the Creative Commons Attribution 4.0 License.
the Creative Commons Attribution 4.0 License.
 | 18 Nov 2022
In situ observations of the Swiss periglacial environment using GNSS instruments
Alessandro Cicoira
Andreas Biri
Ben Buchli
Reynald Delaloye
Reto Da Forno
Isabelle Gärtner-Roer
Stephan Gruber
Tonio Gsell
Andreas Hasler
Roman Lim
Philippe Limpach
Raphael Mayoraz
Matthias Meyer
Jeannette Noetzli
Marcia Phillips
Eric Pointner
Hugo Raetzo
Cristian Scapozza
Tazio Strozzi
Lothar Thiele
Andreas Vieli
Daniel Vonder Mühll
Vanessa Wirz
Jan Beutel
Monitoring of the periglacial environment is relevant for many disciplines including glaciology, natural hazard management, geomorphology, and geodesy. Since October 2022, Rock Glacier Velocity (RGV) is a new Essential Climate Variable (ECV) product within the Global Climate Observing System (GCOS). However, geodetic surveys at high elevation remain very challenging due to environmental and logistical reasons. During the past decades, the introduction of low-cost global navigation satellite system (GNSS) technologies has allowed us to increase the accuracy and frequency of the observations. Today, permanent GNSS instruments enable continuous surface displacement observations at millimetre accuracy with a sub-daily resolution.
In this paper, we describe decennial time series of GNSS observables as well as accompanying meteorological data. The observations comprise 54 positions located on different periglacial landforms (rock glaciers, landslides, and steep rock walls) at altitudes ranging from 2304 to 4003 and spread across the Swiss Alps. The primary data products consist of raw GNSS observables in RINEX format, inclinometers, and weather station data. Additionally, cleaned and aggregated time series of the primary data products are provided, including daily GNSS positions derived through two independent processing tool chains.
The observations documented here extend beyond the dataset presented in the paper and are currently continued with the intention of long-term monitoring. An annual update of the dataset, available at https://doi.org/10.1594/PANGAEA.948334 (Beutel et al., 2022), is planned. With its future continuation, the dataset holds potential for advancing fundamental process understanding and for the development of applied methods in support of e.g. natural hazard management.
- Article
(11589 KB) - Full-text XML
-
Supplement
(291 KB) - BibTeX
- EndNote


Observations based on permanent in situ global navigation satellite system (GNSS) instruments have been investigated intensively over the past decade in pursuit of a better process understanding of the periglacial environment and its related mass movements (Wirz et al., 2013; Ravanel and Deline, 2014; Cicoira et al., 2019b). The advantage of this method for assessing surface displacements over traditional field surveying and remote-sensing techniques is the level of detail that can be obtained at different temporal scales. Today it is possible to monitor at millimetre accuracy with a temporal resolution of minutes, using double-difference processing techniques (Teunissen and Montenbruck, 2017) and commodity receiver hardware similar to those found in consumer products, e.g. mobile phones or automotive systems (Paziewski et al., 2021). Depending on the level of detail required, chiefly characterised by the accuracy of coordinate tuples, their temporal resolution is achieved by operating GNSS receiver pairs continuously and subsequently post-processing the observation data derived. While the cost footprint of the required hardware is several orders of magnitude lower than that required for traditional geodetic surveying equipment (Wirz et al., 2013), the power and communication bandwidth required for operating the sensors remotely remain high. However, it has been shown that by selectively duty cycling receivers and transmitting the GNSS observation data on a low-power wireless sensor network (WSN) (Buchli et al., 2012), a trade-off between energy/data volumes and the fidelity required can be obtained. In this way, near-real-time permanent monitoring in remote locations, over large timescales, and in adverse meteorological conditions become possible.
In this paper, we document a dataset of continuous GNSS observations of 54 positions obtained in the periglacial environment of the Swiss Alps over the past 14 years in the framework of the X-Sense Project and the PermaSense consortium. PermaSense has been a large interdisciplinary research consortium targeted to custom-design low-cost wireless sensors for the detection and analysis of temporal and spatial variability of high-alpine slope movements (Beutel et al., 2011). In Sect. 2, we provide a description of the GNSS sensor stations, their technical specifications, an overview of the local geodetic network, and of the data communication system used to collect the data in near real time. The observation positions are distributed throughout the Swiss Alps and range in elevation from 2304 to 4003 . The data cover sites with differing geomorphological characteristics including rock glaciers (ice-rich creeping landforms indicating the occurrence of permafrost), permafrost-affected landslides, and steep rock walls. The field sites are presented in Sect. 3 and in more detail in Appendix A. The primary data of this paper are the raw GNSS observables of all GNSS stations, accompanied by two-axis inclinometer measurements as well as weather station data for some of the investigated sites. The published dataset contains the complete raw data at full sampling rates of all instruments (primary dataset; see Sect. 4) as well as a selection of derived data products (secondary dataset; see Sect. 5). The derived data products are down-sampled and cleaned time series of weather station and inclinometer data as well as post-processed GNSS daily positions obtained by double-difference processing of the GNSS data. A short discussion about validity and uncertainty of primary and derived data products is given in Sect. 6. In Appendix B, we briefly describe the different research projects that contributed to the consortium, to the development of the sensors, and to the evolution of the field-site monitoring network. The history of the consortium is tightly linked to the success of the method, and it can not be illustrated without mentioning its practical applications in the fields of natural hazard management, e.g. in the Swiss Permafrost Monitoring Service (PERMOS). A toolset, originally created for the data describing the Matterhorn Hörnligrat field-site data (Weber et al., 2019a), allows us to (re-)create and independently update (living data process) the data documented in this paper. The code, first presented in Weber et al. (2019b), is updated and available at https://git.uibk.ac.at/informatik/neslab/public/permasense/permasense_datamgr (last access: 21 October 2022, Weber et al., 2022). We expect and encourage the use of this dataset to further develop processing methods, provide atmospheric (Hurter et al., 2012) and ground-based (Henkel et al., 2018) observations as well as for educational purposes, but we also foresee future research applications in the fields of geomorphology, engineering geology, and natural hazard management.
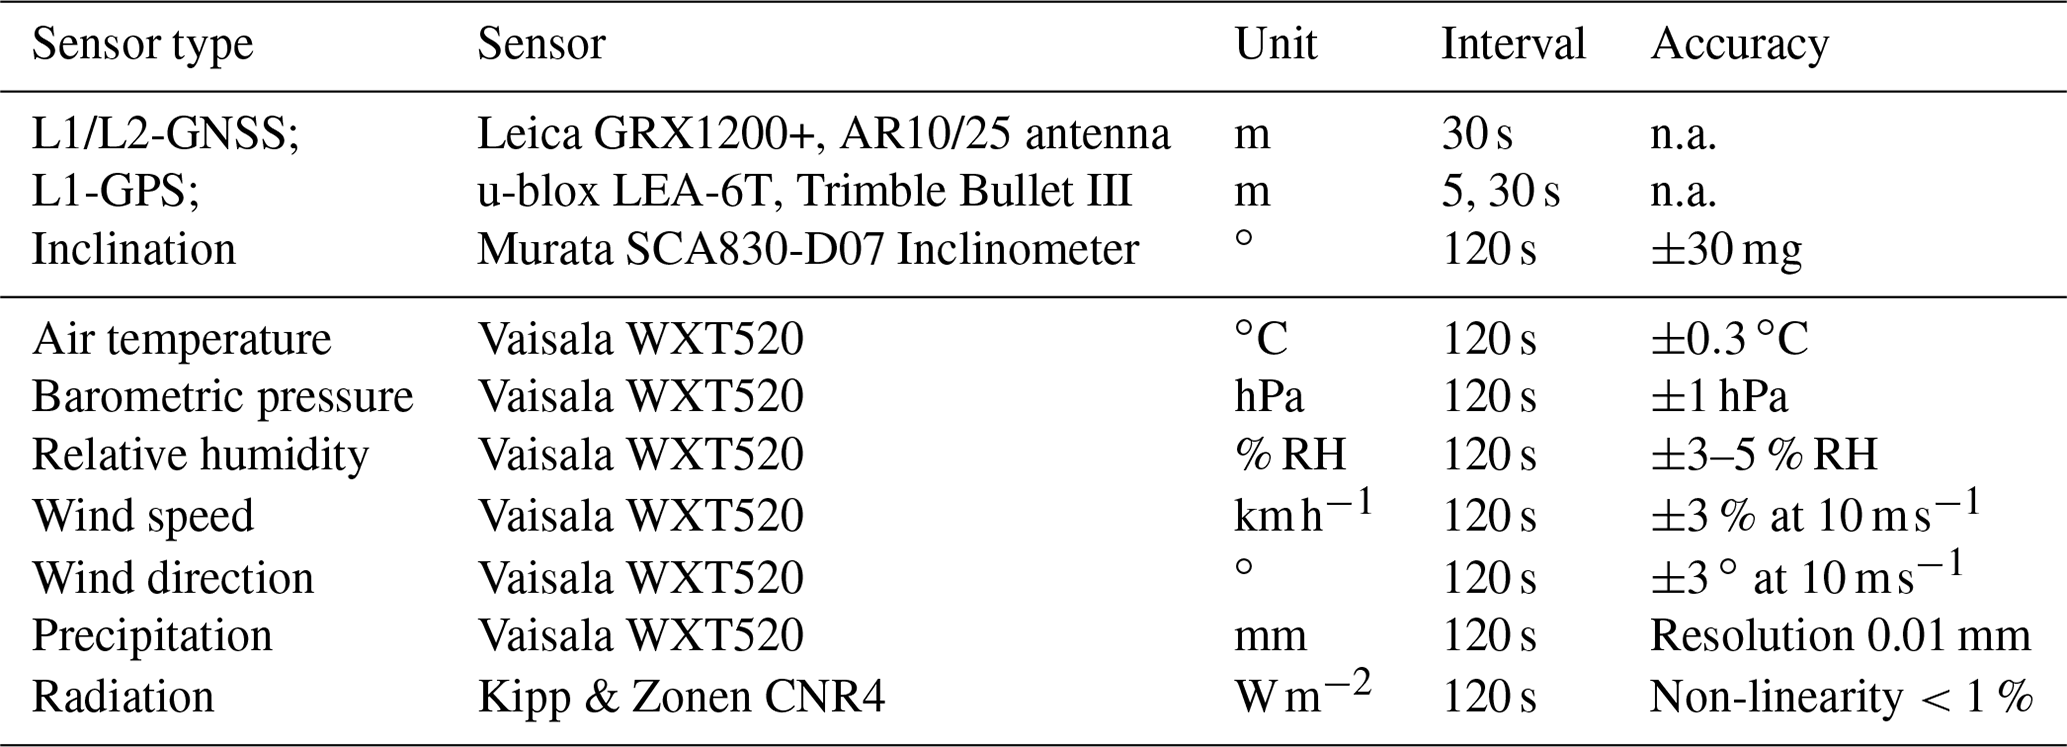
The measurement network consists of distributed GNSS stations that are permanently installed on locations of interest, i.e. on the surface of a landform under investigation. The GNSS sensor and the fix installations were designed in the framework of the PermaSense Project; both are depicted in Fig. 1. In addition, a MEMS two-axis inclinometer has been fully integrated into the sensor system. At selected locations, automatic weather stations provide auxiliary ambient data that are valuable for the analysis of the GNSS observations. In the following paragraphs, we provide a brief description of the different sensors (GNSS, inclinometers, weather stations) as well as the data communication and management infrastructure. All sensor types, including their indicative period of operation, unit system, and key characteristics are synthesised in Table 1.
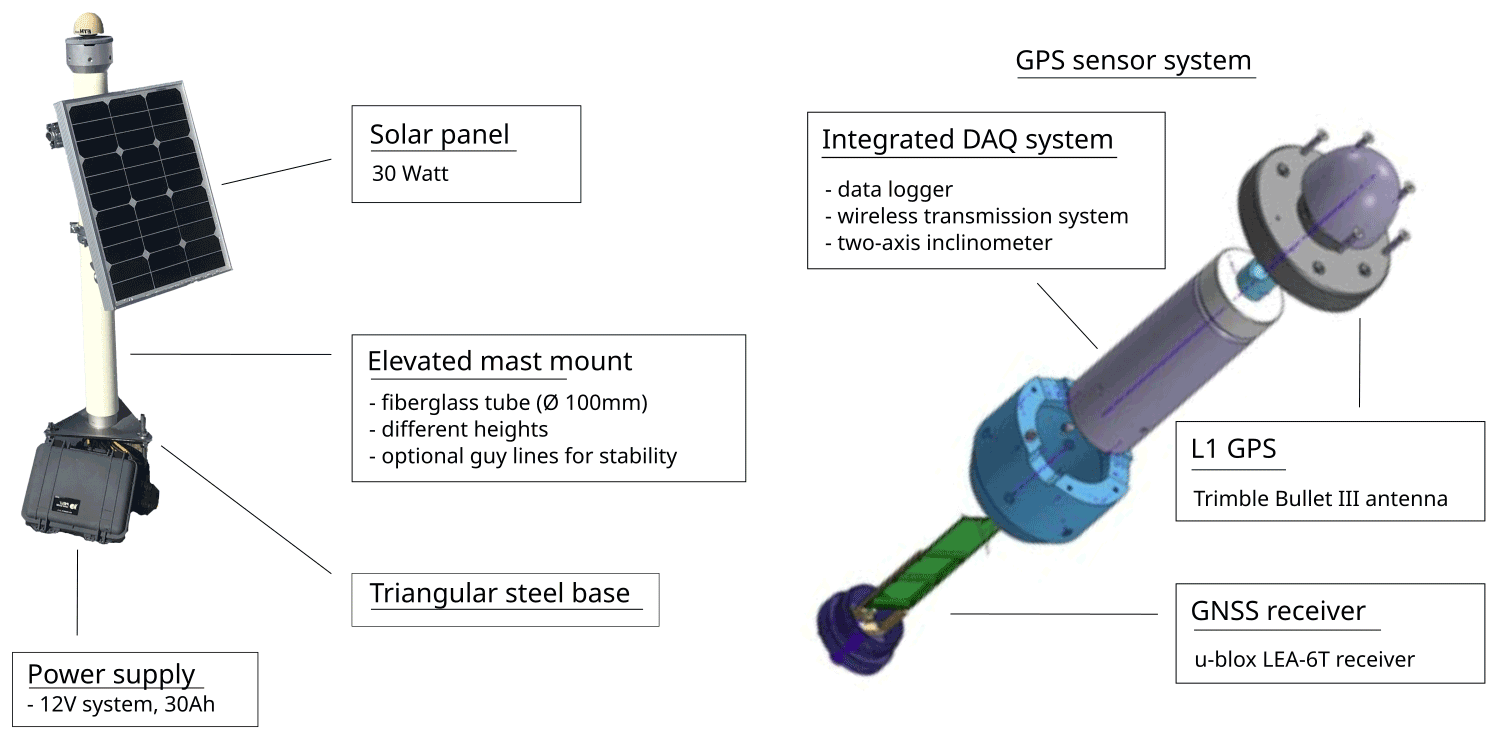
Figure 1Structure and components of the GNSS sensor developed in the PermaSense Project. (Left) Structure of the GNSS station. (Right) Detail of the embedded GNSS antenna, data logger, and wireless transmitter.
2.1 GNSS sensor instruments
Each location is equipped with a station consisting of an integrated GNSS sensor, a 12 V solar power system mounted on and housed inside a fibreglass reinforced tubular mast, and anchored to the underlying rock (see left panel in Fig. 1). The sensor systems consist of an active GNSS antenna, a GNSS receiver, a two-axis inclinometer, a data logger, and in many cases, a low-power wireless transmission system (see right panel in Fig. 1). Typically, the sensor is mounted on top of a rock outcrop or a boulder large enough for a stable positioning (see Sect. 3.3 for more details). Power for all instruments is provided by a standard 12 V photovoltaic system: a solar panel, a charge controller, and a 12 V absorbed glass mat (AGM) sealed lead-acid battery housed inside a Pelicase. In order to guarantee maximum exposure to solar radiation, facilitate operation with extended snow cover in winter, and protect the instrument, the instrument is mounted inside the top of the fibreglass mast. All wires are routed inside the tubular mast.
A GNSS sensor has been installed on stable terrain at select positions in order to provide a stable reference for the double-difference GNSS post-processing. These additional positions ensure a shorter baseline than what would be obtained by using the national reference network. Moreover, these reference stations act as the sink of the local WSN and host the instrumentation for the data collection from all GNSS measurement points. More information is provided in Sect. 3.2.
The GNSS sensor instruments are based on commodity L1-GNSS receivers with the extended capability to output the raw satellite observables (u-blox LEA-6T) and an active antenna (Trimble Bullet III) (Wirz et al., 2013; Buchli et al., 2012). Furthermore, a two-axis inclinometer (Murata SCA830), an ambient temperature/humidity sensor (Sensirion SHT31), and power supervisory circuits are integrated. In order to reduce the necessary power footprint, e.g. at times of reduced solar radiation for energy harvesting, a data-acquisition schedule can be set on each device individually. This sampling schedule has hourly granularity, and time windows when the system is running are typically centred at 12:00:00 UTC to facilitate overlapping time intervals for double-difference GNSS processing.
In 2010, a proof-of-concept study lead to the development of the first generation of these instruments, which were capable of logging data to internal SD-card storage only (Wirz et al., 2013). This first prototype was subsequently refined into two wireless systems: one focused on experimentation (Beutel et al., 2011), the second being a fully integrated wireless GNSS sensor (Buchli et al., 2012). This two-step approach allowed for a fast startup of the project, which was initially independent of infrastructure and network coverage. Over time, most of the sensor locations (initially equipped with data loggers only) have been equipped with wireless data transmission, facilitating sensor operation and near-real-time data retrieval (see Tables A1–A6). The data availability is visualised in Fig. A1.
Table 1Overview list of the sensors used, ordered by sensor type. n.a. denotes not available.
2.2 Two-axis inclination sensors
Two-axis inclinometers (Murata SCA830) are integrated in the sensor systems that are aligned with a marking on the mast mount. This allows a direct determination of the rotation along two axes and subsequently allows us to correct the GNSS measurements for the tilt of the mast, i.e. correct for rotational movements, common in the active layer of permafrost landforms (Wirz et al., 2013; Cicoira et al., 2021). Experience has shown that this correction can yield favourable results and provides the coordinates of the mounting point (Wirz et al., 2014a), but in most cases, the exact point of rotation still remains unclear because the geometry of the rotating mass (where the station is mounted) is unknown.
2.3 Auxiliary weather instruments
A Vaisala WXT520 compact all-in-one weather station was installed at select locations to obtain a more detailed record of local weather data. The measured variables include ambient air temperature, air pressure, relative humidity, wind (speed and direction), and liquid precipitation. At two locations, a four-component net radiometer (Kipp & Zonen CNR4) was installed without capabilities for ventilation and heating. The WXT520 is capable of heating the rain and wind sensor; but for practical reasons, this feature is only enabled when enough power is available, which typically corresponds to good weather periods and turned off especially in prolonged bad-weather periods. Both instruments have been vendor-calibrated and the respective calibration data are applied in the data-conversion procedures as advised by the manufacturer.
2.4 Near-real-time data communication
The locations monitored in the scope of the research and the data presented in this paper are located in high-alpine areas, where cellular network coverage is limited or unavailable. Some field sites have been instrumented following a long-term monitoring strategy, where retrieval of the data once or twice a year is sufficient for the continuation of the time series and their analysis. However, many of the GNSS stations, especially in the Mattertal, are particularly relevant from a natural hazard perspective, and timely data communication is essential for their applicability to management strategies. For this reason, large effort was put into the design and implementation of a data-communication system in near real time. A unique solution comprising of a wireless LAN (WLAN) backbone and a fine distribution using a low-power WSN was sought. The topology of the wireless data-communication backbone in the Matter Valley is illustrated in Fig. A6. Using this approach, it is possible to reach back into areas in the back of side valleys that are interesting from the monitoring perspective, but not covered with regards to connectivity. All locations serviced by the WLAN backbone have Internet Protocol (IP) connectivity facilitating the use of standard sensing equipment. For ease of maintenance, a local WLAN hotspot is also available at these sites for all kinds of activities that require an internet connection. In selected locations, standard 3G/4G modems were further implemented as a backup to the network communication system.
Since WLAN equipment serving the communication backbone is energy-consuming, the actual sensors are integrated with a custom low-power WSN operating on ISM-band radio transceivers and a specialised communication protocol for data gathering (Beutel et al., 2009). Using a hierarchical system of commodity components for the backbone and a highly optimised and custom network for the fine distribution to spatially separated sensing locations, it is possible to operate on a more reduced resource footprint, over long periods of time, and minimising the number of interventions.
2.5 Data-management infrastructure
All data collected are organised and stored so that reproducible research and reuse of the data in different contexts and in future projects are possible. The data infrastructure must also allow for flexibility with respect to extensions (e.g. integrating new sensor types), support of different sampling rates, metadata integration and life-cycle management. The data back-end is implemented using a data-streaming middleware, where a dedicated processing structure called a virtual sensor is responsible for processing a specific data type, e.g. one virtual sensor for temperature measurements and another virtual sensor for GNSS positions. Complete processing chains can be implemented by concatenating virtual sensors, either within the same instance of the Global Sensor Network (GSN; Aberer et al., 2006) or also across multiple instances of the GSN. More details about data processing and storing are given in Weber et al. (2019a).
In order to consistently manage and document the field site and all the sensors with homogeneous metadata, a set of rules has been defined:
-
An individual protocol sheet is used for each intervention (field work day) where all noteworthy items are recorded (installation, maintenance, removal).
-
Sensor interventions on site take place at different times for each position. To simplify things, the whole day of an intervention is typically assumed to be invalid data.
-
All sensor devices are mapped to a distinct position ID. The mapping contains start and finish time stamps, the device ID of the sensor, sensor type, and calibration data.
-
All data from a specific data source (sensor type) are kept in an individual data structure. Queries are typically made per data type and position ID.
-
Detailed circumstances (orientation angles, status of the station) are recorded using auxiliary data formats: text files, Excel files or photographs.
The dataset described can be divided into five main geographical areas. Moving from west to east, they are (i) the Matterhorn Hörnli Ridge, (ii) the main trunk of the Matter Valley, (iii) the upper Saas Valley in the Canton of Valais, (iv) Stabbio di Largario in Ticino, and (v) the upper Engadin Valley in Canton Graubünden. All of the field sites monitored are located in the periglacial environment or in its proximity. We classify the instrumented landforms into three types: (i) rock glaciers, (ii) landslides, and (iii) steep rock walls. In this section, we present an overview of the landform types and instrumented field sites. A more detailed description of the investigated landforms, accompanied by some scientific references which can be used as a starting point for additional information, is given in Appendix A. All the landforms and their types are illustrated in Fig. 2 alongside the number of the GNSS sensors installed (details can be investigated in the Supplement of the paper). An example of a small-scale local geodetic network and the wireless communication geometry are provided in Sect. 3.2.
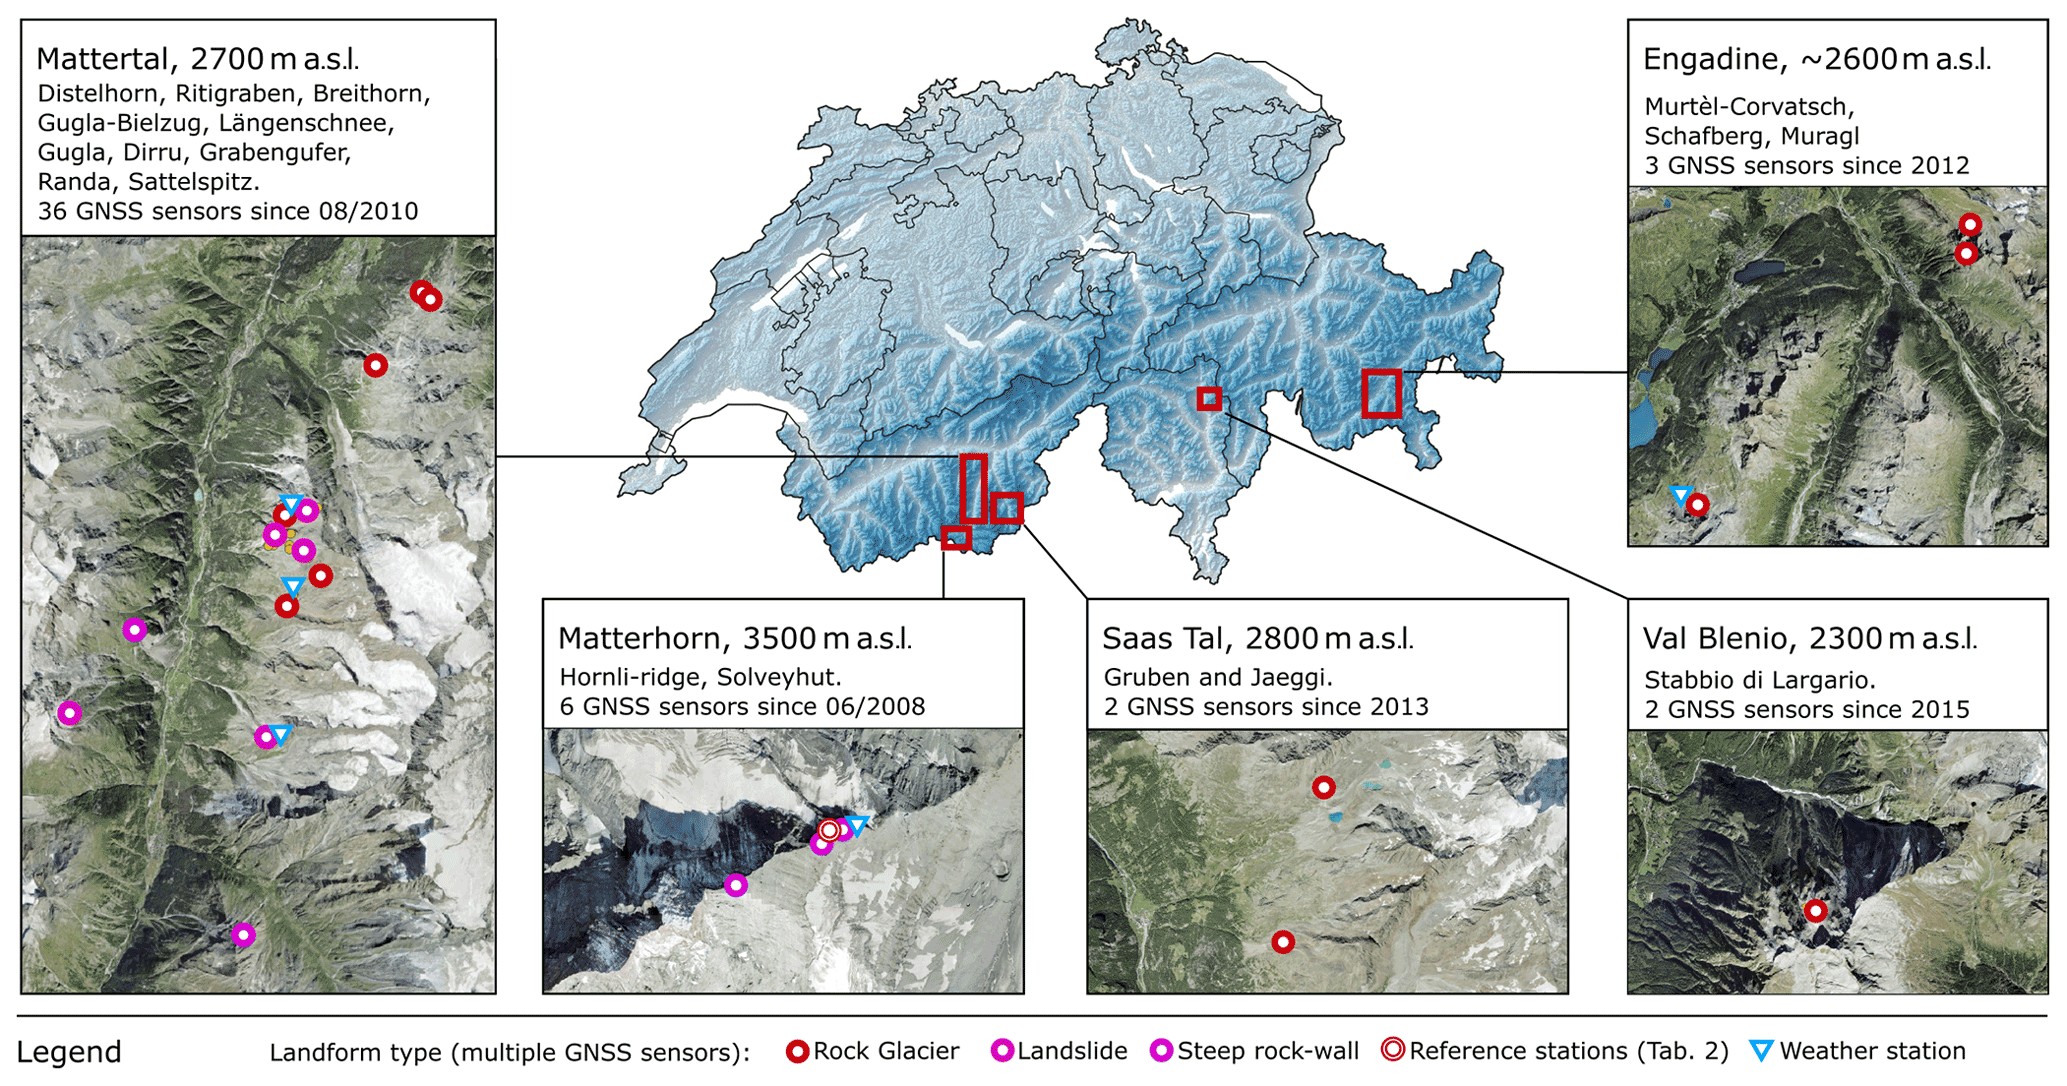
Figure 2Overview map of the field sites. The field sites are divided into five major geographical and geomorphological areas, for which a panel provides a more detailed sight of the sensor network. Further details can be investigated in the Supplement of the paper. Satellite imagery from the Swiss Federal Office of Topography, swisstopo.
3.1 Landforms
3.1.1 Rock glaciers
Eleven rock glaciers across the Swiss Alps have been instrumented with permanent GNSS sensors. A cluster of five rock glaciers is concentrated in the right orographic side of the Matter Valley: Dirru (DI), Distelhorn (DIS), Gugla-Bielzug (BH) (positions 10 and 13), Ritigraben (RIT), Steintälli (ST). In the neighbouring Saas Valley, above the village of Saas-Baalen, the rock glaciers Gruben (GRU) and Jaegi (JAE) host two more GNSS stations. These valleys are rich in rock glaciers, many of which move relatively fast, with average displacement rates of up to several metres per year (Delaloye et al., 2013; Strozzi et al., 2020).
Some rock glaciers are being monitored under the auspices of the PERMOS (Noetzli et al., 2019, kinematics data are available online http://www.permos.ch, last access: 21 October 2022). They include Ritigraben (RIT1) and Gruben (GRU1) in the Valais, the Stabbio di Largario (LAR1 and LAR2) in Val Blenio, and a second large cluster in the upper Engadine, consisting of the rock glaciers Murtèl-Corvatsch (COR1), Muragl (MUA1), and Schafberg (SCH1). Engadine and the Matter Valley are the two driest valleys in Switzerland and are characterised by high mountain peaks. For these reasons, they host the majority of rock glaciers in the country (Haeberli and Vonder Mühll, 1996). Many of the sites, especially the PERMOS locations, are also monitored by terrestrial geodetic surveys. The relative data can be obtained from the responsible institutions and from the PERMOS office.
3.1.2 Steep rock walls
Three field sites are focussing on steep bedrock. The Matterhorn Hörnligrat (MH), the Randa Grossgufer (RA), and the Sattelspitz (SA) north-west ridge are all located in the Matter Valley. All sites are particularly relevant from the perspective of natural hazard management. The Hörnligrat, despite its remoteness, has an important social and economic component due to all the tourist activities that take place on the Matterhorn. The Grossgufer is the remaining lip of the large and famous Randa rockslide which took place in 1991. The Sattelspitz north-west ridge is a currently accelerating buttress, potentially endangering some constructions and activities in the Täsch-Alp.
3.1.3 Landslides
Five permafrost-affected landslides have been instrumented in the Matter Valley with the goal of monitoring unstable and potentially dangerous slopes: (i) the south-west flank of the Breithorn (BH), (ii) one of the culminating peaks of the Mischabel ridge, (iii) the west flank of the Gugla summit, locally called Längenschnee (LS), (iv) the Grabengufer (GG) landslide above the village of Randa, and (v) the Wisse Schijen (WYS) on the eastern flank of the Weisshorn, directly facing it on the other side of the valley. All these sites are well-known by the local population and the cantonal authorities for a long-lasting history of displacement and in some cases for hazard phenomena. The Längenschnee and the Grabengufer landslides are particularly interesting from a historical and geomorphological perspective, respectively. More details can be found in Appendices A and B.
3.2 Local geodetic network
The most accurate position data can be computed using differential GNSS processing techniques (see Sect. 5) when correction data from a GNSS receiver on a non-moving position are available in close proximity to the rover (short baseline) (Wirz et al., 2013; Bu et al., 2021). For the chosen approach using single-frequency GNSS receivers, a short baseline on the order of hundreds of metres to a few kilometres maximum, is favourable. Furthermore, the non-moving reference position and the rover receiver should be situated in the same altitude regime, exhibit similar shading by topographic obstacles (sky view), and need to be operated in overlapping time windows in order to generate the best results.
Table 2Local geodetic network: reference stations: RD01 – Reference Dirru 01, RL01 – Reference Längenschnee 01, RG01 – Reference Grabengufer 01, RAND – Reference Randa, HOGR – Hörnligrat Reference.
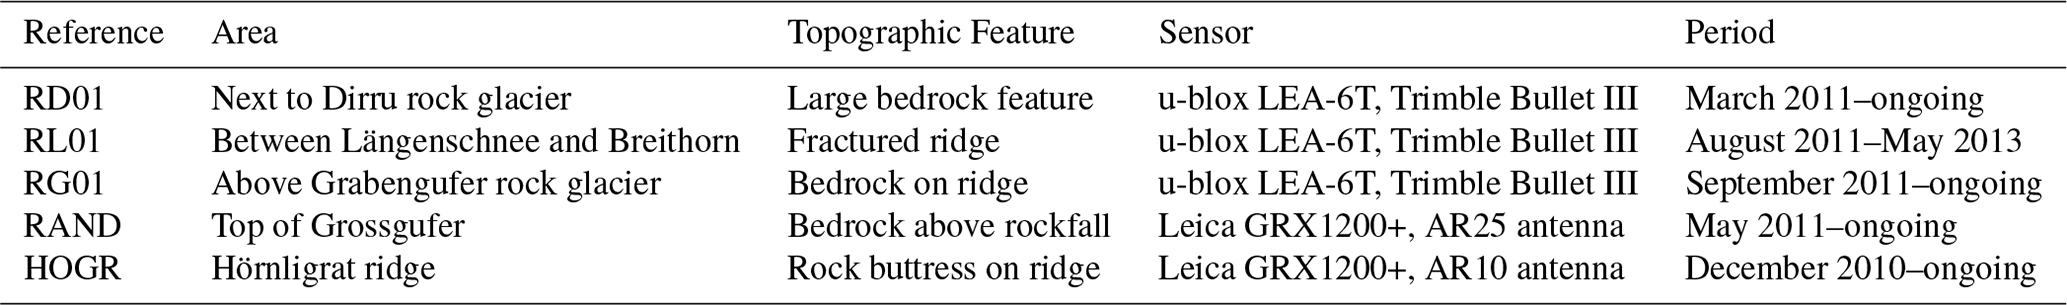
Based on the aforementioned factors, a set of local reference positions has been defined and equipped with continuously operating GNSS receivers as well as high-bandwidth data transmission (see Table 2) forming a local geodetic reference network. In cases where only few or single observation points have been deployed, stations from the permanent GNSS network in Switzerland (AGNES) serve as a reference.
Periodic checks against the national GNSS network have shown that all but two (Längenschnee/RL01 and Hörnligrat/HOGR) reference locations are stable and do not exhibit local movements (see Fig. A2). The station RL01 was abandoned after the discovery that the ridge where it is located is actually moving at a rate of a few centimetres per year, contrary to the assumptions made at an initial site survey. The reference station HOGR represents a special case since it is located on a moving buttress on the Matterhorn Hörnligrat Ridge. In this case however, due to the extreme nature of the environment in which the station is installed, no stable terrain at the same elevation is available. Therefore, the reference position is maintained, but the observations have to be corrected for the movement of the reference position before further analysis, as explained in more detail in Weber et al. (2019a).
3.3 Field site selection and prerequisites for in situ GNSS sensor installation
The variety of the field sites presented in this paper is the result of the historical development of the PermaSense project (a short summary is given in Appendix B). The multitude of measuring points and field sites presented embodies the variety of applications that the project has served over time. Natural hazard management applications are often very well constrained in the selection of the site and the single location of the measurement positions, as these are the relevant ones from the hazard perspective. On the other hand, long-term climatic monitoring requires more thorough thinking and preliminary investigations to select the best-suited field sites first and then the single measurement points. It is important to note that the measurements provide a detailed description of the kinematic behaviour of surface boulder, which are only a proxy of deep-seated geomorphological processes. The results have to be evaluated with care and expert knowledge; see e.g. Cicoira et al. (2021) for the components of rock glacier velocities. In this paragraph, we provide a brief overview of three guiding criteria (technical and geomorphological) that all the GNSS positions have to respect.
Within the PermaSense project, the installation of an in situ GNSS sensor on an observation point had to comply with minimum technical and geomorphological requirements, which can be met fairly easy, depending on the field site.
- i.
From a technical perspective, good visibility to the horizon in direction of the Equator (southern sky when working in the Northern Hemisphere) is required both for good and persistent satellite visibility as well as for maximum solar radiation for power generation (see Fig. 3). Where different positions are equivalent with regard to the other criteria, the technical feasibility of the measurements can be used as a discriminant for a decision. In case of abundant snow cover or large periods without sunlight, a tall mast and conservative power set-ups are critical.
- ii.
From a geomorphological perspective, the chosen point must be representative of the investigated process. As explained in Wirz et al. (2014b) and later in Cicoira et al. (2021), the velocity measured at the surface of a periglacial landform is typically the result of three super-imposed signals. On bedrock, the representatives of the selected point is directly connected with the structural geology of the site, making the selection less prone to personal interpretation. In order to minimise the noise due to stochastic movement within the active layer and at the terrain surface, it is favourable to choose large boulders well embedded in the active layer (with two metaphors: a stable boat in water or a tooth with a deep root; see Fig. 3). The additional two-axis inclination measurements allow us to retrieve critical information about the three-dimensional nature of the roto-translation of the surveyed point (not known a priori) and with the use of proper post-processing analysis, reduce the relative error associated in the measurements (Wirz et al., 2014a).
- iii.
The longevity of the measuring point must be anticipated prior to installing the GNSS station. In extreme cases with blocks sliding on the surface or strongly rotating above the surface, it may be required to re-level the GNSS instrument back to vertical after some time (see Fig. A7a). Finally, it may happen that a station is severely damaged or destroyed, e.g. by a rockfall (see Fig. A7b) or a snow avalanche. In this case, the position has to be replaced. A location as close as possible and with similar characteristics has to be chosen in order to minimise the influence of spatial variability and guarantee (as much as possible in this unwanted condition) data homogeneity and the continuation of the time series.
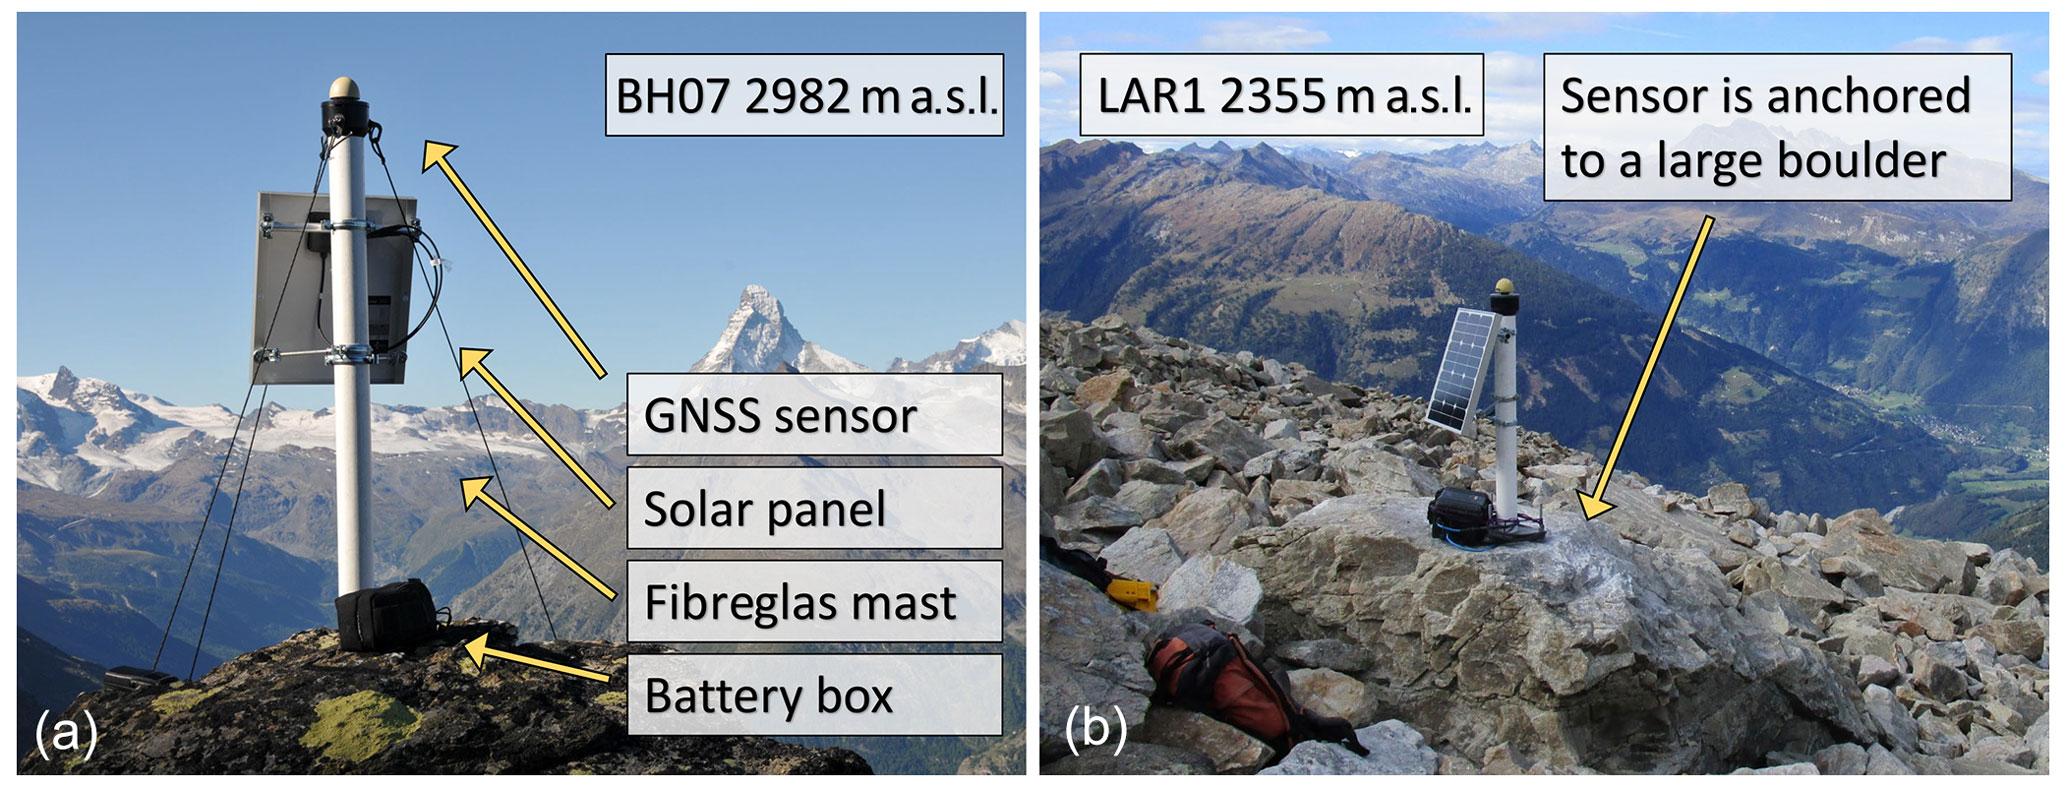
Figure 3Two GNSS stations mounted atop large boulders on the Breithorn landslide 2982 , Herbriggen (a) and on the Largario Rock Glacier 2355 , Val di Blenio (b) illustrate how a field deployment including all sensor setup and anchoring appears.
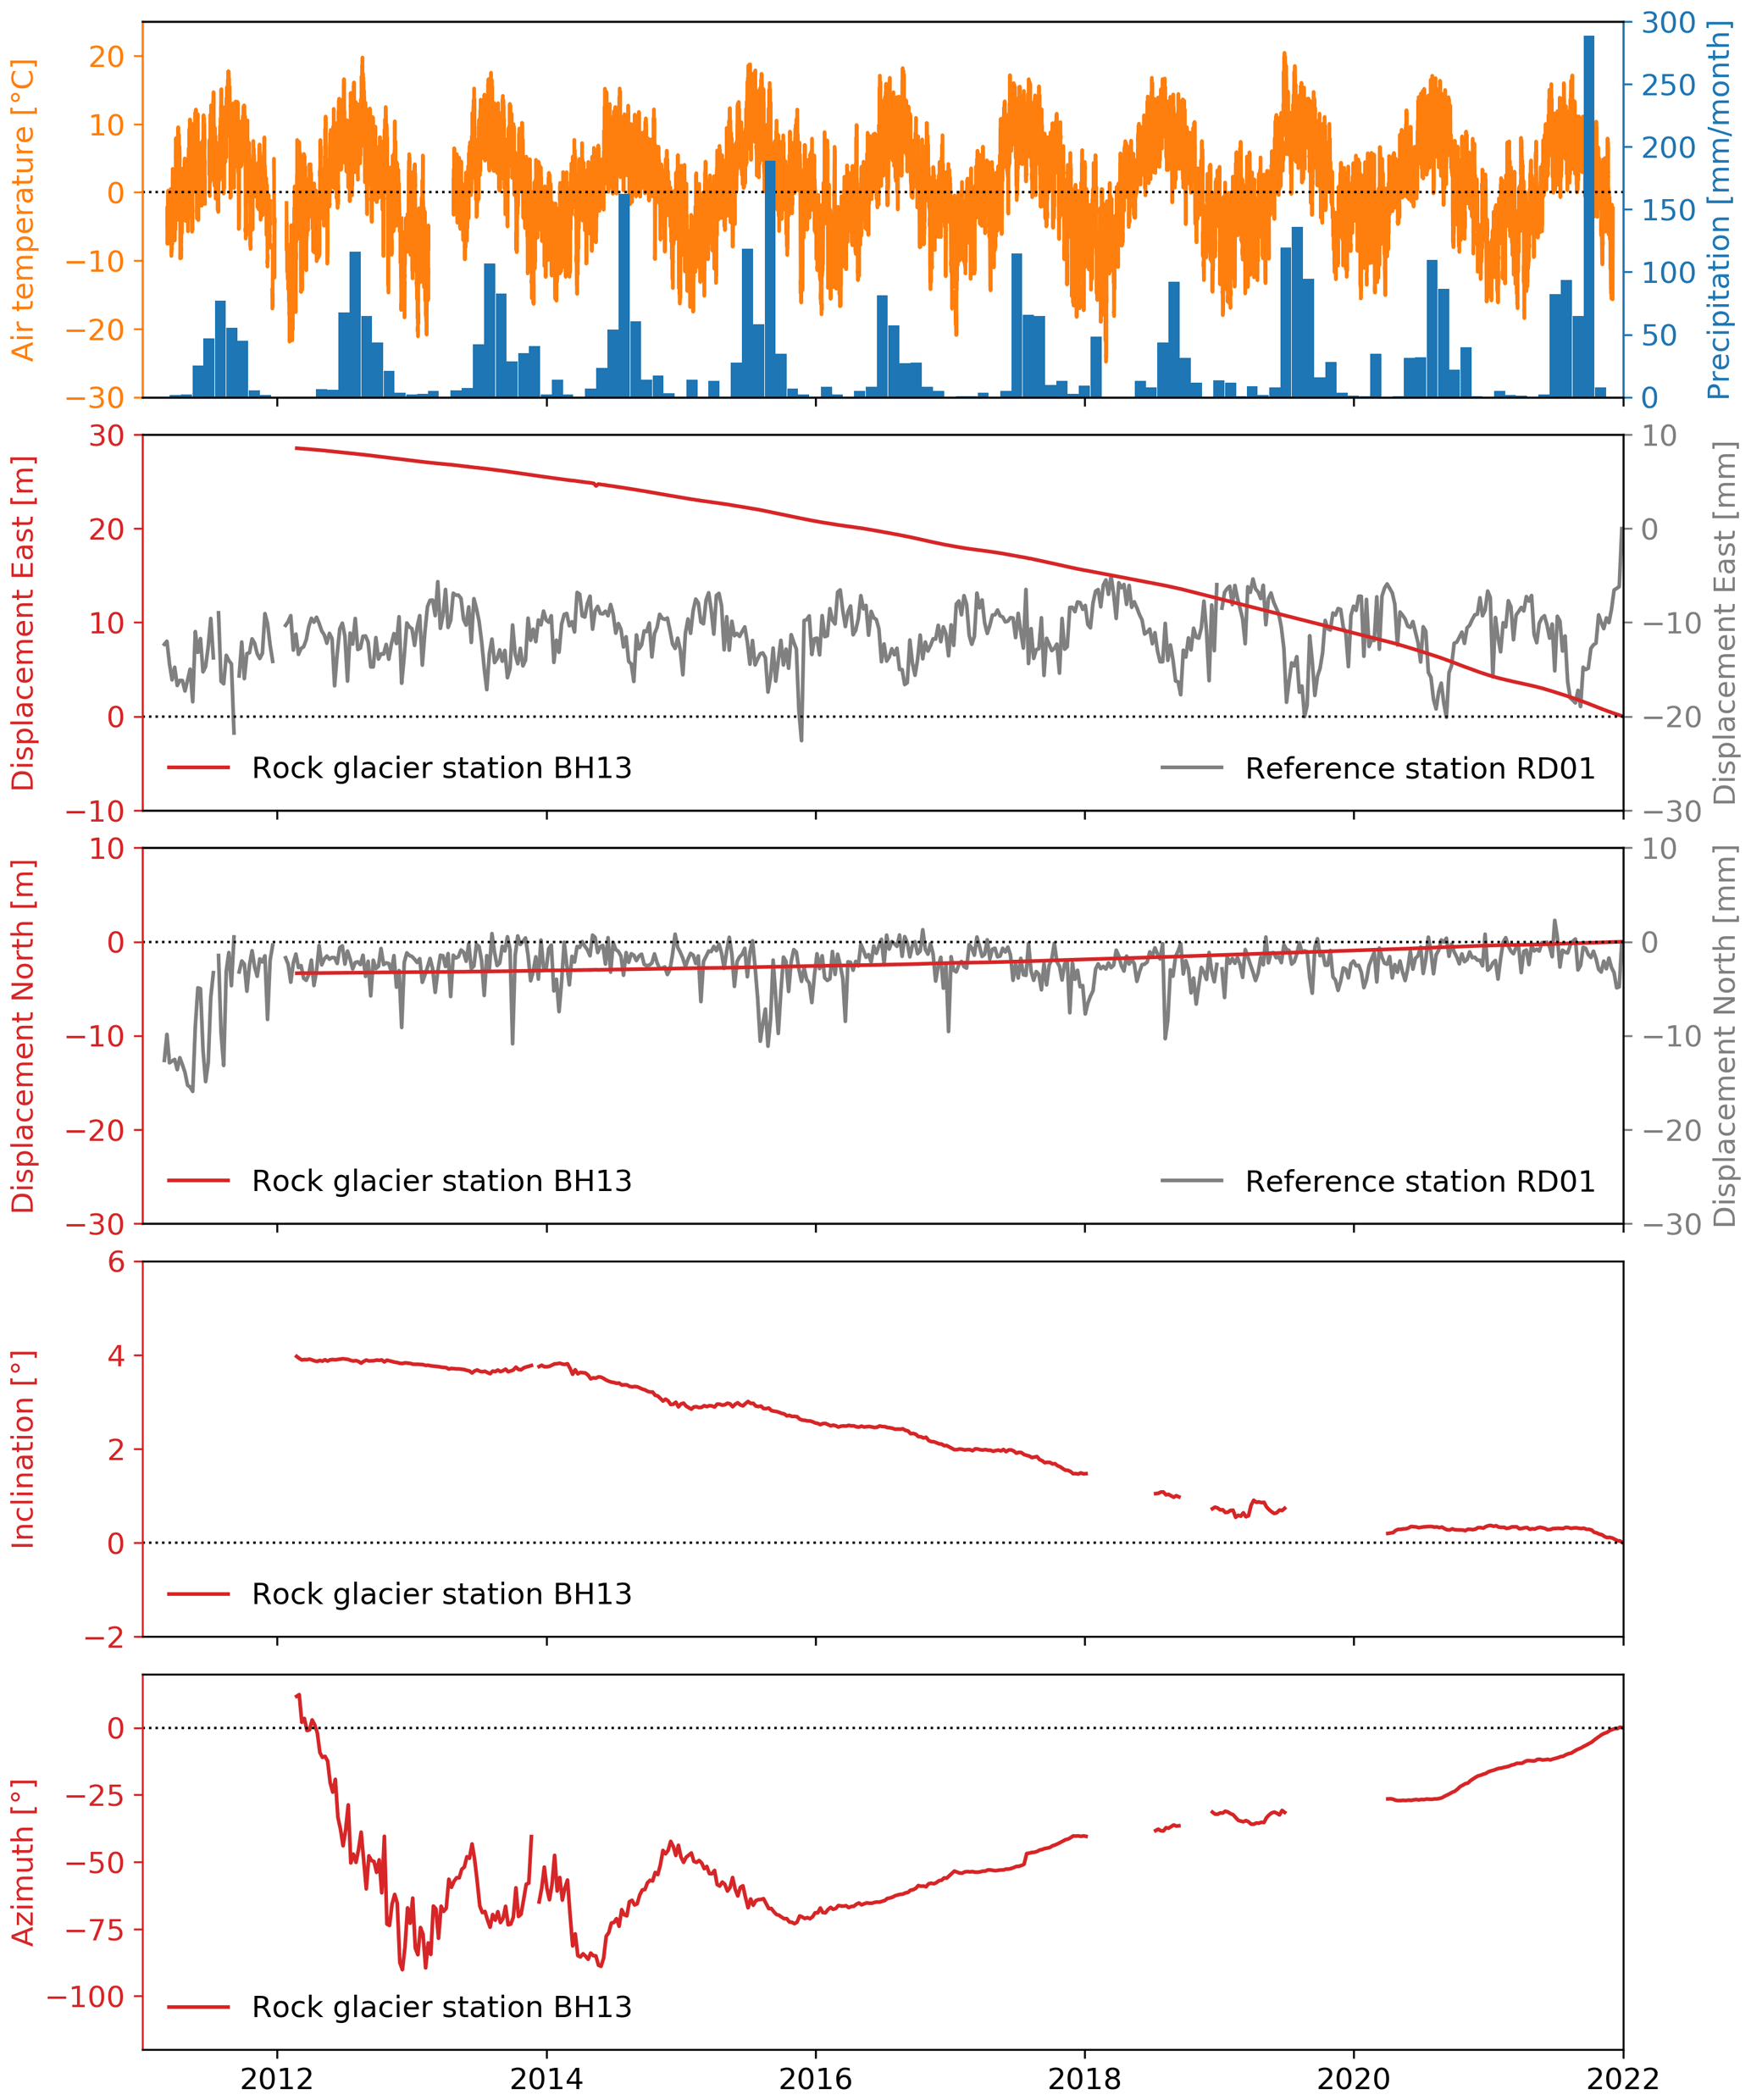
Figure 4A decade of air temperature and precipitation from weather station DH13, as well as displacement, inclination, and azimuth for Gugla Bielzug Rock Glacier (position BH13) and displacements for reference station RD01.
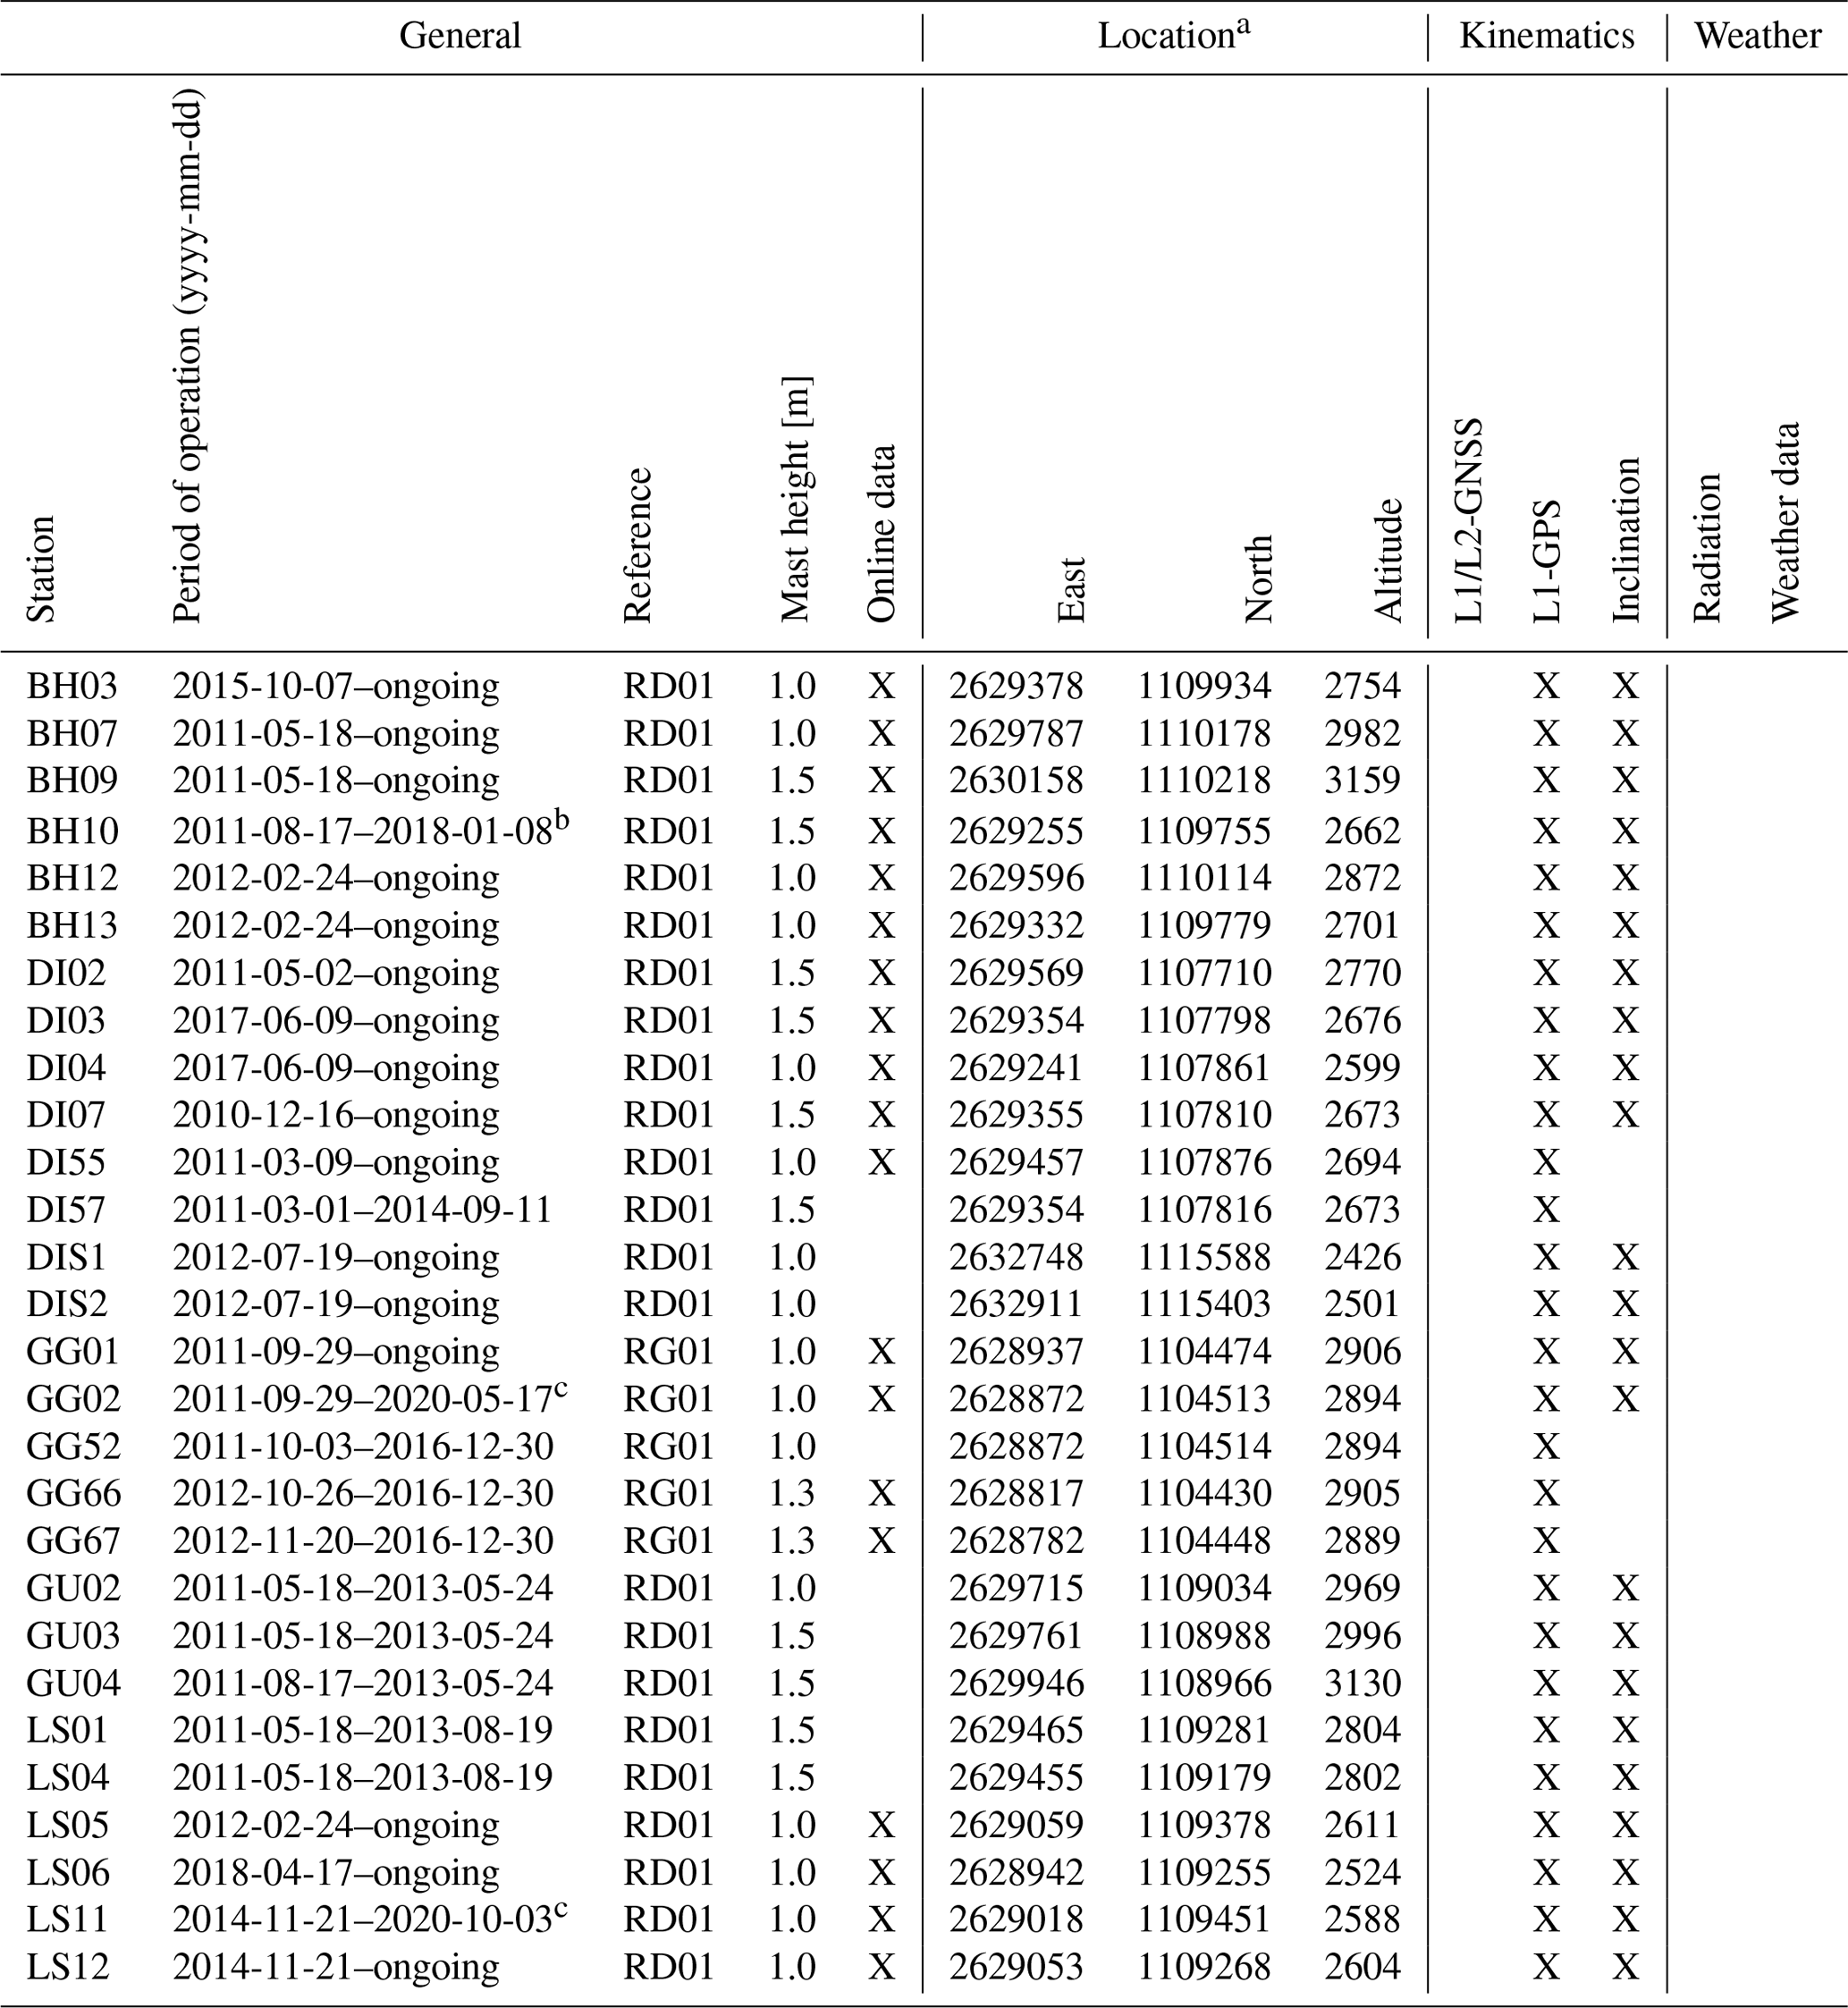
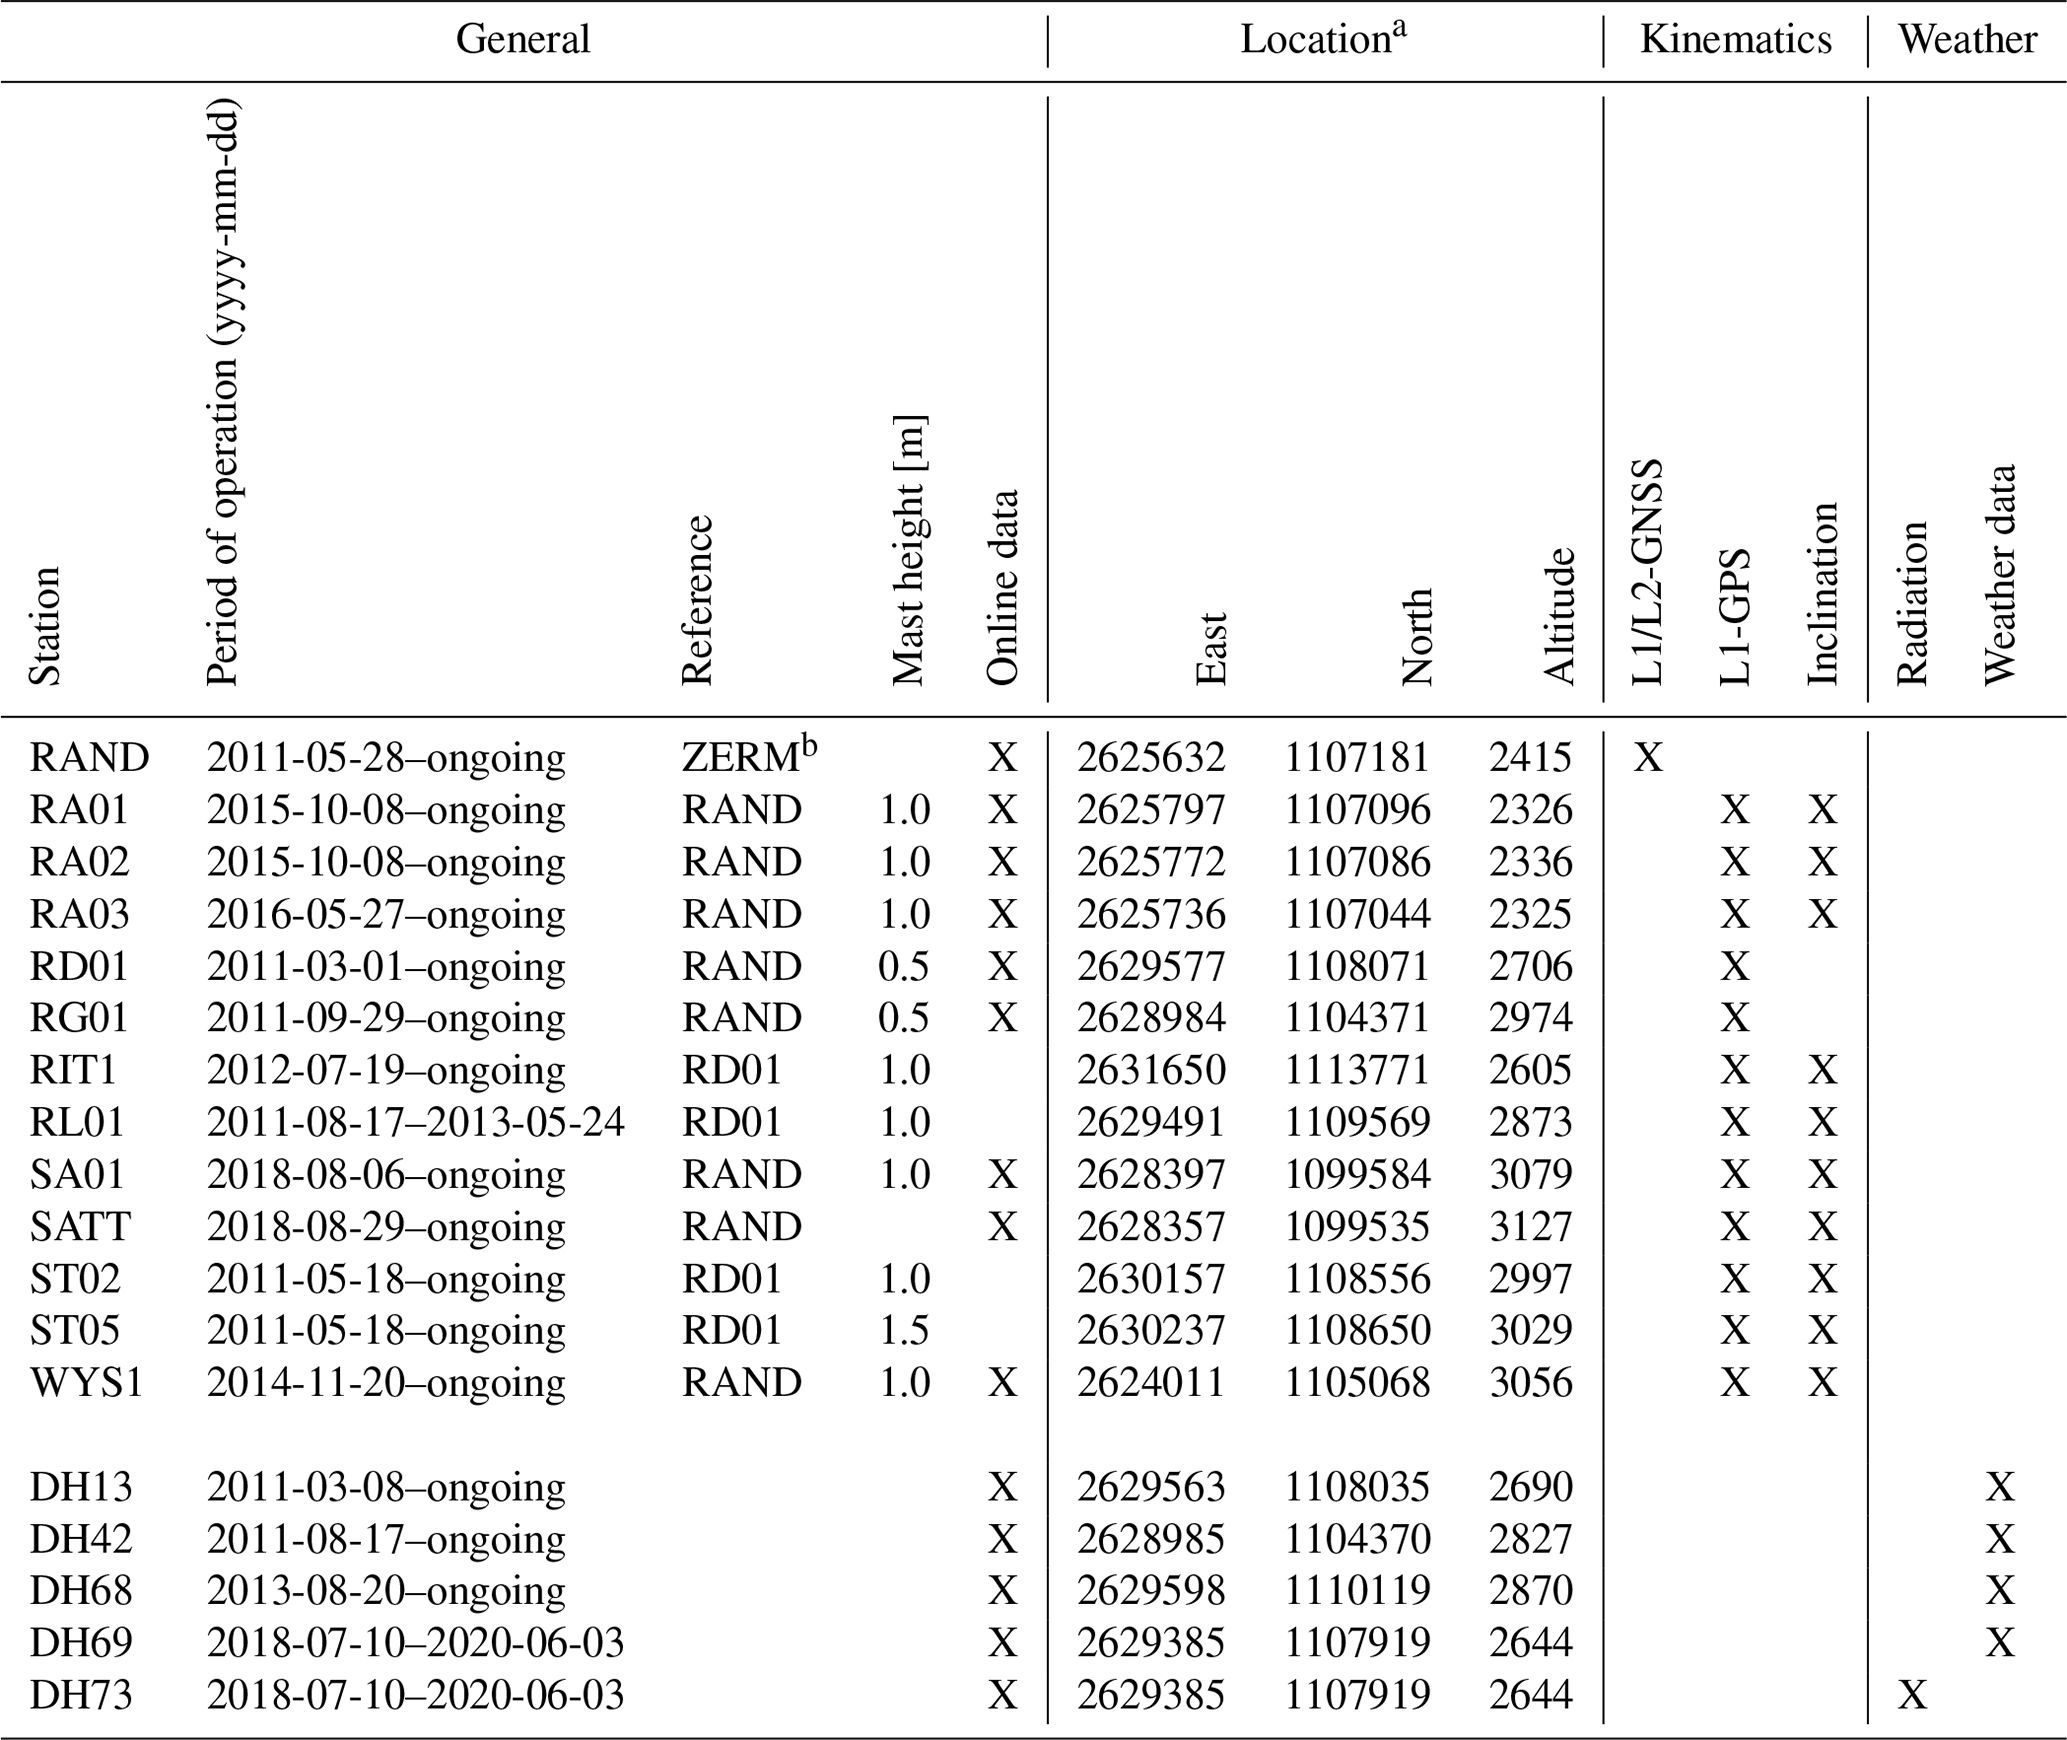
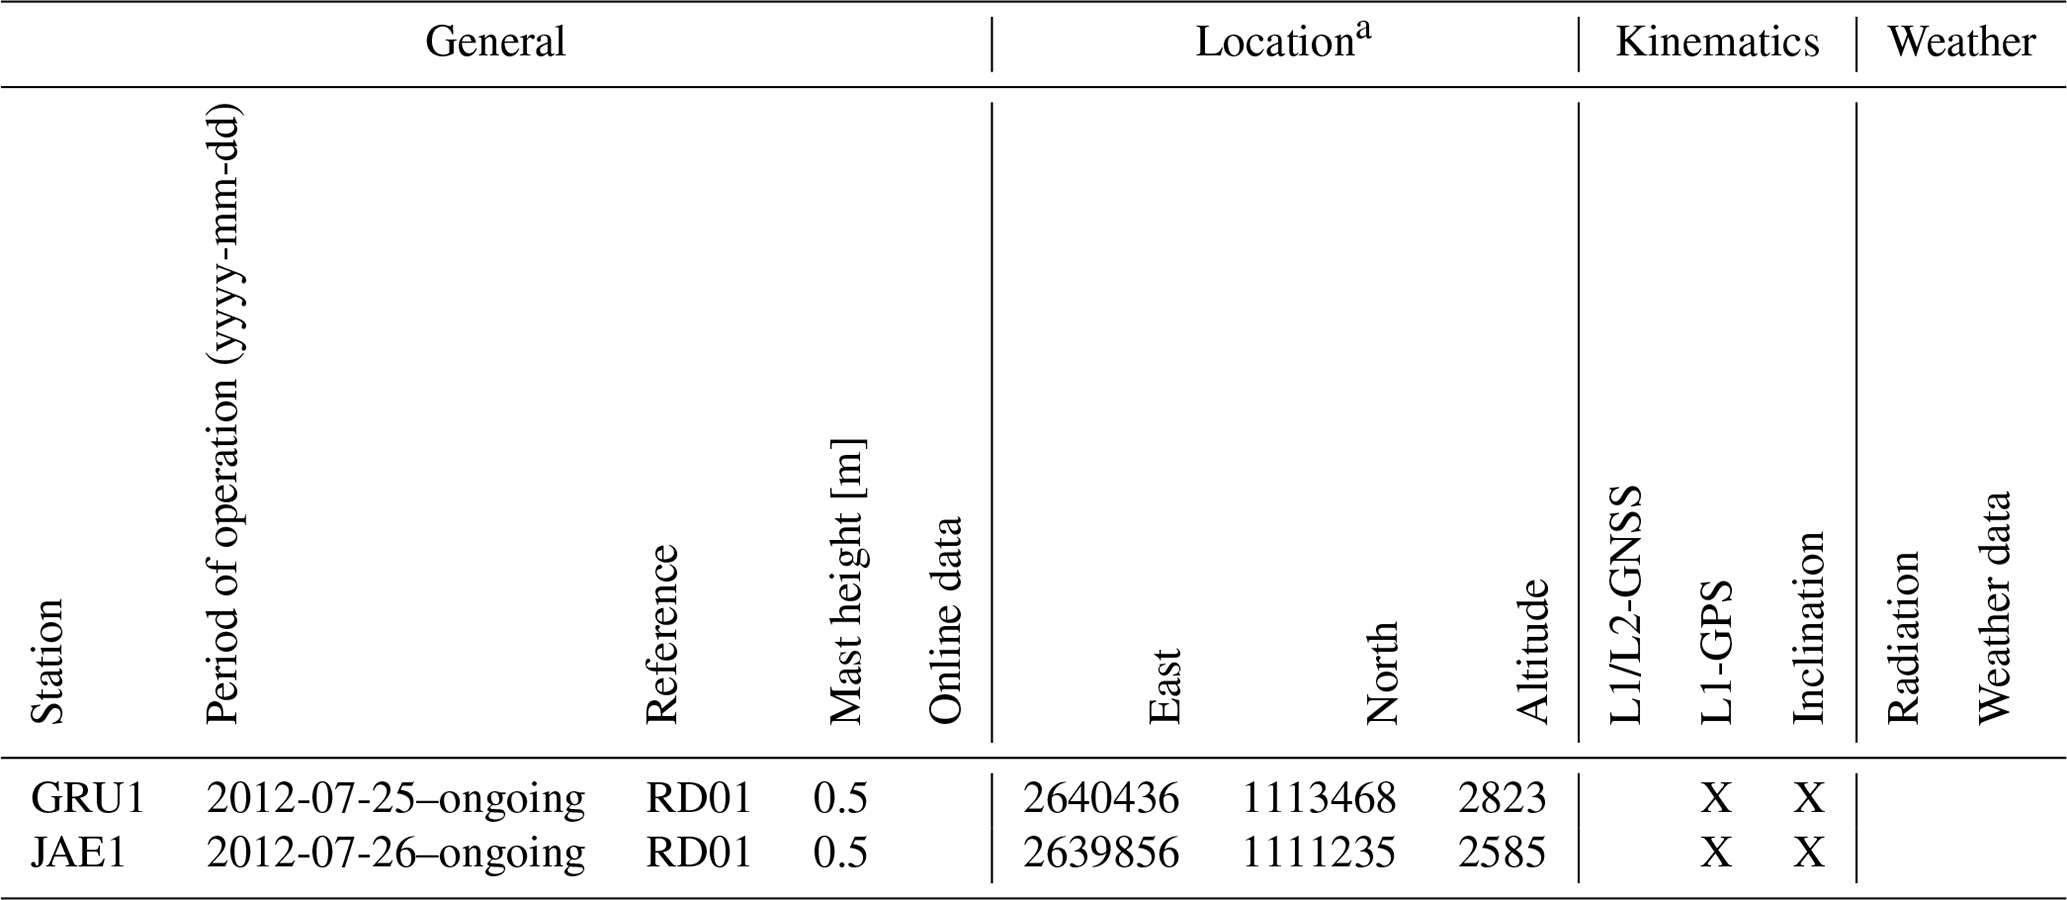
In this section, we present the primary data products provided within the scope of this paper. The primary data products are the raw files as provided by the sensors. They comprise GNSS observables in the form of compressed RINEX files, as well as inclinometer and weather station data (CSV files). Technical specifications about the sensors are given in Sect. 2 and in Table 1. More comprehensive information about the data availability, operation window of all sensors, their instrumentation, and additional plots are given in the appendix. Tables A1–A6 provide a detailed list of all GNSS and automatic weather stations, along with some basic information about them. The label of the station is indicated on the very left. Thereafter, we indicate the period of operation, from the date of deployment to the end date of the operations, or an indication if it is currently ongoing. Next, the name of the reference station (as in Table 2) used for the double-difference GNSS processing is given. The mast height indicates the height of the antenna above the rock instrumented. Additional to this basic information, the field “online data” allow us to identify all the sensors that are currently connected with the online data-management infrastructure via the near-real-time WSN (see Sect. 2.4 for more details). Under the field “location”, the coordinates of the station at the time of deployment are indicated in the EPSG:2056 – Swiss CH1903+ / LV95 coordinate system. The current coordinates are available in the dataset. Finally, two fields are used to illustrate the sensors installed at each station. We distinguish between kinematics for all GNSS stations, including optional inclinometers, and automatic weather stations. A more detailed overview of the data availability for all sensors is given in Fig. A1, where all operating periods, data gaps, and discontinued sensors are visualised.
The sensor labels are given due to historical reasons and follow a geographical and chronological order.
Each sensor is given a four-character alphanumeric label, with two or three letters indicating the field site (as illustrated in Sect. 3) and the number identifying a given sensor on a field site.
The labelling of the data files consists of this four-character alphanumeric label prefixing a string for the sensor type, and a string indicating the time period of the measurements included in the file: e.g. BH10_gps_inclinometer_2018.csv contains GPS inclinometer data for the year 2018 for the position Breithorn 10.
More information on the structure of the data repository is provided in Sect. 7 and Table 3.
4.1 GNSS raw observation data
Raw GNSS observables are the key primary data product of this paper. The raw observables are provided in the form of industry standard daily RINEX 2.11 files for each station presented. They include carrier-phase measurements, pseudo-range values as well as Doppler shift and raw signal strength. Furthermore, the two positions, RAND and HOGR, equipped with a reference grade L1-/L2-GNSS receiver, and used as reference stations, contain both GPS and GLONASS observation data. For both receiver types employed, signals are tracked at an interval of 30 s with the exception of the L1-GPS reference stations that were changed from 30 to 5 s midway through the project. By using a higher sampling rate, a very large amount of data is obtained, but the approach allows for more flexible analysis, especially for the exploration of real-time kinematic applications. As explained in Sect. 2.1, the GNSS rovers employed (Wirz et al., 2013; Buchli et al., 2012) are not continuously sampling data at the given rate. In order to reduce energy consumption, the data generation duration can be configured based on a user-defined daily schedule. The schedule is defined using hourly granularity with a minimum duration of 1 h per day.
4.2 Inclinometer data
Almost all L1-GPS sensors are equipped with an integrated two-axis inclinometer based on a MEMS component (Murata SCA830-D07). An example of the inclinometer data for station BH13 is given in Fig. 4. These are sampled at 2 min intervals during periods at which the GNSS sensor is running. The schedule for the inclinometer data acquisition is the same as for the GNSS sensor. Data are provided in CSV files. The data can be used to constrain the rotational movement of the sensor around a centre of rotation, which in principle is not known. Wirz et al. (2014b) provided a framework to use this information to correct the position measurement on the ground for the component of the rotation between the anchor and the sensor (given by the mast height). For some applications (e.g. Leinauer et al., 2022), the inclinometer data have been proven to be a valuable proxy of more expensive position/displacement measurements.
4.3 Weather station data
The Dirruhorn and Matterhorn sites are instrumented with automatic weather stations. The data comprise ambient air temperature, air pressure, relative humidity, wind (speed and direction), and precipitation as well as four-component net radiation. The time series for the Dirruhorn field site is given in Fig. 4. The raw weather station data sampled at 2 min intervals are provided in the form of CSV files.
In order to favour direct usage of the data presented in this paper, we provide data products derived from post-processing of the raw sampled data presented above. This process consists of three main steps: data transformations, cleaning, and aggregation. The only transformation needed for the presented dataset is from the raw GNSS observables to daily positions; more details are discussed in the next subsection. In the second step, artefacts that have been identified manually or are known a priori from the metadata (e.g. due to field interventions) are corrected in the data-cleaning step. Available cleaning operations are to delete, offset, or replace single or multiple data points. Finally, for all data, aggregates are computed. For inclinometer and weather data, the aggregates are given in hourly values. Different aggregation functions are used. In most cases, the arithmetic mean is applied. For the cumulative precipitation, we used sum. Peak rain intensity is obtained with the maximum. From the GNSS data, the daily positions are calculated with the GNSS processing routine. The aggregation function in the toolchain can further provide aggregation over longer time periods, e.g. to weekly, monthly, or yearly values. In the following discussion, we provide a brief explanation of the methods used, which represent operational best practices emerged from the context of the PermaSense project. A more detailed description of the processing steps and the related algorithm (also provided in the paper) is given in Appendices C and D.
5.1 GNSS processing
The main data-transformation step performed within this paper is the transformation from the raw primary GNSS data to calculate daily static GNSS positions using double-difference GNSS post-processing. Double-difference GNSS processing (Teunissen and Montenbruck, 2017) is based on data obtained in a common observation interval from a station pair. The workflow is illustrated in Fig. 5. Positions for the so-called “rover” station can be calculated with high precision under the assumption that the location of the “reference” station is quasi-stationary and that observations from both stations are subject to similar perturbations. Care should be taken that the baseline distance between any station pair is short, the field of view to the satellites (horizon) is similar, and a station pair is located in the same altitude regime. The main quality indicators of the input data (GNSS observables) are the number of visible satellites, the signal-to-noise ratio, and the observation duration. For the derived data products, the ratio of fixed ambiguities as well as the standard deviations per coordinate axis are key quality indicators. Double-difference processing achieves best accuracy when utilising the precision final GNSS data products from the International GNSS Service (IGS), although other GNSS data products can be used as well, e.g. if near-real-time solutions are required for practical applications in landslide-monitoring procedures. The GNSS processing flow employed uses two different post-processing toolchains, namely the Bernese GNSS Software (Dach et al., 2015) and the open-source RTKLIB toolchain (http://www.rtklib.com, last access: 31 December 2021).
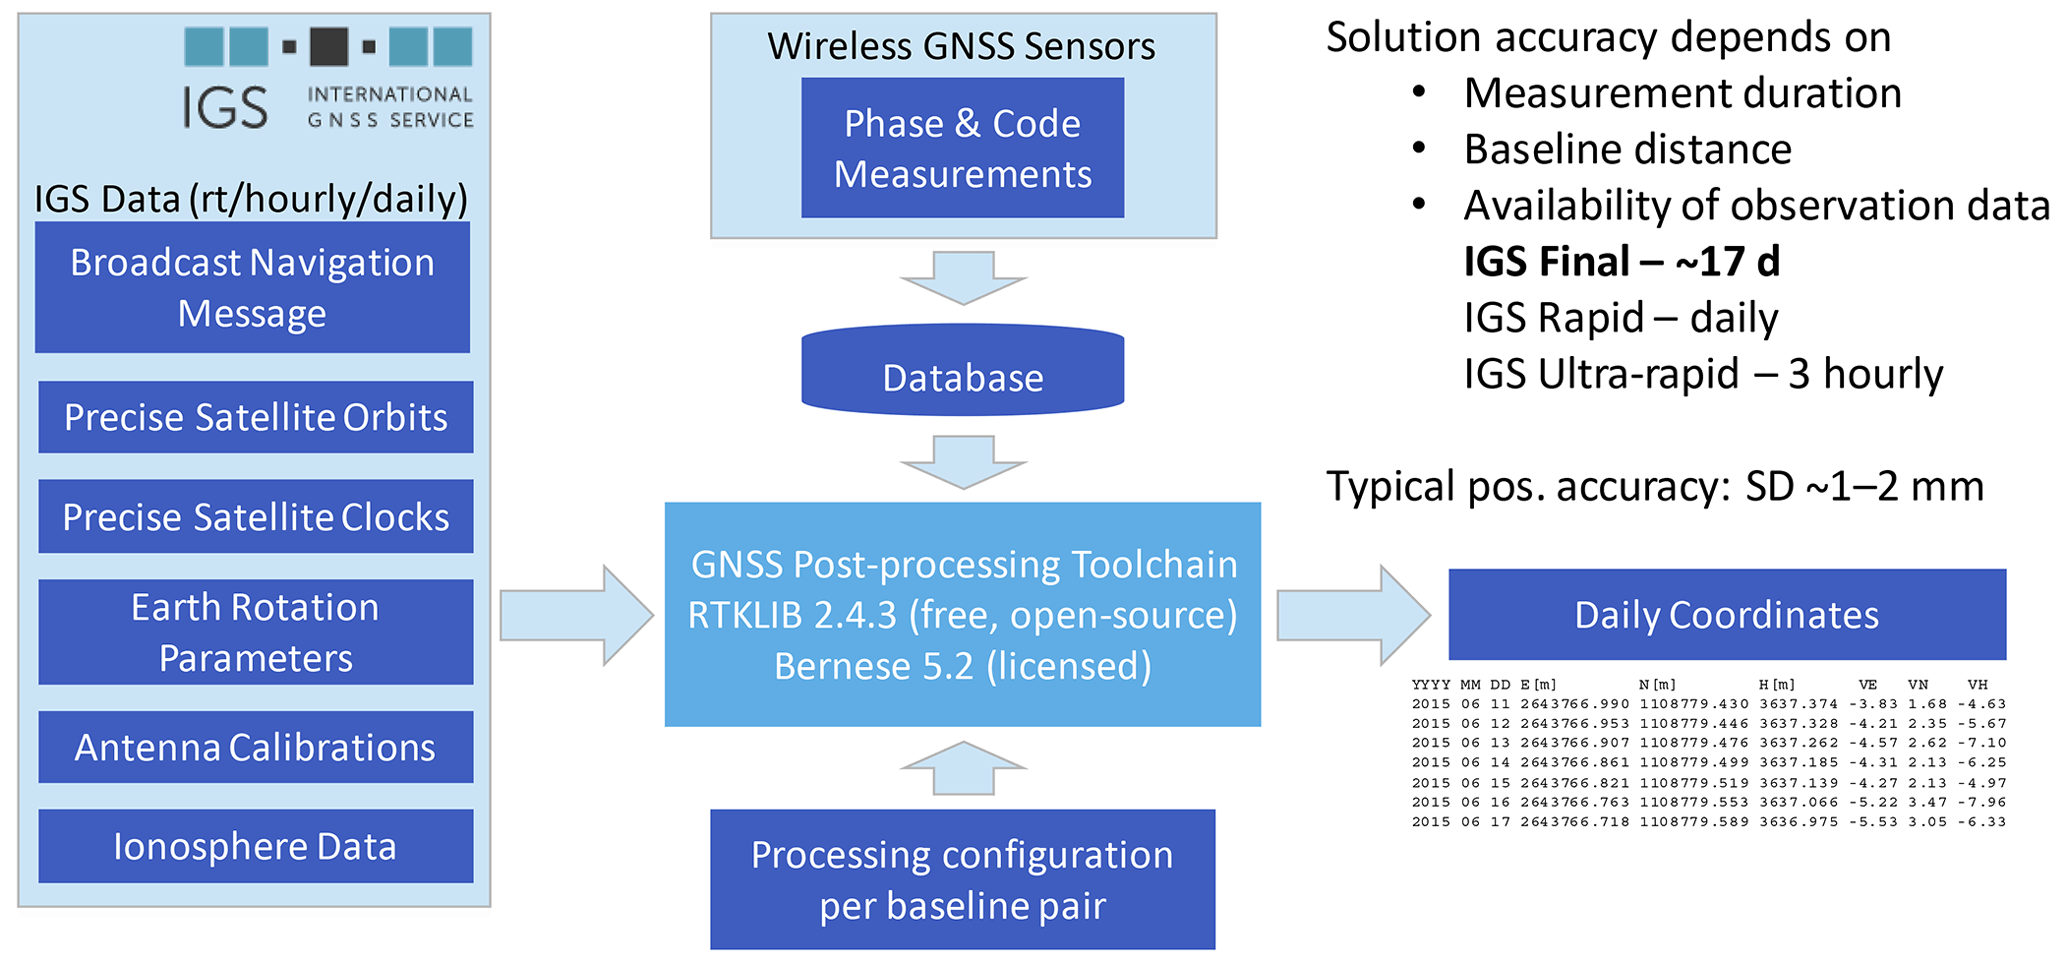
The post-processing with RTKLIB starts from the daily observation files, compiled using the online database as one file per day per position. To constitute a baseline pair between a rover position and a reference station, in most cases we use a sensor from the local geodetic network. Differently, we use reference positions from AGNES for determining the coordinates of the reference stations, and in cases where the baseline distance is too high for the calculation of accurate positions. All rover–reference pairs are indicated in Tables A1–A6. Thereafter, coordinates are calculated. In a final step, the daily coordinates are re-projected from the WGS84 to Swiss national coordinate system by using the online REFRAME conversion service (REST API) by swisstopo. The geodetic datum of all daily position data is EPSG:2056 – Swiss CH1903+ / LV95 coordinate system with the reference frame Bessel (ellipsoidal). After post-processing, the derived data are uploaded again to the PermaSense database for convenient online data access. A custom-developed set of wrapper scripts to be used with RTKLIB is described in Appendix D.
The processing using the Bernese GNSS software is a similar process and follows the same steps presented in Fig. 5. However, further details on this tool are omitted due to its license-only availability. Because the two processing tools use different algorithms and parameter sets, the output data can show differences. Most noticeably, due to different parameter-threshold settings, it may happen that a daily computed position is available for a given tool, but not for the other. Given the long-term nature of the observations, these often spurious missing values can be safely interpolated in a further processing step if deemed necessary by the application.
5.2 Data cleaning and aggregation
A generic toolchain to access, compile, clean, aggregate, and validate both primary as well as derived data from the online PermaSense database has been developed by Weber et al. (2019b) (DOI: http://doi.org/10.5281/zenodo.2542715) and an update is available at https://git.uibk.ac.at/informatik/neslab/public/permasense/permasense_datamgr (last access: 21 October 2022, Weber et al., 2022).
This tool allows us to query the database based on location and sensor type/data type, compile raw CSV files, apply metadata, data cleaning and correction functions, aggregate time-series data to pre-selectable aggregation intervals, and produce intuitive validation plots.
The data cleaning and correction step allows us to delete outliers based on time intervals or value thresholds as well as perform simple mathematical corrections, e.g. to apply a constant factor or an offset for a given interval.
Using this latter feature allows us to correct artefacts introduced during site maintenance, e.g. from changing sensor equipment or from re-levelling a GNSS mast that is required when the tilt angle changes very much.
An example for such a correction is shown in Fig. 6 for the north component of the inclinometer data of station BH13 that is located on the Gugla-Bielzug rock glacier.
Additionally, outliers from days with sensor-device changes are removed using the del operation, and offsets due to differences between two sensor devices are corrected using the offset operation.
The filtered original data (with a number of artefacts) are plotted in orange, the cleaned data are shown in blue, and the aggregated data over 1400 min (daily values) are shown in red in Fig. 6.
A quick tutorial for this tool is given in Appendix C.
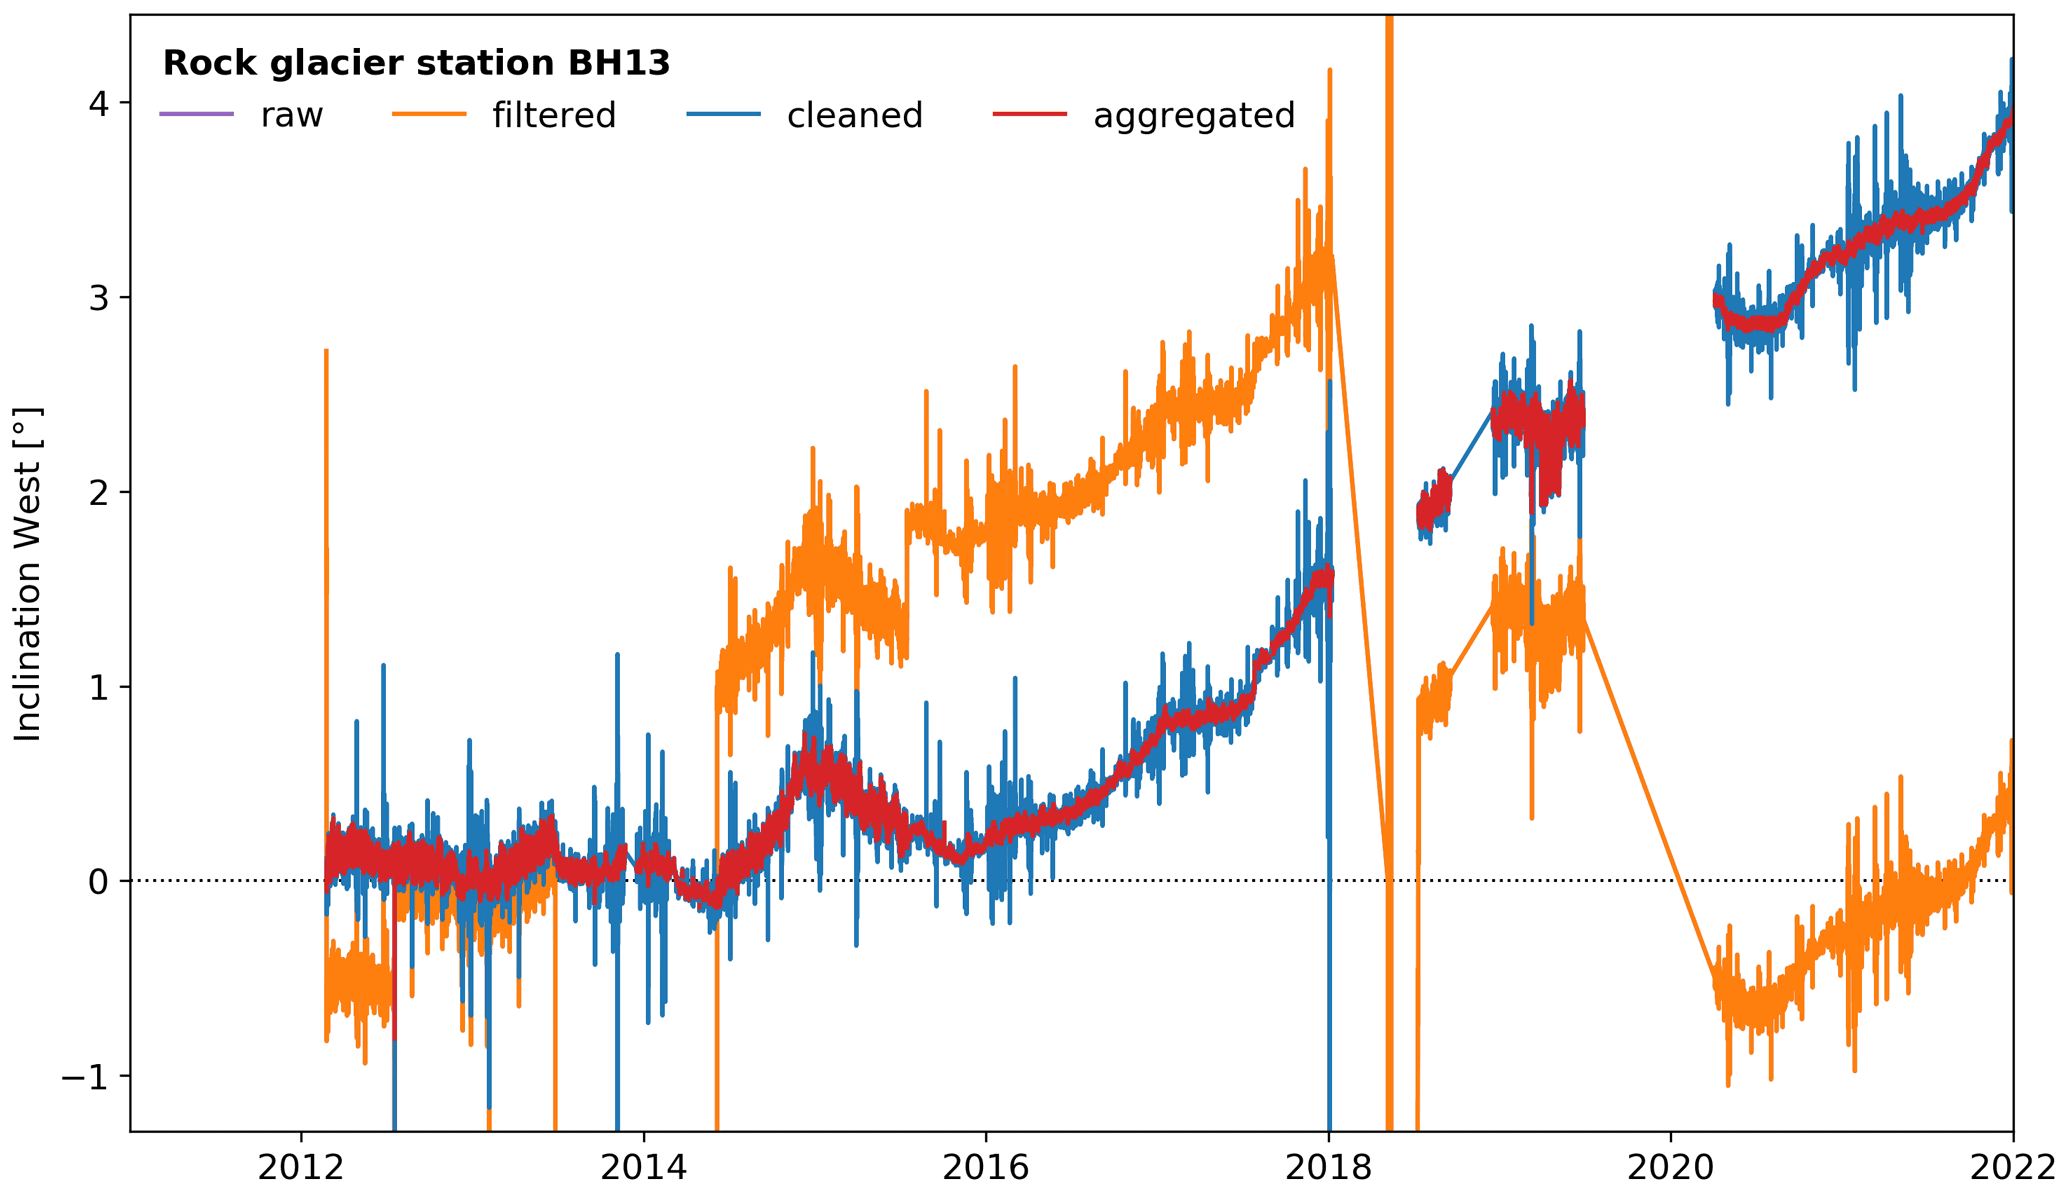
Figure 6Data cleaning example: Inclinometer west-component time series data for location BH13 on the Gugla-Bielzug rock glacier has severe outliers and jumps in the raw data that can be removed, compensated for, and aggregated to smooth time series using the PermaSense Data Manager.
5.2.1 GNSS daily positions and displacements
All GNSS-derived daily positions are converted to relative coordinates starting with a zero value at the onset of the measurement period and have undergone a rudimentary data-cleaning step: outliers and jumps pertaining to device changes on field service days have been removed.
All cleaned daily files showing displacements from the beginning are available in the folder gnss_derived_data_products.
Such cleaned time series easily enable us to visualise and compare the displacement rates measured at the several locations and to distinguish different patterns linked to landforms (see Fig. 7).
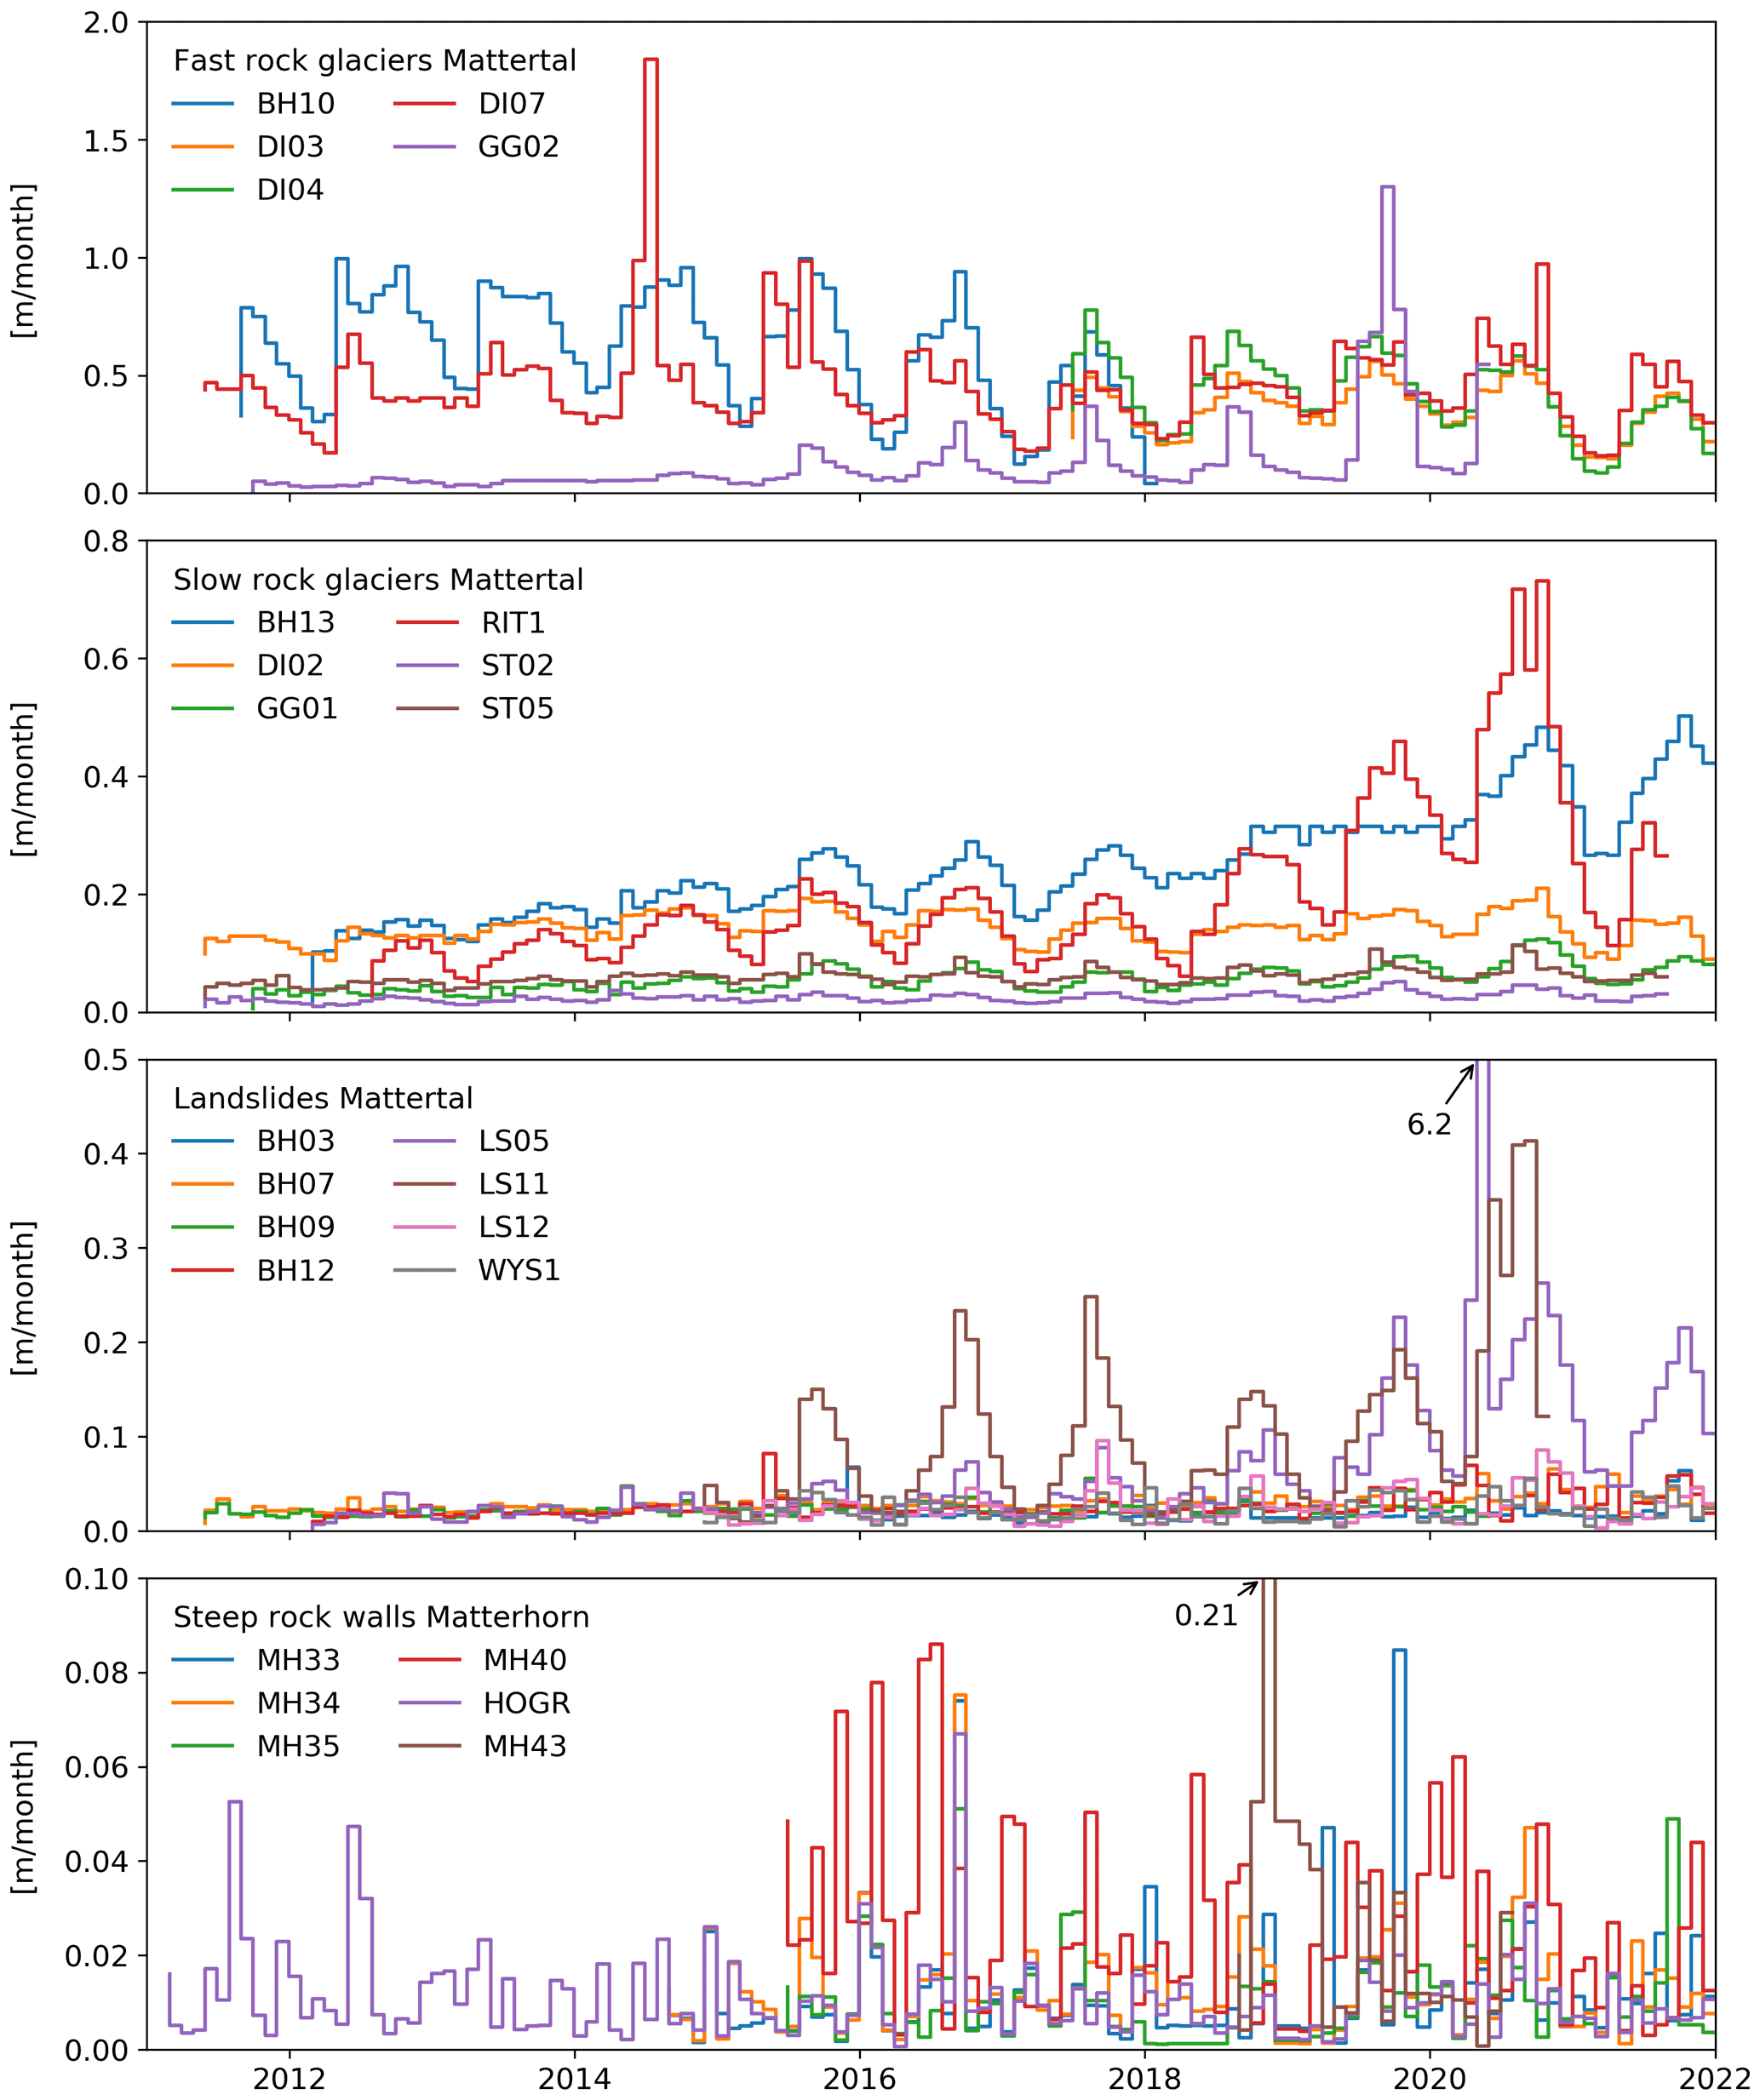
Figure 7Time series of all GNSS positions presented in this paper, classified by landform type and range of displacement rates. The outlier in the Landslides Mattertal (LS05, Summer 2020) was due to a superficial roto-translatory movement of the boulder on which the sensor was placed, as confirmed by a 24∘ rotation visible in the inclinometer data.
5.2.2 Inclinometer data
Similarly, the raw data from inclinometer and weather station sensors are available at sampling intervals of 120 s.
Based on the example of the Gugla-Bielzug rock glacier described earlier (see Sect. 5.2 and Fig. 6), all time-series data from inclinometer and weather stations are cleaned, offset-compensated, and aggregated to hourly data products. All of these data files are available in the folder timeseries_derived_data_products.
5.3 Standardised analysis plots
For each position, a number of standardised graphs are generated (see Figs. A3, A4 and A5 ).
These plots are available for all derived data products in the folder timeseries_sanity_plots of the data repository and also as a supplement to this paper.
Table 3Structure, description, formats, and sizes of the dataset components.
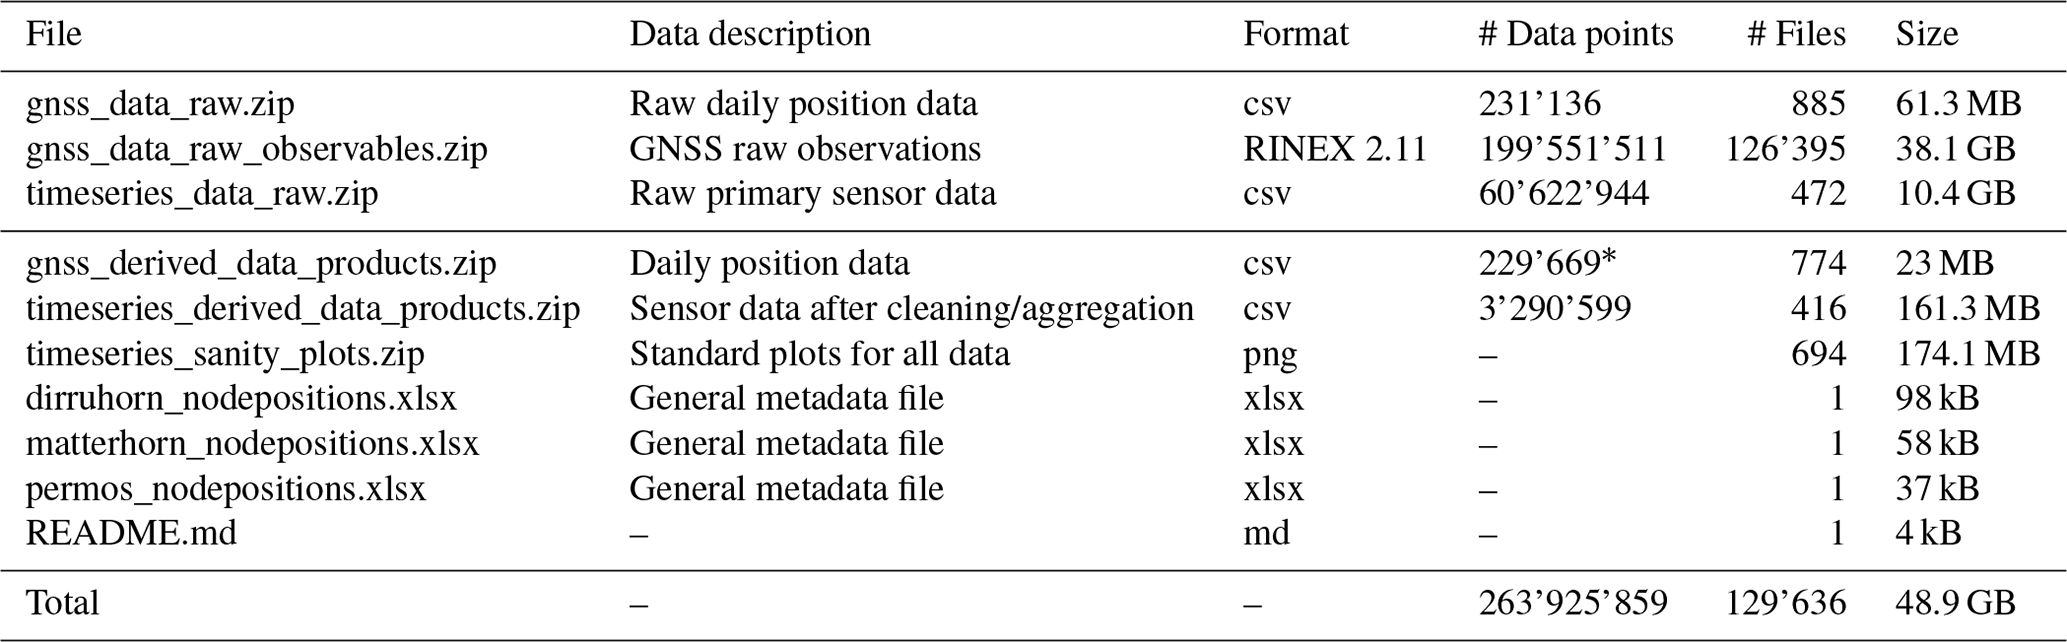
* In part the data have been processed by two different toolchains, RTKLIB and Bernese.
The dataset presented in this manuscript comprises primary (raw) and derived data products for a series of sensors. In Table 1 we provide an overview of the sensor types, their sampling intervals and their nominal accuracy. For most of the sensor systems used, the work presented here represents a novel application domain, with custom developed sensor systems applied in a challenging operating regime. In many cases, the extreme environmental conditions and demanding logistics make so that our measurements are the only ones performed in the area over such extended periods of time, hindering direct comparison to other sensors, typically used for validation.
The processing of the derived data products is completely transparent: the complete processing workflow from raw sensor data to the derived data products applying cleaning and aggregation is described in Sect. 5. Standardised visualisations for every data channel (an example is given in Fig. 6) are provided at https://doi.org/10.1594/PANGAEA.948334 (Beutel et al., 2022) and allow to check the data cleaning and aggregation on a per-channel basis. Note that data offset were corrected only when field site interventions included in the meta data provided an objective reason. No arbitrary stylistic correction is performed.
The processing accuracy of the GNSS observables (input data), to daily coordinates (primary data product) heavily depends on the quantity and quality of the input data. This in turn depends on the satellite availability, the meteorological and atmospheric conditions, on the duration of the data acquisition intervals that in turn depend on the available power as well as the ground kinematics observed. In effect, the accuracy of the primary GNSS data products varies over time and space (between different positions). For this reason, no average/typical values are given for the whole dataset. Instead, quality indicators are available for each daily position fix calculated. For the GNSS data the standard deviation for each axis (E, N, vertical) as well as the ratio of fixed ambiguities is given, the ratio is a percentage that specifies how well the GNSS solver was able to resolve integer ambiguities for fixing a solution – a commonly used quality indicator in GNSS post-processing. For the rtklib solution a static parameter set is chosen for each reference position, i.e. all baseline pairs to the same reference are processed in the same way. The details are in the respective documentation of the tools used.
Furthermore, the accuracy of the daily coordinate fixes depends also on the physical behaviour observed (the kinematic of the measured landforms). If the observation point moves significantly during one observation interval (epoch) an average position is computed. For static (non-moving positions) this effect can be easily neglected. For fast motion, or stick-slip events on the contrary, this effect can negatively impact the accuracy of the measurements that basically results in a time offset for the observed displacement. If required a detailed analysis using finer grained temporal scales for the GNSS post-processing can be applied to the input data. On longer temporal scales, a seasonal period in noise can be observed for most stations and especially notable for the reference station. In Figs. 4 and B2, we show two examples of the seasonal variability in the position of a reference station. This pattern could be explained by the physical behaviour of the boulder on which the sensor is mounted. However, because no validation measurements are present, we have to consider this as noise. This noise can be considered irrelevant, because as the feature under investigation usually exhibit a yearly displacement 2–3 orders of magnitude higher than the seasonal, instrumental noise itself (displacement in metres, noise in millimetres). Nevertheless, short-term outliers in the observations should be interpreted carefully, as they can be an amplified result of noise in the reference station (e.g. spikes in RAND and HOGR in Fig. A2). A last caveat should be given on the interpretation of the data, which despite hourly to daily resolution, should be interpreted with care at such shorter timescales, critically distinguishing between noise and signals in the data.
The dataset published with this paper contains data from 1 March 2011 until 31 December 2021. An overview of the structure, file types, and size of the datasets, for both the raw primary data and derived data products, is given in Table 3. Furthermore, the dataset also contains the key metadata files for the field sites. Annual updates of this dataset are planned (living data process). Using the toolset described in Appendix C and using the online repository at http://data.permasense.ch, last access: 26 October 2022 (see Weber et al., 2019a for details), the data user can also create custom updates of the dataset independently. Furthermore, a set of wrapper scripts for GNSS post-processing using the open-source RTKLIB toolchain (http://www.rtklib.com, last access: 26 October 2022) are described in Appendix D. This toolchain allows us to compute the differential GNSS daily positions from both the RINEX files contained in this dataset as well as the online data from the PermaSense database.
The toolset (code) for preparing, processing, validating, and updating the data contained in this publication is available from the following providers and links:
-
https://git.uibk.ac.at/informatik/neslab/public/permasense/permasense_datamgr (last access: 26 October 2022) (DOI: https://doi.org/10.5281/zenodo.7251255, Weber et al., 2022).
-
https://git.uibk.ac.at/informatik/neslab/public/permasense/rtklib_processing (last access: 26 October 2022) (DOI: https://doi.org/10.5281/zenodo.7251288, Beutel, 2022).
The dataset (structure is described in Table 3) and its annual update are available from the following website:
This paper documents the data resulting from a multiple field-site monitoring effort using in situ GNSS sensors on different landforms in the Swiss Alps. This dataset constitutes one of the largest and highest fidelity datasets documenting mass movement by means of permanent ground measurement points, a method that has been developed and put into practice by the authors. The data are obtained mainly at mass movement sites in the periglacial field with a few placements at lower altitudes at or beyond the fringe of permafrost. Most of these sites are subject to further investigations using a multitude of methods, e.g. terrestrial surveys, seismometers, time-lapse photography, UAV surveys, InSAR. A basic overview of these field sites, methods employed, and data available are documented. As such, this dataset provides an important step for future work and development of novel methods, further process understanding, and help for mitigating natural hazards as well as adaptation strategies. Since October 2022, Rock Glacier Velocity (RGV) is a new Essential Climate Variable (ECV) product within the Global Climate Observing System (GCOS) (WMO, 2022).
A1 Rock glaciers
-
The Dirru Rock Glacier (DI) is a well-studied landform for this peculiar kinematic behaviour (Delaloye et al., 2010). Continuous kinematic measurements have been available since 2011 for three positions in the upper part and the first steep flank of the rock glacier. In year 2018, two more positions were instrumented on the fast-moving tongue, with the goal of creating a spatially resolved network for the analysis of the spatial variability of rock glacier velocities at a daily scale (Cicoira et al., 2019b, 2021).
-
The Distelhorn rock glacier (DIS) is the northernmost rock glacier of the Matter Valley cluster. It is located on the western flank of the Distelhorn, above the municipality of Grächen in the Matter Valley. The two instrumented GNSS positions are located on two fronts. The upper one (at 2500 ) shows a bulgy morphology, while the lower one (at 2420 ) is more distinct. Access to the rock glacier is facilitated by the presence of nearby ski slopes.
-
The Gruben rock glacier (GRU) and Jaegi rock glacier (JAE) are located in the adjacent Saas Valley, near Saas Grund, (Switzerland). They are among the first rock glaciers investigated in Switzerland (Haeberli et al., 1979; Haeberli, 1996, 1985; Haeberli and Schmid, 1988). The Jaegi rock glacier consists of two overriding fronts at around 2550 The rock glacier has shown signs of destabilisation since the 1950s (Ghirlanda et al., 2016). Currently, the upper lobe – between 2670 and 2550 – has to be considered destabilised, with large displacement rates and geomorphological signs of degradation. The GNSS position is located close to this fast-moving front.
-
The Gugla-Bielzug rock glacier (BH 10/13) is situated towards the north above the village of Herbriggen between the peaks of the Gugla and Breithorn. The frontal part of the rock glacier opens up into a very steep gully with frequent and high-volume discharge of loose material. The Gugla-Bielzug rock glacier and Bielzug debris flow are serious hazard sources in the area. Significant efforts have been undertaken to (i) study the details and (ii) implement protective measures for the safety of the valley habitat and infrastructure. Specifically, a debris catchment, several damming structures, and an early warning system using geophones have been implemented (Kummert et al., 2018a; Kummert and Delaloye, 2018; Kummert et al., 2018b; Wirz et al., 2014b; Guillemot et al., 2021; Oggier et al., 2016).
-
The Stabbio di Largario rock glacier (LAR) is located in the Adula/Rheinwaldhorn massif and therefore adds to the monitoring concept in a different weather zone (Scapozza et al., 2014). This rock glacier is known as an important source of debris, reworked by debris flow descending from the Soi Valley, and having caused several damages at the village of Dangio-Torre in the past, destroying the chocolate plant located at the confluence of Soi Valley into the Blenio Valley on 28–29 August 1908.
-
The Muragl rock glacier (MUR) is located in the homonym valley in the municipality of Samedan (Switzerland). The rock glacier has already been investigated 20 years ago in some of the first detailed photogrammetric studies from aerial and satellite imagery in the periglacial environment (Kääb et al., 1997, 1998). On site, one fixed GNSS sensor is located a few hundred metres up from the PERMOS borehole (Cicoira et al., 2019a).
-
The Murtèl-Corvatsch rock glacier (COR) is one of the first rock glaciers to be studied intensively worldwide. Its displacement rates are 1–2 orders of magnitude smaller than most other rock glaciers presented in this dataset. It hosts the longest time series of permafrost temperatures in an alpine rock glacier, dating back to 1987 (Vonder Mühll and Haeberli, 1990; Hoelzle et al., 2002). During the same period, vertical inclinometer profiles were also measured manually, providing a unique dataset. Recent detailed process-oriented studies are based on the dataset presented (Cicoira et al., 2019a, 2021).
-
The Ritigraben rock glacier (RI) is a well-studied landform in the vicinity of the ski slopes of Grächen (Switzerland). In addition to the kinematics data, borehole temperatures and inclinometers data are available (Kenner et al., 2017, 2018; Cicoira et al., 2019a).
-
The Schafberg rock glacier (SCH) is located above the municipality of Pontresina (Switzerland). The rock glacier delivers debris to steep slopes prone to snow avalanches and debris flows that endanger the infrastructure and the village in the valley bottom. Therefore, it has been the object of investigations for this and other projects related to natural hazards. The kinematic measurements are complemented by borehole temperatures and past inclinometer profile measurements (Arenson et al., 2002), available through PERMOS. Detailed studies about rock glacier dynamics have investigated this well-monitored site (Cicoira et al., 2019a; Kenner et al., 2020).
-
The Steintälli rock glacier (ST) is located a few hundred metres higher in the same catchment as the Dirru rock glacier. It is not directly connected to the valley bottom and is characterised by gentler slope gradients in comparison to the other rock glaciers in the valley. However, it carries two exemplary steep frontal zones above which the two GNSS sensors are positioned. The creep rates and the seasonal variability of this rock glacier are less pronounced and are more related to the general patterns observed in the Alps, rather than its steeper neighbours in the Matter Valley (Noetzli et al., 2019).
A2 Steep rock walls
-
The Matterhorn Hörnli ridge (MH) is the east ridge of the Matterhorn. The measurements are mainly clustered in and around a prominent high-alpine rockfall (at an elevation of about 3500 ) that took place in year 2003 (Hasler et al., 2008, 2011, 2012). The highest position at this site and in the entire dataset is located at the Solvey Hut at 4003 Apart from the thermal and kinematic measurements documented in Weber et al. (2019a), recent years have also seen experimentation with seismic sensors (Weber et al., 2018b, c).
-
The Randa Grossgufer (RA) is a 30 × 106 m3 rockslide site on the orographic left side of the Matter Valley, just opposite from the Dirru rock glacier. It has been thoroughly investigated by numerous researchers (Willenberg et al., 2008b, a; V. Gischig et al., 2011; Fäh et al., 2012-12; S. Gischig et al., 2011; Moore et al., 2011; Burjánek et al., 2010; Eberhardt et al., 2004). Monitoring activity has increased in the past years with one GNSS reference and 3× GNSS sensor rovers situated at the lip of the detachment.
-
The Sattelspitz buttress (SA) is a minor buttress on the west ridge above Täsch (Switzerland). Due to slope instabilities and hazard potential for the fresh water supply of the village of Täsch, a kinematic monitoring has been set up at this site. A fixed GNSS sensor has been installed on top of a rock tower that is currently showing the largest displacement rates on the rock face. The data have not been analysed in a scientific publication.
A3 Landslides
-
The Breithorn landslide (BH) is a landslide situated on the south-west slope of the Breithorn summit (3176 m a.s.l.). It is located in close proximity, a few hundred metres north, of the Gugla-Bielzug rock glacier, which holds the same label. Positions 3, 7, 9, 12, and 68 are/were located on the landslide. Positions 10 and 13 are located on the rock glacier (see below).
-
The Längenschnee (LS) and Gugla (GU) landslides can be found one ridge line further south in the valley. This area features a large, relict landslide that surged at least once in 1959, when the village of Herbriggen was evacuated for a number of days in mid-winter1. The lower parts of the slopes leading down from the Gugla are known as Längenschnee, a sediment and debris-rich area characterised by sharp steepening drop, leading into the valley and towering above the village of Herbriggen. Here, the downslope movement of the whole area poses a significant and real risk for the habitat in the valley. Important countermeasures apart from observation and monitoring have been undertaken recently, e.g. a protective dam is currently being constructed and a large boulder (Grosse Stei) in the area of Längenschnee has been fixed by anchoring and concrete under-filling. This boulder has been monitored since 2018 using a GNSS sensor (position LS11).
-
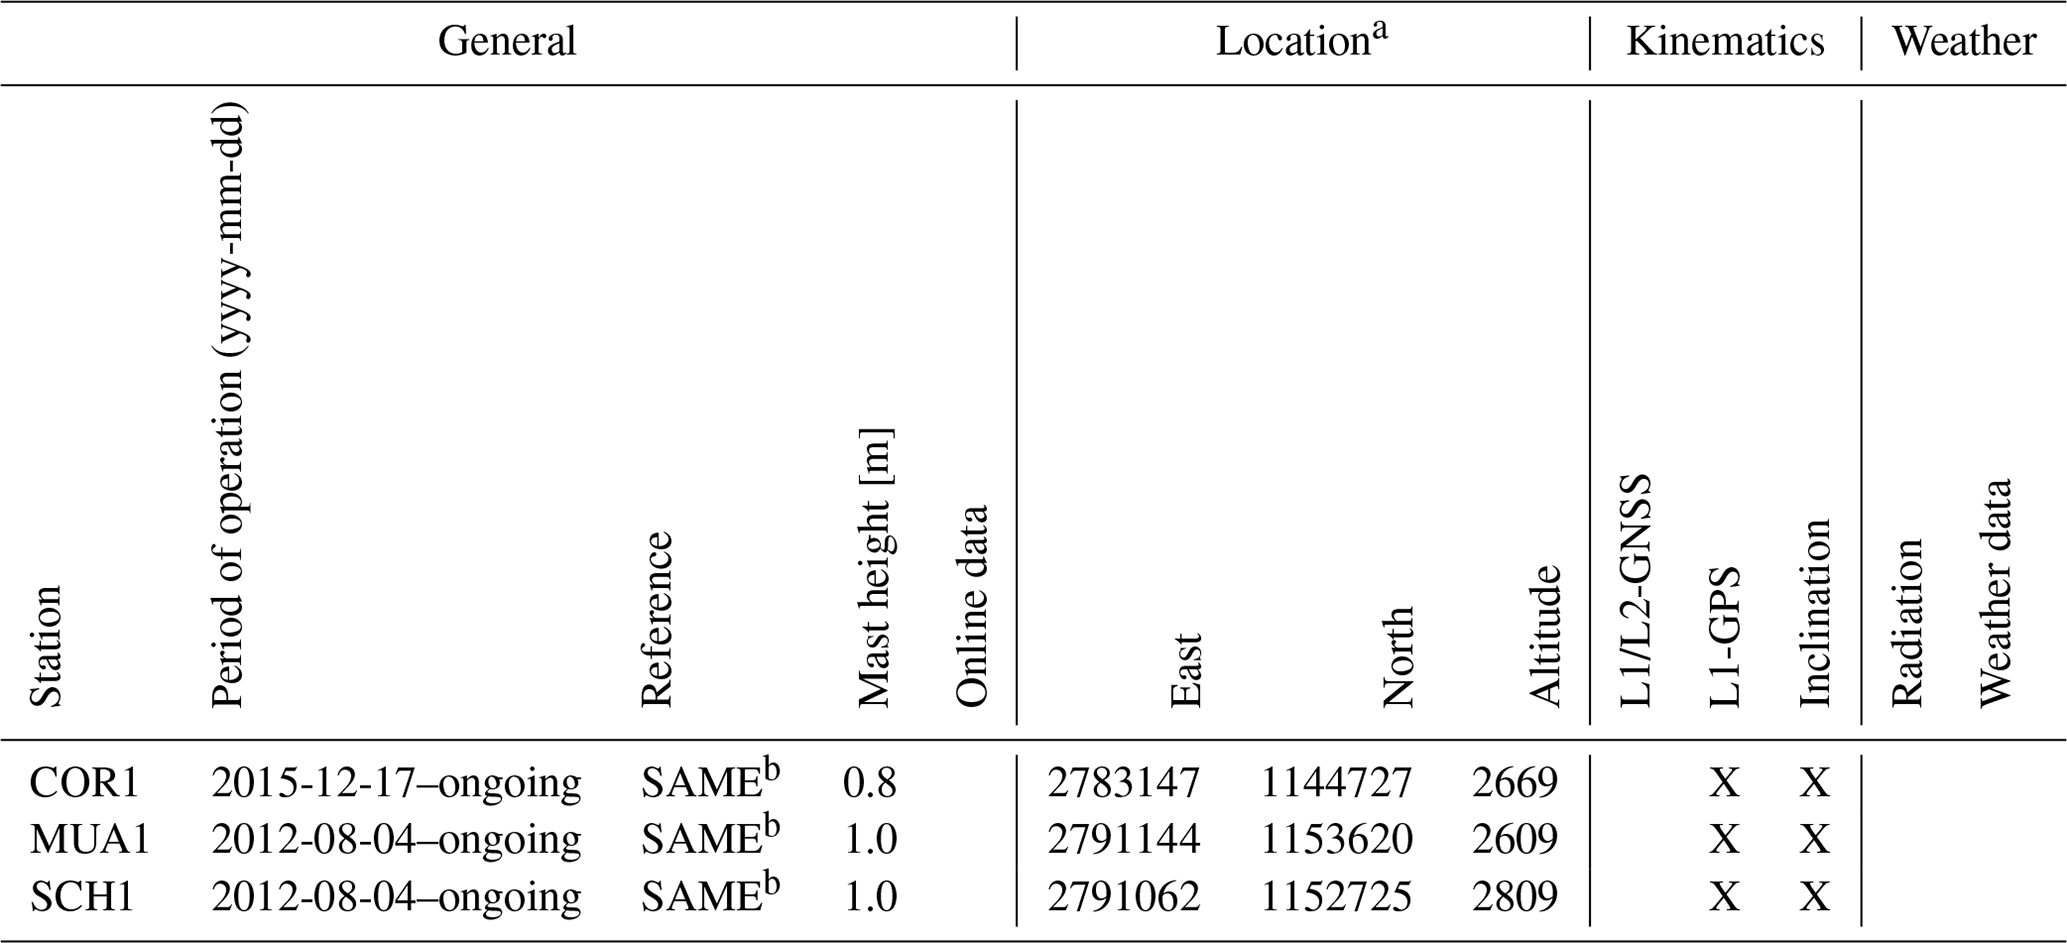
The Grabengufer landslide (GG) is a complex landform comprising of a landslide (sagging) originating at approx. 2800 as well as a very fast-moving rock glacier releasing its debris into a hazard debris flow ending just north of the village of Randa (Delaloye et al., 2013). It has seen mitigation measures for many decades with the earliest on record dating back to 1945, when a protective wall was constructed to fence off a lateral part of the moving rock glacier in the area of the “Grüne Garten” above the village of Randa2.
-
The Wisse Schijen landslide (WYS) is situated on the orographic left side of the Matter Valley at around 3100 m a.s.l., to the west of Randa. A large landslide is affecting the top of the permafrost slope equipped with avalanche protection structures (eight rows of snow nets). These nets retain snow in the Wisse Schijen avalanche release area and protect numerous rows of steel snow bridges below. A GNSS sensor is situated in the centre of the landslide to monitor slope displacements parallel to borehole inclinometer measurements.
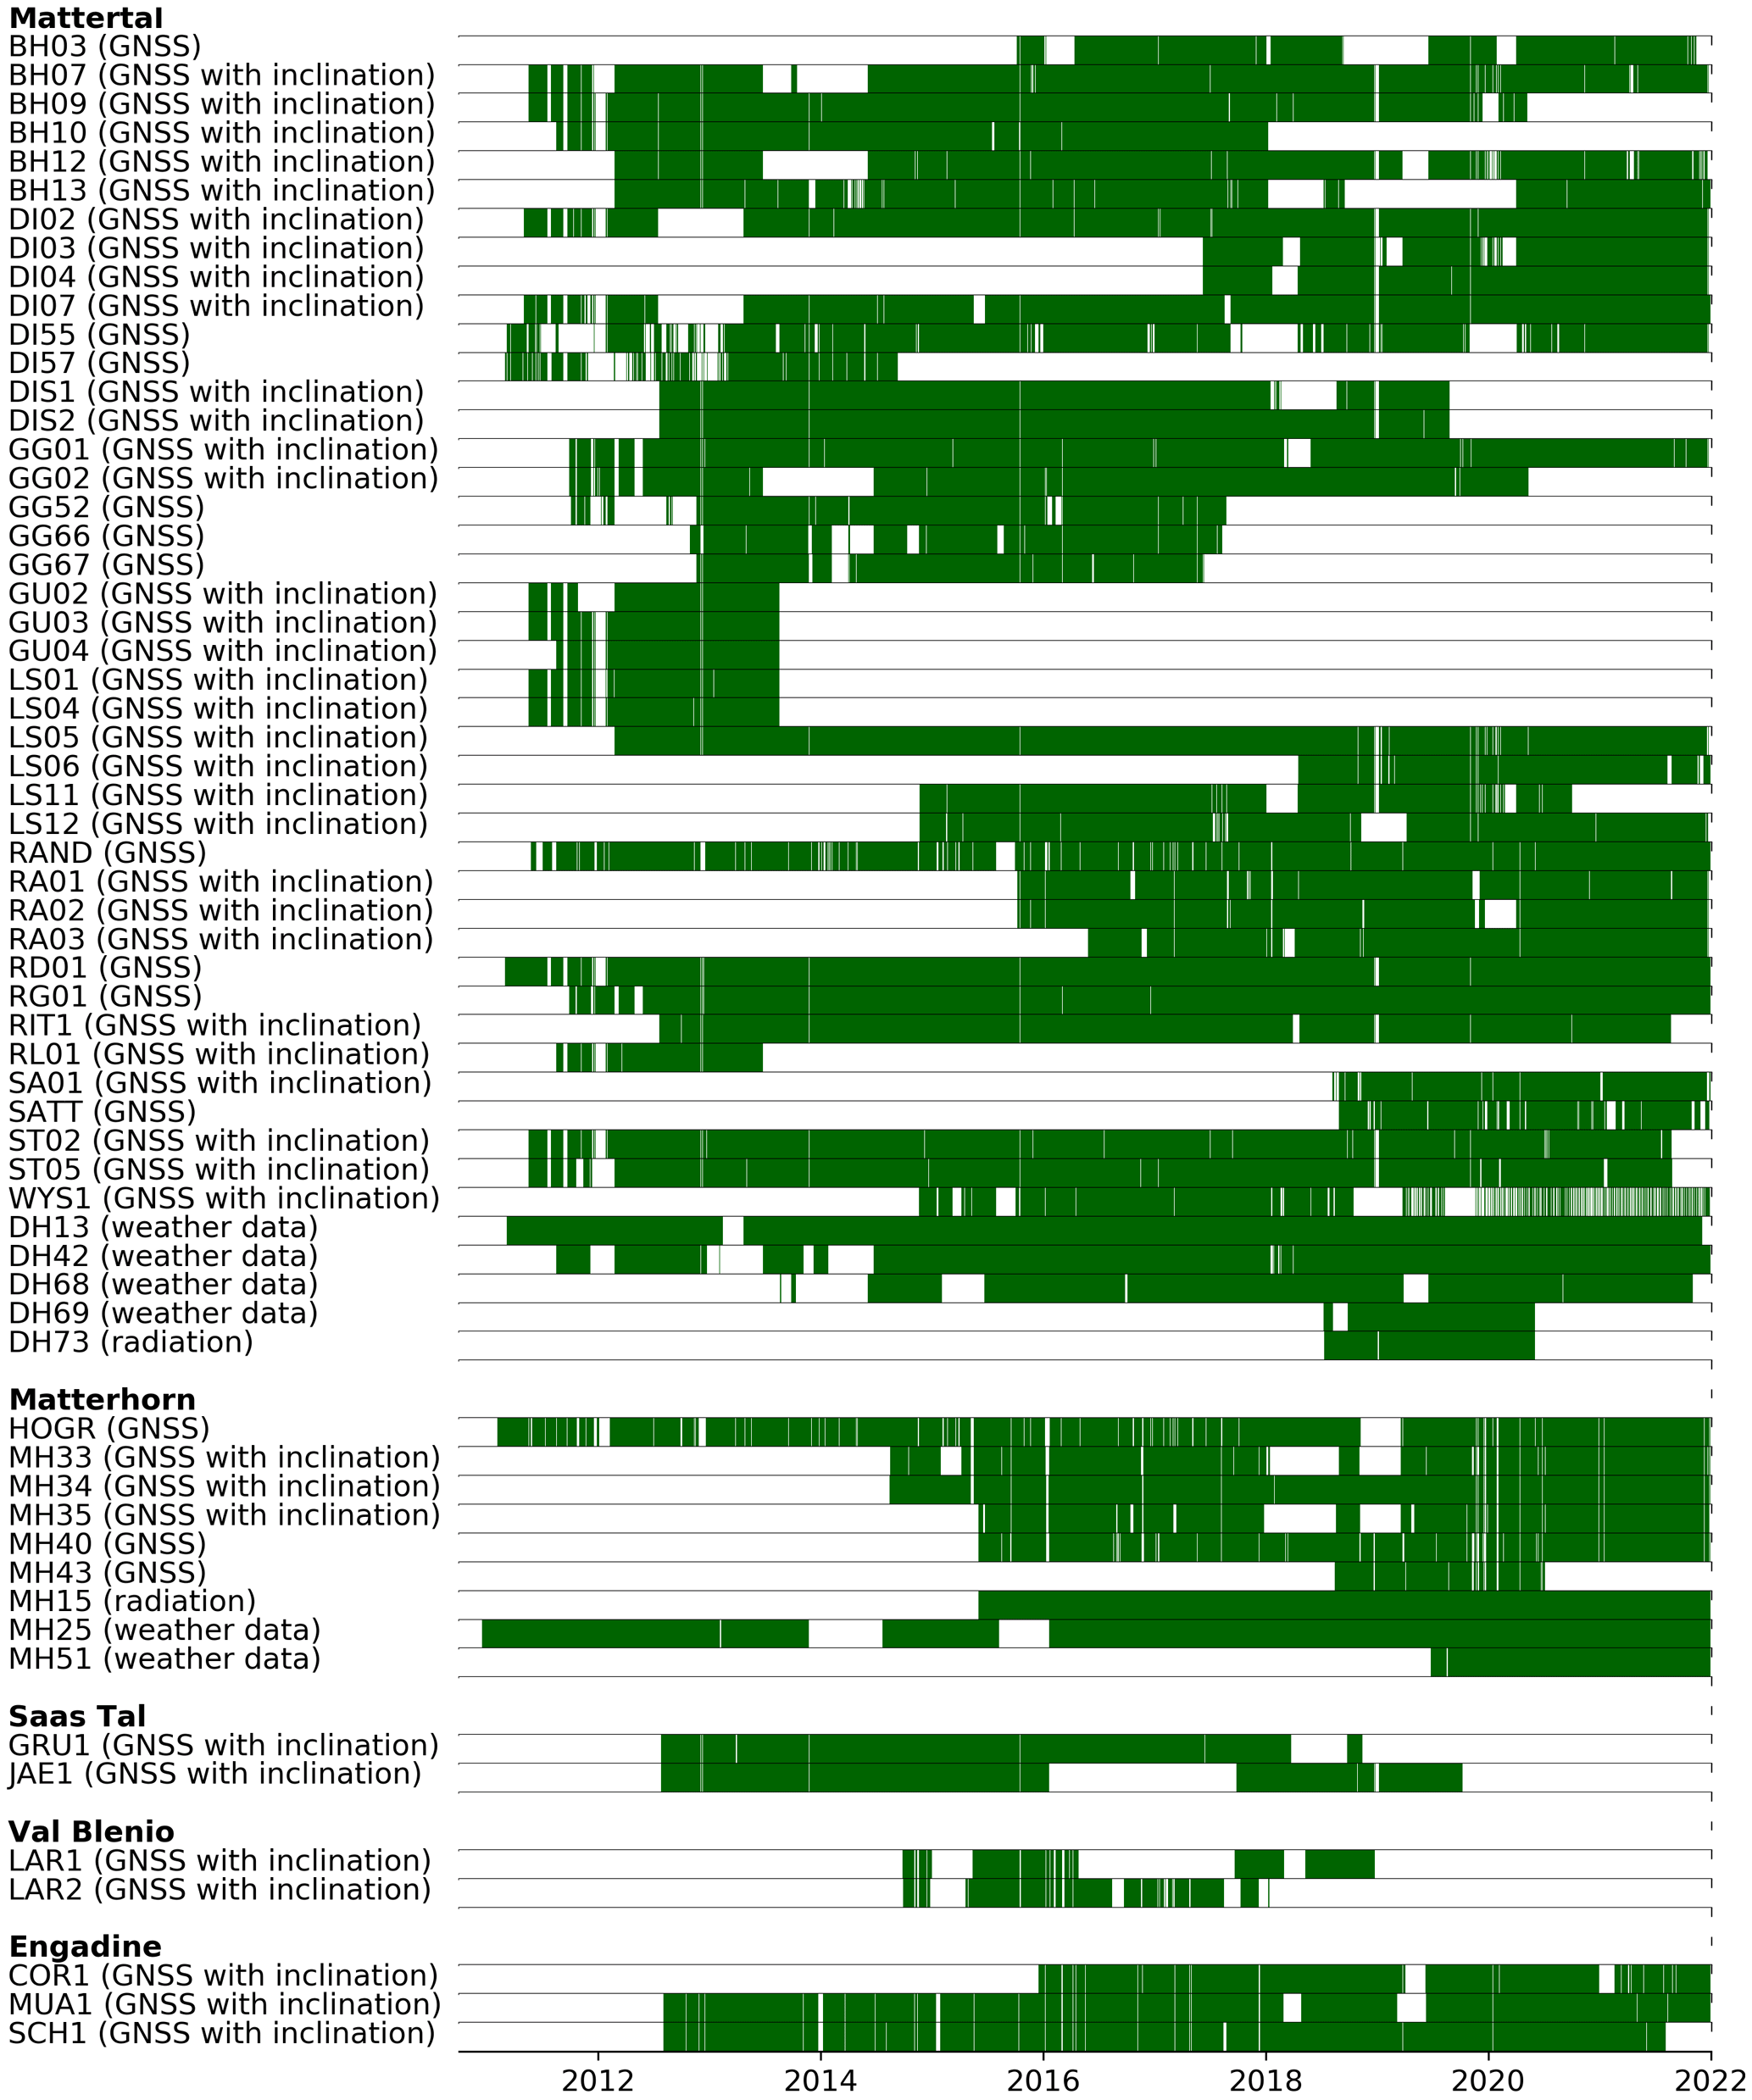
Figure A1Data availability for all primary data products. The time periods when data are available are indicated in green.
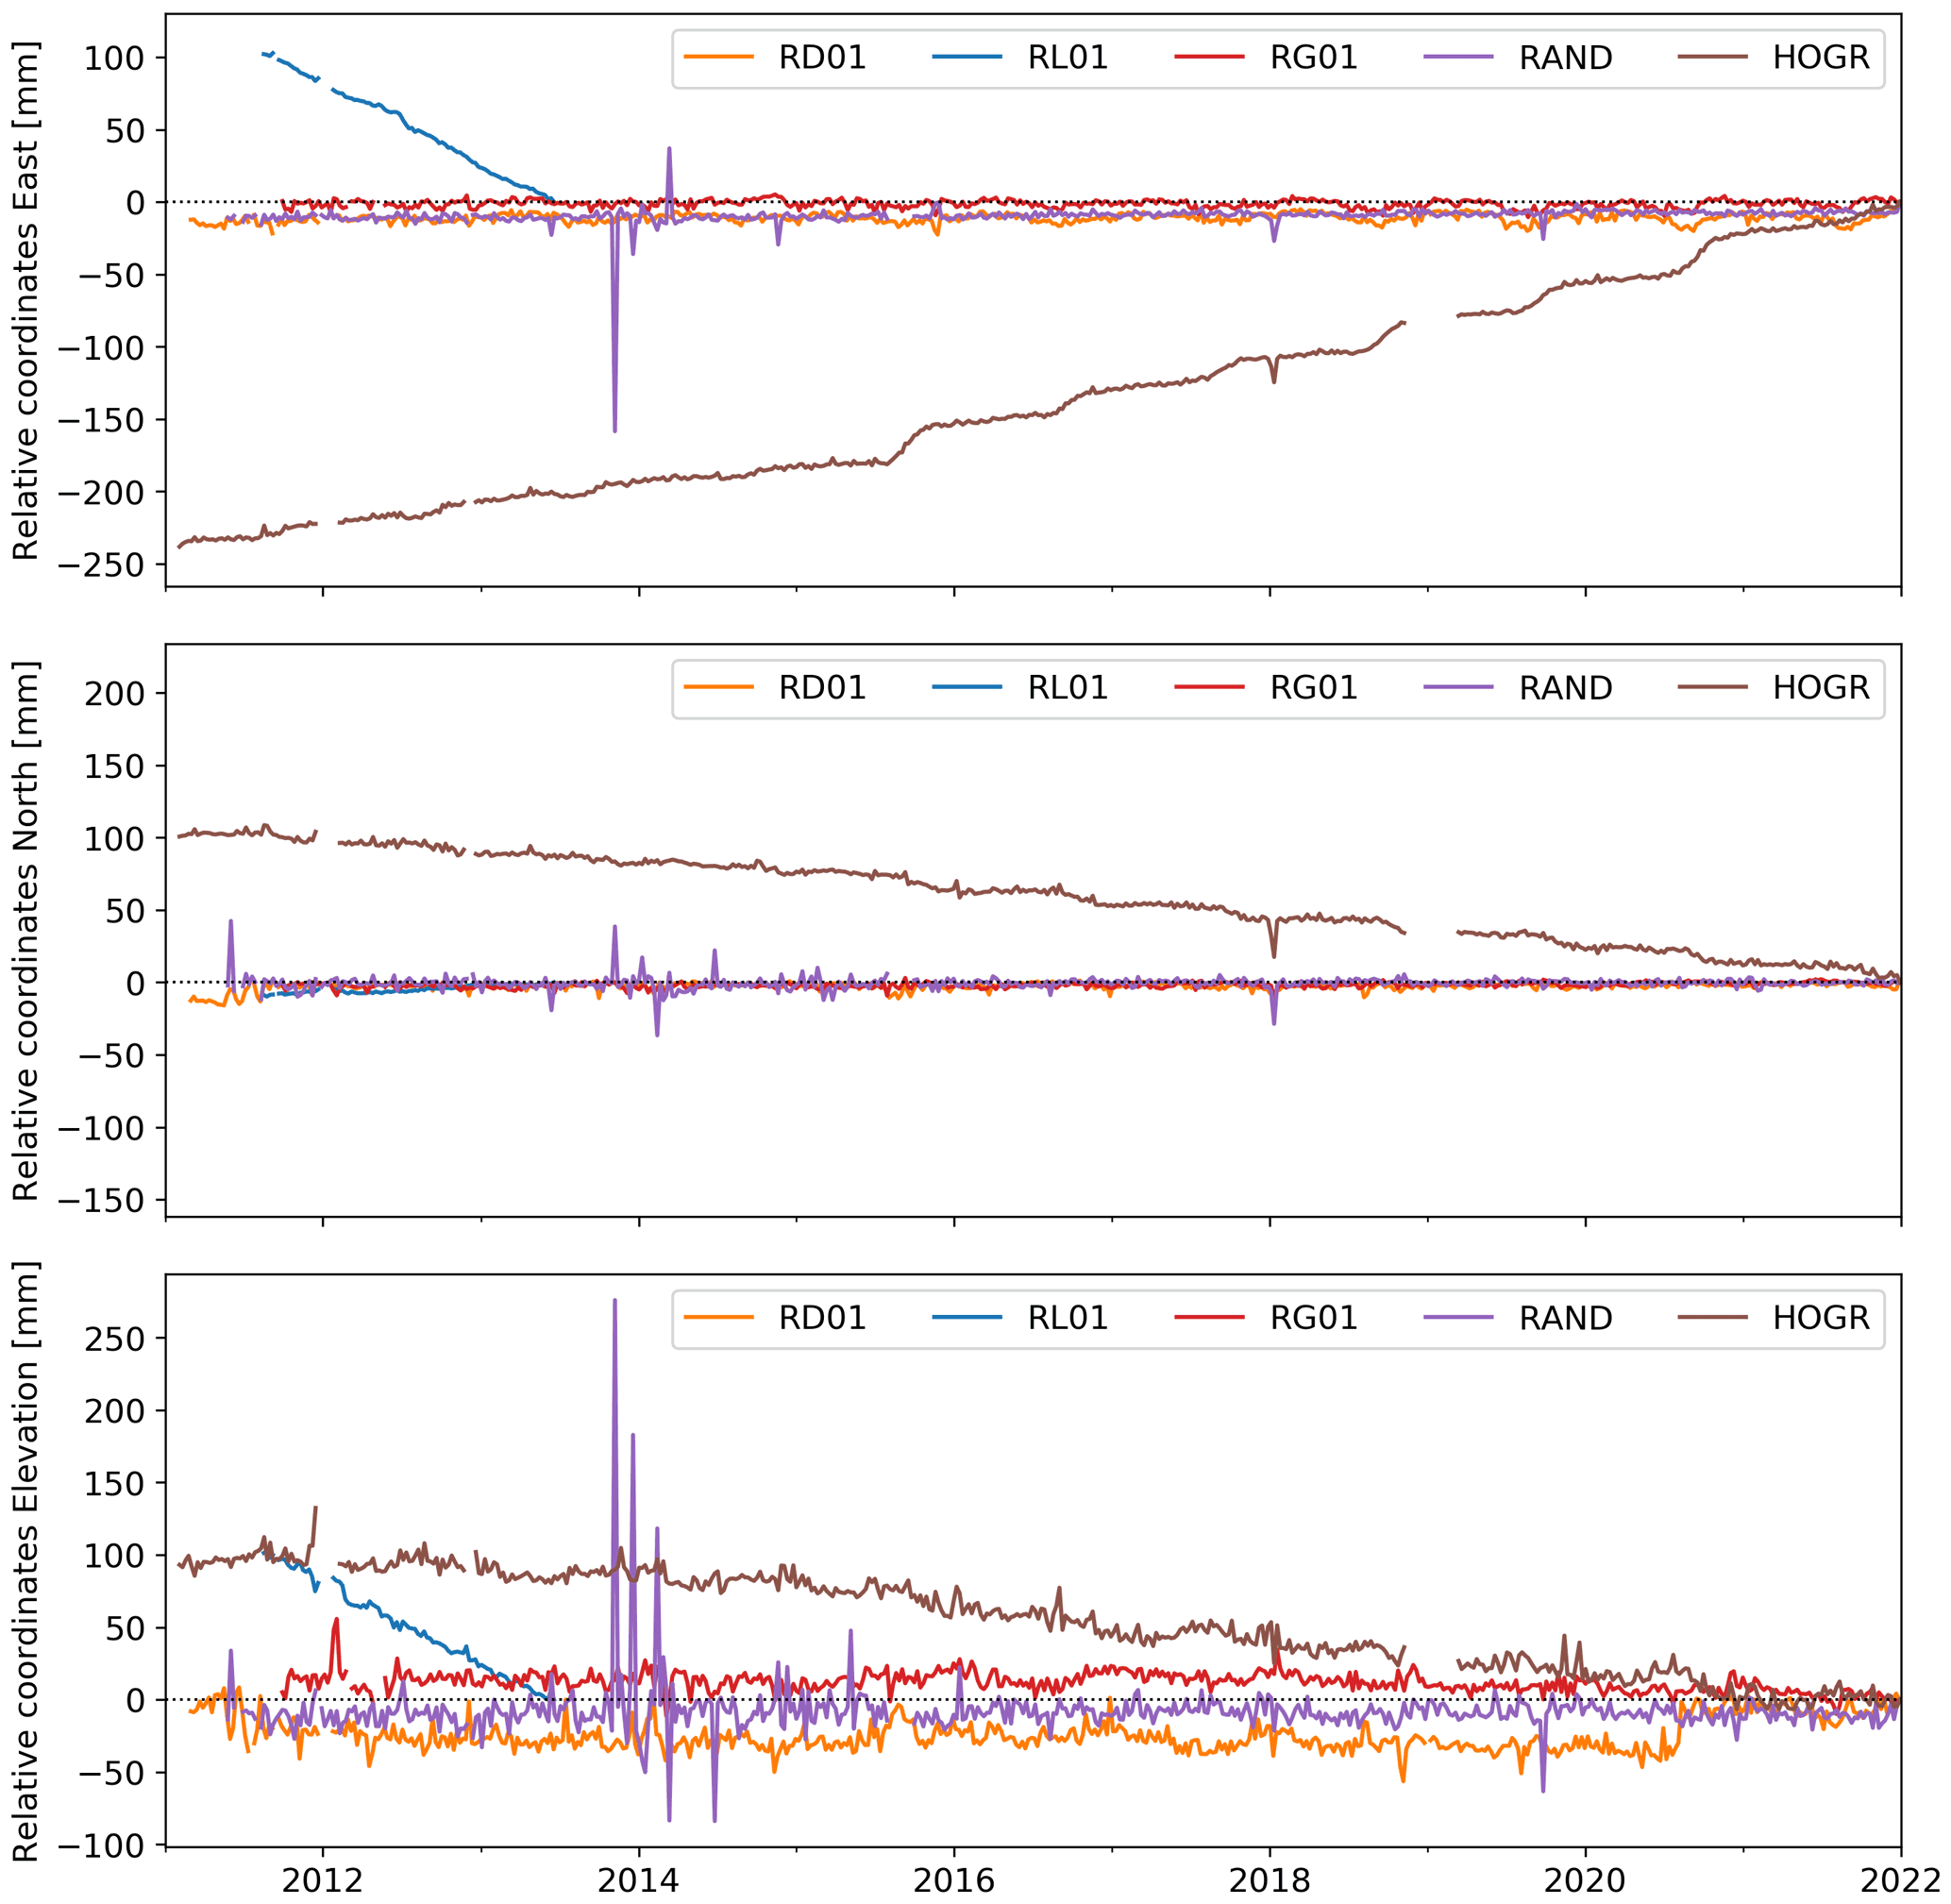
Figure A2Time series (weekly mean) the three components of all reference stations used. A detailed description of each station is given in Table 2. For a discussion of the spike in HOGR that also appears in the nearby RAND, see Sect. 6.
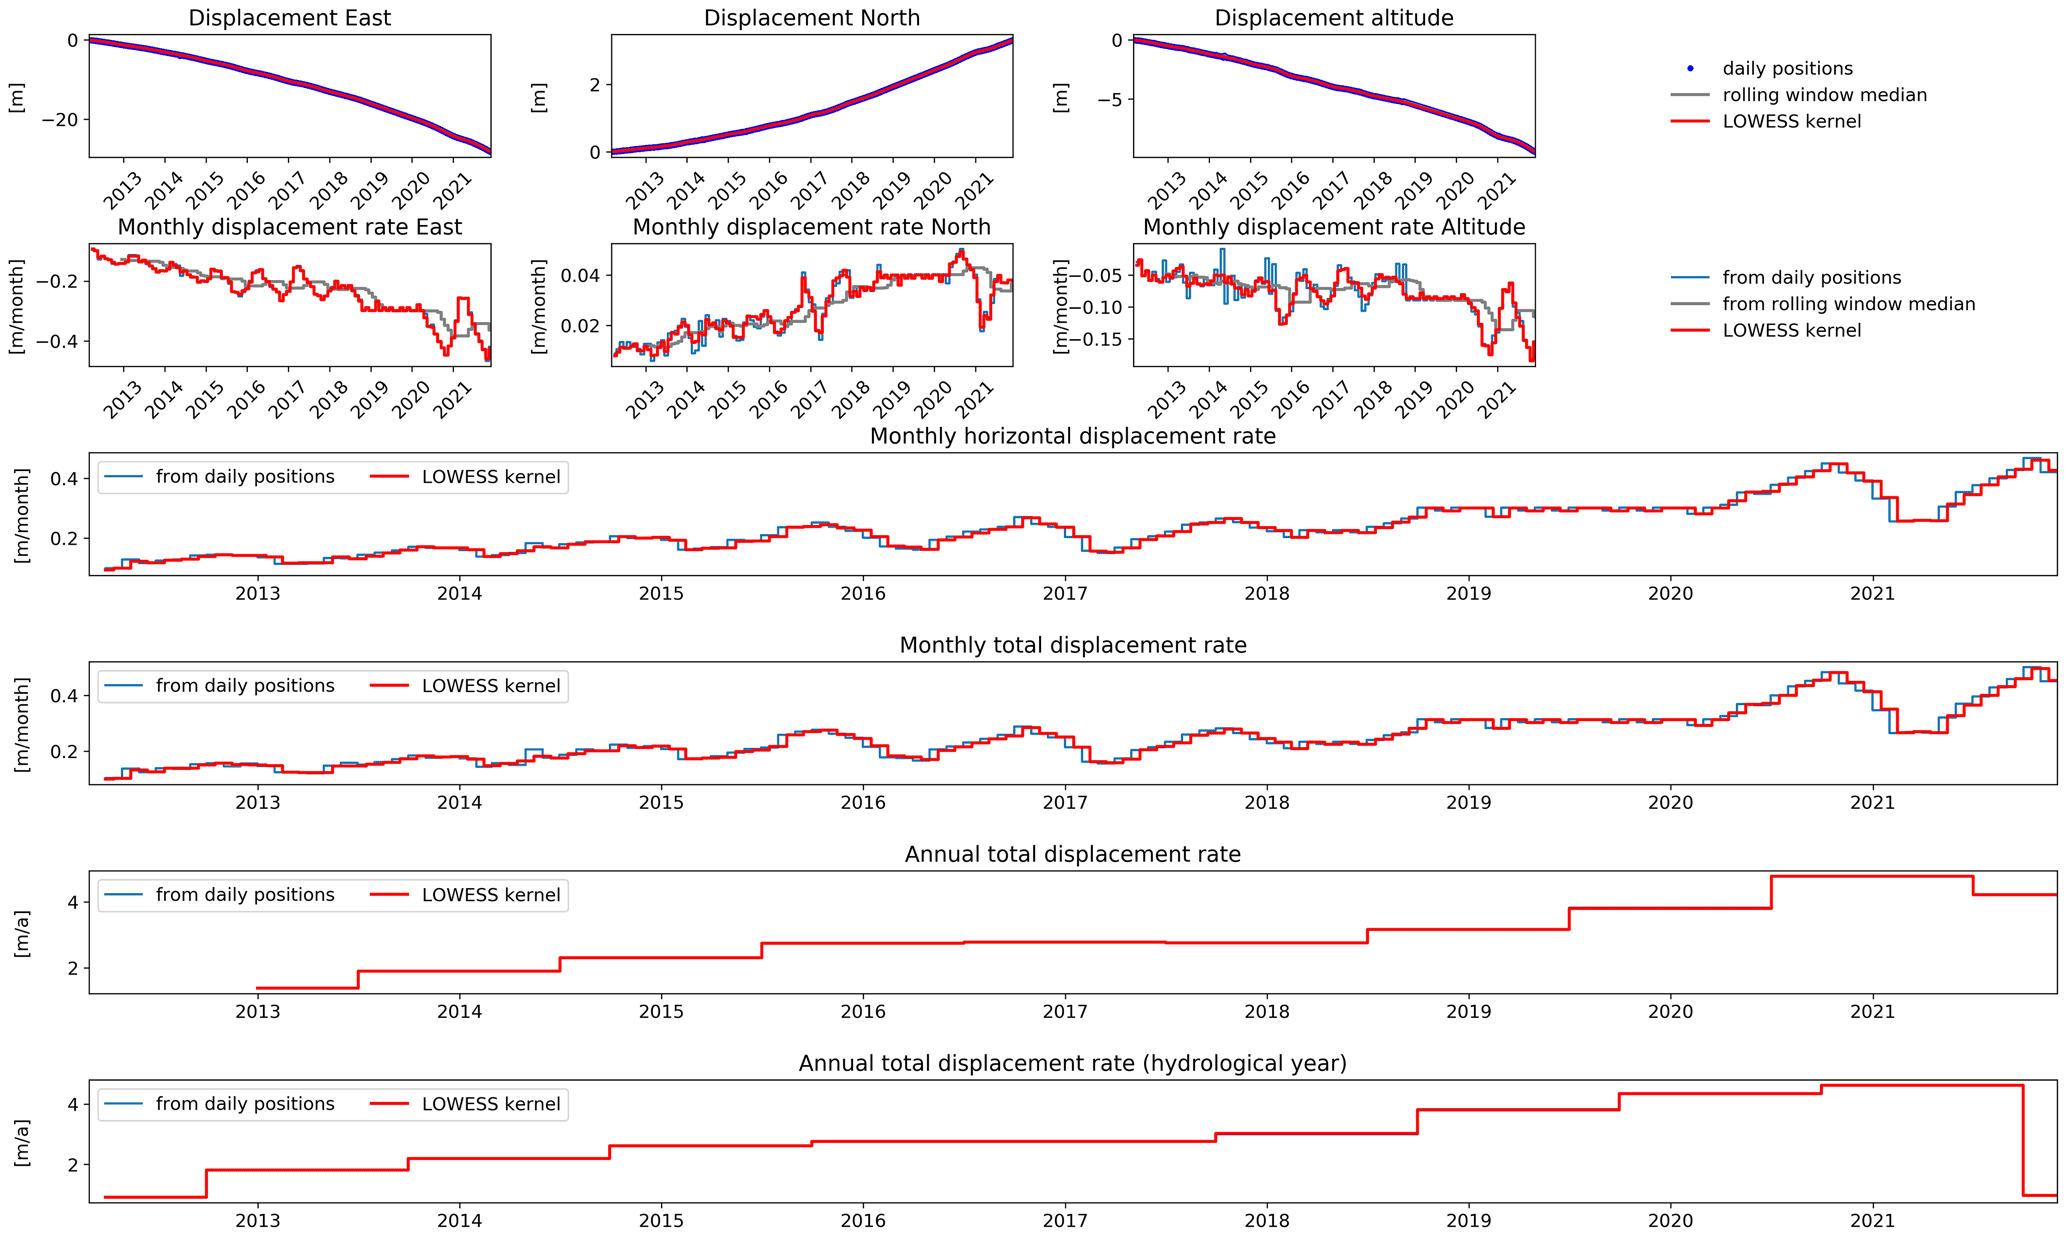
Figure A3Station BH13 on the Breithorn/Bielzug rock glacier above Herbriggen; VS exhibits a steady acceleration downslope.
Figure A4Station BH13 on the Breithorn/Bielzug rock glacier above Herbriggen; VS exhibits a steady acceleration downslope.
Figure A5Station BH13 on the Breithorn/Bielzug rock glacier above Herbriggen; VS exhibits a steady acceleration downslope.
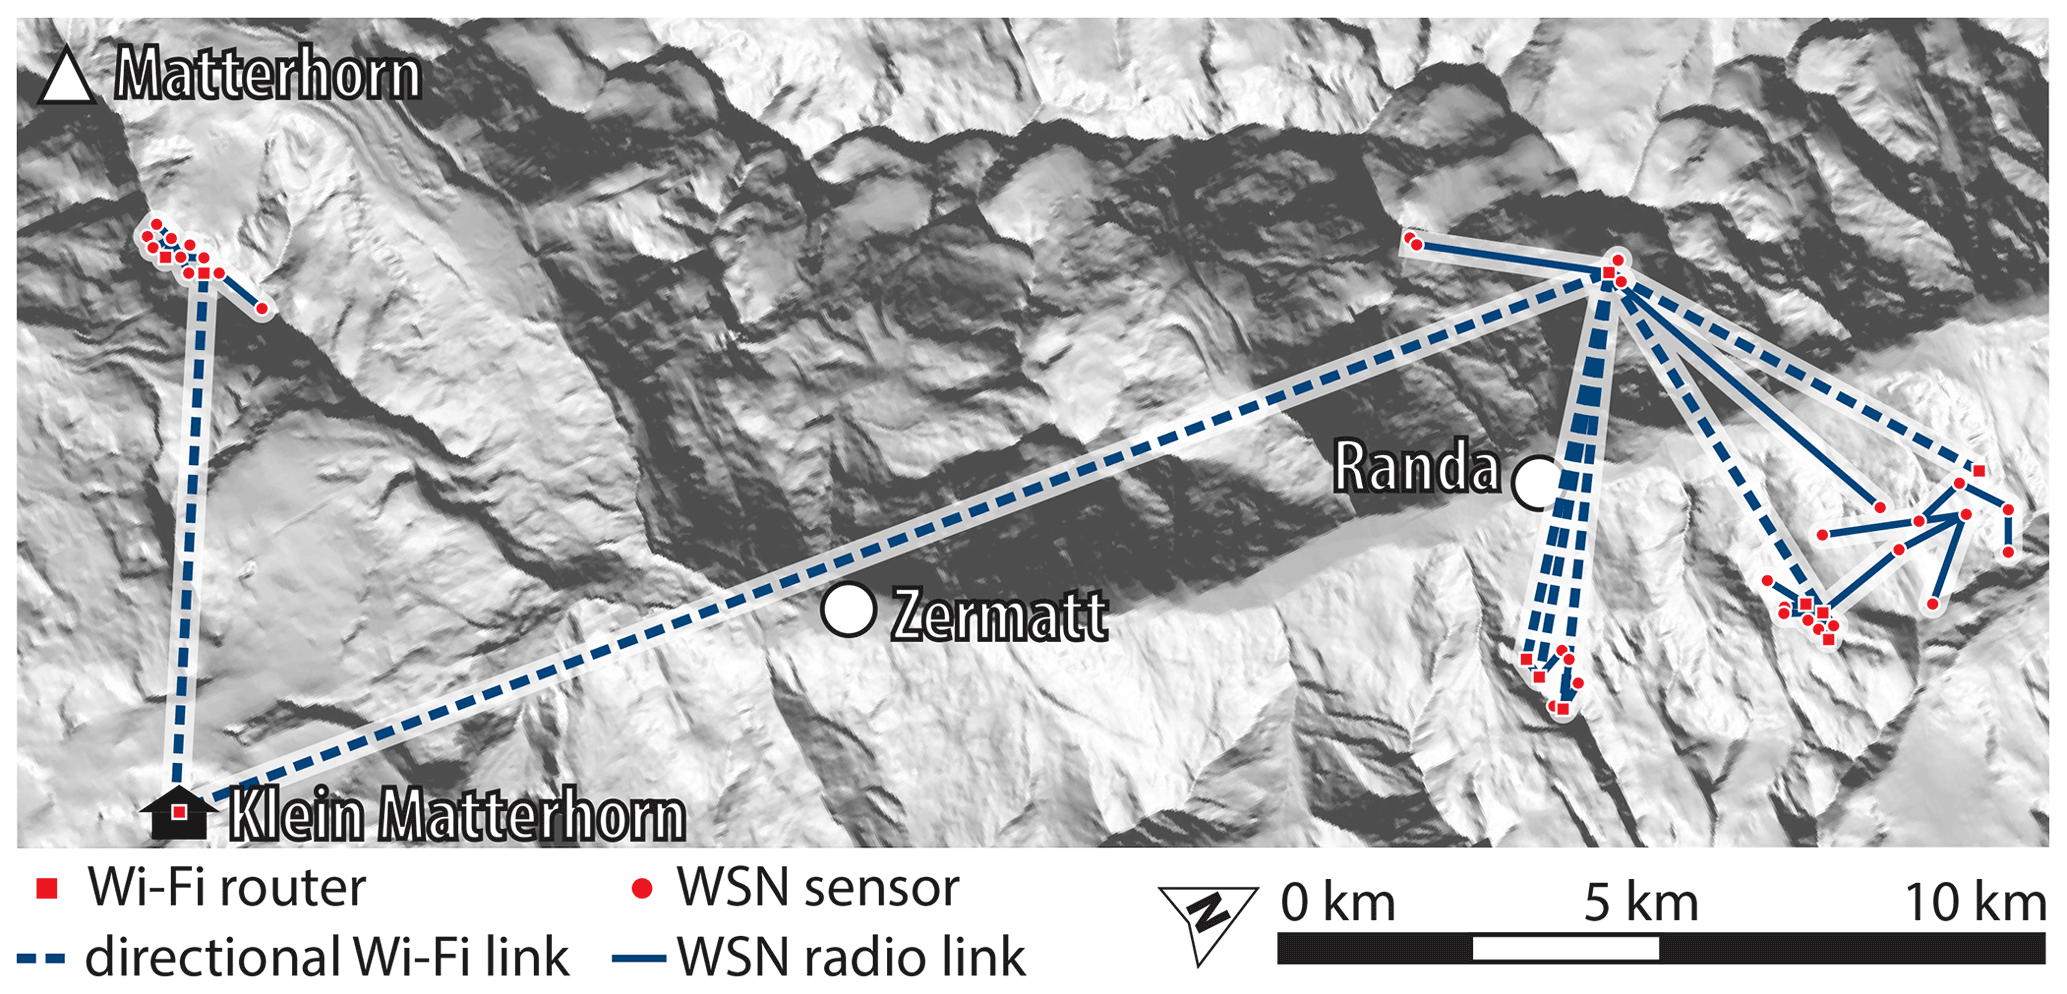
Figure A6Wireless LAN (WLAN) backbone and fine distribution of wireless connectivity to all sensor locations in the Matter Valley. The basis for such connection is a WLAN access point located at the cable car station of the Klein Matterhorn 3883 about 6.5 km away, where the network is attached to a local Internet service provider using glass fibre. In a previous publication, Weber et al. (2019a) provided a more comprehensive and detailed description of the technology of the WSN.
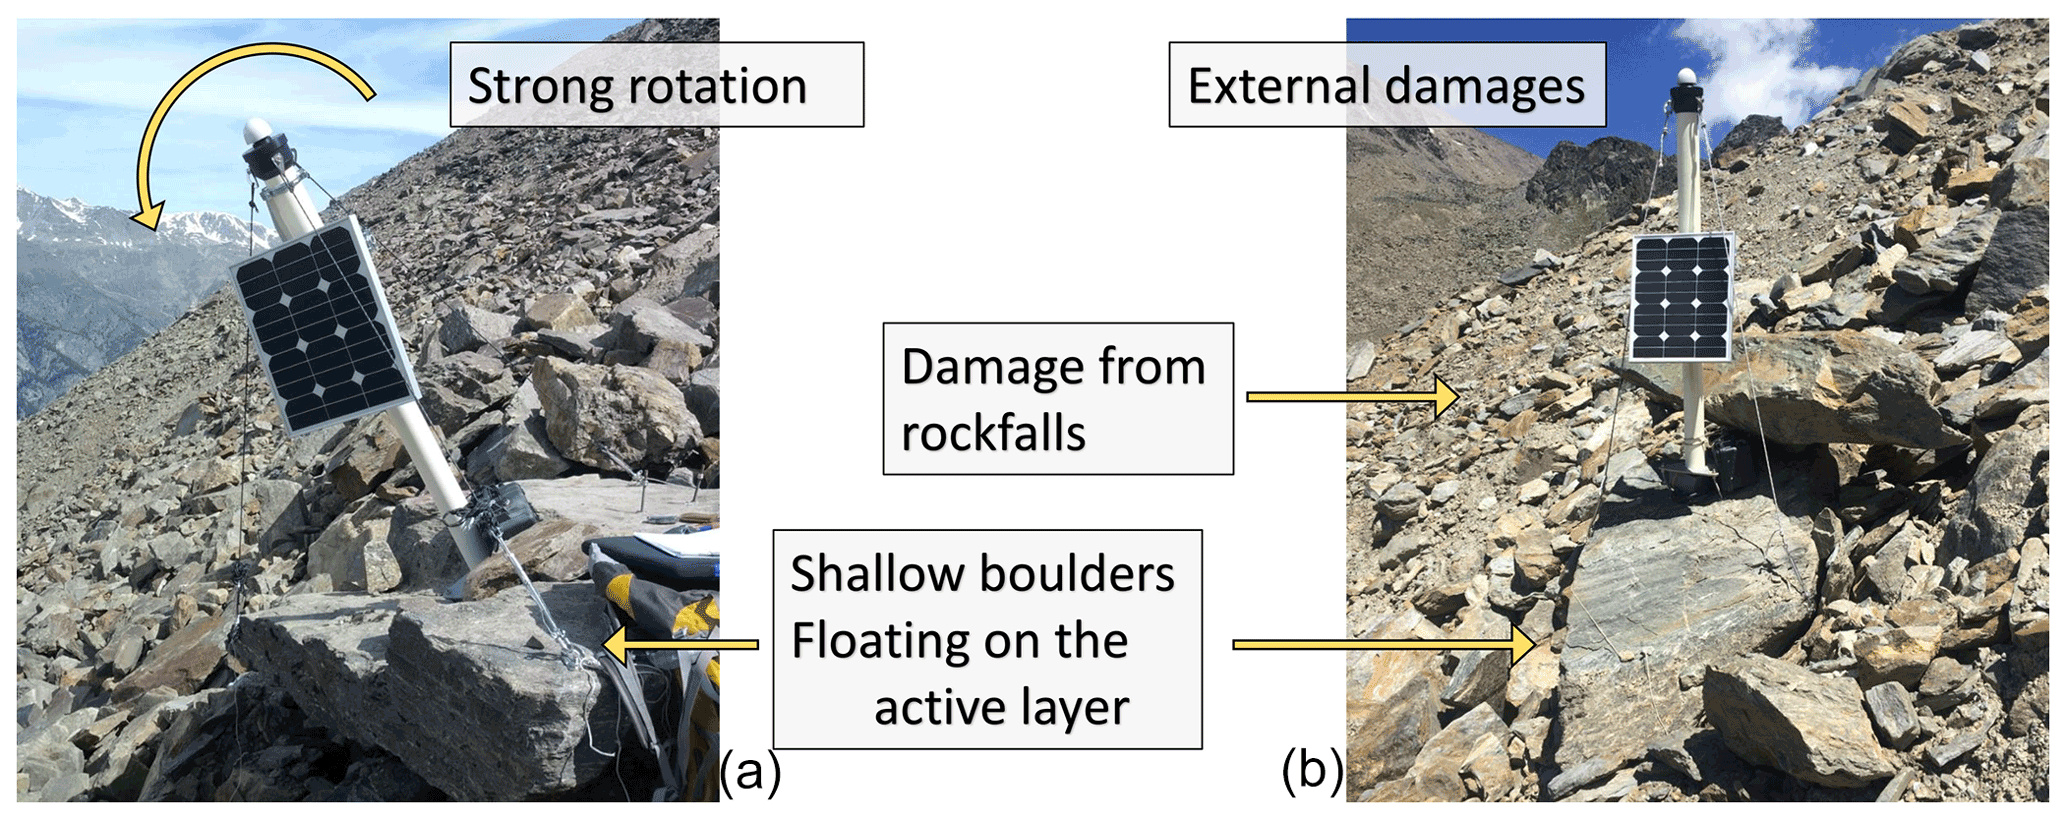
Figure A7In very active movement zones finding a single block to fix the measurement instrument can be challenging, both w.r.t. longevity and the representative motion of the investigated landform. The two locations shown in this figure are very active zones in steep parts of two rock glaciers above Herbriggen (Switzerland): Dirru rock glacier (a) and Breithorn/Bielzug rock glacier (b). Photos from PermaSense archive.
Table A1Per position overview of the sensors in the Matter Valley field site (see Fig. 2): Part 1.
a Location coordinates are given for the first day of deployment. b Sensor was destroyed in an avalanche ending the time series. c Sensor location detached in a rockfall ending the time series.
Table A2Per position overview of the sensors in the Matter Valley field site (see Fig. 2): Part 2.
a Location coordinates are given for the first day of deployment. b Data from the permanent GNSS network in Switzerland (AGNES) are used here.
Table A3Per position overview of the sensors in the Matterhorn field site.

a Location coordinates are given for the first day of deployment. b Data from the permanent GNSS network in Switzerland (AGNES) are used here.
Table A4Per position overview of the sensors in the Saas Tal field site.
a Location coordinates are given for the first day of deployment.
Table A5Per position overview of the sensors in the Val Blenio field site.
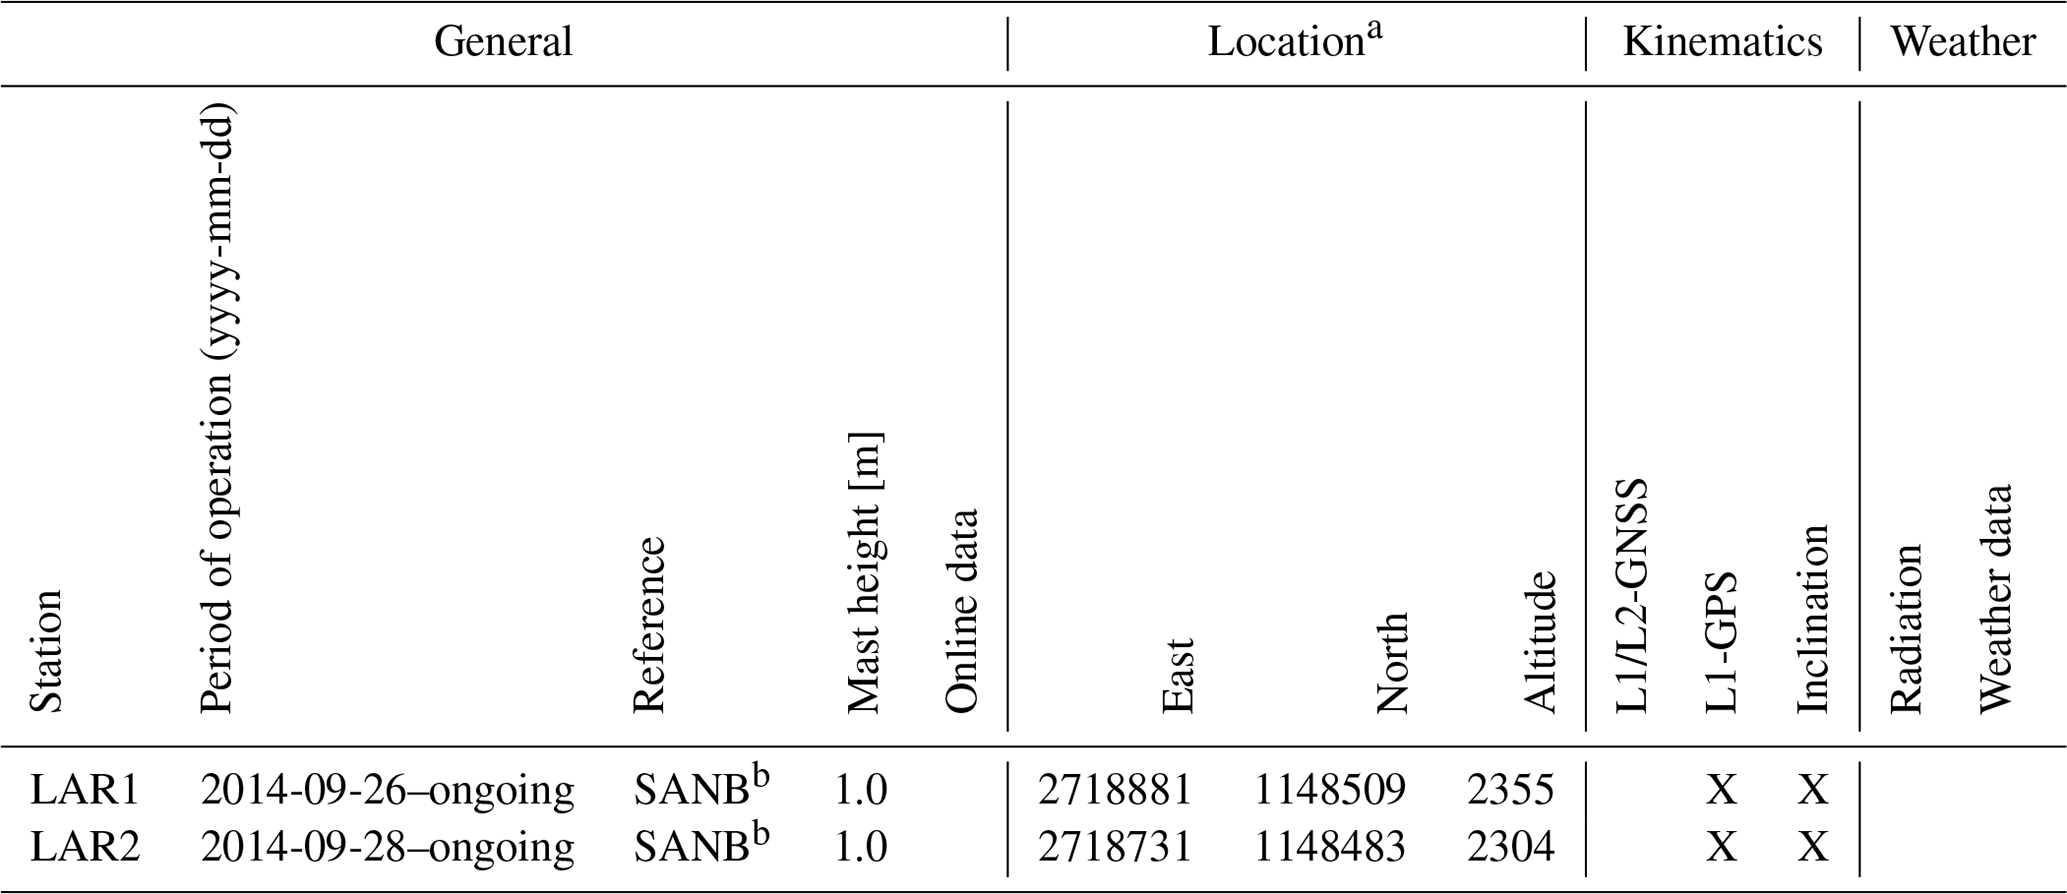
a Location coordinates are given for the first day of deployment. b Data from the permanent GNSS network in Switzerland (AGNES) are used here.
Table A6Per position overview of the sensors in the Engadine field site.
a Location coordinates are given for the first day of deployment. b Data from the permanent GNSS network in Switzerland (AGNES) are used here.
X-Sense, the initial project, conducted from 2010 to 2013, focused on a study area on the orographic right side of the Matter Valley above the municipalities of Randa and Herbriggen (Switzerland). This area is dominantly situated in permafrost, exhibits several features (Wirz et al., 2013) (see Fig. 2), and has a rich history w.r.t. mass movement-related natural hazards. Specifically, the earliest known records for hazard mitigation efforts date back to 1945 (subsidies by the Swiss federal government for rock-wall protection measures near the Grabengufer) and February 1959 (evacuation of the village of Herbriggen due to an excessive landslide spontaneously developing on the Längenschnee/Gugla area).
Apart from obtaining sensor data and working on geoscientific process studies, this project also focussed on developing and proving the utility of low-powered wireless GNSS sensors in the scope of the application described. As mentioned earlier in Sect. 2, a new set of sensors was developed based on commodity L1-GPS receivers and ubiquitous wireless data access based on previous work on the Matterhorn (Talzi et al., 2007; Hasler et al., 2008, 2012; Weber et al., 2017) and Jungfraujoch (Hasler et al., 2011; Girard et al., 2012). The main challenge, besides designing a robust and long-lived sensing system suitable for year-round operation in a high-alpine setting, lies in the fact that the GNSS sensors employed are characterised by (i) large data volumes and (ii) a significant power consumption compared to many other in situ sensors used in this domain. This is due to the fact that the GNSS receiver needs to be operated continuously over large periods of time (typically hours) and without using any low-power operating modes and also using an active antenna in order to obtain sufficient observation data from the satellite constellation w.r.t. both quality and quantity. For the detection of very small displacements, such as in compact bedrock or the ability to react to changing displacement dynamics quickly, e.g. in natural hazard scenarios, a 24/7 operation of the sensors is required. The resulting energy and data footprint of the GNSS sensor alone (without data logging and data transmission) is on the order of watts and megabytes per station and per day. Therefore, it significantly exceeds typical requirements of geoscientific data-acquisition systems, e.g. a typical data logger with sensors attached.
The deployment activities of GNSS sensors started in the summer of 2010 on the central orographic right side of the Matter Valley above the village of Herbriggen. From then on, the newly developed GNSS sensors were tested and put to use to survey kinematics across different landforms and hazard areas (Wirz et al., 2014b). Further extensions took place at the Steintälli rock glacier, the Gugla/Bielzug rock glacier, the Längenschnee, Breithorn, Gugla landslide areas as well as the Grabengufer above Randa.
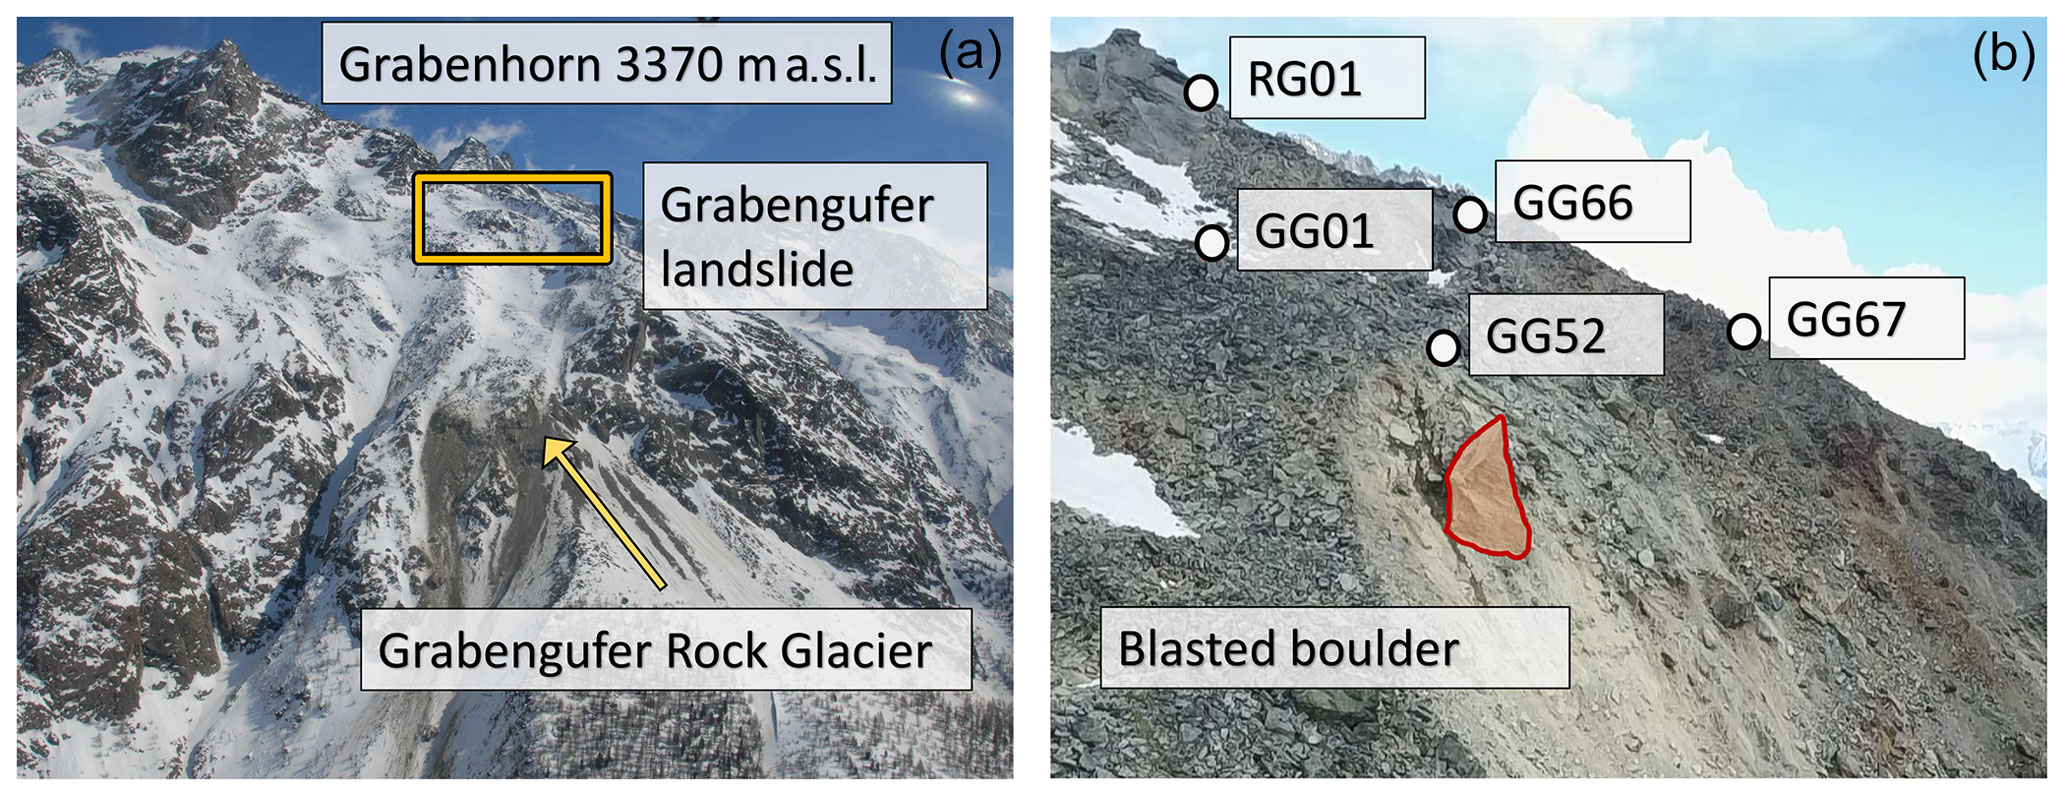
Figure B1The Grabengufer rock glacier in winter. Panel (a) shows an overview of the catchment with the Grabenhorn on top, the Grabengufer landslide, and the Grabengufer rock glacier above the Dorfbächji channel, with exposed eroded debris. Panel (b) shows the zoomed-in area highlighted with the yellow box, the Grabengufer landslide in summer. The different measurement positions, the reference station, and the freestanding block (approx. 2000 m3) blasted in summer of 2018 are labelled. Photos from PermaSense archive.
During the study period, further hazard and mitigation events took place where the data documented by and supplementing this paper served as integral components for decision-making by the Swiss cantonal and federal authorities. A selection of the most noteworthy events and measures are described in the following: In spring 2013, excessive discharge from the Gugla-Bielzug rock glacier caused severe debris flow in the Bielzug torrent, causing a partial evacuation of the village of Herbriggen. Subsequently, a new catchment with dam as well as geophone-based monitoring was projected and erected. In order to protect hikers crossing the Grabengufer, a hanging bridge spanning the upper part of the discharge gully was constructed in 2010. Due to the rapid evolution of the Grabengufer rock glacier and the landslide above it, the bridge was hit by discharged debris multiple times, subsequently closed and dismantled. In 2017, a new bridge with a span of 494 m was erected further downslope in the gully. In 2018, a large boulder on the order of 2000 m3 was blasted in a 2-month effort to protect the village of Randa below (see Figs. B1 and B2). This freestanding boulder was located at the front of the landslide feeding into the Grabengufer rock glacier and was gradually revealed due to continuous erosion happening because of the excessive slope movements in the area. Figure B2 shows the long-term evolution of position GG02. The seasonal accelerations throughout the time series and the anomalous behaviour (exponential acceleration) during 2020 are notable; this lead to the detachment of the boulder from the slope and a consequent rockfall. The process is visible in both the displacement and inclinometer data. Another relevant case interests the area of Längenschnee, where a large rock boulder (2524 ) endangering the municipality of Herbriggen was stabilised with anchors and concrete under-filling in 2014. Here, the monitoring of slope movement using 3× GPS on unstable masses and 1× GNSS sensor on the stabilised rock serve as integral parts of the protection measures for the village of Herbriggen. Due to the recent evolution of the landslide, the village has received a new hazard zonation in 2018, and four large protective dams have recently been erected on the upper limit of the village. In the Ritigraben area, the rock glacier has repeatedly led to severe debris flow with impact on the road, railway track, and Matter Vispa river below. The most notable event was in 2018 when the debris discharged by the Ritigraben Rock Glacier obstructed the river and caused severe flooding all the way into the central sewage treatment plant of the valley (Kenner et al., 2017, 2018).
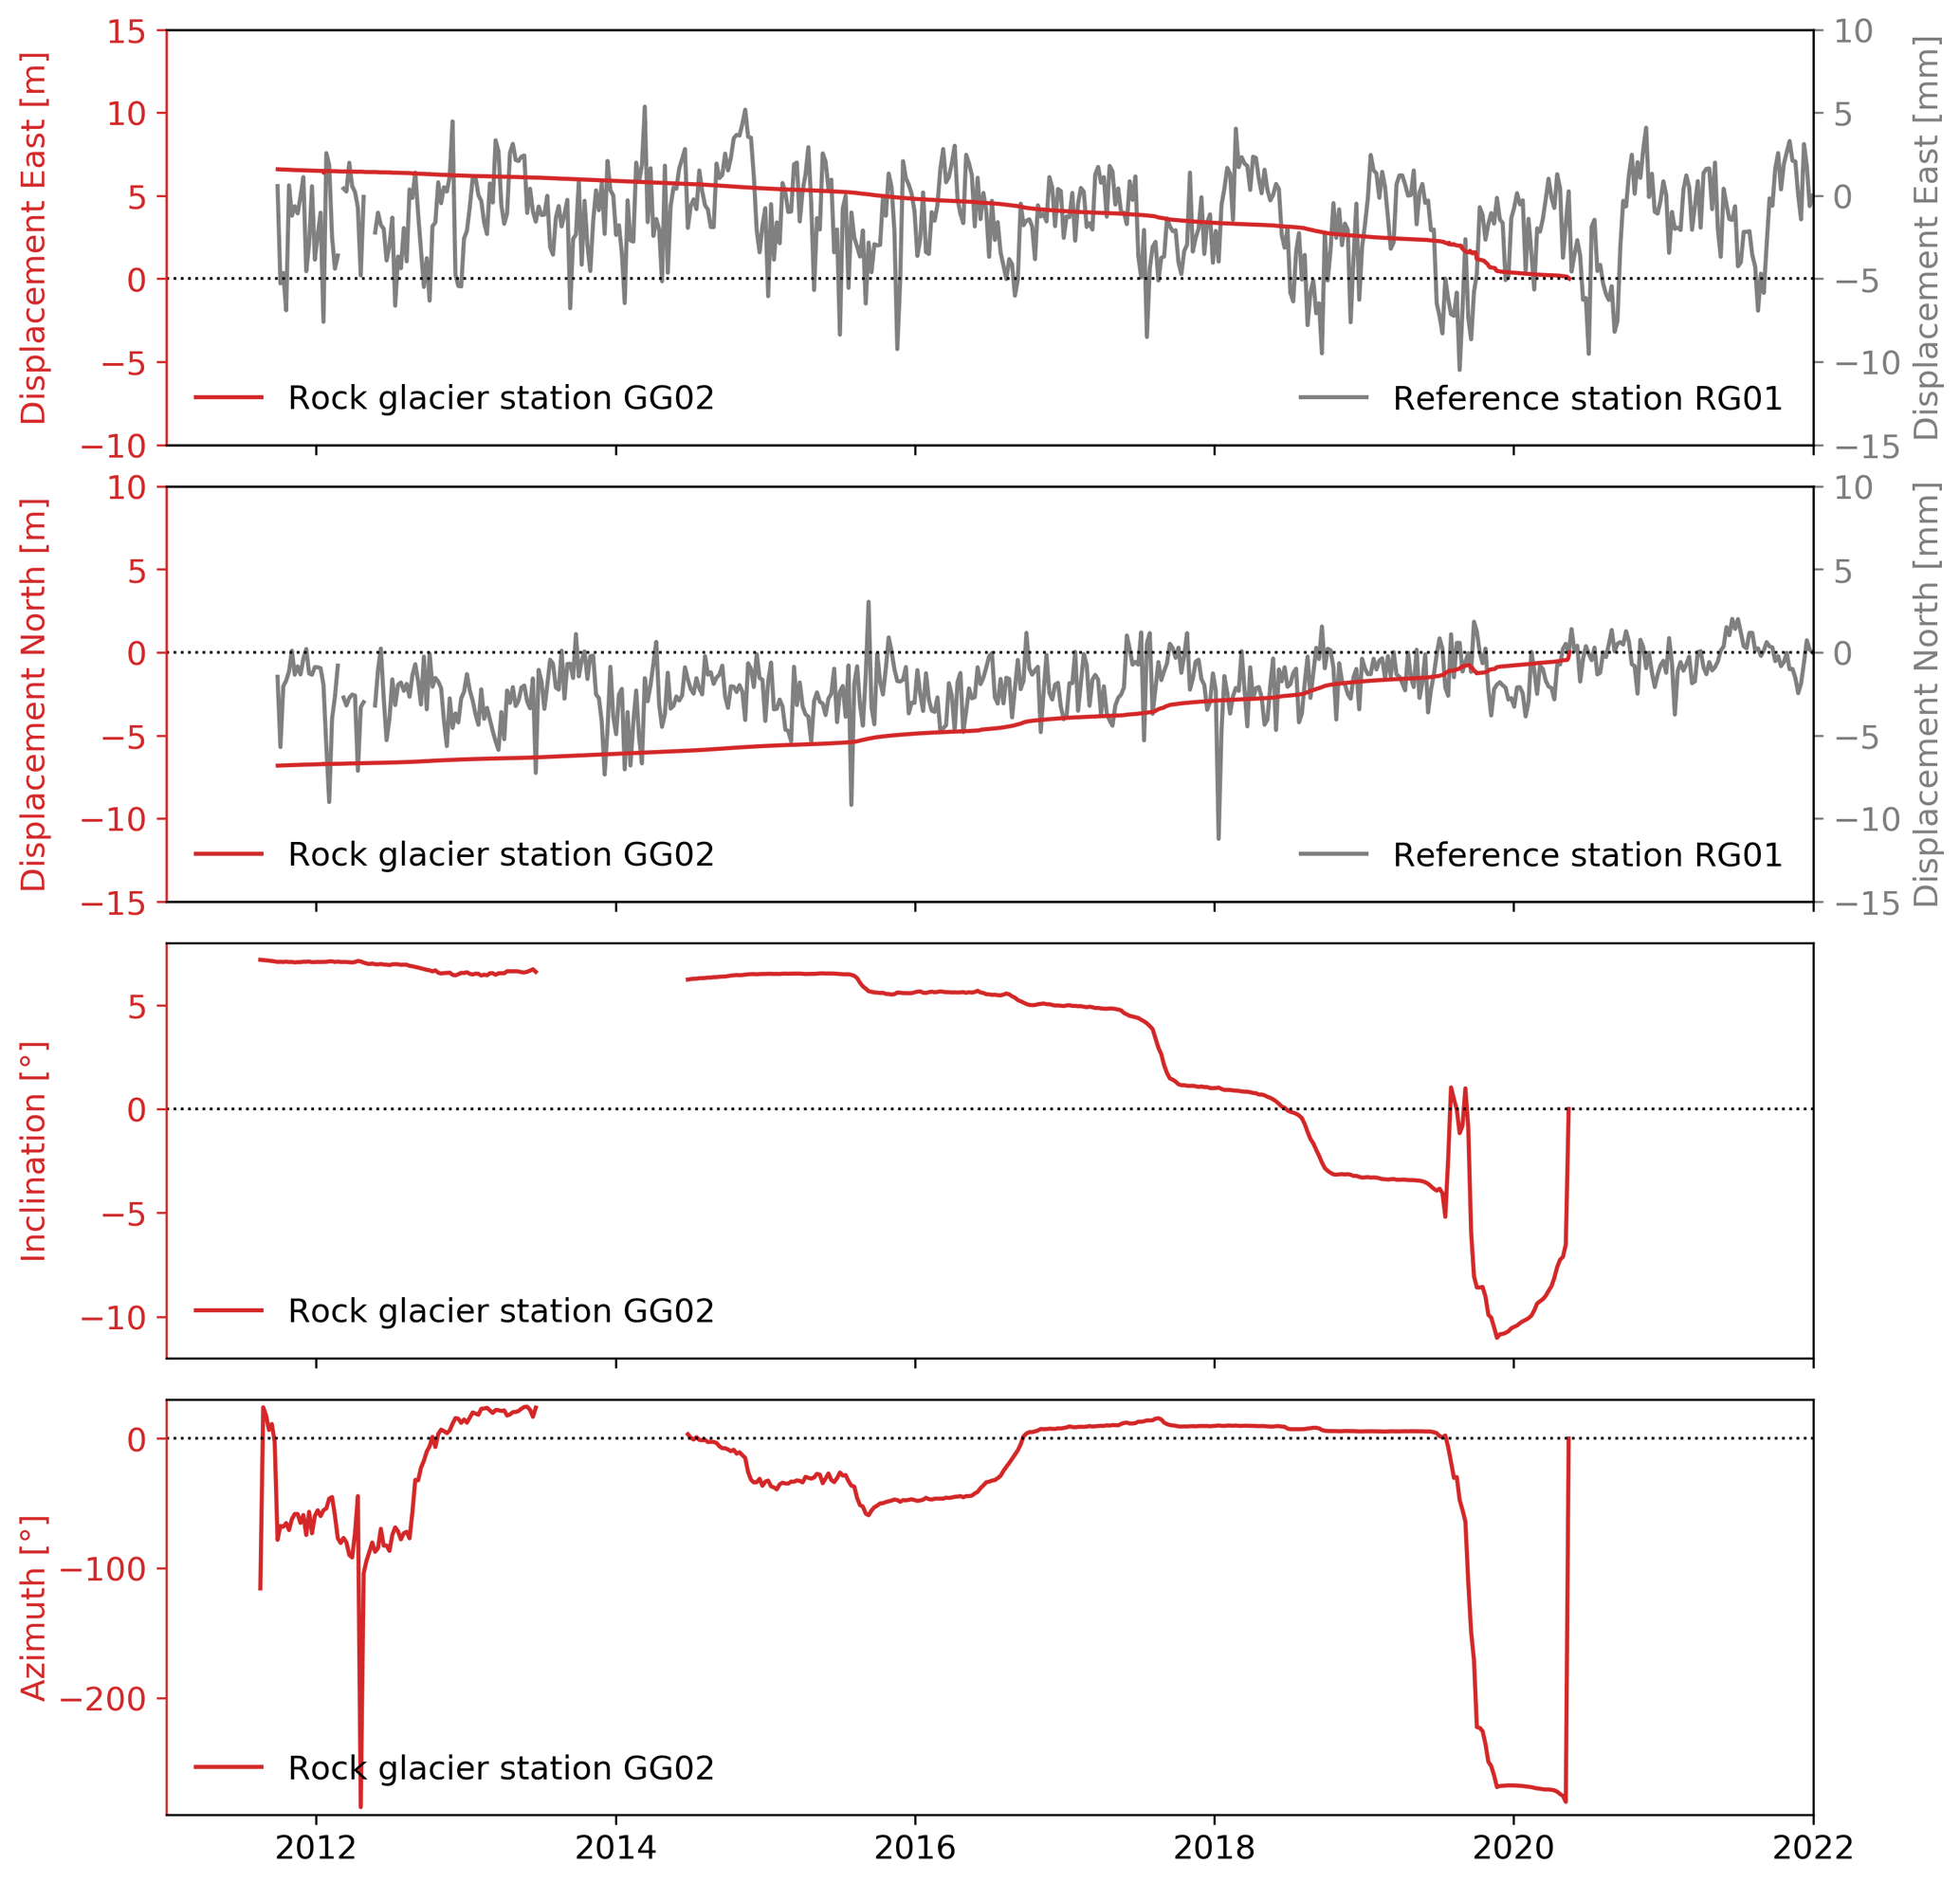
Figure B2A decade of displacement, inclination, and azimuth for the Grabengufer rock glacier (position GG02). In 2020, the boulder where the GNSS station was installed showed an anomalous behaviour and strong acceleration until falling into the gully. The data show this process until the last day.
The method devised in this initial project (Buchli et al., 2012; Wirz et al., 2013) has proven to be very successful and was thus expanded to other locations and applications of monitoring (Kenner et al., 2018; Cicoira et al., 2021) as well as natural hazard mitigation (Kenner et al., 2020) in collaboration with partners of PERMOS, the Swiss cantonal and federal authorities (Randa Grossgufer, Wisse Schijen, PERMOS GNSS sites) (Noetzli et al., 2019).
Codes for the management and processing of data associated with this paper are available at https://git.uibk.ac.at/informatik/neslab/public/permasense/permasense_datamgr (last access: 21 October 2022, Weber et al., 2022). It contains both a Python toolbox for downloading and processing primary as well as secondary data. The toolbox contains routines for the compilation, cleaning, aggregation, and validation of both primary as well as derived data products from the online PermaSense database at http://data.permasense.ch (last access: 21 October 2022) into a local file system. Specifically, the PermaSense data manager allows us to
-
query data from the PermaSense GSN server and save them locally as CSV files
-
load the locally store CSV files
-
filter according to reference values if available
-
clean data manually if needed
-
generate aggregates using an arithmetic mean (exceptions for weather data)
-
generate per-year CSV files for each position and data type
-
generate standard plots for all positions as an intuitive sanity check
-
query images from the PermaSense database server, convert to JPEG and save them locally.
A README.md with this software package explains its usage. In short, a suitable Python environment is required. Using anaconda, you can install the requirements by executing the following command:
conda env create -f condaEnvironment.yaml
conda activate permasense_datamgr
Individual positions can be enabled/disabled in the main Python file manage_GSNdata.py, the metadata for filtering and cleaning is contained in the folder ./metadata. Finally the tool is run by
python manage_GSNdata.py
By default, data are generated in the directory ./data.
A set of scripts automates the computation of static double-difference GNSS solutions using the open-source toolchain RTKLIB (http://www.rtklib.com, last access: 21 October 2022). The scripts are configurable for each baseline pair w.r.t. input data, configuration parameter, and the toolchain to be used. The configuration files and especially paths are set up specifically for processing and producing the PermaSense GNSS data contained in this dataset, but they can be adapted to other processing needs accordingly. This allows flexibility for individual processing needs for each position, should that be required. The scripts are designed to run on x86 Linux, but porting this to other platforms is straightforward.
D1 Prerequisites
In order to run these scripts, the following prerequisites must be installed:
-
RTKLIB processing scripts https://git.uibk.ac.at/informatik/neslab/public/permasense/rtklib_processing (last access: 21 October 2022, Beutel, 2022)
-
RTKLIB can be obtained from http://www.rtklib.com/ (last access: 21 October 2022) or alternatively https://github.com/rtklibexplorer/RTKLIB (last access: 21 October 2022)
-
RINEX file compression tools https://terras.gsi.go.jp/ja/crx2rnx.html (last access: 21 October 2022)
Some of the double-difference baselines are configured using reference positions from the Permanent GNSS network in Switzerland (AGNES) and therefore these observation data must be obtained directly from swisstopo as they are not contained in this dataset.
D2 Processing sequence and configuration setup
A single processing job always computes a single daily position for a given baseline pair. There are two kinds of configuration files that are required for each processing job: (i) a parameter file that specifies a baseline pair, data down-/upload location, starting dates, default directories, and (ii) tools to use for processing as well as a RTKLIB tool-configuration file. The script package first collects the necessary data from either the online server at http://data.permasense.ch (last access: 21 October 2022) from the IGS service or from a local file repository from disk and copies these files together with the necessary configuration files into a local temporary directory. If required, RINEX files are produced using the conv2bin tool from the RTKLIB toolchain. Thereafter, the post-processing tool rnx2rtkp is called, producing an output file with the coordinate data (see Table D1). Lastly, the coordinates are transformed from WGS84 to the Swiss national coordinate system by using the online REFRAME conversion service (REST API) by swisstopo.
The output format of the position data CSV files produced by RTKLIB is described in Table D1.

D3 Processing wrapper script syntax
The main processing wrapper script is responsible for downloading all required data, creating a local temporary computed space, executing the post-processing tool rnx2rtkp, uploading the resulting data to the PermaSense database, and archiving input and output data as well as cleaning up the temporary file space.
    compute_solution.sh -p
        [parameter_file] -d -b -r -c -f -u YYYY MM DD
    #     -d:   igs data download
    #     -b:   no data download and no conversion
                for the basestation
    #     -r:   no data download and no conversion
                for the roverstation
    #     -c:   no conversion
    #     -f:   use IGS final data product
    #     -u:   upload to GSN database
The supplement related to this article is available online at: https://doi.org/10.5194/essd-14-5061-2022-supplement.
JB, AC, and SW developed the concept and prepared the manuscript. JB, SG, AH, SW, BB, AB, MM, RL, TG, and RDF developed the sensor technology, the data-management architecture as well as the tools for managing the data. VW, SG, HR, and JB conceived the initial GNSS sensor deployments with the help of LT, TS, AV, and DVM that jointly had instrumental roles in launching and executing the initial X-Sense project. PL implemented the first GNSS post-processing prototype. JB, AV, SW, AC, AH, HR, LT, TS, RD, IGR, RM, JN, MP, EP, CS, and DVM contributed to the scaling and application of the technology to further field sites and applications, especially in the domain of long-term monitoring, natural hazard mitigation and early warning. All the authors contributed to the article and approved the submitted manuscript.
The contact author has declared that none of the authors has any competing interests.
Publisher’s note: Copernicus Publications remains neutral with regard to jurisdictional claims in published maps and institutional affiliations.
We are extremely grateful for the extraordinary local support that we received during our research activities in the Matter and Saas valleys, specifically from the municipalities of Zermatt (Romy Biner-Hauser), St. Niklaus (Gaby Fux), Herbriggen, Randa, Taesch (Klaus Tscherrig), and Saas Grund; the whole team of Air Zermatt (Gerold Biner); Kurt Lauber, Stephanie Mayor, Martin Lehner, Edith Lehner, and the Hörnlihütte team; Europahütte (Marcel Brantschen); Kinnhütte (Victor Imboden); Alpin Center Zermatt; Zermatter Bergbahnen (Kurt Guntli); Sprengtechnik-GFS (Willy Gitz and Angelo Gruber); Hotel Bahnhof, Zermatt (Fabi Lauber); and the local mountain guides (Hermann Biner, Robert Andenmatten, Willy Taugwalder, Urs Lerjen, Benedikt Perren, Bruno Jelk, Hannes Walser, Simon Anthamatten, Yann Dupertuis, and Anjan Truffer). Without this strong positive welcome, this work would not have been possible. We do not know what we would have done without our “home base” at Hotel Bergfreund in Herbriggen (CH). A big thank you to all generations of the Rosi and Rudi Allmendinger families for their generous support. Furthermore, we are thankful for technical support and consultancy from the Art of Technology (Rolf Schmid), Zurich, CH, as well as Swisstopo (Elmar Brockmann), Wabern, CH, and to the many friends and helpers who were involved in supporting the field work: Lucas Girard, Stephanie Gubler, Christoph Walser, Robert Kenner, Johann Müller, Jeff Moore, and Valentin Gischig. Finally, we acknowledge the two anonymous referees as well as Ken Mankoff and Inga Beck for handling the peer-review process and substantially improving the manuscript.
This research has been supported by funding from the Swiss National Science Foundation NCCR-MICS, the ETH Zurich Competence Center Environment and Sustainability (CCES), the Swiss Federal Office of the Environment (FOEN), nano-tera.ch (grant no. 530659), and the Swiss Permafrost Monitoring Network (PERMOS). Support in the form of equipment has been given by Hilti Schweiz AG, Arc’teryx, Petzl, and Beal. The technical workshops at ETHZ and UniZH as well as Art of Technology, Zurich, contributed to the successful development and implementation of various pieces of equipment.
This paper was edited by Inga Beck and Kenneth Mankoff and reviewed by two anonymous referees.
Aberer, K., Hauswirth, M., and Salehi, A.: A Middleware for Fast and Flexible Sensor Network Deployment, in: Proceedings of the 32nd International Conference on Very Large Data Bases, VLDB '06, VLDB Endowment, Seoul Korea, 12–15 September 2006, 1199–1202, https://dl.acm.org/doi/10.5555/1182635.1164243 (last access: 21 October 2022), 2006.
Arenson, L., Hoelzle, M., and Springman, S.: Borehole deformation measurements and internal structure of some rock glaciers in Switzerland, Permafrost and Periglac., 13, 117–135, https://doi.org/10.1002/ppp.414, 2002. a
Beutel, J.: Scripts to automatically process GNSS data from http://data.permasense.ch using RTKLIB: An Open Source Program Package for GNSS Positioning (1.0), Zenodo [code], https://doi.org/10.5281/zenodo.7251288, 2022. a, b
Beutel, J., Gruber, S., Hasler, A., Lim, R., Meier, A., Plessl, C., Talzi, I., Thiele, L., Tschudin, C., Woehrle, M., and Yuecel, M.: PermaDAQ: A scientific instrument for precision sensing and data recovery in environmental extremes, in: The 8th ACM/IEEE International Conference on Information Processing in Sensor Networks, San Francisco, CA, USA, 13–16 April 2009, 265–276, https://dl.acm.org/doi/10.5555/1602165.1602190 (last access: 21 October 2022), 2009. a
Beutel, J., Buchli, B., Ferrari, F., Keller, M., Thiele, L., and Zimmerling, M.: X-Sense: Sensing in Extreme Environments, in: Proceedings of Design, Automation and Test in Europe, Grenoble, France, 14–18 March 2011, 1460–1465, https://doi.org/10.1109/DATE.2011.5763236, 2011. a, b
Beutel, J., Biri, A., Buchli, B., Cicoira, A., Delaloye, R., Da Forno, R., Gaertner-Roer, I., Gruber, S., Gsell, T., Hasler, A., Lim, R., Limpach, P., Mayoraz, R., Meyer, M., Noetzli, J., Phillips, M., Pointner, E., Raetzo, H., Scapozza, C., Strozzi, T., Thiele, L., Vieli, A., Vonder Mühll, D., Weber, S., and Wirz, V.: Kinematic observations of the mountain cryosphere using in-situ GNSS instruments 2011–2021, PANGAEA [data set], https://doi.org/10.1594/PANGAEA.948334, 2022. a, b, c
Bu, J., Yu, K., Qian, N., Zuo, X., and Chang, J.: Performance Assessment of Positioning Based on Multi-Frequency Multi-GNSS Observations: Signal Quality, PPP and Baseline Solution, IEEE Access, 9, 5845–5861, https://doi.org/10.1109/ACCESS.2020.3048352, 2021. a
Buchli, B., Sutton, F., and Beutel, J.: GPS-equipped Wireless Sensor Network Node for High-accuracy Positioning Applications, Lecture Notes on Computer Science 7158. Proc. of 9th European Conference on Wireless Sensor Networks (EWSN 2012), Trento, Italy, 15–17 February 2012, https://link.springer.com/chapter/10.1007/978-3-642-28169-3_12 (last access: 31 October 2022), 2012. a, b, c, d, e
Burjánek, J., Gassner-Stamm, G., Poggi, V., Moore, J. R., and Fäh, D.: Ambient vibration analysis of an unstable mountain slope, Geophys. J. Int., 180, 820–828, https://doi.org/10.1111/j.1365-246X.2009.04451.x, 2010. a
Cicoira, A., Beutel, J., Faillettaz, J., Gärtner-Roer, I., and Vieli, A.: Resolving the influence of temperature forcing through heat conduction on rock glacier dynamics: a numerical modelling approach, The Cryosphere, 13, 927–942, https://doi.org/10.5194/tc-13-927-2019, 2019a. a, b, c, d
Cicoira, A., Beutel, J., Faillettaz, J., and Vieli, A.: Water controls the seasonal rhythm of rock glacier flow, Earth Planet. Sc. Lett., 528, 115844, https://doi.org/10.1016/j.epsl.2019.115844, 2019b. a, b
Cicoira, A., Marcer, M., Gärtner-Roer, I., Bodin, X., Arenson, L. U., and Vieli, A.: A general theory of rock glacier creep based on in-situ and remote sensing observations, Permafrost Periglac., 32, 139–153, https://doi.org/10.1002/ppp.2090, 2021. a, b, c, d, e, f
Dach, R., Lutz, S., Walser, P., and Fridez, P.: Bernese GNSS Software Version 5.2. User manual, Astronomical Institute, University of Bern, https://doi.org/10.7892/boris.72297, 2015. a
Delaloye, R., Lambiel, C., and Gärtner-Roer, I.: Overview of rock glacier kinematics research in the Swiss Alps, Geogr. Helv., 65, 135–145, https://doi.org/10.5194/gh-65-135-2010, 2010. a
Delaloye, R., Morard, S., Barboux, C., Abbet, D., Gruber, V., Riedo, M., and Gachet, S.: Rapidly moving rock glaciers in Mattertal, in: Mattertal – ein Tal in Bewegung, Publikation zur Jahrestagung der Schweizerischen Geomorphologischen Gesellschaft, Eidg. Forschungsanstalt WSL, Birmensdorf, CH, St. Niklaus, CH, 21–30, https://www.dora.lib4ri.ch/wsl/islandora/object/wsl:11268 (last access: 21 October 2022), 2013. a, b
Eberhardt, E., Stead, D., and Coggan, J.: Numerical analysis of initiation and progressive failure in natural rock slopes – The 1991 Randa rockslide, Int. J. Rock Mech. Min., 41, 69–87, https://doi.org/10.1016/S1365-1609(03)00076-5, 2004. a
Fäh, D., Moore, J., Burjanek, J., Iosifescu Enescu, I., Dalguer, L., Dupray, F., Michel, C., Woessner, J., Villiger, A., Laue, J., Marschall, I., Gischig, V., Loew, S., Alvarez, S., Balderer, W., Kästli, P., Giardini, D., Iosifescu Enescu, C. M., Hurni, L., Lestuzzi, P., Karbassi, A., Baumann, C., Geiger, A., Ferrari, A., Lalou, L., Clinton, J., and Deichmann, N.: Coupled seismogenic geohazards in alpine regions, B. Geofis. Teor. Appl., 53, 485–508, https://doi.org/10.4430/bgta0048, 2012. a
Ghirlanda, A., Braillard, L., Delaloye, R., Kummert, M., and Staub, B.: The complex pluri-decennial and multiphasic destabilization of the Jegi rock glacier (western Swiss Alps): historical development and ongoing crisis, in: XI. International Conference On Permafrost, Potsdam, Germany, 20–24 June 2016, 36–38, https://media.gfz-potsdam.de/bib/ICOP/ICOP_2016_Book_of_Abstracts.pdf (last access: 21 October 2022), 2016.
Girard, L., Beutel, J., Gruber, S., Hunziker, J., Lim, R., and Weber, S.: A custom acoustic emission monitoring system for harsh environments: Application to freezing-induced damage in alpine rock walls, Geosci. Instrum. Method. Data Syst., 1, 155–167, https://doi.org/10.5194/gi-1-155-2012, 2012. a
Gischig, S., Moore, J. R., Evans, K. F., Amann, F., and Loew, S.: Thermomechanical forcing of deep rock slope deformation: 2. The Randa rock slope instability, J. Geophys. Res.-Earth, 116, F04011, https://doi.org/10.1029/2011JF002007, 2011. a
Gischig, V., Amann, F., Moore, J., Loew, S., Eisenbeiss, H., and Stempfhuber, W.: Composite rock slope kinematics at the current Randa instability, Switzerland, based on remote sensing and numerical modeling, Eng. Geol., 118, 37–53, https://doi.org/10.1016/j.enggeo.2010.11.006, 2011. a
Guillemot, A., Baillet, L., Garambois, S., Bodin, X., Helmstetter, A., Mayoraz, R., and Larose, E.: Modal sensitivity of rock glaciers to elastic changes from spectral seismic noise monitoring and modeling, The Cryosphere, 15, 501–529, https://doi.org/10.5194/tc-15-501-2021, 2021. a
Haeberli, W.: Creep of mountain permafrost: Internal Structure and Flow of Alpine Rock Glaciers, PhD thesis, ETH Zurich, 1985. a
Haeberli, W.: On the morphodynamics of ice/debris-transport systems in cold mountain areas, Norsk Geogr. Tidsskr., 50, 3–9, https://doi.org/10.1080/00291959608552346, 1996. a
Haeberli, W. and Schmid, W.: Aerophotogrammetrical monitoring of rock glaciers, in: Proc. Fifth International Conference on Permafrost, International Permafrost Association, Trondheim, Norway, 2-5 August 1988, 764–769, https://www.worldcat.org/title/permafrost-fifth-international-conference-proceedings-august-2-5-1988/oclc/19795903 (last access: 21 October 2022), 1988. a
Haeberli, W. and Vonder Mühll, D.: On the characteristics and possible origins of ice in rock glacier permafrost, Z. Geomorphol., 104, 43–57, 1996. a
Haeberli, W., King, L., and Flotron, A.: Surface movement and lichen‐cover studies at the active rock glacier near the Grubengletscher, Wallis, Swiss Alps, Arctic Alpine Res., 11, 421–441, 1979. a
Hasler, A., Talzi, I., Beutel, J., Tschudin, C., and Gruber, S.: Wireless sensor networks in permafrost research: Concept, requirements, implementation, and challenges, in: Proceedings of the 9th International Conference on Permafrost, Fairbanks, Alaska, 29 June–3 July 2008, 669–674, 2008. a, b
Hasler, A., Gruber, S., and Haeberli, W.: Temperature variability and offset in steep alpine rock and ice faces, The Cryosphere, 5, 977–988, https://doi.org/10.5194/tc-5-977-2011, 2011. a, b
Hasler, A., Gruber, S., and Beutel, J.: Kinematics of steep bedrock permafrost, J. Geophys. Res., 117, F01016, https://doi.org/10.1029/2011JF001981, 2012. a, b
Henkel, P., Koch, F., Appel, F., Bach, H., Prasch, M., Schmid, L., Schweizer, J., and Mauser, W.: Snow Water Equivalent of Dry Snow Derived From GNSS Carrier Phases, IEEE T. Geosci. Remote, 56, 3561–3572, https://doi.org/10.1109/TGRS.2018.2802494, 2018. a
Hoelzle, M., Vonder Mühll, D., and Haeberli, W.: Thirty years of permafrost research in the Corvatsch‐Furtschellas area, Eastern Swiss Alps: A review, Norsk Geogr. Tidsskr., 56, 137–145, https://doi.org/10.1080/002919502760056468, 2002. a
Hurter, F., Geiger, A., Perler, D., and Rothacher, M.: GNSS water vapor monitoring in the Swiss Alps, in: 2012 IEEE International Geoscience and Remote Sensing Symposium, Munich, Germany, 22–27 July 2012, 1972–1975, https://doi.org/10.1109/IGARSS.2012.6351115, 2012. a
Kääb, A., Haeberli, W., and Gudmundsson, G. H.: Analysing the creep of mountain permafrost using high precision aerial photogrammetry: 25 years of monitoring Gruben rock glacier, Swiss Alps, Permafrost Periglac., 8, 409–426, https://doi.org/10.1002/(SICI)1099-1530(199710/12)8:4<409::AID-PPP267>3.0.CO;2-C, 1997. a
Kääb, A., Gudmundsson, G. H., and Hoelzle, M.: Surface deformation of creeping mountain permafrost. Photogrammetric investigations on Murtel Rock Glacier, Swiss Alps, in: Proc. Seventh International Conference on Permafrost, International Permafrost Association, Yellowknife, Northwest Territories, Canada, 23–27 June 1998, 531–537, https://www.uspermafrost.org/assets/docs/Publications/Proceedings/07th International Conference on Permafrost - Program, Abstracts, Reports of Perm Assoc June 23-27 1998.pdf (last access: 21 October 2022), 1998. a
Kenner, R., Phillips, M., Beutel, J., Hiller, M., Limpach, P., Pointner, E., and Volken, M.: Factors Controlling Velocity Variations at Short-Term, Seasonal and Multiyear Time Scales, Ritigraben Rock Glacier, Western Swiss Alps, Permafrost Periglac., 28, 675–684, https://doi.org/10.1002/ppp.1953, 2017. a, b
Kenner, R., Phillips, M., Limpach, P., Beutel, J., and Hiller, M.: Monitoring mass movements using georeferenced time-lapse photography: Ritigraben rock glacier, western Swiss Alps, Cold Reg. Sci. Technol., 145, 127–134, https://doi.org/10.1016/j.coldregions.2017.10.018, 2018. a, b, c
Kenner, R., Pruessner, L., Beutel, J., Limpach, P., and Phillips, M.: How rock glacier hydrology, deformation velocities and ground temperatures interact: Examples from the Swiss Alps, Permafrost Periglac., 31, 3–14, https://doi.org/10.1002/ppp.2023, 2020. a, b
Kummert, M. and Delaloye, R.: Mapping and quantifying sediment transfer between the front of rapidly moving rock glaciers and torrential gullies, Geomorphology, 309, 60–76, https://doi.org/10.1016/j.geomorph.2018.02.021, 2018. a
Kummert, M., Delaloye, R., and Braillard, L.: Erosion and sediment transfer processes at the front of rapidly moving rock glaciers: Systematic observations with automatic cameras in the western Swiss Alps, Permafrost Periglac., 29, 21–33, https://doi.org/10.1002/ppp.1960, 2018a. a
Kummert, M., Delaloye, R., and Braillard, L.: Erosion and sediment transfer processes at the front of rapidly moving rock glaciers: Systematic observations with automatic cameras in the western Swiss Alps, Permafrost Periglac., 29, 21–33, https://doi.org/10.1002/ppp.1960, 2018b. a
Leinauer, J., Weber, S., Cicoira, A., Beutel, J., and Krautblatter, M.: Prospective forecasting of rock slope failure time, Commun. Earth. Environ., in review, 2022. a
Moore, J., Gischig, V., Burjánek, J., Loew, S., and Fäh, D.: Site effects in unstable rock slopes: Dynamic behavior of the Randa instability (Switzerland), Bull. Seism. Soc. Am., 101, 3110–3116, https://doi.org/10.1785/0120110127, 2011. a
Noetzli, J., Pellet, C., and Staub, B. (Eds.): PERMOS 2019. Permafrost in Switzerland 2014/2015 to 2017/2018, Glaciological Report (Permafrost) No. 16-19 of the Cryospheric Commission of the Swiss Academy of Sciences (SCNAT), https://doi.org/10.13093/permos-rep-2019-16-19, 2019. a, b, c
Oggier, N., Graf, C., Delaloye, R., and Burkard, A.: Integral protection concept “Bielzug” – Integrales Schutzkonzept Bielzug, in: Proc. INTERPRAEVENT, Lucerne, Switzerland, 30 May–2 June 2016, 525–534, https://interpraevent2016.ch/wp-content/uploads/2019/03/IP16_CP_digital.pdf (last access: 31 October 2022), 2016. a
Paziewski, J., Fortunato, M., Mazzoni, A., and Odolinski, R.: An analysis of multi-GNSS observations tracked by recent Android smartphones and smartphone-only relative positioning results, Measurement, 175, 109162, https://doi.org/10.1016/j.measurement.2021.109162, 2021. a
Ravanel, L. and Deline, P.: Rockfall hazard in the Mont Blanc massif increased by the current atmospheric warming, in: IAEG 12th Congress, edited by: Lollino, G., Manconi, A., Clague, J., Shan, W., and Chiarle, M., Climate Change and Engineering Geology, Torino, Italy, 425–428, https://hal-sde.archives-ouvertes.fr/hal-01896005 (last access: 21 October 2022), 2014. a
Scapozza, C., Lambiel, C., Bozzini, C., Mari, S., and Conedera, M.: Assessing the rock glacier kinematics on three different timescales: a case study from the southern Swiss Alps, Earth Surf. Proc. Land., 39, 2056–2069, https://doi.org/10.1002/esp.3599, 2014. a
Strozzi, T., Caduff, R., Jones, N., Barboux, C., Delaloye, R., Bodin, X., Kääb, A., Mätzler, E., and Schrott, L.: Monitoring Rock Glacier Kinematics with Satellite Synthetic Aperture Radar, Remote Sens., 12, 559, https://doi.org/10.3390/rs12030559, 2020. a
Talzi, I., Hasler, A., Gruber, S., and Tschudin, C.: PermaSense: Investigating Permafrost with a WSN in the Swiss Alps, in: Proceedings of the 4th Workshop on Embedded Networked Sensors, EmNets '07, ACM, New York, NY, USA, June 2007, 8–12, https://doi.org/10.1145/1278972.1278974, 2007. a
Teunissen, P. J. and Montenbruck, O. (Eds.): Handbook of Global Navigation Satellite Systems, 1st edn., Springer International Publishing, Hardcover ISBN 978-3-030-73172-4, eBook ISBN 978-3-319-42928-1, https://doi.org/10.1007/978-3-319-42928-1, 2017. a, b
Vonder Mühll, D. and Haeberli, W.: Thermal Characteristics of the Permafrost within an Active Rock Glacier (Murtèl/Corvatsch, Grisons, Swiss Alps), J. Glaciol., 36, 151–158, https://doi.org/10.3189/S0022143000009382, 1990. a
Weber, S., Beutel, J., Faillettaz, J., Hasler, A., Krautblatter, M., and Vieli, A.: Quantifying irreversible movement in steep, fractured bedrock permafrost on Matterhorn (CH), The Cryosphere, 11, 567–583, https://doi.org/10.5194/tc-11-567-2017, 2017. a
Weber, S., Beutel, J., Gruber, S., Gsell, T., Hasler, A., and Vieli, A.: Rock-temperature, fracture displacement and acoustic/micro-seismic data measured at Matterhorn Hörnligrat, Switzerland, Zenodo [data set], https://doi.org/10.5281/zenodo.1163037, 2018a.
Weber, S., Fäh, D., Beutel, J., Faillettaz, J., Gruber, S., and Vieli, A.: Ambient seismic vibrations in steep bedrock permafrost used to infer variations of ice-fill in fractures, Earth Planet. Sc. Lett., 501, 119–127, https://doi.org/10.1016/j.epsl.2018.08.042, 2018b. a
Weber, S., Faillettaz, J., Meyer, M., Beutel, J., and Vieli, A.: Acoustic and micro-seismic characterization in steep bedrock permafrost on Matterhorn (CH), J. Geophys. Res.-Earth, 123, 1363–1385, https://doi.org/10.1029/2018JF004615, 2018c. a
Weber, S., Beutel, J., Da Forno, R., Geiger, A., Gruber, S., Gsell, T., Hasler, A., Keller, M., Lim, R., Limpach, P., Meyer, M., Talzi, I., Thiele, L., Tschudin, C., Vieli, A., Vonder Mühll, D., and Yücel, M.: A decade of detailed observations (2008–2018) in steep bedrock permafrost at the Matterhorn Hörnligrat (Zermatt, CH), Earth Syst. Sci. Data, 11, 1203–1237, https://doi.org/10.5194/essd-11-1203-2019, 2019a (data available at: https://doi.org/10.1594/PANGAEA.897640). a, b, c, d, e, f
Weber, S., Beutel, J., and Meyer, M.: Code for PermaSense GSN data management, Zenodo [code], https://doi.org/10.5281/zenodo.2542715, 2019b. a, b
Weber, S., Beutel, J., and Meyer, M.: Code for management and processing of PermaSense data (3.1), Zenodo [code], https://doi.org/10.5281/zenodo.7251255, 2022. a, b, c, d
Willenberg, H., Evans, K. F., Eberhardt, E., Spillmann, T., and Loew, S.: Internal structure and deformation of an unstable crystalline rock mass above Randa (Switzerland): Part II – Three-dimensional deformation patterns, Eng. Geol., 101, 15–32, https://doi.org/10.1016/j.enggeo.2008.01.016, 2008a. a
Willenberg, H., Loew, S., Eberhardt, E., Evans, K. F., Spillmann, T., Heincke, B., Maurer, H., and Green, A. G.: Internal structure and deformation of an unstable crystalline rock mass above Randa (Switzerland): Part I – Internal structure from integrated geological and geophysical investigations, Eng. Geol., 101, 1–14, https://doi.org/10.1016/j.enggeo.2008.01.015, 2008b. a
Wirz, V., Beutel, J., Buchli, B., Gruber, S., and Limpach, P.: Temporal Characteristics of Different Cryosphere-Related Slope Movements in High Mountains, edited by: Margottini, C., Canuti, P., and Sassa, K., Springer, Berlin, Heidelberg, 383–390, ISBN 978-3-642-31336-3, eBook ISBN 978-3-642-31337-0, https://doi.org/10.1007/978-3-642-31337-0_49, 2013. a, b, c, d, e, f, g, h, i
Wirz, V., Beutel, J., Gruber, S., Gubler, S., and Purves, R. S.: Estimating velocity from noisy GPS data for investigating the temporal variability of slope movements, Nat. Hazards Earth Syst. Sci., 14, 2503–2520, https://doi.org/10.5194/nhess-14-2503-2014, 2014a. a, b
Wirz, V., Geertsema, M., Gruber, S., and Purves, R. S.: Temporal variability of diverse mountain permafrost slope movements derived from multi-year daily GPS data, Mattertal, Switzerland, Landslides, 13, 67–83, https://doi.org/10.1007/s10346-014-0544-3, 2014b. a, b, c, d
World Meteorological Organization (WMO): The 2022 GCOS ECVs Requirements, https://library.wmo.int/doc_num.php?explnum_id=11318, last access: 1 November 2022.
- Abstract
- GNSS monitoring in high mountain environments
- Instrumentation technology and data management
- Field sites
- Primary data products
- Derived data products: GNSS processing, cleaning, and aggregation
- Validation and uncertainty of data products
- Code and data availability
- Conclusions and outlook
- Appendix A: Detailed description of the field sites
- Appendix B: Project context and history
- Appendix C: PermaSense data manager
- Appendix D: GNSS processing using the open-source RTKLIB
- Author contributions
- Competing interests
- Disclaimer
- Acknowledgements
- Financial support
- Review statement
- References
- Supplement