the Creative Commons Attribution 4.0 License.
the Creative Commons Attribution 4.0 License.
 | 11 Nov 2022
SiDroForest: a comprehensive forest inventory of Siberian boreal forest investigations including drone-based point clouds, individually labeled trees, synthetically generated tree crowns, and Sentinel-2 labeled image patches
Femke van Geffen
Birgit Heim
Frederic Brieger
Rongwei Geng
Iuliia A. Shevtsova
Luise Schulte
Simone M. Stuenzi
Nadine Bernhardt
Elena I. Troeva
Luidmila A. Pestryakova
Evgenii S. Zakharov
Bringfried Pflug
Ulrike Herzschuh
The SiDroForest (Siberian drone-mapped forest inventory) data collection is an attempt to remedy the scarcity of forest structure data in the circumboreal region by providing adjusted and labeled tree-level and vegetation plot-level data for machine learning and upscaling purposes. We present datasets of vegetation composition and tree and plot level forest structure for two important vegetation transition zones in Siberia, Russia; the summergreen–evergreen transition zone in Central Yakutia and the tundra–taiga transition zone in Chukotka (NE Siberia). The SiDroForest data collection consists of four datasets that contain different complementary data types that together support in-depth analyses from different perspectives of Siberian Forest plot data for multi-purpose applications.
- i.
Dataset 1 provides unmanned aerial vehicle (UAV)-borne data products covering the vegetation plots surveyed during fieldwork (Kruse et al., 2021, https://doi.org/10.1594/PANGAEA.933263). The dataset includes structure-from-motion (SfM) point clouds and red–green–blue (RGB) and red–green–near-infrared (RGN) orthomosaics. From the orthomosaics, point-cloud products were created such as the digital elevation model (DEM), canopy height model (CHM), digital surface model (DSM) and the digital terrain model (DTM). The point-cloud products provide information on the three-dimensional (3D) structure of the forest at each plot.
- ii.
Dataset 2 contains spatial data in the form of point and polygon shapefiles of 872 individually labeled trees and shrubs that were recorded during fieldwork at the same vegetation plots (van Geffen et al., 2021c, https://doi.org/10.1594/PANGAEA.932821). The dataset contains information on tree height, crown diameter, and species type. These tree and shrub individually labeled point and polygon shapefiles were generated on top of the RGB UVA orthoimages. The individual tree information collected during the expedition such as tree height, crown diameter, and vitality are provided in table format. This dataset can be used to link individual information on trees to the location of the specific tree in the SfM point clouds, providing for example, opportunity to validate the extracted tree height from the first dataset. The dataset provides unique insights into the current state of individual trees and shrubs and allows for monitoring the effects of climate change on these individuals in the future.
- iii.
Dataset 3 contains a synthesis of 10 000 generated images and masks that have the tree crowns of two species of larch (Larix gmelinii and Larix cajanderi) automatically extracted from the RGB UAV images in the common objects in context (COCO) format (van Geffen et al., 2021a, https://doi.org/10.1594/PANGAEA.932795). As machine-learning algorithms need a large dataset to train on, the synthetic dataset was specifically created to be used for machine-learning algorithms to detect Siberian larch species.
- iv.
Dataset 4 contains Sentinel-2 (S-2) Level-2 bottom-of-atmosphere processed labeled image patches with seasonal information and annotated vegetation categories covering the vegetation plots (van Geffen et al., 2021b, https://doi.org/10.1594/PANGAEA.933268). The dataset is created with the aim of providing a small ready-to-use validation and training dataset to be used in various vegetation-related machine-learning tasks. It enhances the data collection as it allows classification of a larger area with the provided vegetation classes.
The SiDroForest data collection serves a variety of user communities. The detailed vegetation cover and structure information in the first two datasets are of use for ecological applications, on one hand for summergreen and evergreen needle-leaf forests and also for tundra–taiga ecotones. Datasets 1 and 2 further support the generation and validation of land cover remote-sensing products in radar and optical remote sensing. In addition to providing information on forest structure and vegetation composition of the vegetation plots, the third and fourth datasets are prepared as training and validation data for machine-learning purposes. For example, the synthetic tree-crown dataset is generated from the raw UAV images and optimized to be used in neural networks. Furthermore, the fourth SiDroForest dataset contains S-2 labeled image patches processed to a high standard that provide training data on vegetation class categories for machine-learning classification with JavaScript Object Notation (JSON) labels provided. The SiDroForest data collection adds unique insights into remote hard-to-reach circumboreal forest regions.
- Article
(23146 KB) - Full-text XML
- BibTeX
- EndNote


Circumpolar boreal forests represent close to 30 % of all forested areas and are changing in response to climate, with potentially important feedback mechanisms to regional and global climate through altered carbon cycles and albedo dynamics (e.g., Loranty et al., 2018). These forests are located primarily in Alaska, Canada, and Russia. Forest structure is a crucial component in the assessment of whether a forest is likely to act as a carbon sink or source under changing climate (e.g., Schepaschenko et al., 2021). Publicly available comprehensive datasets on forest structure are rare, due to the involvement of governmental agencies, public sectors, and private actors who all influence the availability of these datasets. That said, the Arctic–Boreal Vulnerability Experiment (ABoVE) run by the NASA Terrestrial Ecology Program provides open-source data collections from boreal and arctic regions in Alaska and Canada (ABoVE Science Definition Team, 2014). Globally, the Forest Observation System (FOS, http://forest-observation-system.net/, last access: 20 July 2021) provides publicly available forest data for Earth Observation (validation and algorithm development) such as described in Chave et al. (2019) and a global aboveground biomass (AGB) database (Schepaschenko et al., 2019) containing a high number of plot level datasets from the boreal forest domain. Schepaschenko et al. (2017) used inventories from the old Soviet Forest Inventory and Planning System (FIPS) and the new Russian National Forest Inventory (NFI) to compile and publish a highly comprehensive forest AGB data collection at plot level, specifically for Eurasia. These data collections (Schepaschenko et al., 2017) and FOS (Schepaschenko et al., 2019) both distribute aggregated plot level information.
However, there is still a lack of usable data for satellite and unmanned aerial vehicle (UAV) imagery classification tasks for the boreal zone as a whole. Additionally, there is a lack of usable training data for automatic needle-leaf tree-crown detection. The central and eastern Siberian boreal zones with their forest types are especially underserved as there are no open-source UAV forest data available. Furthermore, for the circumboreal, still, few data are publicly available at tree or plot levels that are ready to use for machine-learning applications in the field of remote sensing, e.g., optimized data containing annotated vegetation categories.
The SiDroForest (Siberian drone-mapped forest inventory) data collection provides open-source forest structure data at tree, plot, and upscaling levels for boreal forests in central and northeastern Siberia, Russia. At individual tree level, the data consist of conventional forest inventory data such as tree height, tree-crown diameter, and species labels. The individual tree-level data labeling per plot provides opportunities for further machine-learning applications in the form of validation data. At plot level, the data collection contains UAV structure-from-motion (SfM) point clouds, georeferenced orthoimages and products derived from point clouds providing structural forest information. On top of these state-of-the art forest inventory data and SiDroForest UAV products that are enriched by labeling, we prepared two datasets that can be directly used for machine learning in remote-sensing applications. One dataset is a synthetically generated image dataset on tree crowns in the common objects in context (COCO) format (Lin et al., 2014) that we constructed from selected red–green–blue (RGB) UAV imagery from plot data. The other dataset fit for machine learning contains labeled Sentinel-2 (S-2) image patches covering the vegetation plots related to the vegetation composition. These labeled S-2 image patches can, e.g., be used for machine-learning training for a boreal forest land cover classification using S-2 satellite images. In its current stage, the SiDroForest S-2 data collection is not published with performance testing, and we do not consider it as a benchmark dataset for remote-sensing image interpretation (e.g., as defined in Long et al., 2020). The SiDroForest-labeled collection of S-2 image patches is available as a small training and validation dataset so far providing underrepresented vegetation categories, that will save future users time when attempting to classify vegetation cover.
By making SiDroForest public, we aim to remedy public data scarcity on UAV data of boreal forest plots, on tree-level forest data, and specifically for annotated data for the boreal forests in central and northeastern Siberia, and encourage the use of the data presented here for further analyses and machine-learning tasks.
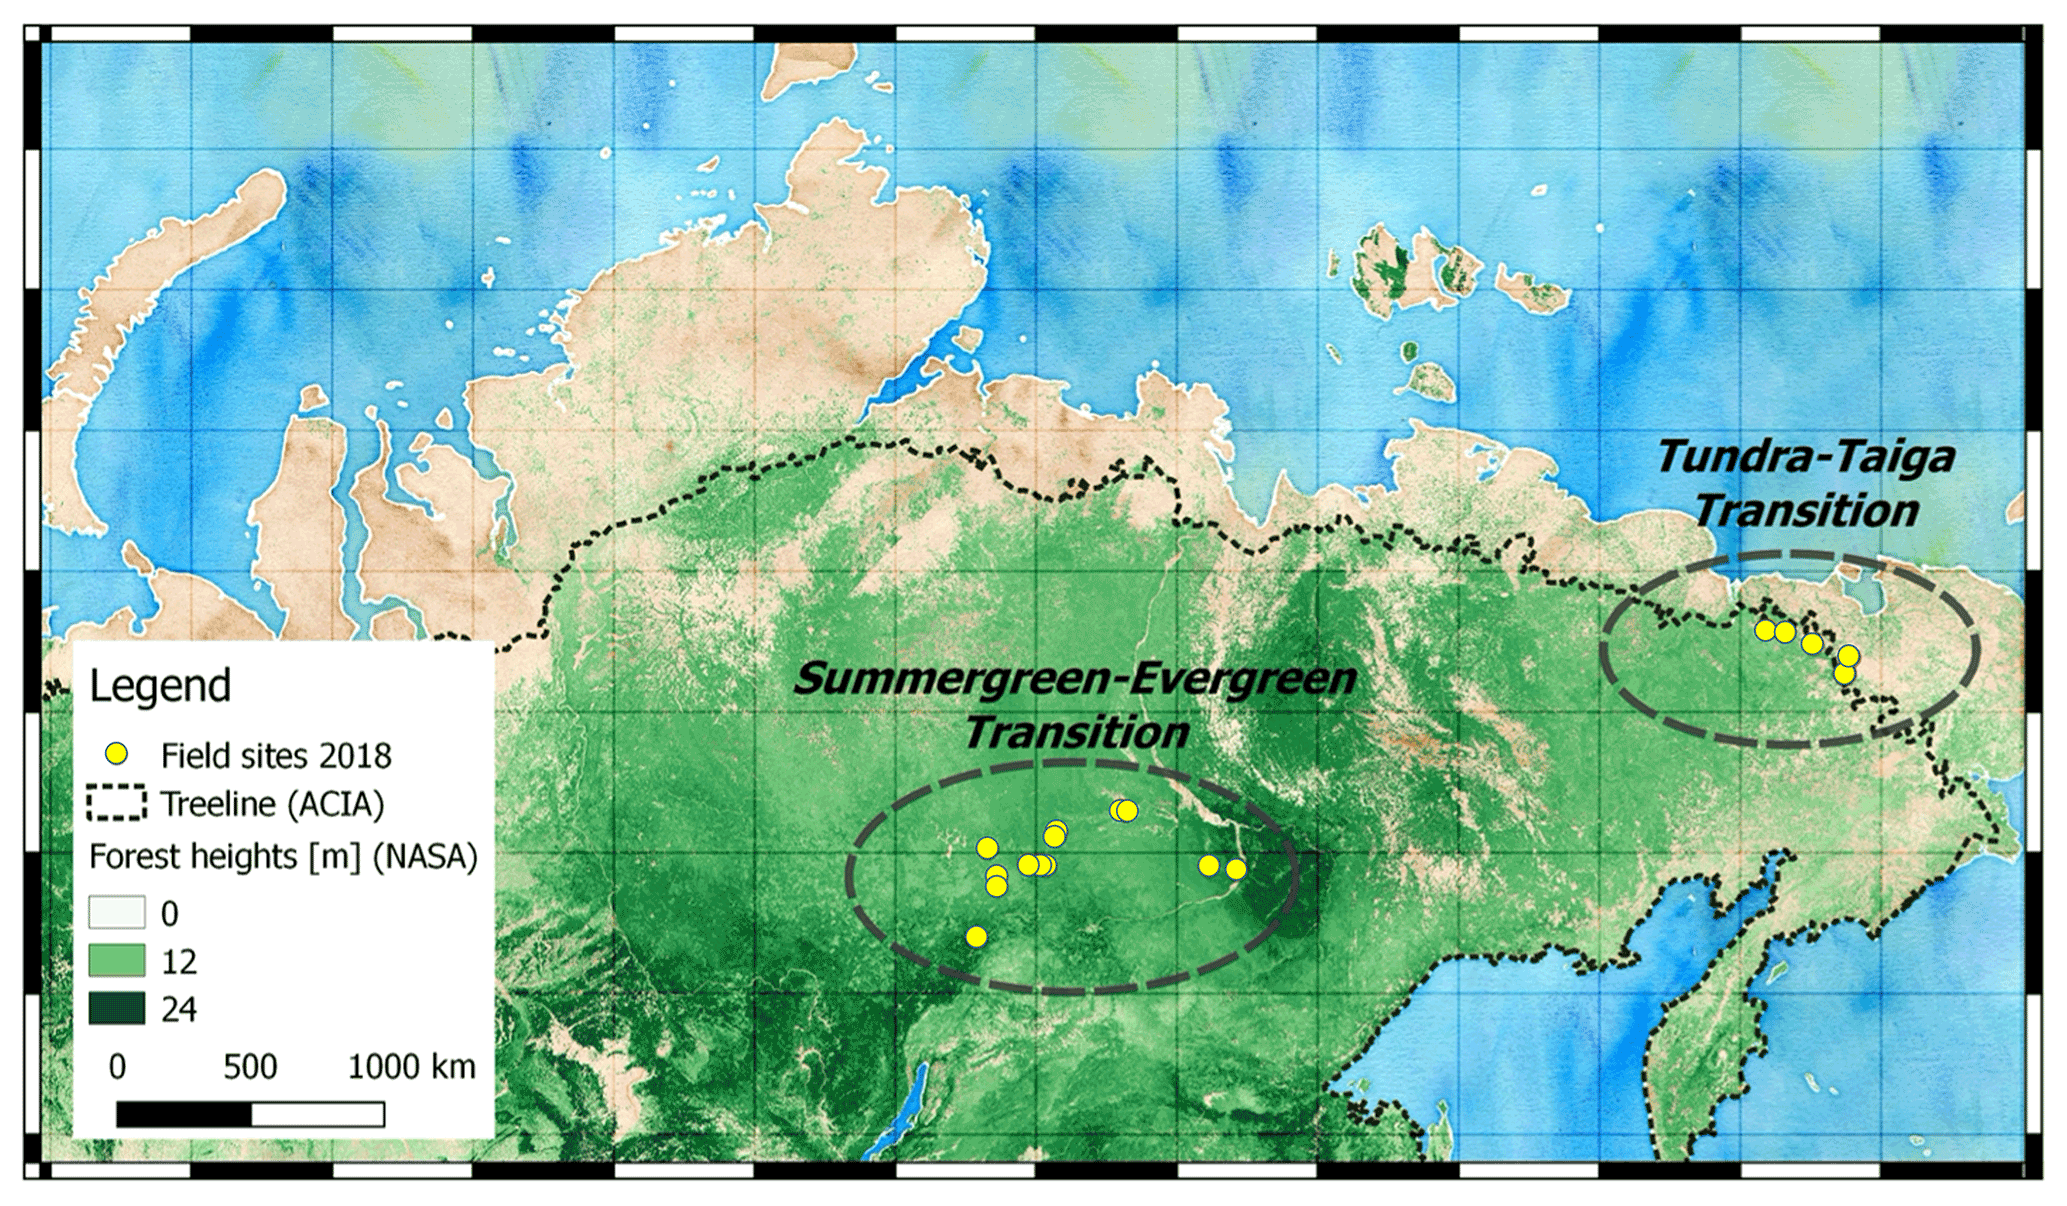
Figure 1Overview of the Siberian transition zones: the tundra–taiga transition in Chukotka and the summergreen–evergreen transition in central Yakutia that were covered by the 2018 Chukotka expedition (yellow points represent 2018 field sites with vegetation plots). The overview map (background © OpenStreetMap contributors 2022. Distributed under the Open Data Commons Open Database License (ODbL) v1.0) shows forest coverage by green color-coded NASA forest height (Simard et al., 2011) and the northern treeline (CAVM Team 2003, for Arctic Climate Impact Assessment, ACIA).
Study region
The data collection we provide contains tree level, plot level, and upscaling level forest structure data from important boreal transition zones located in central and northeastern Siberia that are specifically vulnerable to climate change: these are the tundra–taiga (in Chukotka) and the summergreen–evergreen (in central Yakutia) transition zones (Fig. 1).
The tundra–taiga transition zone occurs where boreal forests reach their maximum northward position and form a treeline ecotone (MacDonald et al., 2007). Here, the transition from open forest stands with decreasing stand densities towards treeless tundra in the north takes place. A warming climate drives the transition from tundra in the tundra–taiga transition zone to open taiga forests (Rees et al., 2020). During the snow-covered season, the taiga has a lower albedo than tundra due to the trees that emerge above the snow. A change from tundra to taiga albedo can result in a positive feedback loop of vegetation change which, in combination with the warming climate, may lead to dramatic environmental changes in the Arctic (Bonan, 2008). Remote-sensing data have been previously used to assess vegetation dynamics in Chukotka. Through vegetation monitoring using Landsat satellite data, Shevtsova et al. (2021) report that shrubification has expanded by 20 % in area in the tundra–taiga zone and by 40 % in the northern taiga as well as tree infilling occurring in the northern taiga. Extensive satellite remote-sensing work was done by Montesano et al. to assess the vegetation dynamics in Siberia using LiDAR and synthetic aperture radar data (2014) and Landsat satellite data (2016). To be able to expand on these satellite-derived remote-sensing findings, in-depth monitoring at a vegetation plot level in this region is important. Clear overviews of species distribution over the varying types of land cover are useful to study the impacts of climate change on the eastern Siberian treeline that is not studied well enough yet, in part due to sparse data being available for the region (Shevtsova et al., 2021). Our open-access data collection will considerably improve insights into the tundra–taiga transition zone.
The second relevant forest transition zone included in the SiDroForest data collection is the summergreen–evergreen transition zone in central Yakutia. Summergreen needle-leaf tree species covered in the SiDroForest data collection consist of two species of larch trees: Larix gmelinii and Larix cajanderi. The evergreen species present are pine and spruce: Pinus sibirica, Pinus sylvestris, and Picea obovata. In forests, the light-demanding summergreen Larix trees are outcompeted by evergreen tree taxa (Troeva et al., 2010). Yet, it is an open question as to how Larix forests, once established, hinder their replacement by evergreen forests and thus maintain a vegetation–climate equilibrium (Mamet et al., 2019). This self-stabilization that takes place in the Larix-dominated forests in central and eastern Siberia most likely results from a combination of unique climate drivers for the region, such as vegetation, climate, fire, and permafrost (Simard et al., 2011). Datasets such as the one presented here are a snapshot of the current state that can be used to monitor individual trees over time to gain insight into the vegetation dynamics of the region.
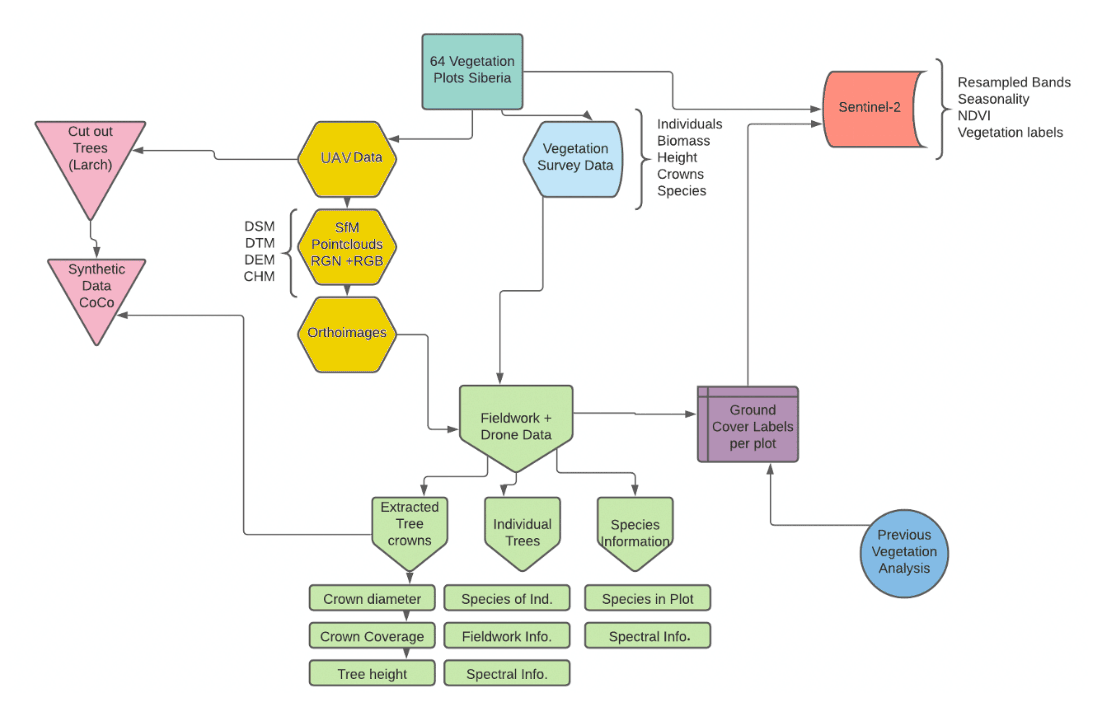
Figure 2Overview of the four datasets all related to the 2018 expedition plots (UAV-derived products, individually labeled shapefiles, synthetically created Siberian larch tree-crown dataset, Sentinel-2 labeled image patches) and their content and interconnections in SiDroForest (see text for details on the labels).
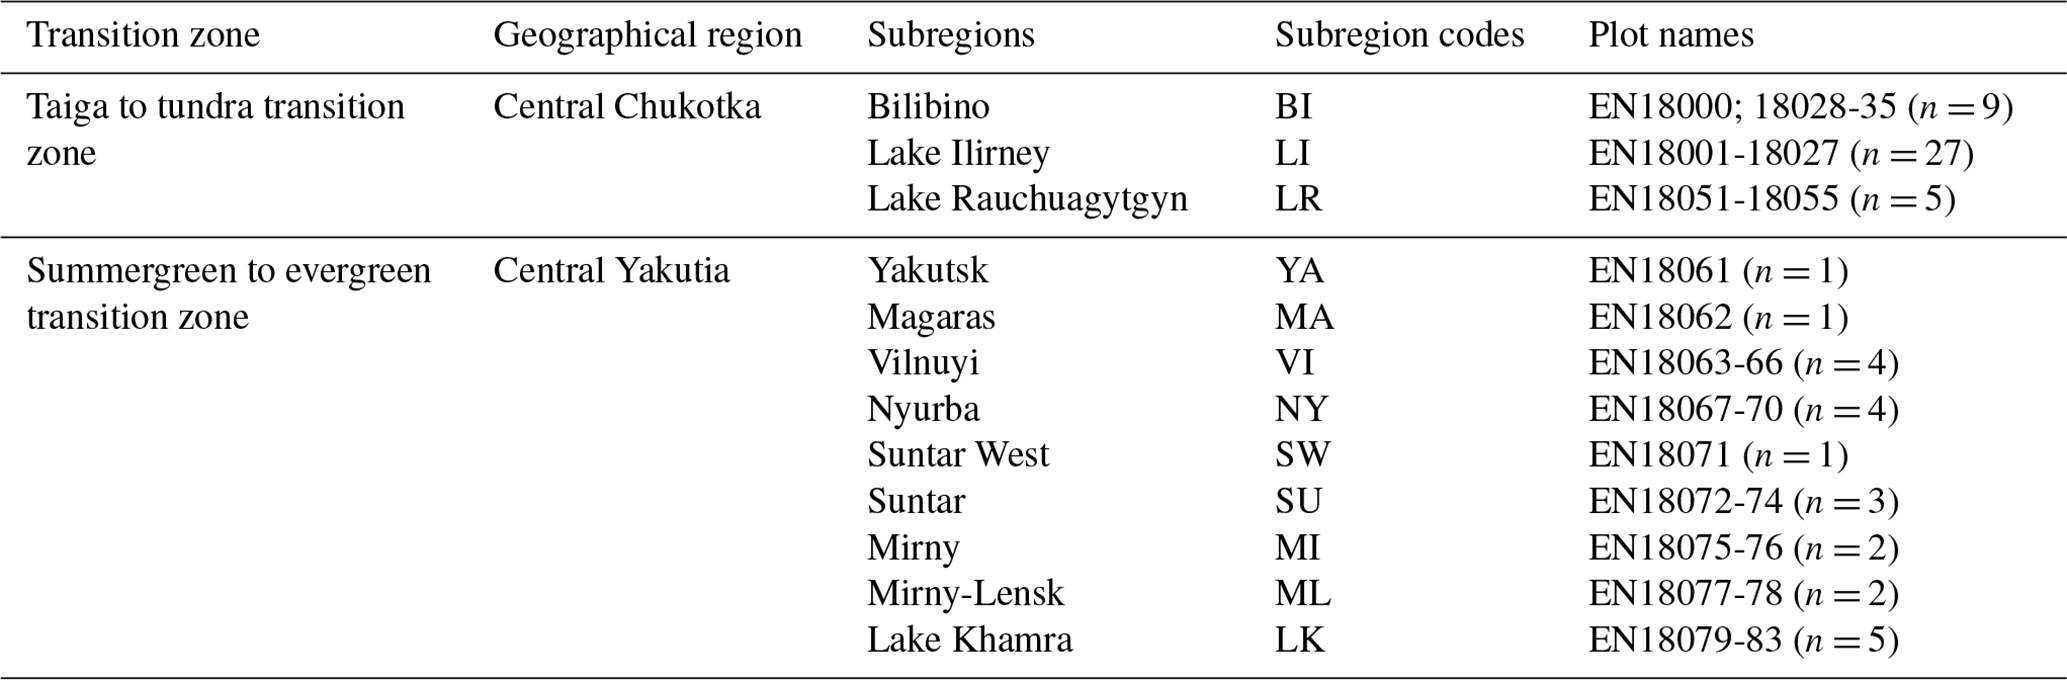
Table 1Overview of vegetation plots per transition zone, region, and subregion along with the subregion codes.
The SiDroForest data collection contains a variety of data types that were selected to create the most comprehensive insights into the boreal forest in Siberia.
The SiDroForest data collection is divided into four datasets (Fig. 2):
-
UAV-based SfM point clouds, point-cloud products, and orthomosaics from UAV image data (yellow hexagon symbols) of expedition vegetation plots in Chukotka and Central Yakutia in summer 2018 (mint green rectangle).
-
Individual labeled trees surveyed during the fieldwork, including information on height, tree crown, and species. These tree-individual labeled point and polygon shapefiles (light green symbols) were generated and are linked to the UAV RGB orthoimages of the expedition vegetation plots.
-
Synthetically created Siberian larch tree-crown dataset of 10 000 instances in Microsoft's COCO format (pink triangle symbols). The images and masks contain the tree crowns of two species of larch (Larix gmelinii and Larix cajanderi), manually extracted from selected UAV RGB images.
-
Sentinel-2 Level-2 bottom-of-atmosphere labeled image patches with seasonal information (red shape symbol) covering the expedition vegetation plots.
Each data type has been enhanced to best use the data for vegetation-related analyses. Dataset three and four have additionally been optimized and annotated for machine-learning tasks. Machine-learning tasks often require validation data and also the annotated datasets 1 and 2 contain data for such an application. The combined data types aim to provide a multi-purpose application dataset on the current state of the vegetation cover in Central Yakutia and Chukotka.
The SiDroForest products are in common software formats: there are point and polygonal shapefiles (shp), raster files are in the georeferenced tagged image file format (GeoTiff), shapefile formats and JavaScript Object Notation (JSON) can be read and visualized in any open-source and commercial GIS and remote-sensing software tools and a wide range of libraries in R, Python, and other programming languages. The point clouds are provided in the standard LASer (LAS) binary file format that can be handled in any software that supports this format such as CloudCompare (CloudCompare, 2022) or R (R Core Team, 2020) or Python libraries specifically developed for this data type.
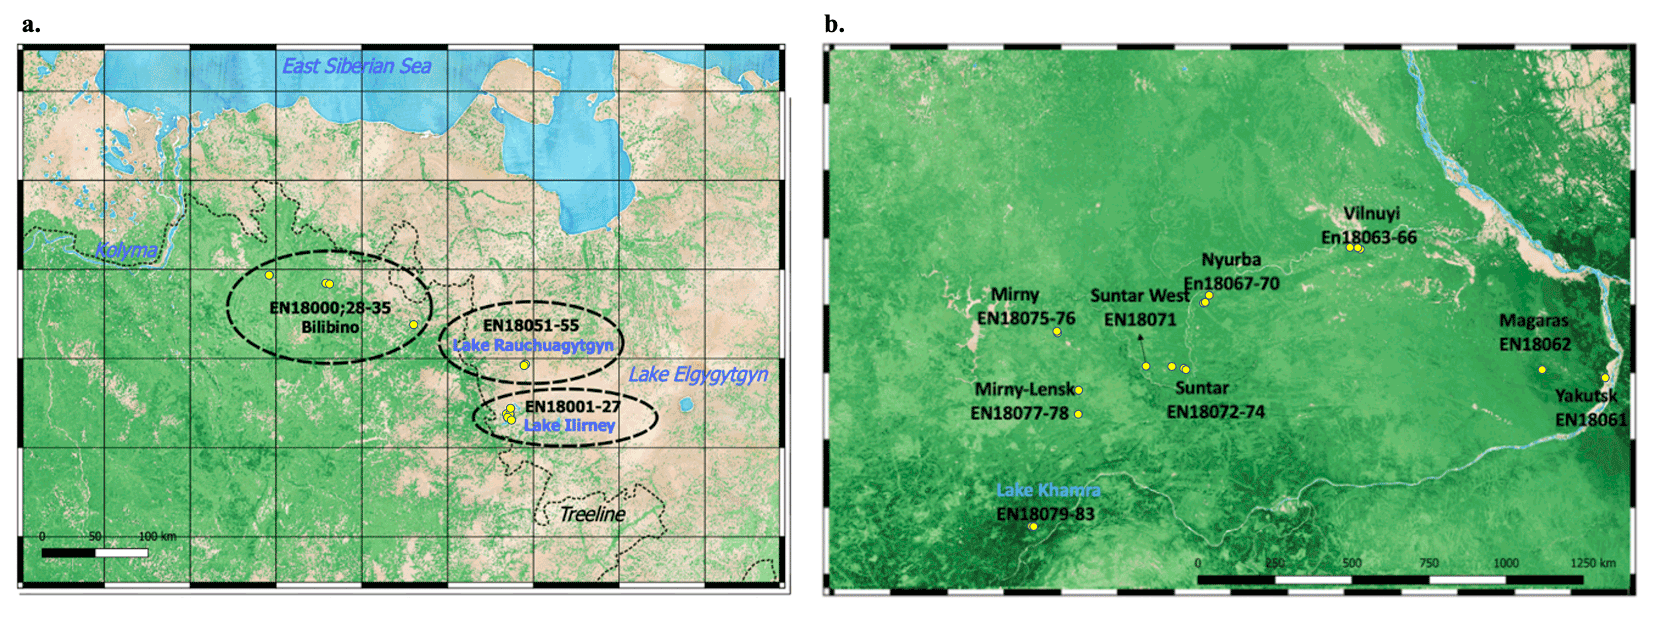
Figure 3Subregions and plots (yellow points) for (a) Chukotka and (b) Central Yakutia: Bilibino (BI) (EN18000, 18028–35), Lake Ilirney (LI) (EN18001–27), and Rauchuagytgyn (RA) (EN18051–55), Yakutsk (YA) (EN18061), Magaras (MA) (EN18062), Vilnuyi (VI) (EN18063-66), Nyurba (NY) (EN18067–70), Suntar West (SW) (EN18071), Suntar (SU) (EN18072–74), Mirny (MI) (EN18075–76), Mirny-Lensk (ML) (EN18077–78) and Lake Khamra (LK) (EN18079–83). See also Table 1. The overview map (background © OpenStreetMap contributors 2022. Distributed under the Open Data Commons Open Database License (ODbL) v1.0.) shows forest coverage by green color-coded NASA forest height (Simard et al., 2011) and the northern treeline (CAVM Team, for Arctic Climate Impact Assessment, ACIA).
2.1 SiDroForest field data
Extensive expeditions from the Alfred Wegener Institute (AWI) Helmholtz Centre for Polar and Marine Research from Germany in cooperation with the North-Eastern Federal University of Yakutsk (NEFU), Yakutia, in the summer of 2018 covered a bioclimatic gradient ranging from treeless tundra via extremely open larch forest with mean tree heights around 5 m close to Lake Ilirney in central Chukotka (tundra–taiga transition zone) in northeastern Siberia to dense mixed tree species stands near Lake Khamra in southwestern central Yakutia (summergreen–evergreen transition zone) (Fig. 1). The larger regions were subdivided into 12 subregions that were named based on the nearest city or lake to the plots: in Chukotka, we defined 3 subregions encompassing 41 vegetation plots (Fig. 3a) and 9 subregions encompassing 23 vegetation plots for central Yakutia (Fig. 3b). The vegetation plots have different tree cover: from treeless tundra to open larch forests on slopes and in lowlands, with tree density depending on slope and slope aspect. All data types included in this dataset are linked to each other using a two-letter code signifying the subregion (Table 1) and the vegetation plot numbers.
A detailed vegetation inventory was conducted for each of the plots visited during fieldwork. The 15 m radius circular plots for the projected cover of trees and tall shrubs (Fig. A1) were set within 30 m × 30 m rectangular vegetation plots for ground projective cover of vegetation taxa. The plots and the field data collection are described in further detail in Shevtsova et al. (2019, 2020a, b, c, 2021). In the field, two tape measures, each 30 m long, were laid out along the main cardinal directions, intersecting in the plot center, marking the main axes of a circular area with a radius of 15 m. A minimum of 10 individuals of each tree and shrub species present were selected per plot. The selection of trees was based on how representative the tree types were for this forest type so that it represents the vegetation as well as possible. To make sure that the data are evenly distributed, we included at least 10 trees per species, if there were as many on the plot. For each individual tree we measured the stem diameter at breast height and at the base. The tree-crown diameter, tree height, and vitality were estimated as described in Brieger et al. (2019). There were three deviations from the standard method of vegetation inventory. On plot EN18014 and EN18065, all trees were recorded, and plot EN18070 was recorded by a transect with three segments: edge, transition, and center.
Post fieldwork, we assigned 11 vegetation classes to the 64 plots (Table A1). The class assignment was based on the previous classes determined by Shevtsova et al. (2020a) for Chukotka. For plots in central Yakutia, we applied a similar method incorporating principal component analysis (PCA), tree density information from the UAV data, and recorded tree species information per plot (Figs. A2 and A3 show the field data information).
In addition to the fieldwork forest inventories that were obtained, 60 of the 64 vegetation plots were overflown with a consumer grade DJI Phantom4 quadcopter carrying MAPIR Survey-3W red–green–blue (RGB) and red–green–near-infrared (RGN) cameras to obtain spatially mapped detailed two- and three-dimensional (2D, 3D) forest structure information. The UAV imagery covered a minimum areal extent of 50 m × 50 m over the 15 m radius plots with a standardized flight plan following a double-grid in near-nadir position and a circular flight facing the plot center at take-off elevation (Fig. A4). Further details are described in Brieger et al. (2019).
2.2 SiDroForest dataset 1: structure-from-motion (SfM) point-cloud products and orthomosaics
2.2.1 SfM point-cloud products of the plots
Due to the availability of multiple overlapping images from different camera viewpoints, point-cloud processing and the generation of 3D products and successive generation of orthoimages were possible. We manually rejected images that had been taken during take-off and landing, as well as under- or overexposed images, from further processing (see also Brieger et al., 2019). The remaining images were used to generate the 3D SfM point clouds and related products directly from the point-cloud data.
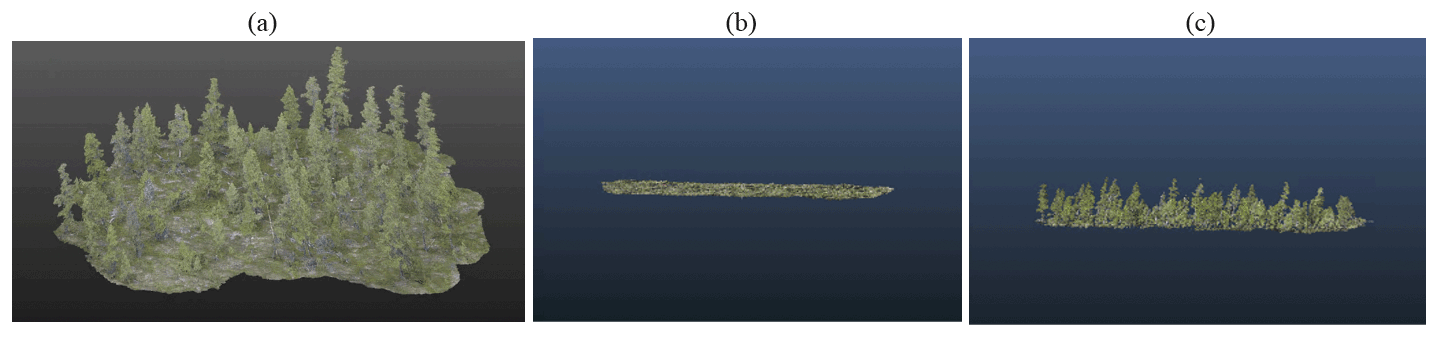
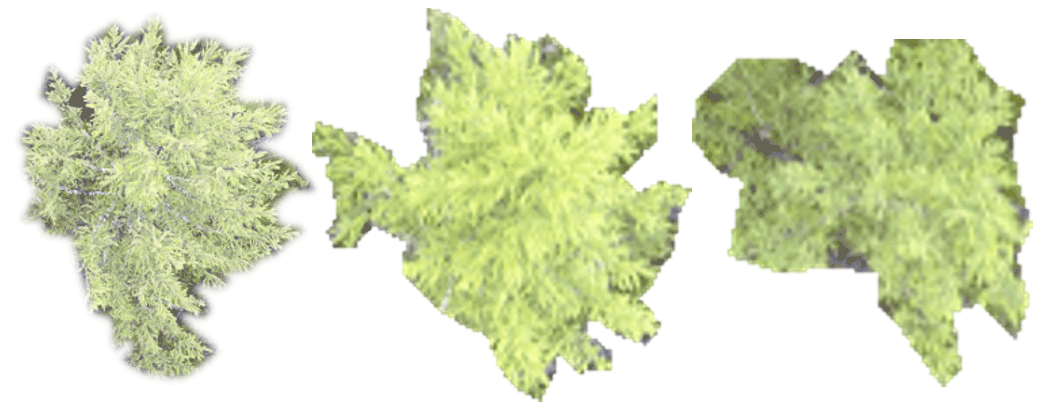
Figure 4(a) Example of a full red–green–blue (RGB) structure-from-motion (SfM) point cloud for plot EN18074. Panel (b) shows the segmented RGB point cloud containing only the points of the ground layer, named groundonly and (c) shows the segmented RGB point cloud with the aboveground vegetation, named treesonly.
The SfM point clouds were constructed with Agisoft PhotoScan Professional (Agisoft, 2018) according to methods described in Brieger et al. (2019). Tracked Global Positioning System (GPS) information was automatically integrated into the images during this process. The parameters were tuned with the highest-resolution settings to capture as much detail of the complex tree structures as possible. The depth filtering in the dense cloud generation was changed from the default to a mild filtering to preserve more detail, especially in tree crowns (details in Brieger et al., 2019). The RGB point clouds have been further segmented into two separate point clouds with a cloth simulation filter (CSF; Zhang et al., 2016) as described in Brieger et al. (2019) to produce two RGB point clouds. One of the point clouds contains the points of the ground and low vegetation (here named “groundonly”) and the other contains the points of the higher vegetation (here named “treesonly”) (Fig. 4).
We chose to segment the RGB point clouds into “groundonly” and “treesonly” because it reduces the size of the individual point clouds and at the same time, it remains easy for users to merge them together. It can also be interesting to have the two segmented when attempting to analyze the below-canopy vegetation or ground-cover classes. Plots with dense vegetation such as EN18077 and EN18063 could not be segmented into “groundonly” and “treesonly” due to the ground not being visible in the images. The final SiDroForest dataset includes three point-cloud types per plot: “treesonly” and “groundonly” in RGB and the full point cloud in RGN. The created point-cloud products include a digital terrain model (DTM), a digital surface model (DSM), a canopy height model (CHM), and a digital elevation model (DEM). The point-cloud products were produced in R (R Core Team, 2020) and exported as georeferenced GeoTiff raster files at 3 cm × 3 cm pixel resolution in the respective Universal Transverse Mercator (UTM) projection of the field site location. The DEM products were cropped to a defined area in the form of a polygon (here named the outer polygon) due to the better quality of the points within this region. The outer polygon is the area covering the camera positions plus a buffer of 5 m. In addition to the clipped product versions and the shapefiles of the outer polygon, the fully covered area that was not clipped to the outer polygon is also supplied for the orthomosaics and the point clouds to give the user a dynamic dataset to work with.
Digital Terrain Model. The definition of a DTM is that the surface represents the ground level with all natural and built features above the ground removed. The DTM is created from the RGB ground cover and lower vegetation (groundonly) point cloud, therefore, the SiDroForest DTM represents the top of the canopy of the lowest vegetation canopy layer in case of low-structure vegetation.
Digital Surface Model. The definition of a DSM is that the surface represents the highest-level elevation including natural and built features. The DSM is produced from the full point cloud, and interpolated between the highest points in each grid cell representing the top of the highest tree canopy layer if trees are present in the plot.
Canopy Height Model. The definition of a CHM is that it represents the difference between the DSM and the DTM (CHM = DSM – DTM), and thus normalizes the DSM to the ground. Because the CHM is derived from a subtraction of the DSM and the DTM, it may contain no data values where the tree crown covers a large amount of ground and the ground data are missing due to this coverage. The SiDroForest CHM represents the vegetation height above the ground.
Digital Elevation Model. The DEM is a quantitative representation of the elevation of Earth's surface. The SiDroForest DEM provides the terrain relief referenced to the vertical datum of the World Geodetic System 1984 (WGS84) without the lowest canopy layer in contrast to the SiDroForest DTM that contains the lowest ground vegetation layer.
2.2.2 Orthomosaics of the plots
The UAV-derived orthomosaics are geometrically corrected images that are by standard georeferenced by topography (the relief) and vegetation (the top-of-canopy elevation). The orthomosaics were constructed from the multiple RGB and RGN overhead photo images that were corrected for perspective and scaled with Agisoft PhotoScan Professional (Agisoft, 2018) using structure from motion/multi-view stereo (SfM-MVS) techniques as described in detail in Brieger et al. (2019). The RGN orthomosaics have been coregistered to the RGB point clouds using the ground control points (GCPs) distributed in the field to make the RGN and RGB point clouds align. The orthomosaics were exported as georeferenced GeoTiff files at 3 cm × 3 cm pixel resolution in the respective Universal Transverse Mercator (UTM) zone projections.
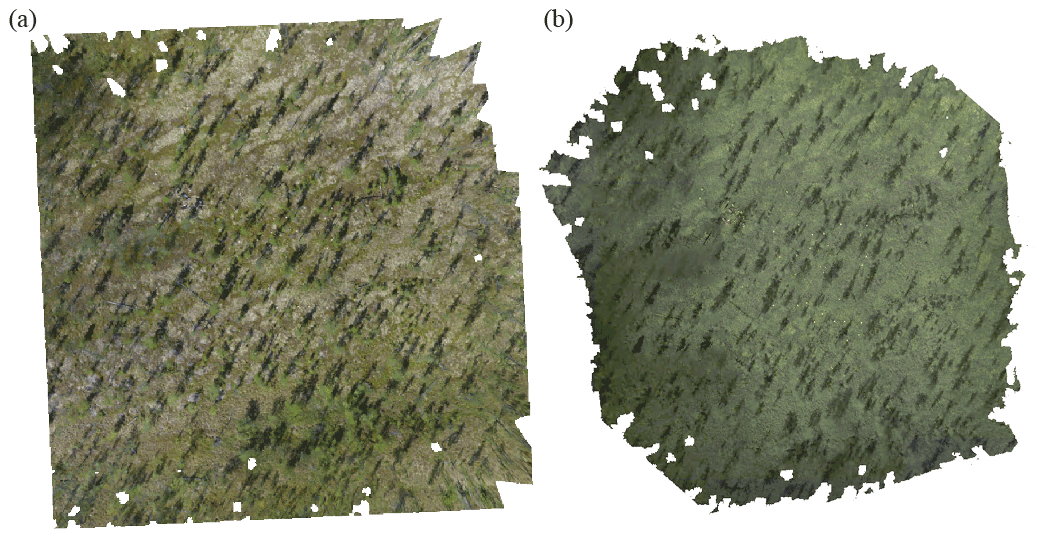
Figure 5Example of red–green–blue (RGB, displayed with red on red, green on green and blue on blue as true color) (a) and red–green–near-infrared (RGN, displayed with green on red, NIR on green, and red on blue) (b) orthomosaics for plot EN18000.
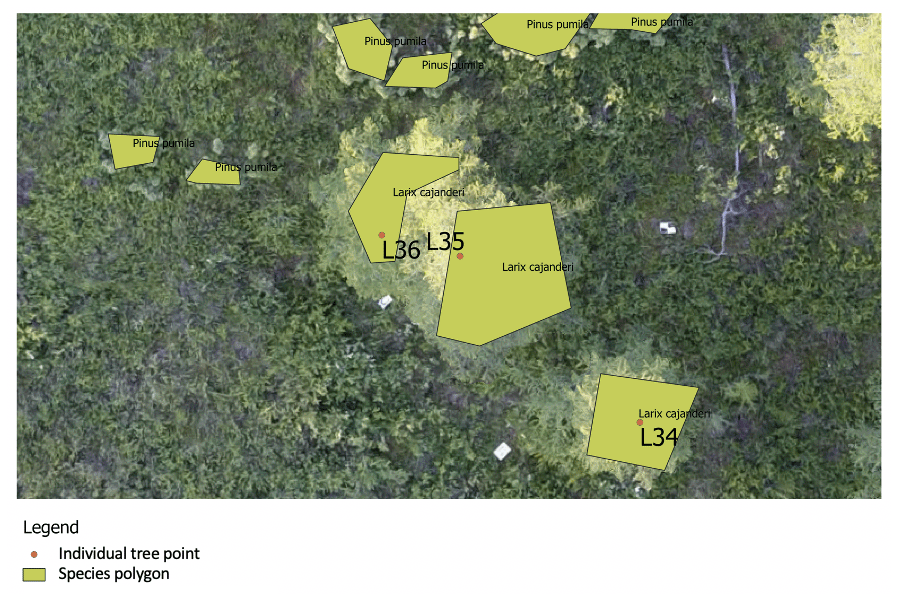
Figure 6Examples of the individual point labels and examples of species polygons. Where possible, the species polygon overlaps the individuals labeled in the field, e.g., the larch at L34, L35, and L36. Additionally, the Pinus pumila were not recorded in the field but are added in the species shapefile. Both shapefiles are visualized on the red–green–blue (RGB) orthoimage of plot EN18004.

Figure 7Examples of red–green–blue (RGB) images of plots from the selected unmanned aerial vehicle (UAV) flights in the following order: EN18063, EN18068, EN18074, EN18078, and EN18083.
Not all RGB orthomosaics have the same high quality, as varying flight or weather conditions affected the construction of the final products. The canopy moved due to wind that cannot be avoided in the acquisition process at high latitudes in the field, where there are nearly never wind-free time slots. This resulted in “blurry” parts in some of the orthomosaics (EN18030, EN18078, and EN18079). These blurry regions affect less than 20 % of the image, therefore the orthomosaics of these plots are included in the data publication. Figure 5 shows an example of the high-quality type of an RGB and RGN orthoimage product.
2.2.3 Automated extracted tree-crown polygons
The SiDroForest data collection also contains 19 342 automatically detected tree-crown polygons (Kruse et al., 2021). The tree crowns were captured in the CHM by analysis of watershed segmentation using the R package ForestTools (Plowright, 2018) and successive automatic generation of a polygon around them following Brieger et al. (2019). This automated tree-crown detection algorithm was run for all plots and the resulting shapefiles are provided for each plot that contained trees. Quality assurance was performed for each plot by carefully examining each plot based on expert knowledge and assigning a quality score of Q1 (good quality), Q2 (medium quality), or Q3 (poor quality) to the shapefile products.
2.3 SiDroForest dataset 2: individually labeled trees
The individuals from within the 15 m radius vegetation survey plots that could be located in the orthoimages were marked in a point and polygon shapefile that outlines the tree crown of the individual tree, containing the individual number of the tree, the species, and its form (tree or shrub). The form attribute was added because in the Chukotka plots there are Pinus species that are not the Pinus tree but the Pinus shrub form. The tree identification, exemplified in Fig. 6, is the first letter of the genus of tree and the total number of individuals recorded (e.g., L259 is the 259th Larix specimen). The total number of Larix recorded is a cumulative number over all the plots recorded. The individual number was recorded during fieldwork and corresponds to information stored in the extensive database of Kruse et al. (2020a) containing measurements concerning the individual tree, which are now also accessed via the SiDroForest dataset in the form of attributed shapefiles.
The point shapefiles also include the geographical x and y coordinates of the point in decimal degrees. The individual number can be used to link the tree or shrub to the rest of the information collected during the expedition such as tree height, crown diameter, and vitality. This information is provided in form of a csv file in Kruse et al. (2021a).
In addition to the two shapefiles that are linked to the individually recorded trees, another shapefile is provided per plot with species-level information (Fig. 6). It contains a minimum of 10 labeled polygon shapefiles that cover trees or large shrubs (> 1.3 m height). These labeled polygons only cover the inside of the tree or shrub to minimize noise from the ground layer for classification purposes. For the species polygon, trees and shrubs that were seen in the rest of the orthoimages were also included, not only the individuals from the fieldwork records.
2.4 SiDroForest dataset 3: synthetic larch tree crowns
The synthetic dataset contains larch (Larix gmelinii (Rupr.) and Larix cajanderi (Mayr.)) tree crowns extracted from the onboard camera RGB images of five selected vegetation plots from fieldwork, placed on top of fully resized images from the same UAV flights.
To create the dataset, backgrounds and foregrounds were needed. The RGB images included for the backgrounds were from the field plots: EN18062 (62.17∘ N, 127.81∘ E), EN18068 (63.07∘ N, 117.98∘ E), EN18074 (62.22∘ N, 117.02∘ E), EN18078 (61.57∘ N, 114.29∘ E), and EN18083 (59.97∘ N, 113∘ E), located in central Yakutia, Siberia (Fig. 7).
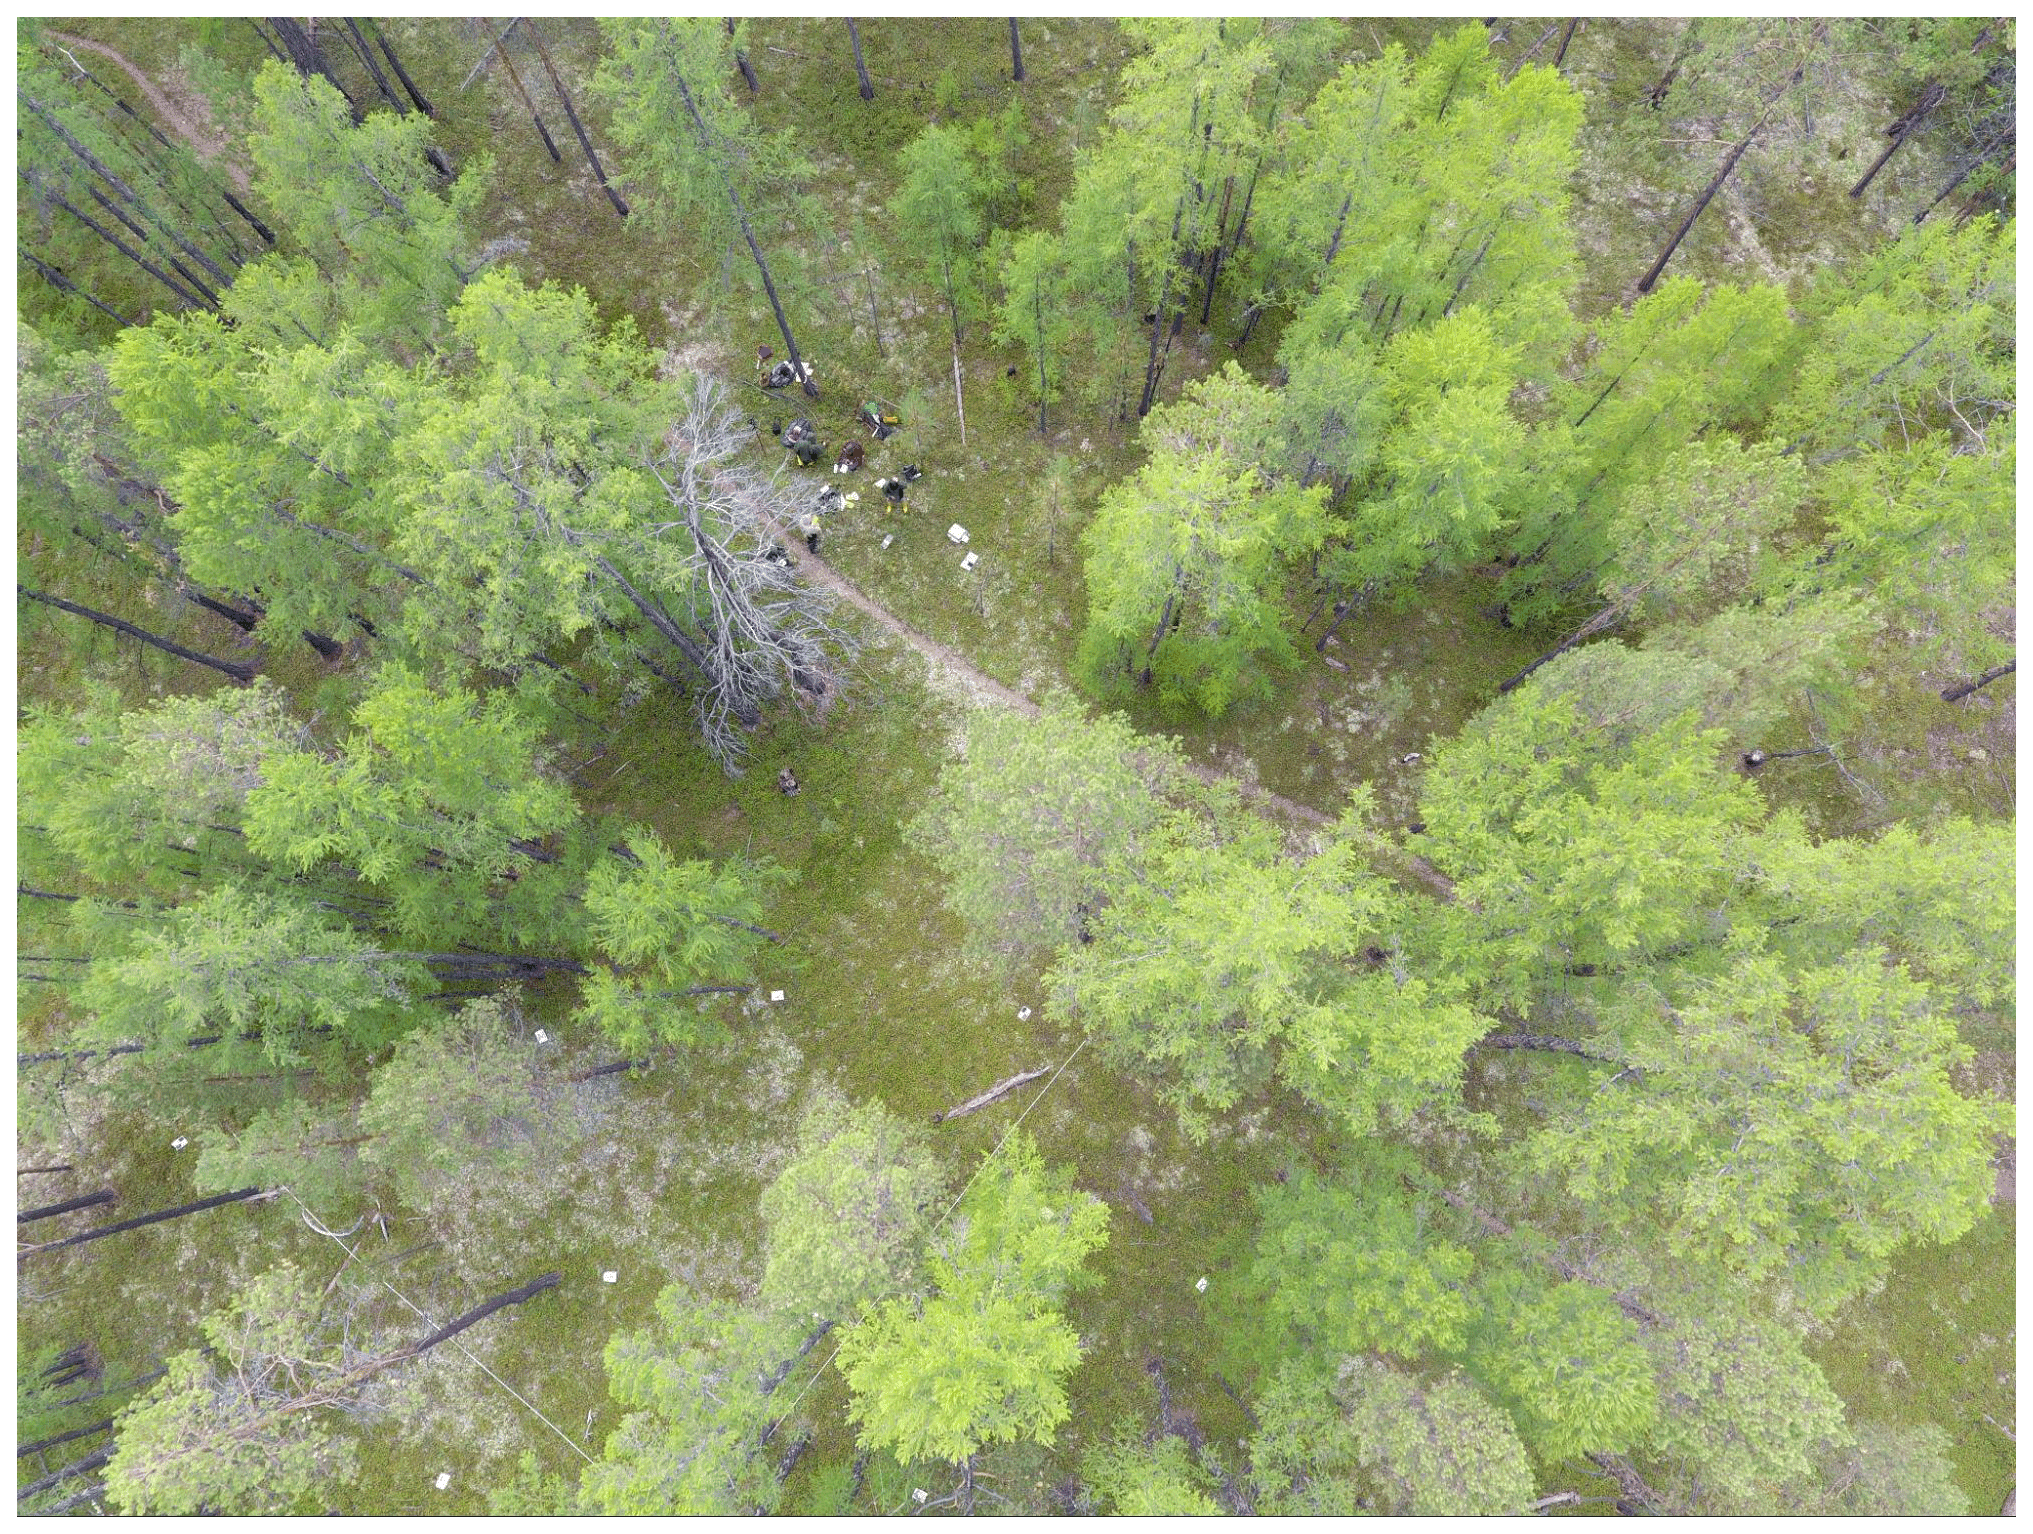
Figure 8Example of a red–green–blue (RGB) image that was excluded from the 35 images for plot EN18068.
The plots were selected based on their vegetation content and their spectral differences, as well as UAV flight angles and the clarity of the UAV RGB images. For each plot, 35 images were selected in order of acquisition, starting at the 15th image in the flight to establish the backgrounds for the dataset. The first 15 images were excluded because they often contain a visual representation of the research team (for example, Fig. 8). Excluding these images reduces noise in the dataset as we aimed to include only forest and natural terrain in the images. The UAV camera acquisitions were taken on different dates during the 2-month long expedition, when visiting the vegetation plots. The fieldwork dates are added in Table A1. There was no color matching later as these were acquisitions in the field under different illuminations: overcast with no shadows as best condition for spectral imaging, and sunny with strong shadow formation of the trees as the least favorable condition. The cameras of every acquisition were calibrated and referenced to photo panels, however this not yet a normalization such as transferring the data into quasi-reflectance data that would allow to have absolute color values between acquisitions.
The raw UAV RGB images were cropped to 640 by 480 pixels at a resolution of 72 dots per inch (dpi). These are later rescaled to 448 by 448 pixels in the process of the dataset creation. In total there are 175 cropped backgrounds.
The foregrounds used in the dataset consist of 117 tree crowns and were manually cut out using Gimp V2.10 software (GIMP, 2019) to ensure that they were all Larix trees (see Fig. 9). Of the tree crowns, 15 % from the margins of the image were included to make sure that the algorithm does not rely on a full tree crown in order to detect a tree.
The COCO format for the SiDroForest synthetic dataset is stored in a JavaScript Object Notation (JSON) file that contains the mask and image name, the color category that was used to create the mask that the category the image falls under, which in this case is “larch” and the super category which is “tree” (an example is shown in Table A2). In this way, the created masks are connected to the created images.
The extracted tree crowns were rotated, rescaled, and repositioned across the images using the cocosynth algorithm developed by Kelley (2019), resulting in a diverse synthetic dataset that contains 10 000 images for training purposes and 2000 images for validation purposes for complex machine-learning neural networks. In addition, the data are saved in the Microsoft COCO format (Lin et al., 2014) and can be easily loaded as a dataset for networks such as the Mask R-CNN, U-Nets, or the Faster R-NN. These are neural networks for instance-segmentation tasks that have become more frequently used over the years for forest monitoring purposes. The Synthetic dataset contains images and labels in the COCO format and can be loaded into most programming languages such as R (R Core Team, 2020) and Python.
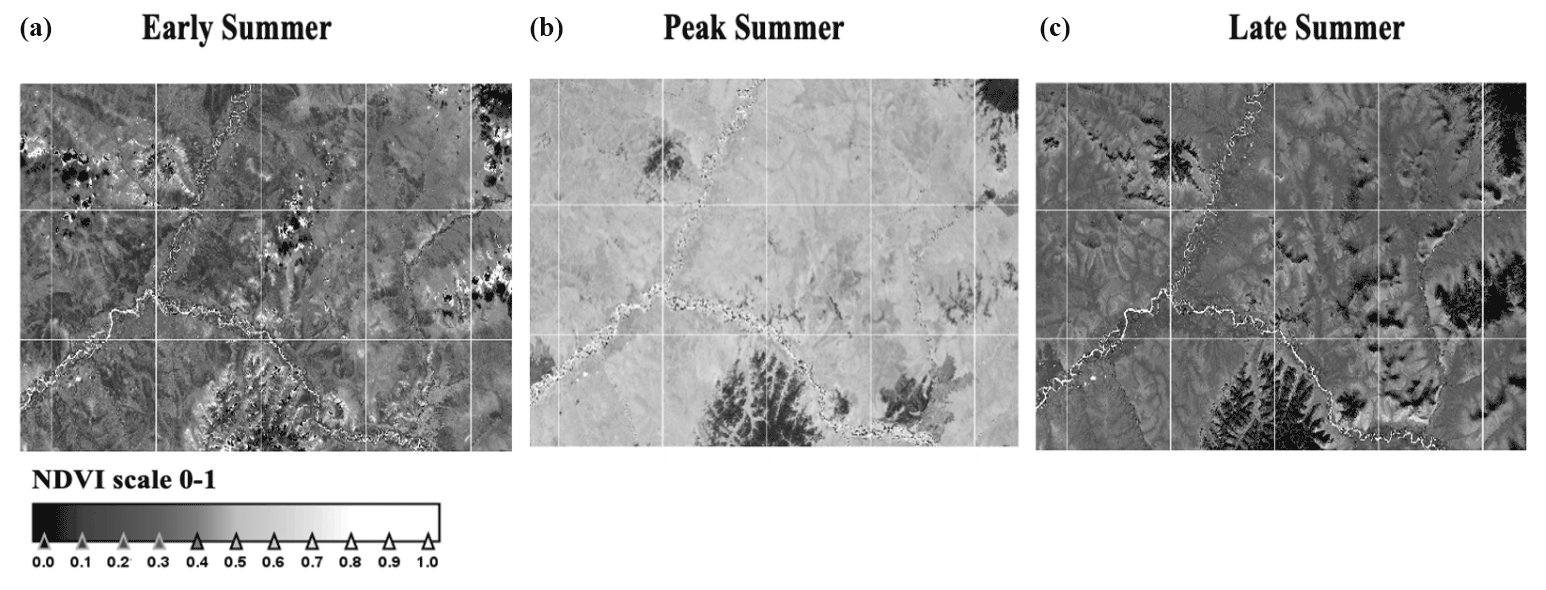
Figure 10Sentinel-2 NDVI in greyscale of the three periods for the Bilibino subregion in Chukotka: (a) early summer, (b) peak summer, and (c) late summer.
2.5 SiDroForest dataset 4: sentinel-2 satellite image patches
Sentinel-2 (S-2) is an ESA optical satellite mission providing satellite imagery globally and freely available, which facilitates low-cost broad-scale analyses of circumpolar boreal forests. The S-2 mission is composed of two identical satellites that were launched in 2015 and 2017 (ESA, 2015). The S-2 imagery has 13 multispectral bands, where in the native spatial resolution, 4 bands have the highest (i.e., 10 m) spatial pixel resolution covering the visible wavelength region with 3 spectral bands (blue, green, red), and 1 spectral band in the near-infrared (NIR). An overview of the S-2 spectral bands can be seen in Appendix Table A3.
The best possible acquisitions of S-2 data, that is, cloudless and without smoke from forest fires, were retrieved from the ESA archive from the years 2016 to 2020 for three distinct time stamps: early summer (May to June, depending on latitude), peak summer (mid-July to early August), and late summer (late August to September). The S-2 Level-1C (top of atmosphere) image data were processed to Level-2A (bottom of atmosphere) surface reflectance using the newest version of the atmospheric correction processor Sen2Cor (ESA, 2021). Atmospheric correction processing was performed mainly with the default configuration which uses a rural aerosol model with a start visibility parameter of 40 km corresponding to aerosol optical thickness of 0.20 at 550 nm. Actual aerosol optical thickness is determined during the atmospheric correction processing. The two non-default settings were further enhancements such as the use of the Copernicus DEM for terrain correction (Copernicus, 2021) and the use of vertical column ozone content from L1C-metadata instead of a fixed value of 331 Dobson units.
The data provided in SiDroForest are optimized for vegetation-related analyses, such as resampling all bands to 10 m spatial resolution to make them comparable at the same resolution and removing the 60 m bands that support atmospheric correction but are not optimal for land surface classification. The NDVI was calculated using (B8 − B4B8 + B4) and masked for surface waters using the water mask provided with the L2A-product. Areas of snow and lake and river ice in early season acquisition NIR bands were masked using an adaptable optimized threshold. The dataset presented here contains 12 subregions (sites) of S-2 acquisitions that cover all the 64 locations where fieldwork was performed in Siberia in 2018 (Table A1) with the 3 seasonal time stamps included and the water-masked NDVI band added (Fig. 10 shows an example of the Bilibino subregion NDVI product in early, peak, and late summer).
In a further step, the pre-processed S-2 imagery with the spectral bands 2, 3, 4 (visible), 5, 6, 7, 8A (NIR), 11, 12 (SWIR; short-wave infrared) at 10 m resampled spatial resolution and the additional water-masked NDVI band are cropped to 30 m × 30 m image patches around the center coordinate of the vegetation plot using UTM-oriented shapefiles. These shapefiles and the JSON-annotated image patches receive the annotation of 1 of the 11 vegetation classes derived from fieldwork and analysis of the UAV data, described in Sect. 2.2.1, as attributions (Table A1). The labels are also stored in the JSON file for each plot in accordance with the patch labeling in BigEarthNet-S2 (Sumbul et al., 2019). The JSON is an open standard file format and data interchange format that uses human-readable text to store and transmit data objects consisting of attribute–value pairs and arrays. It is often used in machine learning as the standard for stored labels.
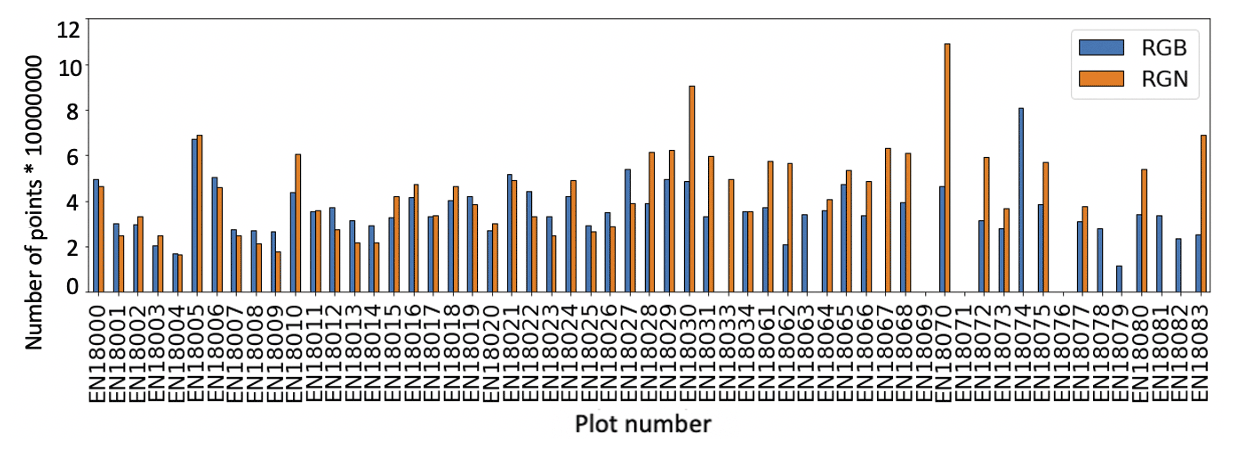
Figure 11Comparison of the number of points in red–green–near-infrared (RGN; orange bars) and the combination of the two red–green–blue (RGB) “groundonly” and “treesonly” point clouds (RGB; blue bars).
3.1 Dataset 1: SfM point clouds and point-cloud products
For most of the plots, especially for the Chukotka plots, the total number of RGB and RGN point-cloud points (with “treesonly” and “groundonly” segmented points added together) were of a similar magnitude (Fig. 11). With higher vegetation structure, the NIR reflectance enables more data points in RGN than the RGB point clouds over the high and dense central Yakutian forest plots.
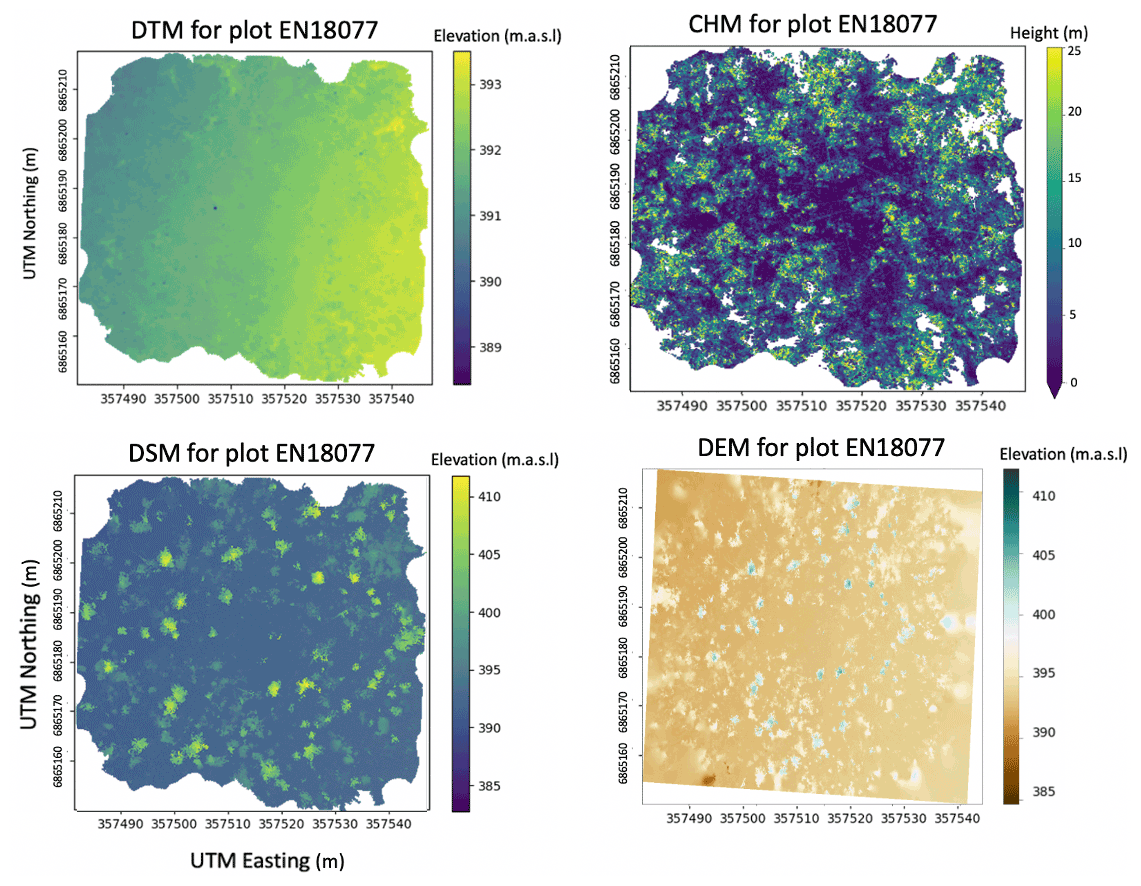
Figure 13Digital terrain model (DTM), canopy height model (CHM), digital surface model (DSM) for plot EN18077.
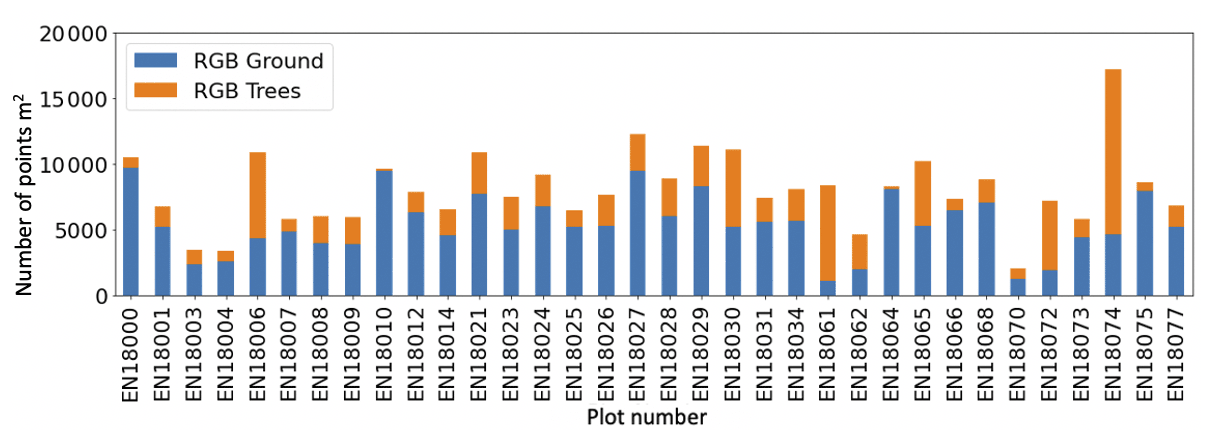
For the segmented RGB point clouds, the ground to aboveground ratio confirms that the plots that have substantially more points in the aboveground (treesonly) part, i.e., a large proportion of the point cloud is concentrated in the forest canopy if the plots also have more vegetation cover in the higher vegetation layer (Fig. 12). The SiDroForest point cloud products provide high-quality 2D and 3D data on the forest stand structure, the tree height and density, and the ground surface elevation of the plots (see example for EN18077 in Fig. 13).
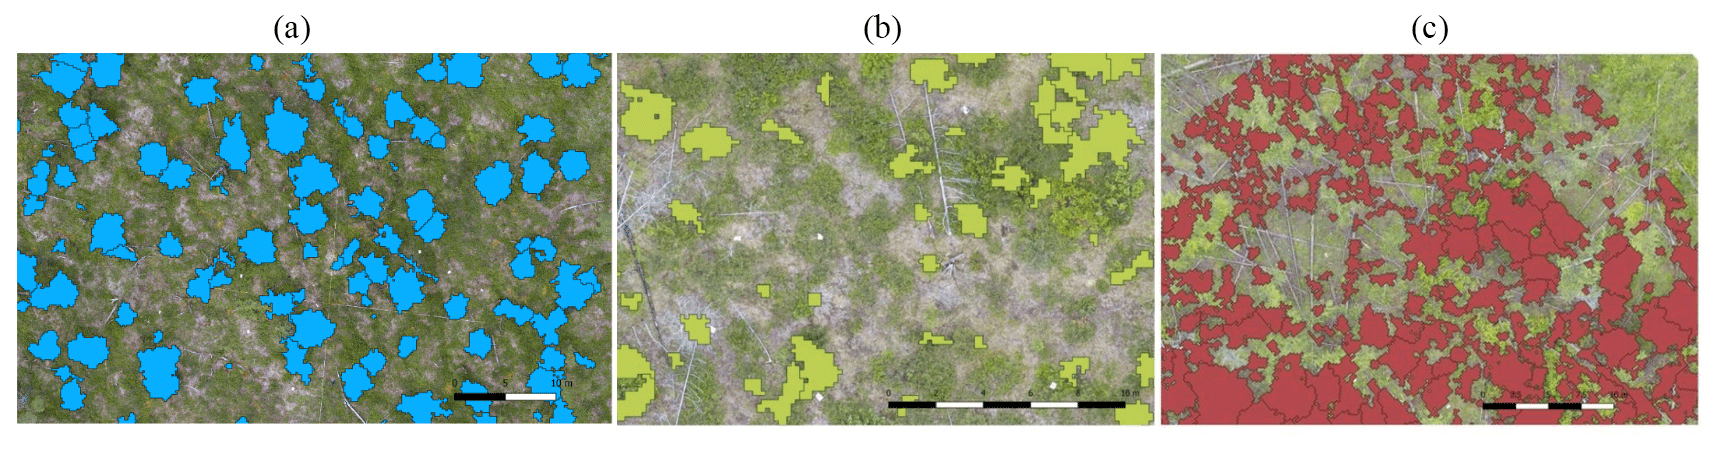
Figure 14(a) Crown polygons for plot EN18014 with Q1 quality score. (b) Crown polygons for plot EN18014 with Q2 quality score. (c) Crown polygons for plot EN18014 with Q3 quality score. The scale bar represents 10 m.
The SiDroForest data collection contains 19 342 automatically detected tree-crown polygons. In contrast to the high quality 2D and 3D point-cloud products, the automatic tree-crown detection algorithm was not equally successful for each plot. For this reason, the quality control label (Q1, Q2, Q3) included with every shapefile in the name is already a useful indicator for the possible applications of this product. Figure 14 shows an example of the different quality scores. Each generated tree crown also has an attribute table assigned that contains information on tree height, vitality, and crown diameter among others. Figure A8 provides useful metadata information.
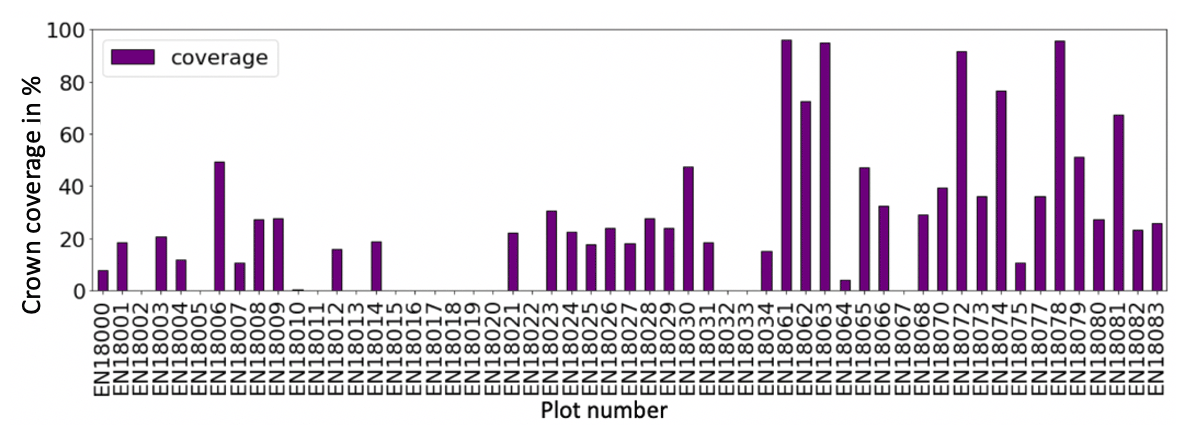
Figure 15The percentage of the crown coverage in the orthomosaics per plot. A high percentage reflects a denser forest.
Each plot has a different number of automatic tree crowns detected, depending on the density and the quality of the detected crowns in the plot. The percentage of crowns covering each plot was calculated to show the coverage of trees per plot (Fig. 15). Low tree-crown cover, i.e., below 50 % coverage, characterize the vegetation plots in the tundra–taiga transition zone in Chukotka. Tree crown coverage between 50 % and ∼ 90 % is reached in some of the plots in the summergreen–evergreen transition zone in central Yakutia. However, also in the central Yakutian boreal zone, a tree-crown coverage between 30 % to 60 % only characterizes most of the field forest plots.
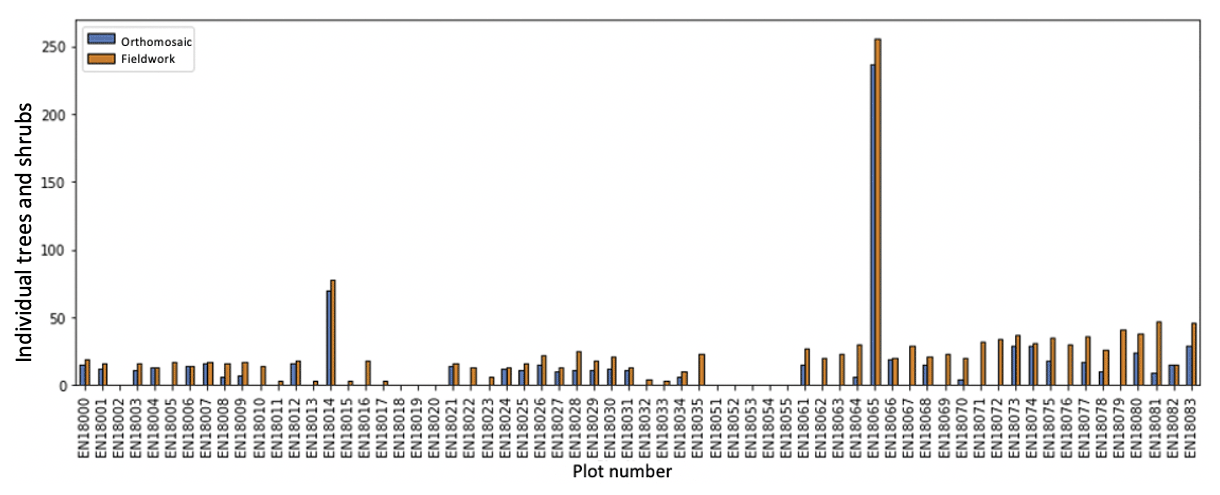
Figure 16Number of individual trees recorded in the field (orange color) and visually identified and relocated (blue color) in the red–green-blue (RGB) orthomosaics per plot. For plots EN18014 and EN18065 all trees were recorded that were present on the plot.
3.2 Dataset 2: individually labeled trees
In order to make assumptions and predictions about the content of the vegetation plots it is important to link the labeled individual trees from the fieldwork to the processed orthoimages. We located 872 trees and large shrubs in the orthoimages that were surveyed in Siberia during the 2-month fieldwork expedition in 2018 (Kruse et al., 2019a) (Fig. 16).
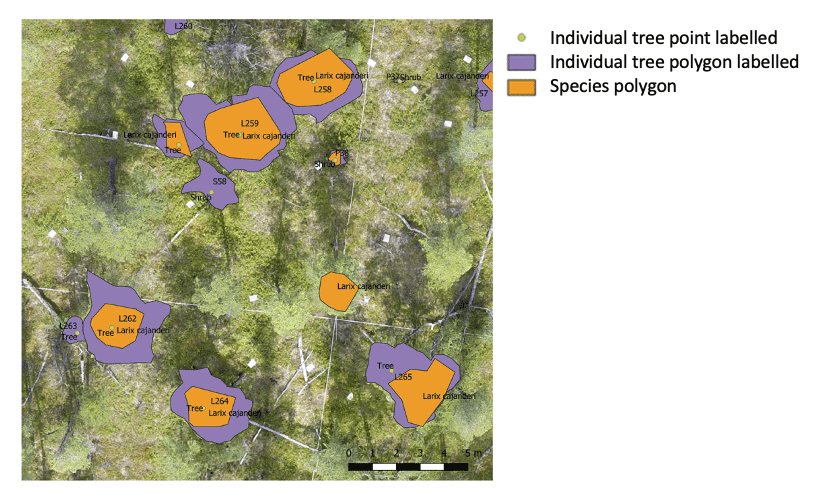
Figure 17Overview of the three types of shapefiles included in the individually labeled trees dataset visualized on top of a red–green–blue (RGB) orthoimage.
For each tree or shrub from fieldwork that is visually identified in the orthoimages, the created point and polygon shapefiles contain information about the tree or shrub species visible in the orthoimages. The field data on species distribution (trees and tall shrubs), mean tree height, and mean crown diameter per plot can be seen in the Appendix (Figs. A2, A3, A6, and A7). For each located individual, the three shapefiles pinpoint the location, provide a unique identifier, record the species information, and can be overlain by users on the RGB or RGN orthoimages of the plots as a useful visualization (example in Fig. 17). The individual number links to the information collected during the expedition such as tree height, crown diameter, and vitality. This dataset can be used to link individual trees in the SfM point clouds, providing unique insights into the vegetation composition and also allows future monitoring of the individual trees and the contents of the recorded vegetation plots.
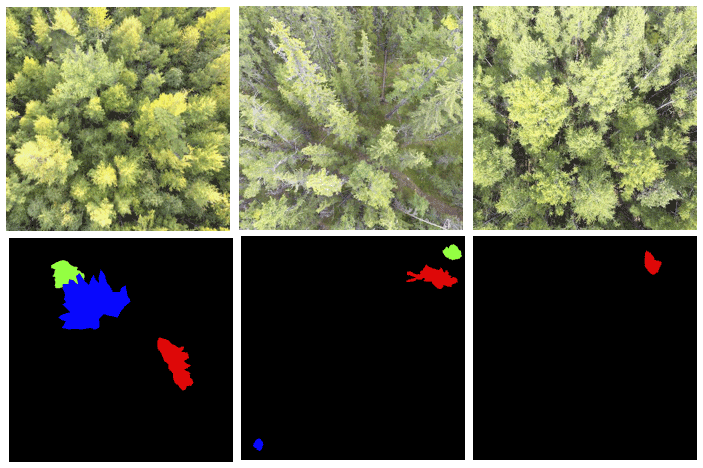
Figure 18Examples of synthetic images and corresponding masks generated. The images show three drone flight images with a cutout larch tree overlay. The masks below show the location of the placed trees in the form of masks. Each mask is assigned a different color to distinguish the masks.
3.3 Dataset 3: synthetic dataset results
This synthetic larch tree-crown dataset was created to enhance the data collective for upscaling and machine-learning purposes. The synthetic larch tree-crown RGB image database has many different larch-dominated forest structures and contains 10 000 synthetically produced images. This creates a large diversity of spatial and spectral features for machine-learning tasks. Examples of the results for the synthetic larch tree crowns include the RGB images that were generated and the accompanying masks that are used for the instance segmentation and object detection tasks as shown in Fig. 18.
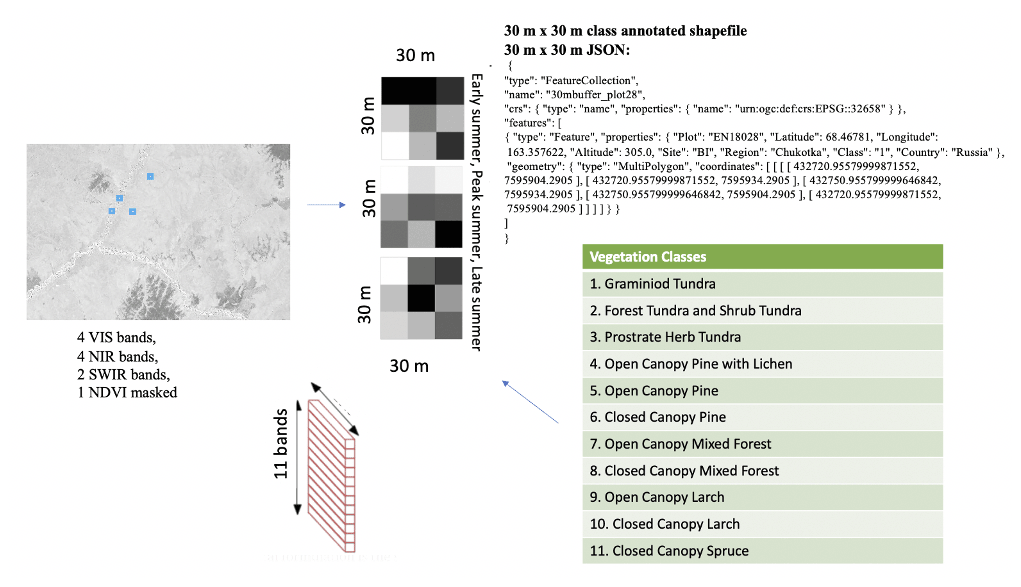
Figure 19Overview of the products in the Sentinel-2 labeled image dataset, exemplified for plot EN18028.

Figure 20Visual representation of the 11 vegetation classes from the orthomosaics (see also Appendix Table A1). The varying quality of the orthomosaics is described in Sect. 2.2.2.
3.4 Dataset 4: sentinel-2 labeled image patches
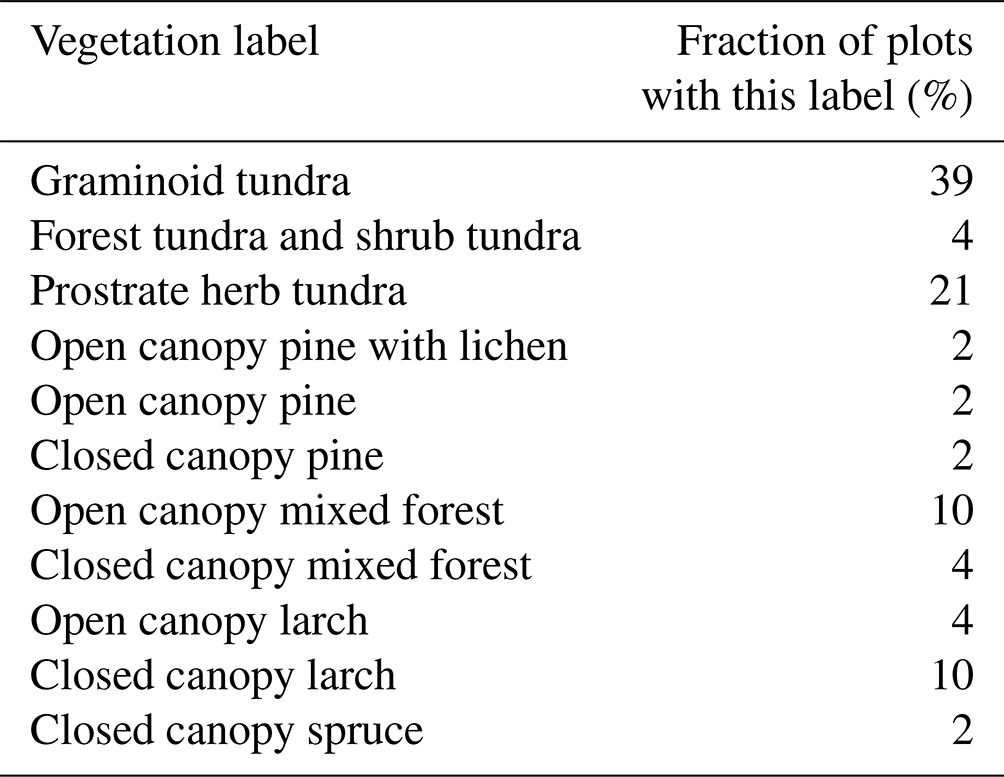
The labeled S-2 image patch dataset comprises 30 m × 30 m labeled multi-band (10 multispectral bands + NDVI) image patches with vegetation labels (Table A1) assigned and 3 seasonal representations (early summer, peak summer, and late summer) for 63 plots and 12 subregions (sites) (Table A1) with the same multi-band format. Since each 30 m × 30 m S-2 image patch consists of 9 units (pixels) of 100 m2 extent each, it amounts to around 550 annotated validation and training units. Figure 19 provides a schematic overview of the contents of the dataset, a visual representation of the 11 vegetation classes can be seen in Fig. 20. For easy re-use and machine-learning purposes, the vegetation classes are in the file name for each patch as well as in the JSON file. The classes and their representation in the labeled S-2 image patches are shown in Table 2.
Table 2Vegetation class labels per plot and percentage of plots for each classification.
4.1 Uniqueness of the SiDroForest comprehensive data collection on Siberian boreal forests
To date, the most relevant open-source datasets available on boreal and arctic vegetation data are from the long-term ABoVE NASA Terrestrial Ecology Program, focusing on boreal and arctic regions in Alaska and Canada. The ABoVE data collections contain field-based, airborne, and satellite sensor-derived data, providing a foundation for improving the analysis and modeling capabilities needed to understand and predict climate change in the arctic and boreal regions. In 2021, there were 50 vegetation-related datasets published so far in the ABoVE Science Cloud (ASC): 11 thematic maps, mostly derived from remote sensing and focused on Alaska, 9 vegetation-variable related mapped remote-sensing products, mostly covering large regions, 1 time-series product extracted for the footprint of a flux tower, and 6 ground-based vegetation-related data collections, including data from 10 terrestrial lidar vegetation plots (Maguire et al., 2020) and 24 vegetation plot surveys. The circumarctic vegetation map north of the treeline (CAVM Team, 2003, Walker et al., 2005) is 1 circumarctic product, the other 49 datasets are all located in Alaska. In the Arctic Data Center, Alexander et al. (2020) published vegetation plot data from six locations in Siberia, focusing on fire damage to vegetation including information on tree age.
The SiDroForest provides a new comprehensive data collection with a variety of data types that were selected to create the most useful insights into specifically the larch-dominated forests representative of eastern Siberia. The focus of the SiDroForest data collection is, at this stage, not to provide thematic maps or upscaled remote-sensing products but to provide a rich, open data source on ground-based and UAV-derived information and labeled data types enhanced to best use the data for vegetation-related analyses and machine-learning tasks.
For eastern Siberia, we had already published 2016 and 2018 vegetation inventories on the projective vegetation cover in Shevtsova et al. (2019, 2020b), and 2018 biomass data (Shevtsova et al., 2020c) of vegetation plots for the tundra–taiga transition zone in Chukotka. Tree-level forest inventory data from eastern Siberian forest plots were published in Kruse et al. (2020a) and Miesner et al. (2022). Additionally, we published a first version of 10 ultra-high resolution photogrammetric point clouds from the UAV overflights in 2018 over forest vegetation plots in central Yakutia in Brieger et al. (2019a, b). For these 10 plots, the construction of RGB SfM point clouds was evaluated and optimized and then used to process all RGB and RGN SiDroForest point clouds. In the SiDroForest data collection, we provide the complete and comprehensive dataset of the full range of standardized SfM-derived products of the 2018 UAV acquisitions in central Yakutia and Chukotka (Kruse et al., 2021b). In the SiDroForest data collection in addition to all RGN and RGB point clouds from all 63 overflown vegetation plots, we provide enhanced field data information such as the individually labeled tree dataset (van Geffen et al., 2021b). These existing field inventories (Shevtsova et al., 2019, 2020b, c; Kruse et al., 2020a; Miesner et al., 2022) are data publications optimized for ecological applications and not for machine learning, and upscaling applications. In the PANGAEA data repository, the individual datasets for ecological applications and the SiDroForest datasets can all be linked to each other by the vegetation plot codes. With these interlinked data types, multipurpose applications, and a more in-depth understanding of the Siberian boreal forests can be fostered.
4.2 High spatial resolution UAV domain in forest data collections
The SiDroForest data collection is largely based on photogrammetric UAV-borne products (i.e., SfM point clouds, digital elevation products, RGB orthomosaics) following a long application history in forestry and well-defined methodological standards (e.g., Jensen et al., 2016; Panagiotidis et al., 2017). Currently, the use of UAVs in environmental applications is undergoing an ever faster growing use in forestry and environmental science due to the landscape-level potential, the flexibility of the data generation and low costs (Fraser et al., 2016). The SiDroForest data collection extends our standard ground-based inventories. In addition to the photogrammetric UAV products, we undertook an automated tree-crown detection that has become more frequent due to the availability of state-of-the-art instance segmentation algorithms from the world of computer vision (Neuville et al., 2021). An example of previous work using a neural network tree-crown detection is Braga et al. (2020), where the Mask R-CNN (He et al., 2017) was used to perform the tree-crown detection and delineation. In another example, the Mask R-CNN was used by Hao et al. (2021) to detect tree crown and canopy height of Chinese fir in a plantation in China. Tree-crown width and tree height of Chinese fir were manually extracted from this UAV imagery using a combination of labeled ground-truth data and canopy height model (CHM) information and served as validation data. This exemplifies how the synthetic dataset in SiDroForest (van Geffen et al., 2021a) could be used for analysis as the Mask R-CNN is trained with a COCO-format dataset.
For the United States, the National Ecological Observatory Network (NEON) provides a 100-million individual tree-crown dataset covering a large area and standardized lidar remote-sensing data (Weinstein et al., 2021) created using machine-learning tools such as DeepForest (Weinstein et al., 2019). Here, a CHM was used to filter out all canopy tops over 3 m in height from 37 different NEON sites. The individual tree crowns in Weinstein et al. (2021) are represented by a bounding box shapefile that approximates the crown area and links it to the tree attributes. The SiDroForest tree-crown dataset cannot cover a comparably large area as the NEON airborne lidar data collection extending over 1 km × 1 km tiles, and used RGB point-cloud products and not lidar-derived CHMs. However, the SiDroForest tree-crown dataset provides 19 342 automatically detected tree-crown polygons in the form of a crown-delineating polygonal shape enriched with attributes offering plot-size coverage of tree crowns with useful data for machine learning and computer vision applications. The tree-crown extraction with 19 342 tree crowns is not complete – what we addressed assigning quality scores to the products. Brieger et al. (2019) also report a weak correlation between observed and detected crown diameters (mean R2 = 0.46, mean RMSE = 0.673 m, mean RMSE% = 24.9 %). We assume that is due to the reduced quality of the available field data, which are subjective estimations instead of absolute measurements and therefore could have decreasing precision with increasing tree heights. The SiDroForest tree-crown data are specifically made to detect Siberian larches in different mixtures of mixed summergreen needle-leaf and evergreen needle-leaf forest.
4.3 Upscaling using SiDroForest data types
It is increasingly common in data science and environmental science to use multiple data types within one analysis. For example, S-2 images and metadata, topography data, CHM, as well as their combinations, were used to predict growing stock volume using deep neural networks in four forestry districts in central Finland (Astola et al., 2021). Another example of the use of multiple data types in non-machine learning remote sensing is the work by Wang et al. (2020), where aboveground biomass (AGB) estimation was performed using field plots, UAV-lidar strip data, and S-2 imagery. In Wang et al. (2020), the partial-coverage UAV-lidar data were used to link ground measurements to S-2 data. These recent studies show the need for well-labeled publicly available data to link the data types together and for performance testing of remote-sensing algorithms. In these studies, the testing data preparation was undertaken within the project, e.g., Thanh Noi and Kappas (2018) compared the performance of three common machine-learning algorithms; a support vector machine (SVM), a random forest (RF) and k nearest neighbors (K-NN) on S-2 data from Vietnam. In order to validate the performance of these algorithms, the training data (training and testing samples) were collected based on the manual interpretation of the original S-2 data and high-resolution imagery obtained from Google Earth and 135 labeled land cover polygons were produced. Thanh Noi and Kappas (2018) is a good example of manually labeled data creation for a specific task and specific research area to be able to use supervised classification tools. The work done by Abdi (2020) shows a similar study that assesses the performance of four machine-learning algorithms for land cover classification of boreal forests. Here too, the validation and training data are manually created to assess the performance of the algorithms.
However, despite the increased availability of satellite missions and open-source remote-sensing data and products, challenges remain that are particular to terrestrial high-latitude ecosystems. Seasonal challenges such as the combination of snow cover over a long time of the year, a short and rapidly progressing growing season, high cloud frequency, and low sun angles pose a problem for comprehensive remote-sensing applications in the high-latitude regions (Beamish et al., 2020). The SiDroForest aims to remedy this scarcity by providing this multisource dataset, e.g., the high-quality dataset of S-2 data linked to published field inventories (van Geffen et al., 2021b). The final labels for the S-2 labeled image patches are assigned from the in situ information of multiple datasets from datasets 1 and 2 – information that can now be upscaled to larger areas by satellite image classification. By this, we assigned the labels with expert knowledge from the field data, still keeping all transparent, so that future users of these datasets can adapt the labeling to their applications, based for example on the detailed information in the tree level and plot level labeled datasets 1 and 2 that we provide in this data collection together with the S-2 labeled image patches for training.
The Yakutia field data collection covered diverse plots as seen in the vegetation classes assigned (Table 2) which may pose a problem for classification as the classes are unevenly distributed. When the fieldwork was undertaken, multiple plot sites covering different classes were preferentially recorded in close proximity to each other for time-related reasons. The time spent in fieldwork is limited and expensive and a variety of different data can be collected close to each other. The diversity of the collected fieldwork data has advantages and disadvantages for machine learning. On the one hand, it is good to have many different vegetation types covered in the field plots to log the diversity of the vegetation cover for the region. On the other hand, more ground-truth data plots in the same category will greatly improve classification of satellite data and too much diversity in the classes hinders a balanced classification. For example, label 4: Open Canopy Pine with Lichen, only occurs in one plot. Spectrally, this plot is different from the others due to the presence of the almost white-colored lichen. It was therefore important to label this plot differently from the others, even if this creates uneven and unbalanced labels.
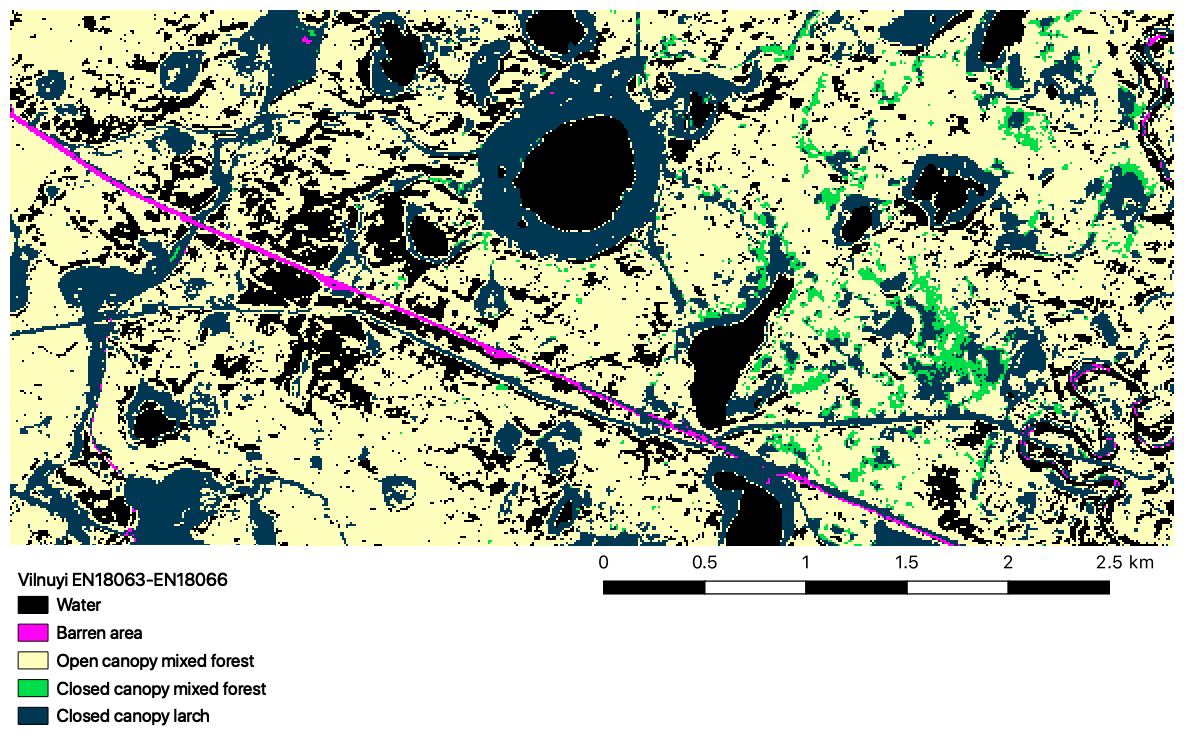
Figure 21Classification of the Sentinel-2 Vilnuyi subregion based on the vegetation labels in SiDroForest. This is an initial classification using a Naïve Bayes algorithm with additional classes: water and barren areas.
The classes assigned to the S-2 image patches were tested with simple machine-learning algorithms. The patches were extracted for both Yakutia and Chukotka and used together to classify all sites. A Gaussian Naive Bayes performed best with 82 % overall average accuracy per class for the Yakutia sites. The preliminary results for one of the Yakutia sites are shown in Fig. 21, chosen due to the diverse vegetation at the site, to show the classification potential.
4.4 SiDroForest labeling and data quality
Labeling accurately is one of the most important aspects for a usable dataset for machine-learning purposes. If the labels are inconsistent or very uneven, the classification tools will have trouble correctly identifying the classes. The SiDroForest data collection contains a variety of labels per dataset.

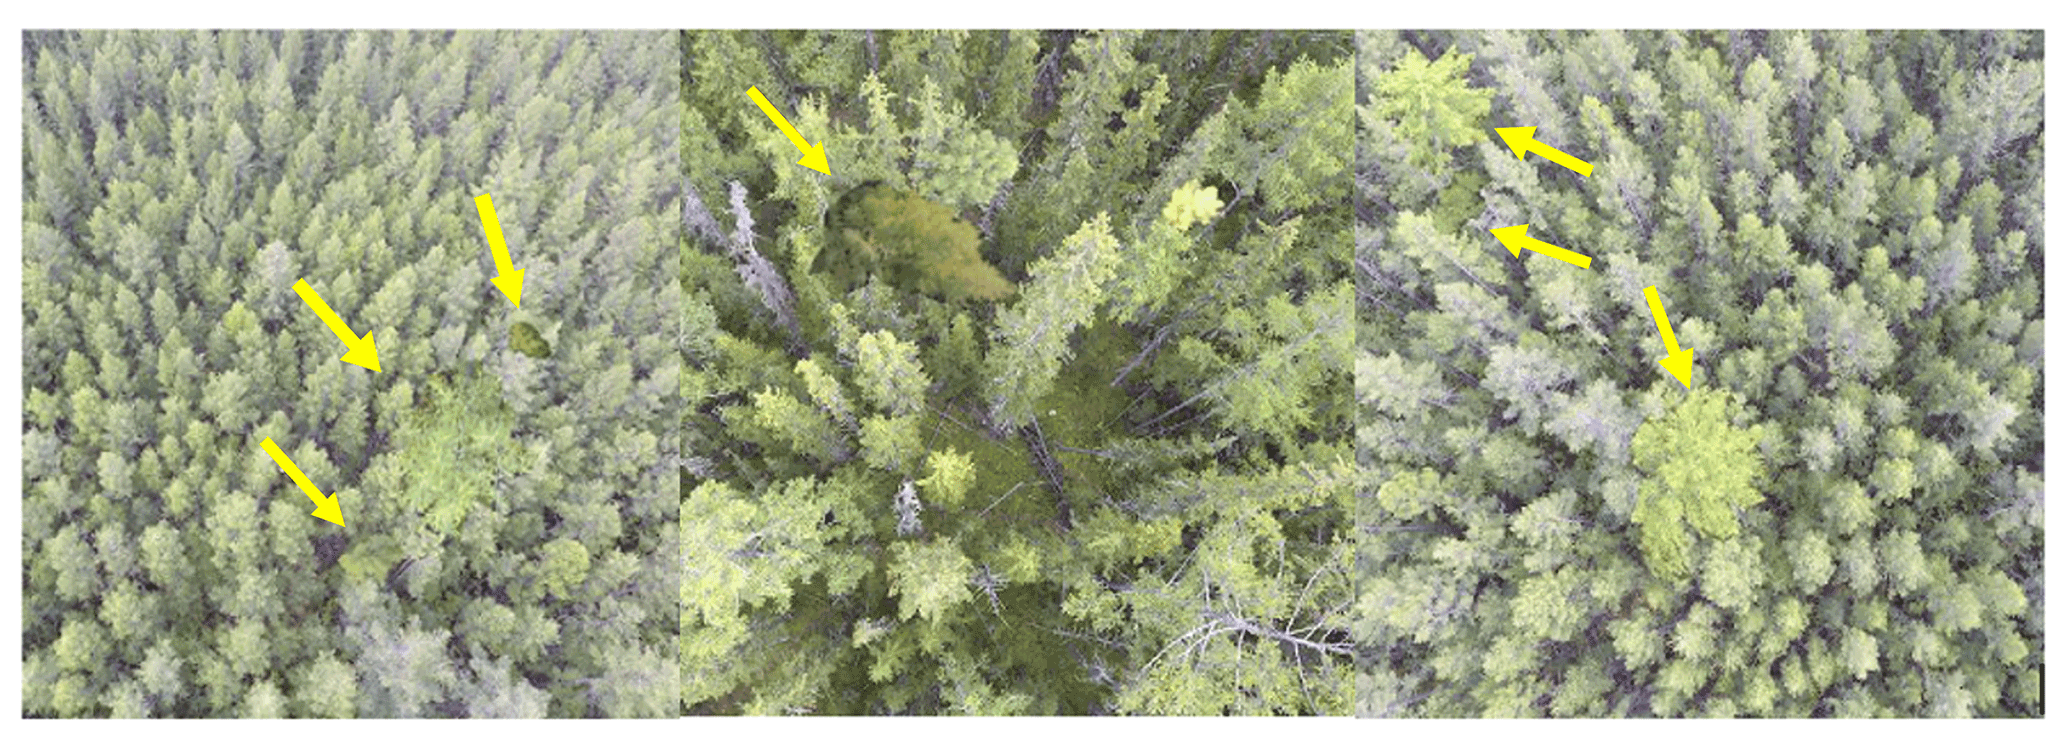
Figure 23Examples of unnatural-looking generated images in the synthetic image dataset, the red arrows show the cutout larch trees that were placed over the UAV images.
The labels for the Individual Labeled Tree dataset (van Geffen et al., 2021c) contain information on species and location of the individual tree or shrub. These data have been verified and checked, yet in some instances two trees are located very close to each other or the location was not recorded correctly in the field and an individual tree or shrub could not be found in that case. The difference between the number of trees recorded in the field and located in the orthomosaics can be seen in Fig. 15. The UAV images were inspected based on expert knowledge to locate the trees as accurately as possible. However, dense forest plots in Yakutia posed a problem for locating all the individuals correctly and not all individuals recorded in the field could be located in the orthoimages for those plots. Figure 22 shows an example of dense forest plots.
The SiDroForest synthetic dataset (van Geffen et al., 2021a) has written labels in the JSON format (Table A2) that contain the higher category, or “super category” “Tree”, and subcategory “Larch”. The two categories exist in case there are more species added under the higher-level label “Tree”. The current set identifies all larch trees, regardless of which species, since the sites covered contain two larch species: Larix cajanderi and Larix gmelinii. The two species of larch here only have the one label larch because the aim was to identify all larch trees in both Chukotka (solely Larix cajanderi) and Yakutia (predominantly Larix gemelinii). It would be an enhancement of the dataset in the future to distinguish between the two species of Larix in the labels as well. The dataset can be further enhanced by adding the other dominant tree species for the region: spruce and pine.
The backgrounds were carefully selected for the synthetic dataset to create diverse scenes and forest information for the algorithm to learn from. This can help the algorithm detect larch trees on multiple backgrounds. However, it may also introduce noise into the dataset. As investigated by Xiao et al. (2020), on the one hand, there is evidence that models succeed by using background correlations but on the other hand, advances in classifiers have given rise to models that use foregrounds more effectively and are more robust to changes in the background. These findings suggest that the performance of the algorithm is more important than the consistency of the backgrounds in a dataset. However, it is still important to be aware of such interference, and extensive benchmarking is needed to evaluate the performance of an instance segmentation or object-detection algorithm for the dataset, which we are planning to undertake.
The dataset also contains generated RGB images that should contain natural looking scenes. In practice, not all the RGB images look as natural as others (for example, parts of images in Fig. 23). The unnatural image construction is mostly due to variation in size compared to the images placed on them. Since there are 10 000 images in the dataset, these unnatural images do not strongly undermine the natural ones and make up less than 10 % of the total images.
The SiDroForest data collection also provides labeled S-2 satellite image patches per vegetation plot (van Geffen et al., 2021b) that can be used as ground-truth data for machine-learning classifications. Though freely available and operationally downloadable, S-2 data are not ready-to-use. Despite a frequent acquisition rate at higher latitudes, S-2 data often contain clouds and finding a cloud- and haze-free acquisition can take time, even with cloud filtering. It is common practice that users produce labeled patches of satellite data that function as parameterization for classification and upscaling purposes. For example, BigEarthNet (Sumbul et al., 2019) is a large-scale open-source dataset that provides labeled S-2 image patches (now called BigEarthNet-S2, previously BigEarthNet) acquired between June 2017 and May 2018 over 10 countries. Each patch includes a JSON file with the ground-cover labels for the patch. In accordance with the structure of BigEarthNet-S2, the SiDroForest image patches are also accompanied by a JSON file that contains the class labels per image patch. The BigEarthNet-S2 provides patches of larger area coverage to represent “landscapes” such as estuaries. The purpose of the SiDroForest S-2 image patches and labels lies in the true representation of vegetation classes and evergreen needle-leaf mixed forest and the seasonal time stamps of early summer, peak summer, and late summer.
In its current stage, the SiDroForest S-2 data collection is not published with performance testing, and we do not consider it to be a benchmark dataset for remote-sensing image interpretation (e.g., Long et al., 2020). The SiDroForest labeled S-2 image patches collection is available as a small training and validation dataset providing so far underrepresented vegetation categories, that will save future users time when attempting to classify vegetation of central Siberian and eastern Siberian boreal forests.
All four datasets of the SiDroForest data collection are published in the PANGAEA data repository and are available for download:
- i.
UAV-SfM point clouds, point-cloud products, and orthoimages: https://doi.org/10.1594/PANGAEA.933263 (Kruse et al., 2021b),
- ii.
Individually labeled trees: https://doi.org/10.1594/PANGAEA.932821 (van Geffen et al., 2021c),
- iii.
Synthetically created tree-crown dataset: https://doi.org/10.1594/PANGAEA.932795 (van Geffen et al., 2021a),
- iv.
Sentinel-2 labeled image patches: https://doi.org/10.1594/PANGAEA.933268 (van Geffen et al., 2021b).
The circumboreal forests are covering large areas on the globe. Every new forest dataset collected, processed further, and published in a ready-to-use format for a wide range of biological and ecological applications is therefore quite rare and an important addition for scientific studies that aim to better understand global forest dynamics.
The datasets presented here provide a comprehensive overview of the vegetation structure of boreal forest using a variety of data types. The fieldwork locations are the anchors that bind all the data types in this data collection together. The datasets include fieldwork information from vegetation plots and UAV acquisitions from extensive field expeditions in summer 2018 covering the tundra–taiga and summergreen–evergreen forest transition zones in Chukotka and central Yakutia in eastern Siberia. The data collection spans from forest inventories at the species level, tree height information and density for each vegetation plot, UAV-derived SfM point clouds that provide structural forest information, RGB and RGN orthoimages from the plots, to S-2 image patches of seasonal information annotated with vegetation categories that can be used for upscaling purposes to a larger region.
Combining the data types within SiDroForest can lead to a better understanding of forest structures and vegetation composition. The future states of boreal forest are still largely unpredictable: labeled field data and remote-sensing data provide the tools for applications based on machine learning to help forecast likely scenarios.
The increased use of machine-learning techniques in the field of remote sensing and forest analyses calls for more and better labeled data. If forest structure data are rarely available for the tundra–taiga and summergreen–evergreen transition zones, even less is available that can be used for machine learning, such as optimized data containing labeled vegetation. In addition, due to the remote nature of the dataset locations, obtaining ground-truth data is difficult and expensive. The current data collection provides rare data on the central Yakutian and northeastern Siberian land cover, optimized on larch forest across the evergreen–summergreen transition zone and the northern treeline. Adding future similar datasets derived from the Northern American boreal domain will consistently enlarge and encompass more tree species and forest types in the upcoming years. By making this data collection open source, we aim to remedy data scarcity on tree-level forest data for the region and we encourage the use of the labeled tree-level and plot-level forest datasets presented here for further analyses and machine-learning tasks.

Figure A1Sampling scheme of the 2018 expedition vegetation survey. Projective cover of tall shrubs and trees was estimated on a circular sample plot with a radius of 15 m (after Shevtsova et al., 2020b).
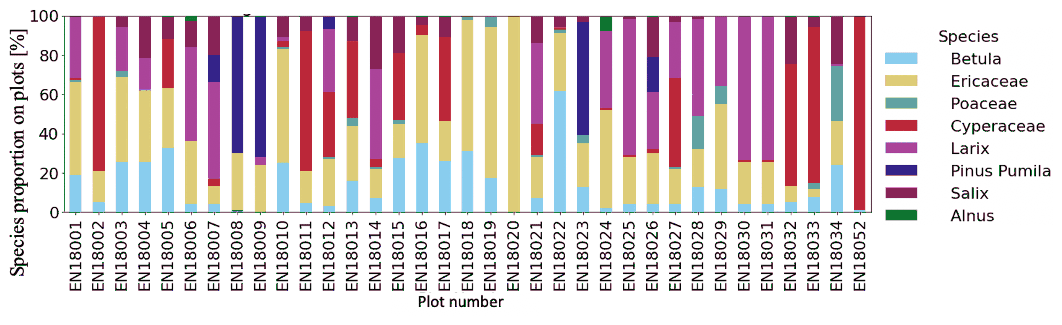
Figure A2Percentage vegetation cover per plot in Chukotka for all recorded vegetation in the plots.
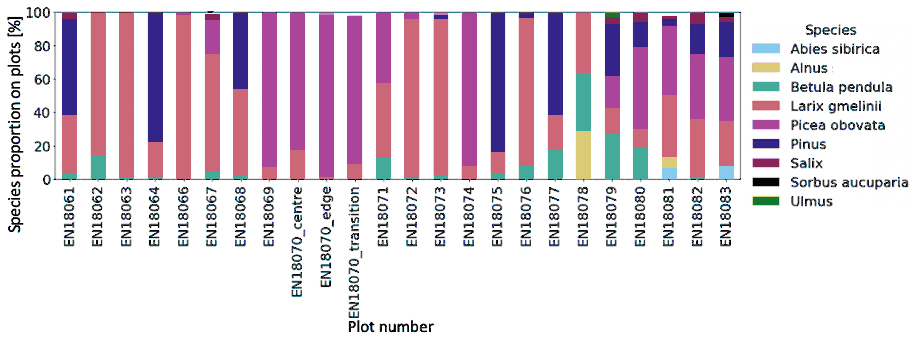
Figure A3Percentage vegetation cover per plot in Yakutia for only large shrubs and trees (> 1.3 m).

Figure A4SiDroForest unmanned aerial vehicle (UAV) data acquisition and flight pattern consisting of a double grid (blue) and a circular mission (orange). The two 15 m long grid lines (red) divide the plot area into four quadrants of similar size (yellow). From Brieger et al. (2019).
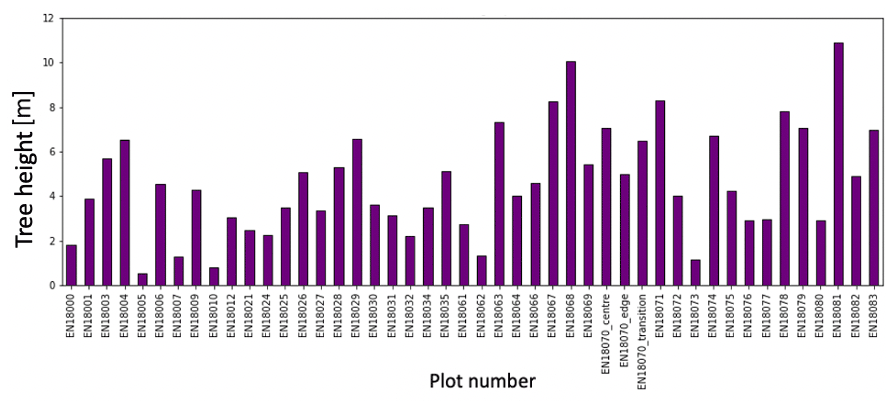

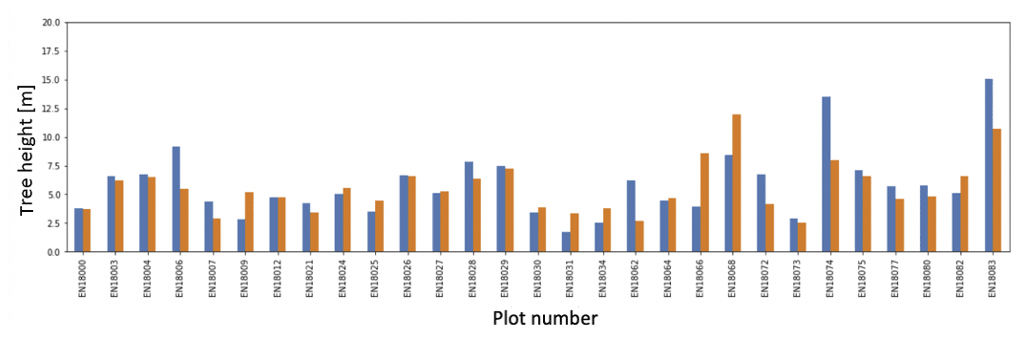
Figure A7Mean heights for trees and shrubs below 1.3 m for unmanned aerial vehicle (UAV)-derived heights (blue) and fieldwork-derived heights (orange).
Table A1An overview of the plots, the latitude and longitude of the central coordinates, the site name, the region (Chukotka or Yakutia), the visiting date of the vegetation plot in the field in 2018, and the vegetation class (used as labels for the 30 m × 30 m S2-patches, Table 2).

1 = Graminoid tundra; 2 = Forest tundra and shrub tundra; 3 = Prostrate herb tundra; 4 = Open canopy pine with lichen; 5 = Open canopy pine; 6 = Closed canopy pine; 7 = Open canopy mixed forest; 8 = Closed canopy mixed forest; 9 = Open canopy Larch; 10 = Closed canopy Larch; 11 = Closed canopy spruce
Table A2Example of common objects in context (COCO) style annotation labels for the masks (1) and images (2).
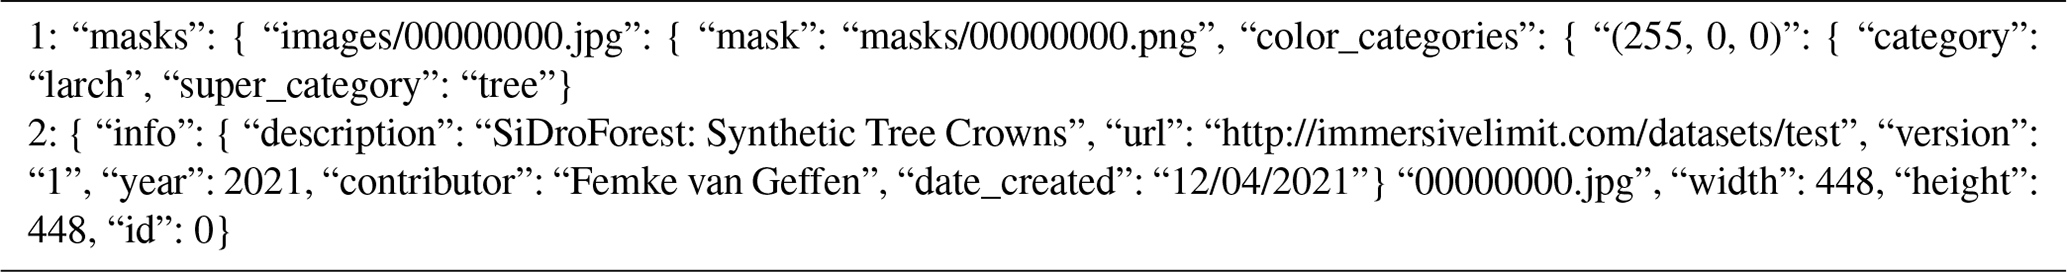
Table A3Overview of Sentinel-2 spectral bands, spatial resolution, and the central wavelength.
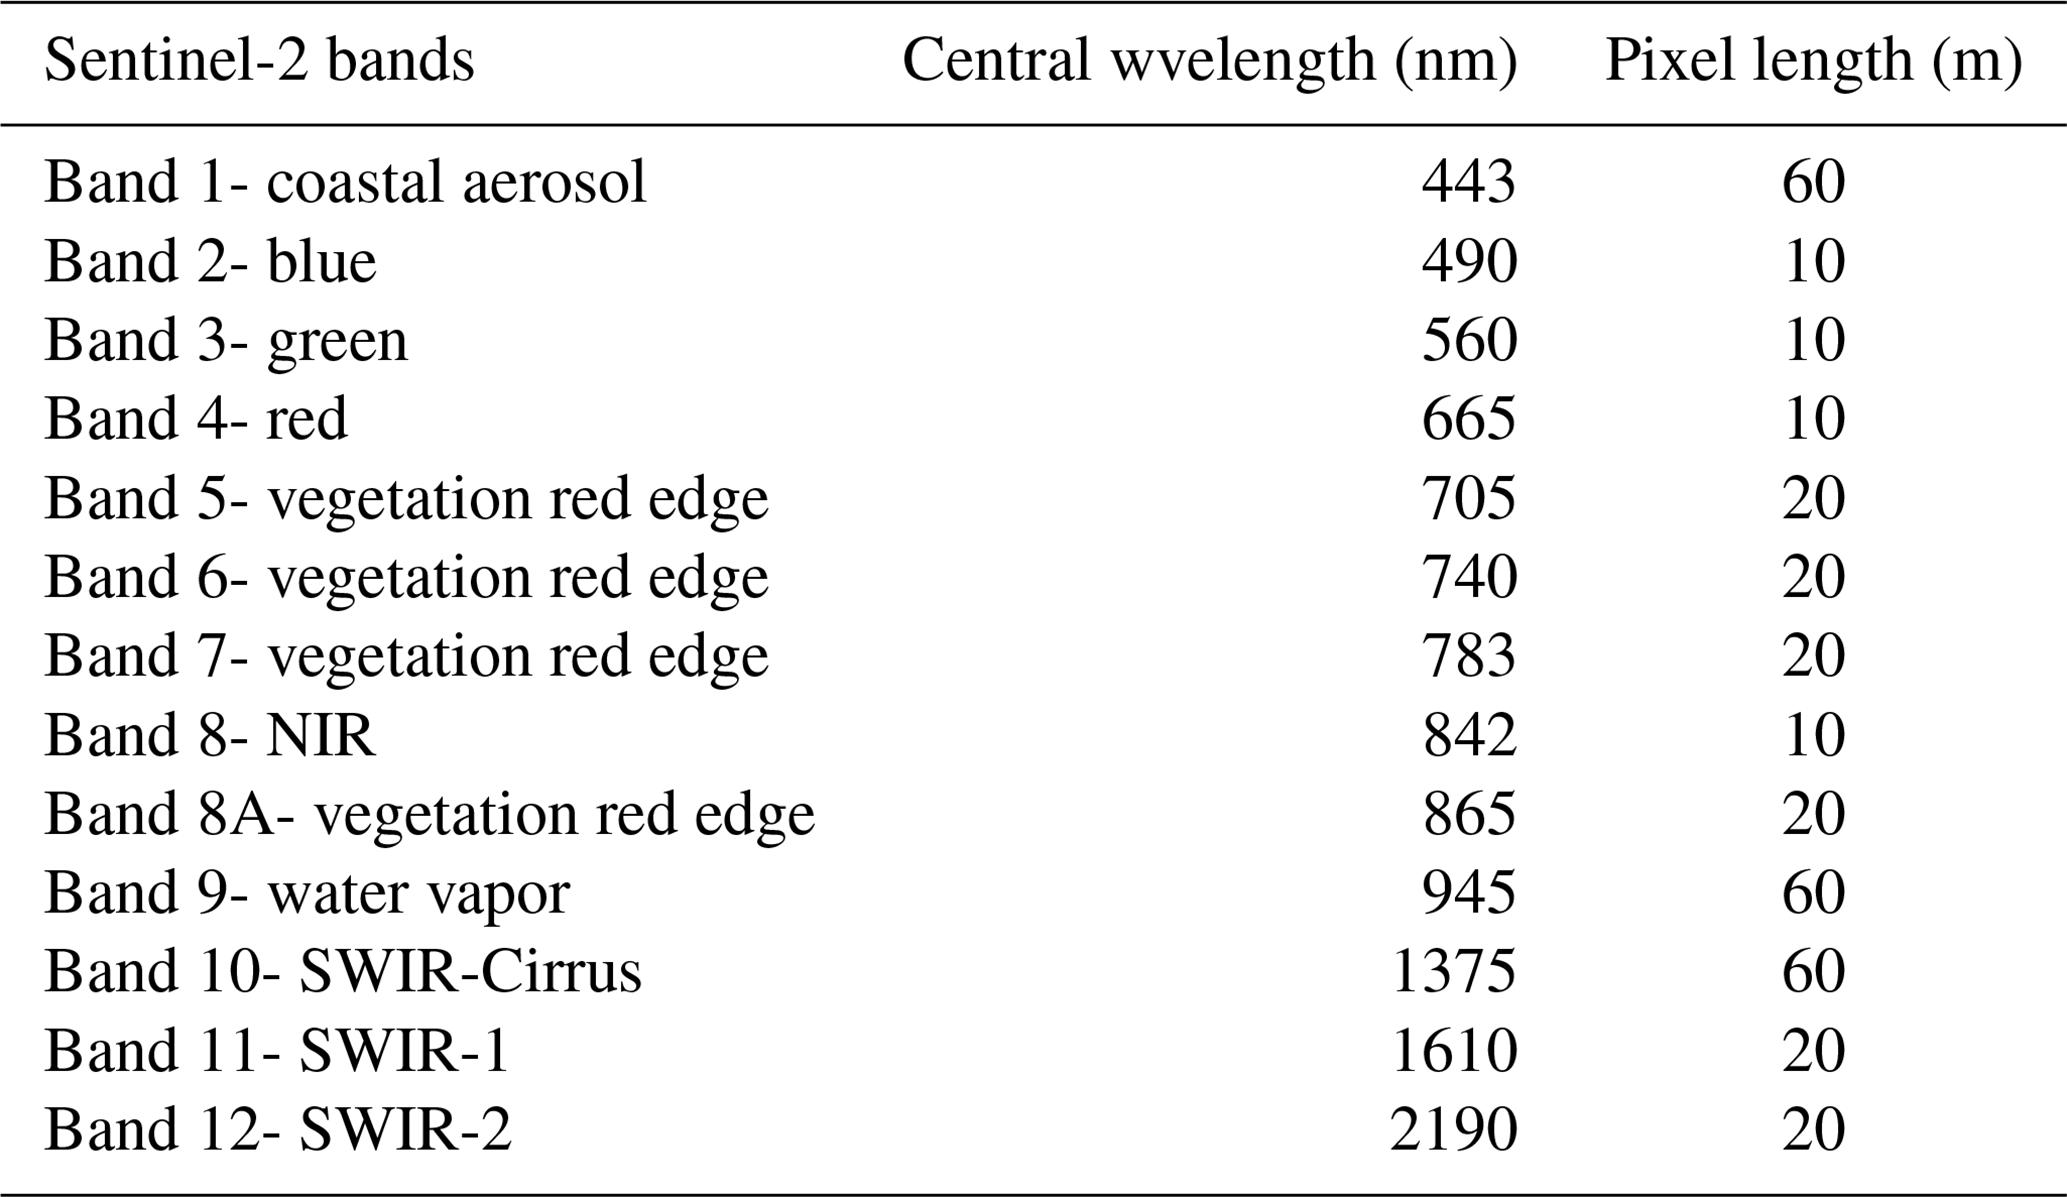
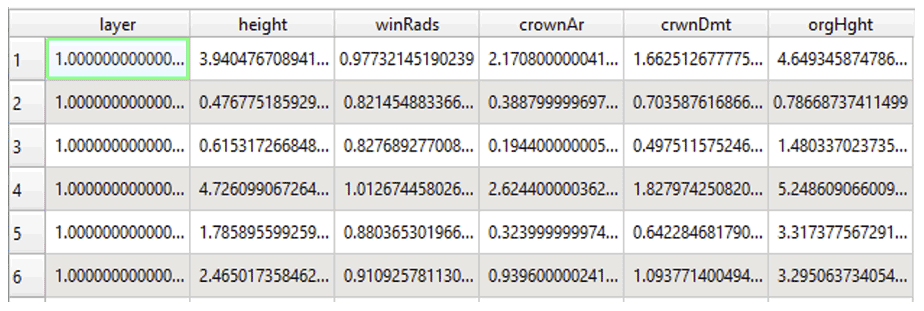
Figure A8Screenshot of the crowns_polygon shapefile attribute table for plot EN18077 as an example. Height: tree height in meters as identified with the tree-top finding algorithm, crownAr: area of the tree crown in square meters, CrwnDmt: simplification of the crown diameter in meters assuming a circular crown, orgHght: maximum height value in meters recorded in the canopy height model (CHM) under the total crown polygon.
FvG is the leading author of this manuscript and of most of the related data publications in the PANGAEA data repository. FvG wrote the manuscript together with SK, BH, and UH. LAP and ESZ organized and facilitated the data collection for the expedition in Siberia and took part in the fieldwork. The majority of vegetation-related ground fieldwork was performed by IAS, LS, SS, EIT, NB, UH, FB and SK. SK and FB undertook the data processing and together with assistants constructed the products for the orthomosaics dataset, including the point-cloud products. RG and FvG supplemented the orthomosaics dataset and assigned vegetation labels to the plots based on vegetation classes by IAS. BH and BP processed the Sentinel-2 dataset. FvG created the synthetics dataset and identified the individuals in the individually labeled trees dataset. FvG cleaned, compiled, and constructed all four final datasets under supervision of SK as lead scientist on this project.
Birgit Heim is topical editor of ESSD.
Publisher's note: Copernicus Publications remains neutral with regard to jurisdictional claims in published maps and institutional affiliations.
The SiDroForest data collection was created as part of a PhD project within the context of the HEIBRiDS graduate school. We thank our Russian and German colleagues from the joint Russian–German expedition 2018 for support in the field. Special thanks to the staff of the BIOM-laboratory in Yakutsk for their great overall support and scientific contributions. We thank Guido Grosse and Thomas Laepple (AWI) who provided us with computational resources for the point-cloud reconstruction from UAV-based data. We greatly thank the three anonymous reviewers, everyone at ESSD who supported us, and our topical editor Yuyu Zhou for helping us to improve the manuscript.
This research has been supported by the ERC consolidator grant Glacial Legacy of Ulrike Herzschuh (grant no. 772852).
This paper was edited by Yuyu Zhou and reviewed by four anonymous referees.
Abdi, A. M.: Land cover and land use classification performance of machine learning algorithms in a boreal landscape using Sentinel-2 data, GISci Remote Sens., 57, 1–20, https://doi.org/10.1080/15481603.2019.1650447, 2020.
ABoVE Science Definition Team: A Concise Experiment Plan for the Arctic-Boreal Vulnerability Experiment, ORNL DAAC, Oak Ridge, Tennessee, USA, [data set], https://doi.org/10.3334/ORNLDAAC/1617, 2014.
Agisoft LLC: Agisoft PhotoScan Professional, Version 1.4.3; Agisoft LLC: St. Petersburg, Russia, 2018.
Alexander, H., Paulson, A., DeMarco, J., Hewitt, R., Lichstein, J., Loranty, M., Mack, M., McEwan, R., Borth, E., Frankenberg, S., and Robinson, S.: Fire influences on forest recovery and associated climate feedbacks in Siberian Larch Forests, Russia, 2018–2019, Arctic Data Center, https://doi.org/10.18739/A2XG9FB90, 2020.
Astola, H., Seitsonen, L., Halme, E., Molinier, M., and Lönnqvist, A.: Deep Neural Networks with Transfer Learning for Forest Variable Estimation Using Sentinel-2 Imagery in Boreal Forest, Remote Sens.-Basel, 13, 2392, https://doi.org/10.3390/rs13122392, 2021.
Beamish, A., Raynolds, M. K., Epstein, H., Frost, G. V., Macander, M. J., Bergstedt, H., Bartsch, A., Kruse, S., Miles, V., Tanis, C. M, Heim, B., Fuchs, M., Chabrillat, S., Shevtsova, I., Verdonen, M., and Wagner, J.: Recent trends and remaining challenges for optical remote sensing of Arctic tundra vegetation: A review and outlook, Remote Sens. Environ., 246, 111872, https://doi.org/10.1016/j.rse.2020.111872, 2020.
Bonan, G. B.: Forests and Climate Change: Forcings, Feedbacks, and the Climate Benefits of Forests, Science, 320, 1444–1449, https://doi.org/10.1126/science.1155121, 2008.
Braga, J. R. G., Peripato, V., Dalagnol, R. P., Ferreira, M., Tarabalka, Y. O. C., Aragão L. E. F., de Campos Velho, H., Shiguemori, E. H., and Wagner, F. H.: Tree Crown Delineation Algorithm Based on a Convolutional Neural Network, Remote Sens.-Basel, 12, 1288, https://doi.org/10.3390/rs12081288, 2020.
Brieger, F., Herzschuh, U., Pestryakova, L. A., Bookhagen, B., Zakharov, E. S., and Kruse, S.: Advances in the derivation of Northeast Siberian forest metrics using high-resolution UAV-based photogrammetric point cloud, Remote Sens.-Basel, 11, 1447, https://doi.org/10.3390/rs11121447, 2019.
CAVM Team: Circumpolar arctic vegetation map ( scale). Conservation of Arctic Flora and Fauna (CAFF) Map No. 1, US Fish and Wildlife Service, Anchorage, AK, 2003.
Chave, J., Davies, S. J., Phillips, O. L., Lewis, S. L., Sist, P., Schepaschenko, D., Armston, J., Baker, T. R., Coomes, D., Disney, M., Duncanson, L., Hérault, B., Labrière, N., Meyer, V., Réjou-Méchain, M., Scipal, K., and Saatchi, S.: Ground Data are Essential for Biomass Remote Sensing Missions, Surv. Geophys., 40, 863–880, https://doi.org/10.1007/s10712-019-09528-w, 2019.
CloudCompare: CloudCompare, version 2.10, GPL software, [software], http://www.cloudcompare.org/ (last access: 7 July 2021), 2022.
Copernicus: Copernicus Digital Elevation Model Product Handbook: https://spacedata.copernicus.eu/documents/20126/0/GEO1988-CopernicusDEM-SPE-002_ProductHandbook_I4.0.pdf/849f4329-873d-50f4-652c-57490de7b9aa?t=1656003026551 (last access: 21 January 2021), 2021.
ESA (European Space Agency): Sentinel-2 User Handbook, Issue 1.2, 64 pp, 2015.
ESA (European Space Agency): Sentinel-2 S2MPC, Sen2Cor Software Release Note, S2-PDGS-MPC-L2A-SRN-V2.9.0, 30 November 2020, Sen2Cor v2.9 – STEP, https://www.esa.int (last access 6 May 2021), 2021.
Fraser, R. H., Olthof, I., Lantz, T. C., and Schmitt, C.: UAV photogrammetry for mapping vegetation in the low-Arctic, Arctic Science, 2, 79–102, https://doi.org/10.1139/as-2016-0008, 2016.
Hao, Z., Lin, L., Post, C. J., Mikhailova, E. A., Li, M., Chen, Y., and Liu, J.: Automated tree-crown and height detection in a young forest plantation using mask region-based convolutional neural network (Mask R-CNN), ISPRS J Photogramm., 178, 112–123, https://doi.org/10.1016/j.isprsjprs.2021.06.003, 2021.
He, K., Gkioxari, G., Dollár, P., and Girshick, R.: Mask R-CNN, 2017 IEEE International Conference on Computer Vision (ICCV), 2980–2988, Venice, Italy, 22–29 October 2017, https://doi.org/10.1109/ICCV.2017.322, 2017.
Herzschuh, U.: Legacy of the Last Glacial on the present-day distribution of deciduous versus evergreen boreal forest, Global Ecol. Biogeogr., 29, 198–206, https://doi.org/10.1111/geb.13018, 2020.
Jensen, J. L. R. and Mathews, A. J.: Assessment of image-based point cloud products to generate a bare earth surface and estimate canopy heights in a woodland ecosystem, Remote Sens.-Basel, 8, 50, https://doi.org/10.3390/rs8010050, 2016.
Kelley, A.: Complete Guide to Creating COCO Datasets, GitHub repository [code], https://github.com/akTwelve/cocosynth (last access: 30 July 2019), 2019.
Kruse, S., Bolshiyanov, D., Grigoriev, M. N., Morgenstern, A., Pestryakova, L., Tsibizov, L., and Udke, A.: Russian-German Cooperation: Expeditions to Siberia in 2018, Reports on Polar and Marine Research, Alfred Wegener Institute for Polar and Marine Research, 734, 257 p., https://doi.org/10.2312/BzPM_0734_2019, 2019a.
Kruse, S., Herzschuh, U., Stünzi, S., Vyse, S., and Zakharov, E.: Sampling mixed species boreal forests affected by disturbances and mountain lake mountain lake and alas lake coring in Central Yakutia, in: Russian–German Cooperation: Expeditions to Siberia in 2018, Reports on polar and marine research (148–153), edited by: Kruse, S., Bolshiyanov, D., Grigoriev, M. N., Morgenstern, A., Pestryakova, L., Tsibizov, L., and Udke, A., Alfred Wegener Institute for Polar and Marine Research, Bremerhaven, https://doi.org/10.2312/BzPM_0734_2019, 2019b.
Kruse, S., Herzschuh, U., Schulte, L., Stuenzi, S. M., Brieger, F., Zakharov, E. S., and Pestryakova, L. A.: Forest inventories on circular plots on the expedition Chukotka 2018, NE Russia, PANGAEA [data set], https://doi.org/10.1594/PANGAEA.923638, 2020a.
Kruse, S., Farkas, L., Brieger, F., Geng, R., Heim, B., Pestryakova, L. A., Herzschuh, U., and van Geffen, F.: SiDroForest: Orthomosaics, SfM point clouds and products from aerial image data of expedition vegetation plots in 2018 in Central Yakutia and Chukotka, Siberia, PANGAEA [data set], https://doi.org/10.1594/PANGAEA.933263, 2021.
Lin, T. Y., Maire, M., Belongie, S., Hays, J., Perona, P., Ramanan, D., and Zitnick, C. L.: Microsoft COCO: Common objects in context, in: European Conference on Computer Vision, 6–12 September 2014, 740–755, Springer, Cham, 2014.
Long, Y., Xia, G. S., Li, S., Yang, W., Yang, M., Y., Zhu, X. X., Zhang, L., and Li, D.: DiRS: On Creating Benchmark Datasets for Remote Sensing Image Interpretation, CoRR, arXiv [preprint], https://doi.org/10.48550/arXiv.2006.12485, 2020.
Loranty, M. M., Abbott, B. W., Blok, D., Douglas, T. A., Epstein, H. E., Forbes, B. C., Jones, B. M., Kholodov, A. L., Kropp, H., Malhotra, A., Mamet, S. D., Myers-Smith, I. H., Natali, S. M., O'Donnell, J. A., Phoenix, G. K., Rocha, A. V., Sonnentag, O., Tape, K. D., and Walker, D. A.: Reviews and syntheses: Changing ecosystem influences on soil thermal regimes in northern high-latitude permafrost regions, Biogeosciences, 15, 5287–5313, https://doi.org/10.5194/bg-15-5287-2018, 2018.
MacDonald, G. M., Kremenetski, K. V., and Beilman, D. W.: Climate change and the northern Russian treeline zone, Philos. T. R. Soc. B, 363, 2283–2299, https://doi.org/10.1098/rstb.2007.2200, 2007.
Maguire, A. J., Eitel, J., Vierling, L., Boelman, N., Griffin, K., Jennewein, J. S., and Jensen, J. E.: ABoVE: Terrestrial Lidar Scanning Forest-Tundra Ecotone, Brooks Range, Alaska, 2016, ORNL DAAC, Oak Ridge, Tennessee, USA, [data set], https://doi.org/10.3334/ORNLDAAC/1782, 2020.
Mamet, S. D., Brown, C. D., Trant, A. J., and Laroque, C. P.: Shifting global Larix distributions: Northern expansion and southern retraction as species respond to changing climate, J. Biogeogr., 46, 30–44, https://doi.org/10.1111/jbi.13465, 2019.
Miesner, T., Herzschuh, U., Pestryakova, L. A.,; Wieczorek, M., Kolmogorov, A., Heim, B., Zakharov, E. S., Shevtsova, I., Epp, L. S., Niemeyer, B., Jacobsen, I., Schröder, J., Trense, D., Schnabel, E., Schreiber, X., Bernhardt, N., Stuenzi, S. M., Brieger, F., Schulte, L., Smirnikov, V., Gloy, J., von Hippel, B., Jackisch, R., and Kruse, S.: Tree data set from forest inventories in north-eastern Siberia, PANGAEA [data set], https://doi.org/10.1594/PANGAEA.943547, 2022.
Montesano, P. M., Nelson, R. F., Dubayah, R. O., Sun, G., Cook, B. D., Ranson, K. J. R., and Kharuk, V.: The uncertainty of biomass estimates from LiDAR and SAR across a boreal forest structure gradient, Remote Sens. Environ., 154, 398–407, https://doi.org/10.1016/j.rse.2014.01.027, 2014.
Montesano, P. M., Neigh, C. S., Sexton, J., Feng, M., Channan, S., Ranson, K. J., and Townshend, J. R.: Calibration and validation of Landsat tree cover in the taiga–tundra ecotone. Remote Sens.-Basel, 8, 551, https://doi.org/10.3390/rs8070551, 2016.
Panagiotidis, D., Abdollahnejad, A., Surový, P., and Chiteculo, V.: Determining tree height and crown diameter from high-resolution UAV imagery, Int J. Remote Sens., 38, 2392–2410, https://doi.org/10.1080/01431161.2016.1264028, 2017.
Plowright, A.: ForestTools: Analyzing Remotely Sensed Forest Data, R Package Version 0.2.0., https://github.com/andrew-plowright/ForestTools (last access: 17 May 2019), 2018.
R Core Team: R: A language and environment for statistical computing, R Foundation for Statistical Computing, Vienna, Austria, [software], https://www.R-project.org/ (last access: 6 April 2020), 2020.
Rees, W. G., Hofgaard, A., Boudreau, S., Cairns, D. M., Harper, K., Mamet, S., and Tutubalina, O.: Is subarctic forest advance able to keep pace with climate change?, Glob. Change Biol., 26, 3965–3977, https://doi.org/10.1111/gcb.15113, 2020.
Schepaschenko, D., Shvidenko, A., Usoltsev, V., Lakyda, P., Luo, Y., Vasylyshyn, R., Lakyda, I., Myklush, Y., See, L., McCallum, I., Fritz, S., Kraxner, F., and Obersteiner, M.: A dataset of forest biomass structure for Eurasia, Scientific Data, 4, 170070, https://doi.org/10.1038/sdata.2017.70, 2017.
Schepaschenko D., Chave J., Phillips O. L., Lewis S. L., Davies S. J., Réjou-Méchain M., Sist P., and Scipal K.: The Forest Observation System, building a global reference dataset for remote sensing of forest biomass, Scientific Data, 6, 198, https://doi.org/10.1038/s41597-019-0196-1, 2019.
Schepaschenko, D., Moltchanova, E., Fedorov, S., Karminov, V., Ontikov, P., Santoro, M., See, L., Kositsyn, V., Shvidenko, A., Romanovskaya, A., Korotkov, V., Lesiv, M., Bartalev, S., Fritz, S., Shchepashchenko, M., and Kraxner, F.: Russian forest sequesters substantially more carbon than previously reported, Sci. Rep.-UK, 11, 12825, https://doi.org/10.1038/s41598-021-92152-9, 2021.
Shevtsova, I., Herzschuh, U., Heim, B., Kruse, S., Schröder, J., Troeva, E., Pestryakova, L. A., and Zakharov, E. S.: Foliage projective cover of 57 vegetation sites of central Chukotka from 2016, PANGAEA [data set], https://doi.org/10.1594/PANGAEA.908570, 2019.
Shevtsova, I., Heim, B., Kruse, S., Schröder, J., Troeva, E., Pestryakova, L. A., Zakharov, E. S., and Herzschuh, U.: Strong shrub expansion in tundra-taiga, tree infilling in taiga and stable tundra in central Chukotka (north-eastern Siberia) between 2000 and 2017, Environ. Res. Lett., 15, https://doi.org/10.1088/1748-9326/ab9059, 2020a.
Shevtsova, I., Kruse, S., Herzschuh, U., Schulte, L., Brieger, F., Stuenzi, S. M., Heim, B., Troeva, E. I., Pestryakova, L. A., and Zakharov, E. S.: Foliage projective cover of 40 vegetation sites of central Chukotka from 2018, PANGAEA [data set], https://doi.org/10.1594/PANGAEA.923664, 2020b.
Shevtsova, I., Kruse, S., Herzschuh, U., Schulte, L., Brieger, F., Stuenzi, S. M., Heim, B., Troeva, E. I., Pestryakova, L. A., and Zakharov, E. S.: Total above-ground biomass of 39 vegetation sites of central Chukotka from 2018, PANGAEA [data set], https://doi.org/10.1594/PANGAEA.923719, 2020c.
Shevtsova, I., Herzschuh, U., Heim, B., Schulte, L., Stünzi, S., Pestryakova, L. A., Zakharov, E. S., and Kruse, S.: Recent above-ground biomass changes in central Chukotka (Russian Far East) using field sampling and Landsat satellite data, Biogeosciences, 18, 3343–3366, https://doi.org/10.5194/bg-18-3343-2021, 2021.
Simard, M., Pinto, N., Fisher, J. B., and Baccini, A.: Mapping Forest canopy height globally with spaceborne lidar, J. Geophys. Res, 116, G04021, https://doi.org/10.1029/2011JG001708, 2011.
Sumbul. G., Charfuelan, M., Demir, B., and Markl, V.: BigEarthNet: A Large-Scale Benchmark Archive for Remote Sensing Image Understanding, IEEE International Geoscience and Remote Sensing Symposium, Yokohama, Japan, 2 July–2 August 2019, 5901–5904, 2019.
Thanh Noi, P. and Kappas, M.: Comparison of Random Forest, k-Nearest Neighbor, and Support Vector Machine Classifiers for Land Cover Classification Using Sentinel-2 Imagery, Sensors, 18, https://doi.org/10.3390/s18010018, 2018.
The GIMP Development Team: GIMP, retrieved from https://www.gimp.org (last access: 20 January 2020), 2019.
Troeva, E. I., Isaev, A. P., Cherosov, M. M., and Karpov, N. S. (Eds.): The Far North: Plant Biodiversity and Ecology of Yakutia, Vol. 3. Springer Science & Business Media, ISBN 9789400731936, 2010.
van Geffen, F., Brieger, F., Pestryakova, L. A., Herzschuh, U., and Kruse, S.: SiDroForest: Synthetic Siberian Larch Tree Crown Dataset of 10 000 instances in the Microsoft's Common Objects in Context dataset (coco) format, PANGAEA [data set], https://doi.org/10.1594/PANGAEA.932795, 2021a.
van Geffen, F., Geng, R., Pflug, B., Kruse, S., Pestryakova, L. A, Herzschuh, U., and Heim, B.: SiDroForest: Sentinel-2 Level-2 Bottom of Atmosphere labelled image patches with seasonal information for Central Yakutia and Chukotka vegetation plots (Siberia, Russia), PANGAEA [data set], https://doi.org/10.1594/PANGAEA.933268, 2021b.
van Geffen, F., Schulte, L., Geng, R., Heim, B., Pestryakova, L. A., Herzschuh, U., and Kruse, S.: SiDroForest: Individual-labelled trees acquired during the fieldwork expeditions that took place in 2018 in Central Yakutia and Chukotka, Siberia, PANGAEA [data set], https://doi.org/10.1594/PANGAEA.932821, 2021c.
Walker, D. A., Raynolds, M. K., Daniëls, F. J., Einarsson, E., Elvebakk, A., Gould, W. A., Katenin, A. E., Kholod, S. S., Markon, C. J., Melnikov, E. S., Moskalenko, N. G., Talbot, S. S., Yurtsev, B. A., and The other members of the CAVM Team: The Circumpolar Arctic vegetation map, J. Veg. Sci., 16, 267–282, https://doi.org/10.1111/j.1654-1103.2005.tb02365.x, 2005.
Wang, D., Wan, B., Liu, J., Su, Y., Guo, Q., Qiu, P., and Wu, X.: Estimating aboveground biomass of the mangrove forests on northeast Hainan Island in China using an upscaling method from field plots, UAV-LiDAR data and Sentinel-2 imagery, Int. J. Appl. Earth Obs., 85, 101986, https://doi.org/10.1016/j.jag.2019.101986, 2020.
Weinstein, B. G., Marconi, S, Bohlman, S., Zare, A., and White, E.: Individual Tree-Crown Detection in RGB Imagery Using Semi-Supervised Deep Learning Neural Networks, Remote Sens.-Basel, 11, 1309, https://doi.org/10.3390/rs11111309, 2019.
Weinstein, B. G., Marconi, S, Bohlman, S., Zare, A., Singh, A., Graves, S. J., and White, E.: A remote sensing derived data set of 100 million individual tree crowns for the National Ecological Observatory Network, eLife, 10:e62922, https://doi.org/10.7554/eLife.62922, 2021.
Xiao, K., Engstrom, L., Ilyas, A., and Madry, A.: Noise or signal: The role of image backgrounds in object recognition, arXiv [preprint], https://doi.org/10.48550/arXiv.2006.09994, 2020.
Zhang, W., Qi, J., Wan, P., Wang, H., Xie, D., Wang, X., and Yan, G.: An Easy-to-Use Airborne LiDAR Data Filtering Method Based on Cloth Simulation. Remote Sens.-Basel, 8, 501, https://doi.org/10.3390/rs8060501, 2016.