the Creative Commons Attribution 4.0 License.
the Creative Commons Attribution 4.0 License.
 | 20 Oct 2022
Carbon fluxes from land 2000–2020: bringing clarity to countries' reporting
Giacomo Grassi
Giulia Conchedda
Sandro Federici
Raul Abad Viñas
Anu Korosuo
Joana Melo
Simone Rossi
Marieke Sandker
Zoltan Somogyi
Matteo Vizzarri
Francesco N. Tubiello
Despite an increasing attention on the role of land in meeting countries' climate pledges under the Paris Agreement, the range of estimates of carbon fluxes from land use, land-use change, and forestry (LULUCF) in available databases is very large. A good understanding of the LULUCF data reported by countries under the United Nations Framework Convention on Climate Change (UNFCCC) – and of the differences with other datasets based on country-reported data – is crucial to increase confidence in land-based climate change mitigation efforts.
Here we present a new data compilation of LULUCF fluxes of carbon dioxide (CO2) on managed land, aiming at providing a consolidated view on the subject. Our database builds on a detailed analysis of data from national greenhouse gas inventories (NGHGIs) communicated via a range of country reports to the UNFCCC, which report anthropogenic emissions and removals based on the IPCC (Intergovernmental Panel on Climate Change) methodology. Specifically, for Annex I countries, data are sourced from annual GHG inventories. For non-Annex I countries, we compiled the most recent and complete information from different sources, including national communications, biennial update reports, submissions to the REDD+ (reducing emissions from deforestation and forest degradation) framework, and nationally determined contributions. The data are disaggregated into fluxes from forest land, deforestation, organic soils, and other sources (including non-forest land uses). The CO2 flux database is complemented by information on managed and unmanaged forest area as available in NGHGIs. To ensure completeness of time series, we filled the gaps without altering the levels and trends of the country reported data. Expert judgement was applied in a few cases when data inconsistencies existed.
Results indicate a mean net global sink of −1.6 Gt CO2 yr−1 over the period 2000–2020, largely determined by a sink on forest land (−6.4 Gt CO2 yr−1), followed by source from deforestation (+4.4 Gt CO2 yr−1), with smaller fluxes from organic soils (+0.9 Gt CO2 yr−1) and other land uses (−0.6 Gt CO2 yr−1).
Furthermore, we compare our NGHGI database with two other sets of country-based data: those included in the UNFCCC GHG data interface, and those based on forest resources data reported by countries to the Food and Agriculture Organization of the United Nations (FAO) and used as inputs into estimates of GHG emissions in FAOSTAT. The first dataset, once gap filled as in our study, results in a net global LULUCF sink of −5.4 Gt CO2 yr−1. The difference with the NGHGI database is in this case mostly explained by more updated and comprehensive data in our compilation for non-Annex I countries. The FAOSTAT GHG dataset instead estimates a net global LULUCF source of +1.1 Gt CO2 yr−1. In this case, most of the difference to our results is due to a much greater forest sink for non-Annex I countries in the NGHGI database than in FAOSTAT. The difference between these datasets can be mostly explained by a more complete coverage in the NGHGI database, including for non-biomass carbon pools and non-forest land uses, and by different underlying data on forest land. The latter reflects the different scopes of the country reporting to FAO, which focuses on area and biomass, and to UNFCCC, which explicitly focuses on carbon fluxes. Bearing in mind the respective strengths and weaknesses, both our NGHGI database and FAO offer a fundamental, yet incomplete, source of information on carbon-related variables for the scientific and policy communities, including under the Global stocktake.
Overall, while the quality and quantity of the LULUCF data submitted by countries to the UNFCCC significantly improved in recent years, important gaps still remain. Most developing countries still do not explicitly separate managed vs. unmanaged forest land, a few report implausibly high forest sinks, and several report incomplete estimates. With these limits in mind, the NGHGI database presented here represents the most up-to-date and complete compilation of LULUCF data based on country submissions to UNFCCC.
Data from this study are openly available via the Zenodo portal (Grassi et al., 2022), at https://doi.org/10.5281/zenodo.7190601.
- Article
(1497 KB) - Full-text XML
-
Supplement
(999 KB) - BibTeX
- EndNote


Land-based mitigation is increasingly recognised as a key strategy to reach the Paris Agreement's aim to “achieve a balance between anthropogenic emissions by sources and removals by sinks”. Global models indicate that changes in land use and land management contribute to around 12 % of the total global anthropogenic CO2 emissions (Friedlingstein et al., 2022), mainly through deforestation. Simultaneously, land uses, particularly forests, may contribute to climate change mitigation through carbon absorption (sink) and storage (stock) in biomass, dead organic matter, soil, and wood products.
Despite an increasing attention to the land use, land-use change, and forestry (LULUCF) sector under the United Nations Framework Convention on Climate Change (UNFCCC), including nature-based solutions to reduce CO2 emissions and enhance CO2 removals (e.g. Griscom et al., 2017; Roe et al., 2021), notable differences still exist among global land-related datasets, in both the magnitude of the net CO2 flux and its trend (IPCC, 2019; Harris et al., 2021; Grassi et al., 2021; Friedlingstein et al., 2022; Deng et al., 2022; Feng et al., 2022). These differences cause concern because, if not explained, they may jeopardise the confidence in LULUCF to achieve climate change mitigation.
Previous studies (Grassi et al., 2018, 2021) have analysed the reasons for large differences in land use CO2 fluxes – globally in the order of several billion tonnes (Gt) of CO2 per year – between the country submissions to UNFCCC and global models (Friedlingstein et al., 2022). There, the differences were found to be mostly due to different approaches to assess the anthropogenic forest sink.
However, while of a similar order of magnitude, less attention has been paid to differences between various country submissions to UNFCCC, the different collections of UNFCCC country data (e.g. Grassi et al., 2021 vs. The Washington Post, 2021 (Mooney et al., 2021)), and other LULUCF datasets such as FAOSTAT (Tubiello, 2020). These differences are mostly due to three main factors.
First, it is arduous to collect LULUCF carbon flux information from some reports that countries submit to the UNFCCC, which here we broadly define as national greenhouse gas inventories (NGHGIs). While data from Annex I (AI) countries are straightforward to retrieve because they are organised in annually submitted standardised tables within the GHG inventories (GHGIs), non-Annex I (NAI) countries submit their NGHGI information less regularly, not in a standardised format, and in a number of reports of different scope and objectives: the national communications (NCs), the biennial update reports (BURs), submissions under the REDD+ (reducing emissions from deforestation and forest degradation, and the conservation and enhancement of forest carbon stocks) framework, and the nationally determined contributions (NDCs). This highly heterogeneous and fragmented reporting, together with sometimes unclear description of methodologies, complicates the assessment of the LULUCF fluxes reported by several NAI countries.
Second, different LULUCF datasets – and sometimes also different country submissions to the UNFCCC – report emissions and removals at different levels of aggregation of land uses, carbon pools, and gases. This, together with differences in methodological approaches, makes the comparisons between the datasets difficult.
Third, carbon fluxes are associated with complex and highly dynamic biological systems, characterised by a marked spatial and temporal variability. Estimating these fluxes in a complete, accurate, and consistent manner is very difficult, and different approaches may capture differently the various natural and anthropogenic drivers.
While dealing with and finding solutions to the third factor is crucial to further improve LULUCF estimates, minimising the “noise” and the bias from first two factors is equally important. In other words, before comparing country-reported LULUCF data with other LULUCF datasets, one should first ask: am I using the most appropriate country data? Am I comparing apples to apples?
From the end of 2024, under the Enhanced Transparency Framework package finalised at COP26 (2021) (https://unfccc.int/enhanced-transparency-framework, last access: 10 July 2022), all UNFCCC parties will start reporting GHG fluxes and managed area with a harmonised format. This will happen through biennial transparency reports (BTRs) that will include, among other things, (i) a national inventory report of anthropogenic emissions and removals, consisting of a national inventory document (with a description of the methods used) and common reporting tables (noting that AI parties will continue to provide flux estimates on a yearly basis), and (ii) information to track progress towards targets as defined in the NDC. This harmonised reporting is expected to alleviate many of the concerns discussed above.
However, we cannot wait until the end of 2024 to get the needed information. Notably, the first global stocktake under the Paris Agreement will take place in 2022–2023, aimed at assessing the countries' collective progress towards meeting the long-term goals of the Paris Agreement. The global stocktake is a crucial step, because any identified gap between the globally aggregated country emissions (reported and pledged) and emission pathways consistent with the Paris Agreement is expected to motivate increased mitigation ambition in subsequent NDCs. Since progress in the implementation of pledges will be monitored through NGHGIs, confidence on NGHGIs is crucial because “If you can't measure it, you can't improve it”.
In this context, a better understanding of the LULUCF data that countries report to the UNFCCC, and of the differences with other relevant country-based datasets, is important to the global assessment of climate efforts and, more broadly, to increase confidence on land-related climate change mitigation.
In this study, we collected LULUCF CO2 flux data from AI countries' GHG inventories and from the most recent and complete NAI countries' reports to the UNFCCC (i.e. NCs, BURs, REDD+, and NDCs), complemented by any available information on managed and unmanaged forest area. To ensure a complete time series 2000–2020, we filled the gaps using standard statistical methods, with the aim to maintain the levels and trends of the underlying, reported raw data. Data are disaggregated into fluxes from forest land (including harvested wood products), deforestation, organic soils, and other fluxes (including non-forest land uses).
The objectives of this study are therefore as follows: (i) to present a comprehensive and updated collection of carbon flux data from the most recent and complete country reports to the UNFCCC (i.e. the “NGHGI database”, NGHGI DB), which can be used by the scientific and policy communities; (ii) to assess the scale and understand the reasons for the discrepancies among different collections of UNFCCC country data, i.e. our NGHGI DB and the UNFCCC greenhouse gas data interface (GHGDI); and (iii) to assess the scale and understand the reasons for the differences between our NGHGI DB and the FAOSTAT LULUCF emissions estimates, which represent an alternative, independent source of data based on country reporting to FAO's Global Forest Resources Assessment 2020 (FAO, 2020).
Table 1Overview of the main characteristics of the sources of data used in this study.

2.1 The NGHGI LULUCF database (NGHGI DB)
In this study, we use the term national greenhouse gas inventories (NGHGIs) in a broad sense, including anthropogenic GHG data submitted to UNFCCC through any official country report. The data in such reporting processes are estimated using one of the relevant IPCC guidelines (IPCC, 1996, 2006, 2019). Although the Paris Agreement removes the previous distinction between Annex I (AI) and non-Annex I (NAI) countries in terms of targets and reporting (retaining some flexibility in GHG reporting for developing countries), we use this distinction here because it still reflects relevant differences in historical GHG data.
The NGHGI LULUCF database presented here (NGHGI DB) is a significant update to data in Grassi et al. (2021), including more recent data (until July 2022), greater coverage of countries, more disaggregated categories, and additional methodological information.
Data were compiled from various submissions to UNFCCC (Table 1). For AI countries, all information is sourced from the GHGI 2022. For NAI countries, NC/BUR, REDD+, and NDC submissions have been used, prioritising the most recent one but also taking the completeness of information into account. For each country, only one type of submission is used in the NGHGI DB. In selecting the source of data for NAI countries, expert judgement is applied in a few cases, e.g. if a NC/BUR is clearly more complete than a slightly more recent NDC, the former is used (see Table 1 of the online dataset, Grassi et al., 2022). In most cases, these exceptions have little or no influence on the carbon fluxes, with the notable exception of the Central African Republic (see later).
It is worth noting that, for NAI countries, NC/BUR, REDD+, and NDC submissions differ in scope and objectives (Table 1). Both NCs and BURs include a GHG inventory section, concern land-based reporting, aim to include all land uses, carbon pools, and gases, and to systematically neither over- nor underestimate emissions/removals (which means accuracy of estimates is in principle achieved). While NCs are typically submitted every 4 years, BURs provide an update of the information presented in NCs, typically every 2 years. The methods used (i.e. 1996 or 2006 IPCC guidelines), the amount of information, and the disaggregation of the categories reported varies considerably among countries.
The REDD+ reporting is voluntary, with the objective of receiving results-based payments. Reporting tends to be activity-based and is rarely complete: 87 % of reporting countries cover the entire national territory, 42 % include both emissions and removals from forest land and conversions to and from forest land (i.e. deforestation, forest degradation, and enhancement of forest-carbon stock), 24 % cover all GHGs, and only 7 % cover all carbon pools. The 2006 IPCC guidelines are typically used. Generally, a larger amount of methodological information is provided in REDD+ compared to other submissions by NAI countries, and it is technically assessed by a team of independent UNFCCC experts.
The NDCs outline the post-2020 efforts by each country to reduce national emissions and adapt to the impacts of climate change, as requested by the Paris Agreement. While the focus is on the future actions, historical emissions and removals from LULUCF are sometimes included, although typically with little or no methodological information and at a rather aggregated level.
While AI countries report a complete time series for the period 1990–2020, most NAI countries do not. Since the lack of data occurs especially for the 1990s, our study focuses on the period 2000–2020, applying gap filling for NAI countries when necessary.
Gap-filling was applied through linear interpolation between two points and/or through extrapolation backward (till 2000) and forward (till 2020) using the single closest available data (see Tables 4 and 5 of the online dataset, Grassi et al., 2022, showing the original and gap-filled time series, respectively). The overall gap-filling rate is 48 % (0 % for AI and 62 % for NAI countries), calculated by dividing the number of gap-filled data by the total number of yearly values in the database for all the 196 countries. When normalised by the contribution to the global carbon flux values, the gap-filling rate is 30 % (0 % for AI and 40 % for NAI countries) of the absolute total flux (calculated by summing the absolute fluxes of the single land categories used here; forest land, deforestation, organic soils, other land uses). This indicates that most of the NAI countries where the biggest fluxes occur reported relatively complete time series.
Furthermore, we tested the potential impact of different gap-filling methods on the level and trends of carbon fluxes. Specifically, we compared the procedure described above with two alternative approaches: (i) i.e. the average 2000–2020 using the non-gap-filled data, and (ii) a gap filling where the interpolation between two data is done taking the most recent data to fill the missing years (while extrapolation backward and forward is done as described above).
Data from this study are openly available online via the Zenodo portal (Grassi et al., 2022) at https://doi.org/10.5281/zenodo.7190601.
2.2 Area of managed land
The NGHGI data submitted to UNFCCC are expected to use, as default, the “managed land” proxy following the 2003 IPCC GPG for LULUCF and the subsequent IPCC guidelines (IPCC, 2006, 2019), according to which all GHG fluxes from managed land areas are considered “anthropogenic”, while GHG fluxes on unmanaged land areas are not estimated because they are not considered “anthropogenic”. Only a minority of countries explicitly reported information on the implementation of this proxy (Ogle et al., 2018; Grassi et al., 2021). For the rest, we considered that the managed land proxy is implicitly used in all other country reports to the UNFCCC, which means that information on the CO2 fluxes reported is sourced from managed land only.
Most AI countries consider their whole land surface as managed, though some countries (for example, the United States, Canada, and Russia) specifically report the area of unmanaged lands (for forest land, grassland, and wetlands). By contrast, the vast majority of NAI countries do not distinguish between managed and unmanaged areas, with some not even reporting the forest area extent.
Given the importance of forest land in the LULUCF fluxes, here we focus mostly on the area of managed forest. When the information of forest area was available in the NGHGIs, we considered this area as managed, whenever it can be assumed that it is the area over which the GHG emissions are estimated. In this case, most countries simply indicate the total area of managed land per each land use category, and only few countries (e.g. Canada, USA, Brazil) explicitly show maps of managed lands. Where this information is not available, we used the area of secondary forests and plantations from country reports to the FAO Forest Resources Assessment, (FRA; FAO, 2020) as a proxy managed forest (see Table 3 of the online dataset, Grassi et al., 2022). In total, the amount of area from FRA that was used to gap fill the missing information from NGHGIs amounts to 71 Mha (2 % of total forest area from NGHGIs).
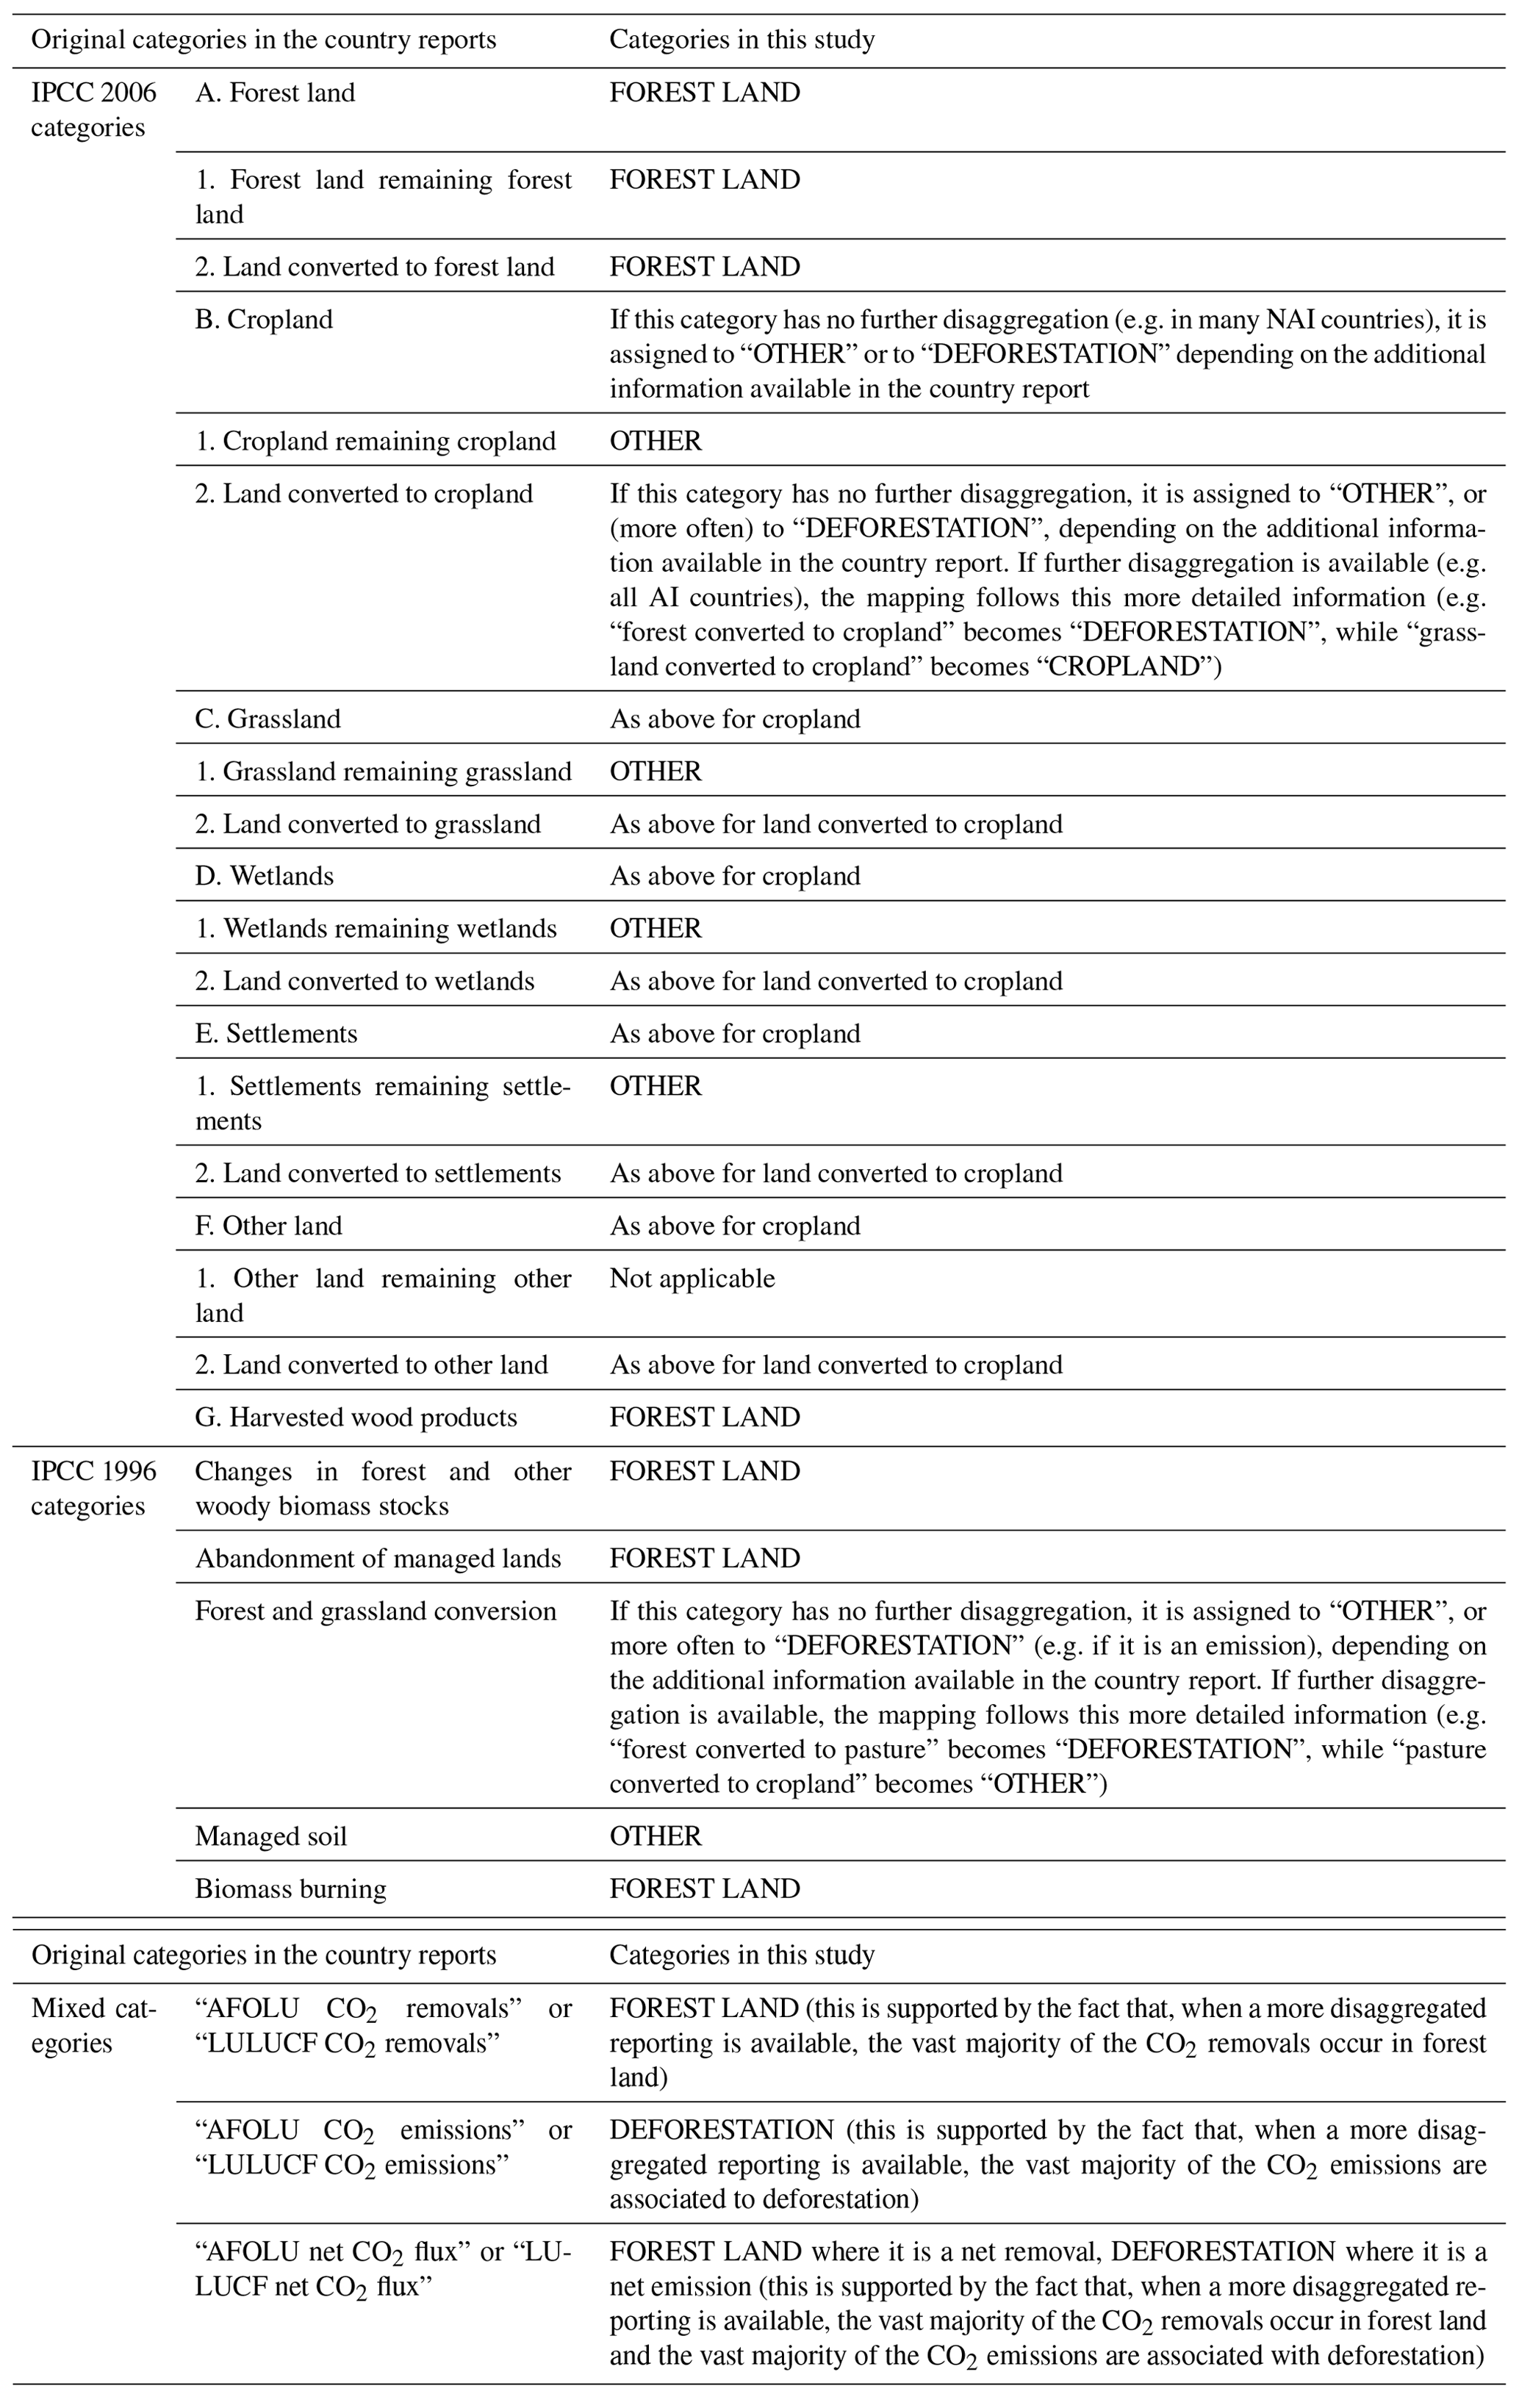
Table 2Mapping of original categories in the country report (typically those of the IPCC methodology) to the categories used in this study (forest land, deforestation, organic soils, other).
Emissions from managed ORGANIC SOILS for AI countries are taken from the detailed reporting in CRF tables, and are subtracted from the respective categories (forest land, deforestation, other). For NAI countries, only Indonesia reports emissions from peat decomposition and peat fires, which we both assigned to ORGANIC SOILS.
2.3 CO2 fluxes
The LULUCF CO2 fluxes in the NGHGI DB are disaggregated into the following categories, following the 2006 IPCC guidelines (IPCC, 2006): forest land (FL, including harvested wood products, excluding organic soils), deforestation (forest converted to other land uses), organic soils (including organic soils from all land uses and peat fires), and other land uses (including cropland, grassland, wetlands, settlements, other land), following the mapping of Table 2. When possible, data on FL were further split in the two subcomponents forest land remaining forest (FL–FL, i.e. forests existing from 20 years or more) and land converted to forest land (L–FL, i.e. forest established less than 20 years ago). While data on FL and deforestation (typically the most important categories) are available for most countries, data for organic soils and other are available for most AI countries but only for some NAI countries (usually the largest in terms of area, see Table 2 of the online dataset, Grassi et al., 2022). For those NAI countries still using the categories of the revised 1996 IPCC guidelines, the mapping to the categories above from the 2006 IPCC guidelines is described in Table 2. The categories used in our NGHGI DB represent a compromise between very disaggregated information from some countries (typically AI and a few NAI countries) and very aggregated information from others. In a few cases – generally for relatively small NAI countries – our categorisation required some approximation: for example, where the country reported only “AFOLU net CO2 flux” or “LULUCF net CO2 flux”, the flux was assigned to FL where it is a net removal, and to deforestation where it is a net emission (Table 2). This is justified by the fact that when a more disaggregated reporting is available, the vast majority of the CO2 removals occur in FL and the vast majority of the CO2 emissions are associated with deforestation.
In addition to the categories above, we provide information also on harvested wood products (HWPs) and natural disturbances such as fires, insects, and wind throws (i.e. whether they are excluded from the NGHGI).
In terms of carbon pools, FL and deforestation data always include above- and below-ground biomass; data for the other carbon pools (dead organic matter, mineral soils, harvested wood products) are reported by the vast majority of Annex I countries and by the largest NAI countries (including Brazil, China, India, Indonesia, Mexico). For Annex I countries, we provide the main statistics on carbon pools retrieved from the individual tables of NGHGIs.
Although most NGHGIs include reporting for all GHGs, in this study we consider only CO2. Exceptions are some NAI countries for which it was not possible to separate CO2 from non-CO2 emissions (mainly CH4 and N2O from forest fires). However, based on information available from AI countries and the largest NAI countries – for which non-CO2 emissions are around 6 % of the total CO2-equivalent LULUCF flux – the global contribution of non-CO2 emissions in our NGHGI DB (i.e. from NAI countries that do not separate GHGs) is assumed to be negligible.
For the purpose of our analysis, we introduced two indicative thresholds to assess the plausibility of the net forest sink reported in the NGHGIs, selected on the basis of various considerations, including the distribution of the forest sink per unit of area among countries (see Fig. S1 in the Supplement), the typical range of IPCC default factors, and expert judgement. In particular, we considered the net forest sink as “biophysically impossible” – and therefore not included in our NGHGI DB – when the average for the period 2000–2020 is greater than −30 tCO2 ha−1 yr−1 at country level (if occurring over >1 Mha). The only case that could be potentially included in our NGHGI DB and that fell in this category was the Central African Republic. In this case, the forest sink reported in the most recent country submission (i.e. −0.7 Gt CO2 yr−1, from the NDC 2021, corresponding to an area-specific sink of about 35 tCO2 ha−1 yr−1) was excluded from the NGHGI DB, and the value from the NDC 2016 (forest sink of −0.3 Gt CO2 yr−1, or 15 tCO2 ha−1 yr−1) was used instead.
Furthermore, we considered the net forest sink as “implausible” when the average for the period 2000–2020 is greater than −10 tCO2 ha−1 yr−1 at country level (if occurring over >1 Mha). Five countries were included in this category (with a forest sink between −14 and −18 tCO2 ha−1 yr−1), collectively covering about 70 Mha of forest: Central African Republic (using the NDC 2016), Mali, Namibia, Malaysia, and the Philippines. For these countries, data are included in the NGHGI DB but are considered separately in the discussion (i.e. numbers are considered unlikely, but not impossible). It is to be noted that we did not apply an analogous method for screening countries which might overestimate gross emissions and/or underestimate gross removals. Also, a country not filtered out by the above threshold does not mean that its forest sink estimates are necessarily accurate.
2.4 Uncertainties
Assessing estimates of uncertainties in the LULUCF sector of NGHGIs is challenging, due to the frequent lack of data and insufficient methodological information (McGlynn et al., 2022).
As per IPCC guidelines (2006), uncertainty is here defined as the lack of knowledge of the true value of a variable that can be described as a probability density function (PDF) characterising the range and likelihood of possible values. It refers to random errors, although the central value of the PDF may be affected by unknown/unquantified biases. Systematic errors (biases, which refer to lack of accuracy), once identified/quantified, should be removed while uncertainties are to be reduced so far as practicable. Following the IPCC (2006), NGHGIs estimate uncertainty at 95 % confidence interval.
Based on the values of uncertainty collected in Grassi et al. (2017), complemented by expert judgement, in this study the uncertainty on the net LULUCF CO2 flux was estimated to be 35 % for AI countries (where the dominating component flux is FL) and 50 % for NAI countries (where the dominant flux component is deforestation). These values are similar to those collected by McGlynn et al. (2022) for the LULUCF estimates reported by six AI countries (average 33 % uncertainty) and 12 NAI countries (average 47 % uncertainty). It should be noted that the estimated % uncertainty has a broad range across countries (e.g. from 14 % of Japan to 102 % of Cambodia, McGlynn et al., 2022), and may be affected by the closeness to zero (i.e. when emissions and removals nearly balance out, the aggregated % uncertainty is likely to be higher). Given the incomplete information on the uncertainty of NGHGIs (especially for NAI countries), the values used in this study should be considered as rough approximations. We then averaged this information at AI and NAI level and aggregated it at global level using Eq. (3.2) from IPCC (2006), vol. 1, chapter 3.
It is worth noting two problems concerning the application of the IPCC guidelines for the estimation of the annual net C-stock changes and associated uncertainties in forest land that may lead to a bias in the assessed uncertainty.
The first is about the so-called “informal harvesting”, i.e. harvest that is likely not captured by national statistical systems. It includes harvest that does not meet the criteria set by the country for data collection (e.g. often, wood harvested by small landowners for domestic uses is not captured in statistics), and harvest that is illegally harvested and therefore not reported to the national statistical system. Informal harvesting varies largely among countries and may add a bias when the IPCC “gain–loss” approach is used to the estimate the annual net CO2 flux from forests. In some cases, this is corrected through proxy data or expert judgement (for instance, Italy reports an annual informal harvest equal to 50 % of its total harvest, see Italian NIR 2021, annex 14), but in several other cases it may remain uncorrected. In principle, the IPCC “stock difference” approach is not affected by this problem as it compares the forest biomass stocks between two different inventories.
The second problem is the ambiguity in the use of the standard error of the mean (SE) vs. the standard deviation of the population (SDp) to calculate the uncertainty of the carbon flux estimates. The SE is to be used to quantify the uncertainty of a variable that applies to the entire population from which the mean value of the variable has been unbiasedly inferred, e.g. the increment of the entire forest land when the increment value is derived from an unbiased forest inventory. In this case, the variability of the population does not determine uncertainty in the knowledge of the true value (only random errors in measurements matter). In contrast, SDp is to be used to quantify the uncertainty of a variable when the mean value of the variable (e.g. the average per hectare forest biomass carbon stock) is applied to only a portion of the population from which has been inferred (e.g. the deforested area). This means that the variability of the population contributes to the uncertainty in the knowledge of the true value; thus SDp always applies to every IPCC default value used in NGHGIs. Although such guidance is provided by IPCC (IPCC, 2019, volume 1, chapter 3), countries do not always properly use the standard error vs. the standard deviation, which leads to underestimating uncertainties when the standard error is used instead of the standard deviation, or overestimating uncertainties when the standard deviation is used instead of the standard error.
2.5 Comparison with other datasets
We compare our NGHGI DB with other datasets that are conceptually close and also based on country data. First, the forest area is compared with data in the Forest Resources Assessment (FRA) database (FAO, 2020). Second, the carbon fluxes are compared with two other sources:
- i.
The LULUCF data directly derived from the UNFCCC GHG data interface (GHGDI, UNFCCC, 2022a); the data for AI countries (https://di.unfccc.int/flex_annex1, last access: 10 July 2022) are the same as the ones used in our study (even if the disaggregation is different), whereas those from NAI countries (https://di.unfccc.int/flex_non_annex1, last access: 10 March 2022 – which include only NC and BUR submissions) differ. To ensure comparability, for NAI countries we gap filled the time series of the UNFCCC GHGDI with the same methodology applied in this study (see above). The original (not gap filled) NC/BUR data from the UNFCCC GHGDI and those collected to build our NGHGI DB are shown in Tables 7 and 8, respectively, of the online dataset (Grassi et al., 2022). We note that a compilation of UNFCCC country-reported data (from the UNFCCC GHGDI) is available also in the FAOSTAT website, for download and visualisation alongside the FAO emissions estimates (FAO, 2021).
- ii.
The LULUCF estimates within the FAOSTAT GHG database (Tubiello, 2020; FAO, 2021), which is used regularly in IPCC assessment reports, in scientific studies (e.g. Tubiello et al., 2021) and by some countries as an input into data quality analysis in support of their NGHGIs. Our analysis complements and updates the comparisons of carbon flux estimates between country data to UNFCCC and FAOSTAT for forest land done by Tubiello et al. (2021), which focused on AI and few large NAI countries.
The FAOSTAT GHG database (Tubiello, 2020) includes LULUCF CO2 fluxes associated with (1) net forest conversion (associated with positive net forest land area loss, tracked separately for FRA forest land sub-categories naturally regenerating forest and planted forest), which we compare to our deforestation data; (2) forest land, arising from a combination of carbon stock changes per unit of area and net forest area gains between successive FRA periods; and fluxes from (3) drainage and fires in organic soils, which we compare to our “organic soils” category. The first two categories are based on country reporting to FAO (via the FRA) of forest land area and above- and below-ground biomass data (FAO, 2020; Tubiello et al., 2021). The latter two categories are conversely estimated using geospatial information (Conchedda and Tubiello, 2020; Prosperi et al., 2020; Rossi et al., 2016).
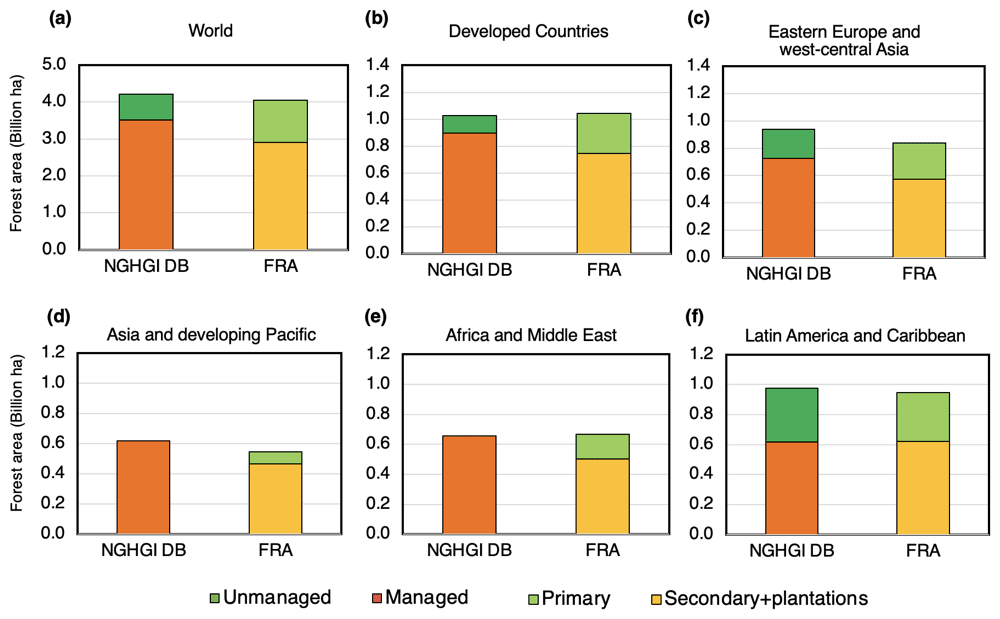
Figure 1Global forest area reported to UNFCCC (as consolidated and gap filled in the NGHGI DB) (managed and unmanaged) and FRA (primary and secondary + plantations) for the year 2015 at global level (a) and for five macro regions (b–f). For the NGHGI DB, about 1 % of total forest area in NAI countries is gap filled with FAO data (i.e. 2, 43, and 1 Mha in panels d, e, and f, respectively).
Several aspects need to be considered when comparing our NGHGI DB and FAOSTAT. First, forest land in FAOSTAT is not disaggregated into a managed and unmanaged component, and the values of carbon stocks include all the forest area (Tubiello et al., 2021), in contrast to the managed forest area included in the country NGHGIs data. This is the main reason why, as explained in Tubiello et al. (2021), FAOSTAT data cannot a priori be assumed to reflect anthropogenic fluxes. In practice, on carbon stocks/ha, the FRA 2020 reports from Canada and Russia explicitly aim to be consistent with UNFCCC reporting and the corresponding managed area, which for these countries is smaller by 0.3 billion ha than their total forest area. For comparisons, the global managed forest area considered in our NGHGI DB (about 3.6 billion ha, Fig. 1) is within 15 % of the total FAO forest land area (4.0 billion ha).
Second, while the methods used by NGHGIs differ among countries (but all follow the IPCC methodological guidance), FAOSTAT applies the same carbon stock change estimation method to all countries, using the FRA data on biomass stocks and area as inputs. To this regard, our comparison with FAOSTAT data includes an assessment of the completeness/uncertainty of estimates for FL and Deforestation for NAI countries. The approach is illustrated in Fig. S2. Specifically, the dataset (i.e. NGHGI DB or FAOSTAT) which includes an estimate for FL or deforestation while the other does not, or the estimate is zero, is considered more complete or less uncertain. Whenever the two datasets appear equally complete or incomplete (for FL and deforestation), then the completeness of the carbon pools is considered.
Table 3Statistics on the sources used in this study for Annex I (AI) and non-Annex I (NAI) countries.

1 The forest area includes 71 Mha which are gap filled from FRA 2020 (see online Table 3, Grassi et al., 2022, and next section). 2 The absolute flux is calculated by summing the absolute fluxes of the various categories (forest land, deforestation, organic soils, other).
3.1 The NGHGI DB: general features
A total of 186 countries out of 196 UNFCCC parties submitted data on LULUCF CO2 emissions/removals to UNFCCC, covering 99.9 % of the global forest area (Table 3). Contrary to Grassi et al. (2021), where LULUCF data were available only for 106 NAI countries, the NGHGI DB presented here includes data for 143 NAI countries. These improvements reflect recent submissions (either NC/BUR, REDD+, or NDC) from countries that did not provide LULUCF data before.
Table 4Statistics on land use categories reported in NGHGIs and used in this study. The % refers to the share within the categories (world, AI, or NAI countries).

Most of the submissions used in the NGHGI DB are recent, i.e. in or after 2019 (80 % of countries, corresponding to 86 % of absolute CO2 flux, i.e. the flux calculated by summing the absolute fluxes of the various land categories). Furthermore, approximately 70 % of countries (80 % of absolute CO2 flux) used at least in part the 2006 IPCC guidelines to estimate the CO2 fluxes.
In terms of land use categories, the reporting by AI countries is more complete than NAI countries (Table 4, Table 2 in the online dataset, Grassi et al., 2022). The most reported land use is forest land (98 % and 90 % for AI and NAI countries, respectively). While reporting on deforestation appears less complete in terms of the number of countries (98 % and 54 % of AI and NAI countries, respectively), those countries not reporting this category are generally small and with little forest area, i.e. they likely have small emissions from deforestation. Overall, it can be assumed that the majority of countries where significant fluxes from deforestation are likely to occur do report some data. This, however, does not necessarily imply that the reported data are accurate. Emissions from organic soils are assumed to be reported (even if sometimes not explicitly separated from mineral soil) by all AI countries where a relevant area of organic soil occurs on managed land. By contrast, only few NAI countries report emissions from the drainage in organic soils, and Indonesia is the only one to report the emissions from peat fires. Nonetheless, significant improvements are expected in the coming years as a result of several international initiatives on peatlands.
Table 5Statistics on carbon pools (number of countries reporting, average CO2 fluxes) for the main land use categories and sub-categories in the NGHGIs of AI countries.
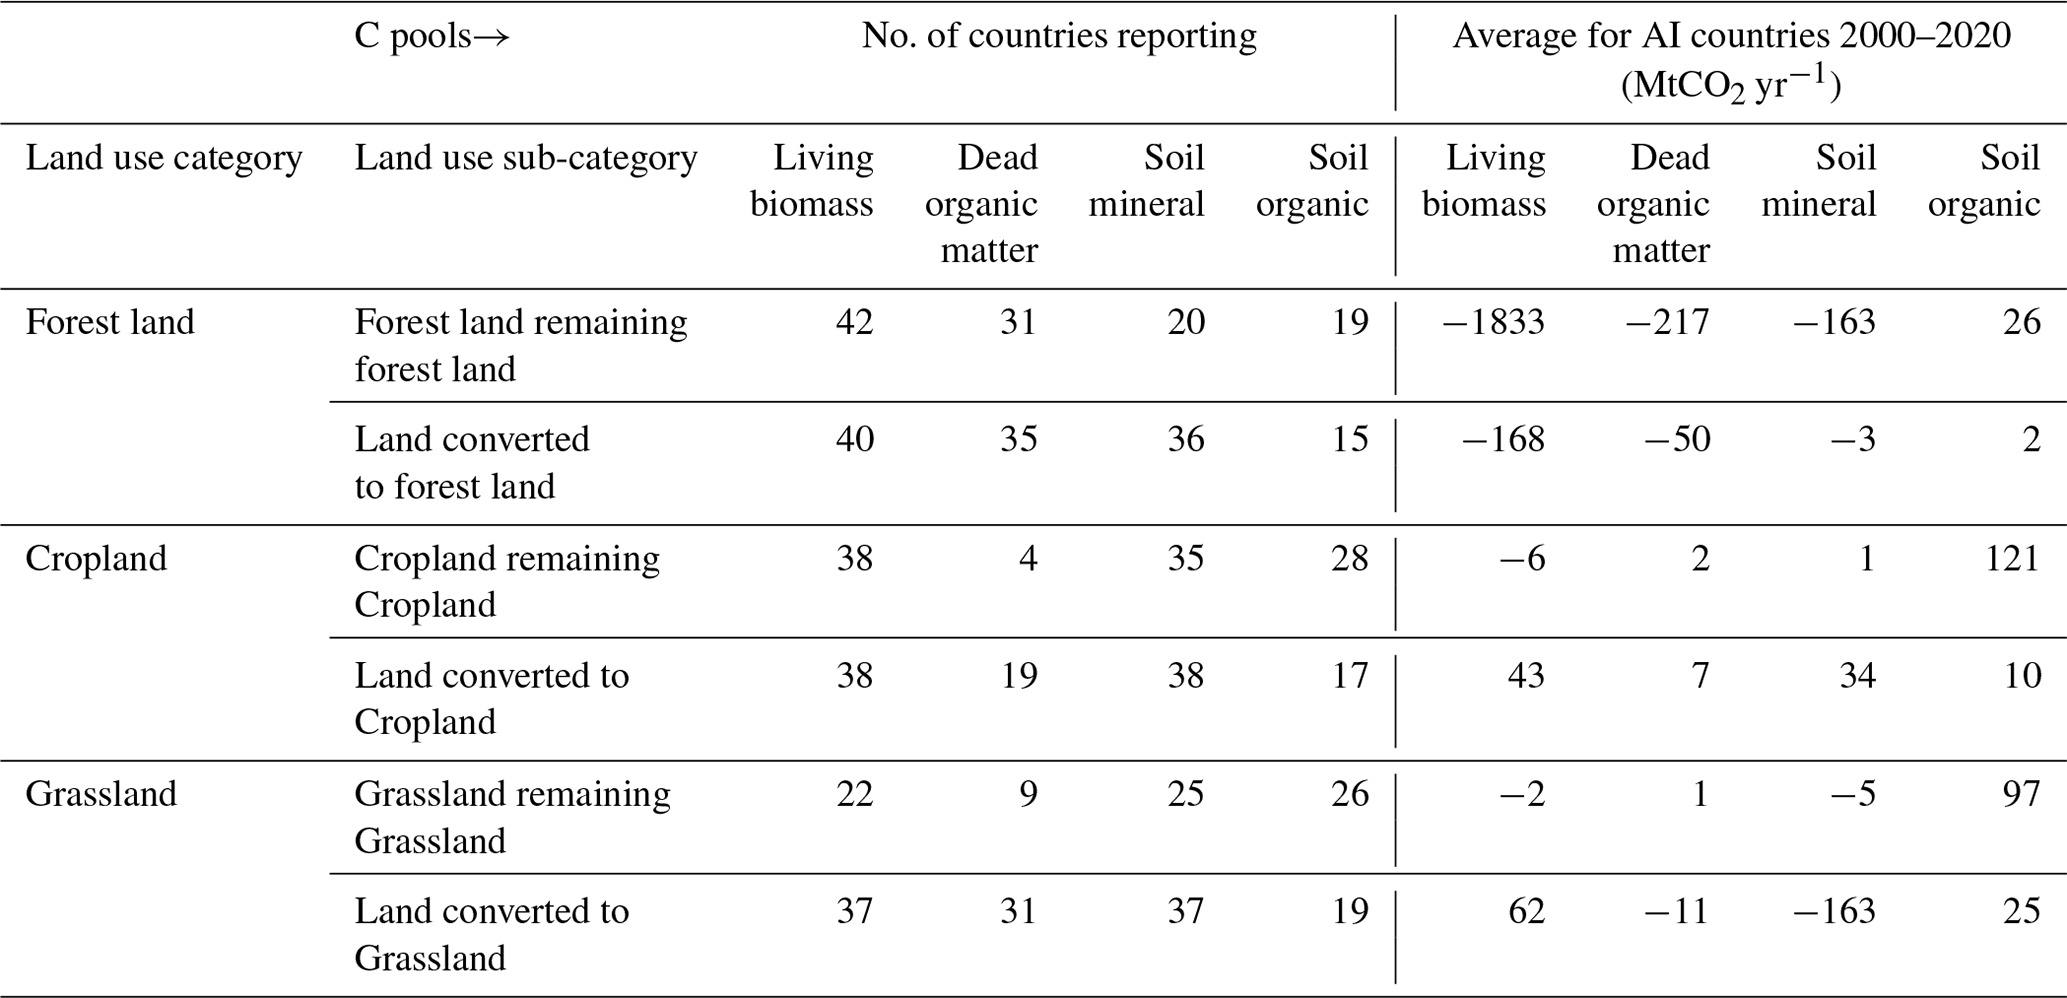
In terms of carbon pools, Table 5 reports the key statistics for the main land use categories of AI countries. The majority of these countries report the most important pool in each category (i.e. living biomass in forest land, soils in cropland and grassland). Furthermore, the countries not reporting are generally the smaller ones. For example, for “forest land remaining forest land”, the 42 countries reporting on living biomass cover 100 % of the total forest area of AI countries (only Monaco does not report); for the 31 countries reporting on dead organic matter this share reaches 95 %, and for the 20 countries reporting on mineral soils it is 93 %. While the most important NAI countries include living biomass, dead organic matter, and mineral soils, the CO2 fluxes are often not separated by pools.
3.2 Forest land area
Here we compare the information on forest area compiled in the NGHGI DB with the data reported by countries to FAO via the FRA (FAO, 2020) as disseminated in FAOSTAT.
Overall, 150 countries reported information on forest land area under the UNFCCC. Conversely, 189 countries reported data to FAO on forest land area, including in most cases its disaggregation into FRA components of naturally regenerating forest (a category that includes both primary and naturally regrowing, or secondary, forest) and planted forest (Table 6). The difference in the number of country reporting between UNFCCC and FAO is due to a group of NAI countries, corresponding in FRA to a total area of 71 Mha (about 2 % of the global forest land area in 2015). The FAO data for these countries were used in the NGHGI DB to gap fill the missing UNFCCC data (see Table 3 in the online dataset, Grassi et al., 2022).
Similarly, the area of unmanaged forest could be derived only from nine NGHGIs (Table 6), compared to 91 countries that reported primary forest to FAO. While all AI countries explicitly report both managed and unmanaged forest area to UNFCCC (with unmanaged area being often zero), the vast majority of NAI countries do not explicitly make this separation in their NGHGIs. In the absence of additional information (e.g. see the information collected and the assumptions made for Colombia, Ecuador, and Peru, Table 1 in the online dataset, Grassi et al., 2022), and following the example of most AI countries, we assume that forest land area reported to UNFCCC is managed. The significance of this assumption is that, according to the IPCC guidelines (IPCC, 2006), all emissions and removals from managed lands are considered “anthropogenic”, while those from unmanaged lands are considered as non-anthropogenic and therefore do not need to be reported. The lack of specific information on managed land area from many NAI countries (particularly on managed forests) represents an important gap of information to assess the extent of anthropogenic CO2 fluxes.
Table 6Number of countries reporting on managed and unmanaged forest to UNFCCC (NGHGIs). For comparison and within the assumptions made in this paper, we also show country reporting to FAO (FAO, 2020) of secondary forest/plantation and primary forest area.
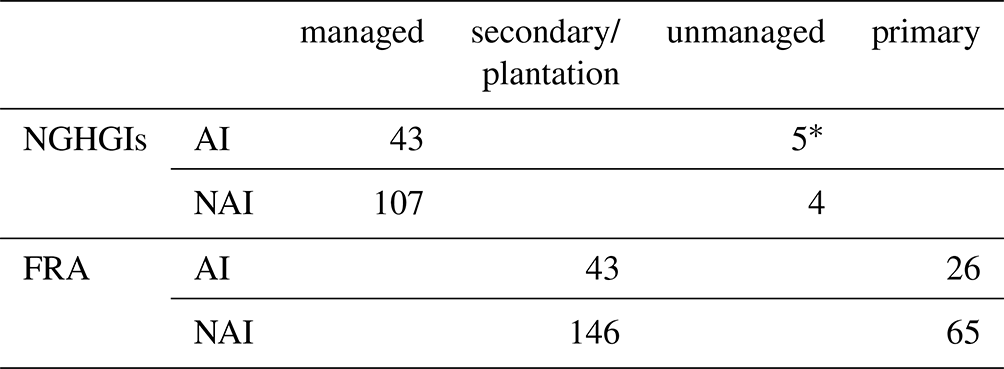
* Including Canada, France, Greece, Russia, and USA. All the other AI countries report that unmanaged forests do not occur.
Figure 1 compares the distribution of managed and unmanaged forest in our NGHGI DB with that of secondary forest/plantation and primary forest from FAO, at global levels and for five macro regions (AI countries are in panels b and c; NAI countries are in panels d–f). While there is a general convergence between the two datasets on the total forest area, some differences emerge when comparing managed vs. secondary/plantation and unmanaged vs. primary. The main reason is that managed forest and secondary/plantations (or unmanaged and primary) are not necessarily synonyms. In fact, managed forest under UNFCCC includes areas that fulfil social, ecological, and economic functions (IPCC, 2006) and that may apply to both primary and secondary forest land, depending on country-specific definitions and situations. For example, based on the detailed information provided in FRA country reports that accompany that data submitted to FAO, many AI countries (including Canada, Russia, and the USA) consider relatively large areas of primary forest as managed. At the same time, we note nonetheless that “forest” area is generally reported by countries to both UNFCCC and FAO using the same underlying bio-physical characteristics, specifically, minimum area, minimum tree height at maturity, and minimum crown closure.
3.3 CO2 fluxes: the NGHGI DB
The NGHGI DB indicates a net mean global LULUCF sink of −1.6 Gt CO2 yr−1 over the period 2000–2020 (Fig. 2a). The LULUCF sink is largely determined by a forest land sink (−6.4 Gt CO2 yr−1) and a deforestation source (+4.4 Gt CO2 yr−1), as well as by smaller land fluxes that nearly cancel each other out, i.e. including organic soils (+0.9 Gt CO2 yr−1) and “Other” (−0.6 Gt CO2 yr−1). Country-level data are included in the online Tables 4 (LULUCF net CO2 flux, not gap filled), 5 (LULUCF flux gap filled), 6 (CO2 flux by land use and land use-change category, gap filled), and 7–10 (more detailed information from NAI country submissions) (Grassi et al., 2022).
A slight trend of decreasing CO2 emissions from deforestation and increasing CO2 removals from forests is present for the NAI country group (Fig. 2b). By contrast, the AI country group shows no clear trend.
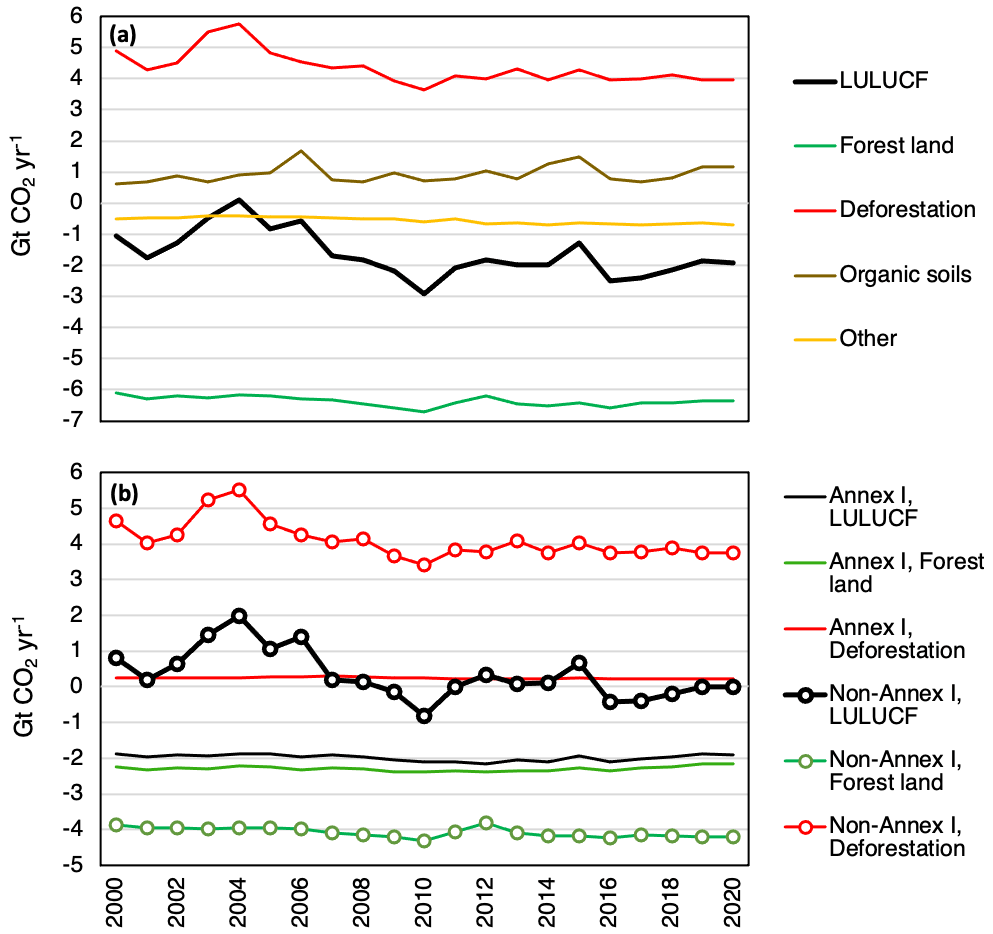
Figure 2Global trend 2000–2020 of CO2 fluxes from the NGHGI DB for the various land uses and land-use change categories (a) and for Annex I vs. non-Annex I countries (b).
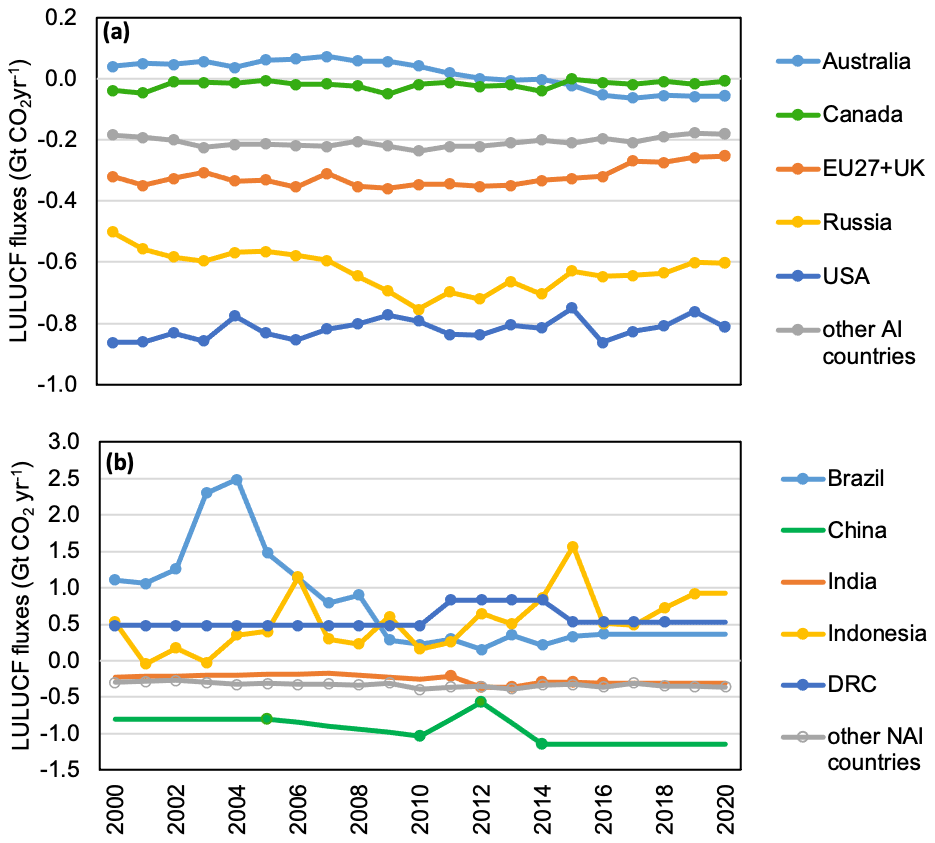
Figure 3Trends 2000–2020 of LULUCF CO2 fluxes from the NGHGI DB for the largest Annex I (a) and non-Annex I (b) countries (or country aggregations). Dots indicate the years for which the data exist in the original submission (i.e. not gap filled).
Figure 3 shows the LULUCF CO2 fluxes in the period 2000–2020 for the largest Annex I and non-Annex I countries, suggesting that the level and trend of global carbon fluxes is largely determined by relatively few large countries.
In addition to the categories illustrated in Fig. 2, the vast majority of AI countries and few NAI countries (e.g. Brazil, China, Chile, Colombia, Mexico, South Africa, etc.) include information on the changes of carbon stock in the harvested wood products (HWPs). At global level, HWP represents a net increase in carbon stock, equivalent to −0.14 Gt CO2 yr−1, which in our NGHGI DB is included in the FL category. However, it should be noted that Canada reports HWP differently from other countries (https://unfccc.int/sites/default/files/resource/docs/2017/arr/can.pdf, last access: 10 July 2022), which leads to estimating greater emissions in HWP and a correspondingly greater sink in the forest biomass pool compared to the other countries (with the total for forest land + HWP being correct and comparable to other countries). If the net increase in HWP from Canada is added to the database in the same way as done by the other countries (which would result in an increase in HWP carbon stock of 0.03 Gt CO2 yr−1), the global increase in HWP carbon stock would be higher, becoming equivalent to −0.3 (−0.16 and −0.14 Gt CO2 yr−1 for AI and NAI countries, respectively).
With regard to natural disturbances, such as fires, insects, and wind throws, these are included in most NGHGIs with the exception of Canada and Australia. Following the IPCC guidelines (IPCC, 2019), these two countries implement a “second-order approximation” for anthropogenic CO2 fluxes (in principle, a refinement of the managed land proxy) and exclude the GHG emissions and subsequent CO2 removals that are considered to result from natural disturbances from their NGHGIs. Overall, the average net emissions that were excluded from the NGHGI for the period 2000–2020 amounted to about 0.1 Gt CO2 eq. yr−1 in Canada (Canada, 2022) and 0.04 CO2 yr−1 in Australia (Australia, 2022).
We tested the dependence of NGHGI DB on the choice of gap-filling procedure, noting that only 52 % of the NGHGI DB data are directly derived from country reports. To this end, we compared our results with two equally reasonable alternatives for gap filling on the resulting level and trends of carbon fluxes. The first alternative, i.e. a simple average of the original non-gap-filled data in each country for 2000–2020, results in a global LULUCF net sink (−1.58 Gt CO2 yr−1) very close to the one obtained with our gap-filling procedure (−1.64 Gt CO2 yr−1); qualitatively identical results are obtained when the analysis is done at the level of specific land categories (forest land, deforestation). The second alternative, i.e. no linear interpolation between two data points (see Methods), produced a global net sink of −1.69 Gt CO2 yr−1 for 2000–2020 and a trend which is very similar to the one of our NGHGI DB (Fig. S3). This indicates that the global levels and trends that are highlighted by the NGHGI DB data are robust across a range of credible gap-filling procedures.
Furthermore, the analysis of UNFCCC country data with information on forest fluxes (all AI and 20 NAI countries) indicates that the majority of the reported sink in forest land (FL) is unevenly distributed across the two sub-categories forest land remaining forest land (FL–FL) and land converted to forest land (L–FL). Specifically, countries report that the vast majority of their forest sink is in FL–FL (87 % globally, 88 % in AI countries and 85 % in NAI countries), while only 13 % is in L–FL. This is consistent with the small carbon sequestration role expected in younger forests typical of the L–FL category which, though sequestering large amounts of carbon per unit area as they grow, occupy a small area compared to older forests in FL–FL. For example, for AI countries, the area of L–FL is only 8 % of total forest area and 12 % of the total forest sink.
Based on the values of uncertainty used in our study (i.e. 35 % for AI countries and 50 % for NAI countries, see Methods), we estimated an aggregated uncertainty at global level (Fig. S4) of about ±0.8 GtCO2 yr−1 (average 2000–2020). It is important to recognise that additional uncertainties may exist, including those arising from omissions or double counting, other conceptual errors, or from incomplete understanding of the processes that may lead to inaccuracies in estimates developed from models (IPCC, 2006). These uncertainties reflect biases and are not identified by the statistical means to estimate uncertainties provided by the 2006 IPCC guidelines. Furthermore, it should be noted that – in the context of country GHG reporting to UNFCCC – the uncertainty analysis should be seen, first and foremost, as a means to help prioritise national efforts to reduce the uncertainty of inventories in the future, and guide decisions on methodological choice (IPCC, 2006). To this regard, in the context of review/technical assessment processes under the UNFCCC, a greater focus on the informal harvesting and the correct calculation of uncertainties (see Methods) would help countries in improving their national estimates and the assessment of the associated uncertainty.
Finally, Fig. S5 includes data from 1990, aggregated for AI and NAI countries. Due to lack of LULUCF information from many NAI countries, data for the pre-2000 period should be considered more uncertain than for the post-2000 period.
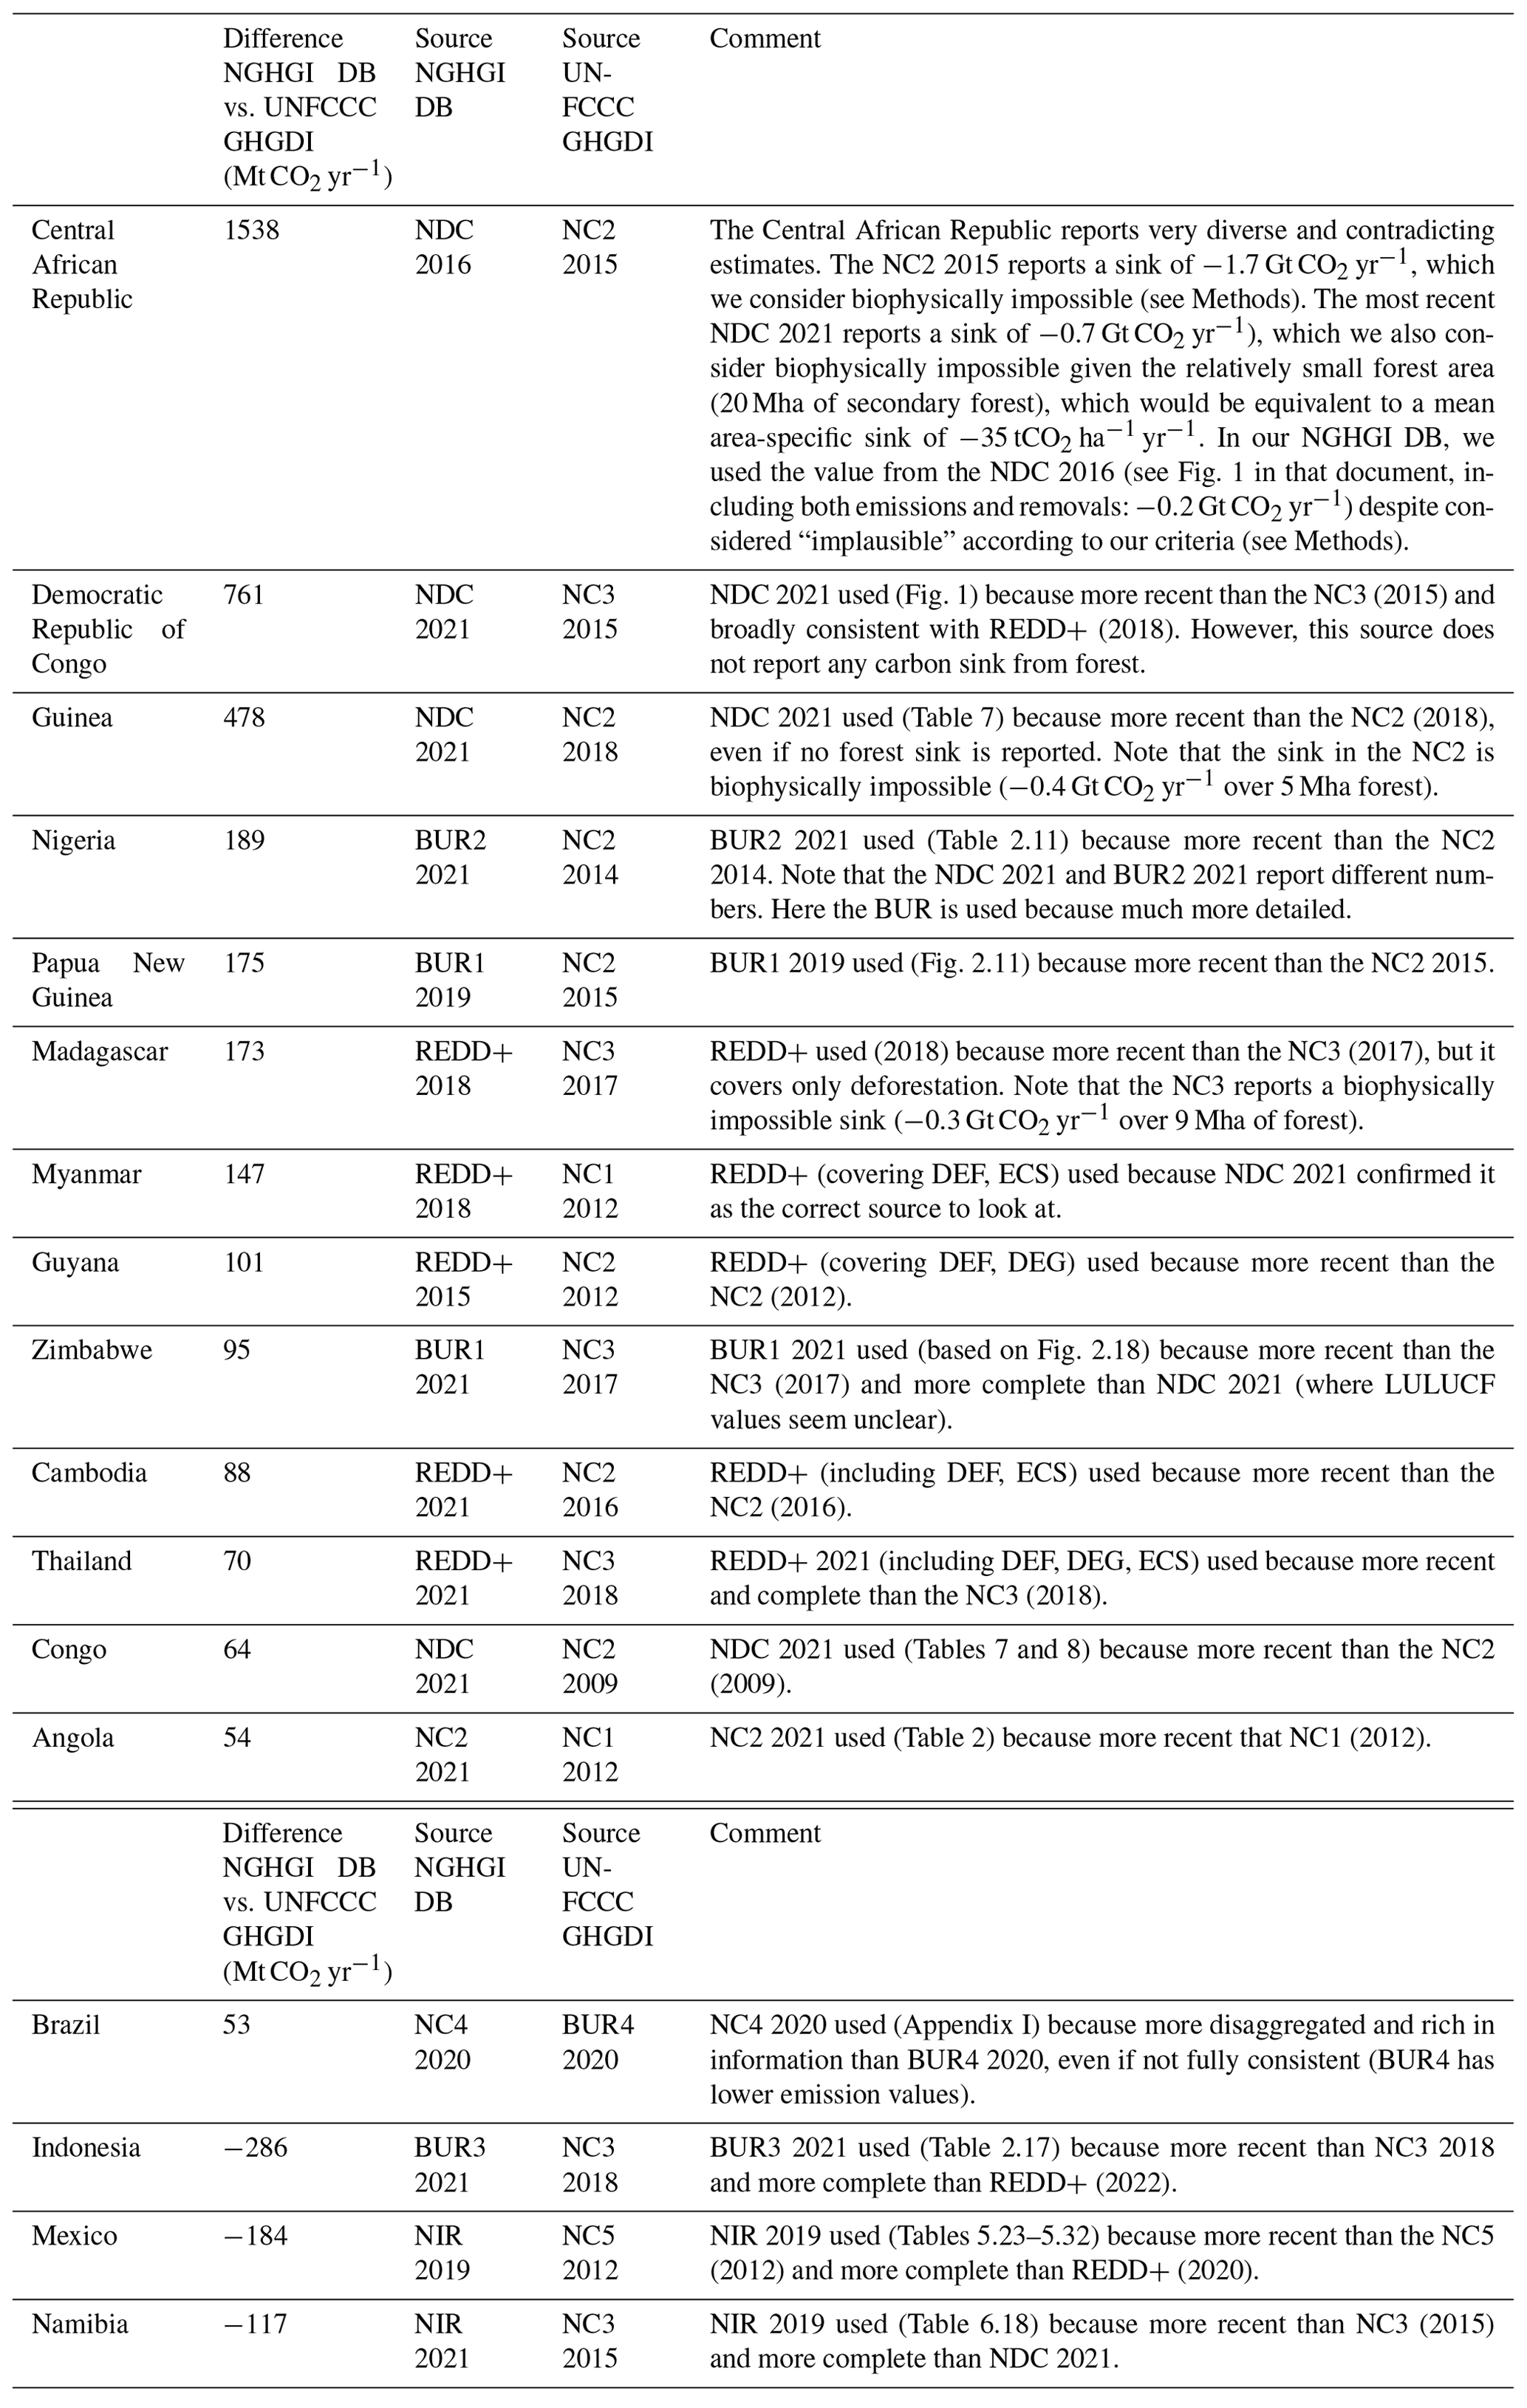
Table 7Countries where the difference between the net LULUCF CO2 flux in the NGHGI DB and in the UNFCCC GHGDI is greater than 50 Mt CO2 yr−1 (absolute values, i.e. positive numbers indicate greater emissions or smaller sinks in the NGHGI DB than the UNFCCC GHGDI), and explanation of the different source used. Collectively, these countries explain most of the difference in global LULUCF values between the two datasets.
3.4 CO2 fluxes: comparing the NGHGI DB and the UNFCCC GHG data interface (UNFCCC GHGDI)
For 2000–2020, the UNFCCC GHGDI (gap filled for NAI countries) includes a much greater net LULUCF sink globally (−5.4 Gt CO2 yr−1) than reported in our NGHGI DB (−1.6 Gt CO2 yr−1). This is entirely due to results in NAI countries, for which the UNFCCC GHGDI gives a global mean net sink of −3.4 Gt CO2 yr−1 and the NGHGI DB conversely a source of 0.4 Gt CO2 yr−1. Note that when the original (not gap filled) data from NAI countries are compared instead the gap-filled ones – i.e. taking the average for 2000–2020 of the available data for each country – the results do not significantly change (i.e. −3.28 Gt CO2 yr−1 in UNFCCC GHGDI and +0.43 Gt CO2 yr−1 in our NGHGI DB). The countries with the biggest difference in carbon flux between our NGHGI DB and the UNFCCC GHGDI are recalled in Table 7.
We identify two reasons for the large difference (3.8 Gt CO2 yr−1) between the two sources.
First, the UNFCCC GHGDI includes only NC/BUR in the format of, and sometimes methodologically consistent with, the revised 1996 IPCC guidelines (IPCC, 1996), because the inclusion of GHG data reported in the format of the 2006 IPCC guidelines has not yet been agreed by parties. This explains a difference of 0.7 Gt CO2 yr−1 due to the inclusion, within our NGHGI DB, of data according to both the 1996 and 2006 IPCC formats.
Second, our NGHGI DB includes country submissions (i.e. REDD+ and NDCs, if clearly more recent than NCs/BURs, see Methods) which are not included in the UNFCCC GHGDI. This explains a further 3.1 Gt CO2 yr−1 difference. For example, for the Central African Republic, the UNFCCC GHGDI includes an exceptionally high net sink from the 2015 NC (−1.7 Gt CO2 yr−1), while our NGHGI DB includes a net LULUCF sink of −0.2 Gt CO2 yr−1 reported in the more recent NDC (2016).
Overall, our NGHGI DB is more complete and updated for NAI countries, containing more than twice the number of yearly values of carbon fluxes than the UNFCCC GHGDI.
For some countries, this second reason above may include difficulties in identifying what area and what anthropogenic LULUCF fluxes to include (especially for the forest sink), possibly resulting in different choices made for different types of submissions. These difficulties may reflect the different IPCC methodological guidance used. The 1996 revised IPCC guidelines (IPCC, 1996) – still used by several NAI countries, especially small ones – do not include a definition on managed land, which is a concept introduced by the IPCC Good Practice Guidance on LULUCF (IPCC, 2003) and retained by the 2006 IPCC guidelines later. According to IPCC (2003), emissions and removals from managed land are recommended as a proxy for anthropogenic emissions and removal. Specifically, forest management is defined as “the process of planning and implementing practices for stewardship and use of the forest aimed at fulfilling relevant ecological, economic and social functions of the forest”, but also suggests that “natural, undisturbed forests should not be considered either an anthropogenic source or sink and are excluded from national inventory estimation”. The 2006 IPCC guidelines (IPCC, 2006) – further confirmed in the 2019 IPCC refinement (IPCC, 2019) – suggest that national definitions of managed forest should cover all forests subject to human intervention, including as management practices protecting forests and abandonment of managed land. This may raise challenges on the exact coverage of managed forests to be included: for example, forests inside a national park can fulfil a relevant ecological function, and be actively protected while being natural and undisturbed.
Related to the above, many REDD+ and NDC submissions tend to focus more on emissions than on removals, compared to NCs/BURs. In the first case, it is explainable by the aim of the REDD+ framework. For NDCs, the greater focus on emissions compared to NC/BUR could be potentially explained by the difference existing for the LULUCF sector between “reporting” of GHG fluxes – which in principle should include all the fluxes in managed lands – and “accounting”, i.e. the use of reported information to meet specific mitigation targets. For the purpose of accounting, the reported GHG fluxes may be potentially filtered through a more restrictive interpretation of “anthropogenic” flux, with the aim to better reflect the impact of mitigation actions (see Supplement in Grassi et al., 2021). In this study we focus on the reporting, i.e. on the carbon fluxes that the countries estimate for the historical period in their managed land and report to UNFCCC. Even if we found no evidence suggesting that the NDCs included in our dataset report a smaller sink than in the NC/BUR because the former apply a more restrictive interpretation of “anthropogenic” flux, this possibility cannot be ruled out.
Overall, the above suggests that a more explicit identification by NAI countries of what they consider to be “anthropogenic” sink would be important to achieve more clarity on global LULUCF fluxes.
Understanding the difference between our NGHGI DB and the UNFCCC GHGDI may help assessing also other analyses, like the one by the Washington Post (Mooney et al., 2021) and the recent UNFCCC synthesis report for the technical assessment component of the first global stocktake (UNFCCC, 2022b).
The Washington Post estimated a global net LULUCF sink of −3.6 Gt CO2 yr−1 in 2019 (excluding data from Central African Republic), while for the same year our NGHGI DB estimates −1.9 Gt CO2 yr−1 (online Table 5, Grassi et al., 2022). Most of the difference is due to the different sources used, i.e. the Post used only NCs and BURs, while our study included also REDD+ and NDC submissions if they were more recent than NCs and BURs. By using the same criteria as the Washington Post, we would obtain a global net LULUCF sink of −3.3 Gt CO2 yr−1 in 2019. The rest of the difference between our NGHG DB and the Post is linked to the more updated data we used and the slightly different gap-filling procedures.
The UNFCCC synthesis for the global stocktake reports a global LULUCF net sink corresponding to about −3.1 Gt CO2 yr−1 for the year 2015. This reflects a sink of −1.9 Gt CO2 yr−1 for all AI countries (for which no differences exist to our dataset), and a sink of −1.2 Gt CO2 yr−1 for 50 NAI countries (i.e. most of NAI countries were not included). This sink is smaller than the one that we derived from UNFCCC GHGDI, because the UNFCCC synthesis for the global stocktake includes more updated data, like in our database. The remaining difference with our study is mostly explainable by the greater number of NAI countries considered in our database (we found some LULUCF data for 143 NAI countries, see Table 4), and the fact that we included also data from recent REDD+ and NDC submissions.
Overall, while the global LULUCF values from other datasets (−5.4 Gt CO2 yr−1 from the UNFCCC GHGDI for the period 2000–2020, −3.6 Gt CO2 yr−1 from the Washington Post for the year 2019, −3.1 Gt CO2 yr−1 from the UNFCCC synthesis for the global stocktake for the year 2015) are not implausible when compared to the estimates from global carbon budget (e.g. around −6.0 CO2 yr−1 of net sink from all terrestrial ecosystems, Friedlingstein et al., 2022), we believe that the NGHGI DB presented here is the most complete, updated, and disaggregated collection of LULUCF information based on NGHGIs.

Figure 4Global trend 2000–2020 of CO2 fluxes from our NGHGI DB and FAOSTAT for LULUCF (a), forest land (b, including “forest land remaining forest land”, “land converted to forest land”, and harvest wood products), deforestation (c, corresponding to net forest conversion in FAOSTAT), and organic soils (d, including peat drainage and peat fires).
3.5 CO2 fluxes: comparing the NGHGI DB to FAOSTAT emissions estimates
The trends of the LULUCF component categories are broadly consistent across the two datasets (Fig. 4), with the exception of forest land after 2010 (Fig. 4b) and deforestation in the 2000s (Fig. 4c). By contrast, there is a large difference in total net LULUCF fluxes, amounting to 2.7 Gt CO2 yr−1 (−1.6 vs. +1.1 for NGHGI-DB and FAOSTAT, respectively, i.e. our data pointing to a sink, while FAOSTAT suggests a source) averaged over the 2000–2020 period (Figs. 4a, 5a). This difference is mainly driven by a much larger estimated net forest land sink in the NGHGI DB (−6.4 Gt CO2 yr−1) compared to FAOSTAT (−3.2 Gt CO2 yr−1) (Figs. 4b, 5b). Conversely, the two datasets are closer on deforestation, albeit the NGHGI DB has consistently higher emissions (on average, by almost 1 Gt CO2 yr−1) than FAOSTAT for NAI countries (Figs. 4c, 5c). For organic soils, there is notable agreement not only on estimated absolute values, but also in the inter-annual variations of emissions (Figs. 4d, 5d). This is remarkable, considering that the NGHGI DB is not very much gap filled for this category (considering that the largest NAI emitters, and particularly Indonesia, report these emissions estimates to UNFCCC), and that the FAOSTAT estimates are based on FAO's own geospatial analysis (Conchedda and Tubiello, 2020).
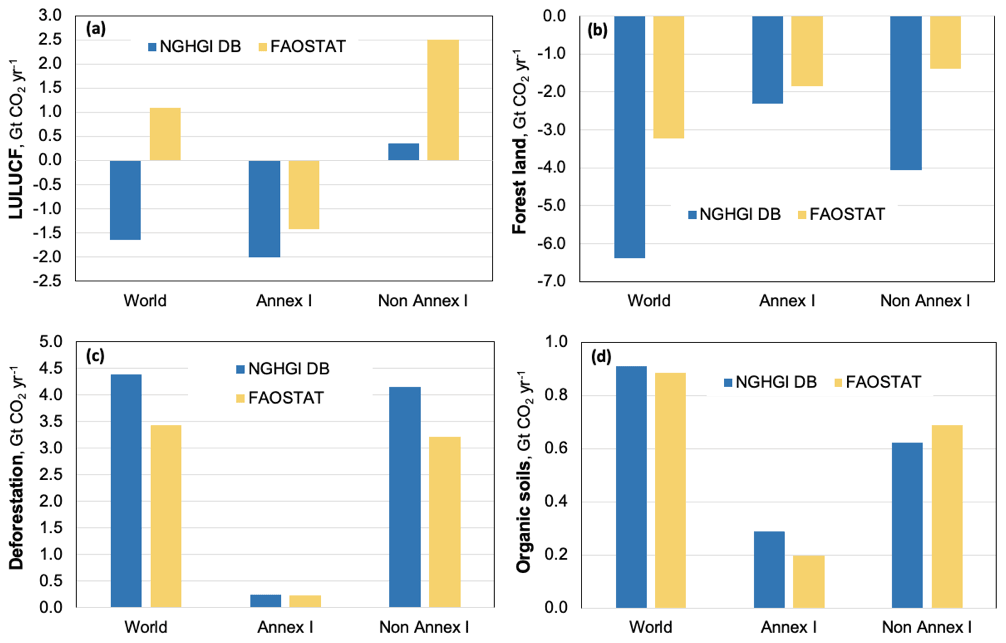
Figure 5CO2 fluxes (average 2000–2020) in Annex I and non-Annex I countries from our NGHGI DB and FAOSTAT, for LULUCF (a), forest land (b), deforestation (c, typically gross in NGHGIs and net in FAOSTAT), and organic soils (d, including peat drainage and peat fires).
Overall, the differences may be explained by a combination of factors, which we discuss below separately for AI and NAI countries, for each category, and for the level of the net CO2 fluxes and their trends.
In AI countries, the NGHGIs are typically more complete in terms of land categories and carbon pools compared to FAOSTAT. In particular, for the level of net CO2 fluxes in FL, a comparison of AI countries' data from NGHGIs and FAOSTAT has already been done by Tubiello et al. (2021). The differences that emerge here between the NGHGI DB and FAOSTAT can be mostly explained by estimates for pools other than living biomass, including HWP, included in the NGHGI DB but not in FAOSTAT. This explains a difference of about 0.2 Gt CO2 yr−1 just for the USA and a similar amount for other developed countries together (Fig. 6a). For the category “other” – i.e. non-forest land uses, excluding organic soils, which are not included in FAOSTAT – our NGHGI DB reports a net sink of −0.23 Gt CO2 yr−1. At the same time, for organic soils, NGHGI DB and FAOSTAT report similar numbers at global level (Fig. 5d), with a good agreement also for AI and NAI countries.
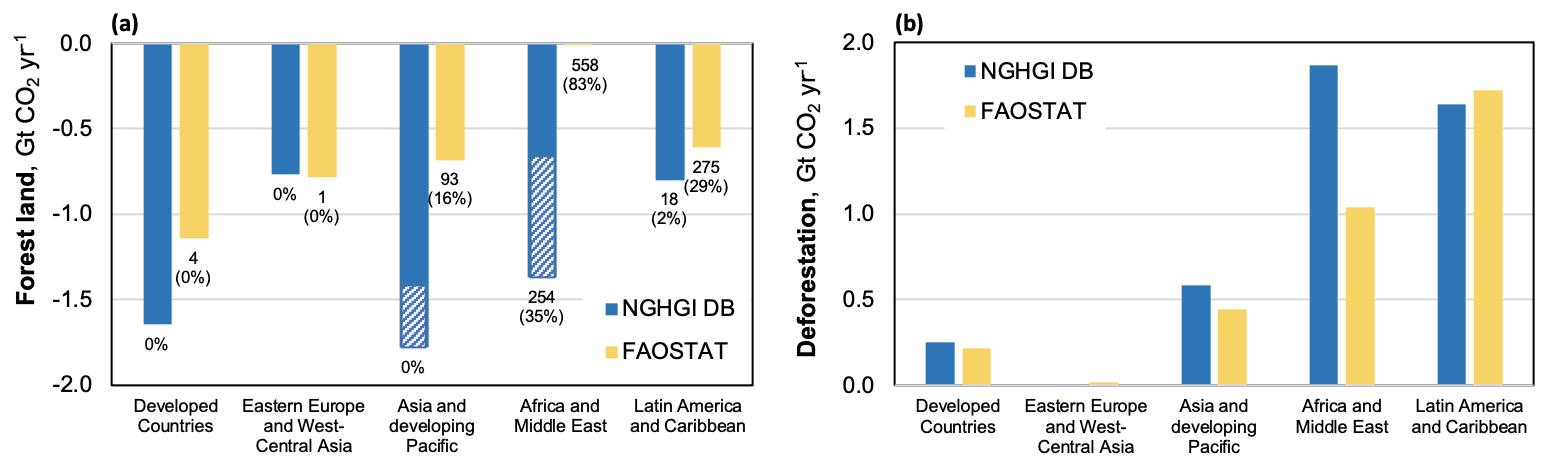
Figure 6CO2 fluxes (average 2000–2020) in the five macro-regions from our NGHGI DB and FAOSTAT, for forest land (a) and deforestation (b, net deforestation in FAOSTAT). The numbers next to each column in panel (a) indicate the areas (in Mha, and % relative to the respective regional forest area) where no or zero carbon flux is estimated for FL or for FL–FL. In panel (a), the dashed blue areas indicate the carbon fluxes that we consider implausible in the NGHG DB (see Methods).
In NAI countries, for FL, we find a large difference in the level of the carbon flux between our NGHGI DB and FAOSTAT data, resulting in a −2.7 Gt CO2 yr−1 greater sink in NGHG DB for 2000–2020 (Fig. 5b). This difference, which alone explains most of the gap between the two datasets, is largely linked to two factors.
On the one hand, the NGHGI DB contains a forest sink from five NGHGIs which we consider implausible (see Methods), possibly due to the inaccurate implementation of the IPCC methodology (the UNFCCC review of some of these reports already signalled this). Collectively, these countries report a net LULUCF flux of −0.9 Gt CO2 yr−1 over the period 2000–2020, with no clear trend. These five countries are located in Africa (Central African Republic, Mali, Namibia) and Southeast Asia (Malaysia, Philippines).
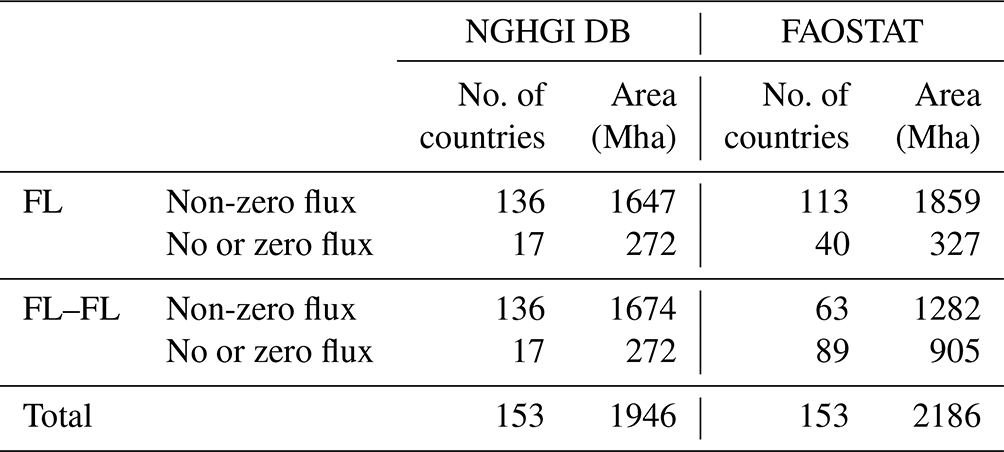
The second factor relates to the large underlying uncertainty in measurements of carbon stock changes over time. The capacity of many NAI countries is insufficient to ensure provision of consecutive and consistent forest inventories. For this reason, many NAI countries report to FAO via the FRA, likely for lack of better information, a constant value of forest carbon stock density (carbon stock/ha) over the period analysed here (2000–2020). In such cases, the estimated carbon stock changes in FAOSTAT necessarily represent net fluxes on either L–FL (positive net forest land area change) or FL–L (negative net forest land area change), while the estimated fluxes on FL–FL are zero. Conversely, when the same NAI countries report to UNFCCC, they may choose to apply the default IPCC gain–loss approach to compute and report non-zero carbon fluxes over FL–FL. This is relevant, because FL–FL is typically where most of the FL carbon flux occurs, considering the much larger underlying areas of FL–FL compared to L–FL in most countries. More specifically, the carbon stock change approach implemented in FAOSTAT results in a non-zero carbon flux for FL–FL in only 63 NAI countries, compared to 136 in countries NGHGIs (Table 8). The remaining 89 NAI countries have a total forest land area of 905 Mha (i.e. 41 % of forest area in NAI countries, mostly in Africa and South America, Fig. 6a), where the underlying FRA data on carbon stock density are lacking or constant over the entire period 2000–2020. Conversely, only 16 NAI countries in our NGHGI DB report no carbon fluxes on FL–FL (Table 8), corresponding to 272 Mha of forest (mostly in Africa, Fig. 6a). The underlying reasons for these differences are further explained in Box 1, and can be summarised by the different scopes of the two country datasets: while FAO reporting via the FRA focuses on measures of area and biomass (without a focus on climate change relevant fluxes), UNFCCC explicitly asks countries to report a value of carbon flux, providing default methods and factors that can be used despite the underlying paucity of national data.
Table 8Statistics on the number of NAI countries (and corresponding forest area) for which NGHGI DB and FAOSTAT compute null or non-null carbon fluxes for forest land (FL) and “forest land remaining forest land” (FL–FL). To note is that FAOSTAT does not explicitly distinguish the two subcomponents of FL, i.e. FL–FL and land converted to forest (L–FL). Here, we performed an additional analysis based on the original country reports to FRA: if the country report to FRA includes a constant value of carbon stock/ha over time, then we assume that the carbon flux FL–FL is zero and that any value computed by FAOSTAT for FL comes from L–FL only (see text for details).
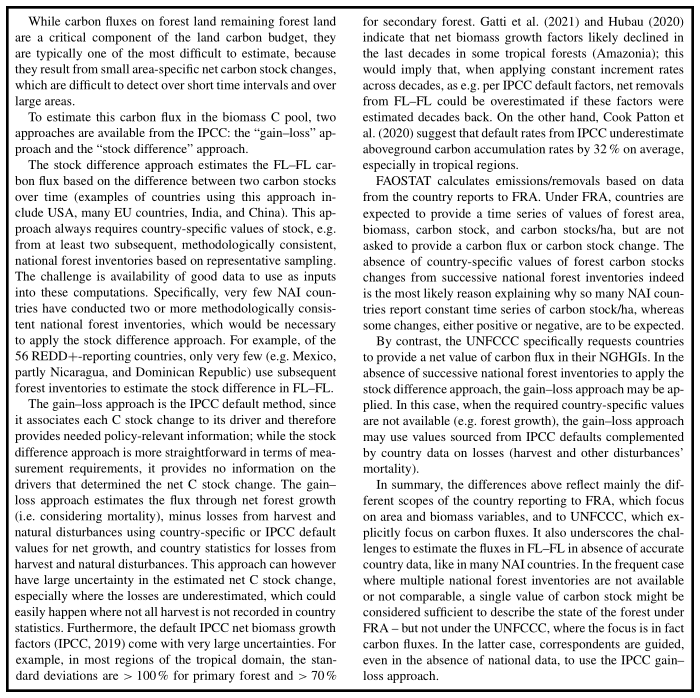
Box 1The challenge of estimating the biomass carbon fluxes in forest land remaining forest land (FL–FL).
We note that when countries do report a non-zero value of FL–FL, these values are most often a sink in both NGHGIs and FAOSTAT, although with features that would merit a more nuanced analysis. Based on this, we estimate a hypothetical sink that could have occurred on those FL areas with no or zero value of carbon flux. To this aim, we used the mean net annual area-specific sink for NAI countries from our NGHGI DB (of −1.9 tCO2 ha−1 yr−1, excluding the countries with implausible FL sinks) and FAOSTAT (of −1.1 tCO2 ha−1 yr−1, excluding those countries reporting a constant carbon stock/ha under FRA). Acknowledging the uncertainty of this exercise, this approach would yield a greater global forest sink, by about −1.0 in FAOSTAT and of −0.5 Gt CO2 yr−1 in our NGHGI DB.
Trends in carbon stock density (tC/ha) may help explain in part the differences of the trends in FL between NGHGIDB and FAO. In particular, after 2015 the NGHGI DB indicates globally a constant sink, whereas FAOSTAT suggests a decrease of the sink (Fig. 4b). These differences originate at country level – including for the major AI and NAI countries (see Fig. S6) – and can be linked to the fact that FRA 2020 carbon stock density data, upon which the FAOSTAT estimates are based, are often constant after 2016 or 2017 (see Fig. S7, e.g. Australia, Canada, Finland, USA, India, Indonesia, and Mexico); this fact reflects a lack of data for the most recent years rather than a real decrease in sink capacity during the period 2015–2020. Indeed, the global forest area with constant carbon stock density for the period 2015–2020 is double that reported for the period 2000–2015 (see Fig. S8). At the same time, the FL fluxes in FAOSTAT are estimated based on differences in carbon stock densities in 2020 and 2015 only. As shown in Fig. S6, the use of 2020 FRA values with constant carbon density after 2015 (Fig. S7) may lead to underestimating the sink strength in FAOSTAT in some cases (for instance USA, EU27+UK, India) and overestimating it in other cases (for instance Canada).
For NAI countries, the emissions from deforestation are estimated in 141 countries by FAOSTAT (net forest conversion) compared to 124 countries in our NGHGI DB. Since FAOSTAT computes the emissions for net forest land area loss, data would roughly correspond to those countries using the so-called “IPCC approach 1” to land representation (Tubiello et al., 2021). By contrast, NGHGI reporting is usually based on a more detailed tracking of the conversions between land uses and the associated gross fluxes. This difference may partly explain why our NGHGI DB estimates somewhat larger emissions from deforestation for NAI countries than in FAOSTAT (Fig. 6b). Furthermore, in FAOSTAT, the use of a single average forest carbon stock density may lead to underestimation of emissions (Tubiello et al., 2021). Other possible confounding factors in comparing deforestation estimates across datasets may be different reporting by NGHGIs of shifting agriculture and forest degradation processes: depending on the country and the report, the fluxes from these processes may be reported either under FL or as additional deforestation.
Although the rates of emissions from deforestation differ in the two databases, the trends look similar, both for the area and for the emissions. Comparing 2015–2020 against 2000–2005, FRA reports a 33 % reduction in deforestation area, and our NGHGI DB and FAOSTAT estimate a 18 % and 20 % reduction of emissions from net forest loss, respectively. The trends for our NGHGI DB and FAOSTAT look rather similar also for the macro regions analysed here, with emissions increasing in Asia and Africa while decreasing in South America (Fig. S9). It should be noted, however, that neither dataset is always very updated: FAOSTAT reflect data collected up to 2017 (or earlier), while for NGHGIs, it depends on the country; for Brazil, data used here are up to 2016 (thus the increases in deforestation detected in the last years in Brazil, e.g. Silva Junior et al. (2021), are not included); for DRC, data are up to 2018; and for Indonesia, up to 2019.
Donegan et al. (2022) found the trends regional forest loss statistic in FAO–FRA to be in overall agreement with the satellite-based assessment in the JRC's tropical moist forest dataset (Vancutsem et al., 2021). A similar trend emerges also in the Global Carbon Budget 2021 (Friedlingstein et al., 2021), based on bookkeeping models. However, this in contrast with analyses based on the global forest change product (GFC, Hansen et al., 2013), which indicates an increasing tree cover loss. Recent evidence indicates that the GFC's trend seems partly or largely explained by an increased capacity of the product to detect changes after 2015 (Palahi et al., 2021; Ceccherini et al., 2021), but other studies (Feng et al., 2022) confirm the GFC's trend also after an effort is made to address its temporal inconsistencies. While acknowledging that tree cover loss does not necessarily imply a land use change, these contradictory trends are striking. Given the renewed political interest in reducing deforestation that emerged at the UNFCCC's conference in Glasgow in 2021 (COP 26), reconciling the differences above is a priority for the scientific community.
Table 9Assessment of the reasons for the difference between the NGHGI database and FAOSTAT for 153 NAI countries, based on the completeness/uncertainty in the estimates of forest land (FL) and deforestation, and of carbon pools included. The method used is illustrated in Fig. S2. The total flux (−1793 Mt CO2 yr−1) is the average difference, for the sum of FL and deforestation in NAI countries, between NGHGI DB (+26 Mt CO2 yr−1) and FAOSTAT (+1819 Mt CO2 yr−1) for the period 2000–2020.
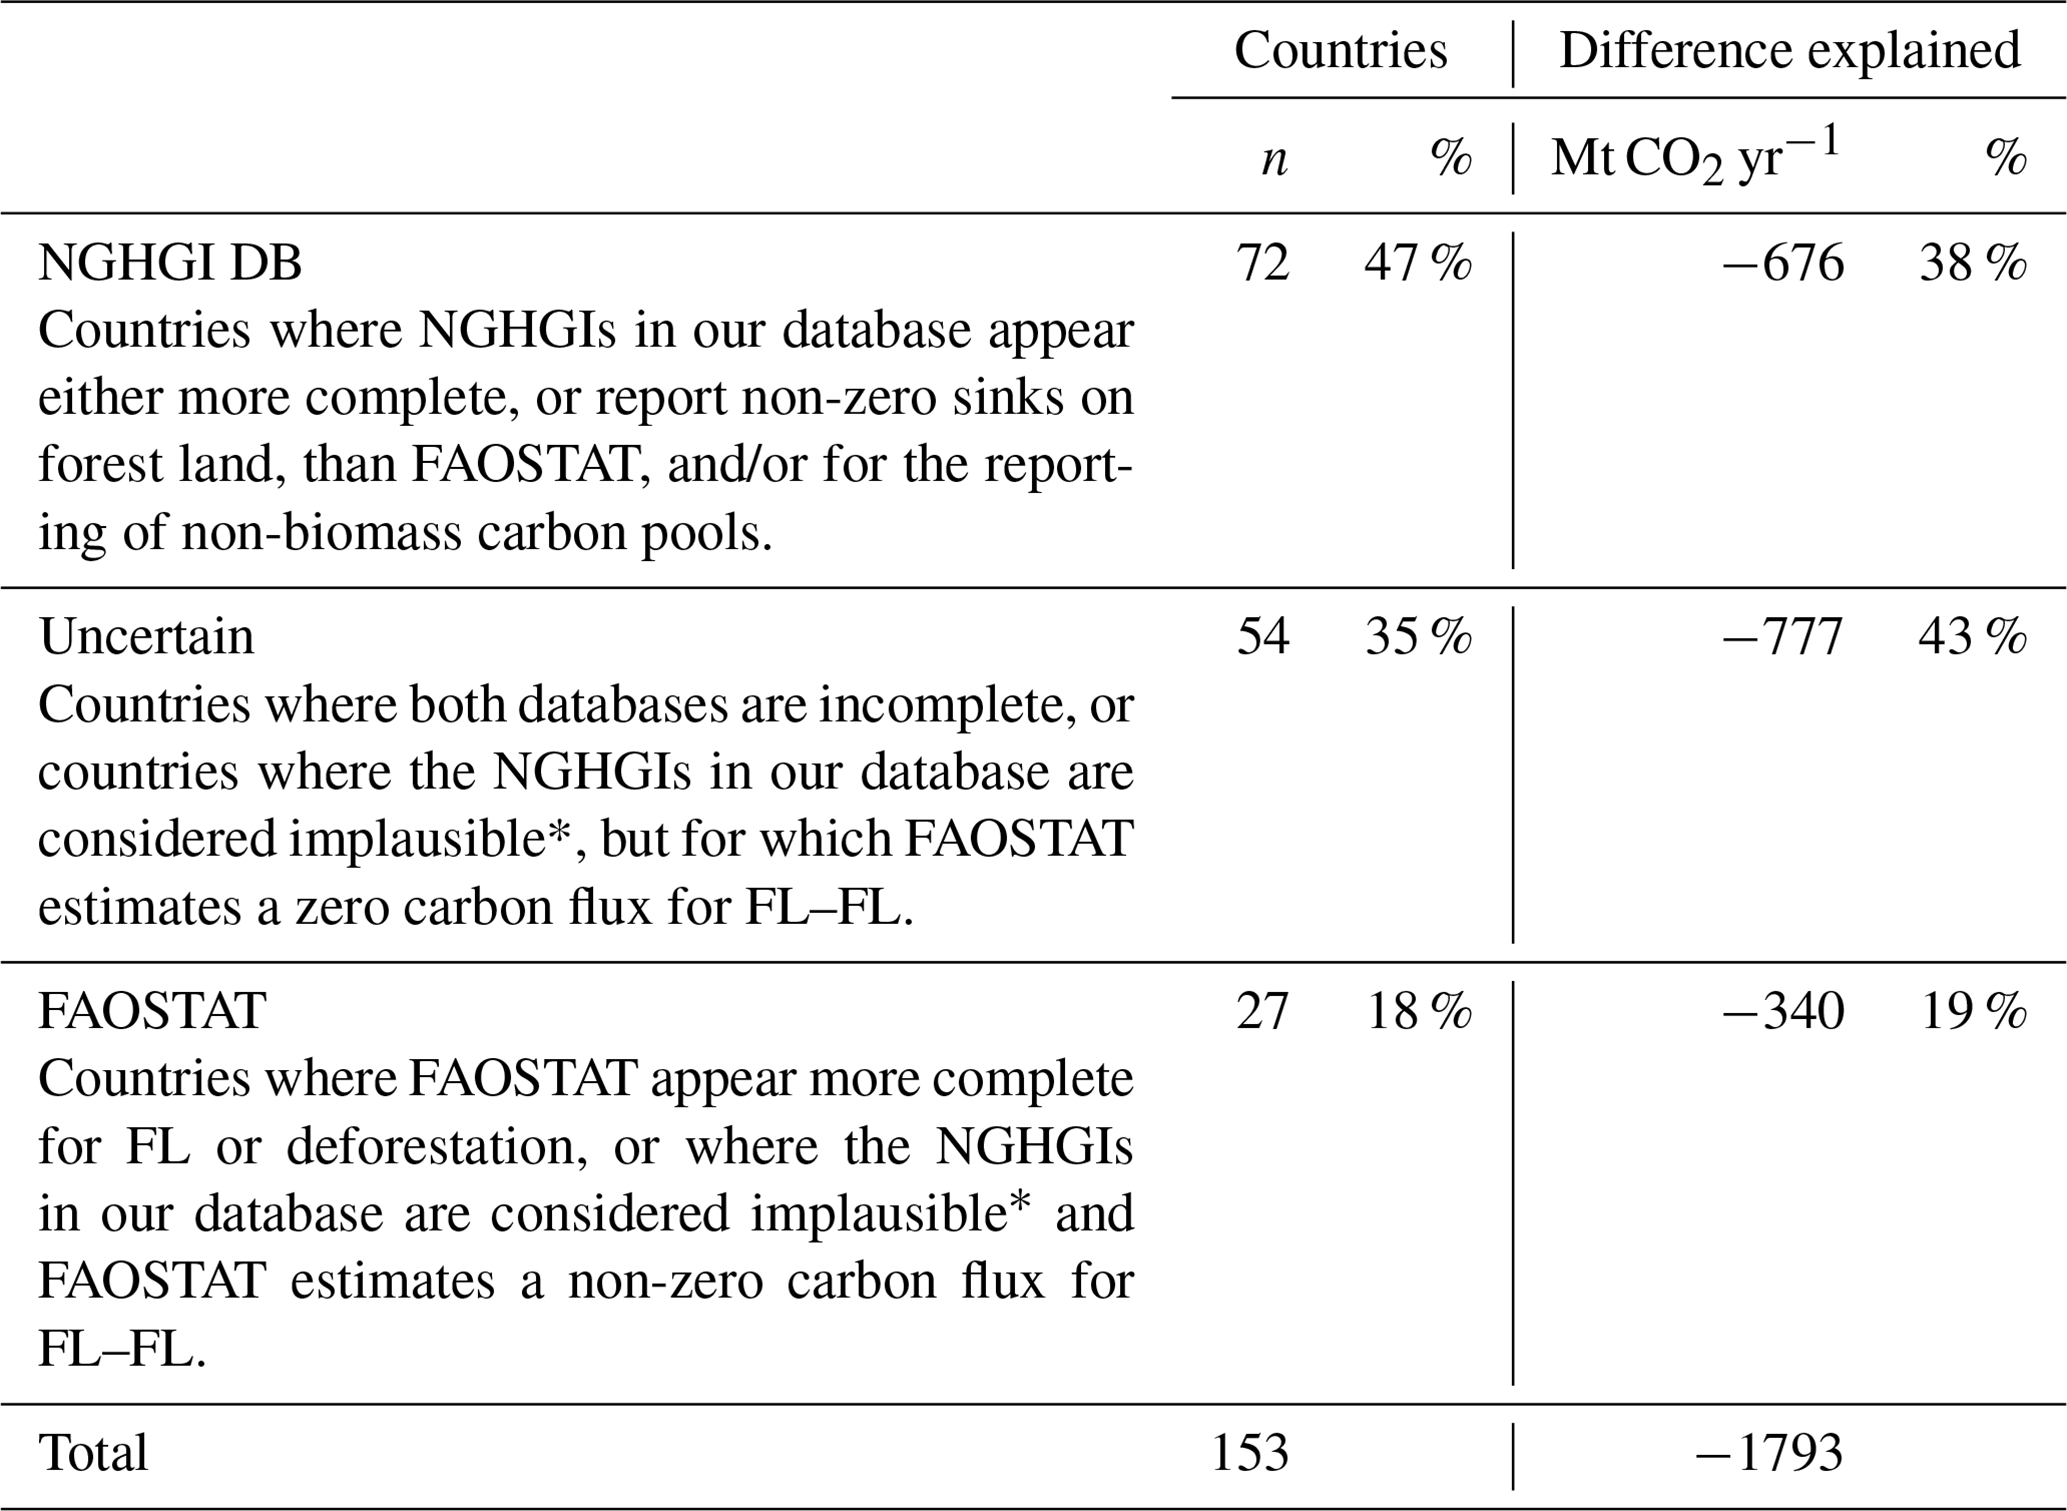
* Where the forest sink is greater than −10 tCO2 ha−1 over >1 Mha, see Methods.
In NAI countries, the fluxes in the category “other” in our NGHGI DB, which are not included in FAOSTAT, represent a net sink of −0.35 Gt CO2 yr−1, mostly from cropland and grasslands in China and India. For organic soils, FAOSTAT's estimates include several NAI countries that do not report such emissions in the NGHGIs; this may explain 0.06 Gt CO2 yr−1 difference between our NGHGI DB and FAOSTAT.
To gain more confidence in our analysis for NAI countries, we made an additional assessment of the completeness/uncertainty of reporting for FL and deforestation in our NGHGI DB and FAOSTAT (including the country reports to FRA). We took into account the cases of implausible forest sink in few NGHGIs whenever the carbon flux for FL–FL is zero in FAOSTAT and the carbon pools considered in the two sources (see Methods). This assessment should be considered as broadly indicative of the level of process coverage of the two datasets with the aim to help potential users.
Results show (Table 9, see also Fig. S2) that for 72 NAI countries the NGHGI DB appears more complete/less uncertain than FAOSTAT on carbon fluxes. This occurs especially when the NGHGI reports non-biomass pools (not included in FAOSTAT), and when FAOSTAT estimates zero carbon fluxes on FL–FL (because of a single value of carbon stock reported over time in many country FRA reports). In the latter case, we assume that one or more estimated values of carbon flux in a NGHGI represents more information than a single value of carbon stock reported over a period of time in a FRA report. It should be noted that here we speak of “completeness/uncertainty” because, according to the IPCC (2006) guidelines, the lack of completeness is a source of uncertainty. In 27 cases, FAOSTAT includes a more plausible forest sink or a more complete/less uncertain reporting than in our NGHGI DB, especially for deforestation in small countries. For the remaining 54 countries, both databases appear incomplete or the outcome of the assessment is uncertain.

Figure 7Disaggregation of the differences in net global LULUCF CO2 fluxes (average 2000–2020) between the NGHGI DB presented in this study and FAOSTAT (upper right column), and between the NGHGI DB and the UNFCCC GHG data interface (UNFCCC GHGDI) (bottom right column). Whiskers indicate the estimated global uncertainty (95 % confidence interval) on the net LULUCF flux for the NGHGI DB (see Methods) and FAOSTAT (Tubiello et al., 2021). See text for details.
Figure 7 summarises the outcome of our analysis, for both AI and NAI countries, to help understand the reasons for the large differences between our NGHGI DB and FAOSTAT (−2.7 Gt CO2 yr−1 on average for 2000–2020), and the NGHGI DB and the UNFCCC GHGDI (+3.8 Gt CO2 yr−1).
In the first case, for AI countries we assume the NGHGI DB to be more complete in terms of land categories and carbon pools than FAOSTAT. For NAI countries, we distinguish cases when (i) the NGHGI DB is more complete on non-forest land uses, or more complete/less uncertain on forest land and deforestation (reflecting the analysis in Table 9) than FAOSTAT; (ii) it is unclear which source is more complete; and (iii) FAOSTAT is either more plausible or more complete than the NGHGI DB. Overall, 59 % of the total difference between the NGHGI DB and FAOSTAT (1.6 Gt CO2 yr−1, striped blue parts in the upper right column in Fig. 7) may be explained by a more complete/less uncertain reporting (in terms of land categories and carbon pools) by the underlying NGHGIs included in our dataset, in both AI and NAI countries (see also Table 9). For another 26 % of the gap (0.7 Gt CO2 yr−1, dotted grey part in the upper right column in Fig. 7), it is difficult to identify a clear reason, and often both datasets appear not very robust. The remaining 15 % (0.4 Gt CO2 yr−1, yellow parts in the upper right column in Fig. 7) can be explained by more plausible sinks or more complete/less uncertain reporting in FAOSTAT than in the NGHGI DB for NAI countries, including on organic soils. Based on this assessment, the hypothetical combination of the best databases for each country (i.e. NGHGI DB or FAOSTAT) would yield a global net LULUCF sink in the range between −0.5 and −1.3 Gt CO2 yr−1 (i.e. the dotted grey area in the upper right column, Fig. 7).
In the comparison between the NGHGI DB and the large sink we derived from the UNFCCCC GHGDI (UNFCCC, 2022a), we consider the NGHGI DB more complete and up to date because it uses sources not considered by the UNFCCC GHGDI (i.e. recent REDD+ and NDC submissions, and NC/BURs with the IPCC (2006) format, see Fig. 7). This suggests attention when using the UNFCCC GHGDI as basis for global analyses. In this regard, the recent UNFCCC synthesis report for the global stocktake (UNFCCC, 2022b) uses more recent data from NAI countries than the UNFCCC GHGDI, resulting in a global LULUCF net sink (−3.1 Gt CO2 yr−1 for the year 2015) which is closer to the values in our NGHGI DB. Overall, the completeness of information in our NGHGI DB – including the possibility to see results by land use and submission type (see the online dataset) – makes it a unique collection of LULUCF data submitted by countries to the UNFCCC.
Data from this study are openly available via the Zenodo portal (Grassi et al., 2022), https://doi.org/10.5281/zenodo.7190601.
The NGHGI DB presented in this study provides access to an up to date, comprehensive, and gap-filled source of information on LULUCF carbon fluxes at country level, based on official country data submitted to the UNFCCC (both Annex I and non-Annex I countries). The database is disaggregated into the following components: (i) forest land (of which we track separately forest land remaining forest land, FL–FL); (ii) deforestation; (iii) organic soils; and (iv) other land fluxes (including non-forest land uses). The NGHGI DB results in a net global sink of −1.6 Gt CO2 yr−1, averaged over the period 2000–2020. This is due to a balance between a large forest land sink (−6.4 Gt CO2 yr−1, mostly on FL–FL), and a large land source from deforestation (+4.4 Gt CO2 yr−1). Other relevant fluxes include those from drainage and burning of organic soils (+0.9 Gt CO2 yr−1), and from other land uses (−0.6 Gt CO2 yr−1). Furthermore, our analysis reinforces the urgency for the global models used in the Global Carbon Budget (Friedlingstein et al., 2022) to address research questions such as: is managed land a net sink or a net source globally? Have rates of deforestation in the tropics been increasing or decreasing in the last two decades? How important are emissions from non-forest lands?
With reference to the range of UNFCCC data that are used as input into the NGHGI DB, Annex I countries explicitly identify area of managed land (for which anthropogenic GHG fluxes are to be reported) and unmanaged land. Conversely, only few non-Annex I make this distinction explicit in their reported data. In the absence of more specific information, and in line with the basic scope of UNFCCC reporting, we assume that all fluxes reported are anthropogenic, and that the corresponding land area is managed. For the future, a more explicit identification by non-Annex I countries of what is considered managed area and anthropogenic GHG flux would be important to achieve more clarity on the global LULUCF fluxes.
Our NGHGI database is then compared with two LULUCF datasets that are conceptually close and also based on country data: the UNFCCC GHG data interface, which reports a global net sink of −5.4 Gt CO2 yr−1, and the LULUCF component of the FAOSTAT emissions database, which results in a global net source of +1.1 Gt CO2 yr−1 averaged over the same 2000–2020 period. In the first case, the difference is due to the fact that our NGHGI DB includes more recent data from NAI countries than the UNFCCC GHGDI, including from REDD+ and NDC submissions.
In the second case, the NGHGI DB reports larger deforestation fluxes than FAOSTAT (+25 % difference, within the underlying uncertainty in both products), possibly due to the fact that FAOSTAT's estimates are typically based on net forest area change, rather than gross deforestation as usually done by NGHGIs, and use a single country value of forest carbon stock density for both primary/secondary and planted forest. On the other hand, some NGHGIs may include shifting agriculture in their deforestation emissions.
Importantly, the NGHGI DB results in a sink on forest land (−6.4 Gt CO2 yr−1) which is much larger than FAOSTAT (−3.2 Gt CO2 yr−1 on average over 2000–2020), especially in non-Annex I countries, and show a different trend for the most recent years. While it can be assumed that no or few countries with major deforestation rates are missing from both datasets, significant data gaps exist in non-Annex I countries with respect to fluxes on forest land. In particular, the carbon flux on FL–FL (where the majority of the forest carbon flux typically occurs) is not estimated or estimated as null over large areas, i.e. 272 Mha in the NGHG DB and 905 Mha in FAOSTAT. Whereas the use of IPCC gain–loss method allows most NAI NGHGIs to estimate a forest carbon flux, the underlying data are uncertain (e.g. on forest growth, especially for recent years) or may be biased (e.g. harvest may be underestimated). By contrast, when country-level data on carbon stock changes are lacking in the FRA reports (especially in Africa for the entire 2000–2020 time series, and in many countries across the globe for the years after 2015), FAOSTAT provides no or null estimates for the forest carbon flux. These gaps imply a large uncertainty in forest land, both for the level of net fluxes (with the uncertainty likely proportional to the areas above for the NGHGI DB and FAOSTAT) and the trends (especially in FAOSTAT for the most recent years), which undermines further progress in assessing the net LULUCF fluxes and mitigation efforts. In addition, the net LULUCF flux in five NGHGIs – collectively amounting to −0.9 Gt CO2 yr−1 – appears implausibly high.
Overall, most of the difference between our NGHGI DB and FAOSTAT can be explained by more complete/less uncertain reporting of carbon fluxes by the NGHGIs included in our database (Fig. 7), especially on FL–FL of non-Annex I countries, on non-biomass carbon pools and non-forest land uses. This mainly reflects the different scopes of the country reporting to FRA, which focuses on forest area and biomass stocks (upon which FAOSTAT's estimates for FL are based), and to UNFCCC, which explicitly focuses on LULUCF carbon fluxes. Indeed, compared to the data included in our NGHGI DB, FAO provides more complete information on forest areas (including primary and secondary forests and plantations) and on carbon stocks, which are important parameters for modelling purposes. Both the NGHGI DB and FAO – bearing in mind the respective strengths and weaknesses – offer a fundamental, yet incomplete, source of information on carbon-related variables, representing a key source of information for both scientific and policy communities, including under the global stocktake.
For the future, the quality of NGHGIs is expected to improve following the full implementation of the Enhanced Transparency Framework under the Paris Agreement. Based on our findings, we suggest that priority areas of improvement for non-Annex I countries – where UNFCCC reviewers and capacity building support should also focus – include the explicit identification of managed vs. unmanaged forest areas (which is crucial to understand if the reported flux is considered anthropogenic), the plausibility of the forest sink, and the completeness of reporting. For FRA data, where relevant improvements have already occurred (Nesha et al., 2021), future efforts may focus on increasing consistency with NGHGIs. Meanwhile, in the absence of appropriate data sources per country, it should be evaluated whether carbon fluxes can be estimated from reported carbon stocks over time.
In summary, although the quality and quantity of LULUCF data in NGHGIs improved considerably in recent years, our database highlights that some important gaps still remain, especially in non-Annex I countries. Addressing these gaps should be seen as a priority to increase confidence in land-use mitigation under the Paris Agreement and facilitate comparison with independent scientific estimates. With these limits in mind, the NGHGI DB presented is the most up to date and complete source of LULUCF CO2 fluxes based on country submissions to UNFCCC.
The supplement related to this article is available online at: https://doi.org/10.5194/essd-14-4643-2022-supplement.
GG led the study design with the help of SF and FNT, performed the analysis, and wrote the first draft. SF, RAV, AK, SR, MV, and JM contributed to the collection of the data from country reports. GC, MS, and ZS contributed to the analysis. All authors contributed to the drafting.
At least one of the (co-)authors is a member of the editorial board of Earth System Science Data. The peer-review process was guided by an independent editor, and the authors also have no other competing interests to declare.
The views expressed are purely those of the writers and may not under any
circumstances be regarded as stating an official position of the European
Commission, FAO, or any other institution.
Publisher’s note: Copernicus Publications remains neutral with regard to jurisdictional claims in published maps and institutional affiliations.
The authors thank Anssi Pekkarinen for the constructive comments to a draft version of the paper, and Werner A. Kurz for the data on HWP and natural disturbances for Canada.
This research has been supported by the EU's Horizon 2020 VERIFY project (grant no. 776810).
This paper was edited by David Carlson and reviewed by Richard Houghton and Philippe Ciais.
Australia: National Inventory Report (NIR), https://unfccc.int/documents/478957, last access: 10 July 2022.
Canada: National Inventory Report (NIR), https://unfccc.int/documents/461919, last access: 10 July 2022.
Ceccherini, G., Duveiller, G., Grassi, G., Lemoine, G., Avitabile, V., Pilli, R., and Cescatti, A.: Reply to Wernick, I. K. et al., Palahi, M. et al., Nature, 592 E18–E23, 2021.
Conchedda, G. and Tubiello, F. N.: Drainage of organic soils and GHG emissions: validation with country data, Earth Syst. Sci. Data, 12, 3113–3137, https://doi.org/10.5194/essd-12-3113-2020, 2020.
Cook-Patton, S. C., Leavitt, S. M., Gibbs, D., Harris, N. L., Lister, K., Anderson-Teixeira, K. J., Briggs, R. D., Chazdon, R. L., Crowther, T. W., Ellis, P. W., Griscom, H. P., Herrmann, V., Holl, K. D., Houghton, R. A., Larrosa, C., Lomax, G., Lucas, R., Madsen, P., Malhi, Y., Paquette, A., Parker, J. D., Paul, K., Routh, D., Roxburgh, S., Saatchi, S., van den Hoogen, J., Walker, W. S., Wheeler, C. E., Wood, S. A., Xu, L., and Griscom, B. W.: Mapping carbon accumulation potential from global natural forest regrowth, Nature, 585, 545–550, 2020.
COP26: Glasgow leaders' declaration on forests and land use, UN Climate Change Conference, Glasgow, 2 November 2021, https://ukcop26.org/glasgow-leaders-declaration-on-forests-and-land-use/ (last access: 10 July 2022), 2021.
Deng, H., Su, Y., Liao, Z., and Wu, J.: Proposal of Implementation Framework of Cooperative Approaches and Sustainable Development Mechanism, Sustainability, 14, 655, https://doi.org/10.3390/su14020655, 2022.
Donegan, E. and Sandker, M.: Outcomes and Influences of REDD+ Implementation on Carbon, in: Forests, Climate, Biodiversity and People: Assessing a decade of REDD+, edited by: Parrotta, J., Mansourian, S., Wildburger, C., and Grima, N., IUFRO World Series Volume 40, Vienna, ISBN 978-3-903345-14-0, https://www.iufro.org/fileadmin/material/publications/iufro-series/ws40/ws40.pdf (last access: 10 July 2022), 2022.
FAO: Global Forest Resources Assessment 2020: Main Report, FAO, Rome, http://www.fao.org/documents/card/en/c/ca9825en (last access: 10 July 2022), 2020.
FAO: Emissions from agriculture and forest land, Global, regional and country trends 1990–2019 [data set], FAO, Rome, https://www.fao.org/faostat/en/#data/GT (last access: 10 July 2022), 2021.
Feng, Y., Zeng, Z., Searchinger, T. D., Ziegler, A. D., Wu, J., Wang, D., He, X., Elsen, P. R., Ciais, P., Xu, R., and Guo, Z.: Doubling of annual forest carbon loss over the tropics during the early twenty-first century, Nat. Sustain., 28, 1–8, 2022.
Friedlingstein, P., Jones, M. W., O'Sullivan, M., Andrew, R. M., Bakker, D. C. E., Hauck, J., Le Quéré, C., Peters, G. P., Peters, W., Pongratz, J., Sitch, S., Canadell, J. G., Ciais, P., Jackson, R. B., Alin, S. R., Anthoni, P., Bates, N. R., Becker, M., Bellouin, N., Bopp, L., Chau, T. T. T., Chevallier, F., Chini, L. P., Cronin, M., Currie, K. I., Decharme, B., Djeutchouang, L. M., Dou, X., Evans, W., Feely, R. A., Feng, L., Gasser, T., Gilfillan, D., Gkritzalis, T., Grassi, G., Gregor, L., Gruber, N., Gürses, Ö., Harris, I., Houghton, R. A., Hurtt, G. C., Iida, Y., Ilyina, T., Luijkx, I. T., Jain, A., Jones, S. D., Kato, E., Kennedy, D., Klein Goldewijk, K., Knauer, J., Korsbakken, J. I., Körtzinger, A., Landschützer, P., Lauvset, S. K., Lefèvre, N., Lienert, S., Liu, J., Marland, G., McGuire, P. C., Melton, J. R., Munro, D. R., Nabel, J. E. M. S., Nakaoka, S.-I., Niwa, Y., Ono, T., Pierrot, D., Poulter, B., Rehder, G., Resplandy, L., Robertson, E., Rödenbeck, C., Rosan, T. M., Schwinger, J., Schwingshackl, C., Séférian, R., Sutton, A. J., Sweeney, C., Tanhua, T., Tans, P. P., Tian, H., Tilbrook, B., Tubiello, F., van der Werf, G. R., Vuichard, N., Wada, C., Wanninkhof, R., Watson, A. J., Willis, D., Wiltshire, A. J., Yuan, W., Yue, C., Yue, X., Zaehle, S., and Zeng, J.: Global Carbon Budget 2021, Earth Syst. Sci. Data, 14, 1917–2005, https://doi.org/10.5194/essd-14-1917-2022, 2022.
Gatti, L. V, Basso, L. S., Miller, J. B., Gloor, M., Gatti Domingues, L., Cassol, H. L. G., Tejada, G., Aragão, L. E. O. C., Nobre, C., Peters, W., Marani, L., Arai, E., Sanches, A. H., Corrêa, S. M., Anderson, L., Von Randow, C., Correia, C. S. C., Crispim, S. P., and Neves, R. A. L.: Amazonia as a carbon source linked to deforestation and climate change, Nature, 595, 388–393, 2021.
Grassi, G., House, J., Dentener, F., Federici, S., den Elzen, M., and Penman, J.: The key role of forests in meeting climate targets requires science for credible mitigation, Nat. Clim. Change, 7, 220–226, 2017.
Grassi, G., House, J., Kurz, W. A., Cescatti, A., Houghton, R. A., Peters, G. P., Sanz, M. J., Viñas, R. A., Alkama, R., Arneth, A., Bondeau, A., Dentener, F., Fader, M., Federici, S., Friedlingstein, P., Jain, A. K., Kato, E., Koven, C. D., Lee, D., Nabel, J. E. M. S., Nassikas, A. A., Perugini, L., Rossi, S., Sitch, S., Viovy, N., Wiltshire, A., and Zaehle, S.: Reconciling global-model estimates and country reporting of anthropogenic forest CO2 sinks, Nat. Clim. Change, 8, 914–920, 2018.
Grassi, G., Stehfest, E., Rogelj, J., van Vuuren, D., Cescatti, A., House, J., Nabuurs, G., Rossi, S., Alkama, R., Viñas, R. A., Calvin, K., Ceccherini, G., Federici, S., Fujimori, S., Gusti, M., Hasegawa, T., Havlik, P., Humpenöder, F., Korosuo, A., Perugini, L., Tubiello, F. N., and Popp, A.: Critical adjustment of land mitigation pathways for assessing countries' climate progress, Nat. Clim. Change, 11, 425–434, 2021.
Grassi, G., Federici, S., Abad Viñas, R., Korosuo, A., and Rossi, S.: LULUCF data based on National GHG inventories (NGHGI DB), Zenodo, https://doi.org/10.5281/zenodo.7190601, 2022.
Griscom, B. W., Adams, J., Ellis, P. W., Houghton, R. A., Lomax, G., Miteva, D. A., Schlesinger, W. H., Shoch, D., Siikamäki, J. V., Smith, P., and Woodbury, P.: Natural Climate Solutions, P. Natl. Acad. Sci. USA, 114, 11645–11650, https://doi.org/10.1073/pnas.1710465114, 2017.
Hansen, M. C., Potapov, P. V., Moore, R., Hancher, M., Turubanova, S. A., Tyukavina, A., Thau, D., Stehman, S. V., Goetz, S. J., Loveland, T. R., and Kommareddy, A.: High-resolution global maps of 21st-century forest cover change, Science, 342, 850–853, 2013.
Harris, N. L., Gibbs, D. A., Baccini, A., Birdsey, R. A., de Bruin, S., Farina, M., Fatoyinbo, L., Hansen, M. C., Herold, M., Houghton, R. A., Potapov, P. V, Suarez, D. R., Roman-Cuesta, R. M., Saatchi, S. S., Slay, C. M., Turubanova, S. A., and Tyukavina, A.: Global maps of twenty-first century forest carbon fluxes, Nat. Clim. Change, 11, 234–240, 2021.
Hubau, W., Lewis, S. L., Phillips, O. L., Affum-Baffoe, K., Beeckman, H., Cuní-Sanchez, A., Daniels, A. K., Ewango, C. E. N., Fauset, S., Mukinzi, J. M., Sheil, D., Sonké, B., Sullivan, M. J. P., Sunderland, T. C. H., Taedoumg, H., Thomas, S. C., White, L. J. T., Abernethy, K. A., Adu-Bredu, S., Amani, C. A., Baker, T. R., Banin, L. F., Baya, F., Begne, S. K., Bennett, A. C., Benedet, F., Bitariho, R., Bocko, Y. E., Boeckx, P., Boundja, P., Brienen, R. J. W., Brncic, T., Chezeaux, E., Chuyong, G. B., Clark, C. J., Collins, M., Comiskey, J. A., Coomes, D. A., Dargie, G. C., de Haulleville, T., Kamdem, M. N. D., Doucet, J.-L., Esquivel-Muelbert, A., Feldpausch, T. R., Fofanah, A., Foli, E. G., Gilpin, M., Gloor, E., Gonmadje, C., Gourlet-Fleury, S., Hall, J. S., Hamilton, A. C., Harris, D. J., Hart, T. B., Hockemba, M. B. N., Hladik, A., Ifo, S. A., Jeffery, K. J., Jucker, T., Yakusu, E. K., Kearsley, E., Kenfack, D., Koch, A., Leal, M. E., Levesley, A., Lindsell, J. A., Lisingo, J., Lopez-Gonzalez, G., Lovett, J. C., Makana, J.-R., Malhi, Y., Marshall, A. R., Martin, J., Martin, E. H., Mbayu, F. M., Medjibe, V. P., Mihindou, V., Mitchard, E. T. A., Moore, S., Munishi, P. K. T., Bengone, N. N., Ojo, L., Ondo, F. E., Peh, K. S.-H., Pickavance, G. C., Poulsen, A. D., Poulsen, J. R., Qie, L., Reitsma, J., Rovero, F., Swaine, M. D., Talbot, J., Taplin, J., Taylor, D. M., Thomas, D. W., Toirambe, B., Mukendi, J. T., Tuagben, D., Umunay, P. M., van der Heijden, G. M. F., Verbeeck, H., Vleminckx, J., Willcock, S., Wöll, H., Woods, J. T., and Zemagho, L.: Asynchronous carbon sink saturation in African and Amazonian tropical forests, Nature, 579, 80–87, 2020.
IPCC: Revised 1996 IPCC Guidelines for National Greenhouse Gas Inventories, https://www.ipcc-nggip.iges.or.jp/public/gl/invs6.html (last access: 10 July 2022), 1996.
IPCC: Good Practice Guidance for Land Use, Land Use Change and Forestry, https://www.ipcc.ch/publication/good-practice-guidance-for-land-use-land-use-change-and-forestry/ (last access: 10 July 2022), 2003.
IPCC: IPCC Guidelines for National Greenhouse Gas Inventories, https://www.ipccnggip.iges.or.jp/public/ 2006gl/ (last access: 10 July 2022), 2006.
IPCC: 2019 Refinement to the 2006 IPCC Guidelines for National Greenhouse Gas Inventories, https://www.ipcc-nggip.iges.or.jp/public/2019rf/index.html (last access: 10 July 2022), 2019.
McGlynn, E., Li, S., Berger, M. F., Amend M., and Harper, K. L.: Addressing uncertainty and bias in land use, land use change, and forestry greenhouse gas inventories, Climatic Change, 170, 5, https://doi.org/10.1007/s10584-021-03254-2, 2022.
Mooney, C., Eilperin, J., Butler, D., Muyskens, J., Narayanswamy, A., and Ahmed, N.: The Washington Post: (2021) Countries' climate pledges built on flawed data, https://www.washingtonpost.com/climate-environment/interactive/2021/greenhouse-gas-emissions-pledges-data/ (last access: 10 July 2022), The Washington Post, 2021.
Nesha, M. K., Herold, M., De Sy, V., Duchelle, A. E., Martius, C., Branthomme, A., Garzuglia, M., Jonsson, O., and Pekkarinen, A.: An assessment of data sources, data quality and changes in national forest monitoring capacities in the Global Forest Resources Assessment 2005–2020, Environ. Res. Lett., 16, 5, https://doi.org/10.1088/1748-9326/abd81b, 2021.
Ogle, S. M., Domke, G., Kurz, W. A., Rocha, M. T., Huffman, T., Swan, A., Smith, J. E., Woodall, C., and Krug, T.: Delineating managed land for reporting national greenhouse gas emissions and removals to the United Nations framework convention on climate change, Carbon Balance and Management, 13, 9, https://doi.org/10.1186/s13021-018-0095-3, 2018.
Palahí, M., Valbuena, R., Senf, C., Acil, N., Pugh, T. A., Sadler, J., Seidl, R., Potapov, P., Gardiner, B., Hetemäki, L., and Chirici, G.: Concerns about reported harvests in European forests, Nature, 592, E15–E17, 2021.
Prosperi, P., Bloise, M., Tubiello, F. N., Conchedda, G., Rossi, S., Boschetti, L., Salvatore, M., and Bernoux, M.: New estimates of greenhouse gas emissions from biomass burning and peat fires using MODIS Collection 6 burned areas, Climatic Change, 161, 415–432, 2020.
Roe, S., Streck, C., Beach, R., Busch, J., Chapman, M., Daioglou, V., Deppermann, A., Doelman, J., Emmet-Booth, J., Engelmann, J., and Fricko, O.: Land-based measures to mitigate climate change: Potential and feasibility by country, Glob. Change Biol., 27, 6025–6058, 2021.
Rossi, S., Tubiello, F. N., Prosperi, P., Salvatore, M., Jacobs, H., Biancalani, R., House, J. I., and Boschetti, L.: FAOSTAT estimates of greenhouse gas emissions from biomass and peat fires, Climatic Change 135, 699–711, 2016.
Tubiello, F. N.: FAOSTAT Forest land emissions (version July 2020), Zenodo [data set], https://doi.org/10.5281/zenodo.3941973, 2020.
Tubiello, F. N., Conchedda, G., Wanner, N., Federici, S., Rossi, S., and Grassi, G.: Carbon emissions and removals from forests: new estimates, 1990–2020, Earth Syst. Sci. Data, 13, 1681–1691, https://doi.org/10.5194/essd-13-1681-2021, 2021.
Silva Junior, C. H., Pessoa, A., Carvalho, N. S., Reis, J. B., Anderson, L. O., and Aragao, L. E.: The Brazilian Amazon deforestation rate in 2020 is the greatest of the decade, Nat. Ecol. Evol., 2, 144–145, 2021.
UNFCCC: UNFCCC GHG data, UNFCCC [data set], https://unfccc.int/process-and-meetings/transparency-and-reporting/greenhouse-gas-data/ghg-data-unfccc/ghg-data-from-unfccc, last access: March 2022a.
UNFCCC: UNFCCC Synthesis report for the technical assessment component of the first global stocktake, https://unfccc.int/documents/461466 (last access: 10 July 2022), 2022b.
Vancutsem, C., Achard, F., Pekel, J. F., Vieilledent, G., Carboni, S., Simonetti, D., Gallego, J., Aragao, L. E., and Nasi, R.: Long-term (1990–2019) monitoring of forest cover changes in the humid tropics, Sci. Adv., 7, eabe1603, https://doi.org/10.1126/sciadv.abe1603, 2021.