the Creative Commons Attribution 4.0 License.
the Creative Commons Attribution 4.0 License.
 | 18 Oct 2022
Oil slicks in the Gulf of Guinea – 10 years of Envisat Advanced Synthetic Aperture Radar observations
Zhour Najoui
Nellya Amoussou
Serge Riazanoff
Guillaume Aurel
Frédéric Frappart
The Gulf of Guinea is a very active area with respect to maritime traffic as well as oil and gas exploitation. Due to the failure of some actors to comply with environmental standards, this region has been subject to a large number of oil pollution episodes. This anthropogenic oil pollution is in addition to natural oil seepage from the ocean floor. This study aims to detect oil slicks in the Gulf of Guinea and to analyse their spatial distribution using synthetic-aperture radar (SAR) images. Previous works have already locally mapped oil slicks in this area; however, to our knowledge, this study is the first to achieve a global statistical analysis based on 10 years of radar images covering 17 exclusive economic zones (EEZs) in the Gulf of Guinea. The present study is based on a database of 3644 SAR images collected between 2002 and 2012 by the Advanced Synthetic Aperture Radar (ASAR) sensor onboard the European Spatial Agency (ESA) Envisat mission, and these images allowed the identification of 18 063 oil slicks. The spatial distribution of these oil slicks is available from Zenodo: https://doi.org/10.5281/zenodo.6470470 (Najoui, 2022b). The oil slicks detected in this work encompass both oil spills of anthropogenic origin and oil seeps of natural origin (natural oil reservoir leaks). A set of 100 georeferenced oil spills is also available from Zenodo: https://doi.org/10.5281/zenodo.6907743 (Najoui, 2022a).
- Article
(15803 KB) - Full-text XML
- BibTeX
- EndNote


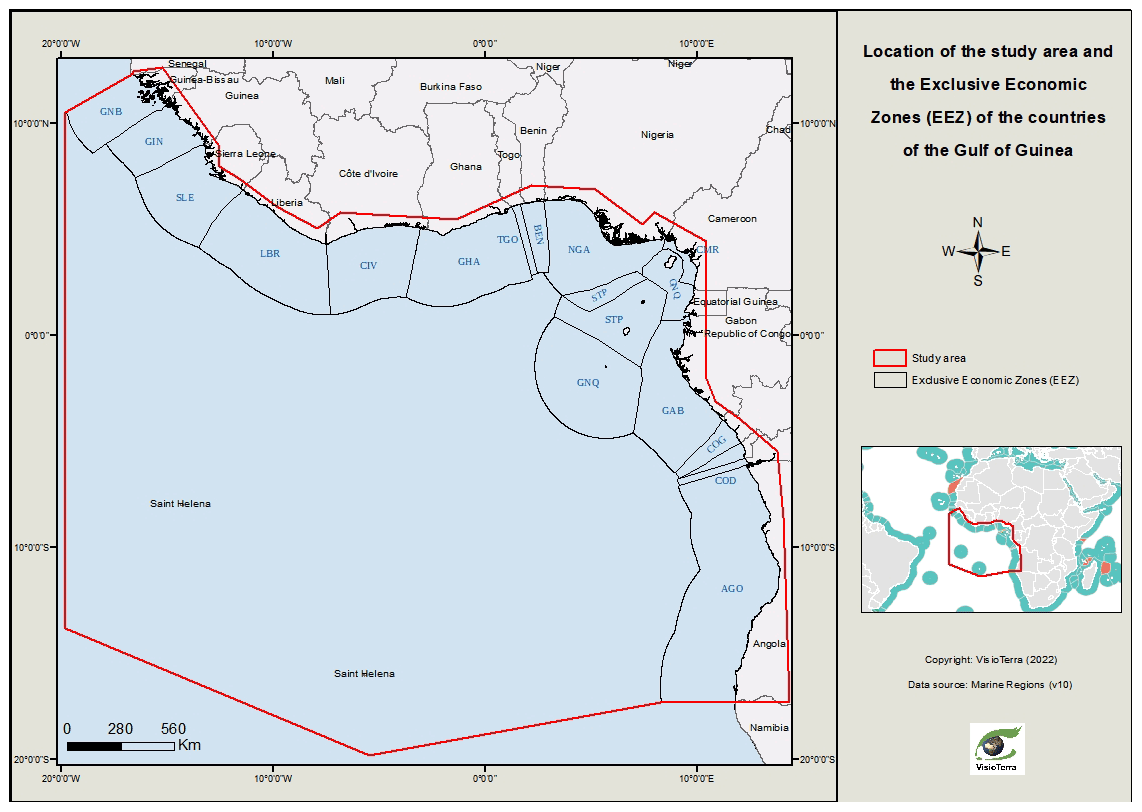
Figure 1Location of the study area in the Gulf of Guinea and the exclusive economic zones (EEZs) of the different countries.
The Deepwater Horizon (DWH) disaster that occurred on 20 April 2010 in the Gulf of Mexico aroused worldwide outrage due to both its human and environmental impacts (Leifer et al., 2012). There was great interest from the public, media, politicians, and scientists, characterized by a meticulous follow-up of the progression of the oil slicks (Caruso et al., 2013; Pinkston and Flemings, 2019). Nevertheless, the future occurrence of a disaster similar to DWH would not be surprising along the African coast and, in particular, in the Gulf of Guinea, where recurrent oil spills are observed. These spills may be caused by de-ballasting operations (Albakjaji, 2010) or oil release due to shipwrecks (Fuhrer, 2012).
Although oil constitutes an important resource for the countries of the Gulf of Guinea from an economic point of view (Ovadia, 2016), the environmental impact caused by frequent oil spills has provoked serious negative effects on both the environment and the local economy (Jafarzadeh et al., 2021; Okafor-Yarwood, 2018; Yaghmour et al., 2022). Moreover, the weakness of national monitoring and legislation control is likely to limit compliance to the major standards followed by large companies. Thus, the provision of observation tools that can enable the people of Africa to ensure sufficient monitoring and better management of the Gulf of Guinea is necessary. A possible solution for African countries to monitor offshore oil exploitation concessions is a local facility using free data such as those provided by the ESA and now the European Union (EU) in the framework of the Copernicus programme.
Synthetic-aperture radar (SAR) images have proven to be a useful tool for oil slick mapping due to the dampening effect that oil has on capillary and small gravity waves, called Bragg waves. The latter are generated on water by local winds, and they are responsible for the radar backscattering (Gade et al., 1998; Jackson et al., 2004; Mercier and Girard-Ardhuin, 2006; Shu et al., 2010; Xu et al., 2015). As a consequence, oil slicks appear darker compared with the nearby undampened water surface where Bragg waves produce brighter radar backscattering. In addition, long-term time series of radar images are freely available from 1991 (the ERS-1 mission was launched in 1991, ERS-2 was launched in 1995, Envisat was launched in 2002, Sentinel-1a was launched in 2014, and Sentinel-1b was launched in 2016), and near-real-time radar images are foreseen to be freely available until at least 2030 owing to the Sentinel constellation. This data availability allows for extensive studies of past and future pollution as well as for the operational detection of oil slicks using satellite radar imagery (Kubat et al., 1998).
In this study, SAR images acquired by the ESA Envisat mission (launched on 1 March 2002) have been used. The Envisat payload contained 10 instruments, including the Advanced Synthetic Aperture Radar (ASAR) sensor, which is the second generation of SAR instrument developed by ESA (Louet and Bruzzi, 1999). The Envisat nominal lifetime (5 years) was doubled until the loss of the satellite on 8 April 2012 (10 years).
The Gulf of Guinea is now one of the largest oil-producing regions of the world; however, very few studies have really analysed its situation with respect to oil slicks (both spills and seeps). The present study focuses on the spatial distribution of oil slicks occurring from 2002 to 2012 in the Gulf of Guinea, by exclusive economic zone (EEZ), using Envisat ASAR radar images.
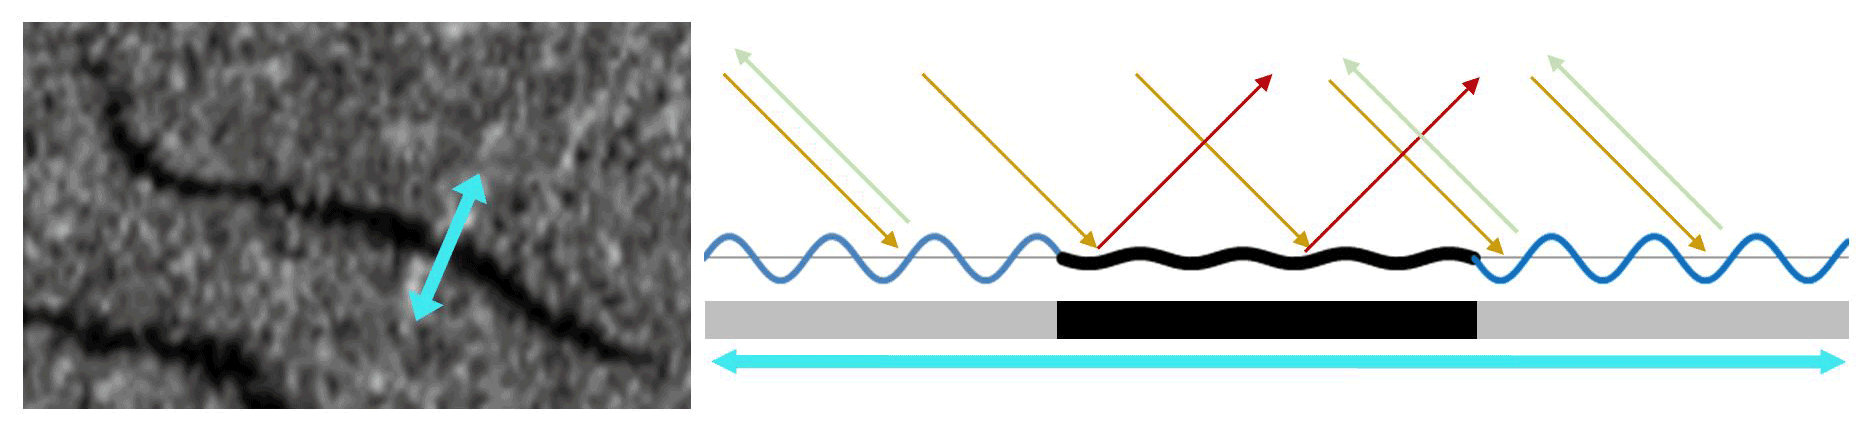
Figure 2Backscattering of the radar signal in the presence or absence of oil (Najoui, 2017).
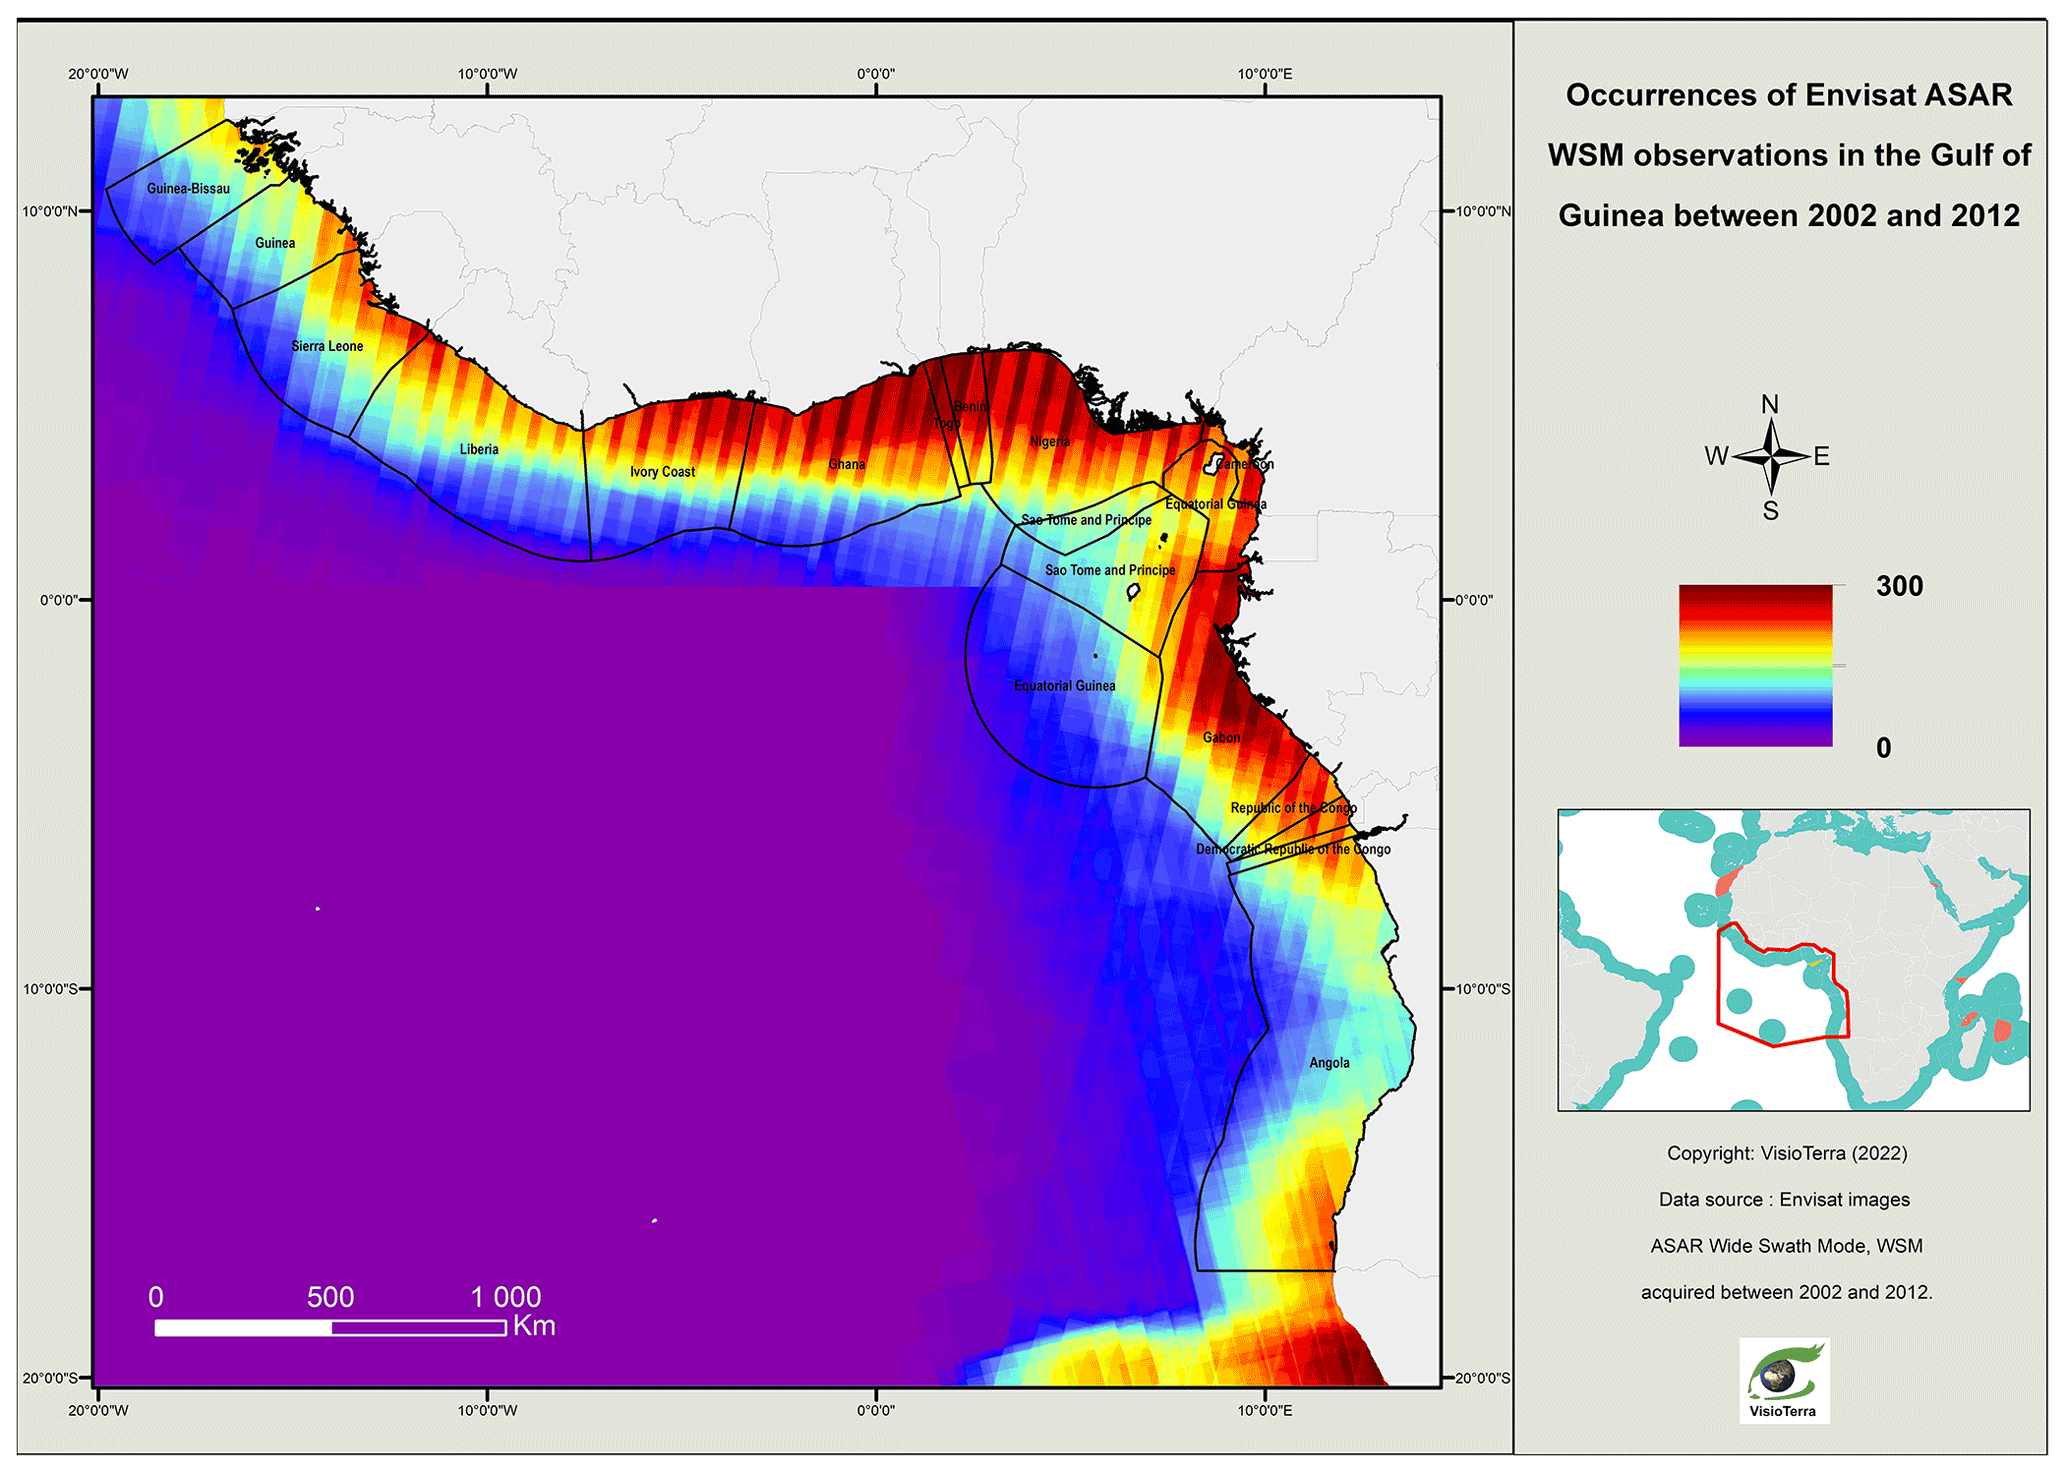
Figure 3The occurrence of Envisat ASAR wide-swath medium-resolution (WSM) observations between 2002 and 2012.
2.1 Geographic location
The radar images used in this study were acquired over the Gulf of Guinea. This region is located in the Atlantic Ocean in the south-west of Africa. According to the International Hydrographic Organization (Bassou, 2016), it extends from Guinea-Bissau to Angola and covers the EEZs of 16 countries bordering the coast (extending over 7000 km): Guinea-Bissau (GNB), Guinea-Conakry (GIN), Sierra Leone (SLE), Liberia (LBR), Côte D'Ivoire (referred to as Ivory Coast in some figures; CIV), Ghana (GHA), Togo (TGO), Benin (BEN), Nigeria (NGA), Cameroon (CMR), Equatorial Guinea (GNQ), Sao Tome and Principe (STP), Gabon (GAB), Republic of the Congo (COG), Democratic Republic of the Congo (COD), and Angola (AGO) (Fig. 1).
2.2 Geological location
Petroleum is a natural mixture composed mainly of hydrocarbons. It is formed within certain sedimentary rocks via the transformation of organic matter (e.g. plankton, plants, and animals) that is incorporated into the deposit. It is a slow and gradual process occurring in a sedimentary basin.
Indeed, the transformation of organic matter into oil spans millions of years and is punctuated by several stages, including the formation of an intermediate substance called kerogen. A given layer of sediment sinks and is buried under other layers of sediment. Depending on the filling of the basin, the heat flow, and the pressure induced by geologic processes, organic matter may change from kerogen to petroleum. As oil is less dense than water, it tends to migrate to the upper layers of the sedimentary strata. These sedimentary strata have a certain geometric configuration that is defined by the tectonic structure of the basin. During this structuring, different areas may have risen higher (anticlines) or sunk lower (synclines) relative to the rest of the stratum. When these upper zones are topped by a cover allowing the oil to escape through faults or fractures, they constitute the oil deposits that are exploited nowadays in offshore or onshore areas.
The Gulf of Guinea is located in a passive zone that has resulted from the opening of the South Atlantic Ocean which began during the Lower Cretaceous, breaking up south-west Gondwana. The climate during this period was hot, humid, and stable, which favoured the chemical weathering of the mainland. Eroded material brought chemical elements to the Gulf of Guinea; in particular, the Niger Delta transported sediments rich in hydrocarbons. These numerous characteristics make this area a source of natural seepage events, also known as oil seeps (Lawrence et al., 2002).

Figure 4ASAR wide-swath medium-resolution (WSM) images (21 December 2011), before (left) and after (right) local stretching, showing a leak from an oil platform (see Fig. 5).
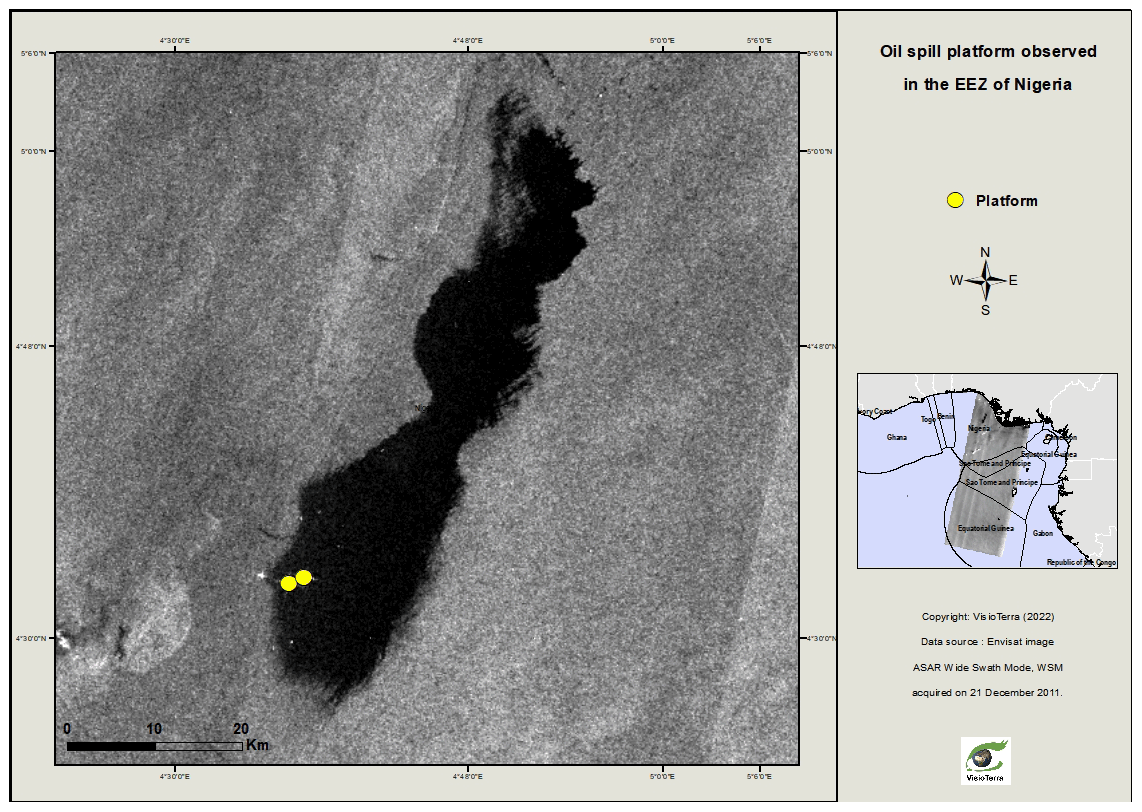
Figure 5Oil spill from a platform observed in the EEZ of Nigeria (21 December 2011). The platforms are represented by the yellow dots (see hyperlook: http://visioterra.org/VtWeb/hyperlook/504c7208cc184c12b42ed036bc9912f3, last access: 13 October 2022).
2.3 Oil exploration in the Gulf of Guinea
Compared with other areas, the Gulf of Guinea region entered the global oil landscape quite recently. In 1982, the signing of the United Nations Convention on the Law of the Sea extended the maritime territories of riparian countries (over their EEZs) to 200 nmi (≈370 km) off their coasts, which encouraged offshore exploration (Bassou, 2016). The Gulf of Guinea is now one of the largest oil-producing regions in the world.
Indeed, since the installation of its first oil platforms (anchored and floating platforms) between 1960 and 1970 (Favennec et al., 2003), the Gulf of Guinea has become one of the most popular destinations for international oil investors (Tull, 2008). The good quality of its oil justifies the attraction of foreign countries to the region (Ngodi, 2005). Since the 2000s, the area has supplied more than 55 billion barrels, i.e. 5 % of world oil production (Mfewou et al., 2018) and 60 % of total daily crude oil production in sub-Saharan Africa. Offshore operation is the default mode of oil extraction in the Gulf of Guinea (Favennec et al., 2003). The depletion of coastal shallow water (≤200 m) resources means that the relative share of deepwater exploration (450–1800 m) or even ultra-deepwater exploration (1800–3000 m) is increasing. This is the case, for example, off the coast of Angola or Gabon.
2.4 Oil pollution and environmental impacts
The Gulf of Guinea is a very active area with respect to oil exploration. The oil spills found in the region are unparalleled in frequency, and their toxicity causes serious repercussions for both the marine environment and the ecosystem (Bagby et al., 2017; Chalghmi, 2015; Khanna et al., 2018; Langangen et al., 2017; Li et al., 2019; Li and Johnson, 2019; NAE-NRC, 2012; Reuscher et al., 2020).
Several cases of accidents caused by the exploitation of offshore oil have been documented. The frequency of oil spills in the Gulf of Guinea is said to be due to factors such as oil production operations, inadequate production equipment leading to corrosion of pipelines and tanks, disasters, sabotage, and vandalism (Adelana and Adeosun, 2011).
Environmental consequences include the loss of habitat for corals and seagrass as well as the destruction of flora (reduction in mangroves and certain species of algae) and fauna (extinction of sea turtles) (Scheren et al., 2002). Oil slicks have a devastating effect on fishing activity. Many Nigerian fishers can no longer practice their profession, especially off the Niger Delta.
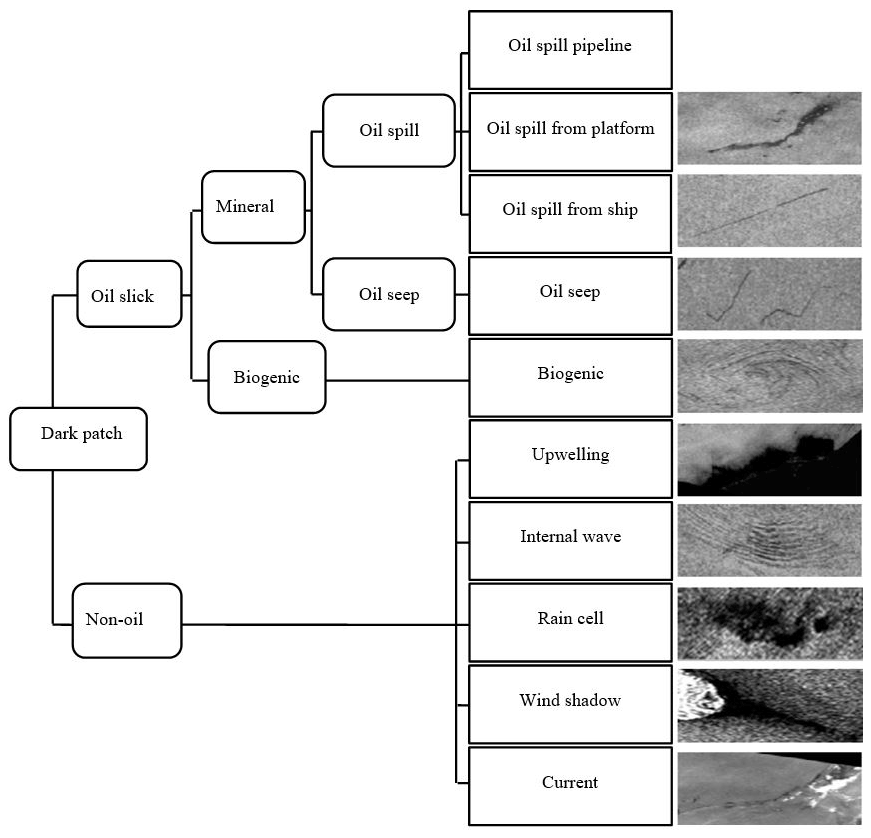
Figure 6The main offshore dark patches seen in SAR images (Najoui et al., 2018a).

Figure 7Oil seeps (1 December 2004) observed in the EEZs of Angola and the Democratic Republic of the Congo. The platforms are represented by the yellow dots.
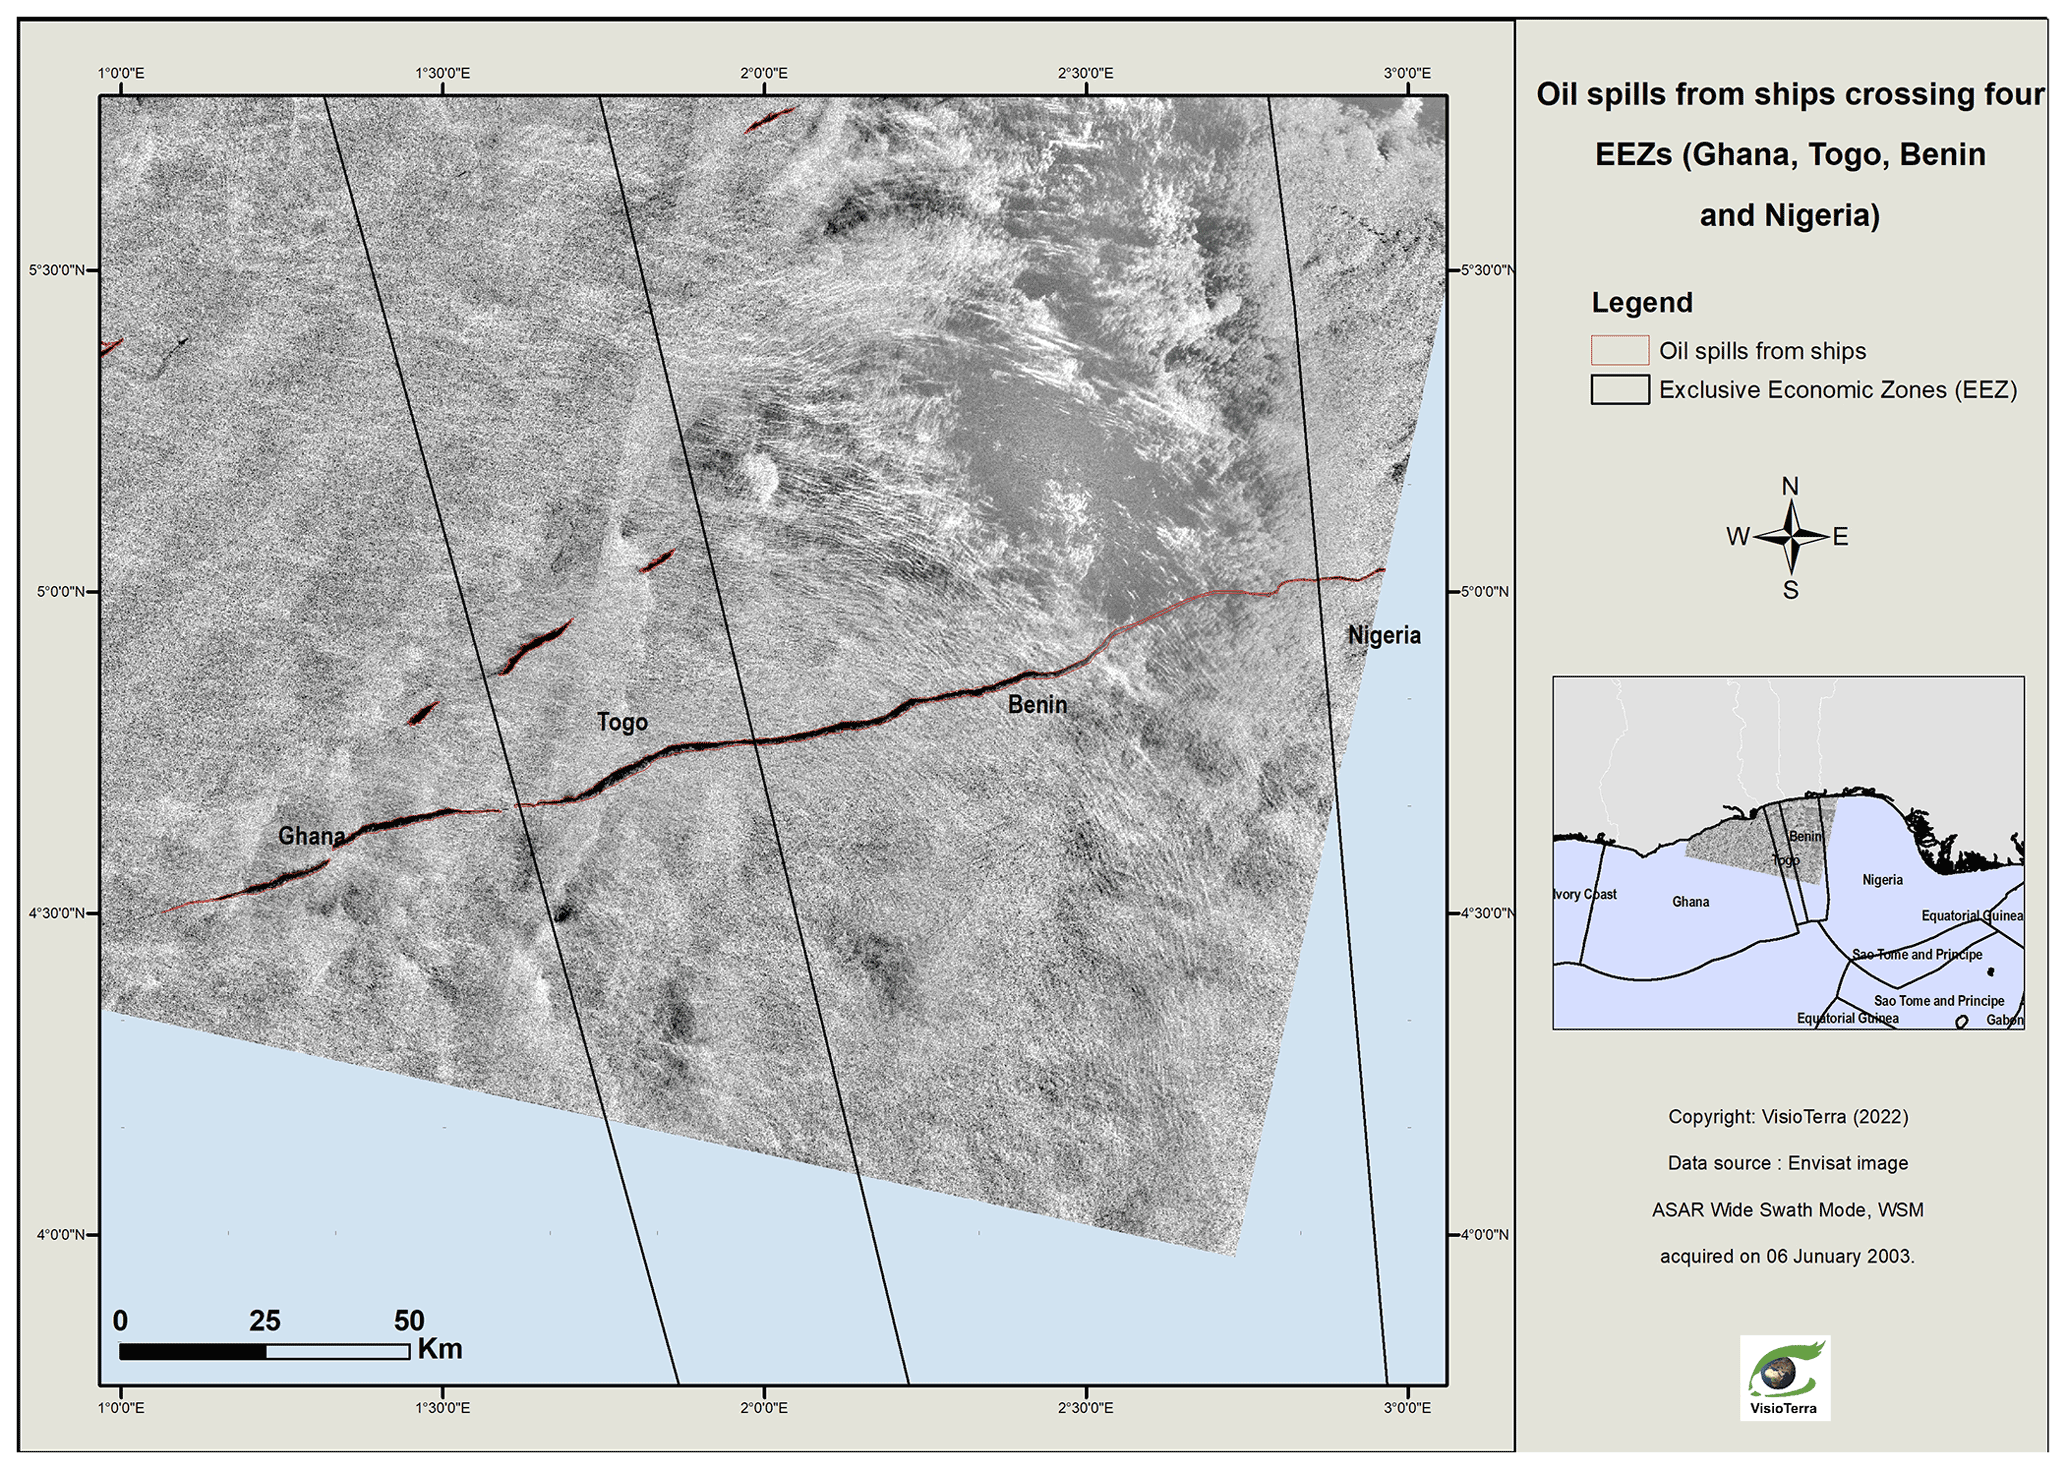
Figure 8Oil spills from ships (5 January 2003) crossing four EEZs (Ghana, Togo, Benin, and Nigeria).
3.1 Radar data
Several spaceborne SAR systems have been widely used for marine pollution monitoring and mapping (Brekke and Solberg, 2008; Del Frate et al., 2000; Dong et al., 2022; Espedal, 1999; Fiscella et al., 2000; Gade et al., 1998; Garcia-Pineda et al., 2008; Kanaa et al., 2003; Li and Johnson, 2019; Liu et al., 1997; Marghany, 2015; Solberg et al., 1999; Suresh et al., 2015). In this study, we used SAR images acquired by the Envisat ASAR instrument between 2002 and 2012. Envisat ASAR operated at a radar frequency of 5.331 GHz in the C band (4.20–5.75 GHz) in various modes including WSM (wide-swath medium-resolution) mode. WSM ASAR images were acquired along 400 km wide swaths at a spatial resolution of approximately 150 m × 150 m. WSM products are delivered with a ground pixel spacing of 75 m × 75 m. Envisat ASAR operated in one of two polarizations types: HH (horizontal transmission–horizontal reception) or VV (vertical transmission–vertical reception). ASAR WSM operated according to the ScanSAR principle, using five predetermined overlapping antenna beams (also called sub-swaths) that covered the wide swath. The ScanSAR principle consists of achieving swath widening by the use of an antenna beam that is electronically steerable with respect to elevation (Miranda et al., 2013).
On a radar image, the areas covered by oil appear as smooth dark regions with low backscattering. This is due to the damping effect that the oil produces on capillary waves and small gravity waves. On an oil-free surface, a significant part of the energy will be backscattered towards the radar; thus, the region will appear lighter (Alpers et al., 2017). The backscatter of the radar signal is also influenced by environmental conditions such as wind speed and sea state (Fingas and Brown, 2017; Zhang et al., 2014). The ideal wind speed for the detection of oil slicks is debated and differs according to the study referenced: −2 to 10 m s−1 (MacDonald et al., 2015), −1.5 to 6.5 m s−1 (Jatiault et al., 2017), or −2.09 to 8.33 m s−1 (Najoui, 2017), Vertical polarization (VV) is the most effective mode for detecting oil spills on the sea surface (Brekke and Solberg, 2008; Jatiault et al., 2017; Najoui et al., 2018b, a).

Figure 9An oil spill from a platform (1 December 2004) observed in the EEZ of Angola. The platforms are represented by the yellow dots.
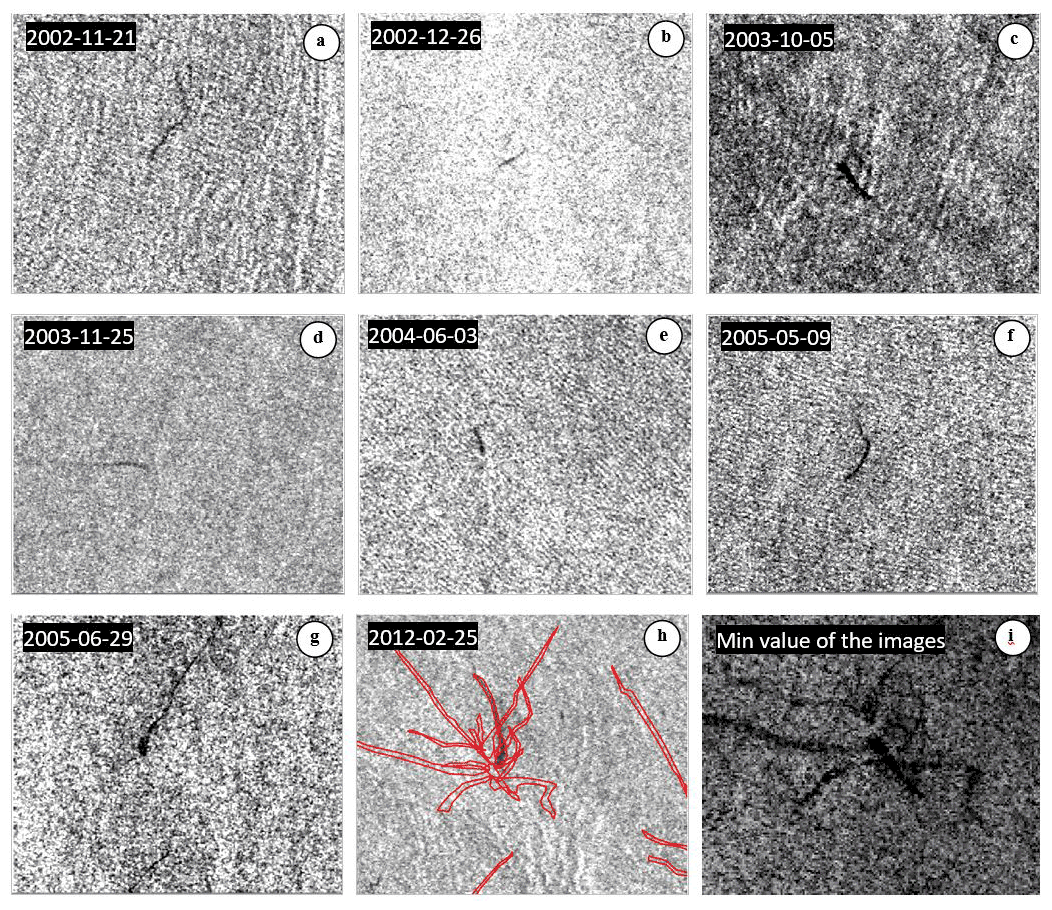
Figure 10An example of a multitemporal analysis with an “astroseep” (flower-like) structure observed in the Lower Congo basin. Images (a), (b), (c), (d), (e), (f), and (g) are Envisat ASAR images acquired on different dates with observed seeps. Image (h) shows an Envisat ASAR image with interpreted seeps. Image (i) shows the Envisat ASAR minimum image (i.e. each pixel is the minimum observed for the seven dates) with an astroseep structure.
All of the Envisat ASAR WSM scenes available in the study area have been processed, resulting in 3644 scenes after the elimination of redundant products. Figure 3 illustrates the spatial distribution of the occurrence of Envisat ASAR WSM observations in the Gulf of Guinea between 2002 and 2012. The number of WSM observations is noticeably higher near the coasts.
3.2 Image preprocessing
The database of 3644 images has been georeferenced in the geographic coordinate reference system over the World Geodetic System 1984 (WGS84) ellipsoid (WGS84 datum). A land mask has been applied, and the images have been radiometrically corrected. The radiometric correction consists of correcting the brightness variations due to SAR peculiarities. Indeed, the radar backscattering in the offshore area is dominated by non-Lambertian reflections (i.e. the surface does not reflect the radiation uniformly in all directions). This non-Lambertian reflection leads to heterogeneity in the brightness in the radar image: it is brighter along the near range (closest to the nadir line) and darker along the far range. The input images have a 16-bit digital number (DN) dynamic which requires reduction to 8 bits to be displayable on a usual screen. The applied preprocessing consists of applying local stretching with an average of 140 and a standard deviation of 60 on a 301-pixel sliding window in order to optimize the detectability of the oil slicks (Fig. 4; Najoui, 2017; Najoui et al., 2018a).
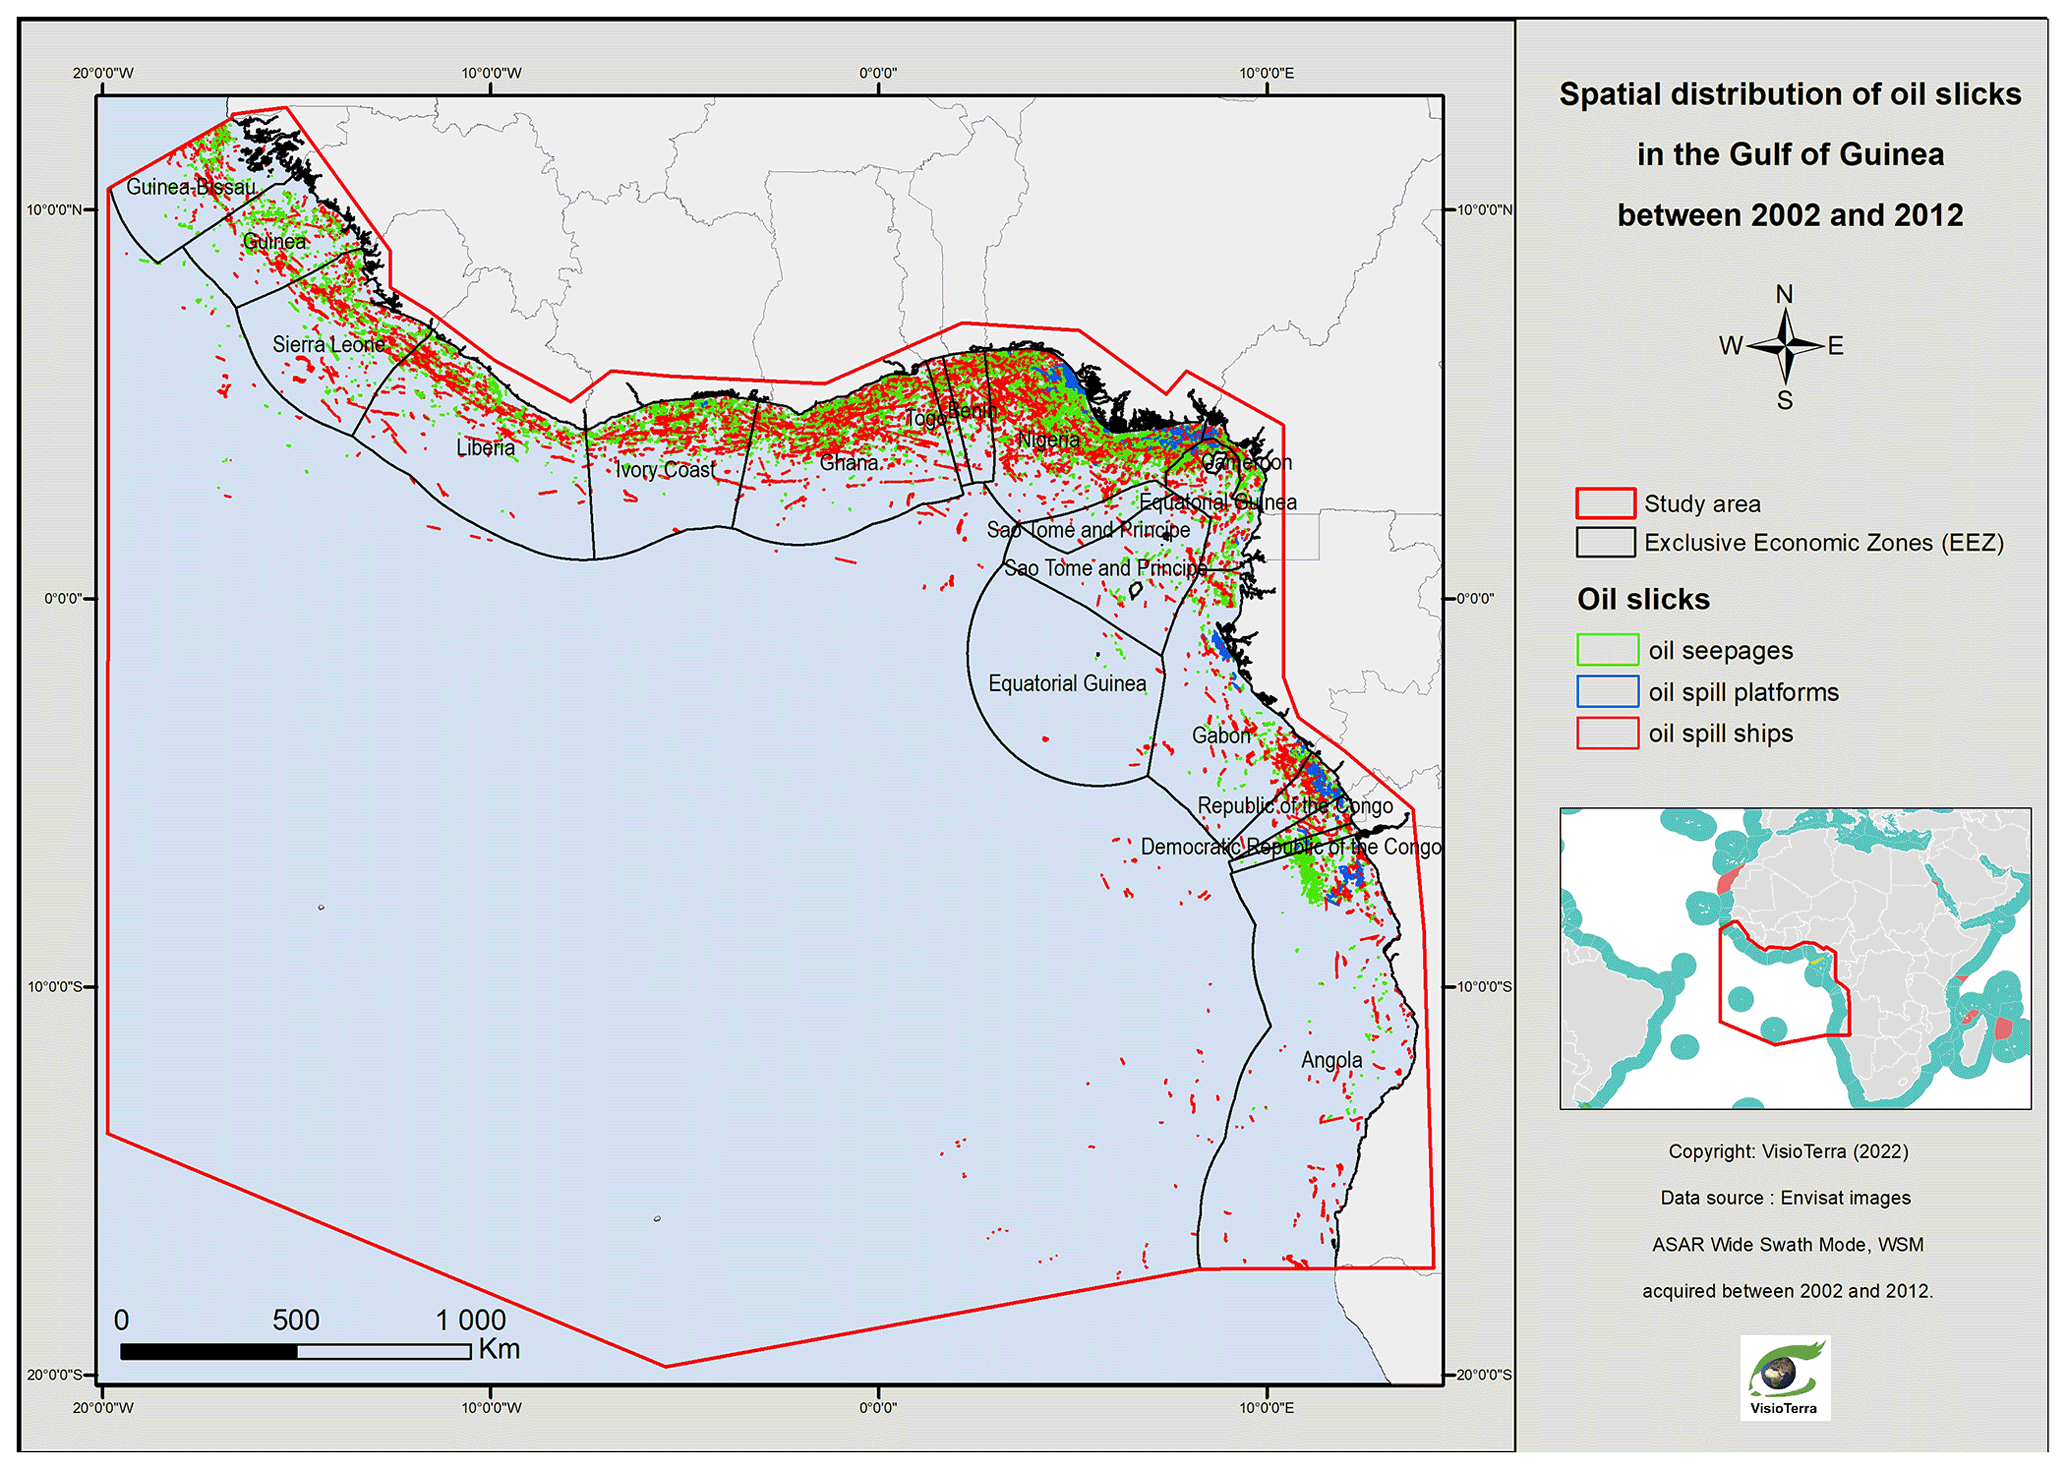
Figure 11Spatial distribution of oil slicks in the Gulf of Guinea between 2002 and 2012.
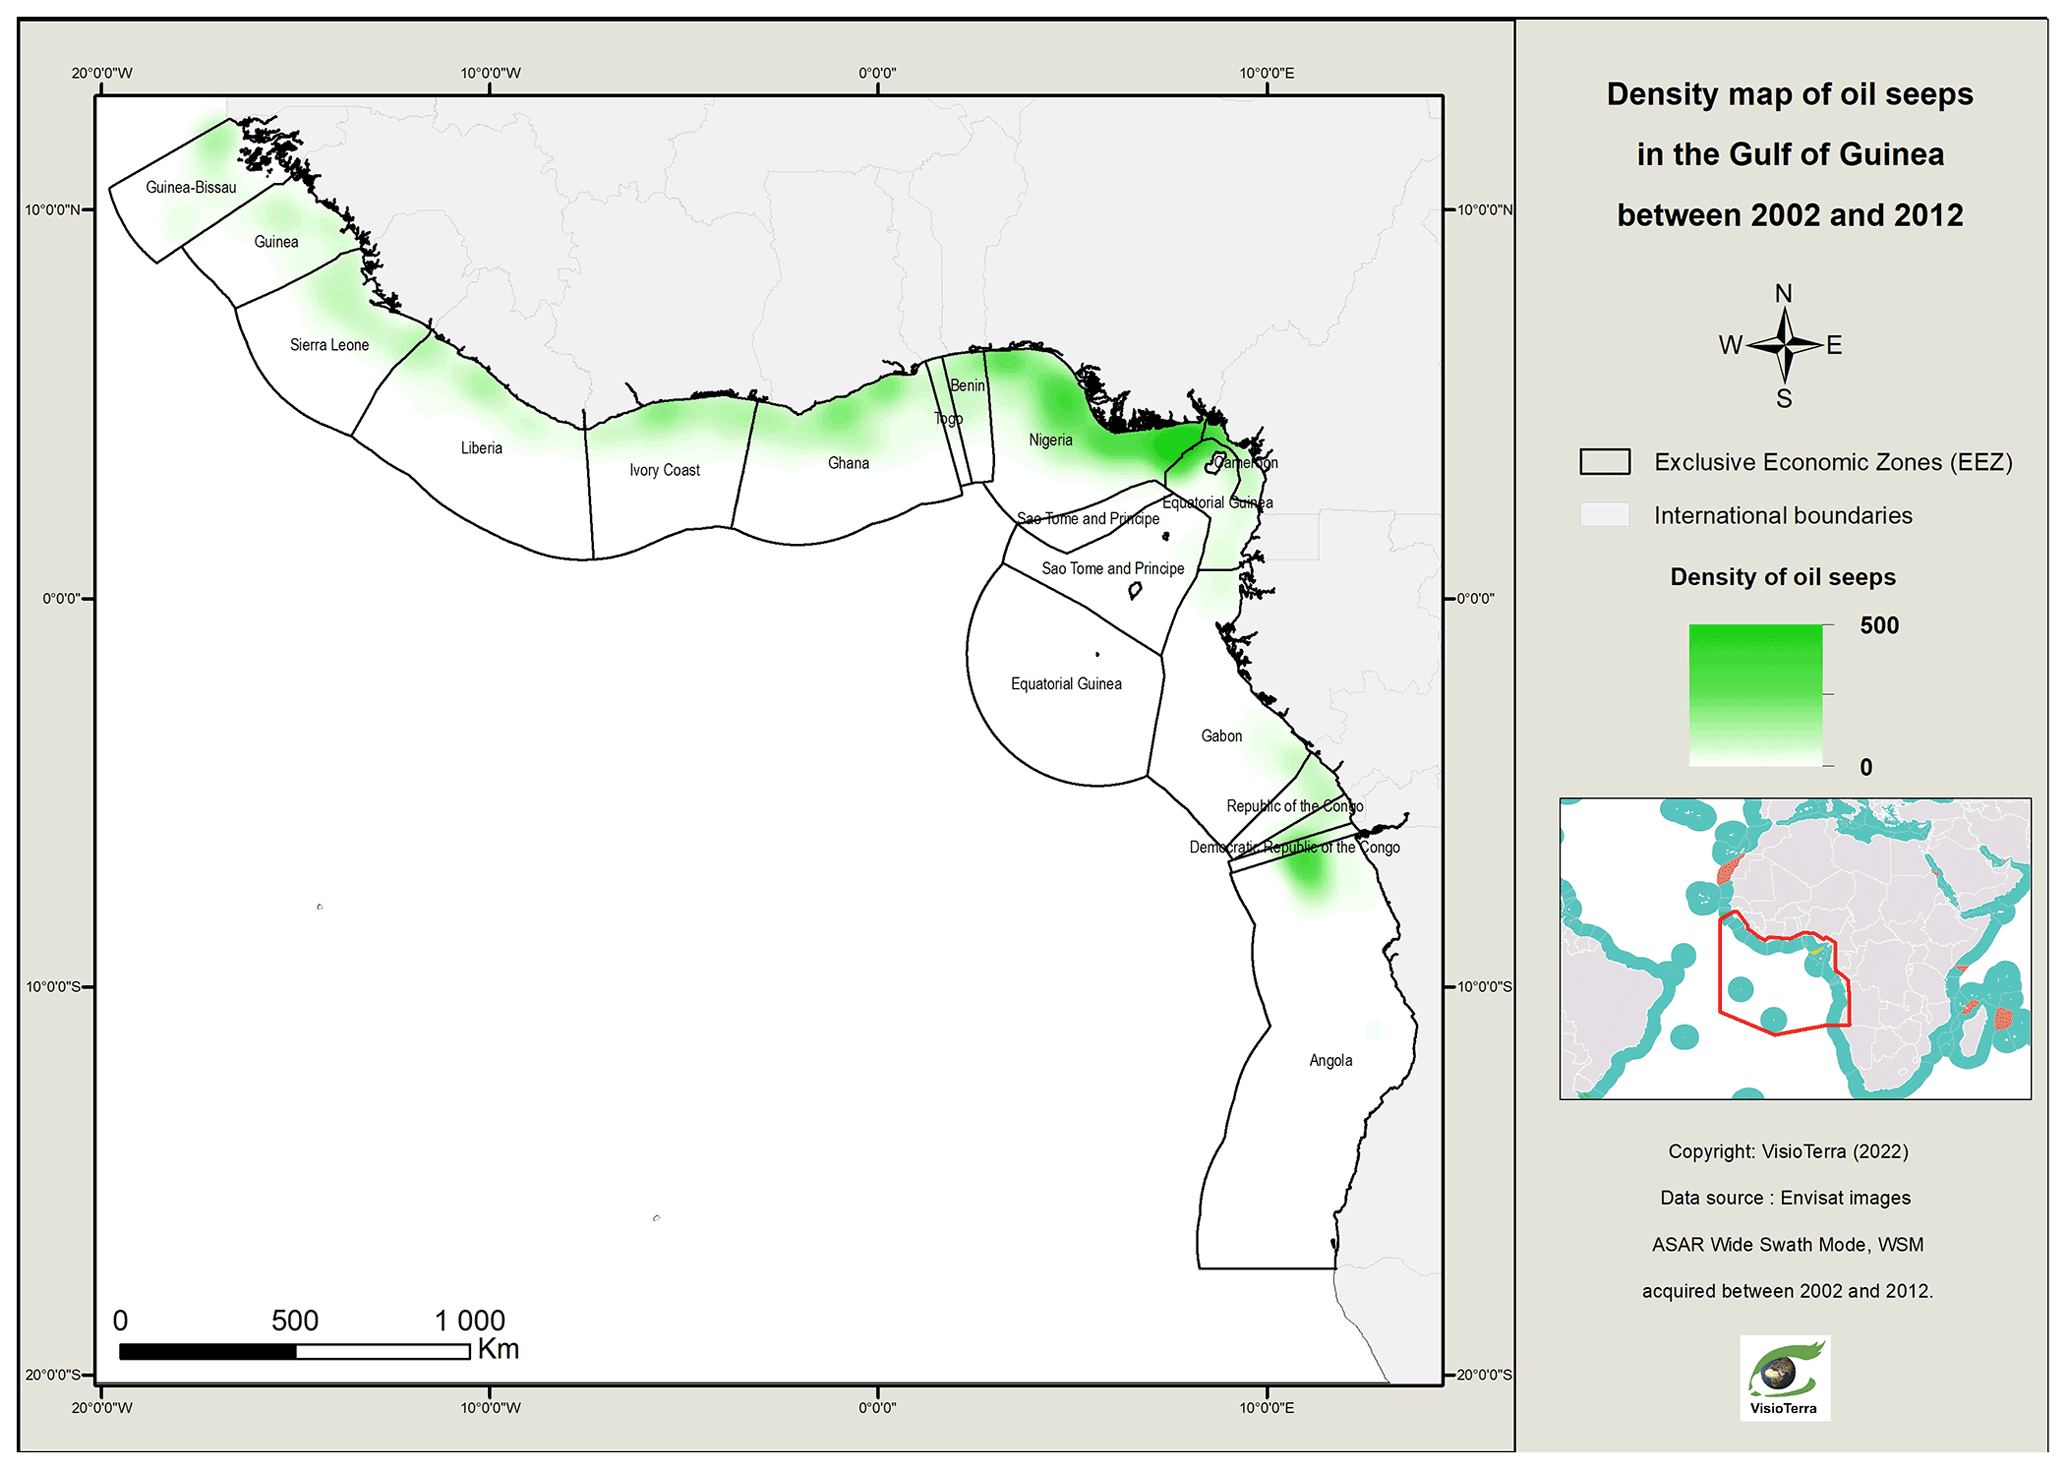
Figure 12Density map of oil seeps in the Gulf of Guinea between 2002 and 2012.
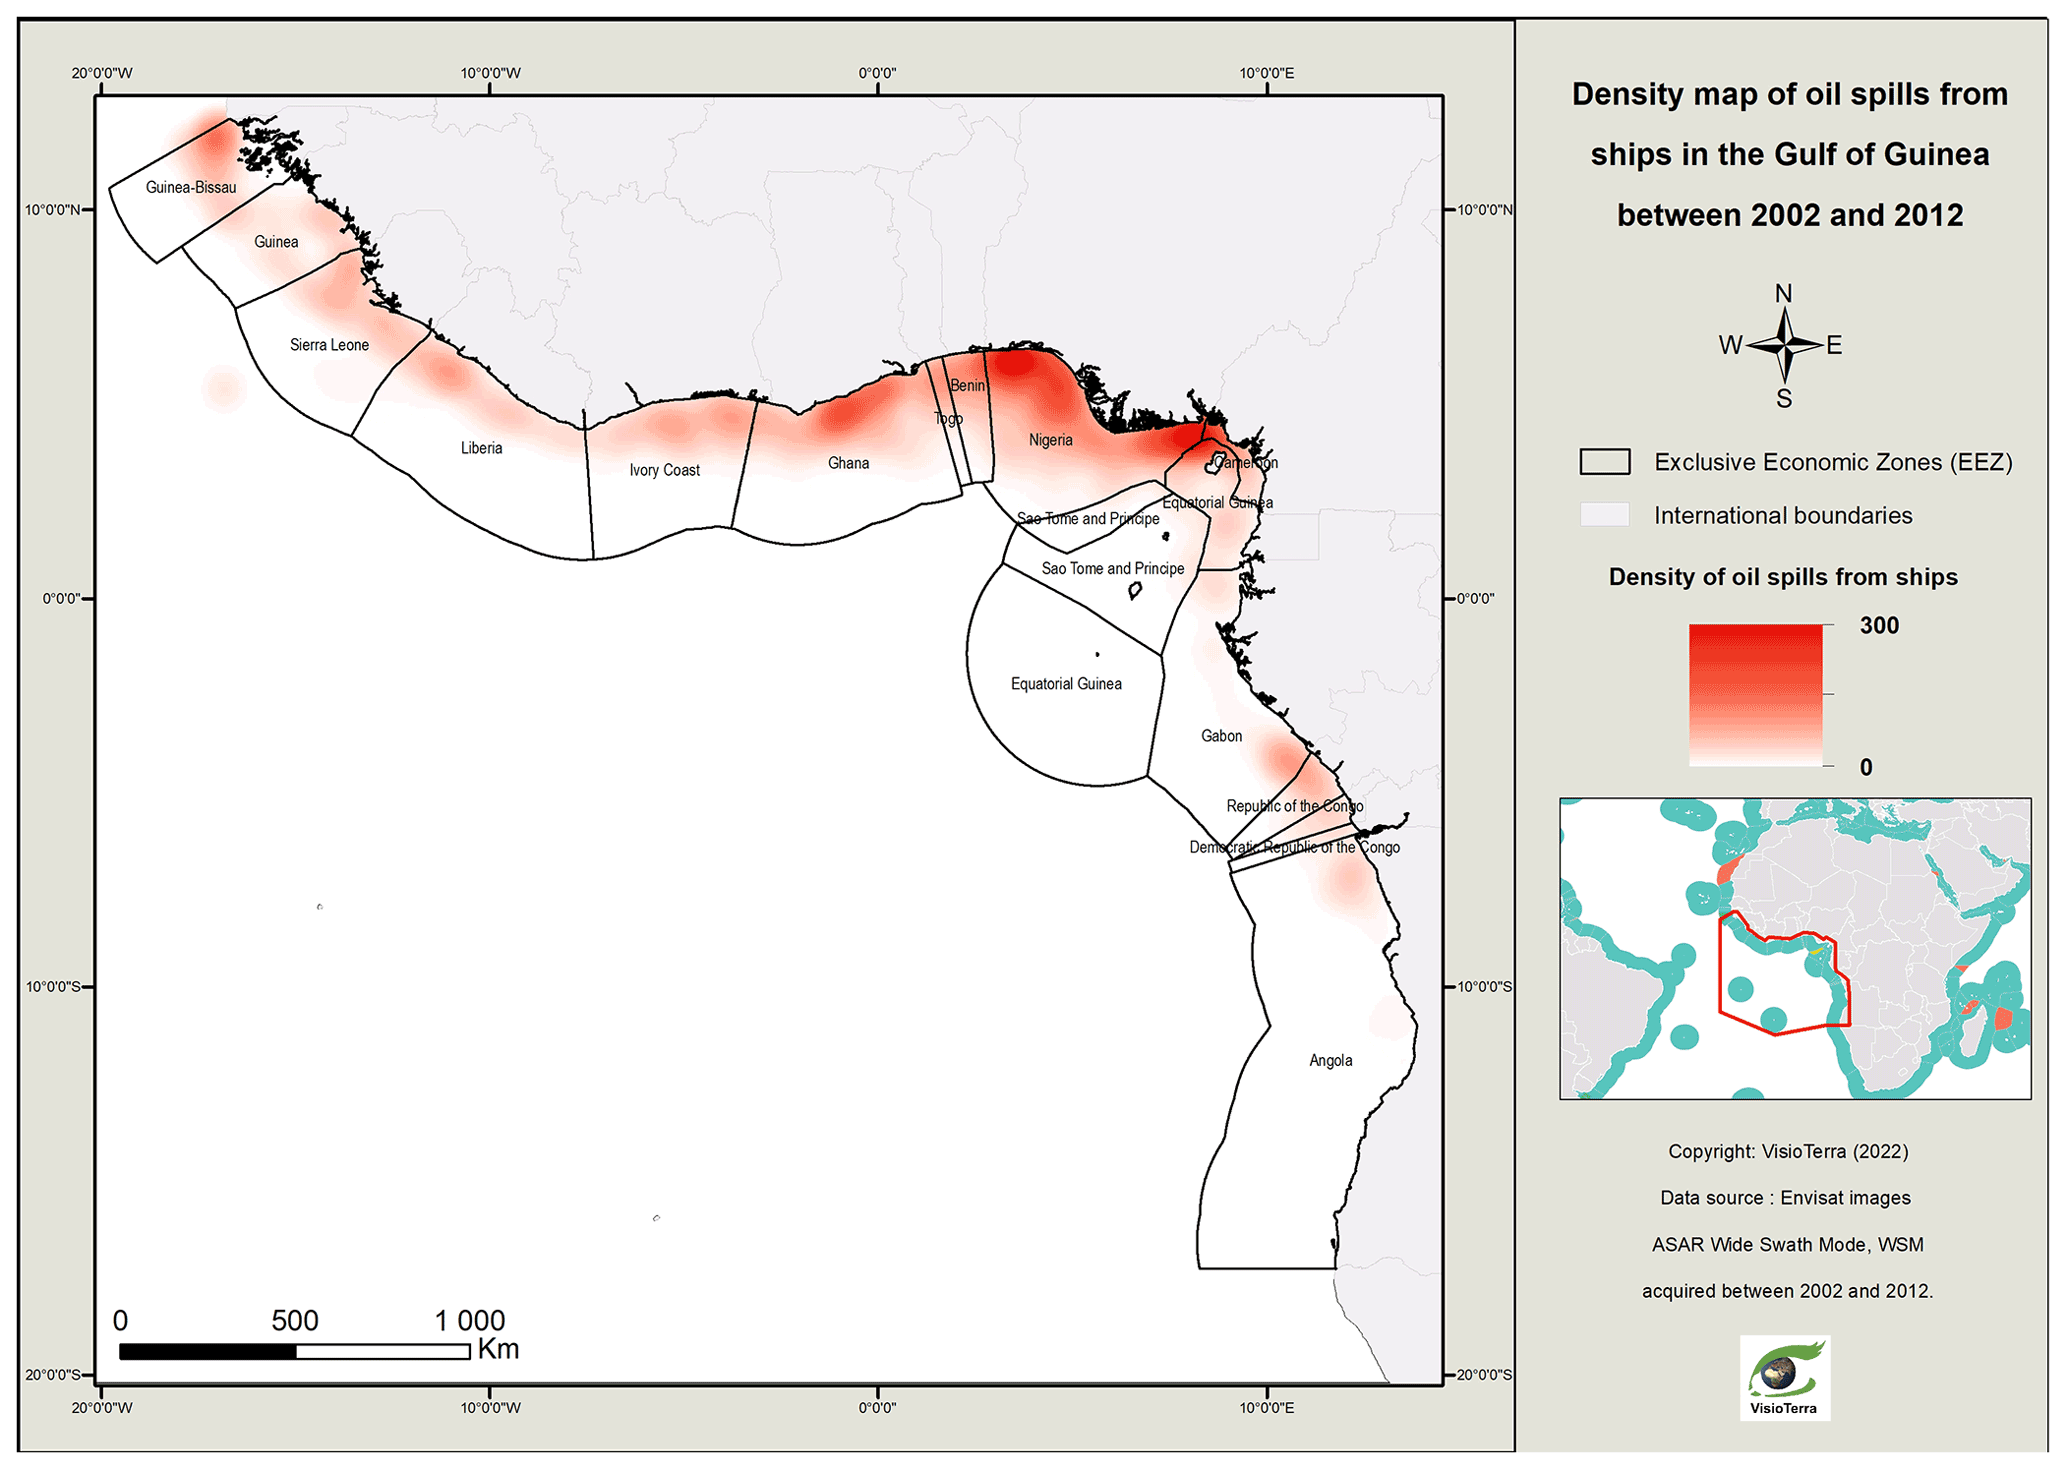
Figure 13Density map of oil spills from ships in the Gulf of Guinea between 2002 and 2012.
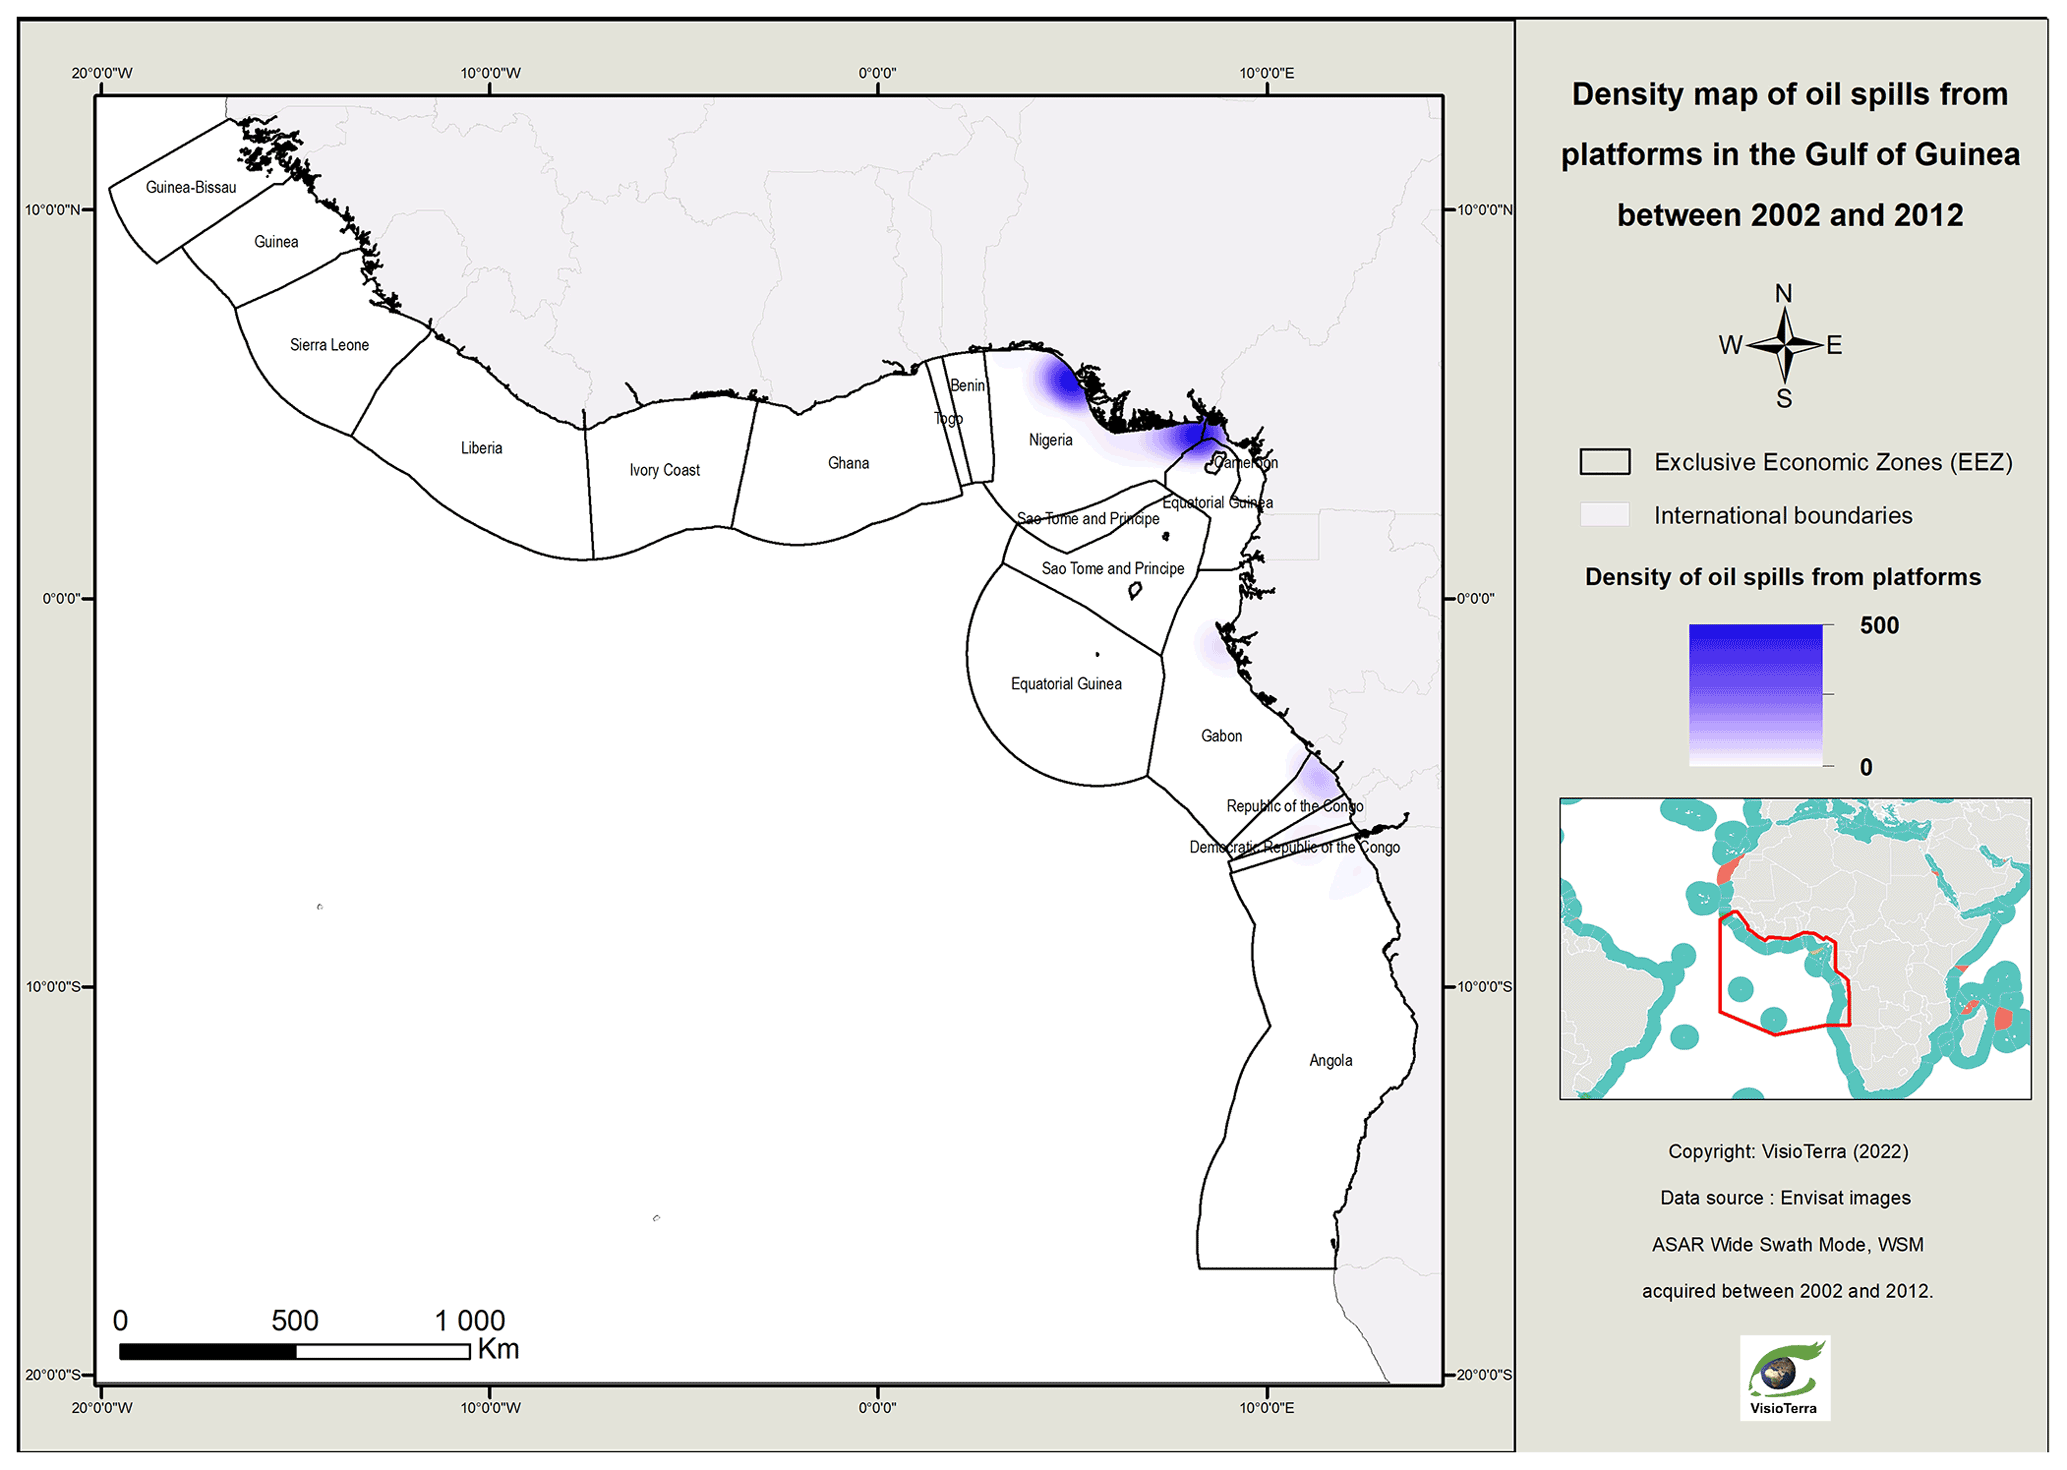
Figure 14Density map of oil spills from platforms in the Gulf of Guinea between 2002 and 2012.
3.3 Manual detection
Oil slicks appear as dark patches on radar images because they flatten the surface of the sea. However, in addition to oil slicks, many phenomena may also appear as dark patches (Fig. 6). Non-oil-related dark patches are termed “look-alike features” and include upwelling, eddies, rainfalls, wind shadows, and internal waves, among others. (Brekke and Solberg, 2005; Espedal, 1999; Najoui et al., 2018a; Xu et al., 2015). These non-oil-related features are mostly due to meteorological conditions.
The detection of oil slicks has been performed using a reliable manual detection approach, as explained in Najoui et al. (2018b) and Jackson et al. (2004). In fact, the 3644 radar images used in this publication have all been manually interpreted. The detection of oil slicks and their categorization were carried out following three stages of analysis: (1) interpretation based on morphological and textural criteria, (2) multi-date analysis of repetitive oil slicks, and (3) validation using auxiliary data.
According to morphological and textural criteria, oil slicks may be subdivided into two major classes: biogenic and mineral. Biogenic oil slicks are organic films made of substances produced by plankton and other marine organisms. Mineral oil slicks can be subdivided into natural seeps (Fig. 7), emitted naturally from the sea bottom, and anthropogenic oil spills that originate from ships (Fig. 8), refineries, oil terminals, industrial plants, oil platforms (Fig. 9), and pipelines (Espedal, 1999). While biogenic oil slicks appear as shiny diffracting points on radar data, oil seeps are characterized by curvilinear shapes due to short-term changes in the strength and orientation of the wind and in the surface currents (Espedal, 1999).
For instance, oil spills from platforms or ships induce significant slicks (Johannessen et al., 2000; Leifer et al., 2012; Trivero and Biamino, 2010). Oil spills from platforms are characterized by an irregular geometric shape. They may reach large extents and have the particularity of being repeated over time. Their most distinctive feature is their proximity to oil platforms. Oil spills from ships have a fine and linear geometric shape that may be continuous or intermittent when boats are moving. When the ship is immobile, the oil slick has an irregular geometric shape that can be confused with an oil spill from a platform. Figure 6 shows some examples of oil-related and non-oil-related patches visible in radar images.
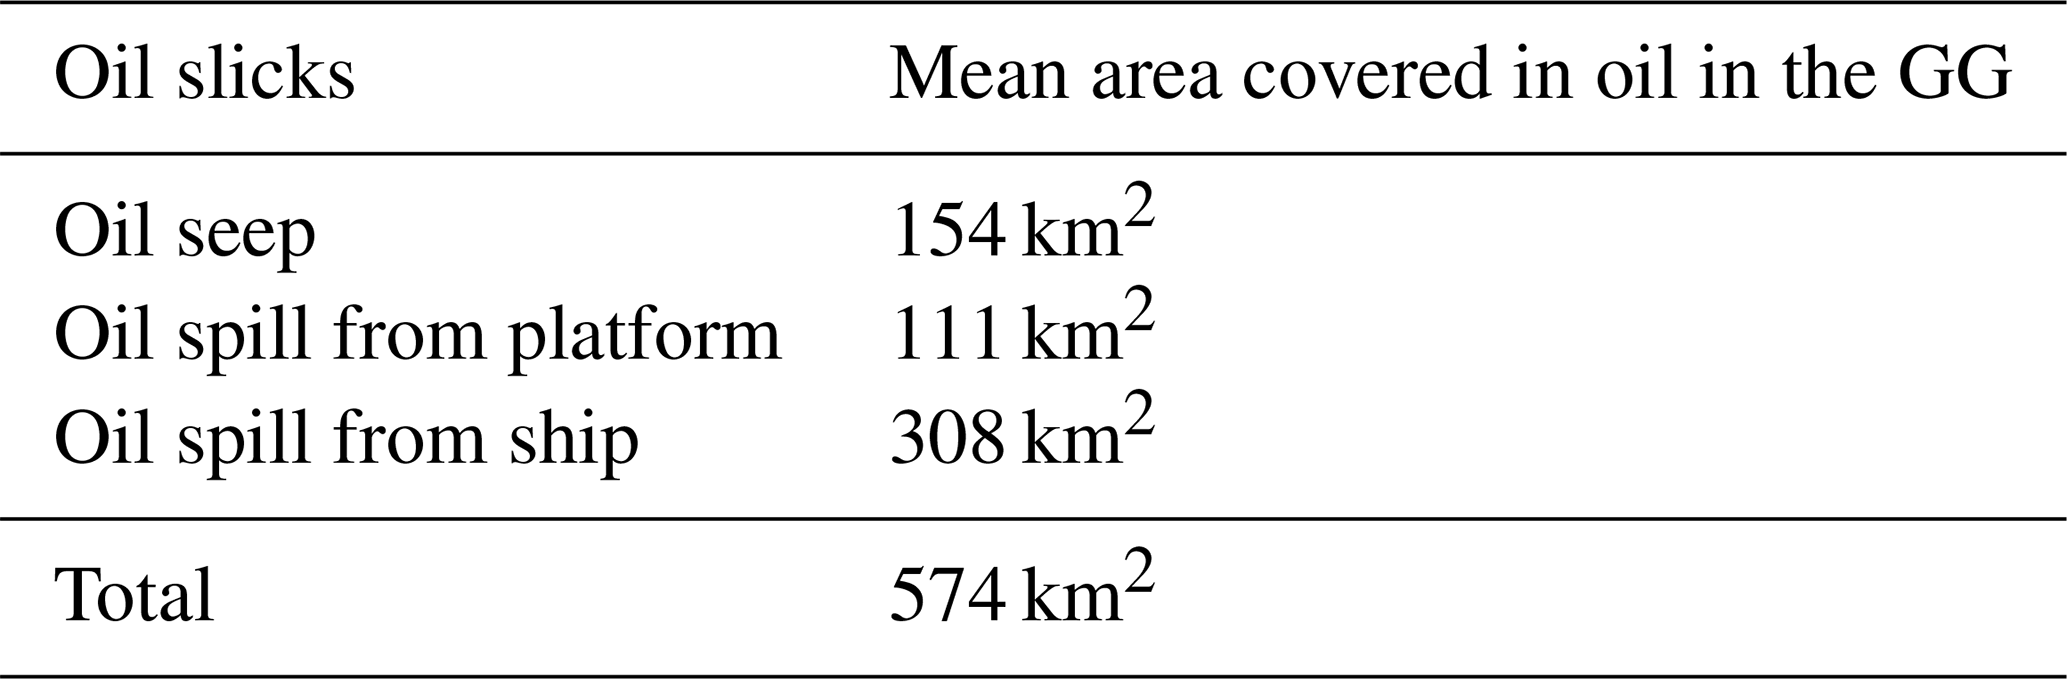
Table 1Temporal mean of the yearly mean area covered in oil between 2002 and 2012 in the Gulf of Guinea (GG).
Thereafter, a multi-date analysis has been performed. We use all of the interpretations from different dates in order to assess the manual interpretation. Indeed, repetitive slicks are more likely due to leaks from static sources – for example, a geological feature for oil seeps or a platform or pipeline for oil spills. The shape of these oil slicks from static sources is induced by the strength and orientation of the short-term changes in both wind and sea surface current. Usually, these types of slicks from natural oil seeps and oil spills from oil platforms form astroseeps or flower-like structures (Fig. 10). In general, ships that discharge oily effluents do it on route, leaving linear-shaped spills or trails in their wake. When oil is discharged in a current-free and calm sea, the resulting overall spill geometry will follow the route of the ship. This linearity is used to identify such oil spills. However, when a de-ballasting ship manoeuvers or when a non-uniform surface current is present, the contour of the spill can deviate significantly from linearity. When oil is discharged from a moving ship, it also spreads laterally, resulting in an oil trail with an increasing width as a function of the distance from the ship. In many cases, a white dot ahead of the de-ballasting trail testifies to the metal structure of the ship, and the size (or even the shape) of the dot can be an indicator of the size of the vessel.
Finally, the validation of the analysis has been performed by the integration of the manual detection output in a geographic information system (GIS) with other auxiliary data. These auxiliary data include the location of oil platforms and oil and gas fields; available bathymetric, geological, and structural data; marine traffic; and wind and current field direction. This work has led to a dataset with 18 063 interpreted oil slicks (Najoui, 2022b).
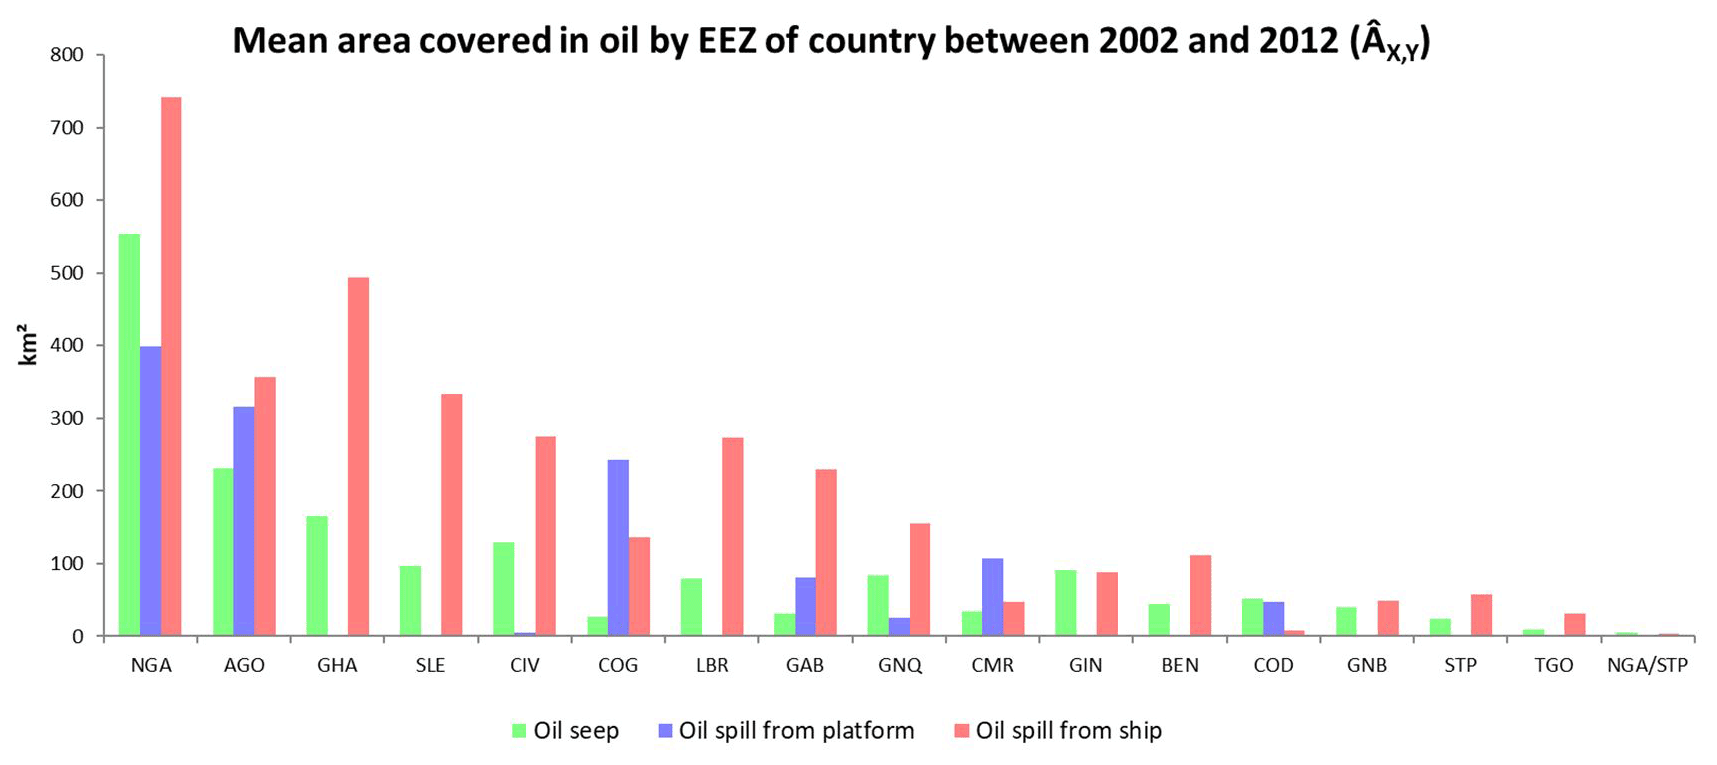
Figure 16Mean area covered in oil by EEZs of countries (ÂX,Y) in the Gulf of Guinea between 2002 and 2012.
3.4 Mean area covered in oil
The image interpretation described in the previous section results in the delimitation of closed polygons corresponding to the oil slicks. These polygons are “embedded” in a raster image to perform the statistical study. As each location within the area of interest has not been observed an equal number of times by the Envisat satellite, an “observation occurrence map” has been produced (Fig. 3). In fact, each location has not been equally observed because of the partial overlap of neighbouring swaths and the use of both ascending and descending orbits. Hence, it was necessary to locally normalize the oil slicks' number distribution by dividing the number of oil slick occurrences by the number of observations made by the Envisat ASAR over the study area, which gives the relative frequency of the presence of oil per pixel.
The probability of the presence of oil X per pixel (PX(l,p)) is equal to the number of occurrences of oil X in a pixel (SX(l,p)) divided by the number of observations (O(l,p)) of the same pixel:
where SX(l,p) is the number of occurrences of the presence of oil X detected on a pixel by image interpretation; X is the type of oil (can be natural leaks – oil seepage, pollution by boats – oil spills from ships, or pollution by platforms – oil spills from platforms); (l,p) denotes the coordinates (l,p) of the current pixel, representing the rows and columns of the image; O(l,p) denotes the number of observations as they appear in the footprints of the processed Envisat ASAR WSM images; and PX(l,p) is the normalized occurrence, also called probability of oil presence at pixel (l,p).
For each class X of oil slick among “seepage” (e), “spill from ship” (s), and “spill from platform” (p), the generic definition given in (Eq. 1) becomes
Here, Se(l,p), Ss(l,p), and Sp(l,p) are the number of oil presence occurrences detected on a pixel by image interpretation with respect to natural leaks (oil seepage), oil spills from ships, and pollution from platforms (oil spills from platforms) respectively; (l,p) denotes the coordinates (l,p) of the current pixel, representing the rows and columns of the image; and O(l,p) denotes the number of observation as they appear in the footprints of the processed Envisat ASAR WSM images.
The total probability of the presence of oil X per pixel (Pt(l,p)) is equal to
Thus, using ÂX, we denote the mean area covered in oil of origin X in the Gulf of Guinea between 2002 and 2012. This mean area is given by
where A(l,p) is the area of the pixel (l,p), and is the mean area of a pixel. Due to the chosen geographic coordinate reference system (CRS), the variation in the area of the pixel (75 m×75 m) is less than 2.5 % over the Gulf of Guinea (GG).
For a given year Y, the mean area covered in oil of origin X (ÂX,Y) is given by
where is the probability of the presence of oil of origin X for a given year Y for a given pixel (l,p).
For a given year Y and for a given EEZ, the mean area covered in oil of origin X () is given by
3.5 Mean fraction covered by oil for a given EEZ
For each country's EEZ over a given period of time, we estimated the mean fraction covered in oil of origin X for a given year Y () by dividing the mean area covered in oil of origin X for a given year Y for a given EEZ () by the area of the country's EEZ (AEEZ) (Eq. 7). When presenting the results, the term EEZ was replaced by the country's ISO code.
4.1 Spatial distribution of oil slicks in the Gulf of Guinea
The spatial and temporal analysis of the Gulf of Guinea allowed the image interpretation of 18 063 oil slicks. The database of the 18 063 identified objects includes two classes of mineral oil: (1) anthropogenic pollution that comes from oil spill platforms and recurring de-ballasting of oil spills from ships and (2) natural oil seepage resurgences that are hints of the presence of hydrocarbon reservoirs in the subsurface of the Gulf of Guinea.
Figure 11 illustrates the spatial distribution of the 18 063 oil slicks that have been detected and then mapped in the Gulf of Guinea over the period from 2002 to 2012. For each of the N slicks, a point has been designated as the source, forming a discrete dot map. In order to obtain a continuous density map, each source point of this dot map has been convoluted by a 2-D kernel function. In fact, the density map is the sum of each of these N kernel functions Figures 12, 13, and 14 show the density maps of oil seepage, spills from ships, and spill from platforms respectively . The kernel function that has been used is
where r is the Euclidian distance to the source point in degrees.
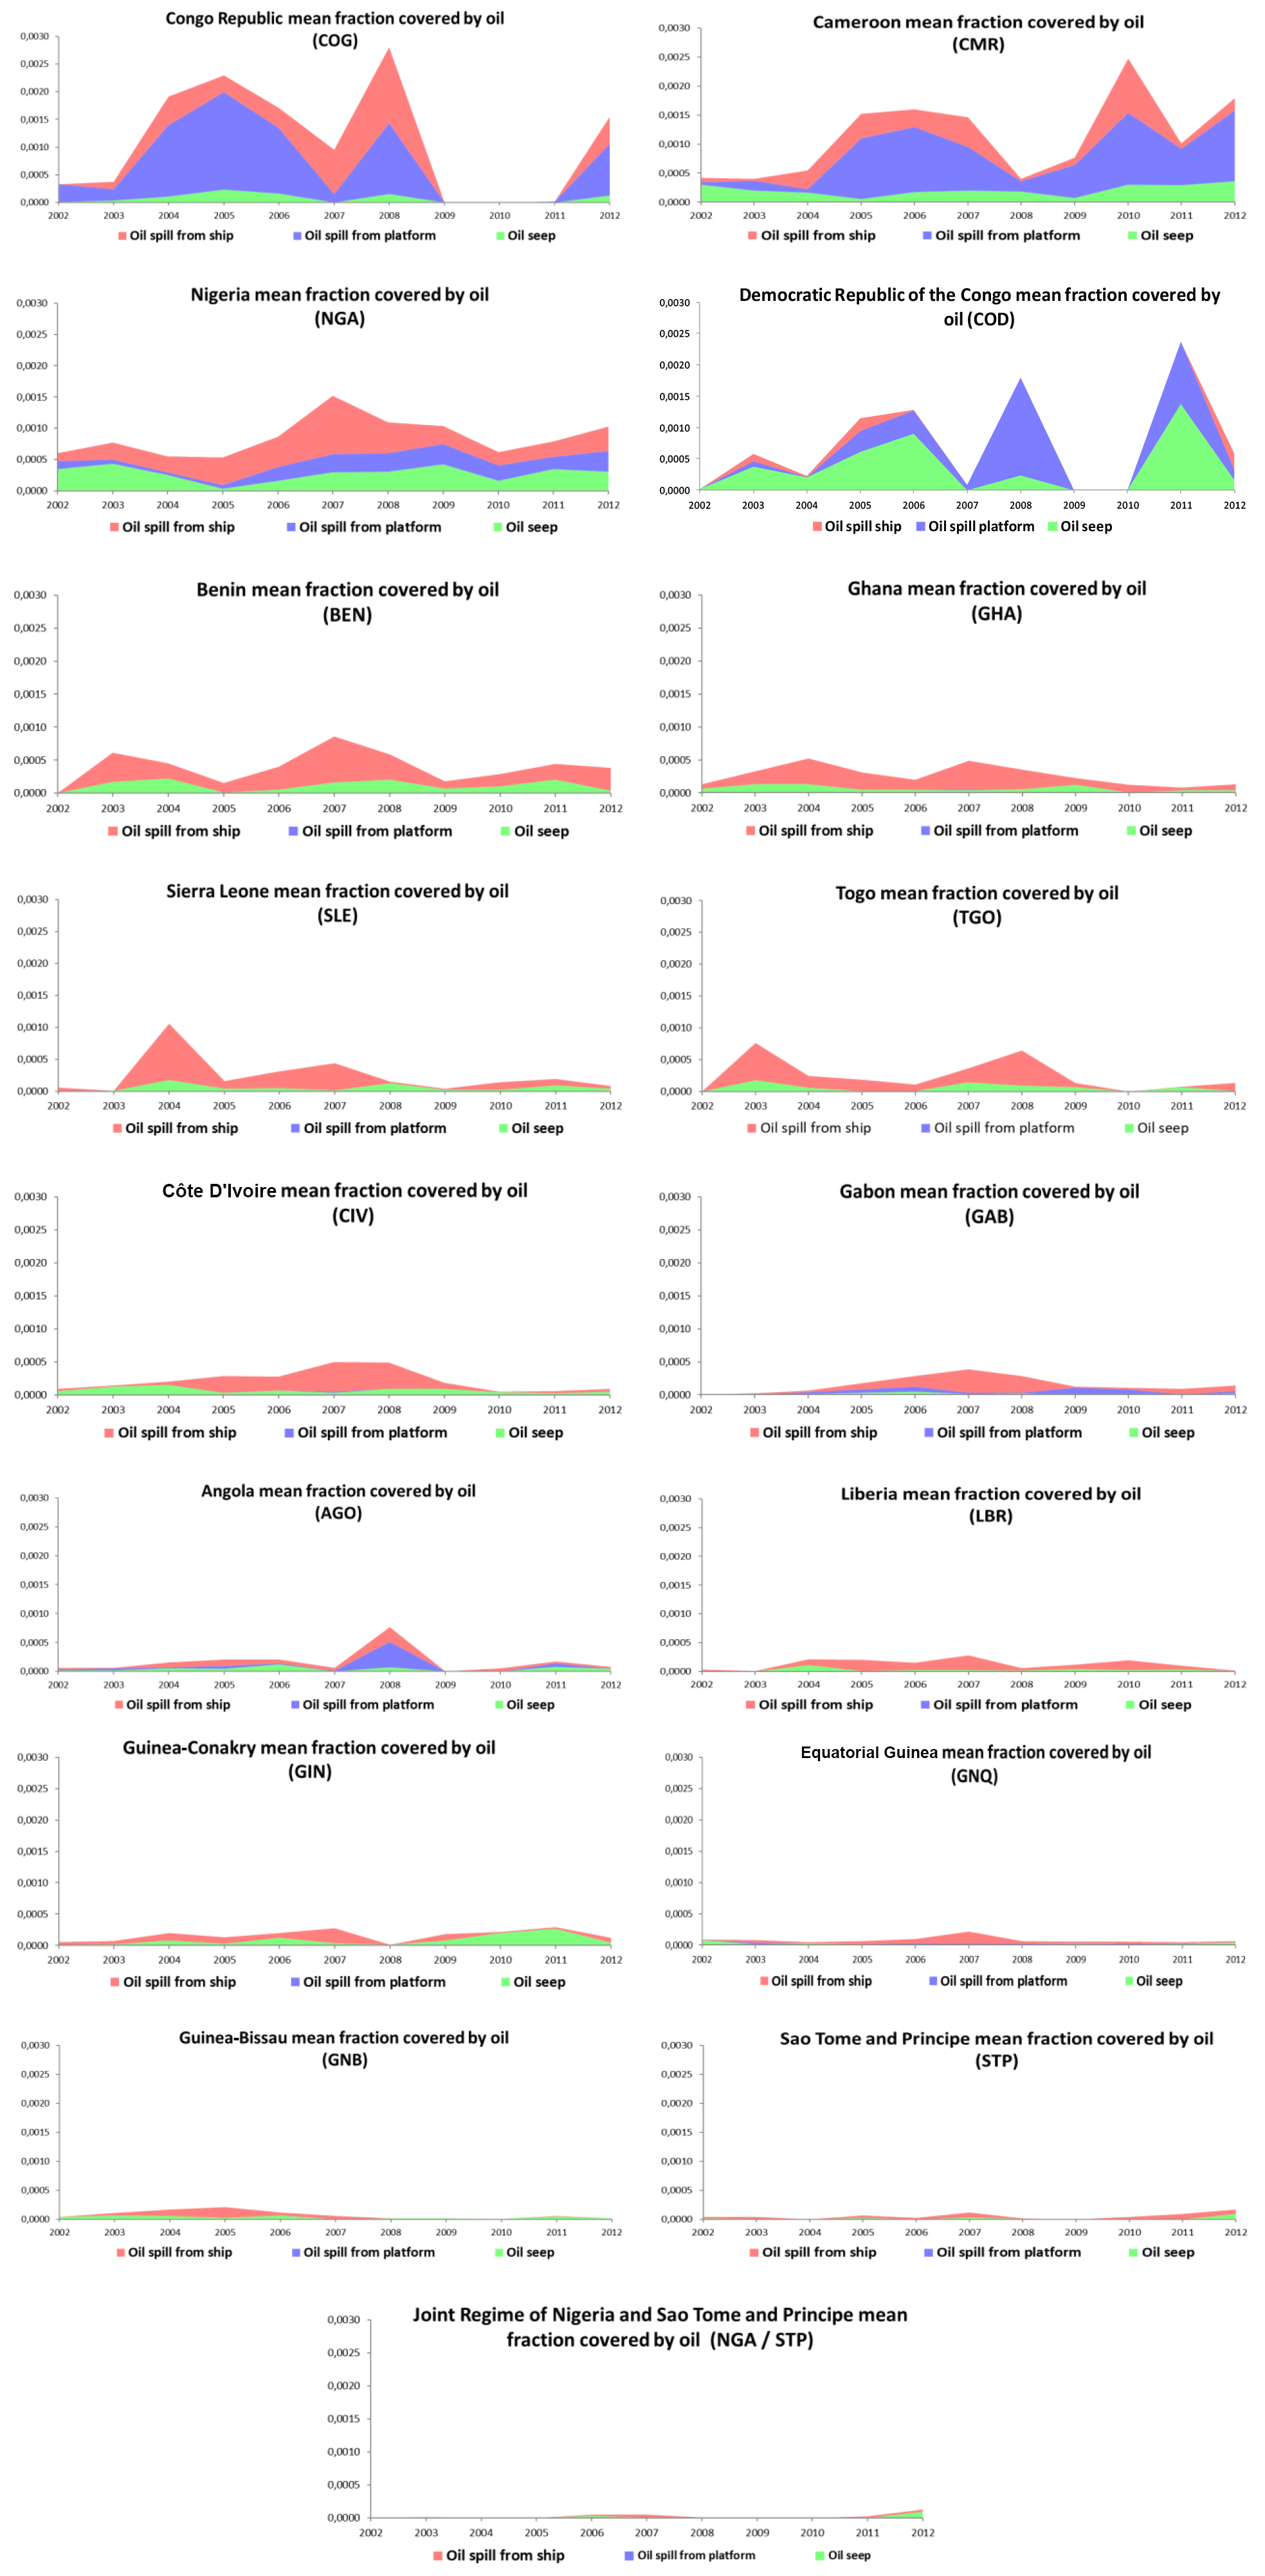
Figure 12 shows that oil seepage locations are distributed over all of the EEZs in the Gulf of Guinea. This large number of oil seepage events in the Gulf of Guinea could be partly explained by its geology, which has resulted from the opening of the South Atlantic domain that began in the Lower Cretaceous, and by the significant sediment supply from the Niger Delta (Grimaud et al., 2018).
The proximity of the main maritime routes with respect to the coast also contributes to the concentration of discharges in these areas. This phenomenon is especially notable along the coast of Nigeria, which is home to one of the main shipping routes and is also well-known for maritime piracy (see Fig. 13). Thus, there are significant ship-related spills in this region, despite the enactment of the International Convention for the Prevention of Pollution from Ships (MARPOL 73/78), which came into force in 1983. Illegal dumping operations in the area include the de-ballasting and cleaning of ship tanks.
Offshore oil platforms are found all along the coasts of the EEZs of the top oil-producing countries (Nigeria, Angola, Republic of the Congo, and Ghana) in the Gulf of Guinea (see Fig. 14). The oil spills from these platforms that have been observed in our study are very well correlated with offshore installations.
4.2 Mean area covered in oil ()
4.2.1 Mean area covered in oil in the Gulf of Guinea (ÂX,Y)
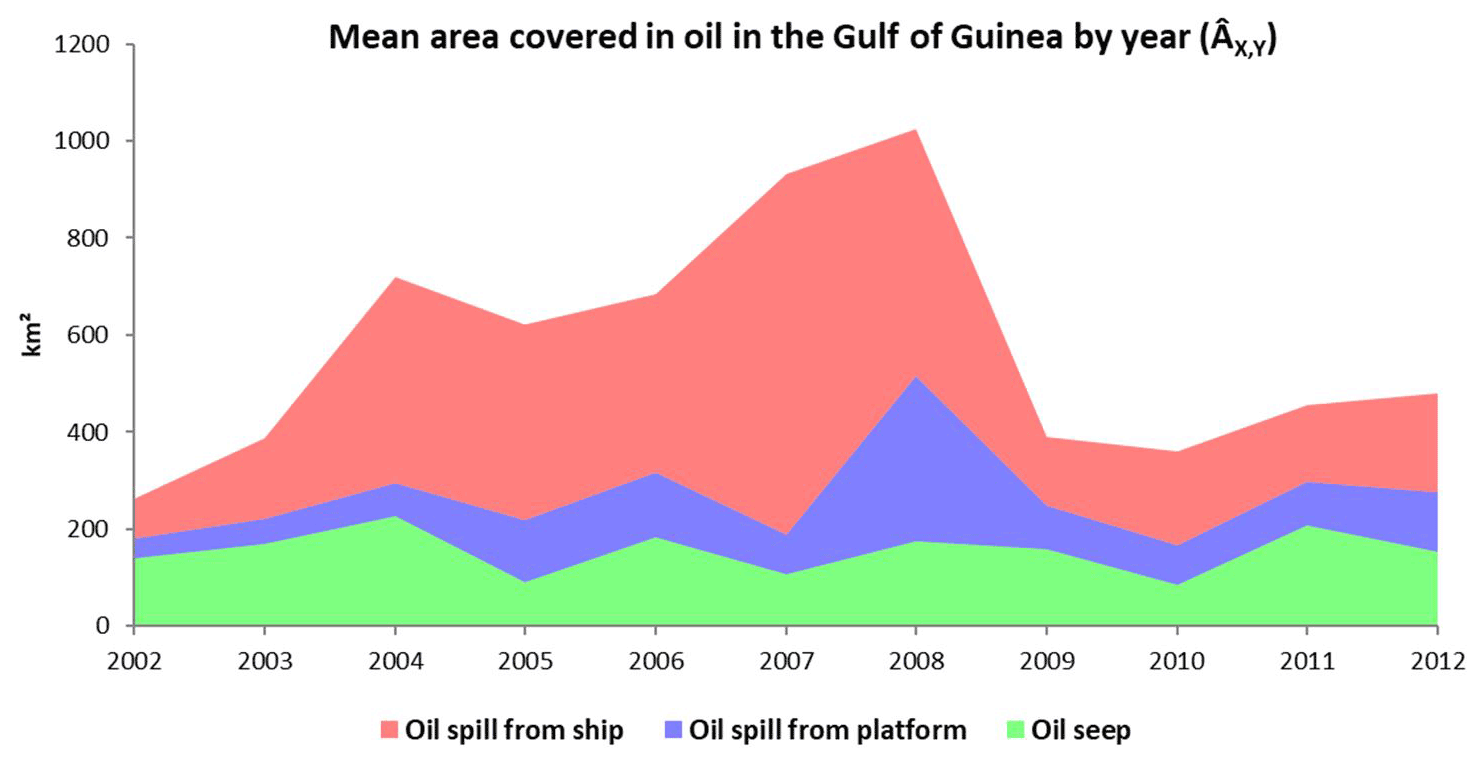
Figure 15 shows the mean area covered in oil in the Gulf of Guinea by year. From this figure, one may notice the following:
-
the mean area covered with oil slicks of natural origin (oil seeps) remains more or less stable during the period from 2002 to 2012;
-
the mean area covered with oil slicks from oil platform spills seems to have increased significantly during 2008, returned to normal in 2009, and then remained normal until the end of the study period;
-
the mean area covered in oil slicks from ships seems to have increased after 2004 (with a peak between 2007 and 2008), fallen in 2009, and then remained stable until the end of the study period.
The mean area covered with oil slicks over the entire Gulf of Guinea (GG) between 2002 and 2012 was 145 km2 for oil seeps, 111 km2 for oil spills from platforms, 308 km2 for oil spills from ship, and 547 km2 for all oil slicks (Table 1). Thus, we have detected an oil slick area of 574 km2 per “full-coverage observation” during the 2002–2012 period. This result is very similar to that obtained by Dong et al. (2022), who detected an oil slick area of 568 km2 per full-coverage observation during the 2014–2019 period using Sentinel-1 data.
4.2.2 Mean area covered in oil by EEZs of countries ()
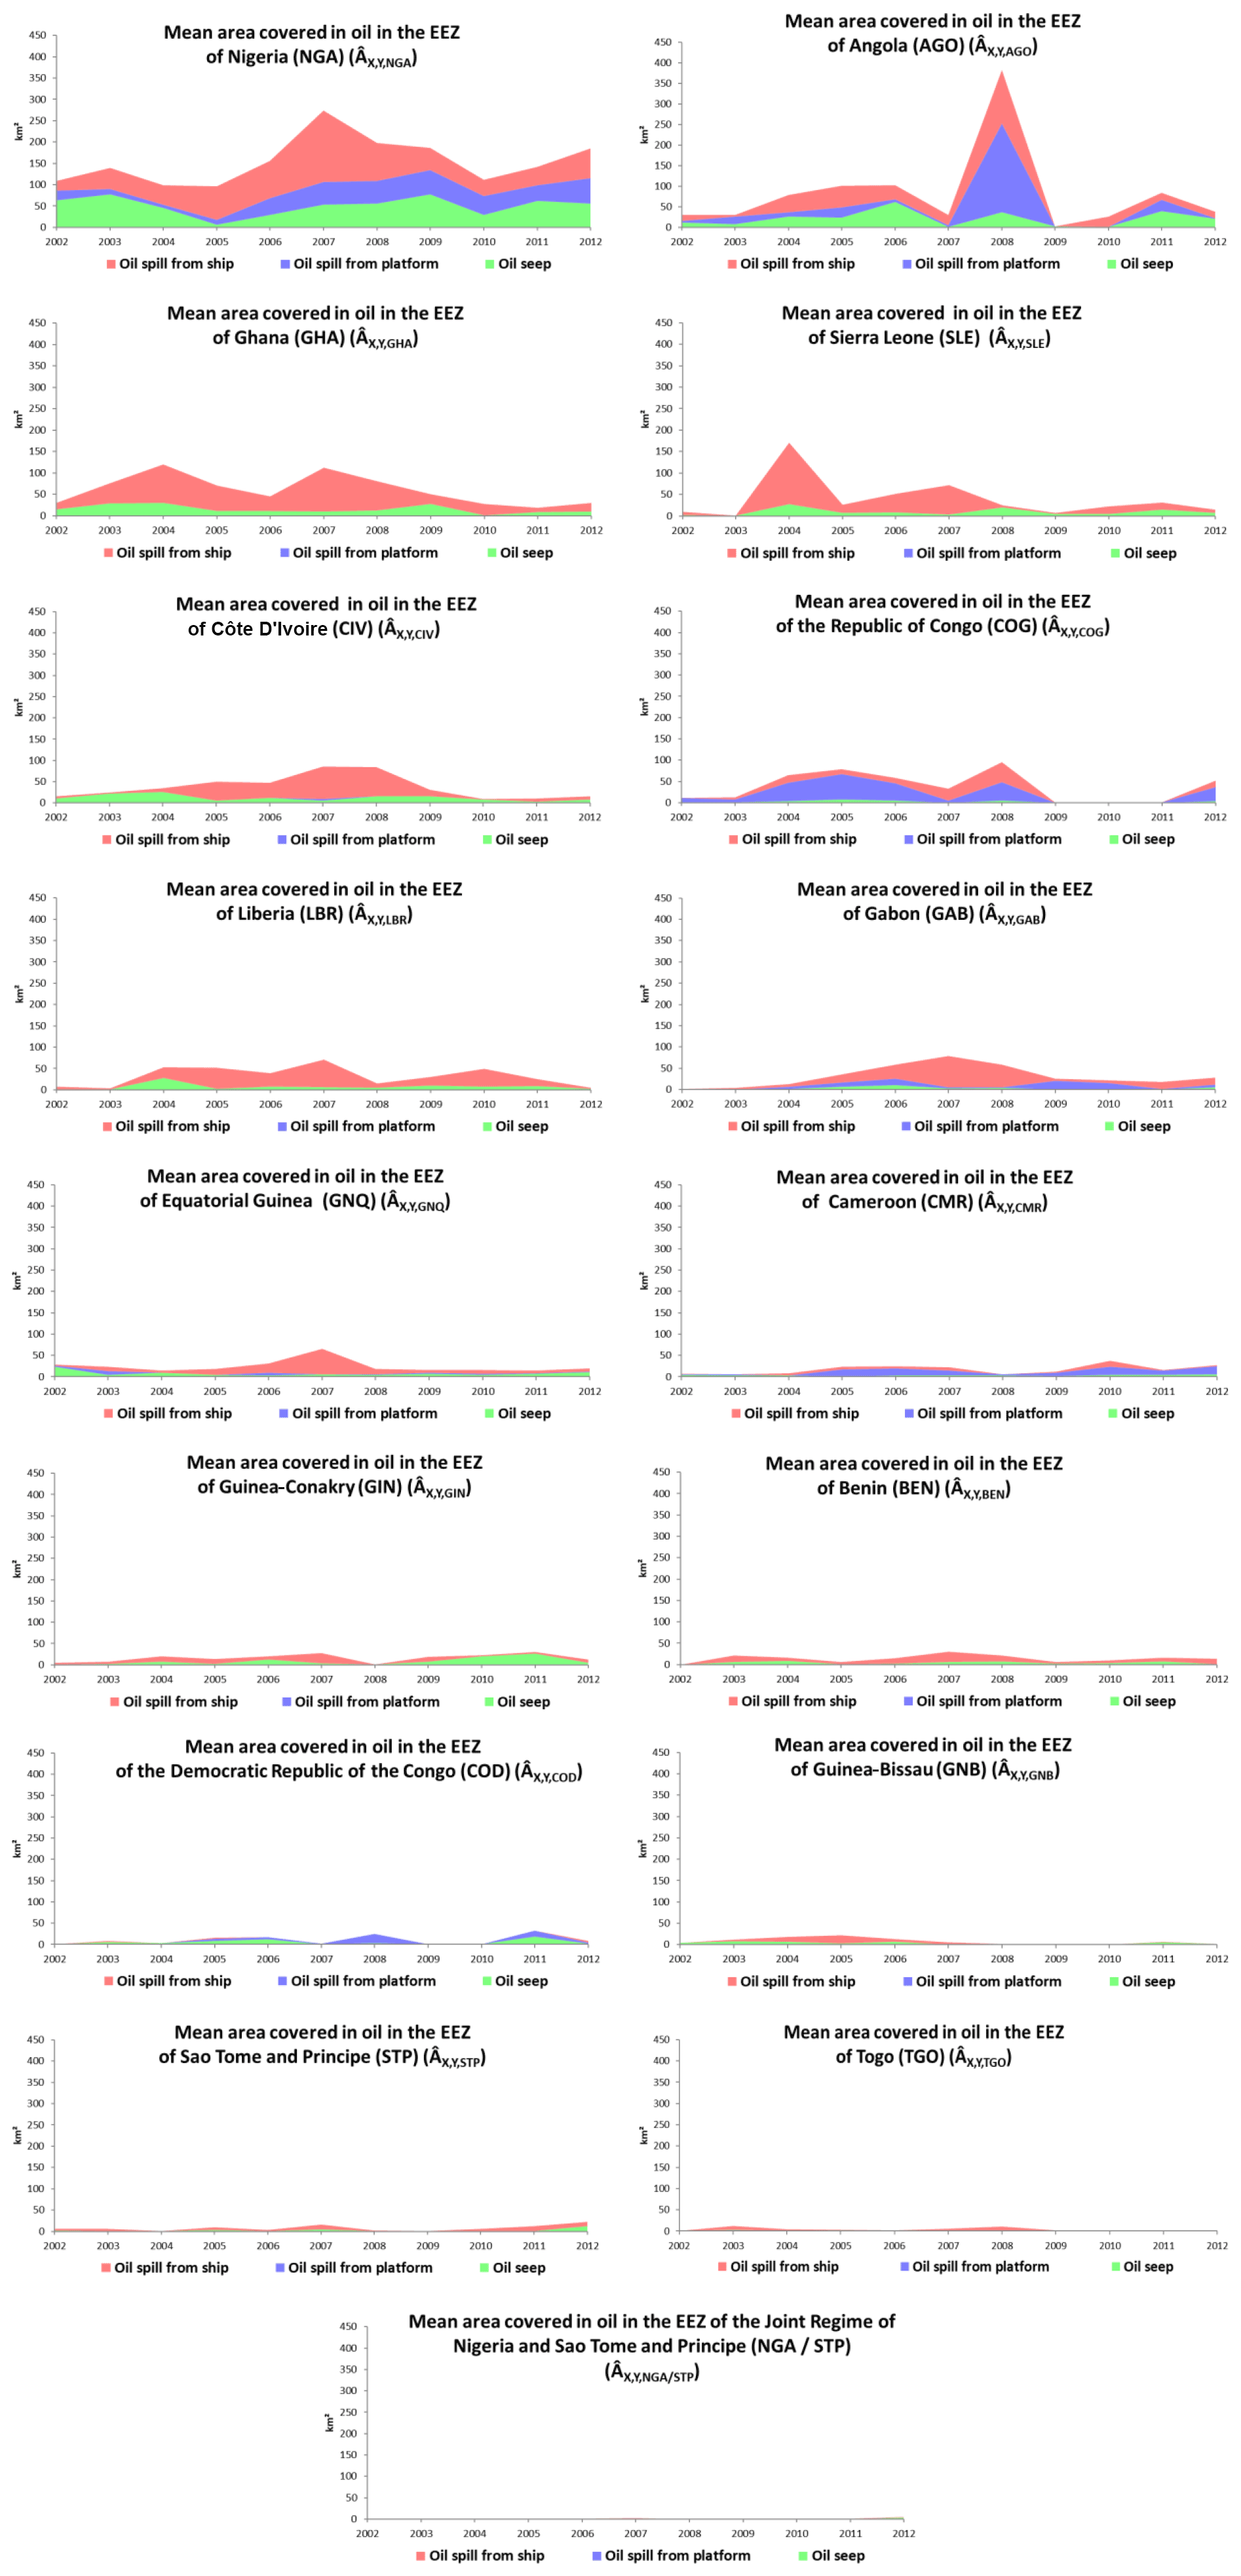
Figure 16 shows the mean area covered in oil with respect to countries' EEZs between 2002 and 2012. Figure 17 shows the mean area covered in oil by countries' EEZs by year. One may notice that the most polluted EEZ is Nigeria, followed by Angola, Republic of the Congo, and Cameroon.
The analysis by EEZ shows that the decrease in oil spills observed between 2008 and 2009 (Fig. 15) was driven by the major oil producing countries: Angola, Nigeria, and Republic of the Congo (Fig. 17).
The fall in the mean area covered in oil from platforms and ships may be explained by the 2008 economic crisis, which led to falling oil prices, thereby inducing a deficit in the budget of oil companies and governments. For instance, Angola oil production decreased in 2009 following the post-2008 slowdown in global economic activity and the subsequent glut of oil on the global market (Mikidadu, 2018).
4.3 Mean fraction covered by oil by EEZ ()
As shown in Fig. 15, Nigeria holds the record for pollution by platforms as well as by boats. These data incorporated the pollution observed throughout the country's whole EEZ. However, these high pollution levels may also be due to the fact that Nigeria has an extended EEZ. To make the analysis independent of the size of the EEZ, we calculate the “Mean fraction covered by oil by EEZ”.
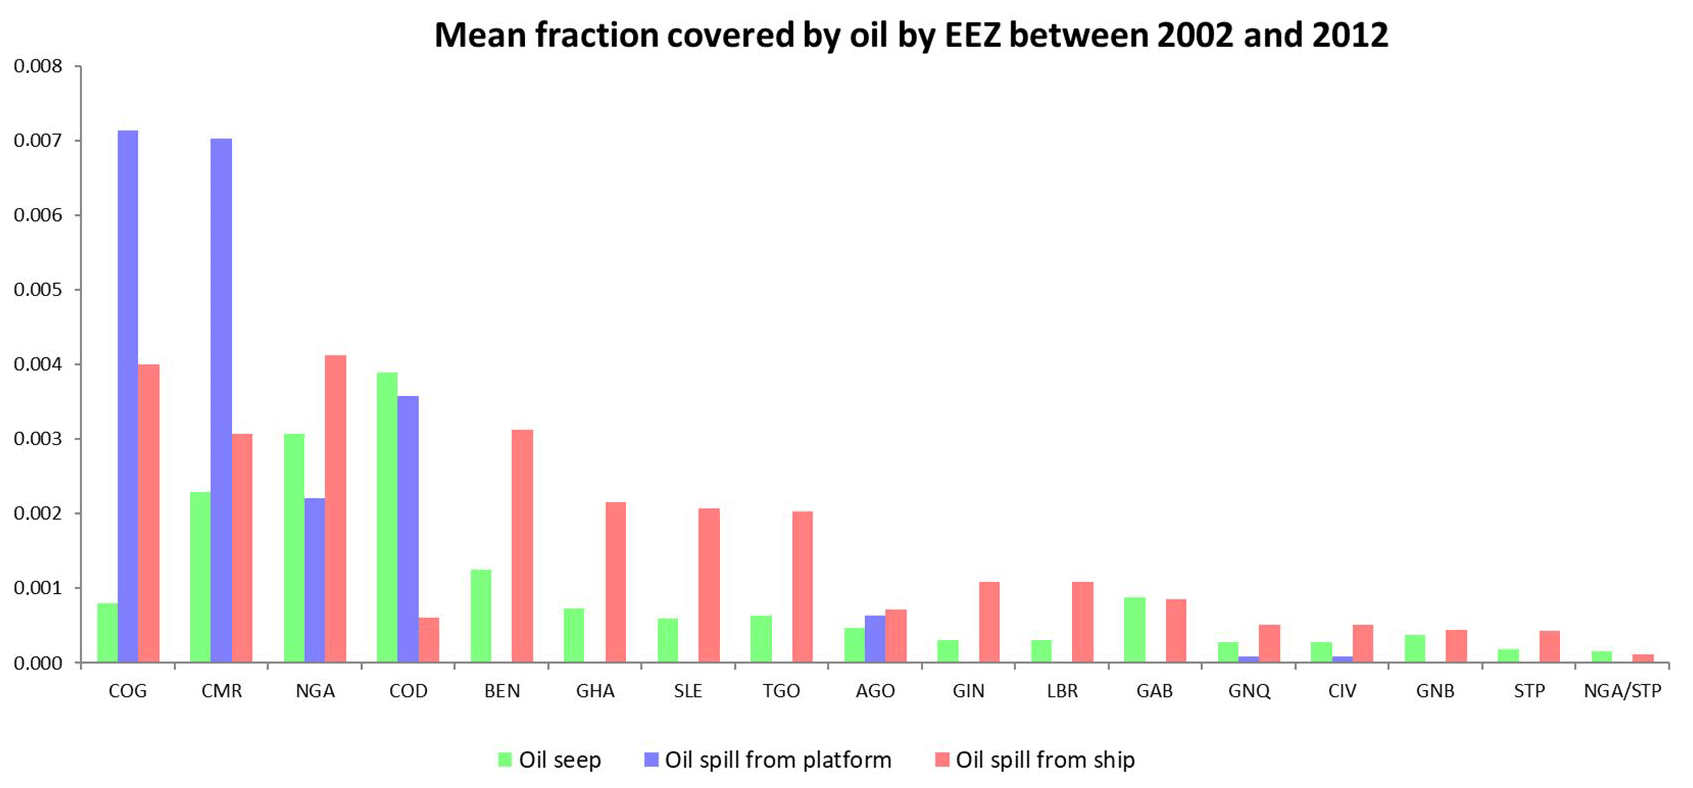
Figure 18 shows the mean fraction covered by oil by the EEZ of countries between 2002 and 2012. Figure 19 shows the mean fraction covered by oil by the EEZ of countries by year.
The country mean fraction covered by oil, which divides the mean area covered by oil by the country's EEZ area (Eq. 7), gives an idea of the mean probability of being covered by oil for each EEZ. Thus, the larger the mean fraction, the more likely the area is to be covered by oil. One may see that the probability of an oil spill is high for the Republic of the Congo, Cameroon, and Nigeria, while the probability of an oil seep is high for the Democratic Republic of the Congo, Nigeria, and Cameroon.
All of the Envisat ASAR images (2002–2012) used in this study are available from the ESA collection: https://doi.org/10.5270/EN1-4c37krv (European Space Agency, 2021). The spatial distribution of the oil slicks in the Gulf of Guinea between 2002 and 2012 is available from Zenodo: https://doi.org/10.5281/zenodo.6470470 (Najoui, 2022b). A set of 100 georeferenced oil spills is also available from Zenodo: https://doi.org/10.5281/zenodo.6907743 (Najoui, 2022a).
An unprecedented database of oil spills has been generated over the EEZs of the Gulf of Guinea using 11 years of wide-swath-mode (150 m spatial resolution) ASAR acquisitions in the C band contained in the archive of the Envisat mission. This database has been achieved using a manual approach. The present study shows that all of the countries' EEZs are sites of natural oil seepage due to the extensive geological context of the Gulf of Guinea. It also shows that oil spills from ships are well correlated with the shipping routes along the coasts of the 17 EEZs of the Gulf of Guinea, while oil spills from oil platforms are concentrated along the coasts of oil-producing countries like Nigeria, Republic of the Congo, Angola, and Ghana. The temporal analysis for 10 years (2002–2012) shows a decrease in the mean area covered by oil between 2008 and 2009. This decrease is likely due to the post-2008 global economic slowdown.
Oil seepage and oil spill monitoring will benefit from the Sentinel-1 mission, launched in 2014, owing to its higher spatial resolution (10 m), its temporal resolution (6 d), and its longer period of acquisitions (beyond 2032). This dataset will offer more reliable and timely information for emergency and mitigation policies.
All authors designed the method. ZN, NA, and SR processed, analysed, and validated the dataset. ZN and SR wrote the manuscript. All authors have read and approved the final paper.
The contact author has declared that none of the authors has any competing interests.
Publisher's note: Copernicus Publications remains neutral with regard to jurisdictional claims in published maps and institutional affiliations.
The authors would like to thank the ESA for providing the SAR scenes used in this study.
This paper was edited by David Carlson and reviewed by Chuanmin Hu and two anonymous referees.
Adelana, S. and Adeosun, T.: Environmental pollution and remediation: challenges and management of oil Spillage in the Nigerian coastal areas, Am. J. Sci. Ind. Res., 2, 834–845, https://doi.org/10.5251/ajsir.2011.2.6.834.845, 2011.
Albakjaji, M.: La pollution de la mer méditerranée par les hydrocarbures liée au trafic maritime, https://tel.archives-ouvertes.fr/tel-00598492/document (last access: 14 October 2022), 2010.
Alpers, W., Holt, B., and Zeng, K.: Oil spill detection by imaging radars: Challenges and pitfalls, Remote Sens. Environ., 201, 133–147, https://doi.org/10.1016/j.rse.2017.09.002, 2017.
Bagby, S. C., Reddy, C. M., Aeppli, C., Fisher, G. B., and Valentine, D. L.: Persistence and biodegradation of oil at the ocean floor following Deepwater Horizon, P. Natl. Acad. Sci. USA, 114, E9–E18, https://doi.org/10.1073/pnas.1610110114, 2017.
Bassou, A.: Le Golfe de Guinée, Zone de Contrastes: Richesses et Vulnérabilités/The Gulf of Guinea, an Area of Contrasts: Wealth and Vulnerabilities, https://www.africaportal.org/publications/le-golfe-de-guinée-zone-de-contrastes-richesses-et-vulnérabilités-gulf-guinea-area-contrasts-wealth-and-vulnerabilities/ (last access: 17 October 2022), 2016.
Brekke, C. and Solberg, A. H. S.: Oil spill detection by satellite remote sensing, Remote Sens. Environ., 95, 1–13, https://doi.org/10.1016/j.rse.2004.11.015, 2005.
Brekke, C. and Solberg, A. H. S.: Classifiers and Confidence Estimation for Oil Spill Detection in ENVISAT ASAR Images, IEEE Geosci. Remote S., 5, 65–69, https://doi.org/10.1109/LGRS.2007.907174, 2008.
Caruso, M., Migliaccio, M., Hargrove, J., Garcia-Pineda, O., and Graber, H.: Oil Spills and Slicks Imaged by Synthetic Aperture Radar, Oceanography, 26, 112–123, https://doi.org/10.5670/oceanog.2013.34, 2013.
Chalghmi, H.: Etude de la pollution marine par les hydrocarbures et caractérisation de leurs effets biochimiques et moléculaires sur la palourde de Ruditapes sp, https://hal.archives-ouvertes.fr/tel-01583022 (last access: 14 October 2022), 2015.
Del Frate, F., Petrocchi, A., Lichtenegger, J., and Calabresi, G.: Neural networks for oil spill detection using ERS-SAR data, IEEE T. Geosci. Remote, 38, 2282–2287, https://doi.org/10.1109/36.868885, 2000.
Dong, Y., Liu, Y., Hu, C., MacDonald, I. R., and Lu, Y.: Chronic oiling in global oceans, Science, 376, 1300–1304, https://doi.org/10.1126/science.abm5940, 2022.
Espedal, H. A.: Satellite SAR oil spill detection using wind history information, Int. J. Remote Sens., 20, 49–65, https://doi.org/10.1080/014311699213596, 1999.
European Space Agency: Envisat ASAR Wide Swath Medium Resolution L1 Product, IPF version 6.03, https://doi.org/10.5270/EN1-4c37krv, 2021.
Favennec, J.-P., Copinschi, P., Cavatorta, T., and Esen, F.: Les nouveaux enjeux pétroliers en Afrique, Polit. Afr., 89, 127–148, https://doi.org/10.3917/polaf.089.0127, 2003.
Fingas, M. and Brown, C.: A Review of Oil Spill Remote Sensing, Sensors, 18, 91, https://doi.org/10.3390/s18010091, 2017.
Fiscella, B., Giancaspro, A., Nirchio, F., Pavese, P., and Trivero, P.: Oil spill detection using marine SAR images, Int. J. Remote Sens., 21, 3561–3566, https://doi.org/10.1080/014311600750037589, 2000.
Fuhrer, M.: Transport maritime de produits chimiques liquides et flottants: etude experimentale du rejet accidentel sous-marin suite a un naufrage, https://tel.archives-ouvertes.fr/tel-00849580 (last access: 14 October 2022), 2012.
Gade, M., Alpers, W., Hühnerfuss, H., Masuko, H., and Kobayashi, T.: Imaging of biogenic and anthropogenic ocean surface films by the multifrequency/multipolarization SIR-C/X-SAR, J. Geophys. Res.-Oceans, 103, 18851–18866, https://doi.org/10.1029/97JC01915, 1998.
Garcia-Pineda, O., MacDonald, I., and Zimmer, B.: Synthetic Aperture Radar Image Processing using the Supervised Textural-Neural Network Classification Algorithm, in: IGARSS 2008–2008 IEEE International Geoscience and Remote Sensing Symposium, 7–11 July 2008, Boston, MA, USA, IV-1265–IV-1268, https://doi.org/10.1109/IGARSS.2008.4779960, 2008.
Grimaud, J.-L., Rouby, D., Chardon, D., and Beauvais, A.: Cenozoic sediment budget of West Africa and the Niger delta, Basin Res., 30, 169–186, https://doi.org/10.1111/bre.12248, 2018.
Jackson, C. R., Apel, J. R., and United States (Eds.): Synthetic aperture radar: marine user's manual, U.S. Dept. of Commerce: National Oceanic and Atmospheric Administration, Washington, D.C., 464 pp., ISBN 10 016073214X, 2004.
Jafarzadeh, H., Mahdianpari, M., Homayouni, S., Mohammadimanesh, F., and Dabboor, M.: Oil spill detection from Synthetic Aperture Radar Earth observations: a meta-analysis and comprehensive review, GIScience Remote Sens., 58, 1022–1051, https://doi.org/10.1080/15481603.2021.1952542, 2021.
Jatiault, R., Dhont, D., Loncke, L., and Dubucq, D.: Monitoring of natural oil seepage in the Lower Congo Basin using SAR observations, Remote Sens. Environ., 191, 258–272, https://doi.org/10.1016/j.rse.2017.01.031, 2017.
Johannessen, O. M., Sandven, S., Jenkins, A. D., Durand, D., Pettersson, L. H., Espedal, H., Evensen, G., and Hamre, T.: Satellite earth observation in operational oceanography, Coast. Eng., 41, 155–176, https://doi.org/10.1016/S0378-3839(00)00030-2, 2000.
Kanaa, T. F. N., Tonye, E., Mercier, G., Onana, V. P., Ngono, J. M., Frison, P. L., Rudant, J. P., and Garello, R.: Detection of oil slick signatures in SAR images by fusion of hysteresis thresholding responses, in: IGARSS 2003. 2003 IEEE International Geoscience and Remote Sensing Symposium. Proceedings (IEEE Cat. No.03CH37477), Toulouse, France, 2750–2752, https://doi.org/10.1109/IGARSS.2003.1294573, 2003.
Khanna, S., Santos, M., Ustin, S., Shapiro, K., Haverkamp, P., and Lay, M.: Comparing the Potential of Multispectral and Hyperspectral Data for Monitoring Oil Spill Impact, Sensors, 18, 558, https://doi.org/10.3390/s18020558, 2018.
Kubat, M., Holte, R. C., and Matwin, S.: Machine Learning for the Detection of Oil Spills in Satellite Radar Images, Mach. Learn., 30, 195–215, https://doi.org/10.1023/A:1007452223027, 1998.
Langangen, Ø., Olsen, E., Stige, L. C., Ohlberger, J., Yaragina, N. A., Vikebø, F. B., Bogstad, B., Stenseth, N. C., and Hjermann, D. Ø.: The effects of oil spills on marine fish: Implications of spatial variation in natural mortality, Mar. Pollut. Bull., 119, 102–109, https://doi.org/10.1016/j.marpolbul.2017.03.037, 2017.
Lawrence, S. R., Munday, S., and Bray, R.: Regional geology and geophysics of the eastern Gulf of Guinea (Niger Delta to Rio Muni), Lead. Edge, 21, 1112–1117, https://doi.org/10.1190/1.1523752, 2002.
Leifer, I., Lehr, W. J., Simecek-Beatty, D., Bradley, E., Clark, R., Dennison, P., Hu, Y., Matheson, S., Jones, C. E., Holt, B., Reif, M., Roberts, D. A., Svejkovsky, J., Swayze, G., and Wozencraft, J.: State of the art satellite and airborne marine oil spill remote sensing: Application to the BP Deepwater Horizon oil spill, Remote Sens. Environ., 124, 185–209, https://doi.org/10.1016/j.rse.2012.03.024, 2012.
Li, Y., Hu, C., Quigg, A., and Gao, H.: Potential influence of the Deepwater Horizon oil spill on phytoplankton primary productivity in the northern Gulf of Mexico, Environ. Res. Lett., 14, 094018, https://doi.org/10.1088/1748-9326/ab3735, 2019.
Li, Z. and Johnson, W.: An Improved Method to Estimate the Probability of Oil Spill Contact to Environmental Resources in the Gulf of Mexico, J. Mar. Sci. Eng., 7, 41, https://doi.org/10.3390/jmse7020041, 2019.
Liu, A. K., Peng, C. Y., and Chang, S. Y.-S.: Wavelet analysis of satellite images for coastal watch, IEEE J. Oceanic Eng., 22, 9–17, https://doi.org/10.1109/48.557535, 1997.
Louet, J. and Bruzzi, S.: ENVISAT mission and system, in: IEEE 1999 International Geoscience and Remote Sensing Symposium. IGARSS'99 (Cat. No.99CH36293), IEEE 1999 International Geoscience and Remote Sensing Symposium, 28 June–2 July 1999, IGARSS'99, Hamburg, Germany, 1680–1682, https://doi.org/10.1109/IGARSS.1999.772059, 1999.
MacDonald, I. R., Garcia-Pineda, O., Beet, A., Daneshgar Asl, S., Feng, L., Graettinger, G., French-McCay, D., Holmes, J., Hu, C., Huffer, F., Leifer, I., Muller-Karger, F., Solow, A., Silva, M., and Swayze, G.: Natural and unnatural oil slicks in the G ulf of M exico, J. Geophys. Res.-Oceans, 120, 8364–8380, https://doi.org/10.1002/2015JC011062, 2015.
Marghany, M.: Automatic detection of oil spills in the Gulf of Mexico from RADARSAT-2 SAR satellite data, Environ. Earth Sci., 74, 5935–5947, https://doi.org/10.1007/s12665-015-4617-y, 2015.
Mercier, G. and Girard-Ardhuin, F.: Partially Supervised Oil-Slick Detection by SAR Imagery Using Kernel Expansion, IEEE T. Geosci. Remote, 44, 2839–2846, https://doi.org/10.1109/TGRS.2006.881078, 2006.
Mfewou, A., Tchekote, H., and Lemouogue, J.: Frontières Et Dynamiques Socio-Spatiales En Afrique: Une Analyse À Partir Des Frontières Sud- Camerounaises, Eur. Sci. J. ESJ, 14, 285, https://doi.org/10.19044/esj.2018.v14n5p285, 2018.
Mikidadu, M.: Oil Production and Economic Growth in Angola, Int. J. Energy Econ. Policy, 8, 127–131, 2018.
Miranda, N., Rosich, B., Meadows, P. J., Haria, K., Small, D., Schubert, A., Lavalle, M., Collard, F., Johnsen, H., Monti-Guarnieri, A., and D'Aria, D.: The Envisat ASAR mission: A look back at 10 years of operation, European Space Agency Special Publication: Paris, France, https://doi.org/10.5167/UZH-96146, 2013.
NAE-NRC: Macondo Well Deepwater Horizon Blowout: Lessons for Improving Offshore Drilling Safety, National Academies Press, Washington, D.C., https://doi.org/10.17226/13273, 2012.
Najoui, Z.: Prétraitement optimal des images radar et modélisation des dérives de nappes d'hydrocarbures pour l'aide à la photo-interprétation en exploration pétrolière et surveillance environnementale, https://pdfs.semanticscholar.org/92b2/e8e06b49d7f31c0847c694f4b4f3bea41222.pdf?_ga=2.235046721.1549874629.1594648502-969427726.1594648502 (last access: 14 October 2022), 2017.
Najoui, Z.: 100 geolocated oil spills in the Gulf of Guinea (1.0), Zenodo, https://doi.org/10.5281/ZENODO.6907743, 2022a.
Najoui, Z.: Spatial distribution of oil slicks in the Gulf of Guinea between 2002 and 2012, Zenodo, https://doi.org/10.5281/ZENODO.6470470, 2022b.
Najoui, Z., Riazanoff, S., Deffontaines, B., and Xavier, J.-P.: A Statistical Approach to Preprocess and Enhance C-Band SAR Images in Order to Detect Automatically Marine Oil Slicks, IEEE T. Geosci. Remote, 56, 2554–2564, https://doi.org/10.1109/TGRS.2017.2760516, 2018a.
Najoui, Z., Riazanoff, S., Deffontaines, B., and Xavier, J.-P.: Estimated location of the seafloor sources of marine natural oil seeps from sea surface outbreaks: A new “source path procedure” applied to the northern Gulf of Mexico, Mar. Petrol. Geol., 91, 190–201, https://doi.org/10.1016/j.marpetgeo.2017.12.035, 2018b.
Ngodi, E.: Gestion des ressources pétrolières et développement en Afrique, Présentation à la 11ème Assemblée générale du CODESRIA (6–10 December 2005), Maputo, Mozambique, 2005.
Okafor-Yarwood, I.: The effects of oil pollution on the marine environment in the Gulf of Guinea–the Bonga Oil Field example, Transnatl. Leg. Theory, 9, 254–271, https://doi.org/10.1080/20414005.2018.1562287, 2018.
Ovadia, J. S.: The petro-developmental state in Africa: making oil work in Angola, Nigeria and the Gulf of Guinea, Hurst & Company, London, 246 pp., https://doi.org/10.1017/S0022278X16000926, 2016.
Pinkston, F. W. M. and Flemings, P. B.: Overpressure at the Macondo Well and its impact on the Deepwater Horizon blowout, Sci. Rep., 9, 7047, https://doi.org/10.1038/s41598-019-42496-0, 2019.
Reuscher, M. G., Baguley, J. G., and Montagna, P. A.: The expanded footprint of the Deepwater Horizon oil spill in the Gulf of Mexico deep-sea benthos, PLOS ONE, 15, e0235167, https://doi.org/10.1371/journal.pone.0235167, 2020.
Scheren, P. A., Ibe, A. C., Janssen, F. J., and Lemmens, A. M.: Environmental pollution in the Gulf of Guinea – a regional approach, Mar. Pollut. Bull., 44, 633–641, https://doi.org/10.1016/S0025-326X(01)00305-8, 2002.
Shu, Y., Li, J., Yousif, H., and Gomes, G.: Dark-spot detection from SAR intensity imagery with spatial density thresholding for oil-spill monitoring, Remote Sens. Environ., 114, 2026–2035, https://doi.org/10.1016/j.rse.2010.04.009, 2010.
Solberg, A. H. S., Storvik, G., Solberg, R., and Volden, E.: Automatic detection of oil spills in ERS SAR images, IEEE T. Geosci. Remote, 37, 1916–1924, https://doi.org/10.1109/36.774704, 1999.
Suresh, G., Melsheimer, C., Korber, J.-H., and Bohrmann, G.: Automatic Estimation of Oil Seep Locations in Synthetic Aperture Radar Images, IEEE T. Geosci. Remote, 53, 4218–4230, https://doi.org/10.1109/TGRS.2015.2393375, 2015.
Trivero, P. and Biamino, W.: Observing Marine Pollution with Synthetic Aperture Radar, in: Geoscience and Remote Sensing New Achievements, edited by: Imperatore, P. and Riccio, D., InTech, https://doi.org/10.5772/9106, 2010.
Tull, D. M.: Oil and Politics in the Gulf of Guinea by Ricardo Soares de Oliveira London: Hurst & Co/New York, Columbia University Press, 2007, 46, 692–694, https://doi.org/10.1017/S0022278X08003558, 2008.
Xu, L., Shafiee, M. J., Wong, A., Li, F., Wang, L., and Clausi, D.: Oil spill candidate detection from SAR imagery using a thresholding-guided stochastic fully-connected conditional random field model, in: 2015 IEEE Conference on Computer Vision and Pattern Recognition Workshops (CVPRW), Boston, MA, USA, 79–86, https://doi.org/10.1109/CVPRW.2015.7301386, 2015.
Yaghmour, F., Els, J., Maio, E., Whittington-Jones, B., Samara, F., El Sayed, Y., Ploeg, R., Alzaabi, A., Philip, S., Budd, J., and Mupandawana, M.: Oil spill causes mass mortality of sea snakes in the Gulf of Oman, Sci. Total Environ., 825, 154072, https://doi.org/10.1016/j.scitotenv.2022.154072, 2022.
Zhang, Y., Li, Y., and Lin, H.: Oil-Spill Pollution Remote Sensing by Synthetic Aperture Radar, in: Advanced Geoscience Remote Sensing, edited by: Marghany, M., InTech, https://doi.org/10.5772/57477, 2014.