the Creative Commons Attribution 4.0 License.
the Creative Commons Attribution 4.0 License.
 | 27 Sep 2022
Impacts of the proposal of the CNG2020 strategy on aircraft emissions of China–foreign routes
Qiang Cui
Yilin Lei
Bin Chen
Aviation emission accounting is the key to establishing market measures to control aviation pollutant emissions. Based on the fuel percentage method (FPM), this paper applies the improved BFFM2-FOA-FPM (Boeing Fuel Flow Method 2–First Order Approximation FPM) to calculate the emissions of six pollutants (CO2, CO, HC, NOx, SO2, and PM2.5) between Chinese and foreign cities from 2014 to 2019, including CCD (climbing, cruising, and descending) emissions and LTO (landing and take-off) emissions. The error rate between the calculated results and the official data is about 2.75 %. The results show that the emissions of six pollutants changed before and after the proposal of the “Carbon Neutral Growth 2020” strategy (CNG2020 strategy). Although the total amount has increased, the average emission per tonne-kilometer of CO2, CO, HC, NOx, SO2, and PM2.5 has decreased by 17.77 %, 17.26 %, 25.15 %, 14.32 %, 17.77 %, and 16.35 %, respectively. The results of this paper can provide a data basis and method reference for implementing the CNG2020 strategy and realizing global carbon emission reduction goals. The dataset is available from https://doi.org/10.6084/m9.figshare.20071751.v1 (Cui., 2022).
- Article
(4090 KB) - Full-text XML
-
Supplement
(8002 KB) - BibTeX
- EndNote


Air transportation between China and foreign countries has developed dramatically in recent years. The turnover of China's foreign routes totaled 46.37×10⁹ t km (tonne-kilometers) in 2019, an increase of 93.13 % compared to 2014; China's foreign routes completed 74.25 million passengers, a rise of 135.34 % compared to 2014; China's foreign routes met 2.42×10⁶ t of goods and mail, an increase of 44.0 % compared to 2014 (CAAC, 2022). The significant growth of the air transport scale intensifies the environmental changes caused by air pollutant emissions, making the aviation industry one of the top 10 greenhouse gas emission industries globally (Turgut et al., 2017). Aviation pollutants mainly come from NOx, CO2, HC, SO2, PM, and aviation-induced cloudiness (AIC) and other pollutants discharged after mixed combustion of aviation fuel and air during an eruption, which affects air quality and causes the temperature chamber effect. Therefore, aviation pollutant emission has attracted more and more attention from the global community (Zheng et al., 2019; Shan et al., 2021).
To solve the problem of aviation pollutant emission, in October 2016, the 39th General Assembly of the International Civil Aviation Organization (ICAO) adopted two critical documents: the ICAO comprehensive statement on sustainable policies and practices of environmental protection “climate change and ICAO complete statement on sustainable policies and procedures of environmental protection – global-market-based measure mechanism”. It aims to achieve the zero-carbon emission growth goal of the international aviation industry from 2020 through the phased implementation of the “Carbon Neutral Growth 2020” strategy (CNG2020 strategy), from 2021 to 2035. The CNG2020 strategy was implemented in 2021. The period from 2021 to 2023 is the pilot phase, and the period from 2024 to 2026 is the first phase. All countries can voluntarily participate in the plan in the pilot phase and the first phase. The second phase is from 2027 to 2035. In the second phase, most countries must participate in the plan, and the least developed countries and island and landlocked developing countries can participate voluntarily. ICAO has predicted the impacts of the CNG2020 strategy on the whole airline industry. The estimated quantity to be offset to achieve carbon-neutral growth from 2020 would be of the order of 142–174×106 t of CO2 in 2025 and 443–596×106 t of CO2 in 2035, with these ranges being determined by the definitions of nine scenarios for CO2 trend assessment from the most optimistic scenario to the least optimistic one. Therefore, the CNG2020 strategy may have substantial impacts on the global airline industry (Cui and Li, 2018).
Aiming at the accounting method of gaseous pollutant emission of aero-engine during a standard landing and take-off cycle, ICAO has successively developed simple methods, advanced methods, and complex methods according to different calculation methods and data requirements since the 1970s (Kesgin, 2006; Altuntas, 2014; Winther et al., 2015; Cokorilo, 2016; Xu et al., 2020). The direct use of the model reference value in ICAO's simple methods will bring uncertainty into the accounting results. On the other hand, the advanced and complex methods that have been further improved obtained highly accurate results. However, they have the limitations of high data requirements, complex implementation, and high research cost and are unsuitable for mass calculation. Therefore, the development of relevant research is relatively slow. Based on the ICAO calculation system, the U.S. Environmental Protection Agency (EPA) puts forward the EPA (Environmental Protection Agency) method combined with the actual situation (U.S. Environmental Protection Agency, 1999; Unal et al., 2005; Zhou et al., 2019; Baxter et al., 2020). Although the EPA method considers meteorological conditions and establishes the relationship between meteorological conditions and aero-engine emissions, it is helpful to understand the relationship between meteorological conditions and emissions. However, the calculation of emission inventory during the aircraft LTO cycle by the EPA method is the same as that of the ICAO simple B method. Therefore, there may be no significant difference between the two calculation results for a single aircraft. As a result, and because the ICAO-recommended method is applied by many organizations and projects, the ICAO-recommended method is the most effective method for LTO cycle pollutant emission evaluation (Kurniawan and Khardi, 2011). Meanwhile, the European Environment Agency (EEA) has established the EMEP (European Monitoring and Evaluation Program) cooperative action framework (Civil and Military Aviation, 2014; Park and O'Kelly, 2014; Pereira et al., 2014). This method is an accounting method of pollutant emission of aircraft during the whole flight based on fuel statistical data. Still, it focuses on analyzing the emission characteristics of aero-engines from the fuel perspective and ignores the differences between engine types. Furthermore, ICAO has further improved the calculation method and proposed the ICAO carbon emission calculator, which can estimate the aviation emission per unit passenger based on the data of various aircraft types (Wasiuk et al., 2016; Liu et al., 2019; ICAO, 2021).
However, there are some drawbacks to the approach provided by ICAO. First, the distance difference is not enough. For example, according to VariFlight (VariFlight, 2022), A320-214 flew between 360 and 3649 km on domestic routes in China in 2018, exceeding the range of the methodology provided by the ICAO. Second, there is no distinction between specific aircraft. ICAO's calculation method only considers large sequences and does not consider differences between subsequence. For example, the A320 family has many families, such as the A320-100 and A320-200, with different engine types, which may lead to a significant difference in the carbon emissions of the two aircraft (Cui et al., 2022a). Third, various pollutants cannot be calculated at the same time. Aiming at these problems, based on the fuel percentage method (FPM), Cui et al. built the improved BFFM2-FOA-FPM (Boeing Fuel Flow Method 2–First Order Approximation) and the ICAO method to calculate the emissions of CO2, CO, HC, NOx, SO2, and PM2.5. The improved BFFM2-FOA-FPM can divide each route into multiple distance segments every 500 km and then calculate each aircraft's emission intensity in each distance segment (Cui et al., 2022b, c).
However, there is little study to analyze the emission difference before and after the construction of CNG2020 strategy. This study can make up for this deficiency. Generally, the entire flight process consists of seven steps: engine starting, taxiing, taking off, climbing, cruising, descending, and landing (Cui, 2019). It is usually divided into the landing and take-off (LTO) cycle and the climbing, cruising, and descending (CCD) stage. This paper will calculate the CCD emissions and LTO emissions of six pollutants (CO2, CO, HC, NOx, SO2, and PM2.5) from China–foreign routes to analyze the impacts of the proposal of CNG2020 strategy. Since COVID-19 began to rage around the world in 2020, the data of 2020 and 2021 cannot be used as a reference. Therefore, 2017–2019 is selected as the cycle after the proposal of the CNG2020 strategy. For comparison, 2014–2016 is selected as the cycle before the proposal, so the whole process of the selected data is 2014–2019. We analyze the impact of the CNG20202020 strategy on China's external routes by comparing and analyzing the emission difference and unit turnover emission difference in these two time periods.
The original data were collected from http://variflight.com (VariFlight, 2022), and we compiled the data. The data on aircraft type, flight time, flight distance, transfer flight, and airlines are from http://variflight.com (VariFlight, 2022). The data on the engines are from the ICAO Aircraft Engine Emissions Databank (EASA, 2022).
Statistical characteristics of China–foreign routes from 2014 to 2019. This article collects information of China–foreign routes during 2014–2019, and detailed statistical characteristics are shown in Fig. 1. The China–foreign routes from 2014 to 2019 involved 121 aircraft types (see details in the tables in the Supplement). It can be seen from Fig. 1a that China–foreign exchanges have developed very rapidly. The number of routes increased from 367 in 2014 to 521 in 2019, and the number of airlines increased from 76 in 2014 to 120 in 2019. These routes cover about 80 countries, showing that China has fixed flights globally with more than 80 countries. Figure 1b shows that the farthest route in 2014 is Guangzhou–New York, 12 583 km. However, in 2015 and 2016, the farthest route became Shanghai Pudong–Mexico City, and the distance is 12 908 km. In 2017, the farthest route was Beijing–Havana, and the distance was 13 091 km, but in 2018, the most distant route became Guangzhou–Mexico City (14 115 km), and it returned to Beijing–Havana in 2019. From this result, it is seen that the farthest destinations on a China–foreign routes are in Central and North America. The shortest routes in 2014, 2015, 2017, and 2019 are Yanji–Vladivostok, with a distance of 224 km, while the shortest one is Nanning–Hanoi (289 km) in other years.
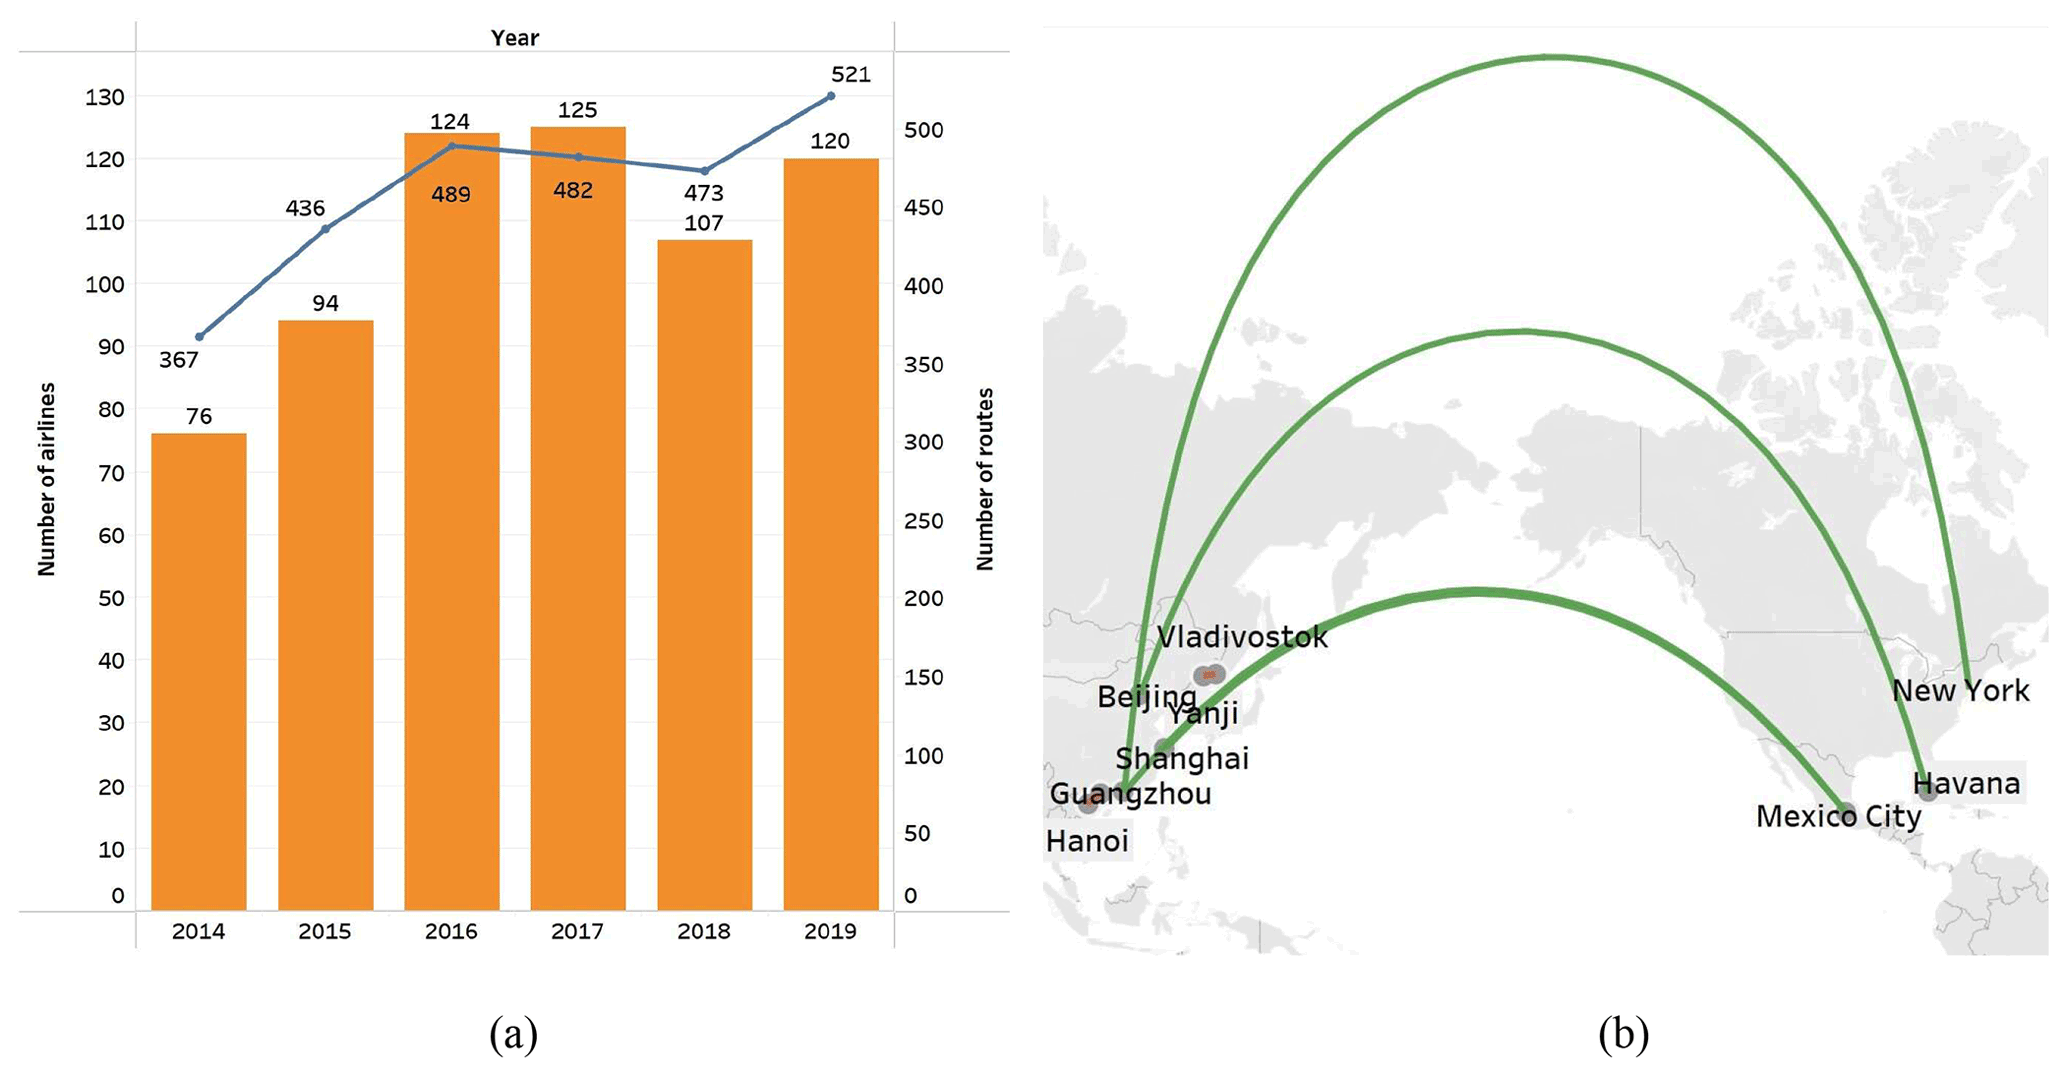
Figure 1Statistical characteristics of the routes during 2014–2019. (a) Number of routes and number of airlines. (b) The longest and shortest distance.
The accuracy of the method. According to the data released by the Civil Aviation Administration of China, in 2019, 46.374×10⁹ t km of transportation was completed between China and foreign routes (CAAC, 2022). The fuel consumption per unit turnover of China's domestic and foreign routes is about 0.285 kg t km−1, but the international routes can float 5 % due to the large aircraft used. The fuel consumption per unit turnover is 0.2993 kg t km−1. Using this standard, multiplied by the carbon emission coefficient per unit fuel consumption (3.157 kg kg−1), the carbon dioxide emissions of the China–foreign routes in 2019 would be 43 818 333.50 t. Therefore, the carbon dioxide emissions calculated in this paper are 45 021 648.34 t, with a 2.75 % error rate. Similarly, the error in 2018 is 5.21 %. Considering the statistical data of various airlines may also contain errors, the calculation results of this paper are very accurate.
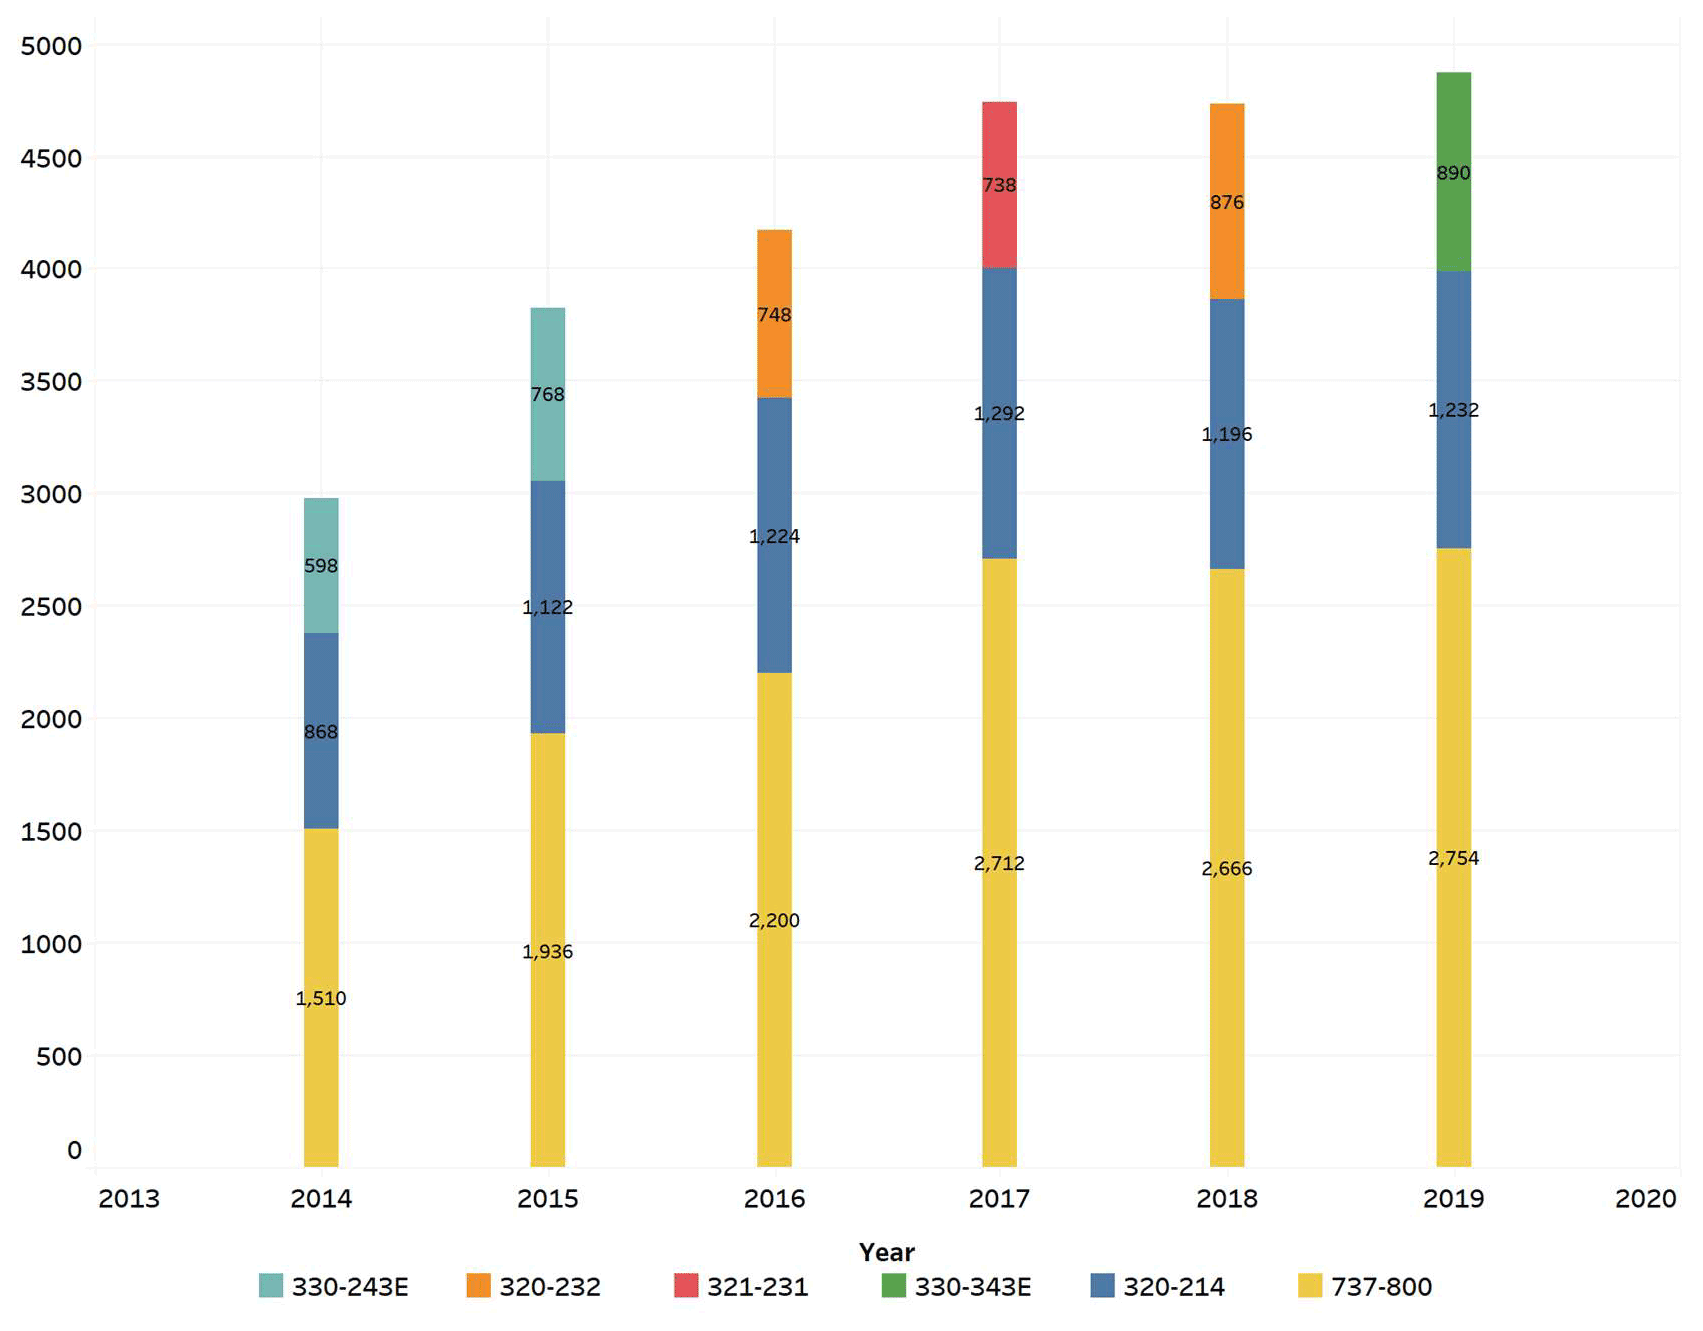
The impact of CNG2020 on aircraft configuration. This article makes detailed statistics on the configuration of aircraft types involved in Chinese and foreign routes from 2014 to 2019. The top three aircraft types in each year are shown in Fig. 2. Among them, the total frequency of 737-800 and 320-214 aircraft types has consistently ranked first and second respectively in these 6 years, and the full frequency of 737-800 aircraft types has increased from 1510 in 2014 to 2754 in 2019. The total frequency of 320-214 aircraft increased from 868 in 2014 to 1232 in 2019. As shown in Fig. 2, before the CNG2020 strategy was put forward, the aircraft configuration changed little. For example, the third aircraft in 2014–2015 was 330-243E, and the third model in 2016 was 320-232. After the CNG2020 strategy was put forward, the aircraft configuration will be fine-tuned every year. For example, the third-ranked aircraft in 2017 was 321-231, the third-ranked aircraft in 2018 was 320-232, and the third-ranked aircraft in 2019 was 330-343E.
The emission intensity of the aircraft in the CCD stage. As mentioned earlier, different from the method of ICAO, we divide each route according to segments of 500 km. Therefore, all routes are divided into 29 distance segments: 0–500, 501–1000, 1001–1500, 1501–2000, 2001–2500, 2501–3000, 3501–3500, 3501–4000, 4001–4500, 4501–5000, 5001–5500, 5501–6000, 6501–6500, 7001–7500, 7501–8000, 8001–8500, 8501–9000, 9001–9500, 9501–10 000, 10 001–10 500, 10 501–11 000 11 001–11 500, 11 501–12 000, 12 001–12 500, 12 501–13 000, 13 001–13 500, 13 501–14 000, and 14 001–14 500 km. In addition, we also considered the differences between subseries, such as 320-214 and 320-232. Then, we get the aircraft's emission intensity of the six pollutants from 2014 to 2019 based on the modified fuel percentage method (MFPM) (see tables in the Supplement). Since different models apply to different distances, we divide the total distance segment into 0–4000, 4001–9500, and 9501–14 500 km. In the 0–4000 km section, 320-214, 320-232, 737-700, and 737-800 cover almost all distance segments. The 320-214 and 320-232 are subseries of the A320 series, and 737-700 and 737-800 are B737 series. Therefore, this comparison highlights the difference between this study and the ICAO method. In the 4001–9500 km section, 330-243E and 330-343E cover most of the distance segments, so we will compare them. Sections 9501–14 500 km, 777-300ER, and 787-8 cover the longest distance, so we will compare them. We summarize the average carbon emission intensity and show the detailed results in Fig. 3. It should be noted that the data of 777-300ER and 787-8 are lost when the distance is greater than 13 000 km, so this part of the comparison cannot be made.

Figure 3Carbon emission intensity of the aircraft (t km−1). (a) Comparison of 320-214 and 320-232 and 737-700 and 737-800. (b) Comparison of 330-243E and 330-343E and 777-300ER, and 787-8.
As shown in Fig. 3a, under the A320 series, 320-214 and 320-232 have similar carbon emission intensity in a 0–500 km distance segment. However, in other distance segments, the carbon emission intensity of 320-214 is higher than that of 320-232. Therefore, 320-232 has a better performance in carbon emissions per kilometer, providing more references for airlines in arranging aircraft types. Under the B737 series, 737-700 and 737-800 have similar carbon emission intensity in a distance segment of 0–1000 km distance segment. In addition, the carbon emission intensity of 737-700 is higher than that of 737-800 at 3500–4000 km, but 737-800 has a more significant intensity than 737-700 at other distances. Therefore, the 737-700 is better than that of the 737-800 at 0–4000 km. Figure 3b shows that 330-343E has a lower carbon emission intensity than 330-243E in the 4000–9500 km distance segment. These two aircraft have similar intensity at 4500–5000 km, but the intensities of 330-243E are larger than 330-343E in other distance segments. In the distance segment 9500–13000 km, 787-8's carbon emission intensities are smaller than 777-300ER, so 787-8 has a better overall performance than 777-300ER in this distance segment.
The difference between the A320 series and the A330 series has little relationship with the engines, as the engines of the subseries are the same. The engines of 320-214 and 320-232 are CFM56-5/V2500, and those of 330-343E and 330-243E are PW4000/Trent 700/CF6-80E1. Therefore, their difference in carbon emission intensity may be related to airline route arrangement and actual flight operation. However, the engines of the other two pairs of aircraft are different. The engines of 737-700 are CFM56-7B20/CFM56-7B24, while those of 737-800 are CFM56-7B24/CFM56-7B27. The engines of 777-300ER are PW4090/Trent 895/GE90-94B, and those of 787-8 are Trent 1000/GEnx-1B. The engines of 737-800 and 777-300ER consume more fuel per kilometer, so the engine difference may lead to the emission intensity of these aircraft.
The impacts of CNG2020 on the overall emissions. The primary emissions include CO2, CO, HC, NOx, SO2, and PM2.5. The CNG2020 strategy was proposed in the second half of 2016. Therefore, the data are divided into two groups for comparison: before the CNG2020 was proposed, i.e., 2014–2016, and after the CNG2020 strategy was proposed, i.e., 2017–2019. The overall emissions of six pollutants in the two groups were averaged and compared. After the proposal of the CNG2020 strategy, the overall emission of six pollutants is still increasing, but the increase rate is no more than 27 %. Taking carbon dioxide as an example, the average overall emission in 2017–2019 was 44 787 085.866 t, increasing 21.50 % (36 861 009.60) over the average overall emission in 2014–2016. The average overall emission of CO, HC, NOx, SO2, and PM2.5 increased 18.36 %, 9.62 %, 26.73 %, 21.50 %, and 20.88 %, respectively.
And we can also find that CO2 accounts for the most significant proportion of various pollutants, which is much higher than other pollutants. Taking 2014–2016 as an example, the average overall emission of CO2 was 36 861 009.60 t, far exceeding the second-ranked NOx (370 431.58 t). In addition to CO2, the emissions of CO and NOx are also relatively large. Nitrogen oxides account for about 1.05 % of the overall emissions, while carbon monoxide accounts for about 0.63 %. In addition, Figs. 4 and 5 more accurately show the changes in the overall emissions of six pollutants before and after the proposal of the CNG2020 strategy. We can find that the growth rate of the overall emissions of pollutants in 2017–2019 is generally less than that in 2014–2016. Taking CO2 as an example, the average annual growth percentage in 2014–2016 is 27.75 %, and that in 2017–2019 is 1.19 %. And the growth rate of CO and HC in 2017–2018 and the growth rate of CO2 in 2018–2019 are negative, which shows that the growth rate of aviation pollutant emissions has slowed down and has a negative growth trend under the influence of the CNG2020 strategy. Since the CNG2020 strategy was put forward in 2016, airlines have made efforts to reduce the overall emissions of Chinese and foreign routes, which is a very positive signal that airlines are trying to achieve carbon-neutral growth in the aviation industry.
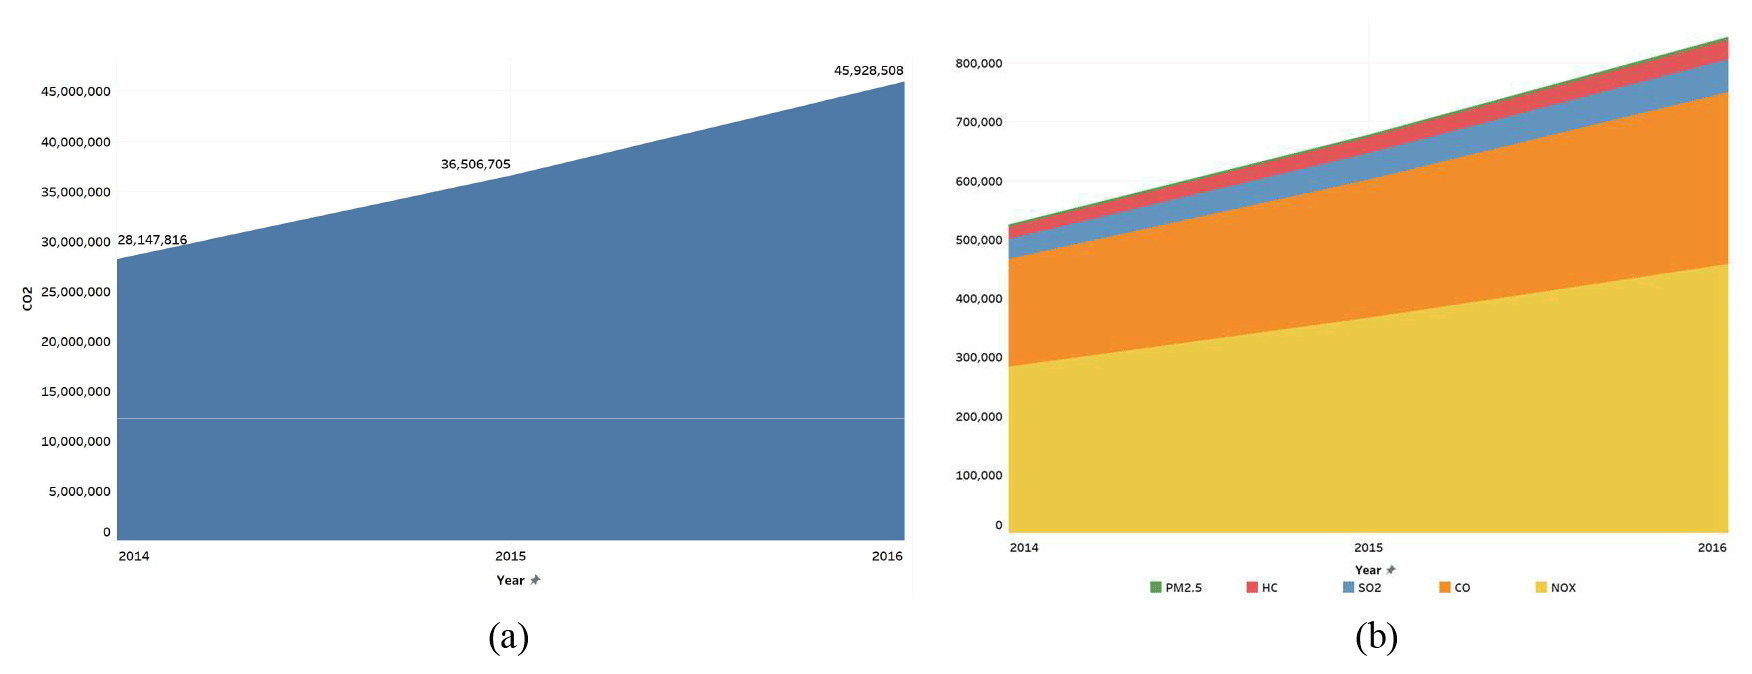
Figure 4Annual overall emissions of six pollutants before the CNG2020 strategy was proposed (tonnes). (a) Annual overall emissions of CO2 from 2014 to 2016. (b) Annual overall emissions of the other five pollutants from 2014 to 2016.
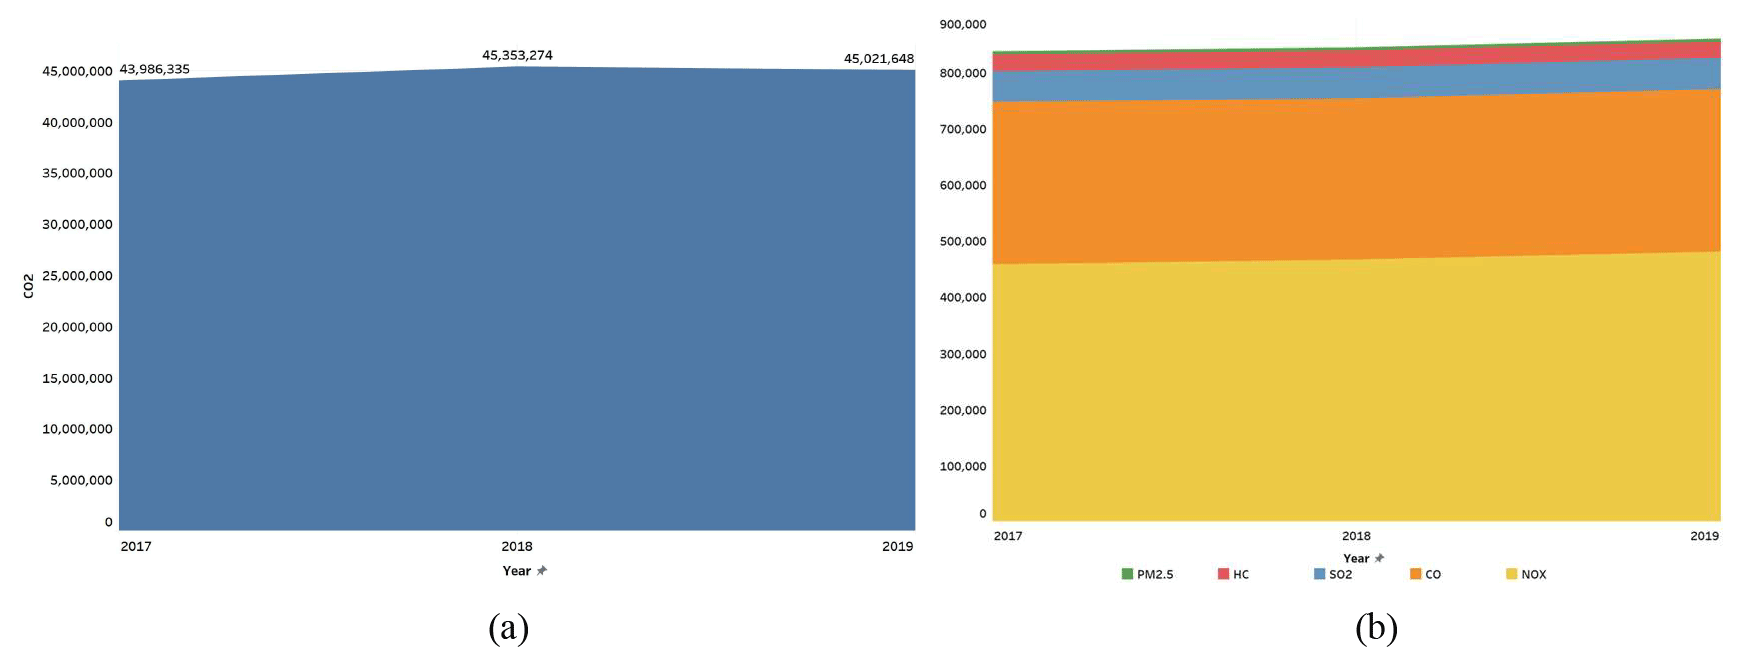
Figure 5Annual overall emissions of six pollutants after the CNG2020 strategy was proposed (tonnes). (a) Annual overall emissions of CO2 from 2017 to 2019. (b) Annual overall emissions of the other five pollutants from 2017 to 2019.
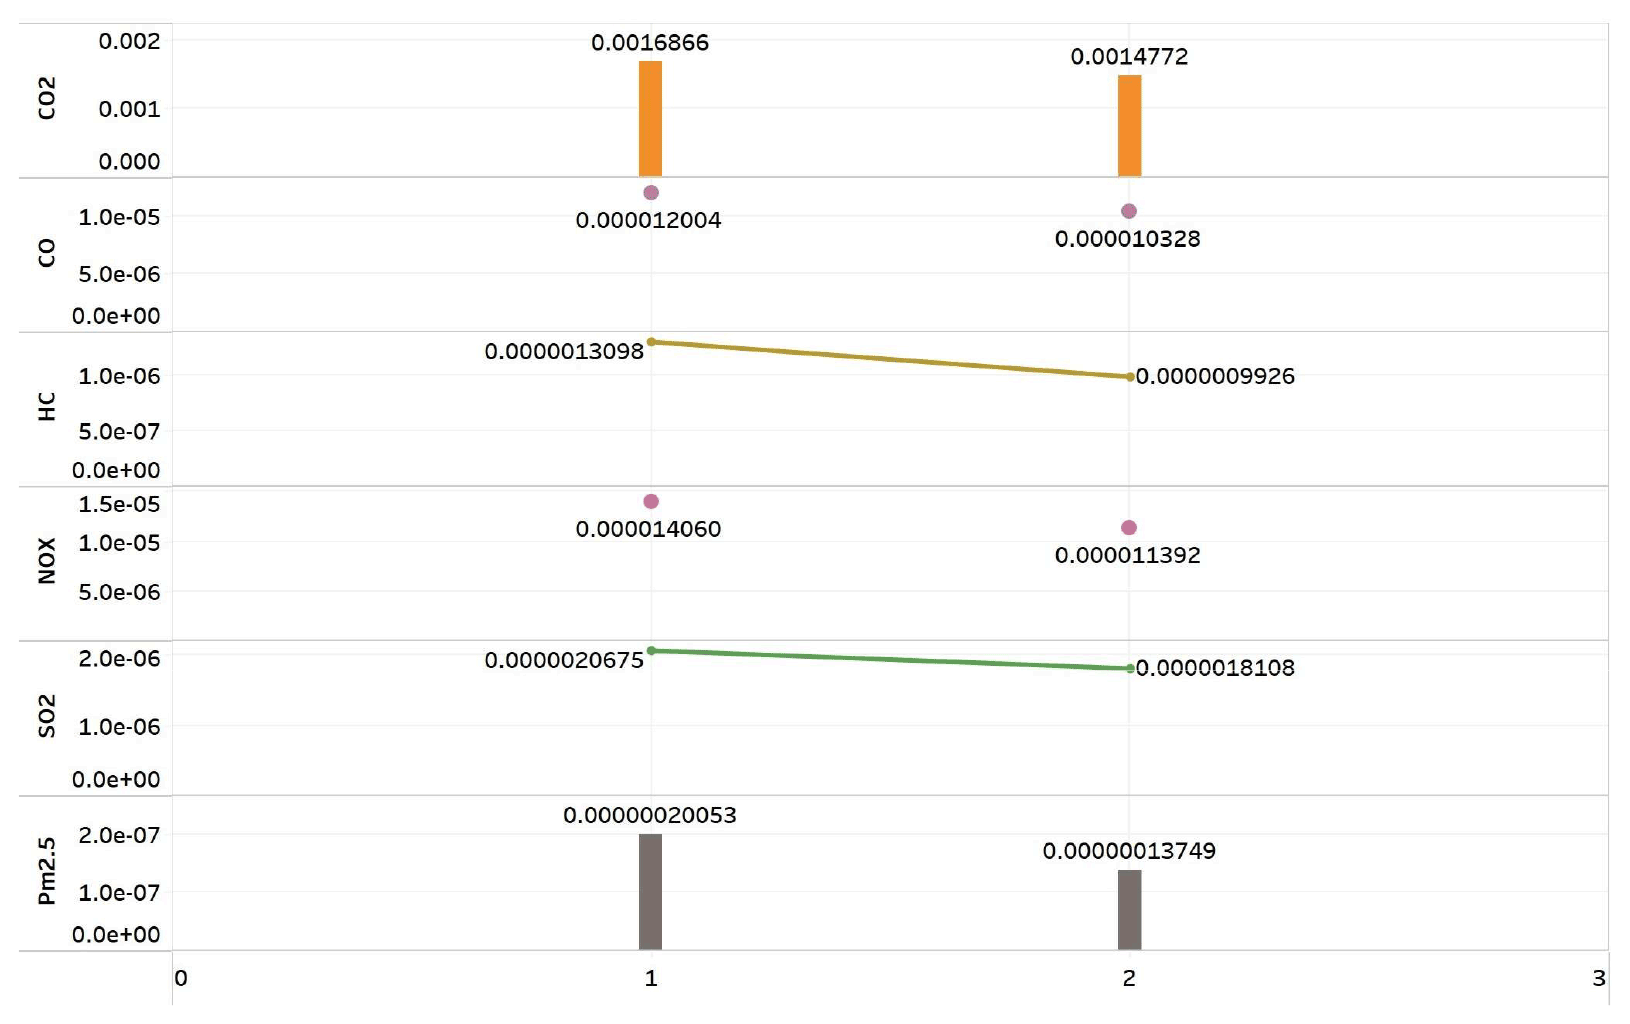
In addition, we compared the changes in unit turnover emissions of six pollutants before and after CNG2020. According to the relevant report data of the Civil Aviation Administration of China, the total transportation turnover in 2014–2019 was 24.011×10⁹ t km, 29.111×10⁹ t km, 34.06×10⁹ t km, 38.848×10⁹ t km, 45.319×10⁹ t km, and 46.377×10⁹ t km, respectively. The unit turnover emissions of six gases in 2014–2019 can be obtained. After averaging the first 3 years and the next 3 years, the results are shown in Fig. 6 (1 represents 2014–2016, and 2 represents 2017–2019). Under the influence of the CNG2020 strategy, the unit turnover emissions of six gases have decreased. Taking CO2 with the largest emissions as an example, the carbon emissions per tonne-kilometer in 2014–2019 were , 1.25E−03, , , , and t, respectively. The average carbon emission per tonne-kilometer before the proposal of the CNG2020 strategy (2014–2016) was t, and after the proposal of the CNG2020 strategy (2017–2019), the average carbon emission per tonne-kilometer was t, a decrease of 17.77 %. Similarly, for CO, HC, NOx, SO2, and PM2.5, the decline rates were 17.26 %, 25.15 %, 14.32 %, 17.77 %, and 16.35 % respectively.
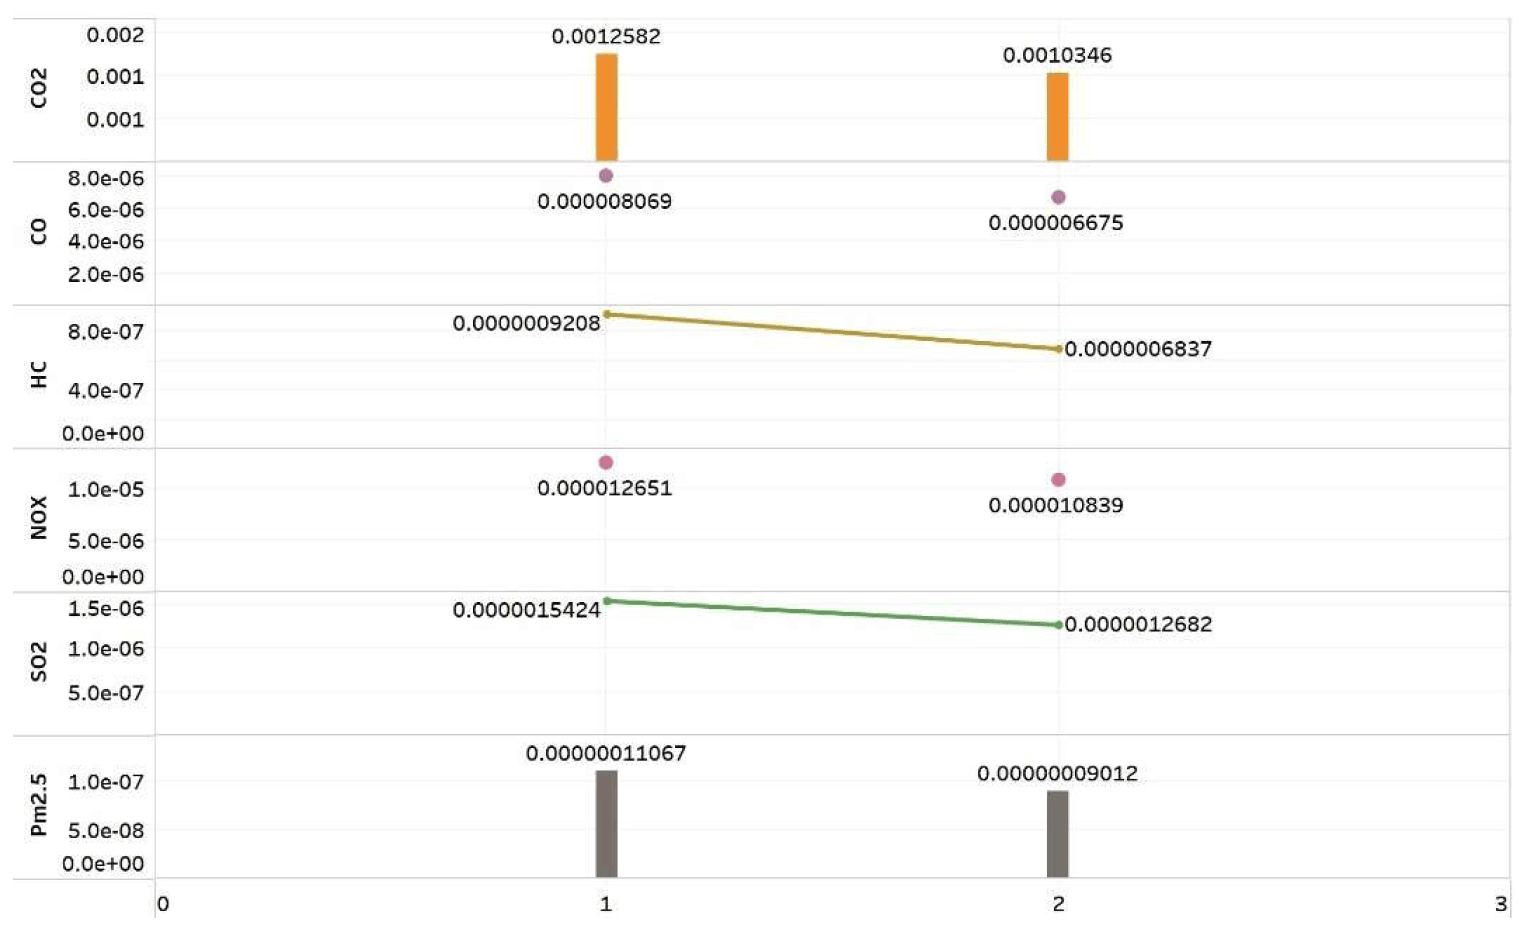
Figure 6Changes in average unit turnover emissions of six pollutants before and after the CNG2020 strategy was proposed (tonnes).
The impacts of CNG2020 on the emissions of the routes. First, we will discuss the impact of the CNG2020 strategy on the average emissions of routes. The data are still divided into two groups for comparison. The average overall emission change of the two groups of routes can be calculated. During 2014–2016, the average overall emission of CO2, CO, HC, NOx, SO2, and PM2.5 of the routes was 84 783.78, 543.60, 62.06, 852.40, 103.93, and 7.45 t, respectively. From 2017 to 2019, the average overall emission of CO2, CO, HC, NOx, SO2, and PM2.5 of the routes was 91 185.39, 587.56, 60.17, 955.15, 111.78, and 7.95 t, respectively. Therefore, except for HC, the overall decline was 3.03 %, and the average overall emissions of other pollutant routes in 2017–2019 increased relatively compared with 2014–2016. For example, CO2 increased by 7.55 %, and NOx rose by 12.05 %, but the increasing percentage is not more than 13 %. Further, the annual variation range of the average overall emission of each pollutant route is analyzed in the two groups in detail. As shown in Figs. 7 and 8, the growth range of the average overall emission of the routes in 2017–2019 was generally less than that in 2014–2016. Taking CO2, which accounts for the most significant proportion of pollutants, as an example, the average annual growth percentage in 2014–2016 was 10.67 %. In 2017–2019, it was negative growth (−2.46 %). And during 2018–2019, the average overall emissions of all pollutants from all routes increased negatively, indicating that all routes reduced aviation pollutants after the CNG2020 strategy was put forward.
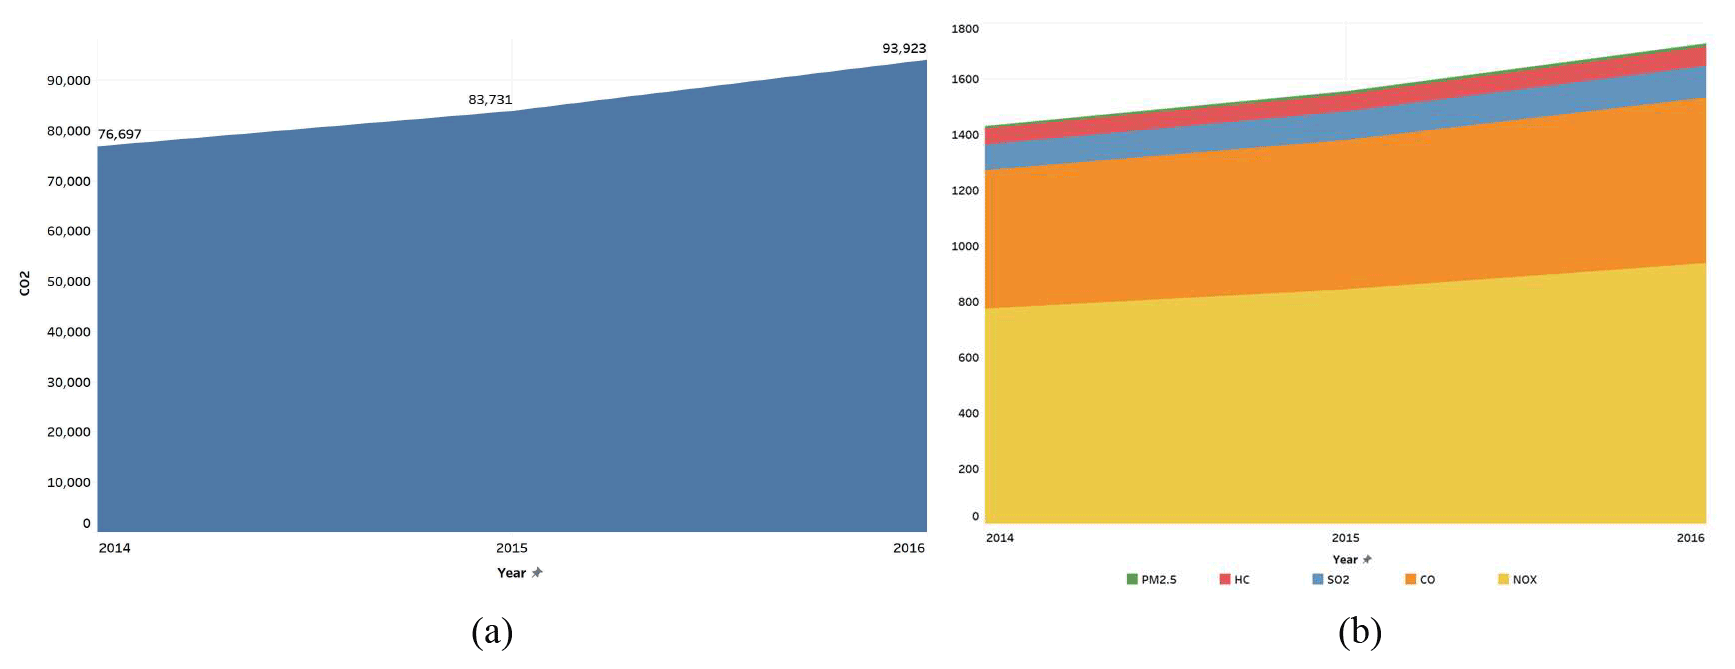
Figure 7Annual average emissions of six pollutants from routes before the CNG2020 strategy was proposed (tonnes). (a) Average overall route emissions of CO2 from 2014 to 2016. (b) Average overall route emissions of the other five pollutants from 2014 to 2016.
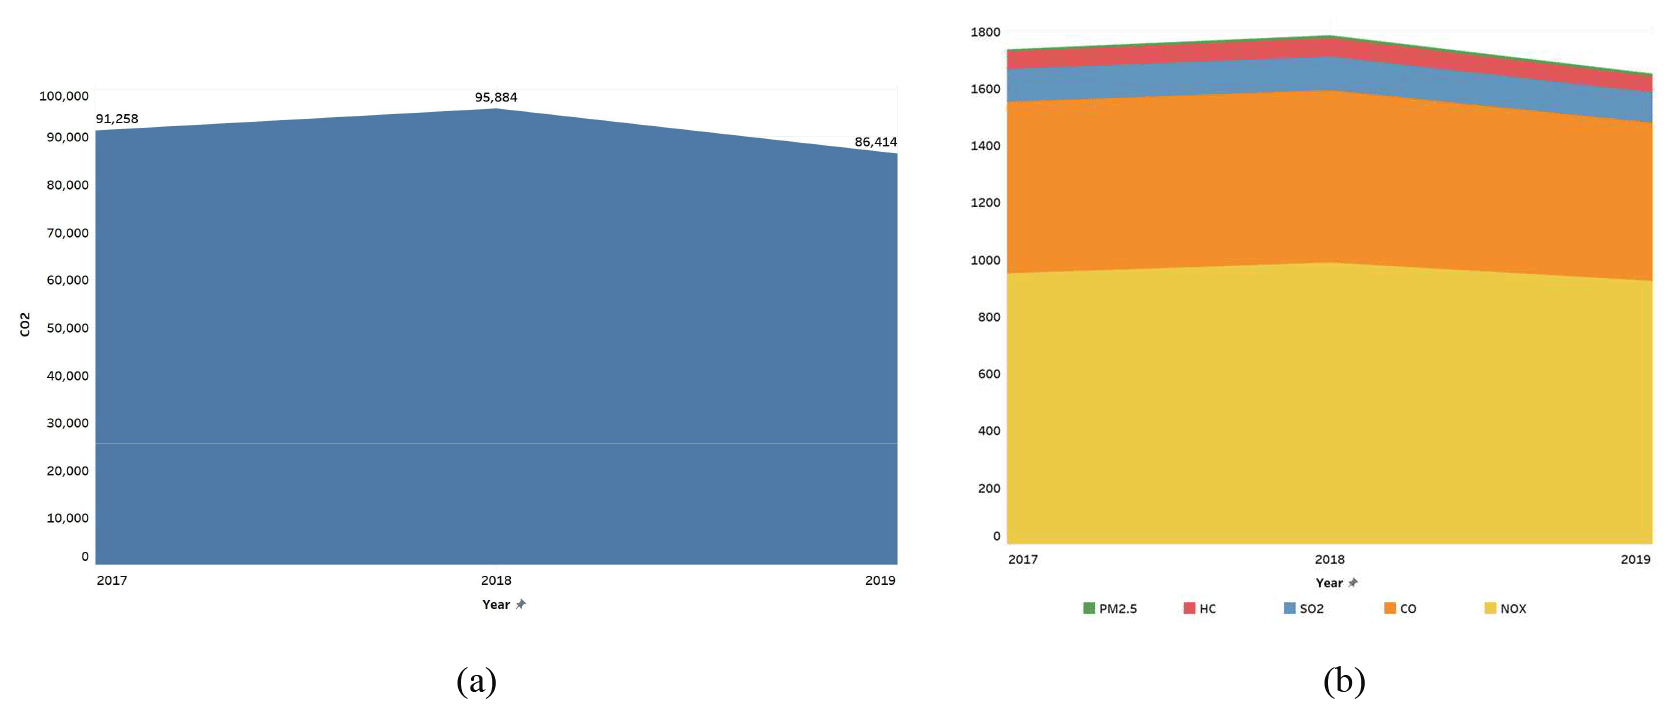
Figure 8Annual average emissions of six pollutants from routes after the CNG2020 strategy was proposed (tonnes). (a) Average overall route emissions of CO2 from 2017 to 2019. (b) Average overall route emissions of the other five pollutants from 2017 to 2019.
Meanwhile, the average unit turnover emissions of each route before and after CNG2020 are shown in Fig. 9 (1 represents 2014–2016, and 2 represents 2017–2019). The average emissions per tonne-kilometer of CO2, CO, HC, NOx, SO2, and PM2.5 routes before the CNG2020 strategy was proposed (2014–2016) are , , and , , and t. After the CNG2020 strategy was put forward (2017–2019), the average emissions per tonne-kilometer of CO2, CO, HC, NOx, SO2, and PM2.5 of the route were , , , , and t, down 18.78 %, 28.29 %, 33.31 %, 36.54 %, 30.09 %, and 18.79 % respectively.
Therefore, we further compare the average carbon emissions per unit turnover of the two groups of data hotspot routes, select the routes before and after the strategy, and study the impact of the CNG2020 strategy on them. Through analysis, 291 routes are available and can be defined as popular routes. As shown in Fig. 10a, we summarize the five routes with the largest increase in average unit turnover carbon emissions and the five routes with the largest reduction before and after the strategy was proposed. The red is the route with the largest increase, and the green is the route with the largest reduction. The former can indicate that the carbon emission per unit turnover increased rapidly after the CNG2020 strategy was proposed. The latter can indicate that the carbon emission per unit turnover decreased rapidly after the CNG2020 strategy was proposed. Among the top five routes with the largest emission reduction, four are associated with Guangzhou, China. It shows that Guangzhou, as one of China's air transport center cities, has achieved good results in carbon emission reduction. Figure 10b shows the five routes with the smallest change in average carbon emissions per unit turnover before and after the proposal of the CNG2020 strategy. Three of them are routes between China and South Korea. In addition, two of the five routes are from Shanghai and Beijing. Compared with Guangzhou, Shanghai, and Beijing, as important aviation hubs in China, they are not sensitive to the CNG2020 strategy. It is worth noting that only 14 of the 291 routes have increased their average carbon emissions per unit turnover after the proposal of the CNG2020 strategy, and the emissions of the remaining 277 routes have decreased after the proposal of the CNG2020 strategy. Moreover, among the 14 routes with increased emissions, 10 routes are shorter than 5000 km, indicating that under the CNG2020 strategy, airlines do not control the carbon emissions of short-haul routes enough.
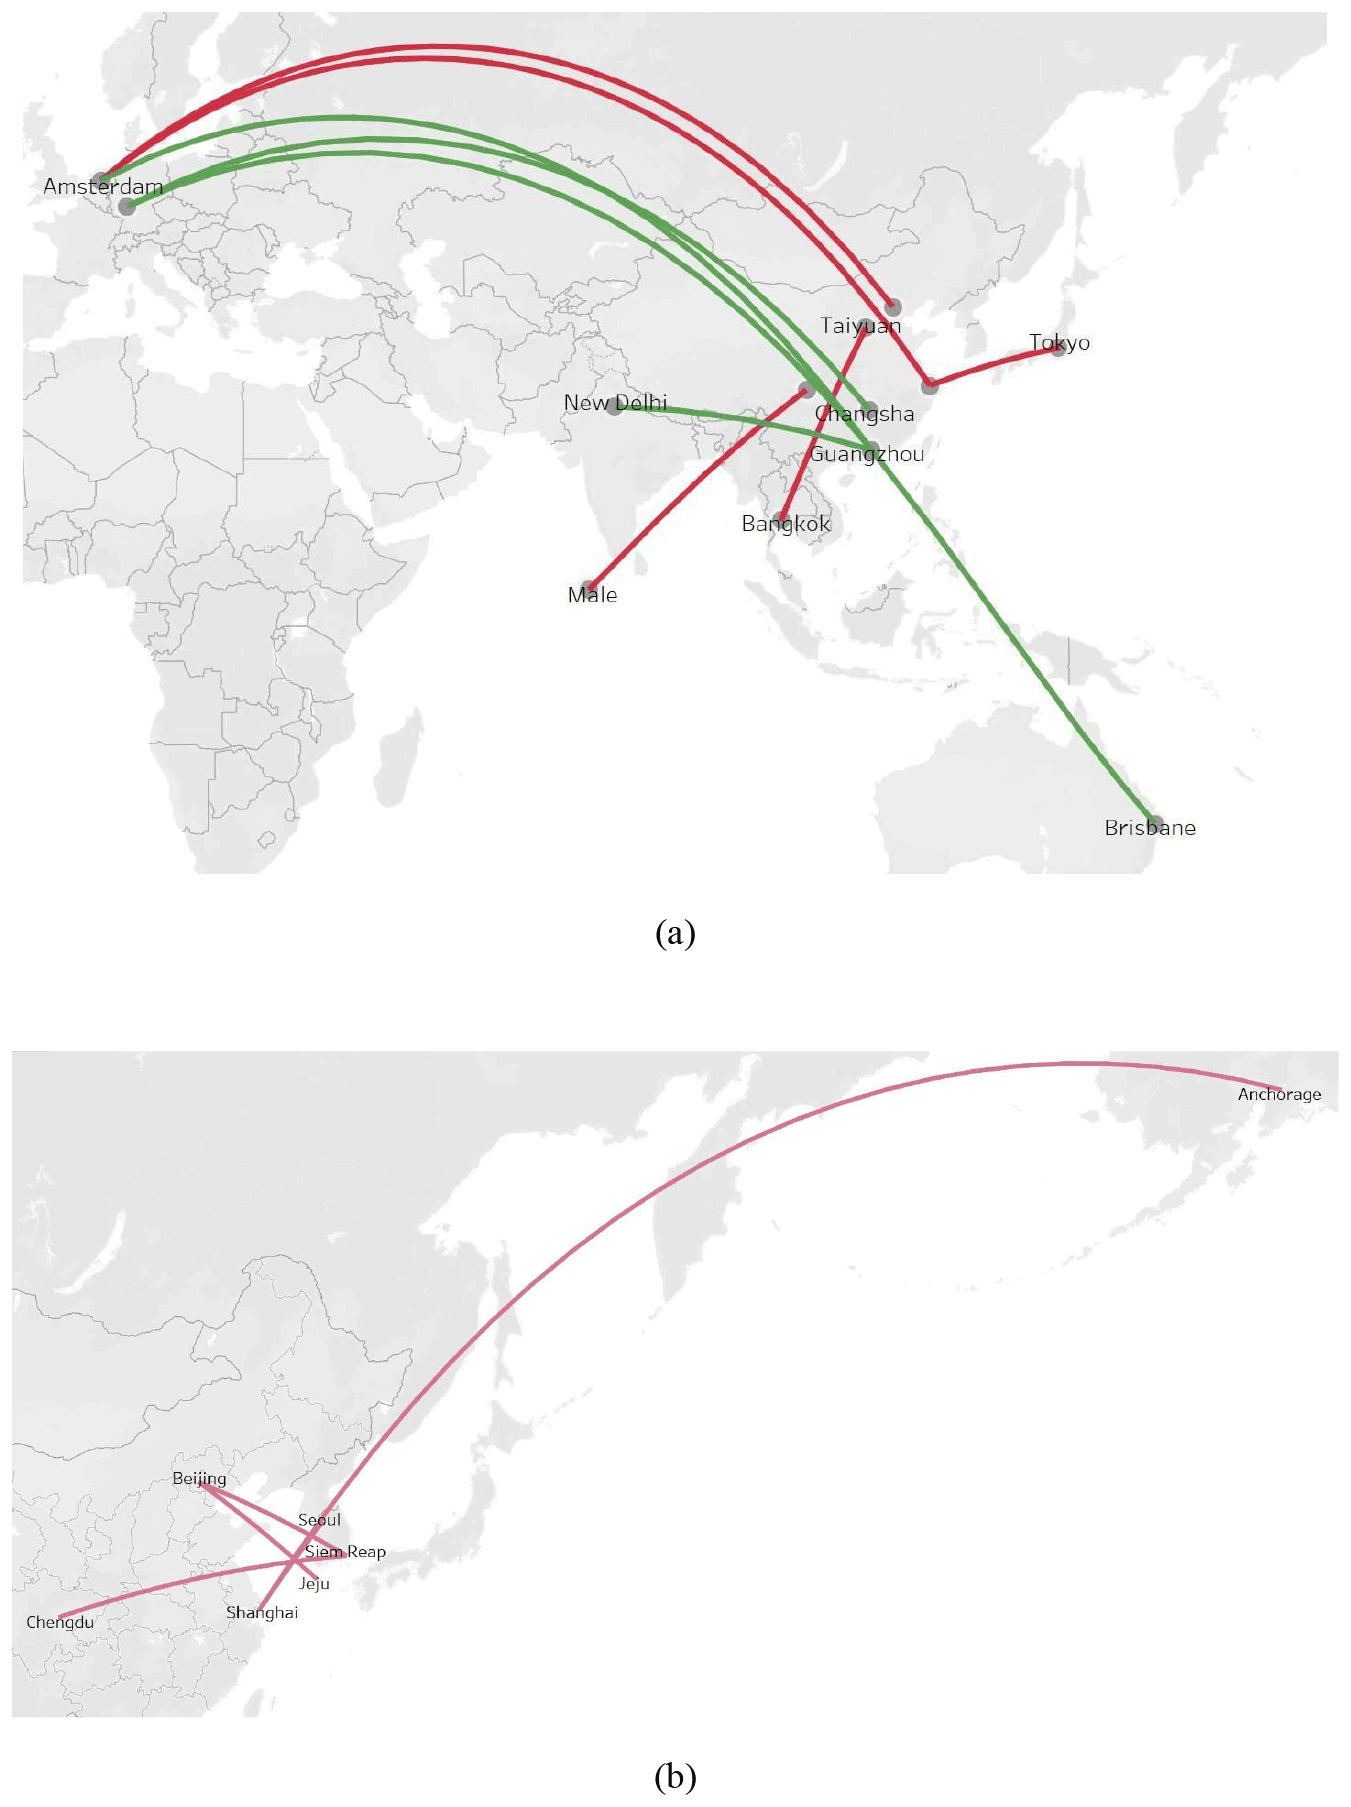
Figure 10The impacts of CNG2020 on some popular routes. (a) The largest increase and the largest reduction routes in average unit turnover carbon emissions before and after the CNG2020 strategy was proposed. (b) The strategy proposes the path of minimum change of average unit turnover carbon emissions before and after the CNG2020 strategy was proposed.
The impacts of CNG2020 on the emissions of the airlines. First, we will discuss the impact of the CNG2020 strategy on the average emissions of airlines. By comparing the changes of average overall emissions of airlines before and after the CNG2020 strategy was proposed, it can be concluded that airlines' average overall HC emissions decreased by 8.24 % in 2017–2019 compared with 2014–2016. But the average overall emissions of CO2, CO, NOx, SO2, and PM2.5 increased by 1.93 %, 2.24 %, 6.17 %, 1.93 %, and 0.98 %, respectively, and the growth rate was no more than 7 %. Further, the annual variation range of the average overall emission of each pollutant airline in the two groups is analyzed, as shown in Figs. 11 and 12. Unlike the comparison results of routes, the growth rate of average overall emissions of airlines in 2017–2019 is generally more significant than that in 2014–2016. Taking CO2, which accounts for an essential proportion of pollutants, as an example, the annual average growth percentage is 0.12 % in 2014–2016 and 4.48 % in 2017–2019. The main reason is that the average overall emissions of airlines increased significantly from 2017 to 2018. The number of airlines in 2018 was 107, 18 fewer than that in 2017, and the number of routes was also reduced by 9. However, the average overall carbon emissions of airlines increased by 20.45 %. Therefore, the overall average total emissions in 2017–2019 were more significant than 2014–2016.
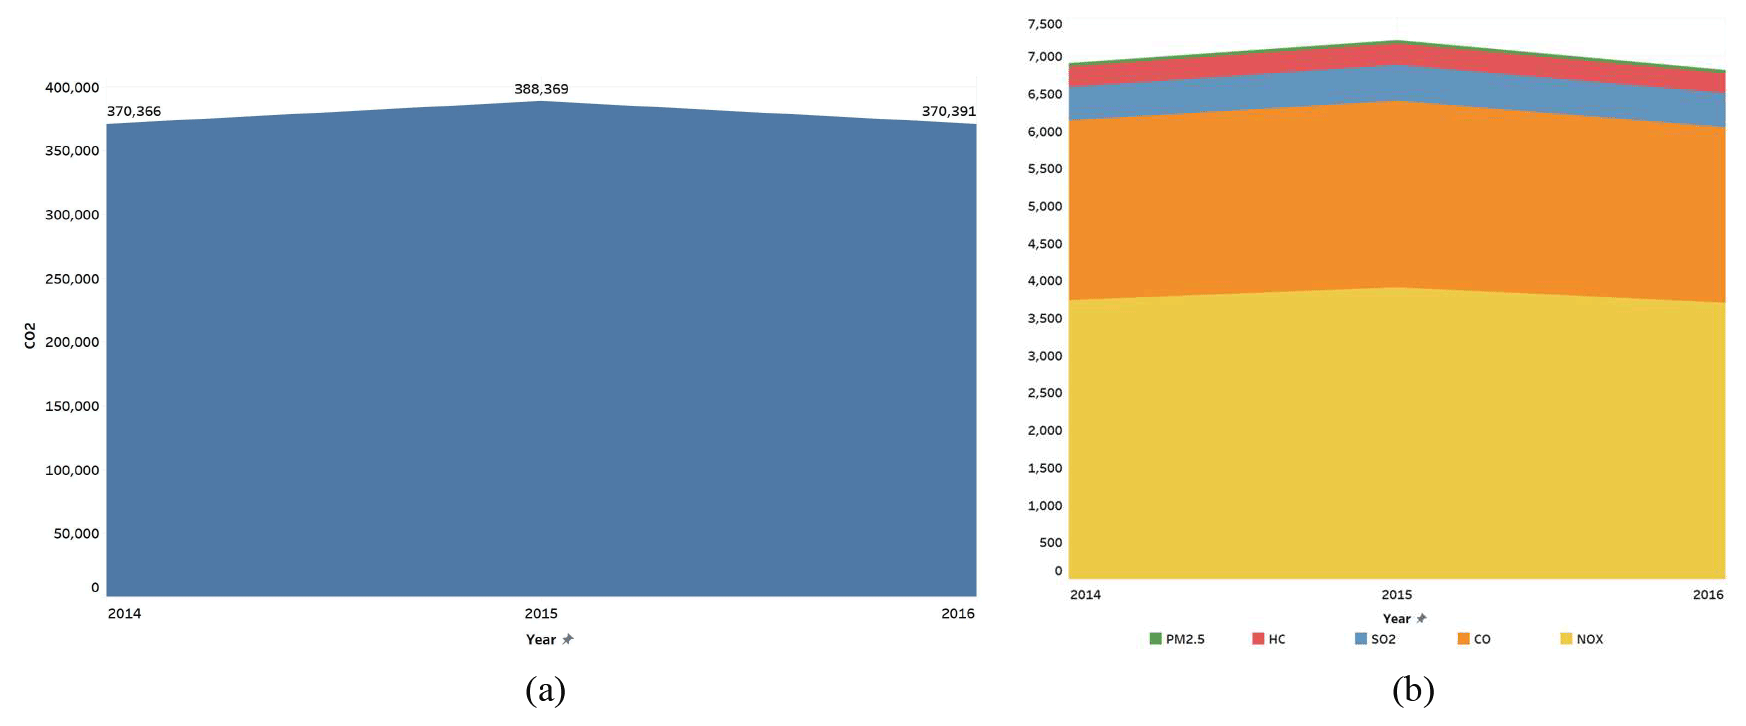
Figure 11Changes in average emissions of six pollutant airlines before the CNG2020 strategy was proposed (tonnes). (a) Average overall airline emissions of CO2 from 2014 to 2016. (b) Average overall airline emissions of the other five pollutants from 2014 to 2016.

Figure 12Changes in average emissions of six pollutant airlines after the CNG2020 strategy was proposed (tonnes). (a) Average overall airline emissions of CO2 from 2017 to 2019. (b) Average overall airline emissions of the other five pollutants from 2017 to 2019.
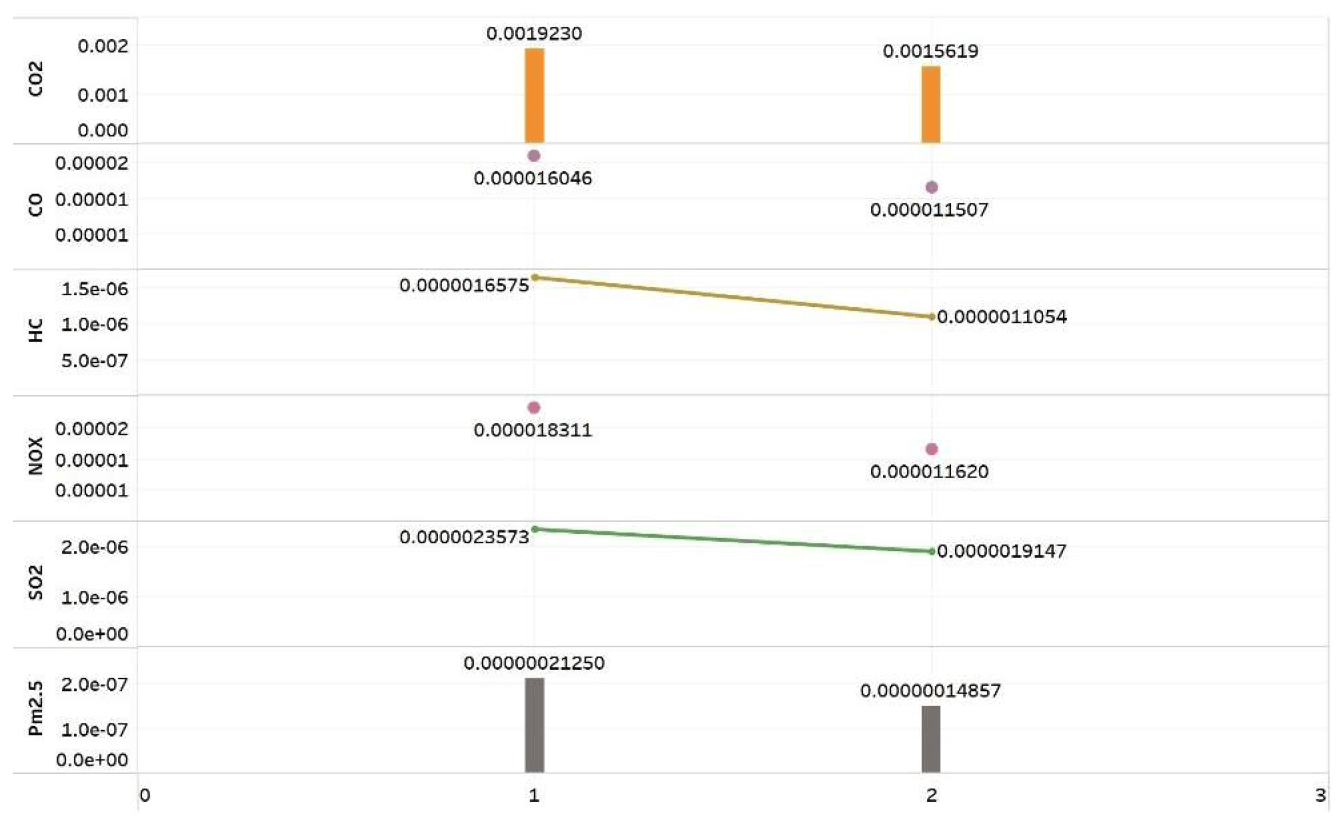
In addition, the average unit turnover emissions of airlines before and after CNG2020 are shown in Fig. 13 (1 represents 2014–2016, and 2 represents 2017–2019). Airlines' average emissions per tonne-kilometer of CO2, CO, HC, NOx, SO2, and PM2.5 before the CNG2020 strategy was proposed (2014–2016) were , , , , , and t, respectively. The average emissions per tonne-kilometer of CO2, CO, HC, NOx, SO2, and PM2.5 of airlines after the proposal of the CNG2020 strategy (2017–2019) were , , , , , and t, down 12.42 %, 13.96 %, 24.21 %, 18.98 %, 12.42 %, and 31.44 % respectively.
Therefore, we further compare airlines' average carbon emissions per unit turnover in the two data hotspots. Through analysis, 63 airlines are available, which can be defined as popular airlines. We summarize the three airlines with the most significant increase in average unit turnover carbon emissions and the three airlines with the most significant decrease in carbon emissions of popular airlines before and after the strategy was proposed, as shown in Fig. 14. The red ones are the airlines with the most significant increase, and the green ones are the airlines with the most significant decrease. It is worth noting that among the 63 airlines, only four airlines have increased their carbon emissions per unit turnover after the CNG2020 strategy was proposed, namely, Asian Air, Lucky Air, Eastar Jet, and Pakistan International Air. The rest have decreased, indicating that most airlines have better controlled their carbon emissions after the CNG2020 strategy was proposed.

In this study, we discuss the impacts of the proposal of the CNG2020 strategy on the aircraft emissions of China–foreign routes during 2014–2019. The emissions from 2014 to 2016 constitute the data before the CNG2020 strategy was put forward, and those from 2017 to 2019 are the data after the CNG2020 strategy was put forward. We collect the flight information (including aircraft types, flight frequency, airline, flight distance, and flight time) of all the international routes between China and foreign countries. Then we calculate the overall emissions for each route and airline containing CO2, CO, HC, NOx, SO2, and PM2.5. The overall emissions include the CCD emissions and LTO emissions; the former is calculated through the modified BFFM2-FOA-FPM, and the latter is calculated based on the ICAO standard method. Accounting for emissions can better summarize the impact of the CNG2020 strategy on aircraft activities and provide data and method references to implement the CNG2020 strategy better.
We get some important results. First, after the proposal of the CNG2020 strategy, the overall emission of six pollutants is still increasing, but the increase rate is no more than 27 %. The growth rate of the overall emissions of pollutants in 2017–2019 is generally less than that in 2014–2016. And CO2 accounts for the most significant proportion of various pollutants, which is much higher than other pollutants. Second, under the influence of the CNG2020 strategy, the emissions of unit turnover of six gases have decreased. Third, except for HC, the overall decline was 3.03 %, and the average overall emissions of other pollutant routes in 2017–2019 increased relatively compared with 2014–2016, but the increasing percentage is not more than 13 %. And the growth range of the average overall emission of the routes in 2017–2019 is generally less than that in 2014–2016. Fourth, each route's average unit turnover emissions have decreased since the CNG2020 strategy was proposed. Fifth, as one of China's air transport center cities, Guangzhou has achieved good results in carbon emission reduction, but Shanghai and Beijing, as important aviation hubs in China, are not sensitive to the CNG2020 strategy. And under the CNG2020 strategy, airlines do not control short-haul routes' carbon emissions. Sixth, airlines' average overall HC emissions decreased, but the average overall emissions of CO2, CO, NOx, SO2, and PM2.5 increased. And unlike the performance of the routes, the growth rate of average overall emissions of airlines in 2017–2019 is generally more significant than that in 2014–2016. Seventh, each airline's average unit turnover emissions have decreased since the CNG2020 was proposed, too. Most airlines have better controlled their carbon emissions since the CNG2020 strategy was proposed. Only four airlines have increased their carbon emissions per unit turnover since the CNG2020 strategy was proposed.
The standard LTO method is adopted in the calculation of LTO phase emissions in this paper, without considering delays and flight turnover caused by weather. And this paper does not consider the emissions of freight transport. Future research could focus on emissions from delays, flight turnover, and freight.
The CCD and LTO emissions of each route and airline for the six pollutants from 2014 to 2019 can be found in Cui (2022) (https://doi.org/10.6084/m9.figshare.20071751.v1).
The original data are collected from the http://variflight.com (VariFlight, 2022), and we complied the data. The data on aircraft type, flight time, flight distance, transfer flight, and airlines are from VariFlight.com (VariFlight, 2022). The data sources and specific steps for data collection are available in Table S1 in the Supplement. The data on the engines of each aircraft and the data on the engines are from the ICAO Aircraft Engine Emissions Databank (EASA, 2022).
In this paper, the emissions in the CCD stage are calculated through the modified BFFM2-FOA-FPM. The LTO emissions are calculated based on the ICAO standard method.
5.1 Modified BFFM2-FOA-FPM
In the modified BFFM2-FOA-FPM, the CCD emissions E(Q) can be calculated by
where Ij is the emission coefficient of pollution j of aviation kerosene (EASA, 2022), weight(Q) is the total weight of the aircraft, Mfuel is the fuel coefficient, and is a fuel weight proportionality coefficient, which is usually calculated by the fuel percentage method (FPM). The total sections of a whole flight contain seven task sections: engine starting, taxiing, taking off, climbing, cruising, descending, and landing. as the fuel weight proportionality coefficient of task section . The number of seats is the certified seat number, and seats are the actual passenger number.
As we only consider the CCD section in this study, we define the of other sections as 1. The of climbing and descending is 0.980 and 0.990. The equation of the CCD section to calculate is , where dis is the cruising distance, v is the cruising speed, ccr is the fuel consumption ratio when the aircraft is cruising, and LDcr is the lift : drag ratio when the aircraft is cruising. The value of ccr and LDcr has direct relationships with the aircraft type. We define , and then for the cruising task section, the is .
The actual flight time of each flight is applied to check the results of ratiocr and get the emission intensity. For CO2, the emission coefficient is fixed, which is kg kg−1. For SO2, the emission coefficient is fixed, which is g kg−1.
For CO and HC, . θ is the ratio of outside temperature to 288 K; δ is the ratio of external pressure to sea level pressure. Ij0 is the standard emission coefficient of a LTO stage OF CO or HC (g kg−1).
For NOx, . Ij0 is the standard emission coefficient of a LTO stage of NOx (g kg−1). θ is the ratio of outside temperature to 288 K, and δ is the ratio of external pressure to sea level pressure. φ is atmospheric relative humidity, P is external pressure, and Pv is atmospheric saturation pressure, which is calculated by the Goff–Gratch formula (Detwiler, 1983):
According to relevant physical laws (Smith et al., 1970; Abu-Ghannam and Shaw, 1980; Detwiler, 1983), the external pressure P is . H is height. The outside temperature T is . The atmospheric relative humidity φ is . a is absolute humidity, and it is .
For PM2.5, it can be divided into nonvolatile compound fine particles (NCFPs) and volatile compound fine particles (VCFPs). For NCFPs, . The unit of INCFP is milligrams per kilogram (mg kg−1). AFR is the air : fuel ratio, which is decided by height. SN is engine smoke, which can be found in the ICAO Aircraft Engine Emissions Databank 27. VCFPs contain volatile organic compounds (VOCs) and volatile sulfur compounds (VSCs). For VOCs, . σ is the ratio of VOCs to the emission coefficient of HC, which can be found in ICAO Aircraft Engine Emissions Databank (EASA, 2022). For VSC, ; 0.2 % is fuel sulfur content, and 3.3 % is sulfur conversion coefficient. Therefore, for PM2.5, .
5.2 ICAO standard method to calculate LTO emissions
This paper uses the standard LTO cycle definition specified by ICAO to calculate the fuel consumption, including all activities at an altitude below 3000 ft (915 m) near the airport. The calculation formula of the five non-CO2 pollution emissions in LTO stage is
where ELTO is the emissions in the LTO stage, Pa is the standard emissions of the engine of aircraft type a (unit: kg), Na is the number of engines of aircraft type a, Cm is the thrust setting of stage m, and tm is the working time of phase m. The value range of m is 1, 2, 3, and 4, respectively corresponding to the four stages of take-off and landing in the aircraft flight process: take-off, climb, approach, and taxiing. According to the standard LTO cycles defined by ICAO, when the aircraft is taking off, its engines are at 100 % thrust, and working time is 0.7 min; when the aircraft is climbing, its engines are at 85 % thrust, and working time is 2.2 min; when the aircraft is approaching, its engines are at 30 % thrust, and working time is 4 min; and when the aircraft is taxiing, its engines are at 7 % thrust, and working time is 26 min. Therefore, in a standard LTO cycle, the total working time is 32.9 min.
The fuel consumption rate is calculated as
where A is the total number of airlines with aircraft type a, j is the type of engine of the aircraft, Kj is the number of aircraft type a equipped with engine type j, and Fjmi is the fuel consumption rate of engine type j under the m setting. The data are from the ICAO Aircraft Engine Emissions Databank (EASA, 2022). This formula is based on the weighted average of all possible engine types of the domestic routes in China.
The supplement related to this article is available online at: https://doi.org/10.5194/essd-14-4419-2022-supplement.
QC designed the study. QC, YL, and BC compiled the original data and participated in writing and revising the manuscript.
The contact author has declared that none of the authors has any competing interests.
Publisher's note: Copernicus Publications remains neutral with regard to jurisdictional claims in published maps and institutional affiliations.
This research has been supported by the National (grant no. 71701088) and the Fundamental Research Funds for the Central Universities (grant no. 2242022S20021).
This paper was edited by Bo Zheng and reviewed by two anonymous referees.
Abu-Ghannam, B. J. and Shaw, R.: Natural transition of boundary layers – the effects of turbulence, pressure gradient, and flow history, J. Mech. Eng. Sci., 22, 213–228, https://doi.org/10.1243/JMES_JOUR_1980_022_043_02, 1980.
Altuntas, O.: Calculation of domestic flight-caused global warming potential from aircraft emissions in Turkish airports, Int. J. Global Warm., 6, 367–379, https://doi.org/10.1504/IJGW.2014.066045, 2014.
Baxter, G., Srisaeng, P., and Wild, G.: Airport related emissions and their impact on air quality at a major Japanese Airport: the case of Kansai International Airport, Transport and Telecommunication, 21, 95–109, https://doi.org/10.2478/ttj-2020-0007, 2020.
CAAC: National aviation database, CAAC [data set], http://www.caac.gov.cn/XXGK/XXGK/index_172.html?fl=11, last access: 6 September 2022.
Civil and Military Aviation: EMEP/EEA air pollutant emission inventory guidebook, Luxembourg, Publications Office of the European Union, 2014.
Cokorilo, O.: Environmental Issues for Aircraft Operations at Airports, Transp. Res. Proc., 14, 3713–3720, 2016,
Cui, Q.: The online pricing strategy of low-cost carriers when carbon tax and competition are considered, Transportation Res. A-Pol., 121, 420–432, https://doi.org/10.1016/j.tra.2019.02.002, 2019.
Cui, Q.: The CCD and LTO emissions of each route and airline for the six pollutions from 2014 to 2019 of China-Foreign routes, FigShare [data set], https://doi.org/10.6084/m9.figshare.20071751.v1, 2022.
Cui, Q. and Li, Y.: CNG2020 strategy and airline efficiency: a network epsilon-based measure with managerial disposability, Int. J. Sustain. Transp., 12, 313–323, https://doi.org/10.1080/15568318.2017.1353187, 2018.
Cui, Q., Chen, B., and Lei, Y. L.: Accounting for the aircraft emissions of China's domestic routes during 2014–2019, Scientific Data, 9, 383, https://doi.org/10.1038/s41597-022-01494-0, 2022a.
Cui, Q., Lei, Y., Li, Y., an Wanke, P. F.: Impacts of the COVID-19 on all aircraft emissions of international routes in South America, iScience, 25, 104865, https://doi.org/10.1016/j.isci.2022.104865, 2022b.
Cui, Q., Li, X.Y., Li, Y.: Accounting for the carbon emissions from domestic air routes in China, Heliyon, 8, e08716, https://doi.org/10.1016/j.heliyon.2022.e08716, 2022c.
Detwiler, A.: Extrapolation of the Goff-Gratch formula for vapor pressure of liquid water at temperatures below 0 ∘C, J. Appl. Meteorol., 22, 503–504, https://doi.org/10.1175/1520-0450(1983)022<0503:EOTGGF>2.0.CO;2, 1983.
EASA: ICAO Aircraft Engine Emissions Databank, https://www.easa.europa.eu/domains/environment/icao-aircraft-engine-emissions-databank, last access: 6 September 2022.
ICAO: ICAO Carbon Emissions Calculator, https://www.icao.int/environmental-protection/CarbonOffset/Pages/default.aspx (last access: 6 September 2022), 2021.
Kesgin, U.: Aircraft emissions at Turkish airports, Energy, 31, 372–384, https://doi.org/10.1016/j.energy.2005.01.012, 2006.
Kurniawan, J. S. and Khardi, S.: Comparison of methodologies estimating emissions of aircraft pollutants, environmental impact assessment around airports, Environ. Impact Assess., 31, 240–252, https://doi.org/10.1016/j.eiar.2010.09.001, 2011.
Liu, H., Tian, H., Hao, Y., Liu, S., Liu, X., Zhu, C., Wu Y., Liu W., Bai X., and Wu B.: Atmospheric emission inventory of multiple pollutants from civil aviation in China: temporal trend, spatial distribution characteristics and emission features analysis, Sci. Total Environ., 648, 871–879, https://doi.org/10.1016/j.scitotenv.2018.07.407, 2019.
Park, Y. and O'Kelly, M. E.: Fuel burn rates of commercial passenger aircraft: variations by seat configuration and stage distance, J. Transp. Geogr., 41, 137–147, https://doi.org/10.1016/j.jtrangeo.2014.08.017, 2014.
Pereira, S. R., Fontes, T., and Coelho, M. C.: Can hydrogen or natural gas be alternatives for aviation? – a life cycle assessment, Int. J. Hydrogen Energ., 39, 13266–13275, https://doi.org/10.1016/j.ijhydene.2014.06.146, 2014.
Shan, Y., Fang, S., Cai, B., Zhou, Y., Li, D., Feng, K., and Hubacek, K.: Chinese cities exhibit varying degrees of decoupling of economic growth and CO2 emissions between 2005 and 2015, One Earth, 4, 124–134, https://doi.org/10.1016/j.oneear.2020.12.004, 2021.
Smith, W. L., Woolf, H. M., and Jacob, W. J.: A regression method for obtaining real-time temperature and geopotential height profiles from satellite spectrometer measurements and its application to Nimbus 3 “SIRS” observations, Mon. Weather Rev., 98, 582–603, https://doi.org/10.1175/1520-0493(1970)098<0582:ARMFOR>2.3.CO;2, 1970.
Turgut, E. T., Cavcar, M., Usanmaz, O., Yay, O. D., Dogeroglu, T., and Armutlu, K.: Investigating actual landing and takeoff operations for time-in-mode, fuel and emissions parameters on domestic routes in turkey, Transport. Res. D-Tr. E., 53, 249–262, https://doi.org/10.1016/j.trd.2017.04.018, 2017.
Unal, A., Hu, Y., Chang, M. E., Odman, M. T., and Russell, A. G.: Airport related emissions and impacts on air quality: application to the Atlanta International Airport, Atmos. Environ., 39, 5787–5798, https://doi.org/10.1016/j.atmosenv.2005.05.051, 2005.
U.S. Environmental Protection Agency: Evaluation of Air Pollutant Emissions from Subsonic Commercial Jet Aircraft, Michigan, 1999.
VariFlight: Original flight information, https://www.variflight.com/, last access: 6 September 2022.
Wasiuk, D., Khan, M., Shallcross, D., and Lowenber, M.: A commercial aircraft fuel burn and emissions inventory for 2005–2011, Atmosphere, 7, 78, https://doi.org/10.3390/atmos7060078, 2016.
Winther, M., Kousgaard, U., Ellermann, T., Massling, A., and Ketzel, M.: Emissions of NOx, particle mass and particle numbers from aircraft main engines, APU's and handling equipment at Copenhagen Airport, Atmos. Environ., 100, 218–229, https://doi.org/10.1016/j.atmosenv.2014.10.045, 2015.
Xu, H., Xiao, K., Cheng, J. P., Yu, Y. M., Liu, Q. Z., Pan, J., Chen, J. J., Chen, F. T., and Fu, Q. Y.: Characterizing aircraft engine fuel and emission parameters of taxi phase for Shanghai Hongqiao International Airport with aircraft operational data, Sci. Total Environ., 720, 137431, https://doi.org/10.1016/j.scitotenv.2020.137431, 2020.
Zheng, J., Mi, Z., Coffman, D., Shan, Y., and Wang, S.: The slowdown in China's carbon emissions growth in the new phase of economic development, One Earth, 1, 240–253, https://doi.org/10.1016/j.oneear.2019.10.007, 2019.
Zhou, Y., Jiao, Y. F., Lang, J. L., Chen, D. S., Huang, C., Wei, P., Li, S. Y., and Cheng, S. Y.: Improved estimation of air pollutant emissions from landing and takeoff cycles of civil aircraft in China, Environ. Pollut., 249, 463–471, https://doi.org/10.1016/j.envpol.2019.03.088, 2019.