the Creative Commons Attribution 4.0 License.
the Creative Commons Attribution 4.0 License.
 | 23 Sep 2022
New contributions of measurements in Europe to the global inventory of the stable isotopic composition of methane
Carina van der Veen
Dave Lowry
Julianne M. Fernandez
Semra Bakkaloglu
James L. France
Rebecca E. Fisher
Hossein Maazallahi
Mila Stanisavljević
Jarosław Nęcki
Katarina Vinkovic
Patryk Łakomiec
Janne Rinne
Piotr Korbeń
Martina Schmidt
Sara Defratyka
Camille Yver-Kwok
Truls Andersen
Huilin Chen
Thomas Röckmann
Recent climate change mitigation strategies rely on the reduction of methane (CH4) emissions. Carbon and hydrogen isotope ratio (δ13C and δ2H) measurements can be used to distinguish sources and thus to understand the CH4 budget better. The CH4 emission estimates by models are sensitive to the isotopic signatures assigned to each source category, so it is important to provide representative estimates of the different CH4 source isotopic signatures worldwide.
We present new measurements of isotope signatures of various, mainly anthropogenic, CH4 sources in Europe, which represent a substantial contribution to the global dataset of source isotopic measurements from the literature, especially for δ2H. They improve the definition of δ13C from waste sources, and demonstrate the use of δ2H for fossil fuel source attribution.
We combined our new measurements with the last published database of CH4 isotopic signatures and with additional literature, and present a new global database. We found that microbial sources are generally well characterised. The large variability in fossil fuel isotopic compositions requires particular care in the choice of weighting criteria for the calculation of a representative global value. The global dataset could be further improved by measurements from African, South American, and Asian countries, and more measurements from pyrogenic sources.
We improved the source characterisation of CH4 emissions using stable isotopes and associated uncertainty, to be used in top-down studies. We emphasise that an appropriate use of the database requires the analysis of specific parameters in relation to source type and the region of interest.
The final version of the European CH4 isotope database coupled with a global inventory of fossil and non-fossil δ13C and δ2H source signature measurements is available at https://doi.org/10.24416/UU01-YP43IN (Menoud et al., 2022a).
- Article
(3524 KB) - Full-text XML
- BibTeX
- EndNote


The current change of the Earth's climate is mainly caused by the emissions of greenhouse gases from anthropogenic activities (IPCC, 2013; IPCC 2021, 2021a). Methane (CH4) is a strong greenhouse gas, with a global warming potential 32 times that of CO2 over 100 years (Etminan et al., 2016). The increase in CH4 concentration has contributed to an average warming of 0.5 ∘C in 2010–2019 compared to 1850–1900, which is slightly smaller than the contribution of CO2 (IPCC 2021, 2021b). The global CH4 mole fraction (χ(CH4)) in the atmosphere has drastically increased since 1984, when direct regular measurements started, changing from 1645 to 1850 ppb in 2017 (Nisbet et al., 2019). Compared to pre-industrial times (before 1750), the global χ(CH4) has increased by 160 %, from 720 to 1850 ppb (IPCC 2021, 2021a).
In the past 30 years, we have not observed a steady growth of atmospheric CH4 mole fraction. Instead the increase in χ(CH4) levelled off between 2000 and 2007, and has been increasing again since then, from 2014 at the highest rate since the 1980s (Nisbet et al., 2019). This renewed increase presents a significant threat to reaching the goals of the Paris agreement, and mitigation policies are now also targeting CH4 emissions (Shindell et al., 2017; Mayfield et al., 2017; Nisbet et al., 2020). Efficient strategies require good knowledge of the different kinds of CH4 sources, their location, and relative contributions. While emission estimates are reported at a country level using statistical methods, atmospheric inversions, based on observations, can be used to verify the inventories (Houweling et al., 2000; Zavala-Araiza et al., 2015; Henne et al., 2016; Maasakkers et al., 2019). But the results from two approaches, respectively called bottom-up and top-down, are not in full agreement, reflecting a lack in our understanding of the CH4 cycle (Etiope and Schwietzke, 2019; Saunois et al., 2020; Stavert et al., 2021).
Measurements of CH4 isotopologues provide additional constraints on the relative contribution of the various source categories, because CH4 isotopic composition depends on the formation processes (Schoell, 1980; Whiticar, 1999; Quay et al., 1999). Time series of ambient CH4 isotopic ratios are already used to derive emission scenarios in global models (e.g. Bousquet et al., 2006; Schaefer et al., 2016; Turner et al., 2017; Thompson et al., 2018; Fujita et al., 2020; Lan et al., 2021), and at the regional scale (Röckmann et al., 2016; Stieger et al., 2019; Menoud et al., 2020c, 2021; Varga et al., 2021). In addition, isotope measurements have proven to be very successful for source attribution in cities (Phillips et al., 2013; Zazzeri et al., 2017; Maazallahi et al., 2020; Xueref-Remy et al., 2020; Defratyka et al., 2021; Fernandez et al., 2022), and larger regions (Tarasova et al., 2006; Fisher et al., 2011; Beck et al., 2012; Warwick et al., 2016; Fisher et al., 2017; Lu et al., 2021). The uncertainties in the resulting emission rates of the different source categories depend on our knowledge of the different isotopic source signatures, and understanding of their variability (Rigby et al., 2012; Schwietzke et al., 2016; McNorton et al., 2018; Szénási, 2020).
Direct measurements of the isotopic signature of CH4 sources allow us to precisely characterise the type of emission, and a lot of data are available in the literature. Several review articles on CH4 isotopic source signatures were previously published (Rice and Claypool, 1981; Cicerone and Oremland, 1988; Bréas et al., 2001). The most recent one presented by Sherwood et al. (2017), and recently updated in Sherwood et al. (2021), gathered values from 13 489 locations (10 778 fossil fuel, 2711 non-fossil) from 347 published references. The 2017 study focused on (fugitive) fossil fuel sources, and allowed to re-evaluate the global δ13C value assigned to this emission category towards more depleted values (Schwietzke et al., 2016). A disadvantage of this database is that it is rather US-centred, and that the dataset is strongest for fossil fuel sources, but less robust for non-fossil sources. Therefore the database can be completed by more studies, especially concerning non-fossil sources.
The MEMO2 project (MEthane goes MObile – MEasurements and MOdelling) was a H2020 MSCA European Training Network1 with the goal to use innovative mobile measurement and modelling tools to improve the quantification of CH4 emissions in Europe (Walter et al., 2019). An important component of MEMO2 was the isotopic characterisation of CH4 sources. Two laboratories involved in MEMO2, at Utrecht University, the Netherlands and at the Royal Holloway University of London, UK, carried out a large number of high-precision measurements with isotope ratio mass spectrometry (IRMS). Another method, using cavity ring-down spectroscopy (CRDS) was developed for the mobile measurements of ambient CH4 isotopic composition. Several research groups were involved in field work with mobile measurements that targeted specific sources or environments in several European countries. Using this network, air samples from numerous CH4 sources could be measured for isotopic composition. The resulting isotopic source signatures were gathered in a publicly available database, with the first version made accessible on 1 October 2020 (Menoud et al., 2020a), and described in a publicly available report (Menoud et al., 2020b). The European data were used in several publications over the past two years by Menoud et al. (2020c, 2021, 2022b), Maazallahi et al. (2020), Defratyka et al. (2021), Bakkaloglu et al. (2021), Fernandez et al. (2022), Bakkaloglu et al. (2022). These studies emphasised the benefits from regional estimates of source CH4 isotopic composition. The last update of the MEMO2 isotopic data was compiled into the European methane isotope database (EMID).
The present study provides an in-depth analysis of the EMID, a comparison with the global data, and the implications for the global understanding of CH4 source isotopic composition. To this purpose, we compiled all the CH4 isotopic source signatures from MEMO2 with the latest version of the Sherwood et al. (2017, 2021) global database. We also searched the literature for more measured CH4 source signatures to add to the dataset.
2.1 Measurements within the MEMO2 project
2.1.1 Sampling
The data were collected by the research teams of eight universities and research institutes: Utrecht University (UU), the Royal Holloway University of London (RHUL), the Laboratoire des Sciences du Climat et de l'Environnement (LSCE), Heidelberg University (UHEI), AGH University of Science and Technology (AGH), Lund University (LU), the University of Groningen (UG), and the Netherlands Organisation for Applied Scientific Research (TNO). They participated in several campaigns in the Netherlands, the United Kingdom, France, Germany, Poland, Sweden, Romania, and Turkey. Several other teams collaborated in two intensive campaigns: the CoMet2 campaign in the Upper Silesian Coal Basin (USCB) in Poland (Fiehn et al., 2020; Gałkowski et al., 2021), and the ROMEO campaign in Romania3 (Röckmann, 2020). The samples were collected mostly between 2017 and 2020, but three locations in the UK were sampled in February 2015, September, and October 2016.
Different sampling methods were used:
-
Mobile sampling on road vehicles, using a fast (0.1 to 10 Hz) analyser on board to detect CH4 enhancements (G2301, G2201-i, and G4302, Picarro Inc., USA; MGGA-918 and UGGA, Los Gatos Research, ABB, USA; LI-7810 Trace Gas analyser, LI-COR, USA; Dual Laser Trace Gas Monitor, Aerodyne Research, USA). Different setups were used by different teams with one or two of these instrument on board, but the sampling procedure was the same. The samples were taken using a small electric pump connected to an inlet outside of the vehicle. The sample receptacles were bags of 1 to 3 L (Supel™-Inert Multi-Layer Foil bags, Sigma-Aldrich Co. LLC, USA; Tedlar or FlexFoil sample bags, SKC Inc., USA). Surveys were made around known sources of CH4, where we sampled the elevated mole fractions and background CH4 on the same day. If it was not practical to approach a source with the vehicle during mobile surveys, samples were taken on foot.
-
Mobile sampling onboard of an aircraft, during the ROMEO campaign. A CRDS instrument (G4302, Picarro Inc., USA) was installed in the aircraft, and samples were taken from the outflow of the instrument into bags of 2 L (Supel™-Inert Multi-Layer Foil bags, Sigma-Aldrich Co. LLC, USA) when an increase in CH4 mole fractions was observed. The method is described in detail in Menoud et al. (2022b).
-
Mobile sampling on foot, without analyser. The samples were taken at regularly spread locations around a known CH4 source, to make sure we collected air with CH4 from the emission plume and background. In this case, the sample receptacles were bags of 2 to 3 L (Supel™-Inert Multi-Layer Foil bags, Sigma-Aldrich Co. LLC, USA; Tedlar sample bags, SKC Inc., USA), filled with a portable hand pump.
-
Soil chambers on wetlands in north Sweden and coal waste disposal areas in Poland. In wetlands, we installed transparent Plexiglas chambers on top of stainless steel collars that were pushed 20 cm into the peat. Samples from the chambers were taken during closure times, when χ(CH4) increased, generally after 10 to 25 min. The soil chambers in Poland were made of plastic buckets covered with aluminium foil that were pushed about 5 cm in the ground and left for 30 min. In both cases, air was pumped into 2 L sample bags (Supel™-Inert Multi-Layer Foil, Sigma-Aldrich Co. LLC, USA) for further analysis in the lab.
-
From an unmanned aerial vehicle (UAV), carrying an AirCore (coiled tubing) system to collect air samples (Andersen et al., 2018). The air samples were continuously pulled into the AirCore while flying transects across the plume of a CH4 emission source, and were transferred to a 0.5 or 1 L bag sample after landing (Supel™-Inert Multi-Layer Foil, Sigma-Aldrich Co. LLC, USA) for further analysis in the laboratory.
2.1.2 Measurements of isotopic composition
The mass spectrometry measurements were performed at two laboratories: the IMAU (Institute for Marine and Atmospheric research Utrecht) at UU, and at the Department of Earth Sciences at RHUL. Both laboratories use a CF–IRMS (continuous flow isotopic ratio mass spectrometry) system to measure δ13C, and also δ2H at IMAU. The system at IMAU was described by Röckmann et al. (2016) and the one at RHUL by Fisher et al. (2006). The reproducibility both groups can achieve is of 0.05 ‰ to 0.1 ‰ for δ13C. At IMAU, δ2H measurements have a reproducibility lower than 2 ‰. For consistency of the results, the two laboratories measured a set of five cylinders that contained air with CH4 of different isotopic composition. The resulting differences in δ13C for each cylinder ranged between 0.02 ‰ and 0.04 ‰. They were within the analytical error reported by the two laboratories, so that the isotopic results obtained within the MEMO2 project are consistent across the laboratories. The inter-comparison exercise is presented in detail in a MEMO2 deliverable report, and publicly available (Lowry et al., 2018).
The UHEI and LSCE groups performed isotopic measurements using CRDS instruments (G2201-i, Picarro inc., USA). Their measurement and calibration methods are described in Hoheisel et al. (2019) and Defratyka et al. (2021).
In the database, the method of isotopic measurements is specified by the “measurement type” parameter, as either “IRMS” or “CRDS”. The laboratory where the measurements were performed is specified in the column “measurement lab”.
2.1.3 Reported variables
The analytical parameters reported in the database are δ13C and δ2H, which are defined as
with for X=13C or for X=2H.
δ values are reported in per mille (‰), relative to the international standard materials Vienna Peedee Belemnite (VPDB) for δ13C, and Vienna Standard Mean Ocean Water (VSMOW) for δ2H.
2.1.4 Calculation of isotopic signatures
The measurement results of δ13C and δ2H of CH4 are for ambient air, and not the sources themselves. There are different methods to derive the isotopic source signatures from the sampled CH4 enhancement signatures; the Keeling plot and Miller–Tans methods are commonly used mass balance approaches. The Keeling plot method is based on the assumption that the background is stable during the sampling period (Keeling, 1961; Pataki et al., 2003). The Miller–Tans method is also applicable when the condition of a stable background is not fulfilled (Miller and Tans, 2003). Because background samples were taken on each survey day and in the same region, the condition of stable background was usually fulfilled. Defratyka (2021) showed that in this case, both methods lead to similar results within their uncertainty.
Both methods involve a linear regression model to fit the observed data. Different models were used: ordinary least squares (OLS) minimising the difference in the y axis coordinate, bivariate correlated errors and intrinsic scatter (BCES) (Akritas and Bershady, 1996), and orthogonal distance regression (ODR) (Boggs and Rogers, 1990). Zobitz et al. (2006) compared different regression methods to be applied in Keeling plots. The ODR method can induce a bias towards lower values, in the case the data points cover a relatively small range on the x axis. Therefore, the OLS and BCES methods were usually preferred to calculate the source signatures for this study.
All the mass balance and regression methods are statistically valid. We did not work towards a uniform procedure, to not modify the data that were processed by each lab. The different approaches are specified for each entry of the database by the parameters “mass balance approach” and “regression method”.
2.2 Revision of the global database of CH4 isotope ratios
2.2.1 Structure of the database to include previous and new measurements
We used the same parameters as in the database of Sherwood et al. (2017, 2021) for non-fossil data. That is because our objectives concern only values for δ13C and δ2H of emitted CH4, and do not include measurements of other gases or isotope signatures that Sherwood et al. (2017) reported in the fossil fuel database. The variables of interest are listed in Table 1 and include the site description (country, region, group, category, and sub-category), and the δ13C and δ2H of CH4. There are two types of values:
-
Single measurement values, as from the characterisation of one emission event. Most fossil fuel data from Sherwood et al. (2021) are single measurements, and the entries in the EMID.
-
Average values from repeated measurements at the same location or over time. The values found in the literature are usually averages of multiple measurements.
A direct comparison between these two types of values would be unbalanced and lead to the over-representation of single measurements. Therefore, to combine the different kinds of data and perform statistical analyses, we aggregated the sources reported in the EMID by region and sub-category, and in the fossil fuel database of Sherwood et al. (2021) per production basin. Throughout the article, the aggregated values are referred to as data locations, to distinguish them from measurements values which refer to the single events.
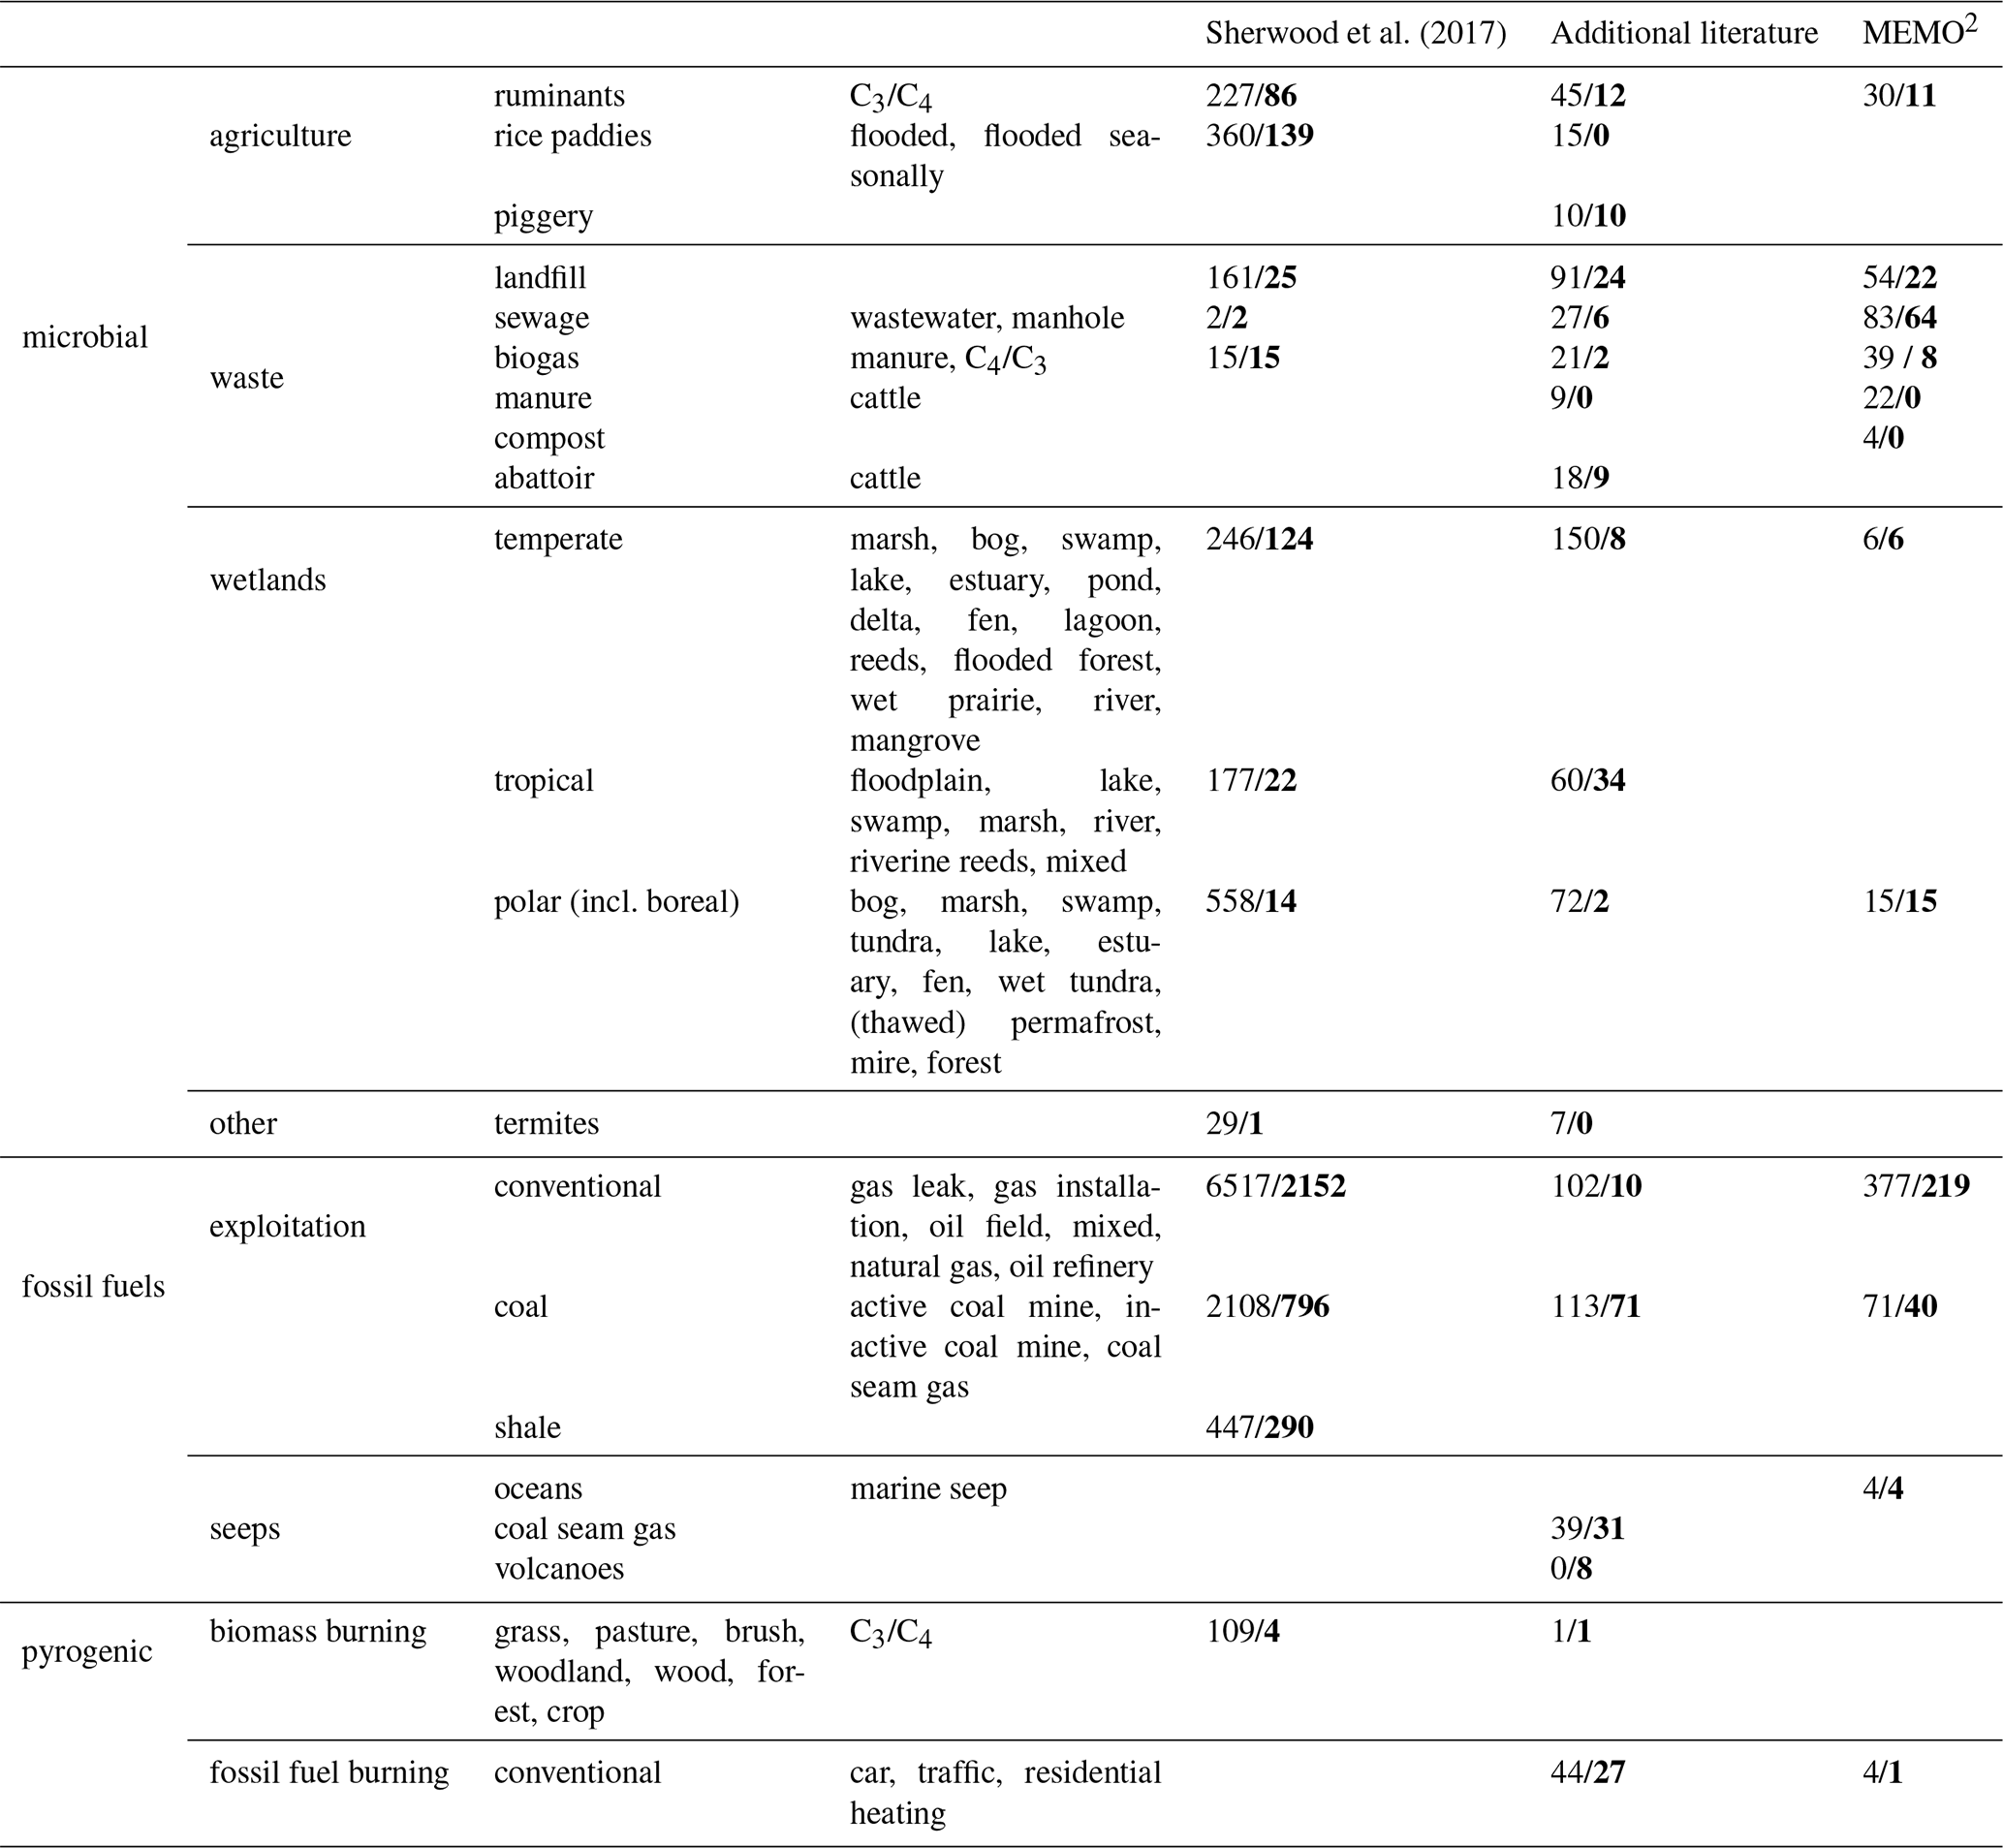
The source categories and sub-categories from Sherwood et al. (2017, 2021) were kept as they were, but when the new entries from MEMO2 measurements and published literature required it, we added additional source categories or sub-categories. The categories are grouped into the three main CH4 formation pathways: modern microbial, pyrogenic, and fossil fuels. The “modern microbial” CH4 is formed by microorganisms in surface ecosystems or in animals through enteric fermentation, and is referred to simply as “microbial” throughout the paper. Microbial CH4 formation in the subsurface related to petroleum systems belongs to the “fossil fuels” category. Compared to Sherwood et al. (2017, 2021), we extended the “biomass burning” category to “pyrogenic” to include emissions from other combustion sources, such as traffic or industry. All categories and sub-categories are listed in Table 2.
Sherwood et al. (2021)Table 1Variables reported in the CH4 isotopic signature database published with this article, which combines three datasets of different origins.

∗ Selected Nomenclature for Air Pollution, https://en.eustat.eus/documentos/elem_13173/definicion.html (last access: 24 March 2022)
Table 2Number of measurements (δ13C/δ2H) per source category in the updated CH4 isotopic signature database.
2.2.2 Data from previously published literature
We found an additional number of 48 sources (Kiyosu, 1983; Chanton et al., 1989, 1992; Lansdown, 1992; Wassmann et al., 1992; Gerard and Chanton, 1993; Levin et al., 1993; Sugimoto and Wada, 1993; Happell et al., 1994; Bergmaschi and Harris, 1995; Happell et al., 1995; Chanton and Whiting, 1996; Sugimoto et al., 1998; Bilek et al., 1999; Levin et al., 1999; Popp et al., 1999; Chanton et al., 2000; Chasar et al., 2000; Smith et al., 2000; Lowry et al., 2001; Chanton et al., 2002; Nakagawa et al., 2005; Bowes and Hornibrook, 2006; Sugimoto and Fujita, 2006; Hornibrook and Bowes, 2007; Galand et al., 2010; Toyoda et al., 2011; Umezawa et al., 2011; Beck et al., 2012; Townsend-Small et al., 2012; Golding et al., 2013; Phillips et al., 2013; Baublys et al., 2015; Day et al., 2015; Iverach et al., 2015; Maher et al., 2015; Rella et al., 2015; Zazzeri et al., 2015; Owen et al., 2016; Zazzeri et al., 2016; Lopez et al., 2017; Obersky et al., 2018; Hoheisel et al., 2019; Lowry et al., 2020; Xueref-Remy et al., 2020; France et al., 2022; Lu et al., 2021; Al-Shalan et al., 2022) in the literature to complete the referred data listed in Sherwood et al. (2021). Because we aim at reflecting the actual CH4 surface emissions to the atmosphere, we excluded studies that reported results from laboratory experiments, and of CH4 dissolved in water (i.e. in oceans, wetlands, and inland waters). We note that the search for data was biased because of the use of English language. The references we added concern published peer-reviewed articles, and to a lesser extent thesis and conference papers. We did not perform additional data quality assessment. The studies were performed from 1982 to 2021 in various laboratories in the world. The study locations do not overlap with the ones of the EMID or the literature gathered in Sherwood et al. (2021), and we do not provide an analysis of potential temporal changes in the isotopic composition of the same source.
The data on isotopic source signatures from the measurement campaigns carried out within the MEMO2 project (2017–2020) were compiled into the EMID. The final version of this database is combined with the global database and additional literature, and is available at https://doi.org/10.24416/UU01-YP43IN (Menoud et al., 2022a).
3.1 The European methane isotope database (EMID)
The isotopic signatures obtained within the MEMO2 project concern 734 locations over eight countries, with δ2H source signatures being measured at 54 % of the sites (Table 3). Measurements of δ2H are less numerous than of δ13C because only the measurement system at IMAU was able to measure this isotope signature. Depending on the availability of the measurement system, the sampling location, and the timing of the campaign, it was not possible to systematically measure all samples at IMAU. Figure 1 shows the geographical distribution of the sampled sites in the different countries, according to the type of source. The number of sources we sampled does not represent the emission magnitudes.
During mobile surveys, we mostly targeted anthropogenic emissions from the exploitation and use of fossil fuels and waste processing facilities (Fig. 1). These are the most obvious anthropogenic CH4 sources in densely populated regions, and we acknowledge a deliberate sampling bias towards urbanised areas. No biomass burning emissions were characterised during the MEMO2 project. The EMID partially addresses the geographical bias pointed out by Sherwood et al. (2017): it particularly includes a large number of measurements made in Romania, where almost no data were available before.
Table 3Number of CH4 isotopic source signatures derived from sample measurements in the EMID.
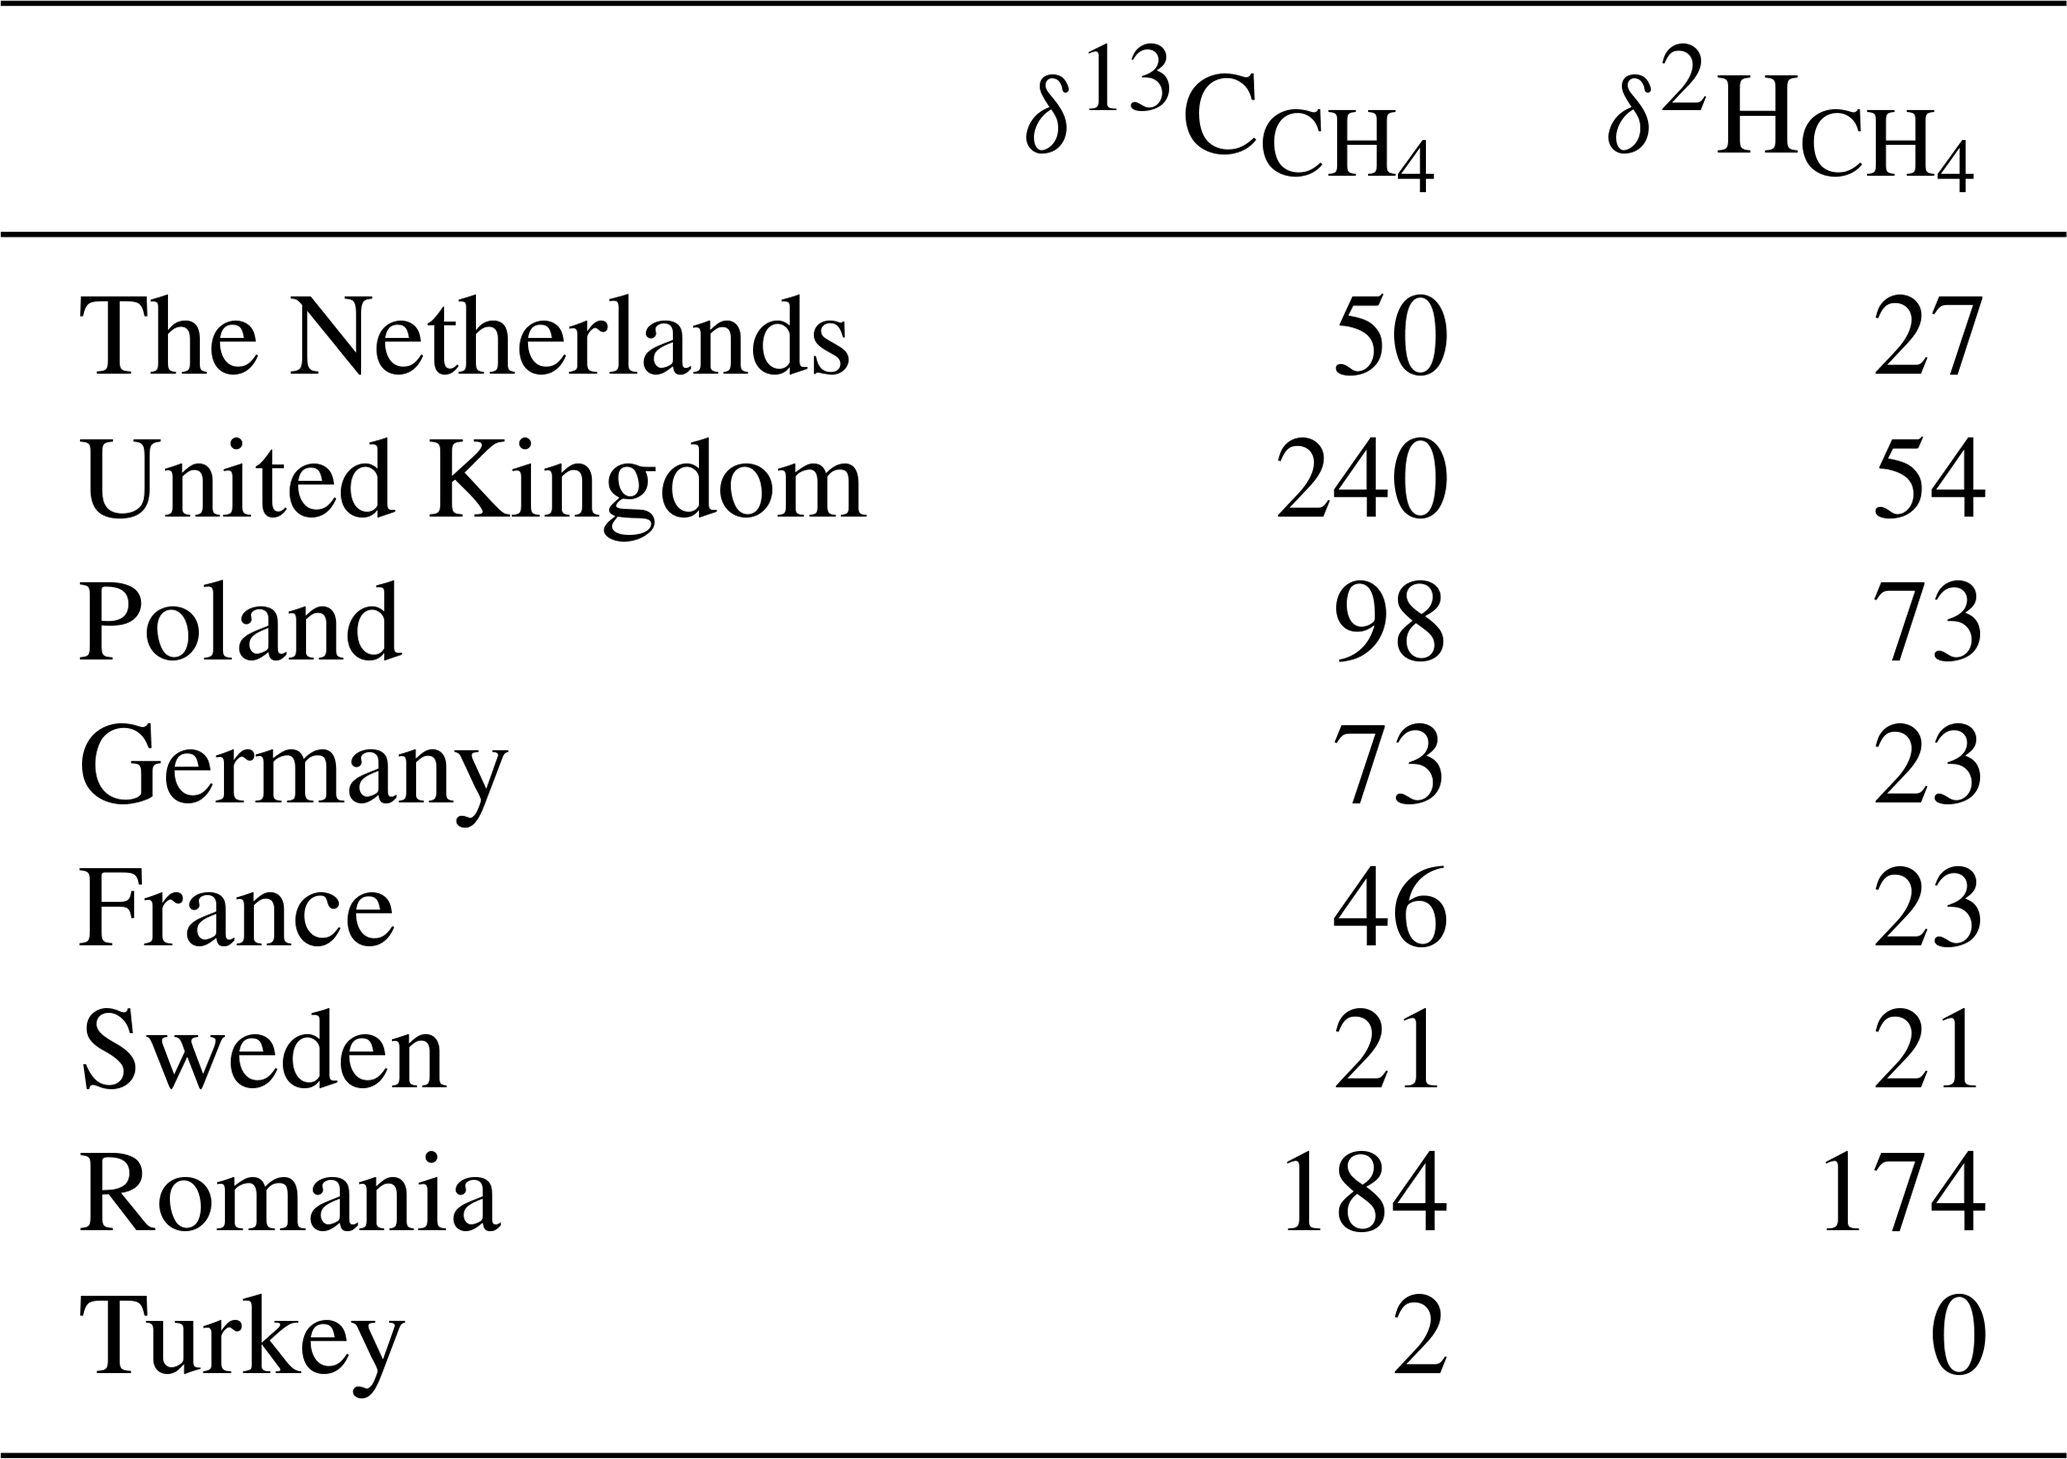
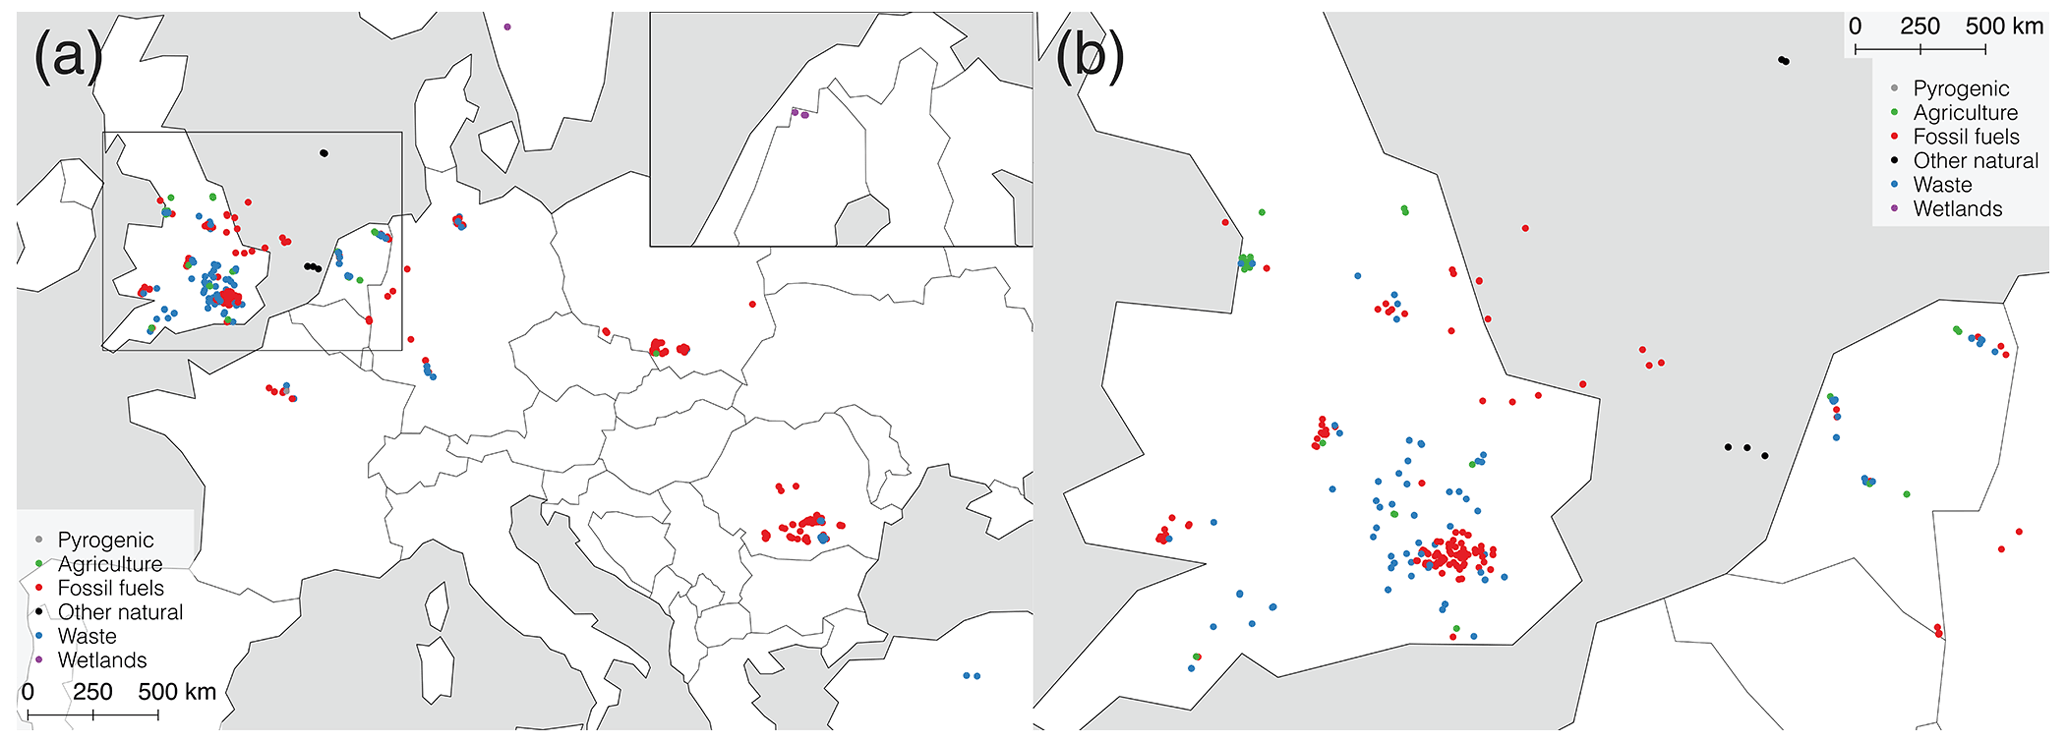
Figure 1Geographical distribution of isotopic signature measurements (δ13C and/or δ2H of CH4) carried out within the MEMO2 project (2017 to 2020), depending on the type of source. (a) All locations. (b) Only in the UK, the Netherlands, and Germany.
We characterised 376 locations by both δ13C and δ2H values, and we compared the results to ranges reported in the literature in Fig. 2. The fossil fuel sources partly overlap with the range of thermogenic CH4, but also spread towards lower δ13C or higher δ2H. This is due to the presence of natural gas of microbial origin in the coal reservoirs of Silesia, in Poland (Kotarba, 2001; Kotarba and Pluta, 2009; Menoud et al., 2021), and in Romania (Baciu et al., 2018; Fernandez et al., 2022; Menoud et al., 2022b). We concluded that this microbial CH4 originates from the CO2 reduction pathway as defined by Milkov and Etiope (2018), with relatively depleted δ13C ( ‰) and relatively enriched δ2H ( ‰). The δ2H measurements were in these cases particularly useful to distinguish fossil fuels from microbial sources (Menoud et al., 2021; Fernandez et al., 2022; Menoud et al., 2022b).
With an average δ13C of ‰ (n=202), the waste-related source signatures in the EMID generally have higher δ13C values compared to typical microbial fermentation CH4 (between −90 ‰ and −50 ‰; Milkov and Etiope, 2018). Waste sources measured in previous studies are less enriched, with an average of ‰ (n=56) in Sherwood et al. (2017). The average value in the EMID is strongly influenced by particularly enriched isotopic compositions in CH4 emitted from sewage water (range between −72.7 and −36.5, average of , n=88) and to a smaller extent from biogas plants (range between −64.4 ‰ and −45.5 ‰, n=54). A new study also reported surprisingly enriched δ13C (and δ2H) around a wastewater treatment plant in Australia: δ13C ‰ (Lu et al., 2021). Other recent studies in different regions of the world have also reported significantly higher δ13C from sewage plants compared to landfills (Hoheisel et al., 2019; Xueref-Remy et al., 2020; Al-Shalan et al., 2022). The δ13C of CH4 emitted from sewage treatment plants depends on process parameters: oxic conditions lead to more enriched signatures than anaerobic treatment (Toyoda et al., 2011). Regarding biogas facilities, Bakkaloglu et al. (2022) emphasised the link between the type of substrate and the emitted CH4 isotopic signatures: facilities that operate with C4 plant substrates emit CH4 with higher δ13C values in comparison with C3 plant substrates. Changes in waste management practices towards less disposal and more biogas production can likely explain the higher range of δ13C values found in recent studies (Bakkaloglu et al., 2021). Another driver for more or less enriched δ13C emissions from waste sources is isotopic fractionation when CH4 reacts or diffuses. Diffusion and oxidation in the soil layers when CH4 migrates from the deeper layers are secondary processes that cause isotopic fractionation (Bergamaschi et al., 1998; De Visscher, 2004; Conrad, 2005; Gebert and Streese-Kleeberg, 2017; Obersky et al., 2018; Bakkaloglu et al., 2021), which increases the range of possible isotopic signatures of the emitted CH4.
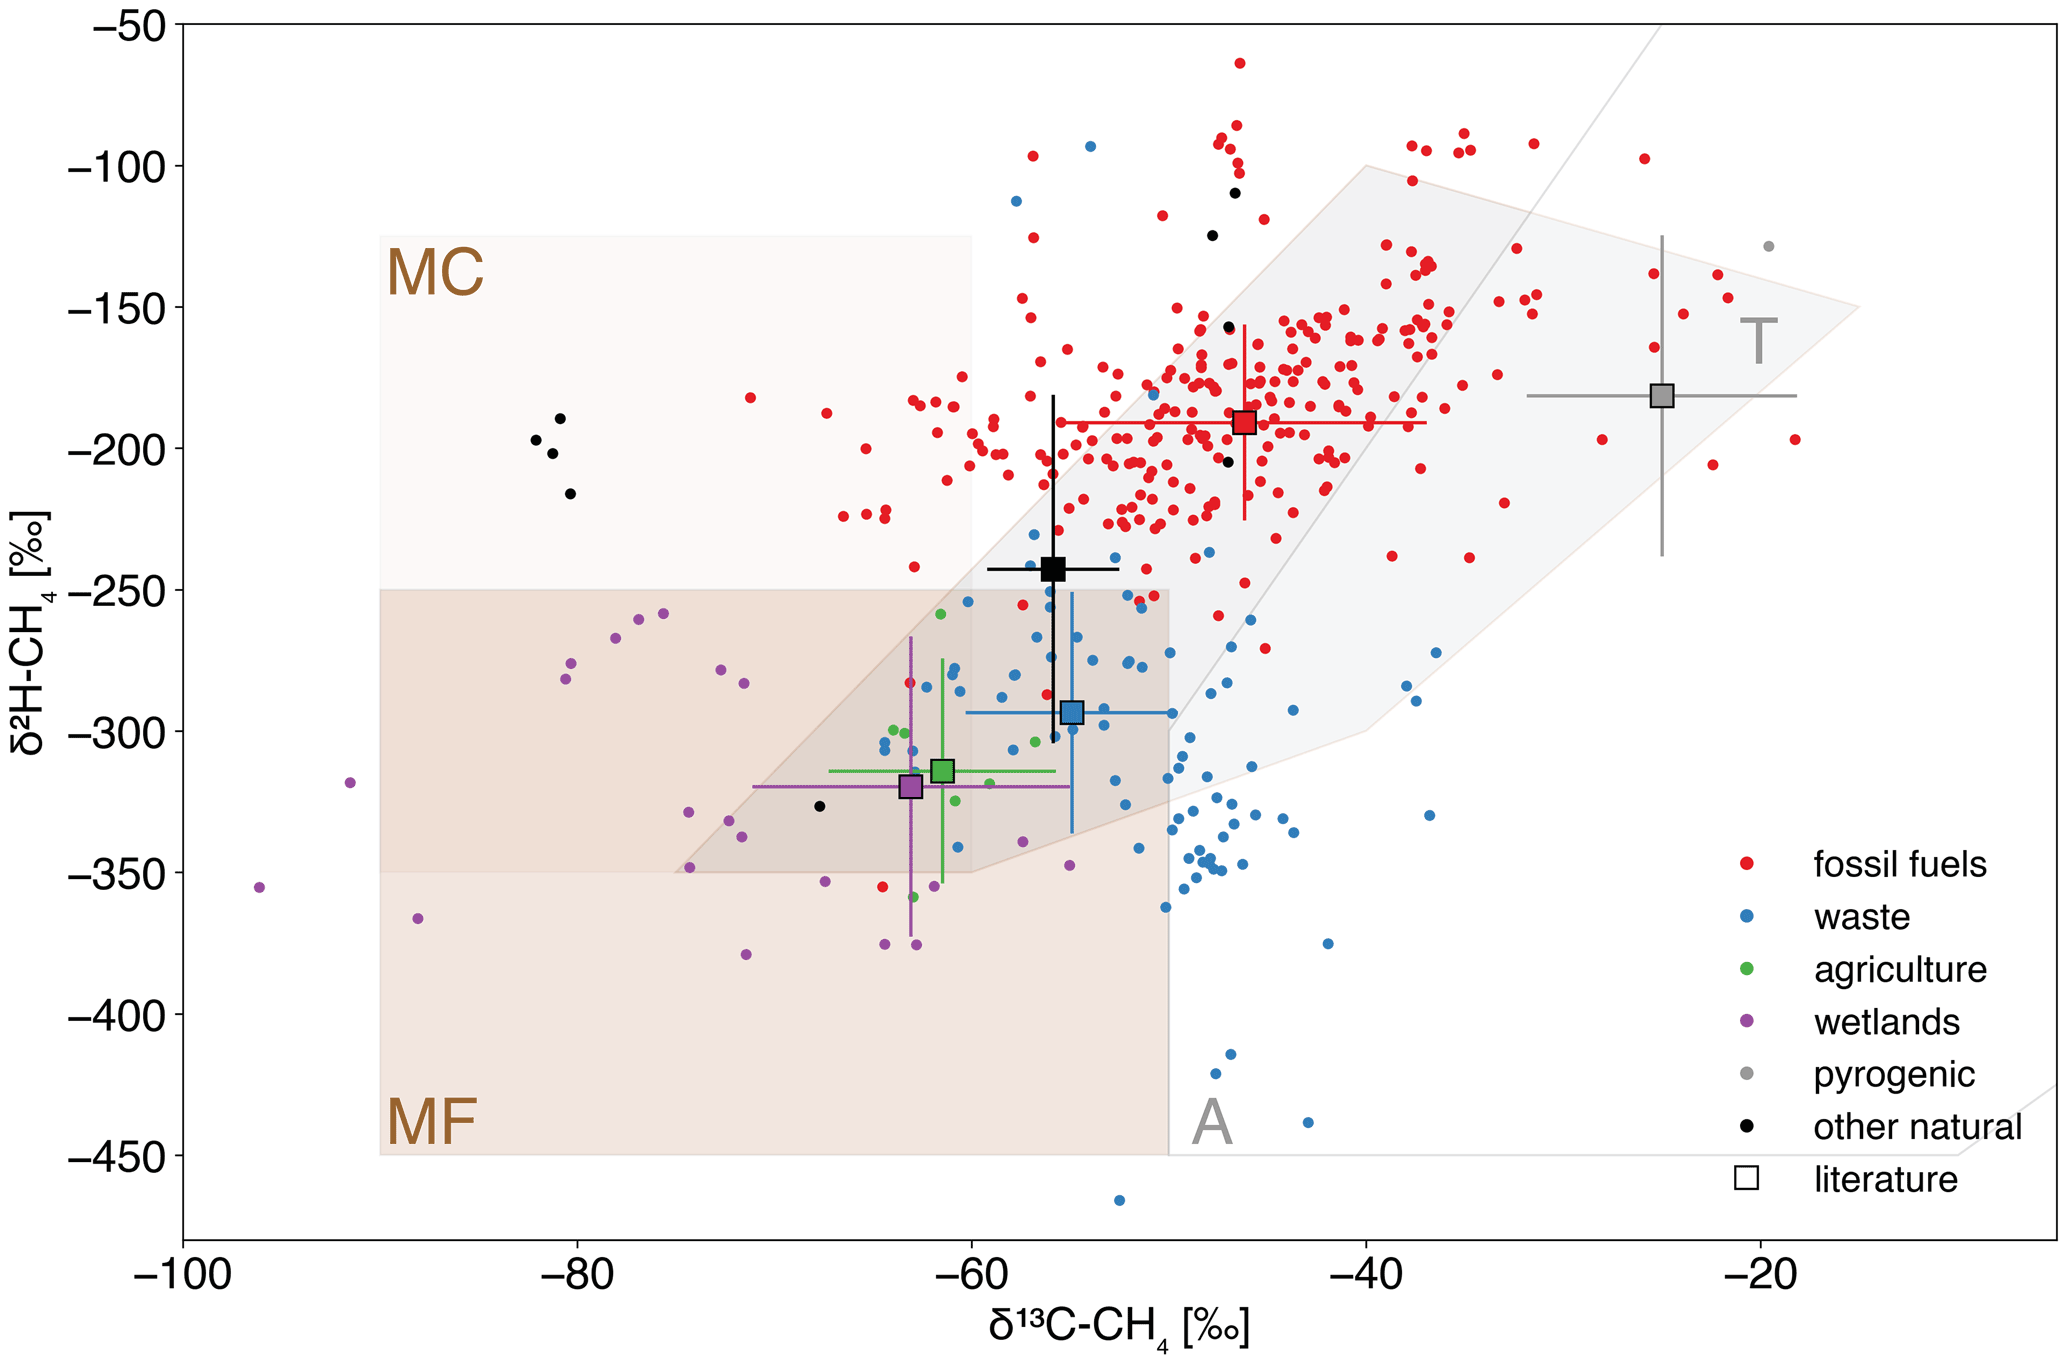
Figure 2Dual isotope plot presenting measurement results from the EMID (circles); the literature data for the same source categories, taken from Sherwood et al. (2017, 2021), and completed with the mean and standard deviation values from additional publications (squares with error bars); shaded areas represent the different methanogenesis pathways from Milkov and Etiope (2018): MF: microbial fermentation, MC: microbial CO2 reduction, T: thermogenic, A: abiotic.

Figure 3Measurement results of δ13C (top) and δ2H (bottom) in CH4 from the EMID. (a) CH4 fugitive emissions from the exploitation of fossil fuels (gas leaks, oil and gas extraction, and processing sites). (b) CH4 emissions from modern microbial fermentation sources (ruminants, landfills, sewage treatment plants, and biogas plants).
The maps in Fig. 3 emphasise the similarities between δ13C source signatures from modern microbial and fossil fuel sources in Poland and Romania. The average δ13C of fugitive emissions from fossil fuel extraction sites in Poland and Romania was ‰ (n=235), and of ‰ (n=42) for gas leaks and gas fields in Romania. From gas leaks in only the UK and the Netherlands, the average δ13C was ‰ (n=154), and ‰ (n=217) when including France and Germany, which reflect differences in the natural gas formation pathway compared to Poland and Romania. This distinction is also visible in the histograms of the EMID in Fig. 5a. In western Europe, δ13C allows for a good separation between microbial and fossil fuel sources, which is well-established in the literature (Levin et al., 1993; Lowry et al., 2001; Röckmann et al., 2016; Zazzeri et al., 2017; Lowry et al., 2020). Yet we show that only δ13C data are not sufficient to distinguish microbial and fossil fuel CH4 from all European regions. Fortunately, the δ2H source signatures allow for a clear distinction between fossil fuel and modern microbial emissions of anthropogenic origin (Figs. 3 and 5a).
Previous isotopic measurements in Europe generally focused on western European countries (Levin et al., 1993; Bergamaschi et al., 1998; Lowry et al., 2001; Röckmann et al., 2016; Zazzeri et al., 2017; Cain et al., 2017; Fisher et al., 2017; Lowry et al., 2020; Xueref-Remy et al., 2020; Defratyka et al., 2021). This geographical bias should be addressed by focusing on western Balkan countries (Croatia, Bosnia, and Serbia) because of coal extraction activities (EDGAR inventory4), and densely populated areas in southern European countries such as Italy.
3.2 New global database
3.2.1 Overview and representativeness
The extended global database including all literature data and the aggregated MEMO2 data consists of 13 313 and 4337 measurements of δ13C and δ2H, respectively, from 64 countries. The map in Fig. 4 shows the partitioning of the measurement data per country, and Table 2 the number of records per CH4 source. Table 4 contains statistics on the data from the EMID only, and the overall database including the EMID.
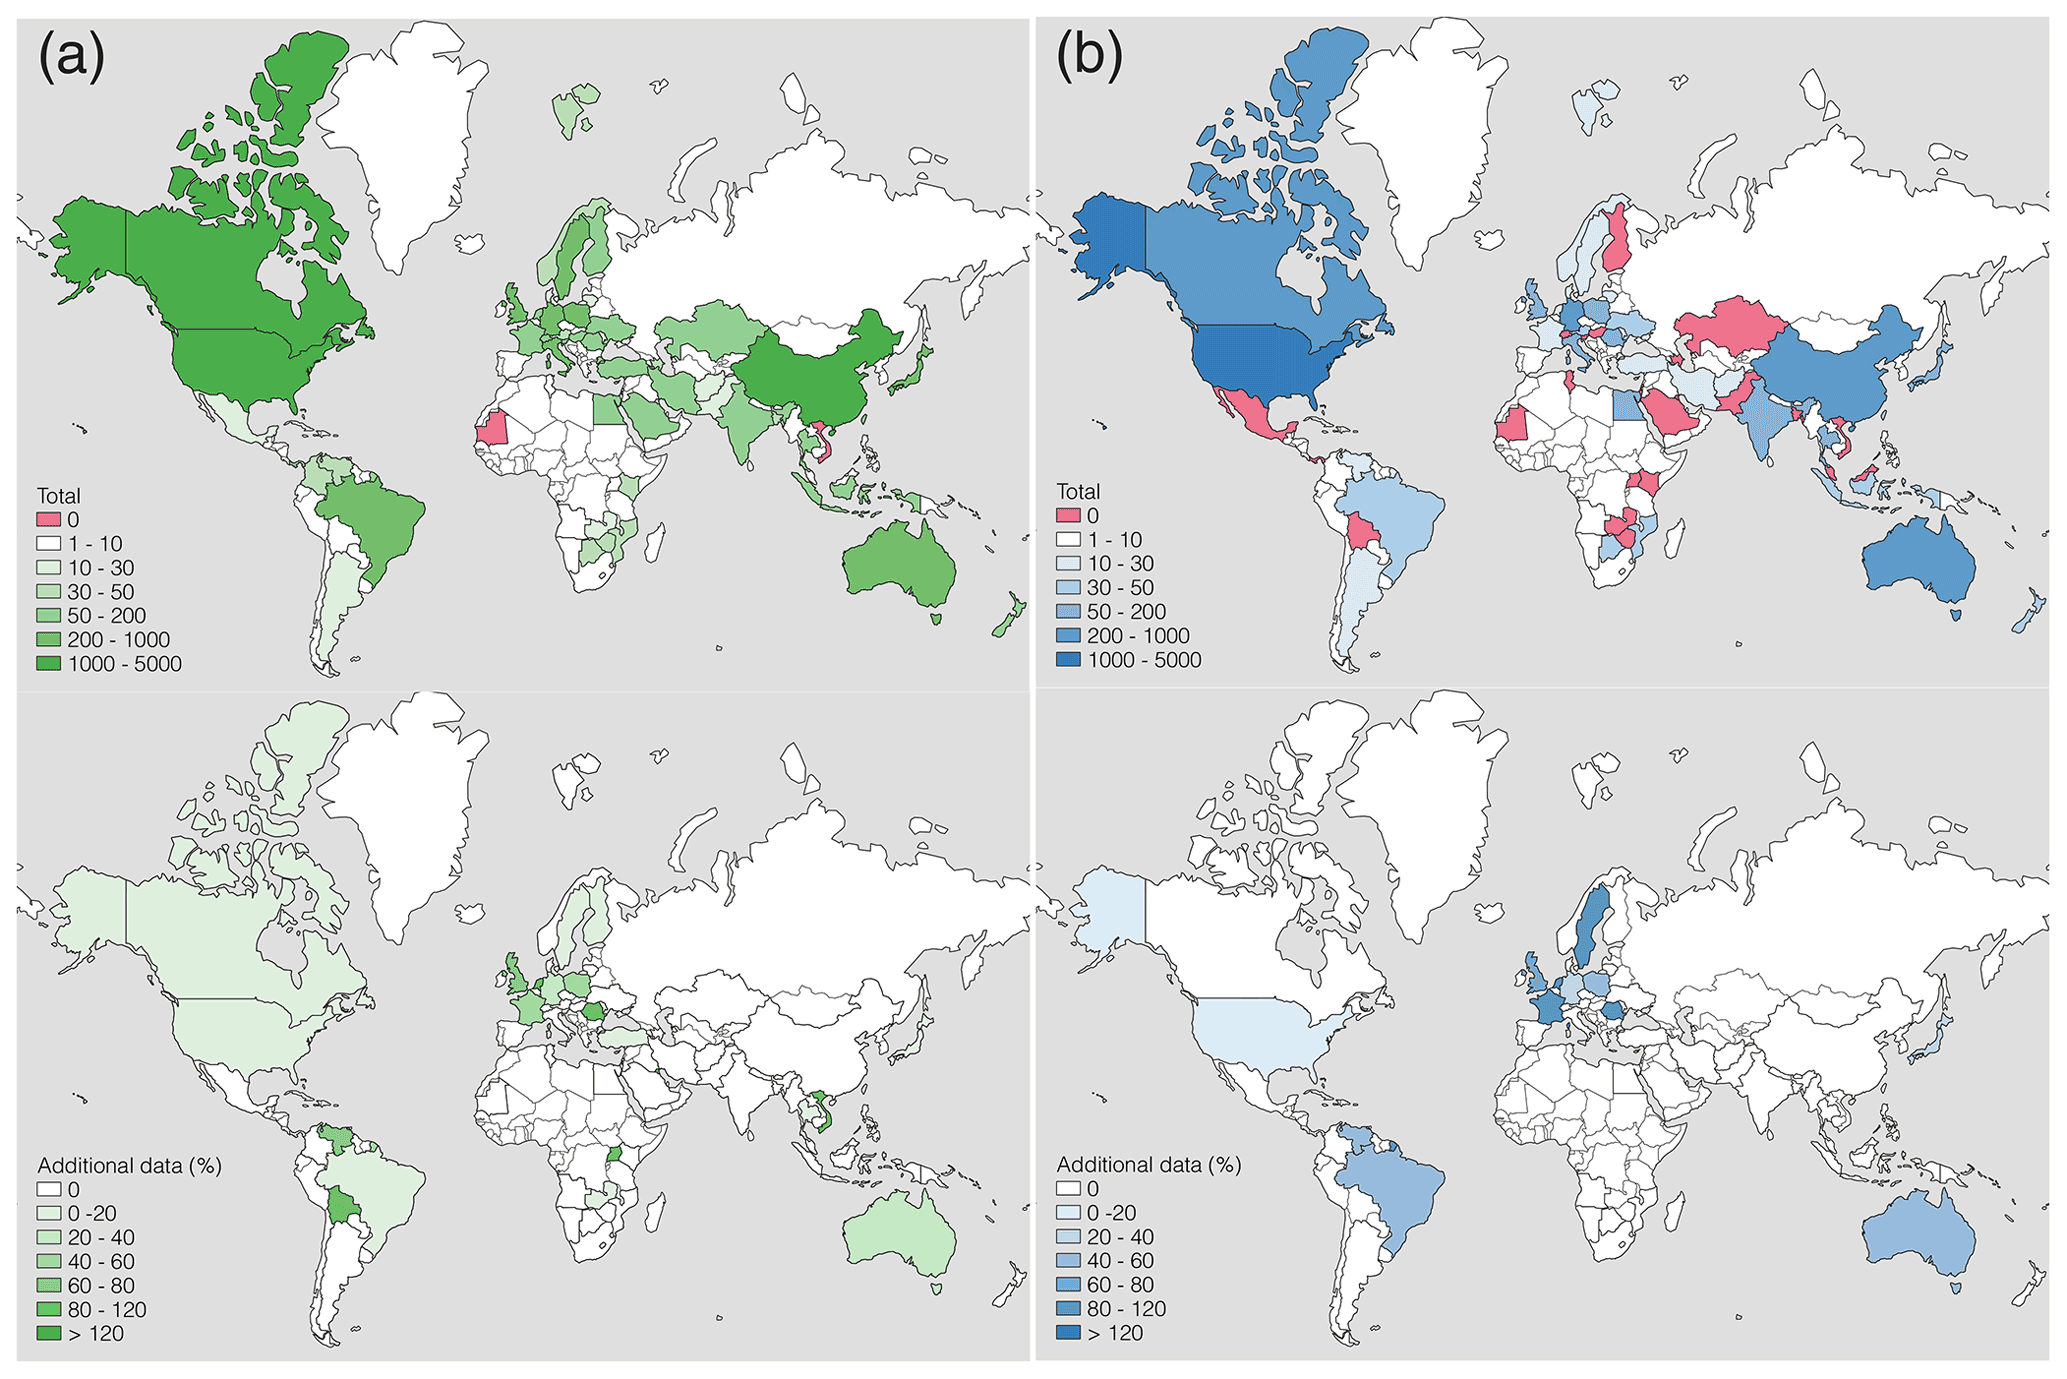
Figure 4Number of isotopic signature measurements, (a) δ13C and (b) δ2H of CH4, carried out in different countries. Top maps show the total numbers reported in the new global database. Bottom maps show the percentage of additional data brought by the EMID and the new published literature compared to Sherwood et al. (2017, 2021).
The number of measurements made in fossil fuel reservoirs and compiled in the database by Sherwood et al. (2021) is comparatively larger than from studies of other CH4 emission sources (Table 1), and the number of measurements is not evenly spread geographically: significantly more measurements were made in North American and European countries, Australia, Brazil, and Japan. In Russia and China, there were relatively more measurements as well, but only for fossil fuel sources. Despite including the first few measurements reported from Africa and the Middle East (France et al., 2022; Al-Shalan et al., 2022), the data distribution remains unbalanced. Nevertheless, specific isotope signatures dependencies can be further analysed for the different source categories.
Fossil fuels. Fugitive emissions from fossil fuel reservoirs are highly variable not only on a large scale, but also from one basin to another, or even within the same basin (Sherwood et al., 2017; Milkov and Etiope, 2018; Alvarez et al., 2018; Milkov et al., 2020a; Lan et al., 2021). Therefore, CH4 isotopic composition from one basin cannot simply be upscaled to a country scale. Any new isotopic measurement from a production basin with large fugitive CH4 emissions brings relevant information. The recent measurements made in Romania, included in the EMID, illustrate well this heterogeneity (Menoud et al., 2022b).
Sherwood et al. (2017) pointed out the lack of data for a list of conventional oil and gas and coal production countries, in Africa, the Middle East, central and southern Asia, and South America. Previous estimates of global CH4 isotopic signatures from the exploitation of fossil fuels weighted the source signatures from one basin by its fuel production (Schwietzke et al., 2016). Recent work suggests that fuel production is not a reliable proxy to estimate CH4 fugitive emissions (Zavala-Araiza et al., 2015; Alvarez et al., 2018; Rutherford et al., 2021; Chen et al., 2021; Maazallahi et al., 2022). Thus, the most relevant sampling locations would be ideally related to estimated emission rates from top-down measurements, instead of production or bottom-up emission estimates. Unfortunately, these data are lacking in many cases. Recently, particularly large CH4 emissions were detected in central Asia (Varon et al., 2019), or measured in Mexico (Zavala-Araiza et al., 2021). Besides the new measurements in Romania, the EMID and additional literature we added to the global isotope database does not address the geographical representation issue.
Modern microbial. The isotopic signatures of CH4 from modern microbial sources (mainly wetlands, ruminants, waste degradation, rice paddies, and termites) are largely dependent on environmental parameters such as the type of substrate and other ecosystem conditions. Figures A1 and A2 show that our new data confirm the trends previously observed: the δ13C sensitivity to C3 or C4 plants in ruminant diet (Rust, 1981; Levin et al., 1993; Klevenhusen et al., 2010; Brownlow et al., 2017), to wetland latitudes (δ13C depletion in polar regions because of less oxidation and the absence of C4 plants) (Fisher et al., 2017; Brownlow et al., 2017; Ganesan et al., 2018), and the δ2H dependency on δ2H of precipitation, and ultimately on the latitude (established for freshwater emissions) (Waldron et al., 1999; Chanton et al., 2006; Douglas et al., 2021; Stell et al., 2021). Based on the correlation with the plant metabolism (C3 or C4), δ13C from wetlands could be mapped on a global scale (Ganesan et al., 2018). Douglas et al. (2021) also suggested a spatial extrapolation of wetland δ2H using δ2H data, which can be interesting for under-sampled locations, for example in the Southern Hemisphere. However, a certain variability will always remain because of the influence of other parameters such as the dominant methanogenic pathway (acetate fermentation or CO2 reduction) (Waldron et al., 1998; De Visscher, 2004; Conrad, 2005; McCalley et al., 2014; Inglett et al., 2015; Chan et al., 2019; Douglas et al., 2021), or the δ13C composition of the organic matter substrate (Conrad et al., 2011; Ganesan et al., 2018).
Biomass burning. Similarly to microbial degradation, the product of biomass burning is influenced by the plant constituents. CH4 produced from the burning of C3 or C4 plants can be distinguished based on the δ13C values (e.g. Chanton et al., 2000; Brownlow et al., 2017). Higher δ13C signatures are measured when the burned plants are mostly C4 plants, and the δ13C is lower for C3 plants. This trend is clearly visible in the CH4 isotope dataset, and is shown in Fig. A3. The δ2H values are expected to depend on the δ2H of local precipitations (Snover et al., 2000; Röckmann et al., 2010), but more measurements are needed to support this hypothesis.
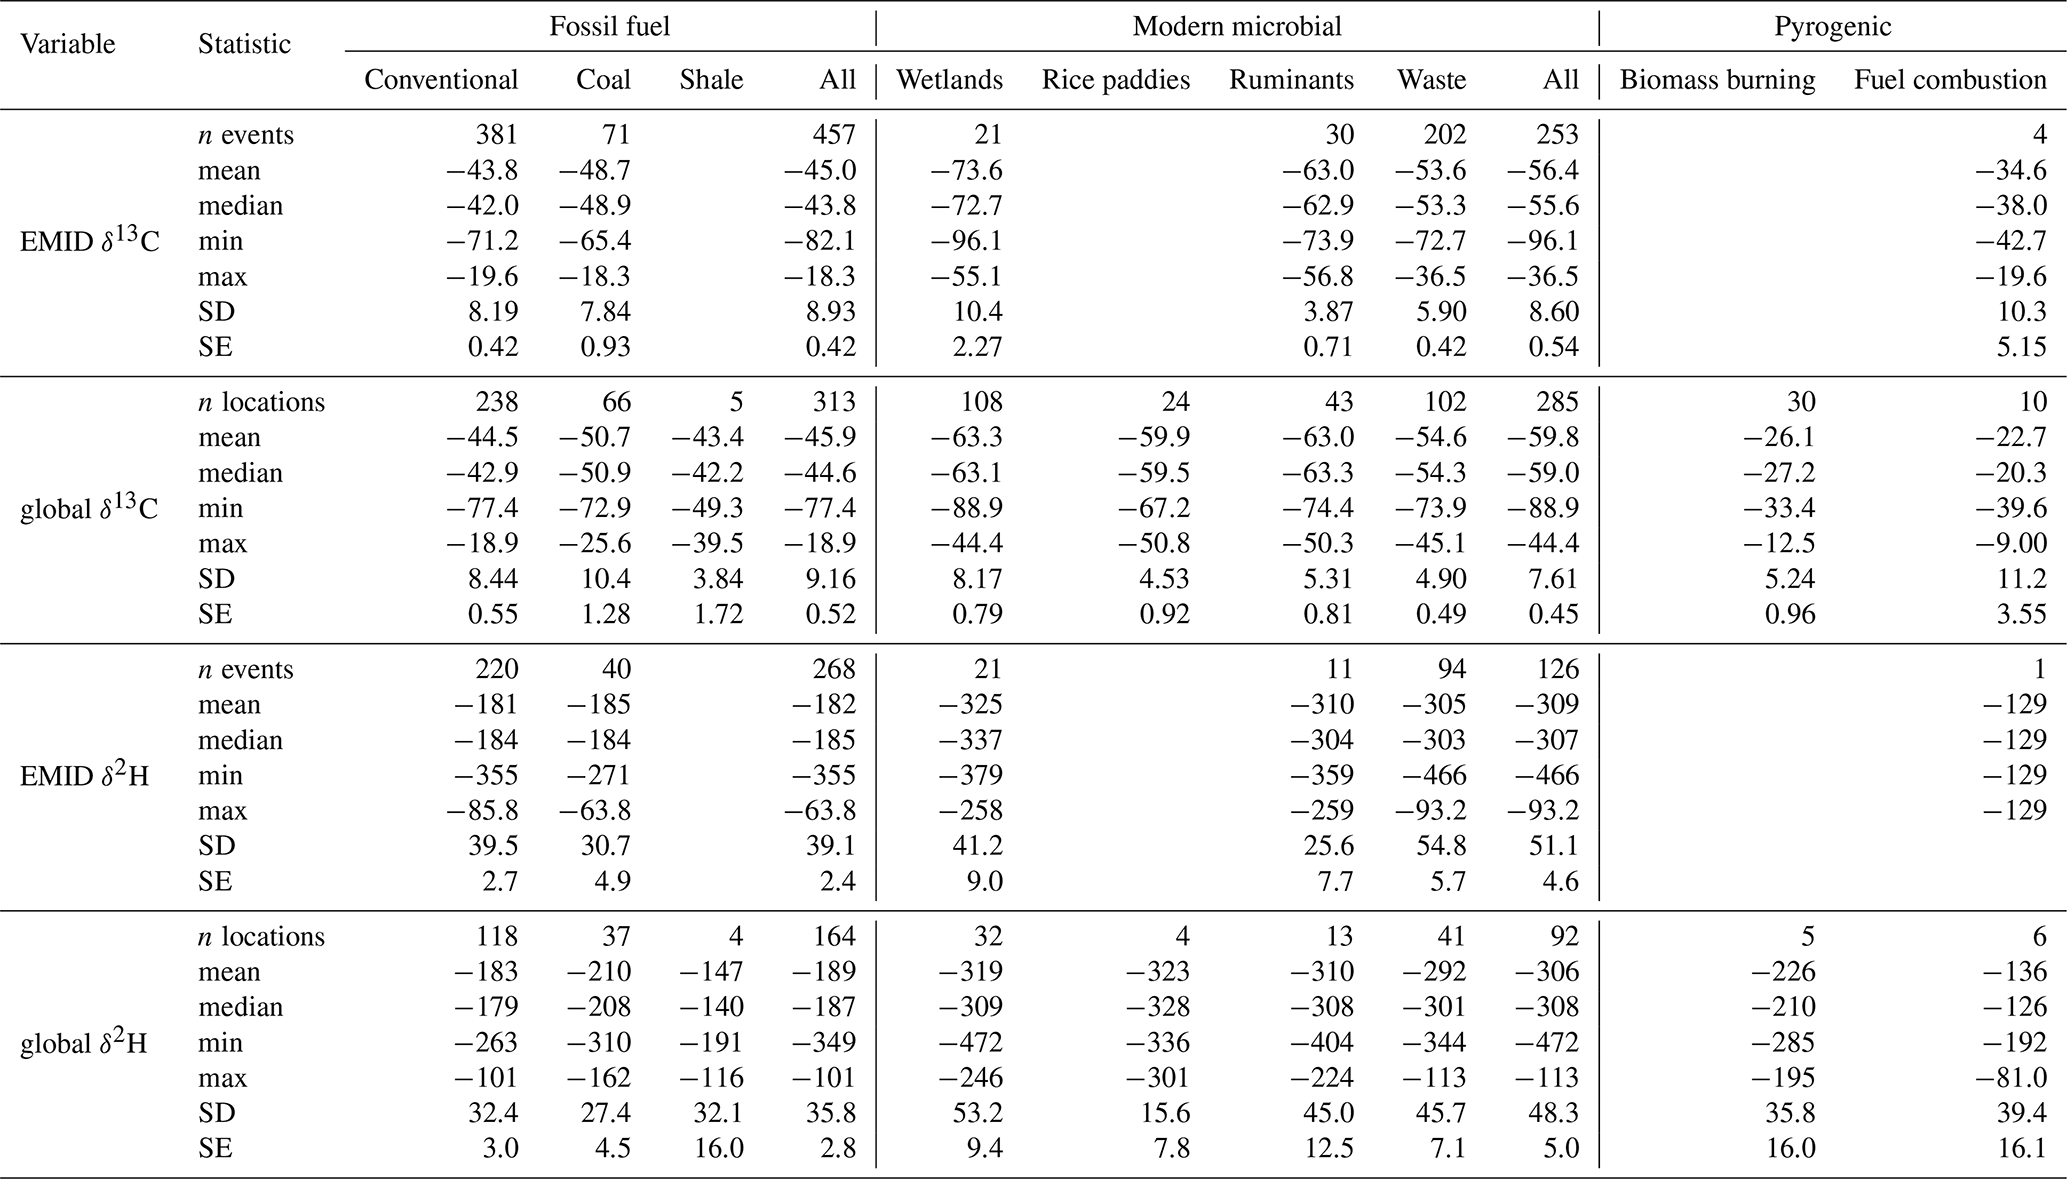
Table 4Statistical information on the results for the main CH4 source categories of the EMID and the update of the global database including the EMID and additional literature data. SD: standard deviation, SE: standard error of the mean.
3.2.2 Global data and the EMID
Statistical information on the CH4 isotopic signatures in the complete extended database are presented in Table 4. Figure 5 shows the distribution frequency of isotope signatures for the source categories that represent the largest reported emissions (Saunois et al., 2020). The categories agriculture, waste, wetlands, and partly other natural are all of modern microbial origin, mostly from acetate fermentation (Milkov and Etiope, 2018). The different categories within microbial processes generally overlap (Fig. 5). Some differences can however be observed, such as the wetlands mean δ13C being lower in the EMID than globally ( ‰ compared to ‰), because the European samples were taken at relatively high latitudes (Sect. 3.2.1). Table 4 also shows that waste sources present more enriched δ13C values than other modern microbial sources. This difference is particularly visible in the EMID, where a relatively large number of sites from waste-related sources were sampled. As mentioned in Sect. 3.1, additional parameters control the isotopic signature of the emitted CH4, such as the type of substrate, the presence of oxygen, or secondary (e.g. oxidation) processes. The minimum waste δ13C signature of −73.9 ‰ is comparable to the low values of other microbial sources, which supports the hypothesis of a larger influence of secondary processes in waste degradation relative to other microbial CH4 formation. We recommend to separate the waste category from the other microbial sources to minimise the uncertainty in the assigned isotopic signature, at least for δ13C. The range of δ2H signatures from waste sources is larger than of the other modern microbial sources, but the average δ2H from the different microbial sources are similar. One can see that δ2H is not systematically correlated with δ13C, and δ2H can also vary with other parameters such as the isotopic composition of water in the substrate. The δ2H signatures for waste are based on less measurements compared to δ13C (42 % of all measured waste sources included δ2H signatures). The relation between δ2H from wetlands and the δ2H from precipitation has been established previously (Waldron et al., 1999; Chanton et al., 2006; Douglas et al., 2021). We also know that the fractionation factors derived for CH4 microbial oxidation are much larger for δ2H than for δ13C (Coleman et al., 1981; Bergamaschi et al., 1998; Chanton et al., 2006). Nevertheless, further δ2H measurements are required to better define the isotopic dependencies to secondary processes.
In Sherwood et al. (2017, 2021), the pyrogenic category only contained biomass burning data, and the binary distribution clearly illustrates the difference between C3 and C4 plants in terms of δ13C signatures: the averages in the global database are ‰ and ‰, for C3 and C4 plants, respectively. The additional biomass burning data we added from published literature confirm the dependency of δ13C on the plant metabolism (Fig. A3). We also added pyrogenic data from fuel combustion (burning of fossil fuel) from both our measurements and the literature. The resulting distribution of the δ13C data is smoother than in Sherwood et al. (2017) (Fig. 5), because the δ13C from fossil fuel burning does not show a clear distinction between C3/C4 plant metabolisms. δ2H isotopic signatures from pyrogenic sources cover a wide range of values, and overlap with the ones of fossil fuels. δ2H signatures allow to clearly distinguish between biomass and fuel combustion (Table 4), but this is based on a very low number of measurements. Further analysis including data on δ2H could help to parameterise the biomass burning δ2H in more detail (Vigano et al., 2010), similar to the above mentioned relation between δ2H and δ2H (Waldron et al., 1999; Chanton et al., 2006; Röckmann et al., 2010; Douglas et al., 2021).
Fugitive CH4 emissions from fossil fuel source locations present a wide range of isotopic signatures: δ13C from −77.4 ‰ to −18.9 ‰, and δ2H from −349 ‰ to −101 ‰ (Table 4). The average signatures of all fugitive CH4 emissions from the exploitation of fossil fuels (excluding seeps) in the EMID were ‰ (n=452) and ‰ (n=259), which compares well with the global average of −44.8±0.1 ‰ (n=8128) calculated in Sherwood et al. (2017). Regarding the present updated global database, the weighted averages were δ13C ‰ and δ2H ‰, weighted by the relative emissions from conventional and coal fuels production worldwide.5 The average values from the different databases are lower than δ13C and δ2H values used in most global models (Table 5), and to the value of ‰ suggested by Schwietzke et al. (2016). The global means in Table 4 do not necessarily represent the global isotopic signature of fossil fuel emissions, because this should be weighted by the magnitude of emissions in the different basins, which was taken into account (using production as indicator) in the calculation by Schwietzke et al. (2016). However, our averages are indications of the general CH4 isotopic signatures from all measurements until now. Because of the high heterogeneity of the δ13C and δ2H values from fossil fuel-related activities, and the temporal variations in the production from the different regions (Stavert et al., 2021; US Energy Information Administration, 2021; Lan et al., 2021), it is important to assume a relatively large uncertainty when estimating in the global signature of fossil fuel emissions in atmospheric models.
In Sect. 3.1, we have shown the use of δ13C to distinguish fossil fuel emissions in western Europe, and the need for δ2H measurements in central and eastern Europe. In the global database, most fossil fuels records (83.5 %) have δ2H values ‰. The few values of δ2H ‰, indicating microbial fermentation as gas origin, were found in some coal formations in the United States and Canada. Figure 5 still allows us to generally conclude that δ2H measurements are more suitable to distinguish fossil fuel vs. biogenic CH4 sources at the global scale than δ13C only, which further emphasises the need for more δ2H measurements.
The extraction of shale gas is growing worldwide (Energy Information Administration, 2016, 2021), and the associated CH4 emissions (Howarth, 2019; Milkov et al., 2020b). However, shale gas commercial production does not increase in Europe (Energy Information Administration, 2016), and so the emphasis of this study is limited to oil, gas, and coal fuels.
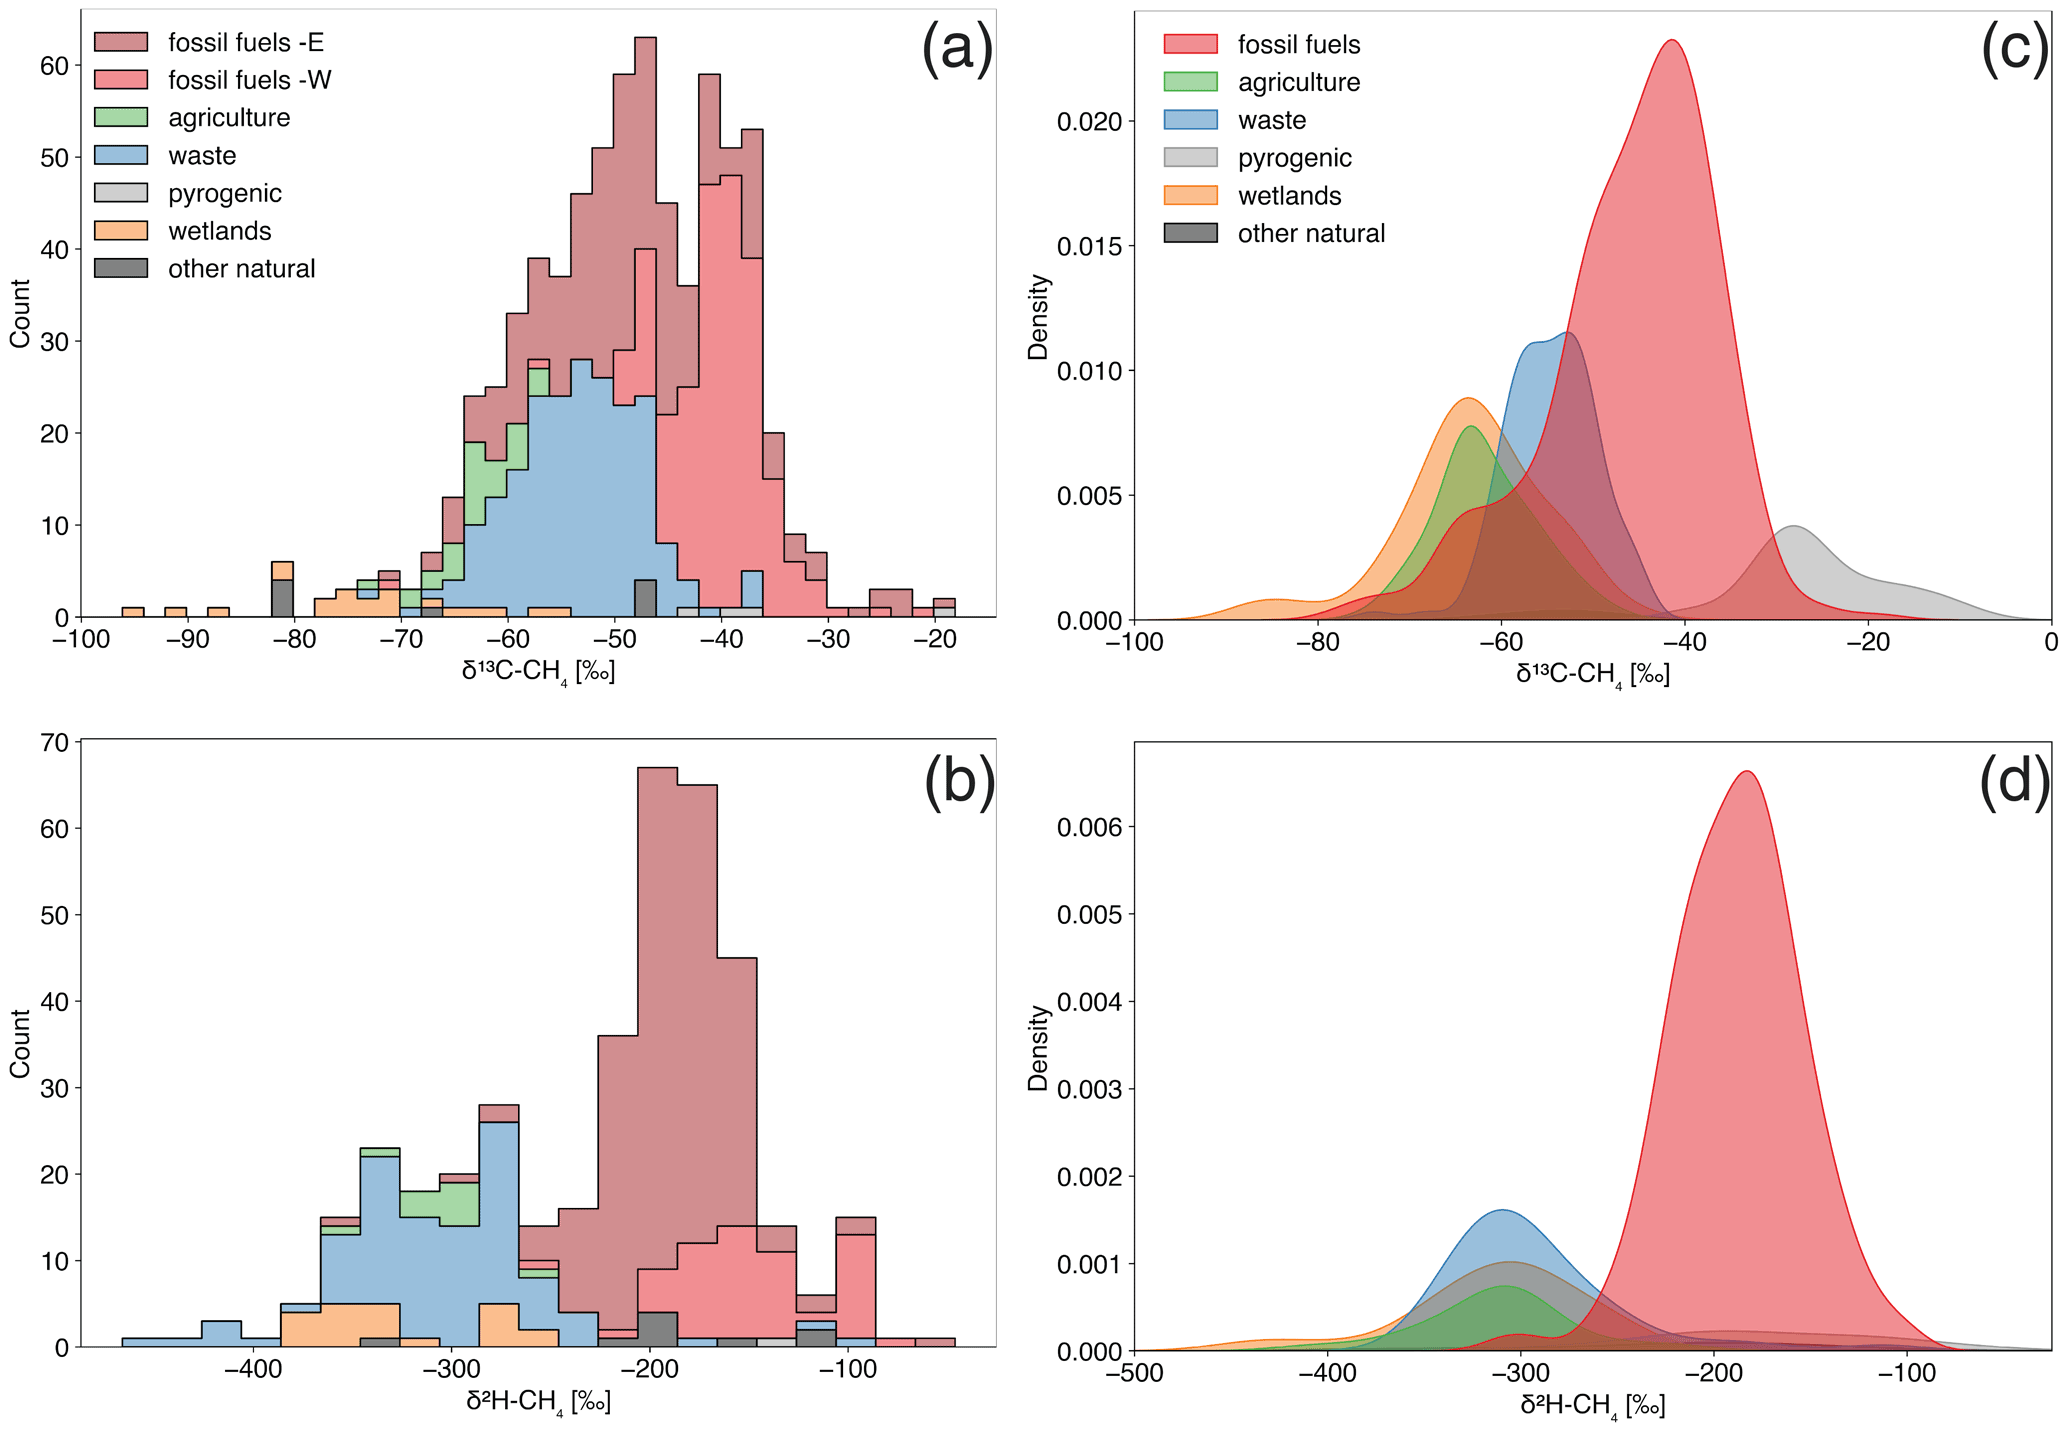
Figure 5Distribution of δ13C (a, c) and δ2H (b, d) in CH4 for different source categories. (a) Single measurements reported in the EMID (absolute numbers). “fossil fuels -E” shows fossil fuels data from Poland and Romania, and “fossil fuels -W” from the UK, the Netherlands, Germany, and France. (b) Measured locations in all datasets (Sherwood et al., 2021), with EMID locations and additional literature) (normalised probability density). “Agriculture” represents ruminants and rice paddies emissions.
Table 5CH4 isotopic source signatures assigned to the fossil fuel-related emissions in past global-scale models (not an exhaustive list).
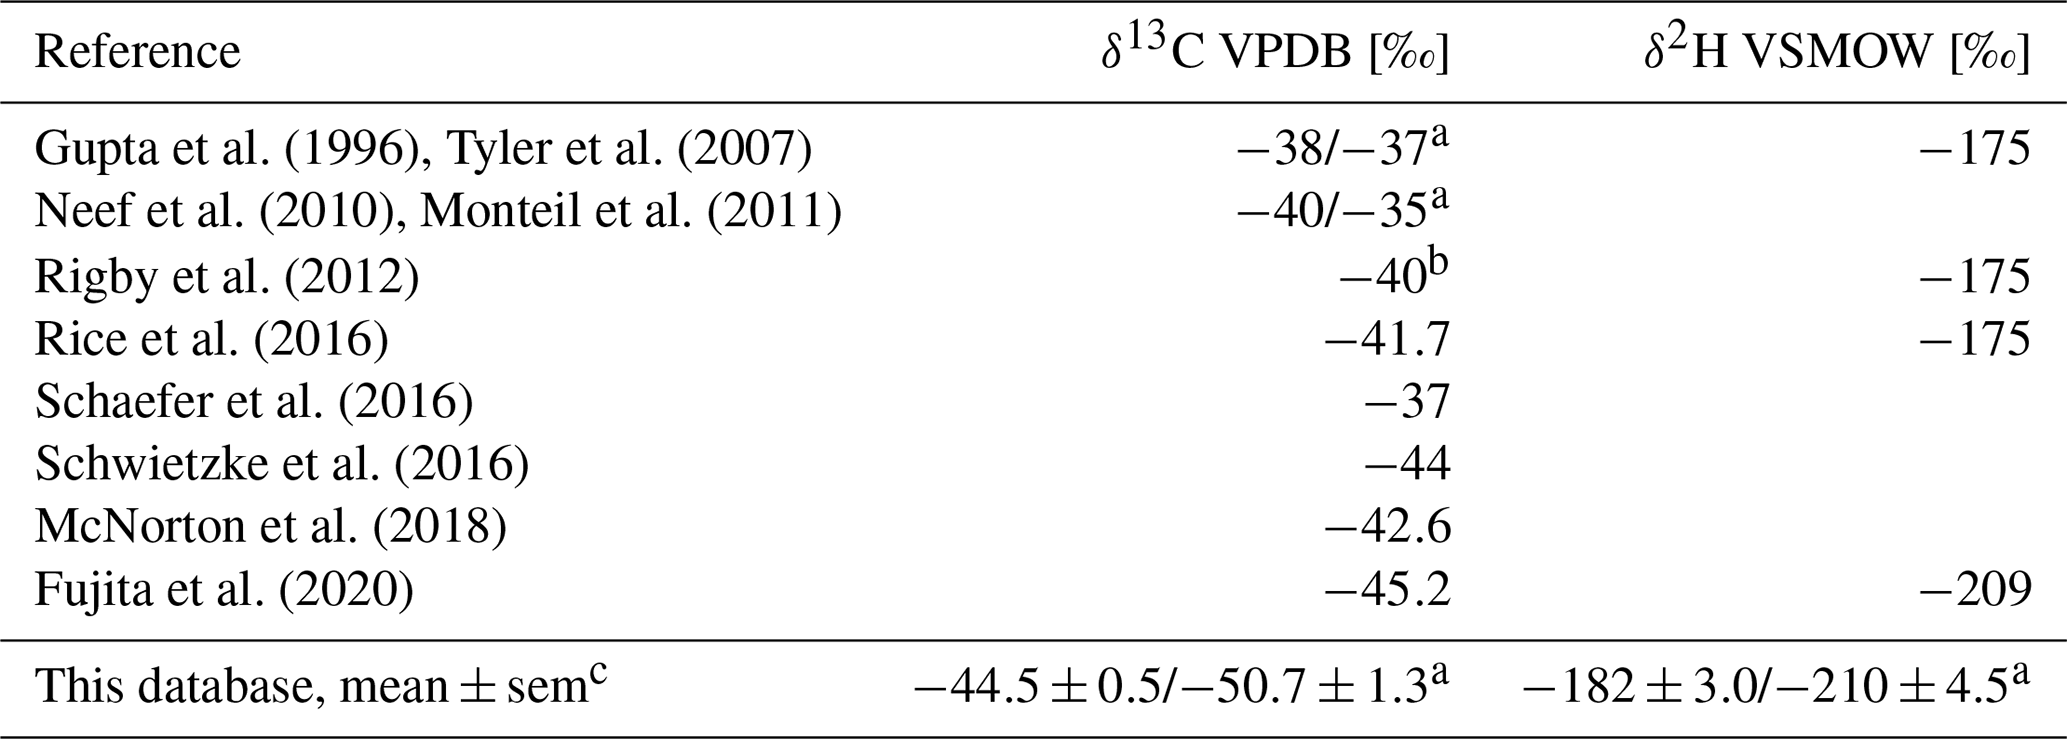
a for natural gas/coal; b also in Lassey et al. (2000), Houweling et al. (2000), Bousquet et al. (2006), Gosh et al. (2015), Thompson et al. (2018); c standard error of the mean.
The database is made freely available to the scientific community in the belief that it provides the most complete picture of the stable isotopic composition of CH4 sources. The free availability of these data does not constitute permission for publication of the data. For research projects, if the data used are essential to the work to be published, or if the conclusion or results largely depend on the data, co-authorship should be considered. Full contact details and information on how to cite the data are given in the accompanying database. The database is currently stored in a publicly available repository: https://doi.org/10.24416/UU01-YP43IN (Menoud et al., 2022a).
This study presents an updated dataset of isotopic source signatures of CH4 from recent atmospheric measurements, while including additional data from published literature which were not previously included. The new data are a contribution from the EMID, that results from the sampling activities performed within the MEMO2 project. It represents a substantial contribution to the global dataset for fugitive fossil fuels and waste sources, mainly sampled in urban areas.
We have highlighted two main improvements in our understanding of the CH4 isotopic composition: (i) a more robust range of values for modern microbial sources, and a better characterisation of the δ13C enrichment in CH4 from waste sources; and (ii) fossil fuel-related sources could have more depleted values than previous estimates used in global models. In this respect, our data confirm the analysis made by Schwietzke et al. (2016).
Finally, the new European data contain comparatively more δ2H measurements. In the case of fossil fuel emissions, the use of δ2H is of particular interest. In general, utilising both δ13C and δ2H for CH4 improves our ability to clearly separate fossil fuel and microbial sources, compared to δ13C alone. The use of δ2H as additional constraint could help to answer open questions regarding the CH4 global budget. To better understand the drivers of δ2H variability (except for δ2H of precipitation), more measurements are required, especially of pyrogenic and waste sources.
The present dataset can be used for CH4 source attribution, studies at local and regional scales, and to derive global source signatures for input to global methane cycle modelling studies. The larger dataset will also help to estimate the uncertainties to take into account when using isotopic data in top-down studies, and with prior knowledge of the specificities of the studied region, the use of isotopic data in top-down studies is a powerful tool to evaluate the bottom-up emission inventories (Alvarez et al., 2018; Etiope and Schwietzke, 2019; Rutherford et al., 2021; Stavert et al., 2021). A future improvement of this database would be to include more measurements on the African, Asian, and South American continents, where experimental studies are lacking. Because of its potential for source characterisation, new studies should also focus on δ2H measurements. The maintenance of a CH4 stable isotope database relies on a certain transparency of different groups around the world on their work. Therefore we strongly encourage the scientific community to pursue the efforts to make scientific data open-access more systematically.
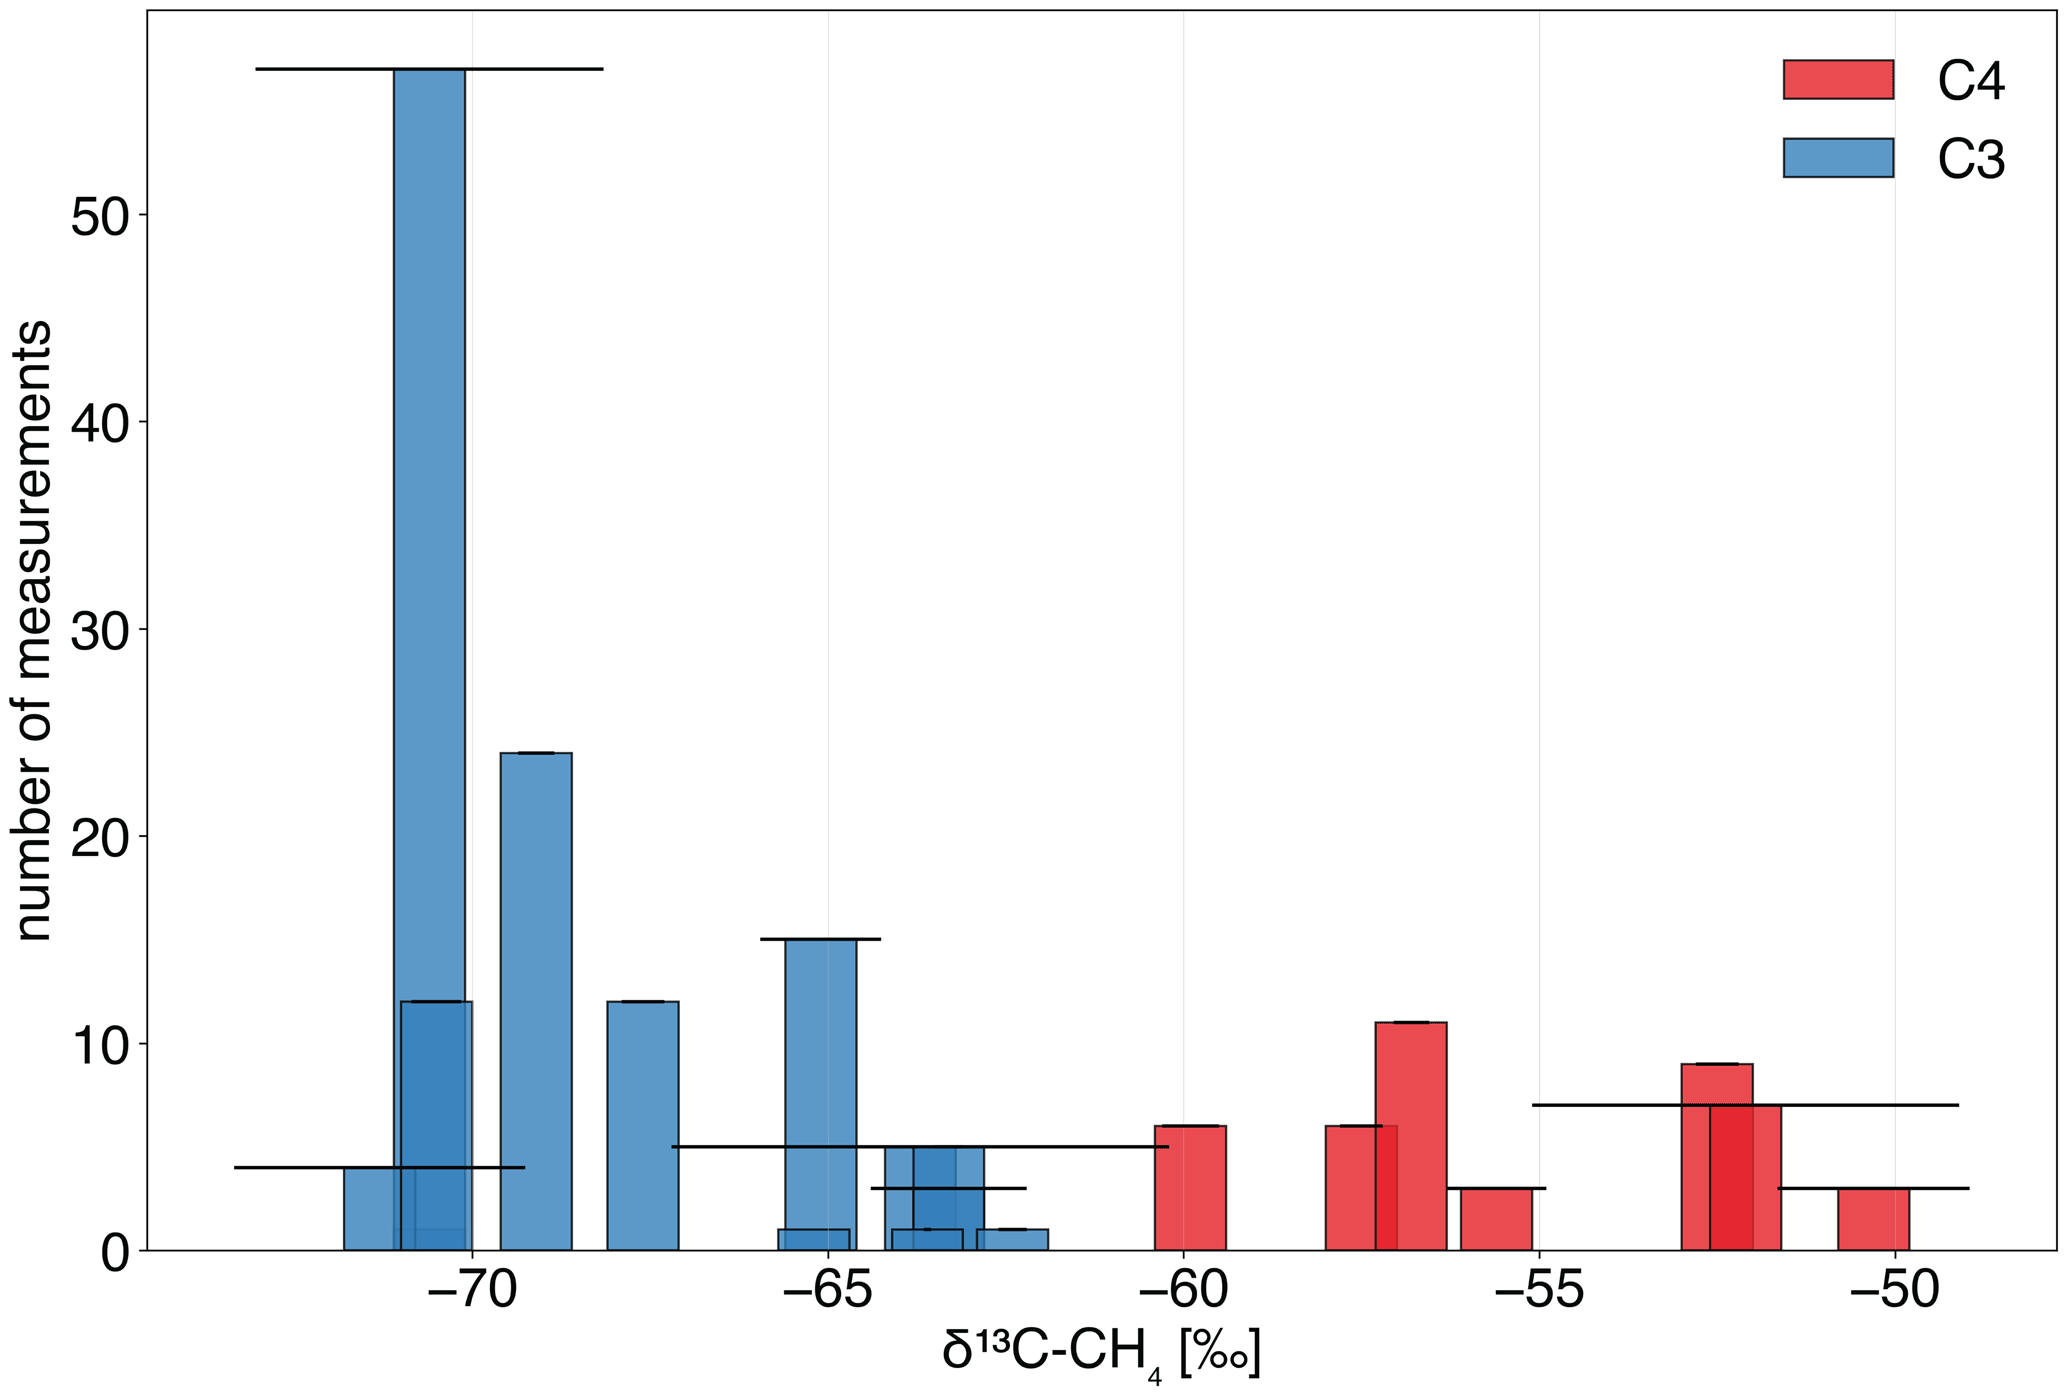
Figure A1Measured δ13C signatures from ruminants in the literature studies (Al-Shalan et al., 2022; Brownlow et al., 2017; Klevenhusen et al., 2009, 2010; Levin et al., 1993; Lu et al., 2021; Rust, 1981; Townsend-Small et al., 2012; Wahlen et al., 1989) according to the feed: a majority of C3 plants (blue) or C4 plants (red). Bar heights represent the number of measurements and black lines standard deviations.
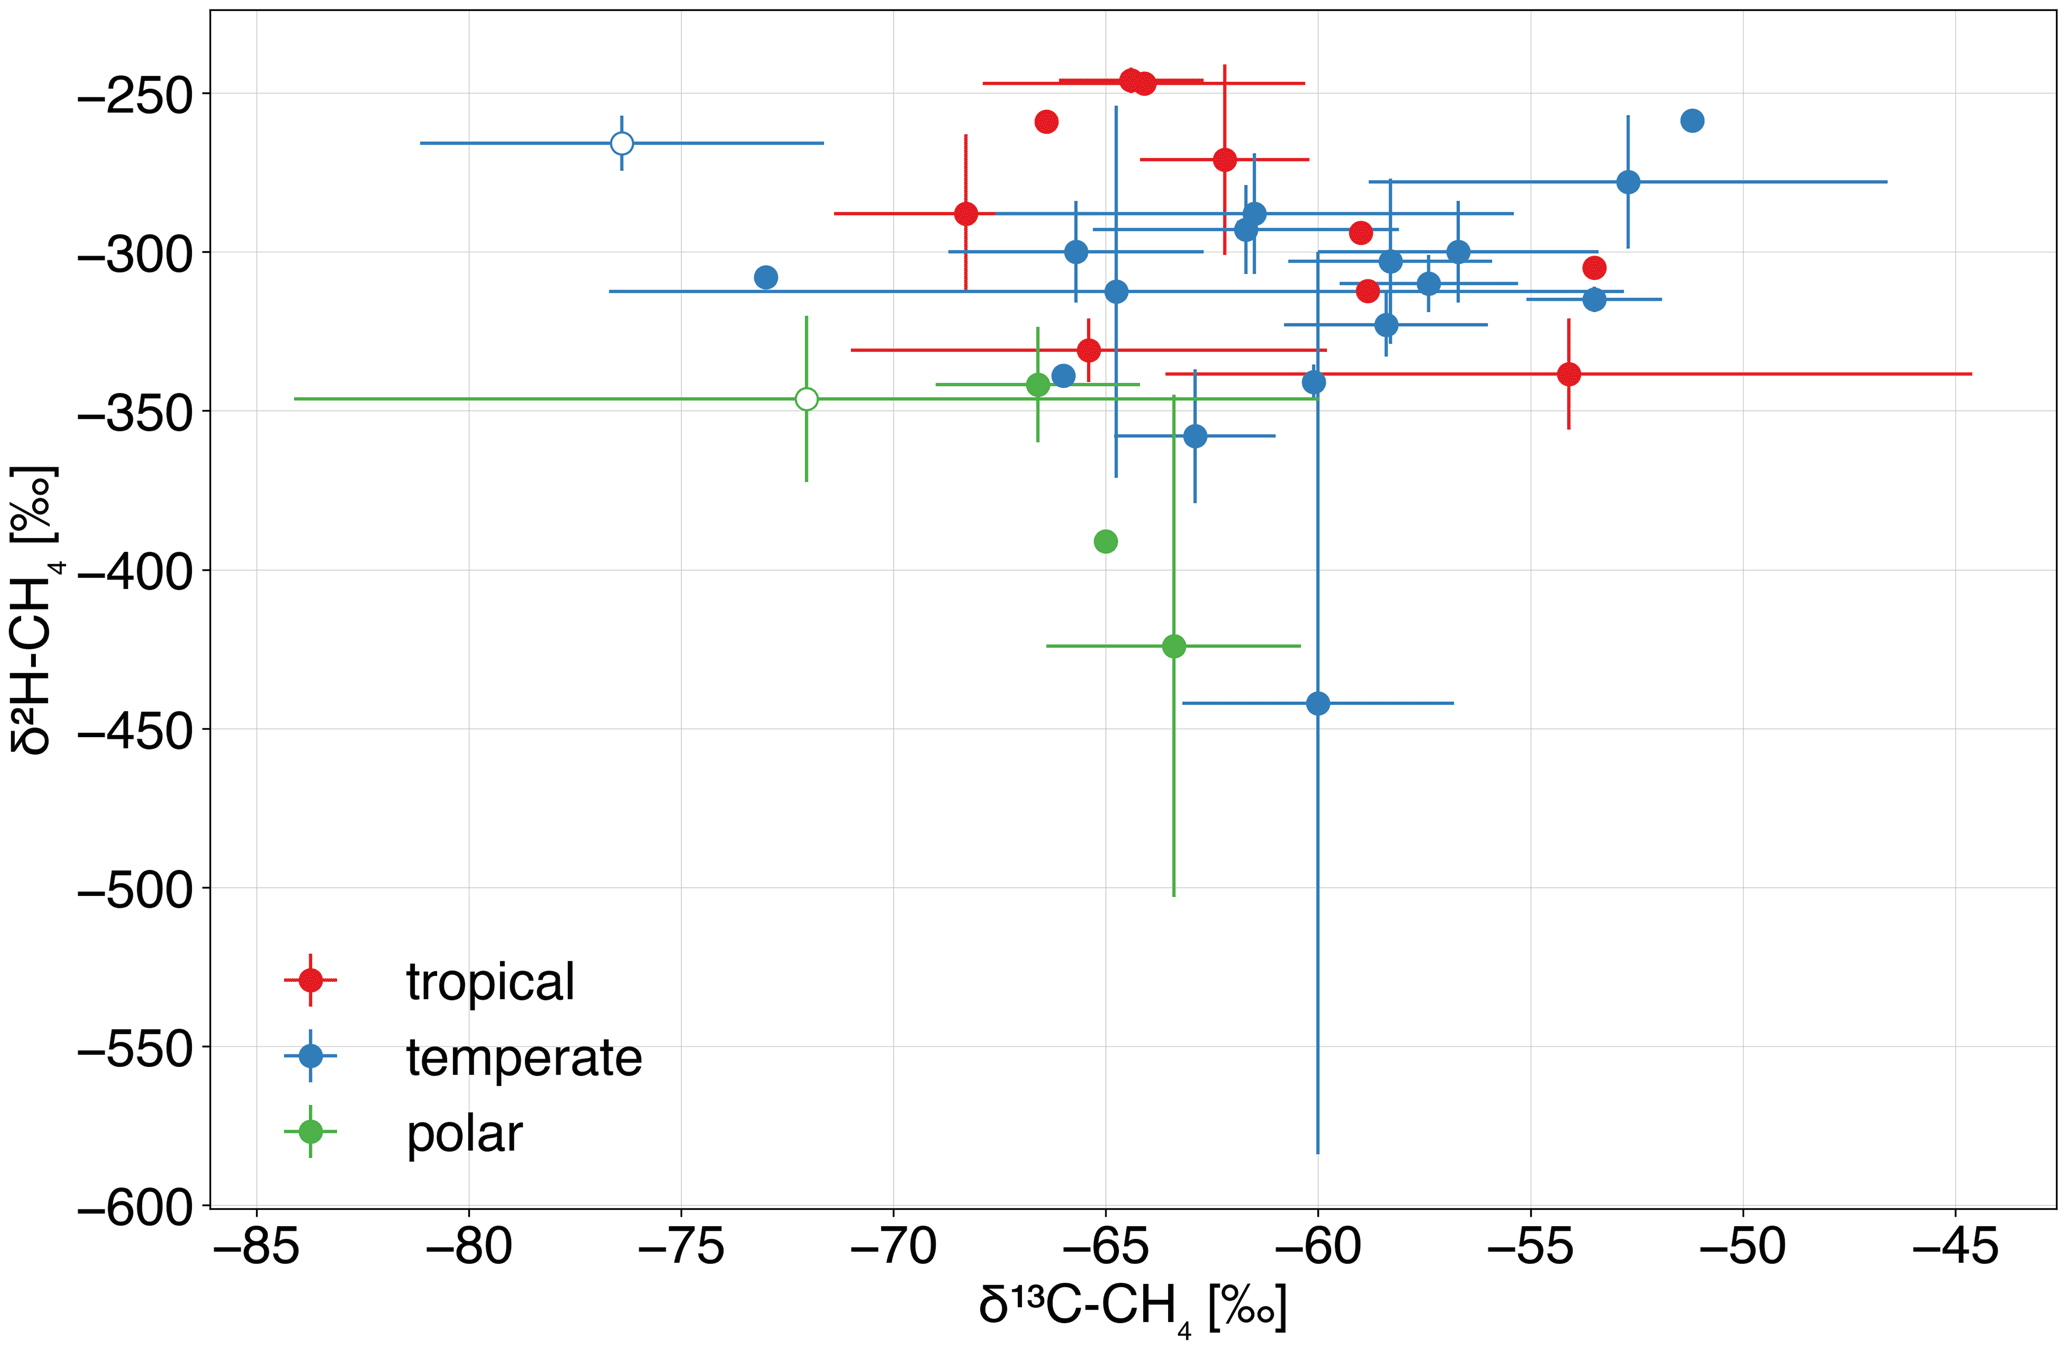
Figure A2Measured δ13C and δ2H signatures from wetlands sites as reported in the literature (Beck et al., 2012; Burke and Sackett, 1986; Day et al., 2015; Happell et al., 1994; Kuhlmann et al., 1998; Lansdown, 1992; Levin et al., 1993; Martens et al., 1992; Nakagawa et al., 2002; Smith et al., 2000; Sugimoto and Fujita, 2006; Umezawa et al., 2011; Wahlen et al., 1989; Wassmann et al., 1992; Woltemate et al., 1984) (solid circled) and EMID (open circles) database, colour-coded by the latitude zones. Error bars show the standard deviations.
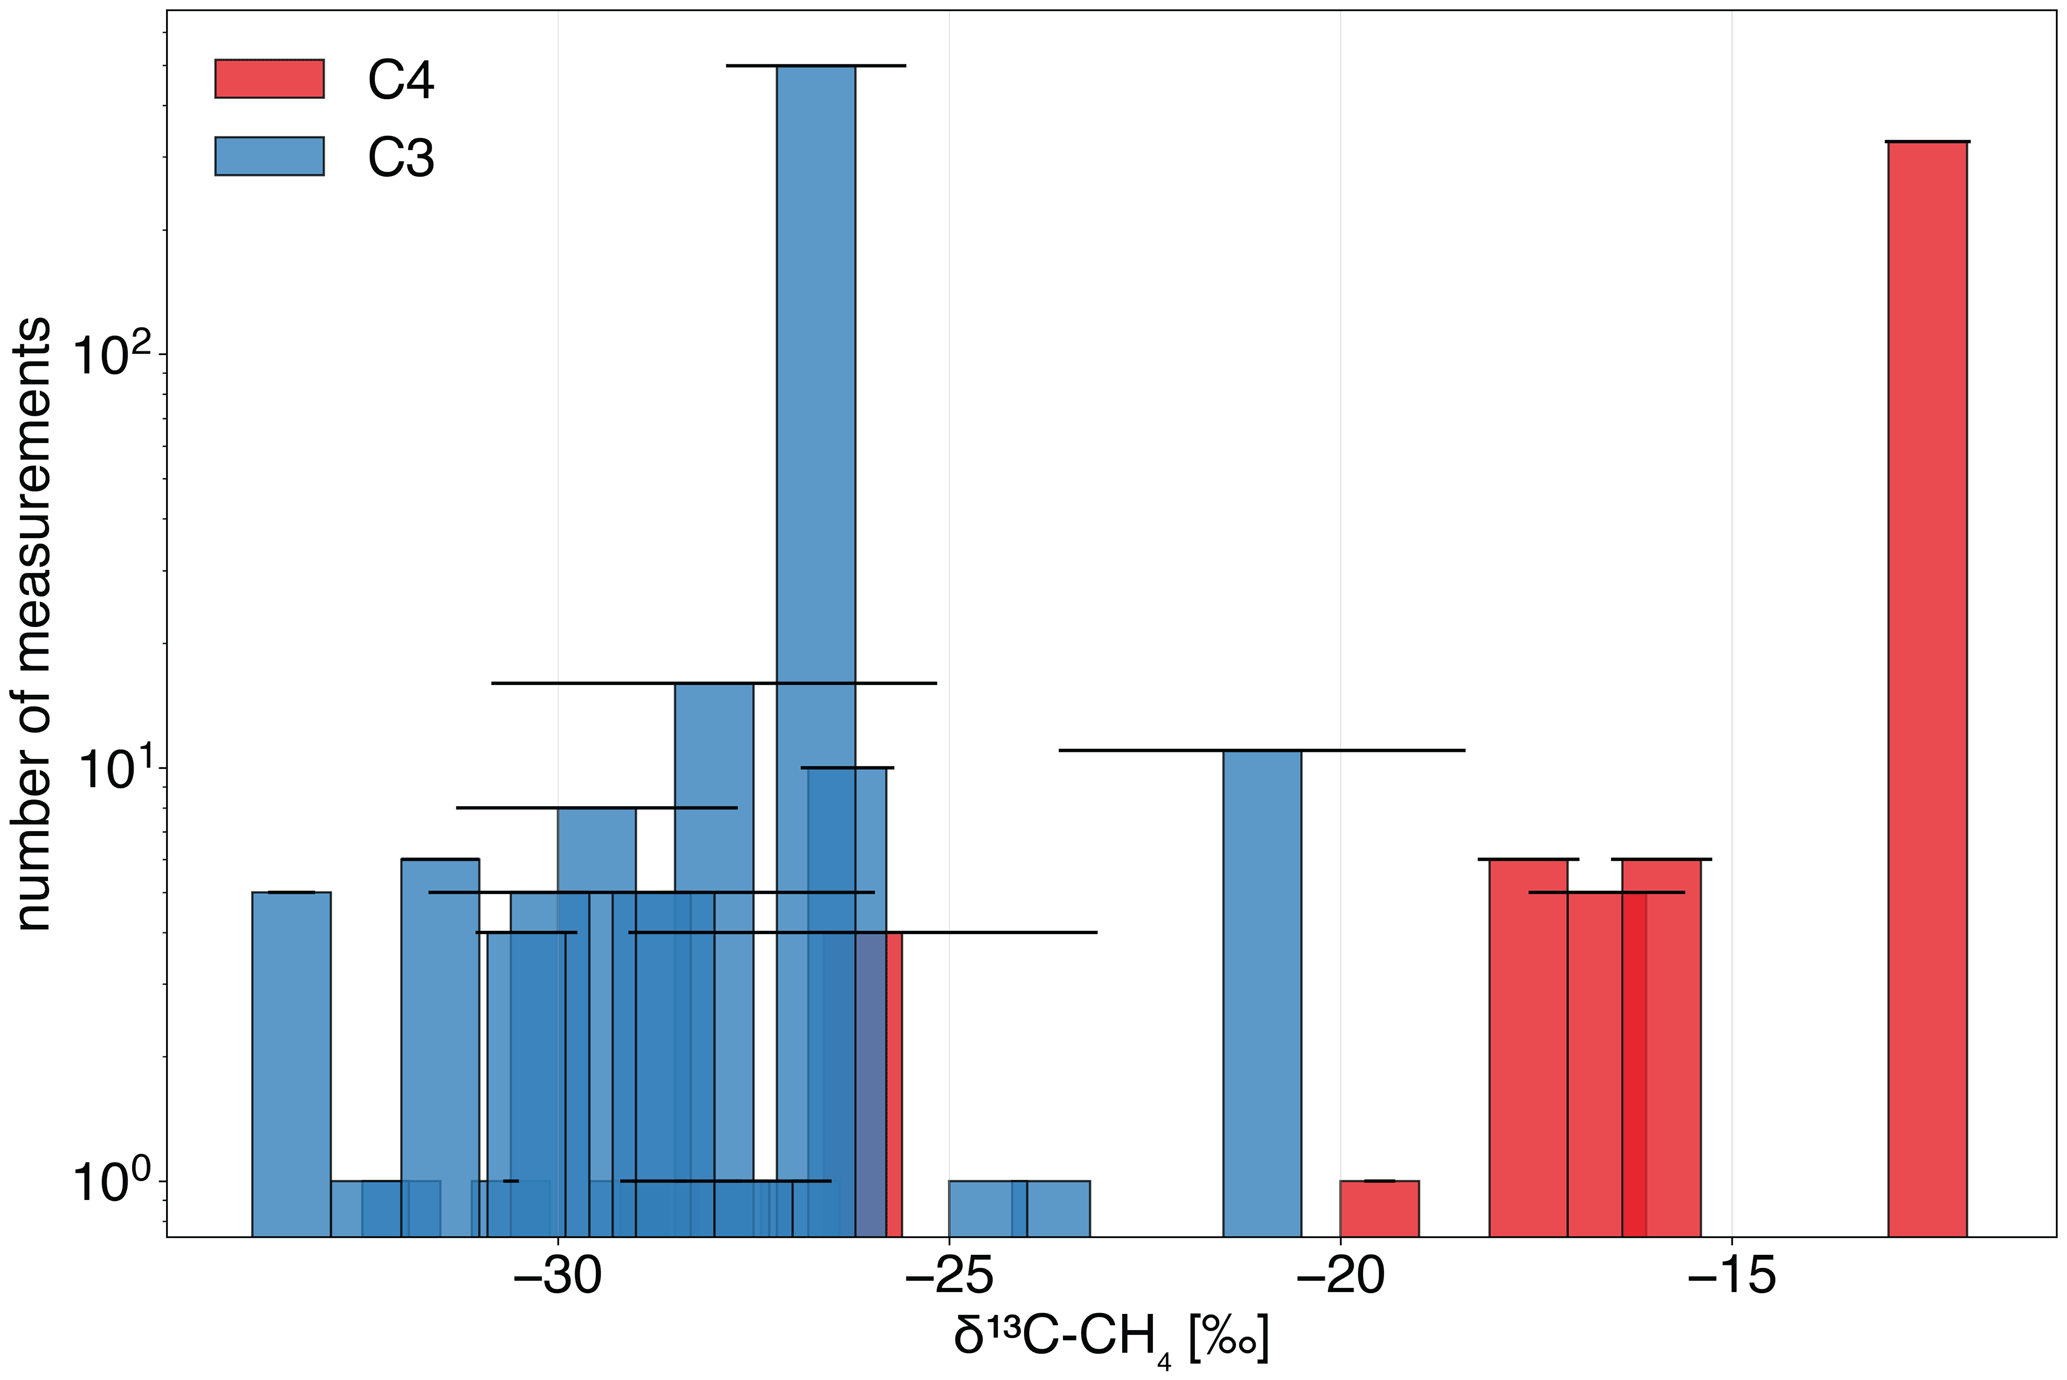
Figure A3Measured δ13C signatures from biomass burning in literature studies (Stevens and Engelkemeir, 1988; Wahlen et al., 1989; Levin et al., 1993; Chanton et al., 2000; Snover et al., 2000; Fisher et al., 2011; Umezawa et al., 2011; Brownlow et al., 2017) according to the type of vegetation: a majority of C3 plants (blue) or C4 plants (red). Bar heights represent the number of measurements and black lines standard deviations.
MM, CvdV, DL, JMF, SB, JLF, and REF performed the isotopic measurements. MM, TR, DL, JLF, SB, JMF, REF, HM, MS, JN, KV, PŁ, PK, MS, SD, and TA took part in the collection of samples. MM gathered and analysed the data and prepared the figures; TR and DL contributed to the interpretation of the data. MM prepared the paper with contributions from TR, DL, JR, MS, PŁ, SB, HM, JMF, and HC.
The contact author has declared that none of the authors has any competing interests.
Publisher's note: Copernicus Publications remains neutral with regard to jurisdictional claims in published maps and institutional affiliations.
We thank all the staff from different organisations involved in the MEMO2, CoMet, and ROMEO projects who participated in the sample collection.We acknowledge the technical staff at UU and RHUL for the maintenance of the IRMS systems. This work was supported by the ITN project “Methane goes Mobile – Measurements and Modelling” (MEMO2; https://h2020-memo2.eu/, last access: 3 November 2021).
This research has been supported by the European Union's Horizon 2020 Research and Innovation programme under the Marie Sklodowska-Curie grant agreement no. 722479.
This paper was edited by Bo Zheng and reviewed by two anonymous referees.
Akritas, M. G. and Bershady, M. A.: Linear Regression for Astronomical Data with Measurement Errors and Intrinsic Scatter, The Astrophys. J., 470, 706, https://doi.org/10.1086/177901, 1996. a
Al-Shalan, A., Lowry, D., Fisher, R., Nisbet, E., Zazzeri, G., Al-Sarawi, M., and France, J.: Methane Emissions in Kuwait: Plume Identification, Isotopic Characterisation and Inventory Verification, Atmos. Environ., 268, 118763, https://doi.org/10.1016/j.atmosenv.2021.118763, 2022. a, b, c, d
Alvarez, R. A., Zavala-Araiza, D., Lyon, D. R., Allen, D. T., Barkley, Z. R., Brandt, A. R., Davis, K. J., Herndon, S. C., Jacob, D. J., Karion, A., Kort, E. A., Lamb, B. K., Lauvaux, T., Maasakkers, J. D., Marchese, A. J., Omara, M., Pacala, S. W., Peischl, J., Robinson, A. L., Shepson, P. B., Sweeney, C., Townsend-Small, A., Wofsy, S. C., and Hamburg, S. P.: Assessment of Methane Emissions from the U.S. Oil and Gas Supply Chain, Science, 361, eaar7204, https://doi.org/10.1126/science.aar7204, 2018. a, b, c
Andersen, T., Scheeren, B., Peters, W., and Chen, H.: A UAV-based active AirCore system for measurements of greenhouse gases, Atmos. Meas. Tech., 11, 2683–2699, https://doi.org/10.5194/amt-11-2683-2018, 2018. a
Baciu, C., Ionescu, A., and Etiope, G.: Hydrocarbon Seeps in Romania: Gas Origin and Release to the Atmosphere, Marine Petrol. Geol., 89, 130–143, https://doi.org/10.1016/j.marpetgeo.2017.06.015, 2018. a
Bakkaloglu, S., Lowry, D., Fisher, R. E., France, J. L., and Nisbet, E. G.: Carbon Isotopic Characterisation and Oxidation of UK Landfill Methane Emissions by Atmospheric Measurements, Waste Management, 132, 162–175, https://doi.org/10.1016/j.wasman.2021.07.012, 2021. a, b, c
Bakkaloglu, S., Lowry, D., Fisher, R. E., Menoud, M., Lanoisellé, M., Chen, H., Röckmann, T., and Nisbet, E. G.: Stable Isotopic Signatures of Methane from Waste Sources through Atmospheric Measurements, Atmos. Environ., 276, 119021, https://doi.org/10.1016/j.atmosenv.2022.119021, 2022. a, b
Baublys, K., Hamilton, S., Golding, S., Vink, S., and Esterle, J.: Microbial Controls on the Origin and Evolution of Coal Seam Gases and Production Waters of the Walloon Subgroup; Surat Basin, Australia, Int. J. Coal Geol., 147–148, 85–104, https://doi.org/10.1016/j.coal.2015.06.007, 2015. a
Beck, V., Chen, H., Gerbig, C., Bergamaschi, P., Bruhwiler, L., Houweling, S., Röckmann, T., Kolle, O., Steinbach, J., Koch, T., Sapart, C. J., van der Veen, C., Frankenberg, C., Andreae, M. O., Artaxo, P., Longo, K. M., and Wofsy, S. C.: Methane Airborne Measurements and Comparison to Global Models during BARCA, J. Geophys. Res.-Atmos., 117, 15310, https://doi.org/10.1029/2011JD017345, 2012. a, b, c
Bergamaschi, P., Lubina, C., Königstedt, R., Fischer, H., Veltkamp, A. C., and Zwaagstra, O.: Stable Isotopic Signatures (δ13C, δD) of Methane from European Landfill Sites, J. Geophys. Res.-Atmos., 103, 8251–8265, https://doi.org/10.1029/98JD00105, 1998. a, b, c
Bergmaschi, P. and Harris, G.: Measurements of Stable Isotope Ratios (13CH4/12CH4, 12CH3D/12CH4) in Landfill Methane Using a Tunable Diode Laser, Global Biogeochem. Cycles, 9, 439–447, 1995. a
Bilek, R. S., Tyler, S. C., Sass, R. L., and Fisher, F. M.: Differences in CH 4 Oxidation and Pathways of Production between Rice Cultivars Deduced from Measurements of CH4 Flux and δ13C of CH4 and CO2, Global Biogeochem. Cycles, 13, 1029–1044, https://doi.org/10.1029/1999GB900040, 1999. a
Boggs, P. T. and Rogers, J. E.: Orthogonal Distance Regression, in: Statistical Analysis of Measurement Error Models and Applications: Proceedings of the AMS-IMS-SIAM Joint Summer Research Conference Held 10–16 June 1989, vol. 112 of Contemporary Mathematics, p. 186, American Mathematical Society, 1990. a
Bousquet, P., Ciais, P., Miller, J. B., Dlugokencky, E. J., Hauglustaine, D. A., Prigent, C., Van der Werf, G. R., Peylin, P., Brunke, E.-G., Carouge, C., Langenfelds, R. L., Lathière, J., Papa, F., Ramonet, M., Schmidt, M., Steele, L. P., Tyler, S. C., and White, J.: Contribution of Anthropogenic and Natural Sources to Atmospheric Methane Variability, Nature, 443, 439–443, https://doi.org/10.1038/nature05132, 2006. a, b
Bowes, H. L. and Hornibrook, E. R. C.: Emission of Highly 13C-depleted Methane from an Upland Blanket Mire, Geophys. Res. Lett., 33, L04401, https://doi.org/10.1029/2005GL025209, 2006. a
Bréas, O., Guillou, C., Reniero, F., and Wada, E.: The Global Methane Cycle: Isotopes and Mixing Ratios, Sources and Sinks, Isot. Environ. Health S., 37, 257–379, https://doi.org/10.1080/10256010108033302, 2001. a
Brownlow, R., Lowry, D., Fisher, R. E., France, J. L., Lanoisellé, M., White, B., Wooster, M. J., Zhang, T., and Nisbet, E. G.: Isotopic Ratios of Tropical Methane Emissions by Atmospheric Measurement: Tropical Methane δ13C Source Signatures, Global Biogeochem. Cycles, 31, 1408–1419, https://doi.org/10.1002/2017GB005689, 2017. a, b, c, d, e
Burke, R. A. and Sackett, W. M.: Stable Hydrogen and Carbon Isotopic Compositions of Biogenic Methanes from Several Shallow Aquatic Environments, in: Organic Marine Geochemistry, edited by: Sohn, M. L., American Chemical Society, Washington, D.C., 305, 297–313, https://doi.org/10.1021/bk-1986-0305.ch017, 1986. a
Cain, M., Warwick, N. J., Fisher, R. E., Lowry, D., Lanoisellé, M., Nisbet, E. G., France, J., Pitt, J., O'Shea, S., Bower, K. N., Allen, G., Illingworth, S., Manning, A. J., Bauguitte, S., Pisso, I., and Pyle, J. A.: A Cautionary Tale: A Study of a Methane Enhancement over the North Sea, J. Geophys. Res.-Atmos., 122, 7630–7645, https://doi.org/10.1002/2017JD026626, 2017. a
Chan, E. W., Shiller, A. M., Joung, D. J., Arrington, E. C., Valentine, D. L., Redmond, M. C., Breier, J. A., Socolofsky, S. A., and Kessler, J. D.: Investigations of Aerobic Methane Oxidation in Two Marine Seep Environments: Part 2 – Isotopic Kinetics, J. Geophys. Res.-Oceans, 124, 8392–8399, https://doi.org/10.1029/2019JC015603, 2019. a
Chanton, J., Crill, P., Bartlett, K., and Martens, C.: Amazon Capims (Floating Grassmats): A Source of 13C Enriched Methane to the Troposphere, Geophys. Res. Lett., 16, 799–802, https://doi.org/10.1029/GL016i008p00799, 1989. a
Chanton, J. P. and Whiting, G. J.: Methane Stable Isotopic Distributions as Indicators of Gas Transport Mechanisms in Emergent Aquatic Plants, Aquatic Botany, 54, 227–236, 1996. a
Chanton, J. P., Martens, C. S., Kelley, C. A., Crill, P. M., and Showers, W. J.: Methane Transport Mechanisms and Isotopic Fractionation in Emergent Macrophytes of an Alaskan Tundra Lake, J. Geophys. Res., 97, 16681, https://doi.org/10.1029/90JD01542, 1992. a
Chanton, J. P., Rutkowski, C. M., Schwartz, C. C., Ward, D. E., and Boring, L.: Factors Influencing the Stable Carbon Isotopic Signature of Methane from Combustion and Biomass Burning, J. Geophys. Res.-Atmos., 105, 1867–1877, https://doi.org/10.1029/1999JD900909, 2000. a, b, c
Chanton, J. P., Arkebauer, T. J., Harden, H. S., and Verma, S. B.: Diel Variation in Lacunal CH4 and CO2 Concentration and δ13C in Phragmites Australis, Biogeochemistry, 59, 287–301, https://doi.org/10.1023/A:1016067610783, 2002. a
Chanton, J. P., Fields, D., and Hines, M. E.: Controls on the Hydrogen Isotopic Composition of Biogenic Methane from High-Latitude Terrestrial Wetlands, J. Geophys. Res.-Biogeo., 111, G04004, https://doi.org/10.1029/2005JG000134, 2006. a, b, c, d
Chasar, L. S., Chanton, J. P., Glaser, P. H., and Siegel, D. I.: Methane Concentration and Stable Isotope Distribution as Evidence of Rhizospheric Processes: Comparison of a Fen and Bog in the Glacial Lake Agassiz Peatland Complex, Ann. Botany, 86, 655–663, https://doi.org/10.1006/anbo.2000.1172, 2000. a
Chen, Y., Sherwin, E., Berman, E., Jones, B., Gordon, M., Wetherley, E., Kort, E., and Brandt, A.: Comprehensive Aerial Survey Quantifies High Methane Emissions from the New Mexico Permian Basin, Atmos. Sci., preprint, https://doi.org/10.31223/X56D0D, 2021. a
Cicerone, R. J. and Oremland, R. S.: Biogeochemical Aspects of Atmospheric Methane, Global Biogeochem. Cycles, 2, 299–327, 1988. a
Coleman, D. D., Risatti, J., and Schoell, M.: Fractionation of Carbon and Hydrogen Isotopes by Methane-Oxidizing Bacteria, Geochim. Cosmochim. Ac., 45, 1033–1037, https://doi.org/10.1016/0016-7037(81)90129-0, 1981. a
Conrad, R.: Quantification of Methanogenic Pathways Using Stable Carbon Isotopic Signatures: A Review and a Proposal, Org. Geochemistry, 36, 739–752, https://doi.org/10.1016/j.orggeochem.2004.09.006, 2005. a, b
Conrad, R., Noll, M., Claus, P., Klose, M., Bastos, W. R., and Enrich-Prast, A.: Stable carbon isotope discrimination and microbiology of methane formation in tropical anoxic lake sediments, Biogeosciences, 8, 795–814, https://doi.org/10.5194/bg-8-795-2011, 2011. a
Day, S., Ong, C., Rodger, A., Etheridge, D., Hibberd, M., van Gorsel, E., Spencer, D., Krummel, P., Fry, R., Dell'Amico, M., Sestak, S., Williams, D., Loh, Z., and Barrett, D.: Characterisation of Regional Fluxes of Methane in the Surat Basin, Queensland: Phase 2: A Pilot Study of Methodology to Detect and Quantify Methane Sources, Technical report, CSIRO, Australia, 2015. a, b
De Visscher, A.: Isotope Fractionation Effects by Diffusion and Methane Oxidation in Landfill Cover Soils, J. Geophys. Res., 109, D18111, https://doi.org/10.1029/2004JD004857, 2004. a, b
Defratyka, S.: Characterizing Methane (CH4) Emissions in Urban Environments (Paris), PhD thesis, Université Paris-Saclay, 2021. a
Defratyka, S. M., Paris, J.-D., Yver-Kwok, C., Fernandez, J. M., Korben, P., and Bousquet, P.: Mapping Urban Methane Sources in Paris, France, Environ. Sci. Technol., 55, 8583–8591, https://doi.org/10.1021/acs.est.1c00859, 2021. a, b, c, d
Douglas, P. M. J., Stratigopoulos, E., Park, S., and Phan, D.: Geographic variability in freshwater methane hydrogen isotope ratios and its implications for global isotopic source signatures, Biogeosciences, 18, 3505–3527, https://doi.org/10.5194/bg-18-3505-2021, 2021. a, b, c, d, e
Energy Information Administration: Shale Gas Production Drives World Natural Gas Production Growth, edited by: Aloulou, F. and Zaretskaya, V., U.S. Energy Information Administration, https://www.eia.gov/todayinenergy/detail.php?id=27512 (last access: 21 September 2022), 2016. a, b
Energy Information Administration: Shale Gas Production (Billion Cubic Feet), edited by: Energy Information Administration, Office of Oil and Gas, U.S. Department of Energy, https://www.eia.gov/dnav/ng/ng_prod_shalegas_s1_a.htm (last access: 21 September 2022), 2021. a
Etiope, G. and Schwietzke, S.: Global Geological Methane Emissions: An Update of Top-down and Bottom-up Estimates, Elementa: Science of the Anthropocene, 7, 47, https://doi.org/10.1525/elementa.383, 2019. a, b
Etminan, M., Myhre, G., Highwood, E. J., and Shine, K. P.: Radiative Forcing of Carbon Dioxide, Methane, and Nitrous Oxide: A Significant Revision of the Methane Radiative Forcing: Greenhouse Gas Radiative Forcing, Geophys. Res. Lett., 43, 12614–12623, https://doi.org/10.1002/2016GL071930, 2016. a
Fernandez, J., Maazallahi, H., France, J., Menoud, M., Corbu, M., Ardelean, M., Calcan, A., Townsend-Small, A., van der Veen, C., Fisher, R., Lowry, D., Nisbet, E., and Röckmann, T.: Street-Level Methane Emissions of Bucharest, Romania and the Dominance of Urban Wastewater., Atmos. Environ., 13, 100153, https://doi.org/10.1016/j.aeaoa.2022.100153, 2022. a, b, c, d
Fiehn, A., Kostinek, J., Eckl, M., Klausner, T., Gałkowski, M., Chen, J., Gerbig, C., Röckmann, T., Maazallahi, H., Schmidt, M., Korbeń, P., Neçki, J., Jagoda, P., Wildmann, N., Mallaun, C., Bun, R., Nickl, A.-L., Jöckel, P., Fix, A., and Roiger, A.: Estimating CH4, CO2 and CO emissions from coal mining and industrial activities in the Upper Silesian Coal Basin using an aircraft-based mass balance approach, Atmos. Chem. Phys., 20, 12675–12695, https://doi.org/10.5194/acp-20-12675-2020, 2020. a
Fisher, R., Lowry, D., Wilkin, O., Sriskantharajah, S., and Nisbet, E. G.: High-Precision, Automated Stable Isotope Analysis of Atmospheric Methane and Carbon Dioxide Using Continuous-Flow Isotope-Ratio Mass Spectrometry, Rapid Commun. Mass Spectrom., 20, 200–208, https://doi.org/10.1002/rcm.2300, 2006. a
Fisher, R. E., Sriskantharajah, S., Lowry, D., Lanoisellé, M., Fowler, C. M. R., James, R. H., Hermansen, O., Lund Myhre, C., Stohl, A., Greinert, J., Nisbet-Jones, P. B. R., Mienert, J., and Nisbet, E. G.: Arctic Methane Sources: Isotopic Evidence for Atmospheric Inputs, Geophys. Res. Lett., 38, L21803, https://doi.org/10.1029/2011GL049319, 2011. a, b
Fisher, R. E., France, J. L., Lowry, D., Lanoisellé, M., Brownlow, R., Pyle, J. A., Cain, M., Warwick, N., Skiba, U. M., Drewer, J., Dinsmore, K. J., Leeson, S. R., Bauguitte, S. J.-B., Wellpott, A., O'Shea, S. J., Allen, G., Gallagher, M. W., Pitt, J., Percival, C. J., Bower, K., George, C., Hayman, G. D., Aalto, T., Lohila, A., Aurela, M., Laurila, T., Crill, P. M., McCalley, C. K., and Nisbet, E. G.: Measurement of the 13C Isotopic Signature of Methane Emissions from Northern European Wetlands: Northern Wetland CH4 Isotopic Signature, Global Biogeochem. Cycles, 31, 605–623, https://doi.org/10.1002/2016GB005504, 2017. a, b, c
France, J. L., Fisher, R. E., Lowry, D., Allen, G., Andrade, M. F., Bauguitte, S. J.-B., Bower, K., Broderick, T. J., Daly, M. C., Forster, G., Gondwe, M., Helfter, C., Hoyt, A. M., Jones, A. E., Lanoisellé, M., Moreno, I., Nisbet-Jones, P. B. R., Oram, D., Pasternak, D., Pitt, J. R., Skiba, U., Stephens, M., Wilde, S. E., and Nisbet, E. G.: δ13C methane source signatures from tropical wetland and rice field emissions, Philos. T. Roy. Soc. A., 380, 20200449, https://doi.org/10.1098/rsta.2020.0449, 2022. a, b
Fujita, R., Morimoto, S., Maksyutov, S., Kim, H.-S., Arshinov, M., Brailsford, G., Aoki, S., and Nakazawa, T.: Global and Regional CH4 Emissions for 1995–2013 Derived From Atmospheric CH4, δ13C-CH4, and δD-CH4 Observations and a Chemical Transport Model, J. Geophys. Res.-Atmos., 125, e2020JD032903, https://doi.org/10.1029/2020JD032903, 2020. a, b
Galand, P. E., Yrjälä, K., and Conrad, R.: Stable carbon isotope fractionation during methanogenesis in three boreal peatland ecosystems, Biogeosciences, 7, 3893–3900, https://doi.org/10.5194/bg-7-3893-2010, 2010. a
Gałkowski, M., Fiehn, A., Swolkien, J., Stanisavljevic, M., Korben, P., Menoud, M., Necki, J., Roiger, A., Röckmann, T., Gerbig, C., and Fix, A.: Emissions of CH4 and CO2 over the Upper Silesian Coal Basin (Poland) and Its Vicinity, ICOS ERIC – Carbon Portal [data set], https://doi.org/10.18160/3K6Z-4H73, 2021. a
Ganesan, A. L., Stell, A. C., Gedney, N., Comyn-Platt, E., Hayman, G., Rigby, M., Poulter, B., and Hornibrook, E. R. C.: Spatially Resolved Isotopic Source Signatures of Wetland Methane Emissions, Geophys. Res. Lett., 45, 3737–3745, https://doi.org/10.1002/2018GL077536, 2018. a, b, c
Gebert, J. and Streese-Kleeberg, J.: Coupling Stable Isotope Analysis with Gas Push-Pull Tests to Derive in Situ Values for the Fractionation Factor Aox Associated with the Microbial Oxidation of Methane in Soils, Soil Sci. Soc. Am. J., 81, 1107–1114, https://doi.org/10.2136/sssaj2016.11.0387, 2017. a
Gerard, G. and Chanton, J.: Quantification of Methane Oxidation in the Rhizosphere of Emergent Aquatic Macrophytes: Defining Upper Limits, Biogeochemistry, 23, 79–97, https://doi.org/10.1007/BF00000444, 1993. a
Golding, S. D., Uysal, I. T., Bolhar, R., Boreham, C. J., Dawson, G. K. W., Baublys, K. A., and Esterle, J. S.: Carbon Dioxide-Rich Coals of the Oaky Creek Area, Central Bowen Basin: A Natural Analogue for Carbon Sequestration in Coal Systems, Australian J. Earth Sci., 60, 125–140, https://doi.org/10.1080/08120099.2012.750627, 2013. a
Ghosh, A., Patra, P. K., Ishijima, K., Umezawa, T., Ito, A., Etheridge, D. M., Sugawara, S., Kawamura, K., Miller, J. B., Dlugokencky, E. J., Krummel, P. B., Fraser, P. J., Steele, L. P., Langenfelds, R. L., Trudinger, C. M., White, J. W. C., Vaughn, B., Saeki, T., Aoki, S., and Nakazawa, T.: Variations in global methane sources and sinks during 1910–2010, Atmos. Chem. Phys., 15, 2595–2612, https://doi.org/10.5194/acp-15-2595-2015, 2015. a
Gupta, M., Tyler, S., and Cicerone, R.: Modeling Atmospheric δ13CH4 and the Causes of Recent Changes in Atmospheric CH4 Amounts, J. Geophys. Res.-Atmos., 101, 22923–22932, https://doi.org/10.1029/96JD02386, 1996. a
Happell, J. D., Chanton, J. P., and Showers, W. S.: The Influence of Methane Oxidation on the Stable Isotopic Composition of Methane Emitted from Florida Swamp Forests, Geochim. Cosmochim. Ac., 58, 4377–4388, https://doi.org/10.1016/0016-7037(94)90341-7, 1994. a, b
Happell, J. D., Chanton, J. P., and Showers, W. J.: Methane Transfer across the Water-Air Interface in Stagnant Wooded Swamps of Florida: Evaluation of Mass-Transfer Coefficients and Isotropic Fractionation, Limnol. Oceanogr., 40, 290–298, https://doi.org/10.4319/lo.1995.40.2.0290, 1995. a
Henne, S., Brunner, D., Oney, B., Leuenberger, M., Eugster, W., Bamberger, I., Meinhardt, F., Steinbacher, M., and Emmenegger, L.: Validation of the Swiss methane emission inventory by atmospheric observations and inverse modelling, Atmos. Chem. Phys., 16, 3683–3710, https://doi.org/10.5194/acp-16-3683-2016, 2016. a
Hoheisel, A., Yeman, C., Dinger, F., Eckhardt, H., and Schmidt, M.: An improved method for mobile characterisation of δ13CH4 source signatures and its application in Germany, Atmos. Meas. Tech., 12, 1123–1139, https://doi.org/10.5194/amt-12-1123-2019, 2019. a, b, c
Hornibrook, E. R. C. and Bowes, H. L.: Trophic Status Impacts Both the Magnitude and Stable Carbon Isotope Composition of Methane Flux from Peatlands, Geophys. Res. Lett., 34, L21401, https://doi.org/10.1029/2007GL031231, 2007. a
Houweling, S., Dentener, F., and Lelieveld, J.: Simulation of Preindustrial Atmospheric Methane to Constrain the Global Source Strength of Natural Wetlands, J. Geophys. Res.-Atmos., 105, 17243–17255, https://doi.org/10.1029/2000JD900193, 2000. a, b
Howarth, R. W.: Ideas and perspectives: is shale gas a major driver of recent increase in global atmospheric methane?, Biogeosciences, 16, 3033–3046, https://doi.org/10.5194/bg-16-3033-2019, 2019. a
Inglett, K. S., Chanton, J. P., and Inglett, P. W.: Methanogenesis and Methane Oxidation in Wetland Soils, in: SSSA Book Series, edited by DeLaune, R., Reddy, K., Richardson, C., and Megonigal, J., pp. 407–425, American Society of Agronomy and Soil Science Society of America, Madison, WI, USA, https://doi.org/10.2136/sssabookser10.c21, 2015. a
IPCC: Climate Change 2013: The Physical Science Basis, Working Group I Contribution to the Fifth Assessment Report of the Intergovernmental Panel on Climate Change, edited by: Stocker, T. F., Qin, D., Plattner, G.-K., Tignor, M., Allen, S. K., Boschung, J., Nauels, A., Xia, Y., Bex, V., and Midgley, P. M., Cambridge Univ. Press, Cambridge, UK and New York, NY, USA, ISBN 978-1-107-66182-0, 2013. a
IPCC 2021: Climate Change 2021: The Physical Science Basis. Contribution of Working Group I to the Sixth Assessment Report of the Intergovernmental Panel on Climate Change, edited by: Masson-Delmotte, V., Zhai, P., Pirani, A., Connors, S. L., Péan, C., Berger, S., Caud, N., Chen, Y., Goldfarb, L., Gomis, M. I., Huang, M., Leitzell, K., Lonnoy, E., Matthews, J. B. R., Maycock, T. K., Waterfield, T., Yelekçi, O., Yu, R., and Zhou, B., Cambridge University Press., https://doi.org/10.1017/9781009157896, 2021a. a, b
IPCC: Summary for Policymakers, in: Climate Change 2021: The Physical Science Basis. Contribution of Working Group I to the Sixth Assessment Report of the Intergovernmental Panel on Climate Change, edited by: Masson-Delmotte, V., Zhai, P., Pirani, A., Connors, S. L., Péan, C., Berger, S., Caud, N., Chen, Y., Goldfarb, L., Gomis, M. I., Huang, M., Leitzell, K., Lonnoy, E., Matthews, J. B. R., Maycock, T. K., Waterfield, T., Yelekçi, O., Yu, R., and Zhou, B., Cambridge University Press, Cambridge, United Kingdom and New York, NY, USA, 3–32, https://doi.org/10.1017/9781009157896.001, 2021b. a
Iverach, C. P., Cendón, D. I., Hankin, S. I., Lowry, D., Fisher, R. E., France, J. L., Nisbet, E. G., Baker, A., and Kelly, B. F. J.: Assessing Connectivity Between an Overlying Aquifer and a Coal Seam Gas Resource Using Methane Isotopes, Dissolved Organic Carbon and Tritium, Sci. Rep.-UK, 5, 15996, https://doi.org/10.1038/srep15996, 2015. a
Keeling, C. D.: The Concentration and Isotopic Abundances of Carbon Dioxide in Rural and Marine Air, Geochim. Cosmochim. Ac., 24, 277–298, 1961. a
Kiyosu, Y.: Hydrogen Isotopic Compositions of Hydrogen and Methane from Some Volcanic Areas in Northeastern Japan, Earth Planet. Sc. Lett., 62, 41–52, https://doi.org/10.1016/0012-821X(83)90069-9, 1983. a
Klevenhusen, F., Bernasconi, S. M., Hofstetter, T. B., Bolotin, J., Kunz, C., and Soliva, C. R.: Efficiency of Monolaurin in Mitigating Ruminal Methanogenesis and Modifying C-isotope Fractionation When Incubating Diets Composed of Either C 3 or C4 Plants in a Rumen Simulation Technique (Rusitec) System, Brit. J. Nutr., 102, 1308–1317, https://doi.org/10.1017/S0007114509990262, 2009. a
Klevenhusen, F., Bernasconi, S. M., Kreuzer, M., and Soliva, C. R.: Experimental Validation of the Intergovernmental Panel on Climate Change Default Values for Ruminant-Derived Methane and Its Carbon-Isotope Signature, Animal Production Science, 50, 159, https://doi.org/10.1071/AN09112, 2010. a, b
Kotarba, M. J.: Composition and Origin of Coalbed Gases in the Upper Silesian and Lublin Basins, Poland, Org. Geochem., 32, 163–180, https://doi.org/10.1016/S0146-6380(00)00134-0, 2001. a
Kotarba, M. J. and Pluta, I.: Origin of Natural Waters and Gases within the Upper Carboniferous Coal-Bearing and Autochthonous Miocene Strata in South-Western Part of the Upper Silesian Coal Basin, Poland, Applied Geochemistry, 24, 876–889, https://doi.org/10.1016/j.apgeochem.2009.01.013, 2009. a
Kuhlmann, A. J., Worthy, D. E. J., Trivett, N. B. A., and Levin, I.: Methane Emissions from a Wetland Region within the Hudson Bay Lowland: An Atmospheric Approach, J. Geophys. Res., 103, 16009–16016, https://doi.org/10.1029/98JD01024, 1998. a
Lan, X., Basu, S., Schwietzke, S., Bruhwiler, L. M. P., Dlugokencky, E. J., Michel, S. E., Sherwood, O. A., Tans, P. P., Thoning, K., Etiope, G., Zhuang, Q., Liu, L., Oh, Y., Miller, J. B., Pétron, G., Vaughn, B. H., and Crippa, M.: Improved Constraints on Global Methane Emissions and Sinks Using δ13C-CH4, Global Biogeochemical Cycles, 35, e2021GB007000, https://doi.org/10.1029/2021GB007000, 2021. a, b, c
Lansdown, J. M.: The Carbon and Hydrogen Stable Isotope Composition of Methane Released from Natural Wetlands and Ruminants, Abstract, University of Washington, 1992. a, b
Lassey, K. R., Lowe, D. C., and Manning, M. R.: The Trend in Atmospheric Methane δ13C and Implications for Isotopic Constraints on the Global Methane Budget, Global Biogeochem. Cycles, 14, 41–49, https://doi.org/10.1029/1999GB900094, 2000. a
Levin, I., Bergamaschi, P., Dörr, H., and Trapp, D.: Stable Isotopic Signature of Methane from Major Sources in Germany, Chemosphere, 26, 161–177, https://doi.org/10.1016/0045-6535(93)90419-6, 1993. a, b, c, d, e, f, g
Levin, I., Glatzel-Mattheier, H., Marik, T., Cuntz, M., Schmidt, M., and Worthy, D. E.: Verification of German Methane Emission Inventories and Their Recent Changes Based on Atmospheric Observations, J. Geophys. Res.-Atmos., 104, 3447–3456, https://doi.org/10.1029/1998JD100064, 1999. a
Lopez, M., Sherwood, O., Dlugokencky, E., Kessler, R., Giroux, L., and Worthy, D.: Isotopic Signatures of Anthropogenic CH4 Sources in Alberta, Canada, Atmos. Environ., 164, 280–288, https://doi.org/10.1016/j.atmosenv.2017.06.021, 2017. a
Lowry, D., Holmes, C. W., Rata, N. D., O'Brien, P., and Nisbet, E. G.: London Methane Emissions: Use of Diurnal Changes in Concentration and δ13C to Identify Urban Sources and Verify Inventories, J. Geophys. Res.-Atmos., 106, 7427–7448, https://doi.org/10.1029/2000JD900601, 2001. a, b, c
Lowry, D., Röckmann, T., Fisher, R., Menoud, M., and Fernandez, J.: Isotopic measurements linked to common scale (Deliverable No. 2.1), WP2. MEMO2: MEthane goes MObile – MEasurements and MOdelling, https://h2020-memo2.eu/wp-content/uploads/sites/198/2018/12/MEMO2-D2.1-Isotopic-measurements-linked-to-common-scale-final.pdf (last access: 11 May 2022), 2018. a
Lowry, D., Fisher, R. E., France, J. L., Coleman, M., Lanoisellé, M., Zazzeri, G., Nisbet, E. G., Shaw, J. T., Allen, G., Pitt, J., and Ward, R. S.: Environmental Baseline Monitoring for Shale Gas Development in the UK: Identification and Geochemical Characterisation of Local Source Emissions of Methane to Atmosphere, Sci. Total Environ., 708, 134600, https://doi.org/10.1016/j.scitotenv.2019.134600, 2020. a, b, c
Lu, X., Harris, S. J., Fisher, R. E., France, J. L., Nisbet, E. G., Lowry, D., Röckmann, T., van der Veen, C., Menoud, M., Schwietzke, S., and Kelly, B. F. J.: Isotopic signatures of major methane sources in the coal seam gas fields and adjacent agricultural districts, Queensland, Australia, Atmos. Chem. Phys., 21, 10527–10555, https://doi.org/10.5194/acp-21-10527-2021, 2021. a, b, c, d
Maasakkers, J. D., Jacob, D. J., Sulprizio, M. P., Scarpelli, T. R., Nesser, H., Sheng, J.-X., Zhang, Y., Hersher, M., Bloom, A. A., Bowman, K. W., Worden, J. R., Janssens-Maenhout, G., and Parker, R. J.: Global distribution of methane emissions, emission trends, and OH concentrations and trends inferred from an inversion of GOSAT satellite data for 2010–2015, Atmos. Chem. Phys., 19, 7859–7881, https://doi.org/10.5194/acp-19-7859-2019, 2019. a
Maazallahi, H., Fernandez, J. M., Menoud, M., Zavala-Araiza, D., Weller, Z. D., Schwietzke, S., von Fischer, J. C., Denier van der Gon, H., and Röckmann, T.: Methane mapping, emission quantification, and attribution in two European cities: Utrecht (NL) and Hamburg (DE), Atmos. Chem. Phys., 20, 14717–14740, https://doi.org/10.5194/acp-20-14717-2020, 2020. a, b
Maazallahi, H., Röckmann, T., and Schwietzke, S.: Estimation of CH Emissions from the Romanian Sector Using Field Measuremnets, in preparation, 2022. a
Maher, D. T., Cowley, K., Santos, I. R., Macklin, P., and Eyre, B. D.: Methane and Carbon Dioxide Dynamics in a Subtropical Estuary over a Diel Cycle: Insights from Automated in Situ Radioactive and Stable Isotope Measurements, Marine Chem., 168, 69–79, https://doi.org/10.1016/j.marchem.2014.10.017, 2015. a
Martens, C. S., Kelley, C. A., Chanton, J. P., and Showers, W. J.: Carbon and Hydrogen Isotopic Characterization of Methane from Wetlands and Lakes of the Yukon-Kuskokwim Delta, Western Alaska, J. Geophys. Res., 97, 16689, https://doi.org/10.1029/91JD02885, 1992. a
Mayfield, E. N., Robinson, A. L., and Cohon, J. L.: System-Wide and Superemitter Policy Options for the Abatement of Methane Emissions from the U.S. Natural Gas System, Environ. Sci. Technol., 51, 4772–4780, https://doi.org/10.1021/acs.est.6b05052, 2017. a
McCalley, C. K., Woodcroft, B. J., Hodgkins, S. B., Wehr, R. A., Kim, E.-H., Mondav, R., Crill, P. M., Chanton, J. P., Rich, V. I., Tyson, G. W., and Saleska, S. R.: Methane Dynamics Regulated by Microbial Community Response to Permafrost Thaw, Nature, 514, 478–481, https://doi.org/10.1038/nature13798, 2014. a
McNorton, J., Wilson, C., Gloor, M., Parker, R. J., Boesch, H., Feng, W., Hossaini, R., and Chipperfield, M. P.: Attribution of recent increases in atmospheric methane through 3-D inverse modelling, Atmos. Chem. Phys., 18, 18149–18168, https://doi.org/10.5194/acp-18-18149-2018, 2018. a, b
Menoud, M., Röckmann, T., Fernandez, J., Bakkaloglu, S., Lowry, D., Korben, P., Schmidt, M., Stanisavljevic, M., Necki, J., Defratyka, S., and Kwok, C. Y.: mamenoud/MEMO2_isotopes: v8.1 complete, Zenodo [data set], https://doi.org/10.5281/zenodo.4062356, 2020a. a
Menoud, M., Röckmann, T., Lowry, D., and Fernandez, J.: Improved isotopic source signatures of local and regional CH4 emissions (Deliverable No. 2.2), WP2. MEMO2: MEthane goes MObile – MEasurements and MOdelling, https://h2020-memo2.eu/wp-content/uploads/sites/198/2021/03/MEMO2-D2.2-v3-final.pdf (last access: 6 December 2021), 2020b. a
Menoud, M., van der Veen, C., Scheeren, B., Chen, H., Szénási, B., Morales, R. P., Pison, I., Bousquet, P., Brunner, D., and Röckmann, T.: Characterisation of Methane Sources in Lutjewad, The Netherlands, Using Quasi-Continuous Isotopic Composition Measurements, Tellus B, 72, 1–19, https://doi.org/10.1080/16000889.2020.1823733, 2020c. a, b
Menoud, M., van der Veen, C., Necki, J., Bartyzel, J., Szénási, B., Stanisavljević, M., Pison, I., Bousquet, P., and Röckmann, T.: Methane (CH4) sources in Krakow, Poland: insights from isotope analysis, Atmos. Chem. Phys., 21, 13167–13185, https://doi.org/10.5194/acp-21-13167-2021, 2021. a, b, c, d
Menoud, M., van der Veen, C., Lowry, D., Fernandez, J. M., Bakkaloglu, S., France, J. L., Fisher, R. E., Maazallahi, H., Stanisavljević, M., Nęcki, J., Vinkovic, K., Łakomiec, P., Rinne, J., Korbeń, P., Schmidt, M., Defratyka, S., Yver-Kwok, C., Andersen, T., Chen, H., and Röckmann, T.: European Methane Isotope Database Coupled with a Global Inventory of Fossil and Non-Fossil δ13C- and δ2H-CH4 Source Signature Measurements: V2.0.0, Utrecht University [data set], https://doi.org/10.24416/UU01-YP43IN, 2022a. a, b, c
Menoud, M., van der Veen, C., Maazallahi, H., Hensen, A., Velzeboer, I., van den Bulk, P., Delre, A., Korben, P., Schwietzke, S., Ardelean, M., Calcan, A., Etiope, G., Baciu, C., Scheutz, C., Schmidt, M., and Röckmann, T.: CH4 isotopic signatures of emissions from oil and gas extraction sites in Romania, Elementa: Science of the Anthropocene, 10, 00092, https://doi.org/10.1525/elementa.2021.00092, 2022b. a, b, c, d, e
Milkov, A. V. and Etiope, G.: Revised Genetic Diagrams for Natural Gases Based on a Global Dataset of >20,000 Samples, Org. Geochemistry, 125, 109–120, https://doi.org/10.1016/j.orggeochem.2018.09.002, 2018. a, b, c, d, e
Milkov, A. V., Faiz, M., and Etiope, G.: Geochemistry of Shale Gases from around the World: Composition, Origins, Isotope Reversals and Rollovers, and Implications for the Exploration of Shale Plays, Org. Geochemistry, 143, 103997, https://doi.org/10.1016/j.orggeochem.2020.103997, 2020a. a
Milkov, A. V., Schwietzke, S., Allen, G., Sherwood, O. A., and Etiope, G.: Using Global Isotopic Data to Constrain the Role of Shale Gas Production in Recent Increases in Atmospheric Methane, Nat. Sci. Rep., 10, 4199, https://doi.org/10.1038/s41598-020-61035-w, 2020b. a
Miller, J. B. and Tans, P. P.: Calculating Isotopic Fractionation from Atmospheric Measurements at Various Scales, Tellus B, 55, 207–214, https://doi.org/10.3402/tellusb.v55i2.16697, 2003. a
Monteil, G., Houweling, S., Dlugockenky, E. J., Maenhout, G., Vaughn, B. H., White, J. W. C., and Rockmann, T.: Interpreting methane variations in the past two decades using measurements of CH4 mixing ratio and isotopic composition, Atmos. Chem. Phys., 11, 9141–9153, https://doi.org/10.5194/acp-11-9141-2011, 2011. a
Nakagawa, F., Yoshida, N., Sugimoto, A., Wada, E., Yoshioka, T., Ueda, S., and Vijarnsorn, P.: Stable Isotope and Radiocarbon Compositions of Methane Emitted from Tropical Rice Paddies and Swamps in Southern Thailand, Biogeochemistry, 61, 1–19, https://doi.org/10.1023/A:1020270032512, 2002. a
Nakagawa, F., Tsunogai, U., Komatsu, D. D., Yamada, K., Yoshida, N., Moriizumi, J., Nagamine, K., Iida, T., and Ikebe, Y.: Automobile Exhaust as a Source of 13 C- and D-enriched Atmospheric Methane in Urban Areas, Org. Geochemistry, 36, 727–738, https://doi.org/10.1016/j.orggeochem.2005.01.003, 2005. a
Neef, L., van Weele, M., and van Velthoven, P.: Optimal Estimation of the Present-Day Global Methane Budget, Global Biogeochem. Cycles, 24, GB4024, https://doi.org/10.1029/2009GB003661, 2010. a
Nisbet, E. G., Manning, M. R., Dlugokencky, E. J., Fisher, R. E., Lowry, D., Michel, S. E., Myhre, C. L., Platt, S. M., Allen, G., Bousquet, P., Brownlow, R., Cain, M., France, J. L., Hermansen, O., Hossaini, R., Jones, A. E., Levin, I., Manning, A. C., Myhre, G., Pyle, J. A., Vaughn, B. H., Warwick, N. J., and White, J. W. C.: Very Strong Atmospheric Methane Growth in the 4 Years 2014–2017: Implications for the Paris Agreement, Global Biogeochem. Cycles, 33, 318–342, https://doi.org/10.1029/2018GB006009, 2019. a, b
Nisbet, E. G., Fisher, R. E., Lowry, D., France, J. L., Allen, G., Bakkaloglu, S., Broderick, T. J., Cain, M., Coleman, M., Fernandez, J., Forster, G., Griffiths, P. T., Iverach, C. P., Kelly, B. F. J., Manning, M. R., Nisbet-Jones, P. B. R., Pyle, J. A., Townsend-Small, A., al-Shalaan, A., Warwick, N., and Zazzeri, G.: Methane Mitigation: Methods to Reduce Emissions, on the Path to the Paris Agreement, Rev. Geophys., 58, e2019RG000675, https://doi.org/10.1029/2019RG000675, 2020. a
Obersky, L., Rafiee, R., Cabral, A. R., Golding, S. D., and Clarke, W. P.: Methodology to Determine the Extent of Anaerobic Digestion, Composting and CH4 Oxidation in a Landfill Environment, Waste Manage., 76, 364–373, https://doi.org/10.1016/j.wasman.2018.02.029, 2018. a, b
Owen, D. D. R., Shouakar-Stash, O., Morgenstern, U., and Aravena, R.: Thermodynamic and Hydrochemical Controls on CH4 in a Coal Seam Gas and Overlying Alluvial Aquifer: New Insights into CH4 Origins, Sci. Rep.-UK, 6, 32407, https://doi.org/10.1038/srep32407, 2016. a
Pataki, D. E., Ehleringer, J. R., Flanagan, L. B., Yakir, D., Bowling, D. R., Still, C. J., Buchmann, N., Kaplan, J. O., and Berry, J. A.: The Application and Interpretation of Keeling Plots in Terrestrial Carbon Cycle Research, Global Biogeochem. Cycles, 17, 1022, https://doi.org/10.1029/2001GB001850, 2003. a
Phillips, N. G., Ackley, R., Crosson, E. R., Down, A., Hutyra, L. R., Brondfield, M., Karr, J. D., Zhao, K., and Jackson, R. B.: Mapping Urban Pipeline Leaks: Methane Leaks across Boston, Environ. Pollut., 173, 1–4, https://doi.org/10.1016/j.envpol.2012.11.003, 2013. a, b
Popp, T. J., Chanton, J. P., Whiting, G. J., and Grant, N.: Methane Stable Isotope Distribution at a Carex Dominated Fen in North Central Alberta, Global Biogeochem. Cycles, 13, 1063–1077, 1999. a
Quay, P., Stutsman, J., Wilbur, D., Snover, A., Dlugokencky, E., and Brown, T.: The Isotopic Composition of Atmospheric Methane, Global Biogeochem. Cycles, 13, 445–461, https://doi.org/10.1029/1998GB900006, 1999. a
Rella, C. W., Hoffnagle, J., He, Y., and Tajima, S.: Local- and regional-scale measurements of CH4, δ13CH4, and C2H6 in the Uintah Basin using a mobile stable isotope analyzer, Atmos. Meas. Tech., 8, 4539–4559, https://doi.org/10.5194/amt-8-4539-2015, 2015. a
Rice, A. L., Butenhoff, C. L., Teama, D. G., Röger, F. H., Khalil, M. A. K., and Rasmussen, R. A.: Atmospheric Methane Isotopic Record Favors Fossil Sources Flat in 1980s and 1990s with Recent Increase, P. Natl. Acad. Sci. USA, 113, 10791–10796, https://doi.org/10.1073/pnas.1522923113, 2016. a
Rice, D. D. and Claypool, G. E.: Generation, Accumulation, and Resource Potential of Biogenic Gas, Am. Assoc. Pet. Geol. Bull., 65, 1, 1981. a
Rigby, M., Manning, A. J., and Prinn, R. G.: The Value of High-Frequency High-Precision Methane Isotopologue Measurements for Source and Sink Estimation: Methane Isotopologues in Inversions, J. Geophys. Res.-Atmos., 117, 1–14, https://doi.org/10.1029/2011JD017384, 2012. a, b
Röckmann, T. and the The ROMEO team: ROMEO – ROmanian Methane Emissions from Oil and Gas, EGU General Assembly 2020, Online, 4–8 May 2020, EGU2020-18801, https://doi.org/10.5194/egusphere-egu2020-18801, 2020 a
Röckmann, T., Gómez Álvarez, C. X., Walter, S., van der Veen, C., Wollny, A. G., Gunthe, S. S., Helas, G., Pöschl, U., Keppler, F., Greule, M., and Brand, W. A.: Isotopic Composition of H2 from Wood Burning: Dependency on Combustion Efficiency, Moisture Content, and δD of Local Precipitation, J. Geophys. Res., 115, D17308, https://doi.org/10.1029/2009JD013188, 2010. a, b
Röckmann, T., Eyer, S., van der Veen, C., Popa, M. E., Tuzson, B., Monteil, G., Houweling, S., Harris, E., Brunner, D., Fischer, H., Zazzeri, G., Lowry, D., Nisbet, E. G., Brand, W. A., Necki, J. M., Emmenegger, L., and Mohn, J.: In situ observations of the isotopic composition of methane at the Cabauw tall tower site, Atmos. Chem. Phys., 16, 10469–10487, https://doi.org/10.5194/acp-16-10469-2016, 2016. a, b, c, d
Rust, F.: Ruminant Methane δ(13C/12C) Values: Relation to Atmospheric Methane, Science, 211, 1044–1046, https://doi.org/10.1126/science.7466376, 1981. a, b
Rutherford, J. S., Sherwin, E. D., Ravikumar, A. P., Heath, G. A., Englander, J., Cooley, D., Lyon, D., Omara, M., Langfitt, Q., and Brandt, A. R.: Closing the Methane Gap in US Oil and Natural Gas Production Emissions Inventories, Nat. Commun., 12, 4715, https://doi.org/10.1038/s41467-021-25017-4, 2021. a, b
Saunois, M., Stavert, A. R., Poulter, B., Bousquet, P., Canadell, J. G., Jackson, R. B., Raymond, P. A., Dlugokencky, E. J., Houweling, S., Patra, P. K., Ciais, P., Arora, V. K., Bastviken, D., Bergamaschi, P., Blake, D. R., Brailsford, G., Bruhwiler, L., Carlson, K. M., Carrol, M., Castaldi, S., Chandra, N., Crevoisier, C., Crill, P. M., Covey, K., Curry, C. L., Etiope, G., Frankenberg, C., Gedney, N., Hegglin, M. I., Höglund-Isaksson, L., Hugelius, G., Ishizawa, M., Ito, A., Janssens-Maenhout, G., Jensen, K. M., Joos, F., Kleinen, T., Krummel, P. B., Langenfelds, R. L., Laruelle, G. G., Liu, L., Machida, T., Maksyutov, S., McDonald, K. C., McNorton, J., Miller, P. A., Melton, J. R., Morino, I., Müller, J., Murguia-Flores, F., Naik, V., Niwa, Y., Noce, S., O'Doherty, S., Parker, R. J., Peng, C., Peng, S., Peters, G. P., Prigent, C., Prinn, R., Ramonet, M., Regnier, P., Riley, W. J., Rosentreter, J. A., Segers, A., Simpson, I. J., Shi, H., Smith, S. J., Steele, L. P., Thornton, B. F., Tian, H., Tohjima, Y., Tubiello, F. N., Tsuruta, A., Viovy, N., Voulgarakis, A., Weber, T. S., van Weele, M., van der Werf, G. R., Weiss, R. F., Worthy, D., Wunch, D., Yin, Y., Yoshida, Y., Zhang, W., Zhang, Z., Zhao, Y., Zheng, B., Zhu, Q., Zhu, Q., and Zhuang, Q.: The Global Methane Budget 2000–2017, Earth Syst. Sci. Data, 12, 1561–1623, https://doi.org/10.5194/essd-12-1561-2020, 2020. a, b, c
Schaefer, H., Fletcher, S. E. M., Veidt, C., Lassey, K. R., Brailsford, G. W., Bromley, T. M., Dlugokencky, E. J., Michel, S. E., Miller, J. B., Levin, I., Lowe, D. C., Martin, R. J., Vaughn, B. H., and White, J. W. C.: A 21st-Century Shift from Fossil-Fuel to Biogenic Methane Emissions Indicated by 13CH 4, Science, 352, 80–84, https://doi.org/10.1126/science.aad2705, 2016. a, b
Schoell, M.: The Hydrogen and Carbon Isotopic Composition of Methane from Natural Gases of Various Origins, Geochim. Cosmochim. Ac., 44, 649–661, https://doi.org/10.1016/0016-7037(80)90155-6, 1980. a
Schwietzke, S., Sherwood, O. A., Bruhwiler, L. M. P., Miller, J. B., Etiope, G., Dlugokencky, E. J., Michel, S. E., Arling, V. A., Vaughn, B. H., White, J. W. C., and Tans, P. P.: Upward Revision of Global Fossil Fuel Methane Emissions Based on Isotope Database, Nature, 538, 88–91, https://doi.org/10.1038/nature19797, 2016. a, b, c, d, e, f, g
Sherwood, O. A., Schwietzke, S., Arling, V. A., and Etiope, G.: Global Inventory of Gas Geochemistry Data from Fossil Fuel, Microbial and Burning Sources, version 2017, Earth Syst. Sci. Data, 9, 639–656, https://doi.org/10.5194/essd-9-639-2017, 2017. a, b, c, d, e, f, g, h, i, j, k, l, m, n, o, p
Sherwood, O. A., Schwietzke, S., and Lan, X.: Global δ13C-CH4 Source Signature Inventory 2020, Earth System Research Laboratories, https://doi.org/10.15138/qn55-e011, 2021. a, b, c, d, e, f, g, h, i, j, k, l, m, n, o
Shindell, D. T., Fuglestvedt, J. S., and Collins, W. J.: The Social Cost of Methane: Theory and Applications, Faraday Discuss., 200, 429–451, https://doi.org/10.1039/C7FD00009J, 2017. a
Smith, L. K., Lewis Jr., W. M., Chanton, J. P., Cronin, G., and Hamilton, S. K.: Methane Emissions from the Orinoco River Floodplain, Venezuela, Biogeochemistry, 51, 113–140, https://doi.org/10.1023/A:1006443429909, 2000. a, b
Snover, A. K., Quay, P. D., and Hao, W. M.: The D/H Content of Methane Emitted from Biomass Burning, Global Biogeochem. Cycles, 14, 11–24, https://doi.org/10.1029/1999GB900075, 2000. a, b
Stavert, A. R., Saunois, M., Canadell, J. G., Poulter, B., Jackson, R. B., Regnier, P., Lauerwald, R., Raymond, P. A., Allen, G. H., Patra, P. K., Bergamaschi, P., Bousquet, P., Chandra, N., Ciais, P., Gustafson, A., Ishizawa, M., Ito, A., Kleinen, T., Maksyutov, S., McNorton, J., Melton, J. R., Müller, J., Niwa, Y., Peng, S., Riley, W. J., Segers, A., Tian, H., Tsuruta, A., Yin, Y., Zhang, Z., Zheng, B., and Zhuang, Q.: Regional Trends and Drivers of the Global Methane Budget, Global Change Biol., 28, 184–200, https://doi.org/10.1111/gcb.15901, 2021. a, b, c
Stell, A. C., Douglas, P. M. J., Rigby, M., and Ganesan, A. L.: The Impact of Spatially Varying Wetland Source Signatures on the Atmospheric Variability of δD-CH 4, Philos. T. Roy. Soc. A, 379, 20200442, https://doi.org/10.1098/rsta.2020.0442, 2021. a
Stevens, C. M. and Engelkemeir, A.: Stable Carbon Isotopic Composition of Methane from Some Natural and Anthropogenic Sources, J. Geophys. Res., 93, 725, https://doi.org/10.1029/JD093iD01p00725, 1988. a
Stieger, J., Bamberger, I., Siegwolf, R. T. W., Buchmann, N., and Eugster, W.: Source Partitioning of Atmospheric Methane Using Stable Carbon Isotope Measurements in the Reuss Valley, Switzerland, Isot. Environ. Health S., 55, 1–24, https://doi.org/10.1080/10256016.2018.1561448, 2019. a
Sugimoto, A. and Fujita, N.: Hydrogen Concentration and Stable Isotopic Composition of Methane in Bubble Gas Observed in a Natural Wetland, Biogeochemistry, 81, 33–44, https://doi.org/10.1007/s10533-006-9028-4, 2006. a, b
Sugimoto, A. and Wada, E.: Carbon Isotopic Composition of Bacterial Methane in a Soil Incubation Experiment: Contributions of Acetate, Geochim. Cosmochim. Ac., 57, 4015–4027, https://doi.org/10.1016/0016-7037(93)90350-6, 1993. a
Sugimoto, A., Inoue, T., Kirtibutr, N., and Abe, T.: Methane Oxidation by Termite Mounds Estimated by the Carbon Isotopic Composition of Methane, Global Biogeochem. Cycles, 12, 595–605, https://doi.org/10.1029/98GB02266, 1998. a
Szénási, B.: Atmospheric Monitoring of Methane Emissions at the European Scale, PhD thesis, Université Paris-Saclay, 2020. a
Tarasova, O., Brenninkmeijer, C., Assonov, S., Elansky, N., Rockmann, T., and Brass, M.: Atmospheric CH4 along the Trans-Siberian Railroad (TROICA) and River Ob: Source Identification Using Stable Isotope Analysis, Atmos. Environ., 40, 5617–5628, https://doi.org/10.1016/j.atmosenv.2006.04.065, 2006. a
Thompson, R. L., Nisbet, E. G., Pisso, I., Stohl, A., Blake, D., Dlugokencky, E. J., Helmig, D., and White, J. W. C.: Variability in Atmospheric Methane From Fossil Fuel and Microbial Sources Over the Last Three Decades, Geophys. Res. Lett., 45, 11499–11508, https://doi.org/10.1029/2018GL078127, 2018. a, b
Townsend-Small, A., Tyler, S. C., Pataki, D. E., Xu, X., and Christensen, L. E.: Isotopic Measurements of Atmospheric Methane in Los Angeles, California, USA: Influence of “Fugitive” Fossil Fuel Emissions: LOS ANGELES METHANE EMISSIONS, J. Geophys. Res.-Atmos., 117, D07308, https://doi.org/10.1029/2011JD016826, 2012. a, b
Toyoda, S., Suzuki, Y., Hattori, S., Yamada, K., Fujii, A., Yoshida, N., Kouno, R., Murayama, K., and Shiomi, H.: Isotopomer Analysis of Production and Consumption Mechanisms of N2O and CH4 in an Advanced Wastewater Treatment System, Environ. Sci. Technol., 45, 917–922, https://doi.org/10.1021/es102985u, 2011. a, b
Turner, A. J., Frankenberg, C., Wennberg, P. O., and Jacob, D. J.: Ambiguity in the Causes for Decadal Trends in Atmospheric Methane and Hydroxyl, P. Natl. Acad. Sci. USA, 114, 5367–5372, https://doi.org/10.1073/pnas.1616020114, 2017. a
Tyler, S. C., Rice, A. L., and Ajie, H. O.: Stable Isotope Ratios in Atmospheric CH4: Implications for Seasonal Sources and Sinks, J. Geophys. Res., 112, D03303, https://doi.org/10.1029/2006JD007231, 2007. a
Umezawa, T., Aoki, S., Kim, Y., Morimoto, S., and Nakazawa, T.: Carbon and Hydrogen Stable Isotopic Ratios of Methane Emitted from Wetlands and Wildfires in Alaska: Aircraft Observations and Bonfire Experiments, J. Geophys. Res., 116, D15305, https://doi.org/10.1029/2010JD015545, 2011. a, b, c
US Energy Information Administration: International Energy Statistics Database, U.S. Energy Information Administration, https://www.eia.gov/international/data/world (last access: 21 September 2022), 2021. a
Varga, T., Fisher, R. E., France, J. L., Haszpra, L., Jull, A. J. T., Lowry, D., Major, I., Molnár, M., Nisbet, E. G., and László, E.: Identification of Potential Methane Source Regions in Europe Using δ13C Measurements and Trajectory Modeling, J. Geophys. Res.-Atmos., 126, e2020JD033963, https://doi.org/10.1029/2020JD033963, 2021. a
Varon, D. J., McKeever, J., Jervis, D., Maasakkers, J. D., Pandey, S., Houweling, S., Aben, I., Scarpelli, T., and Jacob, D. J.: Satellite Discovery of Anomalously Large Methane Point Sources From Oil/Gas Production, Geophys. Res. Lett., 46, 13507–13516, https://doi.org/10.1029/2019GL083798, 2019. a
Vigano, I., Holzinger, R., Keppler, F., Greule, M., Brand, W., Geilmann, H., van Weelden, H., and Röckmann, T.: Water Drives the Deuterium Content of the Methane Emitted from Plants, Geochim. Cosmochim. Ac., 74, 3865–3873, https://doi.org/10.1016/j.gca.2010.03.030, 2010. a
Wahlen, M., Tanaka, N., Henry, R., Deck, B., Zeglen, J., Vogel, J., Southon, J., Shemesh, A., Fairbanks, R., and Broecker, W.: Carbon-14 in Methane Sources and in Atmospheric Methane: The Contribution from Fossil Carbon, Science, 245, 286–90, https://doi.org/10.1126/science.245.4915.286, 1989. a, b, c
Waldron, S., Watson-Craik, I. A., Hall, A. J., and Fallick, A. E.: The Carbon and Hydrogen Stable Isotope Composition of Bacteriogenic Methane: A Laboratory Study Using a Landfill Inoculum, Geomicrobiol. J., 15, 157–169, https://doi.org/10.1080/01490459809378073, 1998. a
Waldron, S., Lansdown, J., Scott, E., Fallick, A., and Hall, A.: The Global Influence of the Hydrogen Isotope Composition of Water on That of Bacteriogenic Methane from Shallow Freshwater Environments, Geochim. Cosmochim. Ac., 63, 2237–2245, https://doi.org/10.1016/S0016-7037(99)00192-1, 1999. a, b, c
Walter, S., Röckmann, T., and The MEMO2 team: MEMO2: MEthane Goes MObile – MEasurements and MOdelling, in: International Symposium on Non-CO2 Greenhouse Gases (NCGG), Unpublished, Amsterdam, the Netherlands, 2019. a
Warwick, N. J., Cain, M. L., Fisher, R., France, J. L., Lowry, D., Michel, S. E., Nisbet, E. G., Vaughn, B. H., White, J. W. C., and Pyle, J. A.: Using δ13C-CH4 and δD-CH4 to constrain Arctic methane emissions, Atmos. Chem. Phys., 16, 14891–14908, https://doi.org/10.5194/acp-16-14891-2016, 2016. a
Wassmann, R., Thein, U. G., Whiticar, M. J., Rennenburg, H., Seiler, W., and Junk, W. J.: Methane Emissions from the Amazon Floodplain: Characterization of Production and Transport, Global Biogeochem. Cycles, 6, 3–13, https://doi.org/10.1029/91GB01767, 1992. a, b
Whiticar, M. J.: Carbon and Hydrogen Isotope Systematics of Bacterial Formation and Oxidation of Methane, Chem. Geol., 161, 291–314, https://doi.org/10.1016/S0009-2541(99)00092-3, 1999. a
Woltemate, I., Whiticar, M. J., and Schoell, M.: Carbon and Hydrogen Isotopic Composition of Bacterial Methane in a Shallow Freshwater Lake, Limnol. Oceanogr., 29, 985–992, 1984. a
Xueref-Remy, I., Zazzeri, G., Bréon, F., Vogel, F., Ciais, P., Lowry, D., and Nisbet, E.: Anthropogenic Methane Plume Detection from Point Sources in the Paris Megacity Area and Characterization of Their δ13C Signature, Atmos. Environ., 222, 117055, https://doi.org/10.1016/j.atmosenv.2019.117055, 2020. a, b, c, d
Zavala-Araiza, D., Lyon, D. R., Alvarez, R. A., Davis, K. J., Harriss, R., Herndon, S. C., Karion, A., Kort, E. A., Lamb, B. K., Lan, X., Marchese, A. J., Pacala, S. W., Robinson, A. L., Shepson, P. B., Sweeney, C., Talbot, R., Townsend-Small, A., Yacovitch, T. I., Zimmerle, D. J., and Hamburg, S. P.: Reconciling Divergent Estimates of Oil and Gas Methane Emissions, P. Natl. Acad. Sci. USA, 112, 15597–15602, https://doi.org/10.1073/pnas.1522126112, 2015. a, b
Zavala-Araiza, D., Omara, M., Gautam, R., Smith, M. L., Pandey, S., Aben, I., Almanza-Veloz, V., Conley, S., Houweling, S., Kort, E. A., Maasakkers, J. D., Molina, L. T., Pusuluri, A., Scarpelli, T., Schwietzke, S., Shen, L., Zavala, M., and Hamburg, S. P.: A Tale of Two Regions: Methane Emissions from Oil and Gas Production in Offshore/Onshore Mexico, Environ. Res. Lett., 16, 024019, https://doi.org/10.1088/1748-9326/abceeb, 2021. a
Zazzeri, G., Lowry, D., Fisher, R., France, J., Lanoisellé, M., and Nisbet, E.: Plume Mapping and Isotopic Characterisation of Anthropogenic Methane Sources, Atmos. Environ., 110, 151–162, https://doi.org/10.1016/j.atmosenv.2015.03.029, 2015. a
Zazzeri, G., Lowry, D., Fisher, R. E., France, J. L., Lanoisellé, M., Kelly, B. F. J., Necki, J. M., Iverach, C. P., Ginty, E., Zimnoch, M., Jasek, A., and Nisbet, E. G.: Carbon isotopic signature of coal-derived methane emissions to the atmosphere: from coalification to alteration, Atmos. Chem. Phys., 16, 13669–13680, https://doi.org/10.5194/acp-16-13669-2016, 2016. a
Zazzeri, G., Lowry, D., Fisher, R. E., France, J. L., Lanoisellé, M., Grimmond, C. S. B., and Nisbet, E. G.: Evaluating Methane Inventories by Isotopic Analysis in the London Region, Sci. Rep.-UK, 7, 4854, https://doi.org/10.1038/s41598-017-04802-6, 2017. a, b, c
Zobitz, J., Keener, J., Schnyder, H., and Bowling, D.: Sensitivity Analysis and Quantification of Uncertainty for Isotopic Mixing Relationships in Carbon Cycle Research, Agric. Forest Meteorol., 136, 56–75, https://doi.org/10.1016/j.agrformet.2006.01.003, 2006. a
Marie Skłodowska-Curie Actions, Horizon 2020 Innovative Training Networks founded under the grant agreement no. 722479: https://cordis.europa.eu/project/id/722479 (last access: 21 September 2022)
Carbon dioxide and Methane mission, May–June 2018
ROmanian Methane Emissions from Oil & gas, October 2019
European Commission, Joint Research Centre (EC–JRC)/Netherlands Environmental Assessment Agency (PBL), May 2021. Emissions Database for Global Atmospheric Research (EDGAR).
Relative weights of 0.66 for conventional fuels (oil and natural gas) and 0.34 for coal. Emission data from Saunois et al. (2020).