the Creative Commons Attribution 4.0 License.
the Creative Commons Attribution 4.0 License.
 | 22 Sep 2022
A global marine particle size distribution dataset obtained with the Underwater Vision Profiler 5
Marc Picheral
David Antoine
Marcel Babin
Léo Berline
Tristan Biard
Emmanuel Boss
Peter Brandt
Francois Carlotti
Svenja Christiansen
Laurent Coppola
Leandro de la Cruz
Emilie Diamond-Riquier
Xavier Durrieu de Madron
Amanda Elineau
Gabriel Gorsky
Lionel Guidi
Helena Hauss
Jean-Olivier Irisson
Lee Karp-Boss
Johannes Karstensen
Dong-gyun Kim
Rachel M. Lekanoff
Fabien Lombard
Rubens M. Lopes
Claudie Marec
Andrew M. P. McDonnell
Daniela Niemeyer
Margaux Noyon
Stephanie H. O'Daly
Mark D. Ohman
Jessica L. Pretty
Andreas Rogge
Sarah Searson
Masashi Shibata
Yuji Tanaka
Toste Tanhua
Jan Taucher
Emilia Trudnowska
Jessica S. Turner
Anya Waite
Lars Stemmann
Marine particles of different nature are found throughout the global ocean. The term “marine particles” describes detritus aggregates and fecal pellets as well as bacterioplankton, phytoplankton, zooplankton and nekton. Here, we present a global particle size distribution dataset obtained with several Underwater Vision Profiler 5 (UVP5) camera systems. Overall, within the 64 µm to about 50 mm size range covered by the UVP5, detrital particles are the most abundant component of all marine particles; thus, measurements of the particle size distribution with the UVP5 can yield important information on detrital particle dynamics. During deployment, which is possible down to 6000 m depth, the UVP5 images a volume of about 1 L at a frequency of 6 to 20 Hz. Each image is segmented in real time, and size measurements of particles are automatically stored. All UVP5 units used to generate the dataset presented here were inter-calibrated using a UVP5 high-definition unit as reference. Our consistent particle size distribution dataset contains 8805 vertical profiles collected between 19 June 2008 and 23 November 2020. All major ocean basins, as well as the Mediterranean Sea and the Baltic Sea, were sampled. A total of 19 % of all profiles had a maximum sampling depth shallower than 200 dbar, 38 % sampled at least the upper 1000 dbar depth range and 11 % went down to at least 3000 dbar depth. First analysis of the particle size distribution dataset shows that particle abundance is found to be high at high latitudes and in coastal areas where surface productivity or continental inputs are elevated. The lowest values are found in the deep ocean and in the oceanic gyres. Our dataset should be valuable for more in-depth studies that focus on the analysis of regional, temporal and global patterns of particle size distribution and flux as well as for the development and adjustment of regional and global biogeochemical models. The marine particle size distribution dataset (Kiko et al., 2021) is available at https://doi.org/10.1594/PANGAEA.924375.
- Article
(6085 KB) - Full-text XML
- BibTeX
- EndNote


1.1 Nature and origin of marine particles
Bacterioplankton, phytoplankton and zooplankton; nekton; aggregates; marine snow; fecal pellets; biomineralized shells; mineral dust; precipitates; suspended clay; and, nowadays, also plastics are part of the general marine particle size spectrum (Sheldon and Parsons, 1967; Stemmann and Boss, 2012; Cózar et al., 2014). The relative contribution of living particles to the total load of particles is not well known and may vary from 1 % to 50 % according to the particle size range and the marine ecosystem investigated (Forest et al., 2012; Stemmann and Boss, 2012; Checkley et al., 2008). Abiotic particles can originate from resuspension at the seabed (Puig et al., 2013; McCave, 2009, 1986; Honjo et al., 1984), dust deposition (Zuniga et al., 2008; Ratmeyer et al., 1999), and influx by rivers (Ludwig and Probst, 1998) and glaciers (Neal et al., 2010). Furthermore, dissolved constituents precipitate when river water (Many et al., 2019) or hydrothermal fluids (German and Von Damm, 2003) mix with seawater. Photosynthesis by planktonic algae is the almost exclusive source of biogenic carbon in the open ocean, although other processes, such as carbon fixation by chemoautotrophs, benthic algae and seagrass as well as land- and river-derived organic particles, add to this as well (see e.g. Duarte et al., 2010; Ludwig and Probst, 1998). Higher trophic levels consume this biogenic carbon to build up biomass and fuel physiological activity. Along the entire plankton trophic web, part of the consumed carbon is also transformed into detritus (fecal pellets, exuviae, discarded houses or dead bodies). Small particles such as phytoplankton cells can also coagulate to form larger aggregates, which might also include other detrital particles (Jackson, 1990). The two pathways lead to the formation of detrital particles that have different sinking properties depending on their size, content and porosity (Stemmann et al., 2004). As particle size is an essential trait for many biotic and abiotic interactions, it is often used to develop and calibrate size-resolved mechanistic models of phytoplankton bloom formation, particle coagulation and export to the mesopelagic zone (Stemmann et al., 2004; Jouandet et al., 2014; Bianchi et al., 2018). Moreover, the size structure of particles and plankton is one of the most relevant indicators of ecosystem functionality and energy fluxes (Jackson, 1990; Zhou, 2006; Stemmann and Boss, 2012). How abiotic and biotic marine particles of different sizes are formed, destroyed, advected or sink are key questions in ocean carbon cycling and biogeochemistry (Stemmann et al., 2012; Boyd et al., 2019; Giering et al., 2020); therefore, their quantitative monitoring is needed.
1.2 Marine particle imaging
Many phytoplankton and zooplankton organisms as well as some other particles are sturdy and can be sampled using nets, traps, sediment traps, bottles and in situ filtration devices. Fragile particles, often formed by the aggregation of diverse source particles (e.g. dead cells, fecal pellets, exudates and minerals), called “Marine snow” (Beebe, 1931) and fragile zooplankton such as cnidarians, rhizarians and other gelatinous organisms are, however, not amenable to such sampling methods (O'Hern et al., 1988; Alldredge and Silver, 1988; Wiebe and Benfield, 2003; Remsen et al., 2004). Therefore, only in situ measurements allow for a realistic assessment of the size and abundance of marine particles (Alldredge and Silver, 1988). The earliest such measurements were made from moored platforms, submersibles or by divers, and they included the analysis of photographic images (Suzuki and Kato, 1953; Alldredge and Gotschalk, 1988). Advancement in electronic components and digital processing routines then allowed for the development of instruments such as the optical plankton counter (Herman, 1992), holographic instruments (Katz et al., 1999) and various camera systems (Asper, 1987; Honjo et al., 1984; Lampitt et al., 1993; Ratmeyer and Wefer, 1996; Benfield et al., 2007). Among them, the Underwater Vision Profiler (UVP) (Gorsky et al., 2000; Picheral et al., 2010) was designed to automatically size and count undisturbed abiotic and biotic marine particles.
1.3 The Underwater Vision Profiler and its use
The UVP was developed at the Laboratoire d'Océanographie de Villefranche-sur-Mer (LOV) to provide consistent measurements of particle abundance and size. Single units of UVP versions 1 to 4 were produced from 1991 to 2008 (Gorsky et al., 2000, 2002). The first prototype (serial number 000) of version 5 started field operations in 2008 and was described in detail by Picheral et al. (2010). The instrument was commercialized in 2010 and produced until 2021. A standard (STD) version with a 1.3 megapixel greyscale camera was produced between 2008 and 2016 (serial numbers 000 to 011), and a high-definition (HD) version with a 4 megapixel greyscale camera was produced between 2016 and 2021 (serial numbers 200 to 223). The smaller and more versatile UVP6 (Picheral et al., 2022) has been commercially available since 2019. Using the standard settings, the UVP5 images a volume of about 1 L at a frequency of 6 to 20 Hz and can be deployed down to 6000 m depth. Particles on each image are automatically sized. Further data processing of all particles allows for the calculation of the particle size distribution – the particle abundance or biovolume in increasing size intervals. The UVP5 STD version covers the size range from 102 µm to ∼50 mm ESD (where ESD denotes the equivalent spherical diameter), whereas the HD version covers the size range from 64 µm to ∼50 mm ESD. Via a reduction in the distance between the LED lights and the camera, the resolution can be further increased, but the imaged volume is then reduced. Inter-calibrated UVP5 units are globally in use by several teams. As the UVP5 is mostly integrated in the CTD (conductivity, temperature and depth) rosette and has its own pressure sensor, the fine-scale vertical distribution of particles and major plankton groups can be related to environmental data obtained with other sensors mounted on the CTD rosette. Most efforts regarding the analyses of UVP particle size spectra (including data from earlier versions such as the UVP4) have been focused on the estimation of particle biomass and flux by comparing them with particulate organic carbon (POC) collected in sediment traps or Niskin bottles (e.g. Guidi et al., 2008b, 2015; Kiko et al., 2017; Stemmann et al., 2002, 2008a). Particle abundance data have also been used to estimate aerobic (Kalvelage et al., 2015; Thomsen et al., 2019) and anaerobic respiration (Bianchi et al., 2018; Karthäuser et al., 2021), to inform model development (Bianchi et al., 2018; Stemmann et al., 2004; Jouandet et al., 2014), or to calibrate biogeochemical models (Niemeyer, 2020). Changes in the particle distribution have been related to physical processes such as transport along continental margins (Stemmann et al., 2008b; Forest et al., 2013; de Madron et al., 1999), deep resuspension (Puig et al., 2013; de Madron et al., 2017) and mesoscale processes (Waite et al., 2016; Fiedler et al., 2016; Stemmann et al., 2008b; Guidi et al., 2012). Profound changes in bacterial activity at oxygen minimum zone boundaries (Roullier et al., 2014) have been related to enhanced particle abundance. Likewise, the importance of phytoplankton (Stemmann et al., 2002; Guidi et al., 2009) and zooplankton (Hauss et al., 2016; Christiansen et al., 2018; Stemmann et al., 2004) interactions with particles have been assessed, and the introduction of particles at depth via zooplankton diel vertical migration have been reported (Kiko et al., 2017, 2020; Stemmann et al., 2000). In recent years, image analysis of large objects has been performed, and plankton organisms have been discriminated from the detrital and abiotic particles in subsets of the dataset presented here, allowing the study of large plankton communities (Forest et al., 2012), the biogeography of specific taxa (Christiansen et al., 2018; Biard et al., 2016), zooplankton functional traits (Vilgrain et al., 2021) and particle types (Trudnowska et al., 2021).
1.4 The global marine particle size distribution dataset
Here, we provide a dataset that was obtained with several inter-calibrated UVP5 units operated by different laboratories and during different cruises and projects around the world (Table 1). This international, collaborative effort resulted in a consistent, inter-calibrated global marine particle size distribution database that contains 8805 particle abundance and biovolume profiles obtained in all major oceans and several marginal seas since 2008. We provide further details about the UVP5, the inter-calibration and quality control procedures, and the dataset structure in Sect. 2. The summarizing statistics, maps on data distribution, a description of global particle distribution, and recommendations for use and further growth of the dataset are provided in Sect. 3.
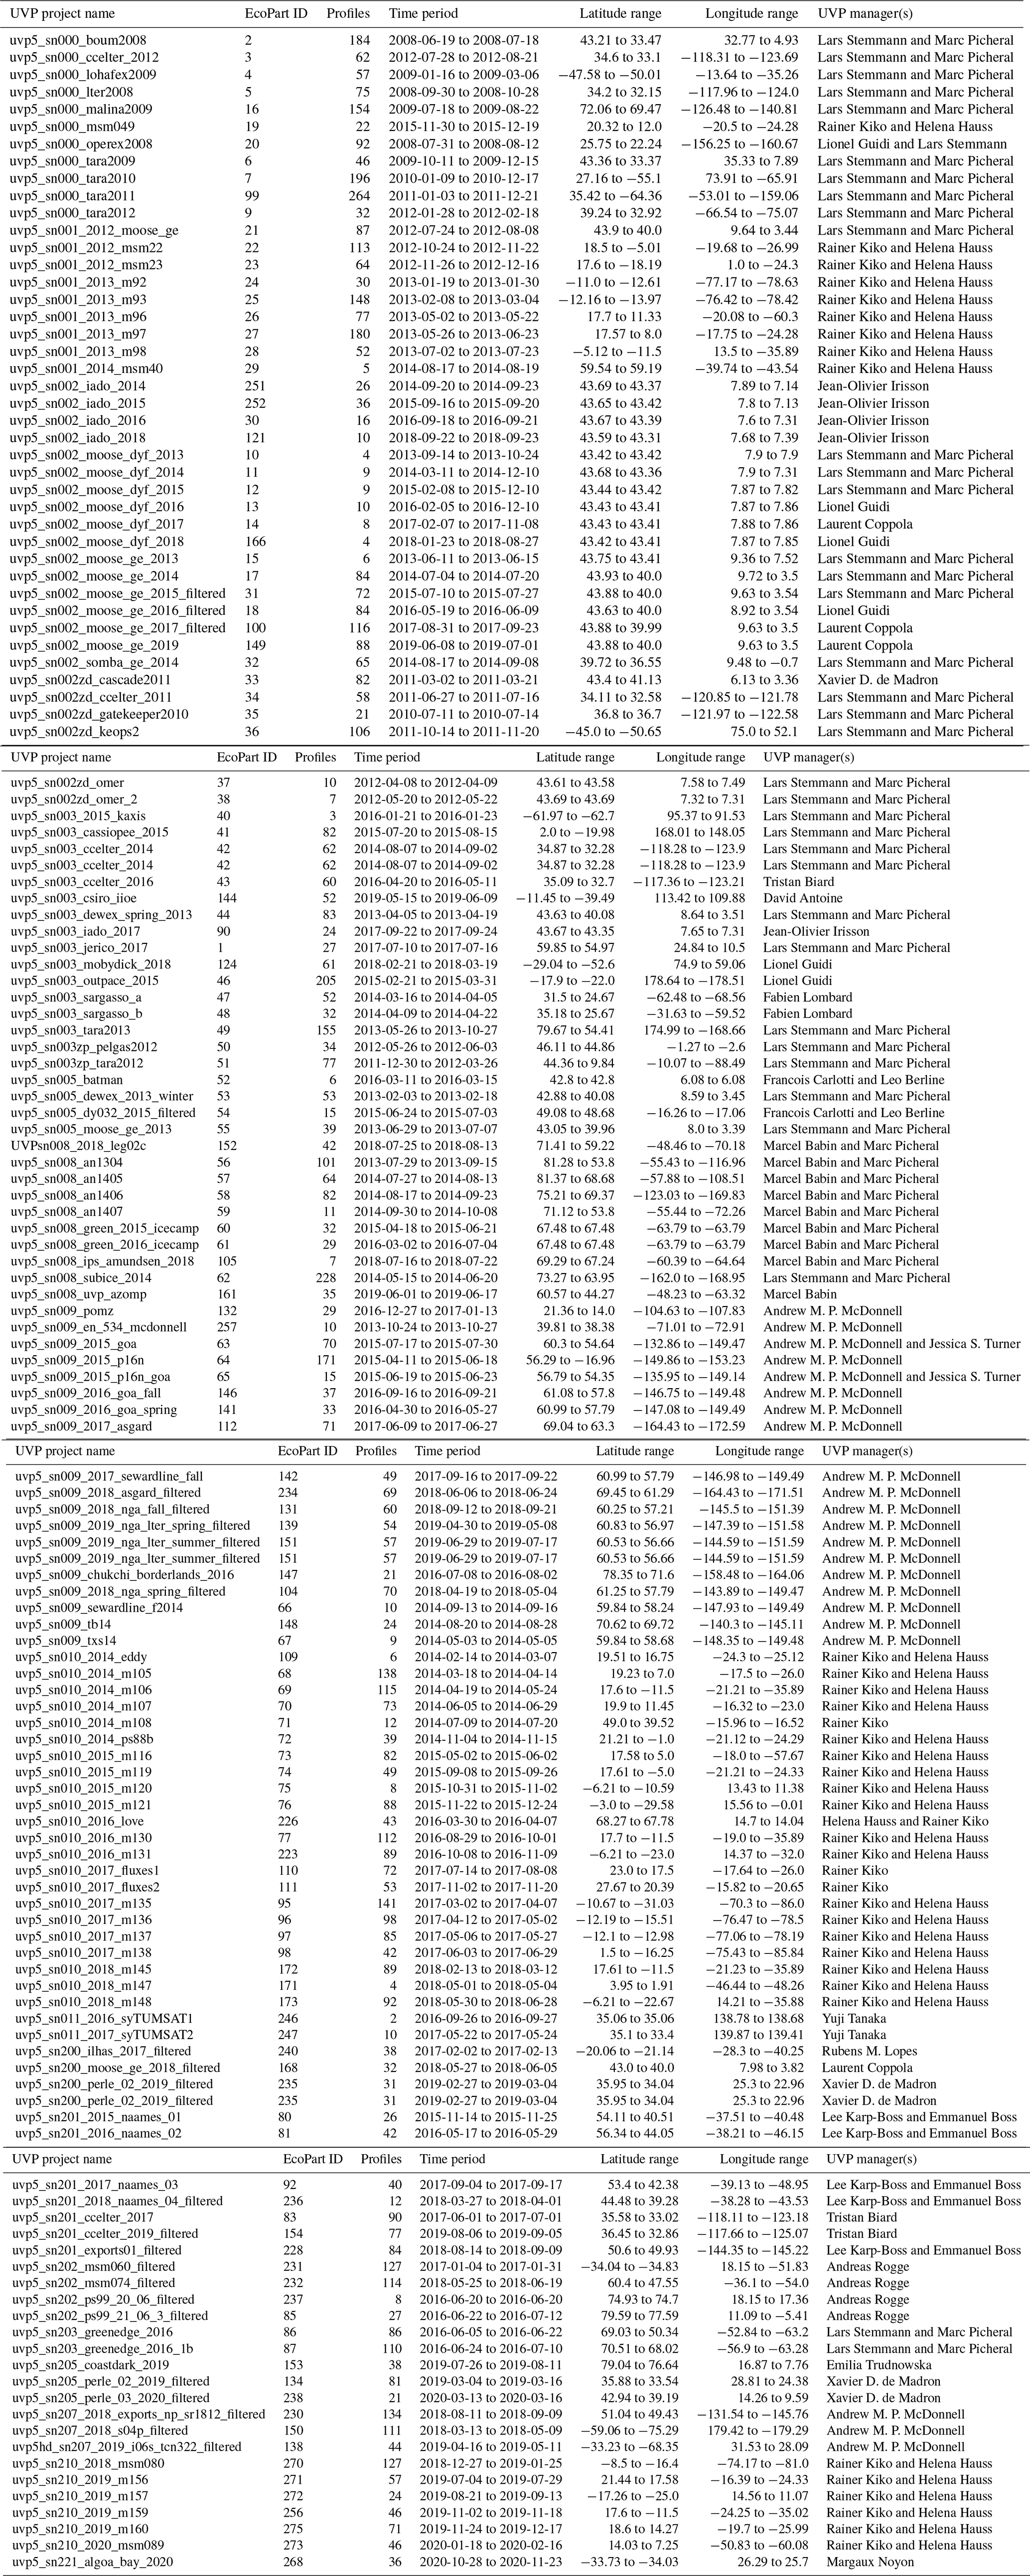
Table 1Geospatial information for UVP projects. Please note that latitude and longitude values in the table were automatically rounded to one significant figure if the second significant figure was zero.
2.1 UVP5 description
The UVP5 consists of one downward-facing camera in a titanium pressure case and two sets of red LED lights that illuminate a 0.88–1.16 L water volume (Picheral et al., 2010). The imaged volume depends on the actual instrument set-up and was determined experimentally for each set-up. During deployment – usually during the downcast of a CTD profile – the UVP5 takes 5–20 pictures of the illuminated volume of water per second. The particles in each image are counted and sized immediately, and the data are stored in the instrument. Particle area is measured as the number of pixels (Sp) of an imaged object and can be converted to particle cross-sectional area (Sm) in square millimetres (mm2) as follows: . Here, Aa represents the area of one pixel in square millimetres (mm2), and Exp is a dimensionless adjustment factor. Aa and Exp need to be calibrated experimentally. To conduct the initial calibration for the dataset provided here, natural plankton and particle objects from the Bay of Villefranche-sur-Mer, France, were imaged in an aquarium with the UVP5 HD serial number 203 and using a stereo microscope during experiments conducted in fall 2016. Optimal values for the parameters Aa and Exp were obtained by minimizing ΔS, which is defined as follows:
where is the surface area (in pixels) of object i as seen by the UVP, and is the surface area (in mm2) of the same object i measured under the stereomicroscope. The minimization was performed using the Nelder–Mead simplex algorithm (implemented in the MATLAB fminsearch function). For this calibration experiment, an Aa of 0.0036 mm2 (interquartile range of −0.0002 to 0.0074 mm2), an Exp of 1.149 (interquartile range of 1.016 to 1.282) and an r2 of 0.88 were found. Further details regarding the initial calibration procedure for the UVP5 SD version that was also applied to obtain the UVP5 HD calibration coefficients are given in Picheral et al. (2010).
2.2 Instrument inter-calibration
As several UVP5 units were produced, an inter-calibration procedure was developed to allow the comparability of data from these units. The inter-calibration procedure is based on a comparison between one or several reference units (in particular serial numbers 002 and 203) and the units to be calibrated. The imaged volume of each unit is determined before the instruments are deployed simultaneously at sea, on the same instrument carrier, and the normalized size spectra are calculated. These operations have been performed in the Mediterranean Sea off Nice, France, since 2008. Figure 1a shows an example of raw data from a parallel deployment of a reference unit (serial number 002) and a unit under calibration (serial number 200). The Aa and Exp of the serial number 200 are then adjusted so that the normalized size spectra of both units coincide after post-processing (Fig. 1b). The reference units were regularly inter-calibrated against each other to check for possible drifts and improved data consistency. The development of the HD version of the UVP5 in 2016 required a revision of the UVP5 inter-calibration procedure, as the pixel resolution had changed (Picheral et al., 2010). The calibration obtained for the serial number 203 HD unit in fall 2016 was propagated to several STD model reference units via simultaneous deployment at sea and the subsequent calculation of correction factors. Thereafter, the corrections obtained for the reference units were digitally propagated to all previously used UVP5 units by reanalysing the earlier calibration experiment data. How the uncertainties of the initial calibration of the serial number 203 HD model propagate to the other UVP5 units and if these uncertainties can be reduced require further investigation.
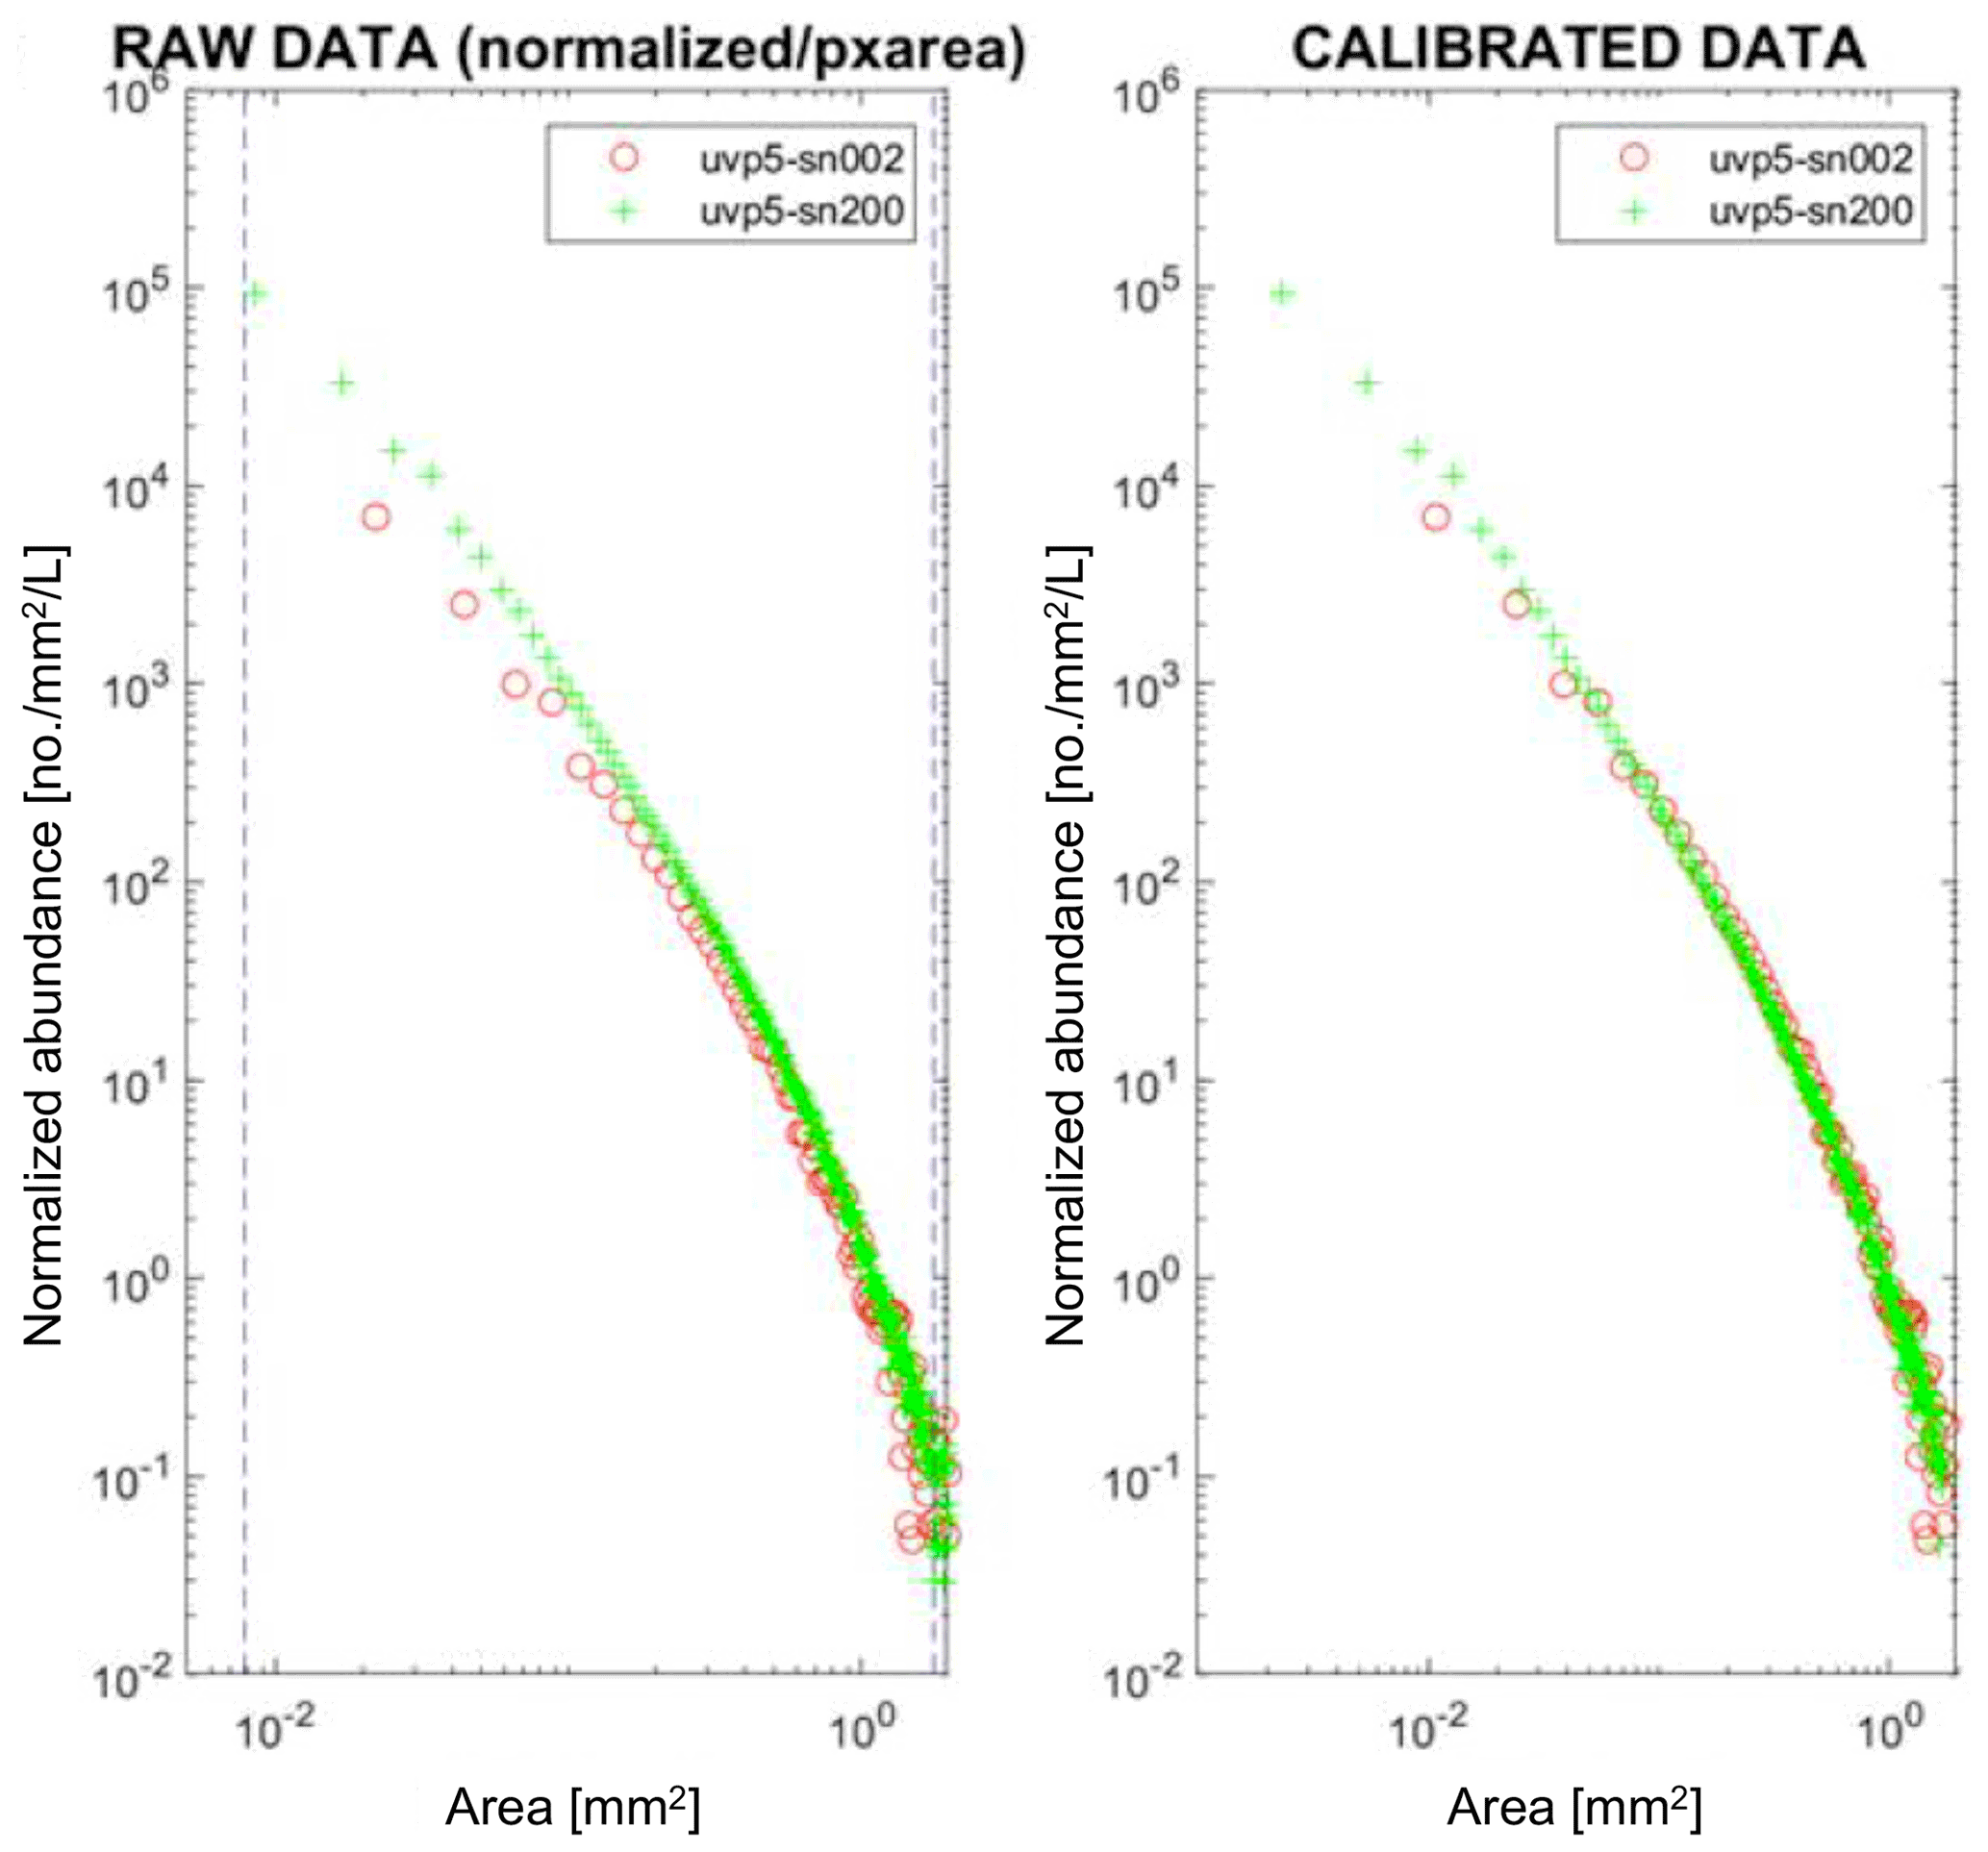
Figure 1The UVP5 inter-calibration procedure based on the normalized size spectrum. To calculate the normalized size spectrum, the abundance of particles in a given size class is divided by the mean area of the size class. The normalized abundance of each size class is then plotted against the area of the size class. Panel (a) shows the raw number size spectrum data of the unit to be adjusted (serial number 200) for one exemplary inter-calibration experiment against serial number 002, and panel (b) shows the respective data after the adjustment of the parameters Aa and Exp to coincide better with the number size spectrum of UVP5 serial number 002.
2.3 Data collection, processing, quality control and dataset description
Metadata (position and time) of each profile collected in the presented dataset were checked by the respective data owners. All instrument settings and calibration coefficients for all cruises and projects were checked and, if necessary, corrected to match the HD inter-calibration results using automatic routines. Data from all cruises were then reprocessed using Zooprocess (https://sites.google.com/view/piqv/softwares/uvp5, last access: 1 September 2022) to obtain a coherent and inter-calibrated dataset, based on the HD inter-calibration conducted in fall 2016. For easier access and preliminary sharing, the data were then uploaded to EcoPart (http://ecopart.obs-vlfr.fr, last access: 1 September 2022). To enable the data to be archived at PANGAEA, they were directly downloaded from the EcoPart SQL (Structured Query Language) database using a dedicated Python script and separated into 3-year splits to obtain smaller file sizes and to enable the subsequent addition of further data.
During processing, the silhouette area of each particle is calculated (as described above) and then converted to an equivalent spherical diameter (ESD) according to . Biovolume is calculated assuming a spherical particle using the following expression: . Particles in a certain size class (e.g. ESD of 0.0403–0.0508 mm) and within a 5 dbar depth range are then counted and divided by the total observed volume to yield the particle abundance (particles L−1) in this size and depth interval. Likewise, the biovolume of individual particles is added up and divided by the observed volume to yield the biovolume in cubic millimetres per litre (mm3 L−1). Size class bins are evenly spaced on a natural logarithmic scale, starting at 0.001 mm and ending at 26 mm, with a total of 45 size bins. Hence, the size class bin width increases with size in a logarithmic fashion. Due to the detection limits of the UVP5, size class bins smaller than 0.0403 mm ESD are empty and not reported, and the largest size bin covers the size range from 20.6 to 26 mm ESD. The particle abundance and biovolume of particles with an ESD>26 mm are also provided as an additional value. Data in this form are available on the EcoPart server. Quality-checked data were downloaded from the server on 26 May 2021 and submitted to PANGAEA. A final update of the dataset was conducted on the 15 February 2022. Apart from the particle abundance and biovolume in different size classes, the dataset contains the cruise ID, the EcoPart project identifier (integer), the profile identifier, the filename of the raw file, the filename of an accompanying CTD profile (if this exists), latitude and longitude (both in decimals), date and time (in UTC), an EcoPart internal station identifier (integer), the depth (in dbar; indicated via the middle value of the 5 dbar depth bin), and the observed volume per depth bin (in L). The particle size distribution data reported are inclusive of all living and non-living particles across the size range of detection. The dataset (available at https://doi.org/10.1594/PANGAEA.924375; Kiko et al., 2021) contains all individual profile data. Moreover, along with the dataset presented here, the values of Aa, Exp, the imaged volume for each data acquisition, links to CTD data and other metadata are archived at PANGAEA in the “Metadata collection for a global marine particle size distribution dataset obtained with the Underwater Vision Profiler 5”.
Users of this dataset need to be aware that we provide the data “as is”, aggregated in 5 dbar depth bins. The particle size that can be quantified reliably with the UVP is limited at the lower end by the optical resolution of the camera and at the upper end by the imaged volume. The optical resolution differs between the different UVP units used. In most cases, the lower size limit is at 0.102 mm (UVP5 SD) or 0.064 mm (UVP5 HD) ESD, and it is sometimes also higher, i.e. 0.203 or 0.256 mm ESD, for early SD deployments. Moreover, several datasets exist that have a lower limit of 0.0403 mm ESD. In these cases, the distance of the camera system to the illuminated field was reduced to increase the image resolution. Projects with project IDs from 33 to 38 (uvp5_sn002zd_cascade2011, uvp5_sn002zd_ccelter_2011, uvp5_sn002zd_gatekeeper2010, uvp5_sn002zd_keops2, uvp5_sn002zd_keops2, uvp5_sn002zd_omer, and uvp5_sn002zd_omer_2) and from 50 to 51 (uvp5_sn003zp_pelgas2012 and uvp5_sn003zp_tara2012) are concerned. In these cases, the imaged volume was reduced to 0.48 or 0.37 L respectively. We would like to note that many UVP users do not use the first bin or even the first two or three bins of the size distribution of a given dataset in their analyses, as the particle size estimates at the lower resolution limit only rely on very few image pixels and, therefore, might be less reliable or noisy. The lower limit can be identified by computing a size spectrum with all depth bins of the profile or with the entire project dataset included. The bin where the differential particle size distribution peaks then represents the limit below which data should be considered as not quantitative. To yield better count statistics at the upper end of the size distribution, UVP users often also combine abundance or biovolume estimates from several depth bins. This is not only possible for the abundance estimates but also for the biovolume estimates, as the reported biovolumes are the sum of the individual spherical volumes computed from each particle. The aggregation of depth bins leads to a loss of depth resolution, but it increases the reliability of the count statistics, especially at the upper end of the size spectrum where particles are rare. To further define the upper limit of the size spectrum, one could also set the abundance and biovolume estimate to “nan” (not a number) if only one particle was observed in the aggregated volume. The count of particles per size bin can be computed by multiplying the particle abundance and observed volume. The reader is also referred to Bisson et al. (2021) for a more in-depth analysis of the impact of count statistics on the estimation of particle abundance and particle flux. Their analysis shows that uncertainties in particle count statistics lead to an approximately 2-fold uncertainty in resulting particle flux estimates. Overall, we recommend careful consideration of the size range to be analysed for each individual cruise or project, as the instruments used and their settings differ, which can lead to different count statistics at the lower and upper ends of the size spectrum.
To enable visualization within this article, we aggregated particle abundance, as in Kiko et al. (2017), into micrometric (MiP; 0.14 to 0.53 mm ESD) and macroscopic (MaP; 0.53 to 16.88 mm ESD) particles. We also calculated the slope k of the differential particle size distribution (PSD) as a descriptor of the relationship between particle abundance and size (Stemmann and Boss, 2012). This relationship is generally approximated by a two-parameter power-law function: , where b and k are constants, and D is the mean particle diameter for a given diameter range. The differential particle abundance N can be calculated as the total number of objects per unit volume in the given diameter range (e.g. 0.203–0.256 mm) divided by the diameter range (in this case 0.053 mm), and it is given as the number of particles per volume per size. To obtain an estimate of k, which is also referred to as the slope of the PSD, one can then conduct a linear regression of log (N) vs. log (D) as follows: . The slope k of the PSD is calculated for the size range from 0.203 to 2.05 mm, as this is the size range where the slope is mostly linear. The slope k is only considered if the p value of the regression is <0.05, otherwise the value is set to “nan”.
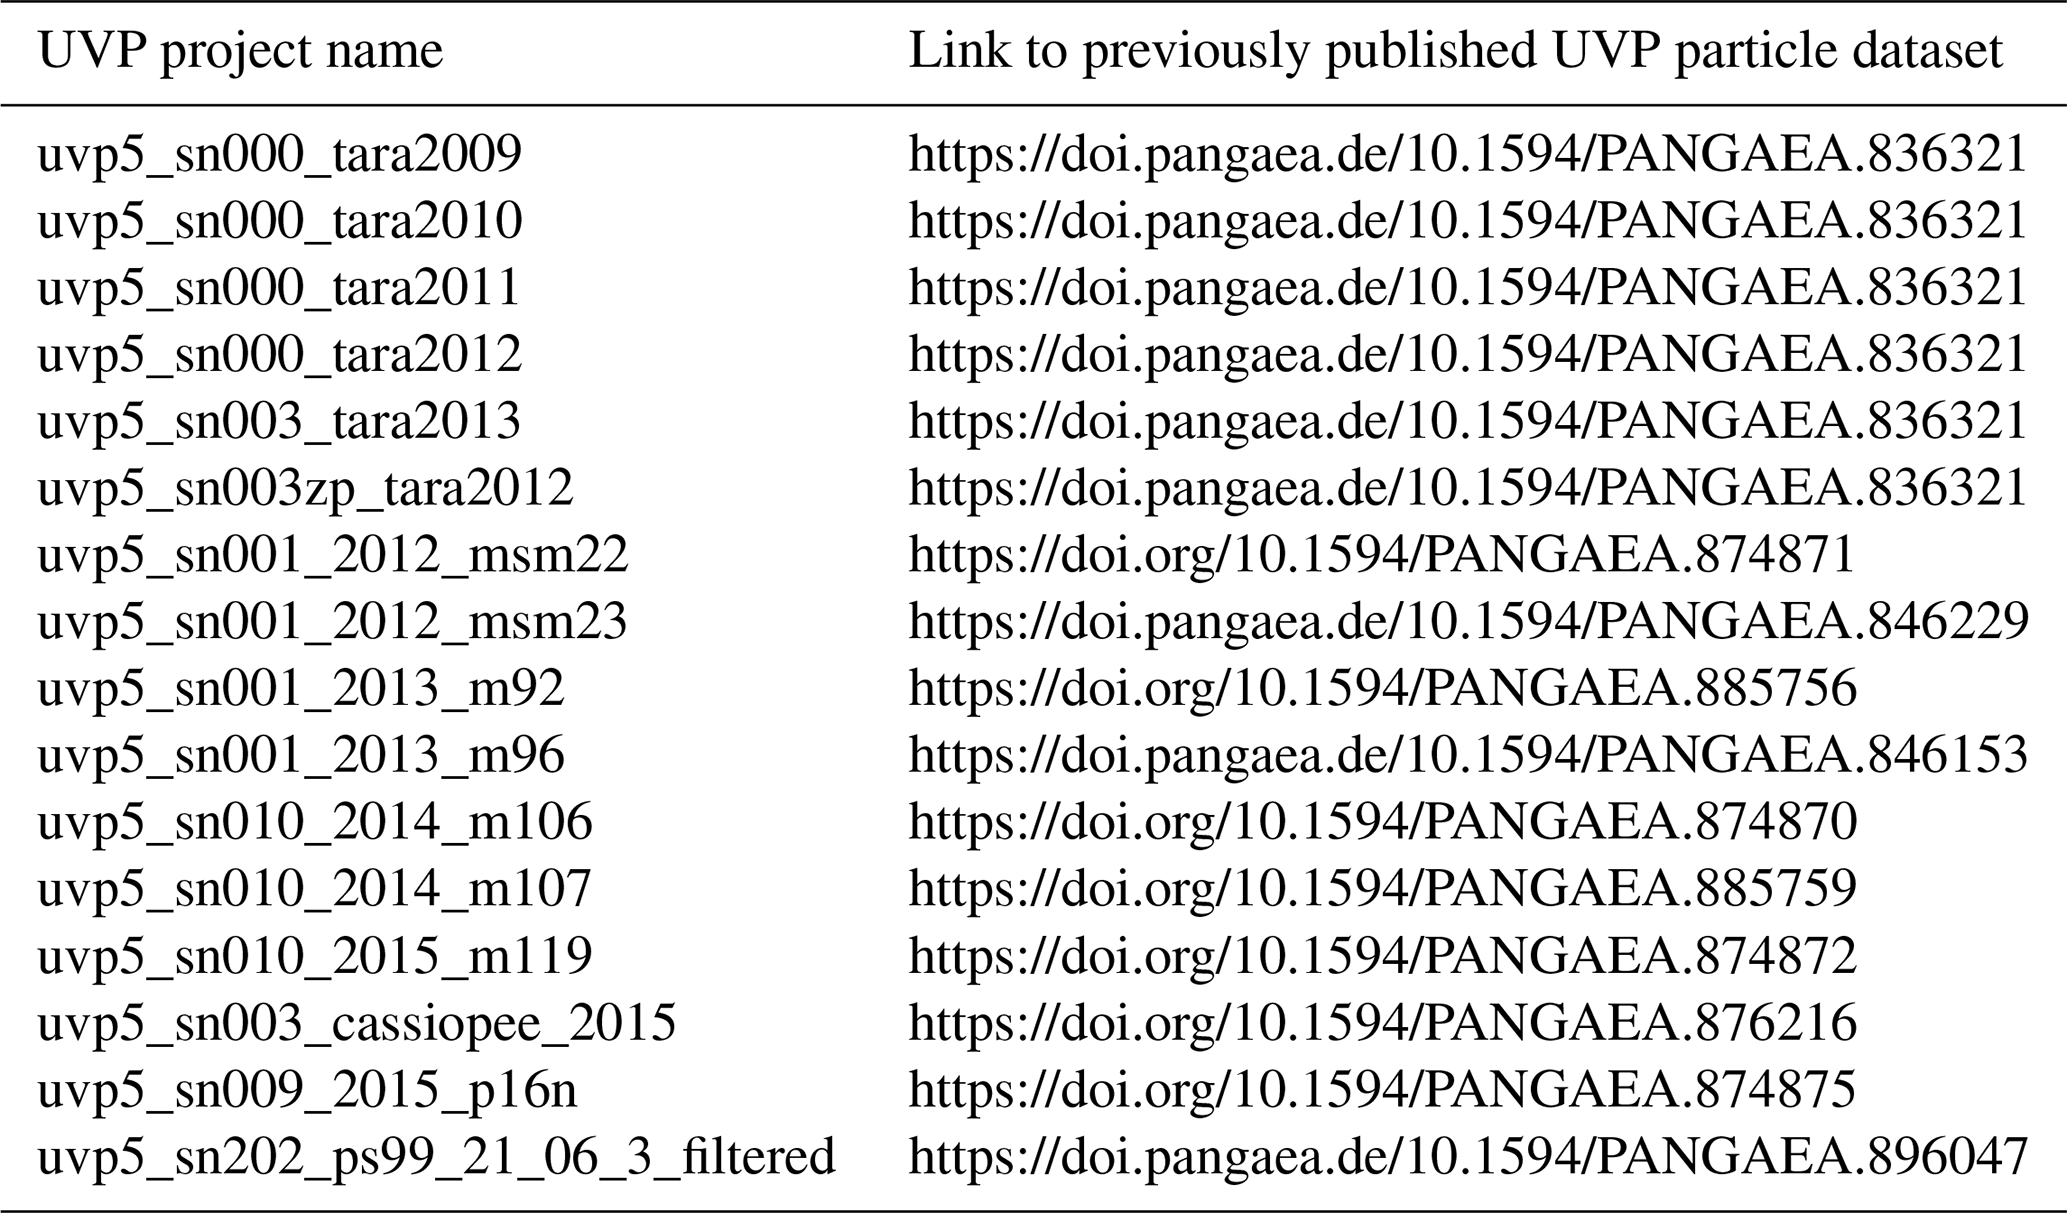
Existing published datasets (Table 2) use different calibration coefficients that are not consistent with the HD inter-calibration procedure; therefore, differences may arise when comparing the different dataset versions. As an example, we calculated the abundances of two size classes and spectral slopes using the datasets from the RV Maria S. Merian cruise MSM23 and several RV Meteor cruises. MiP abundances are 4.2 (median; interquartile range of 3.8–4.7) times larger with the new calibration factors, whereas MaP abundances are 1.5 (median; interquartile range of 1.2–2.0) times larger. Estimates of the slope k of the PSD are 1.09 (median; interquartile range of 1.05–1.12) times larger. These factors were calculated using the datasets from RV Maria S. Merian cruise MSM23 and RV Meteor cruises M92, M96 and M107 for which archived datasets with the relevant data exist. In our view, these changes are related to the increased resolution of the HD version (compared with the SD version) that enabled us to better quantify small particles during the initial laboratory calibration experiment for UVP5 HD serial number 203. This improved calibration was then propagated to all other units and superseded the earlier calibration experiment done with a SD unit.
Table 2References for datasets published before the revision of the inter-calibration procedure.
We do not distinguish UVP5 particle data into distinct categories, such as copepods, aggregates, fecal pellets, or other taxonomic or morphologic classes. For UVP5 data, this is possible for objects >1 mm ESD, as the UVP5 also retrieves “vignettes” – small thumbnail images of respective regions of interest. Homogeneous identification of these vignettes among different cruises and operators is a time-consuming task and has not yet been achieved for the entire dataset. Data from a subset of profiles are currently being prepared for publication.
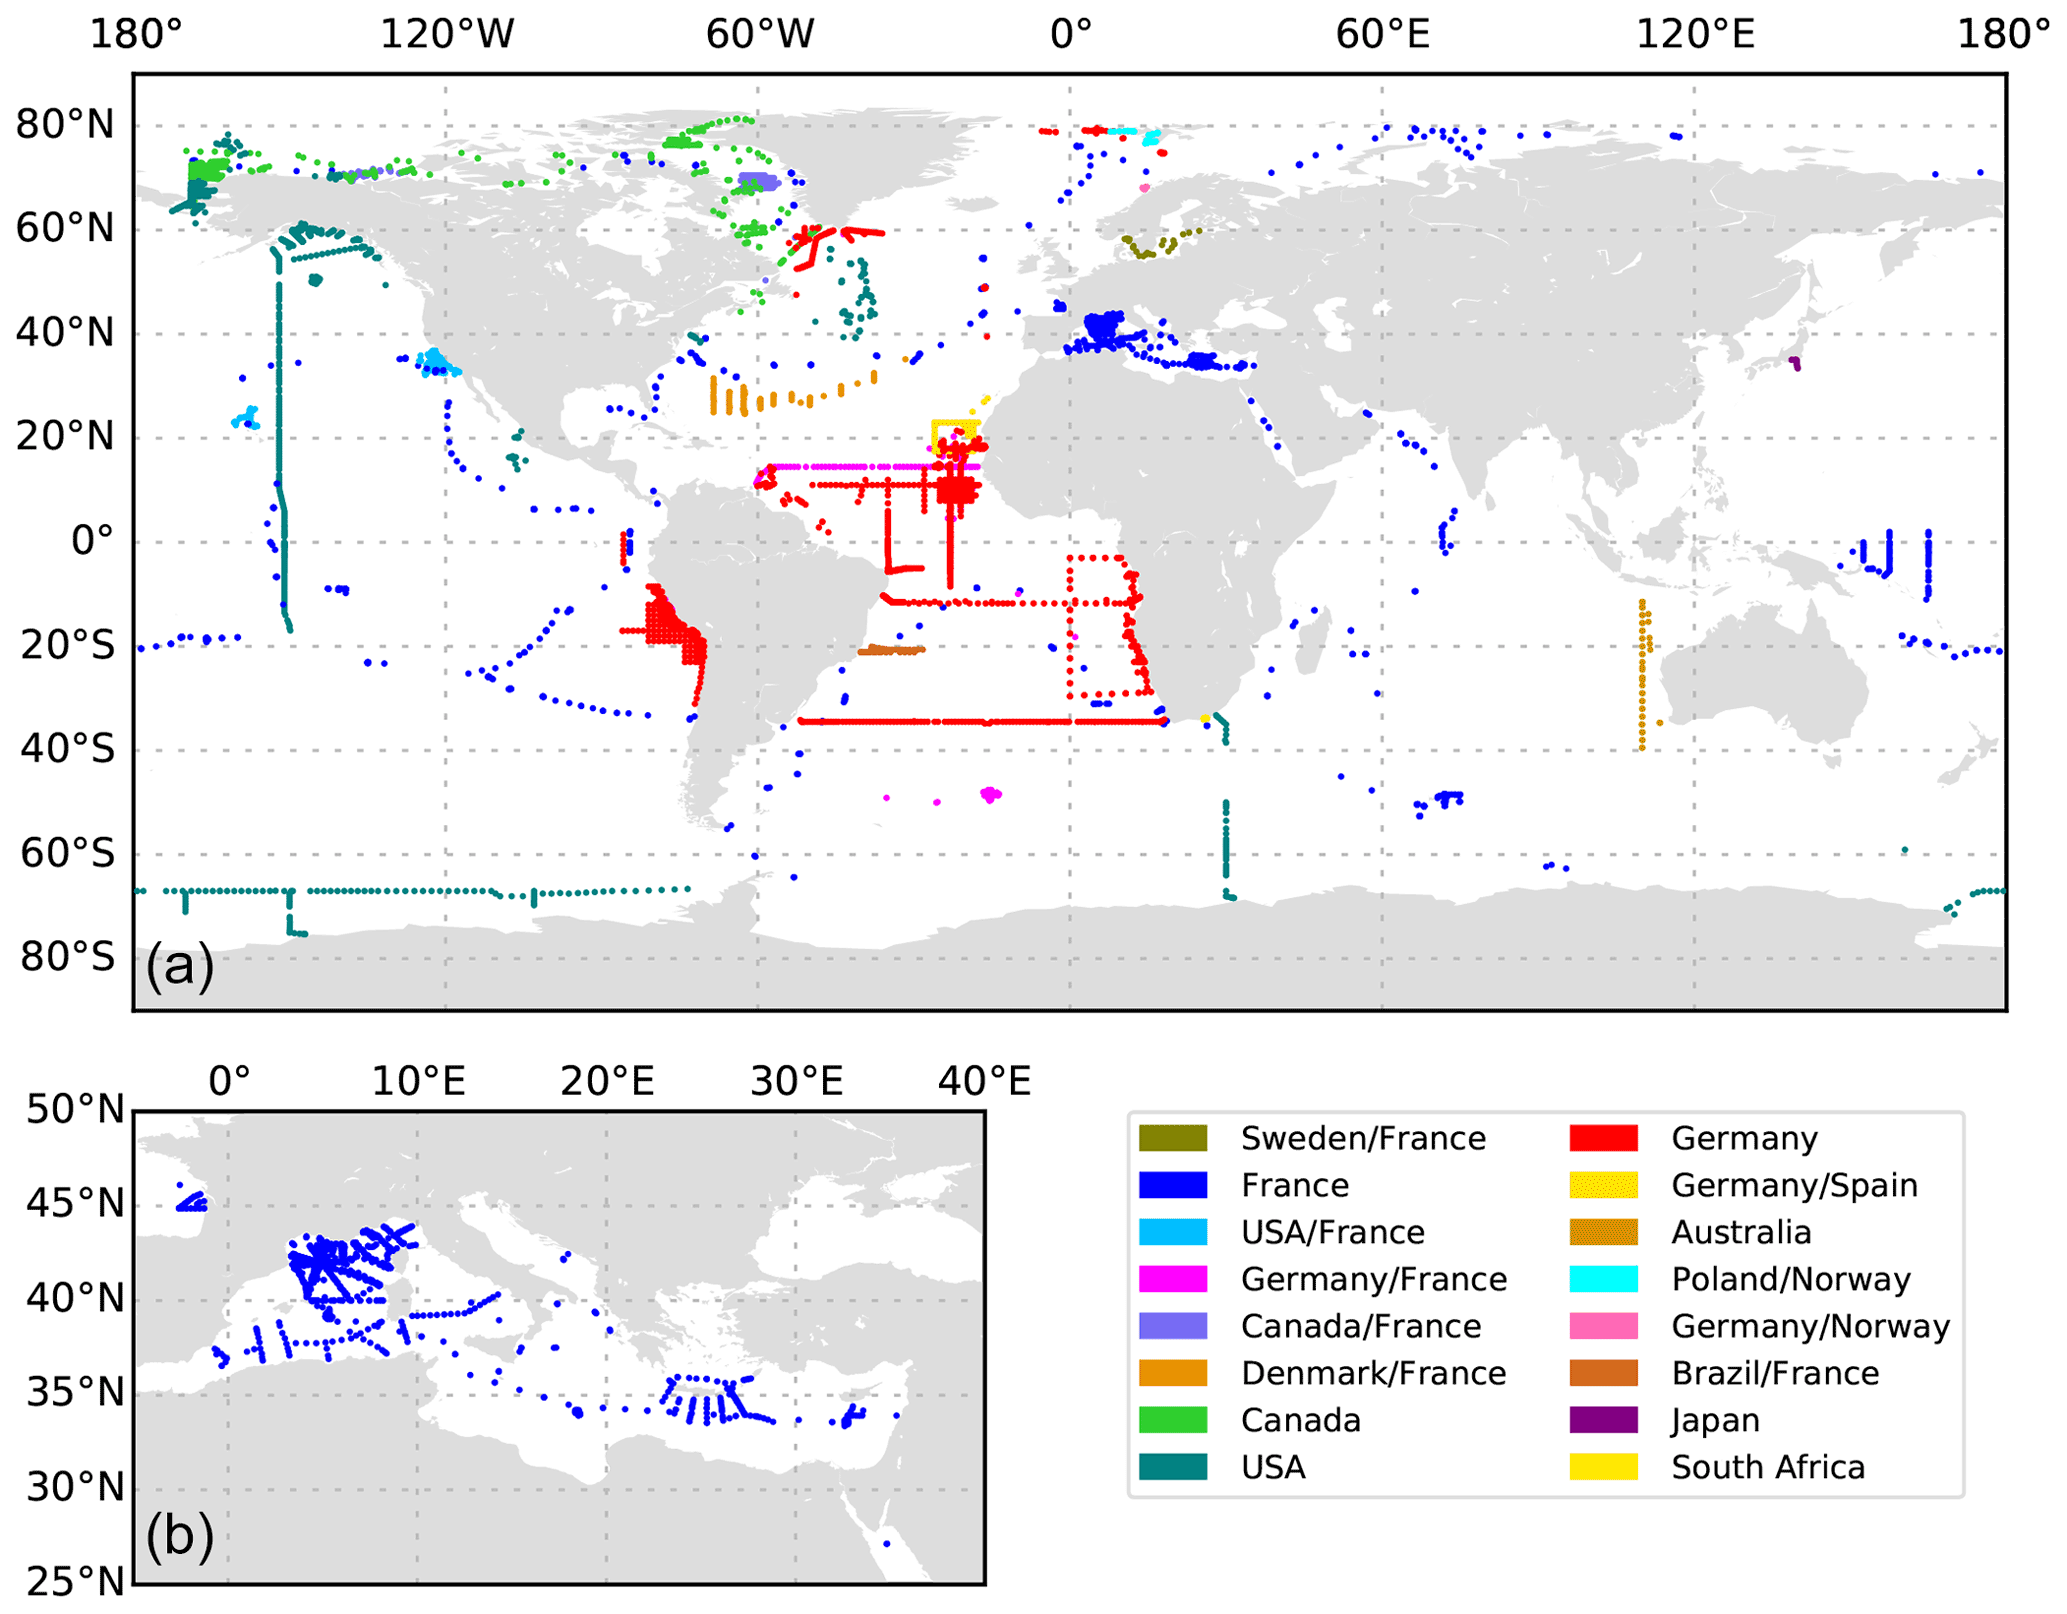
Figure 2(a) The Global distribution of UVP5 data. (b) The data distribution in the Mediterranean Sea.
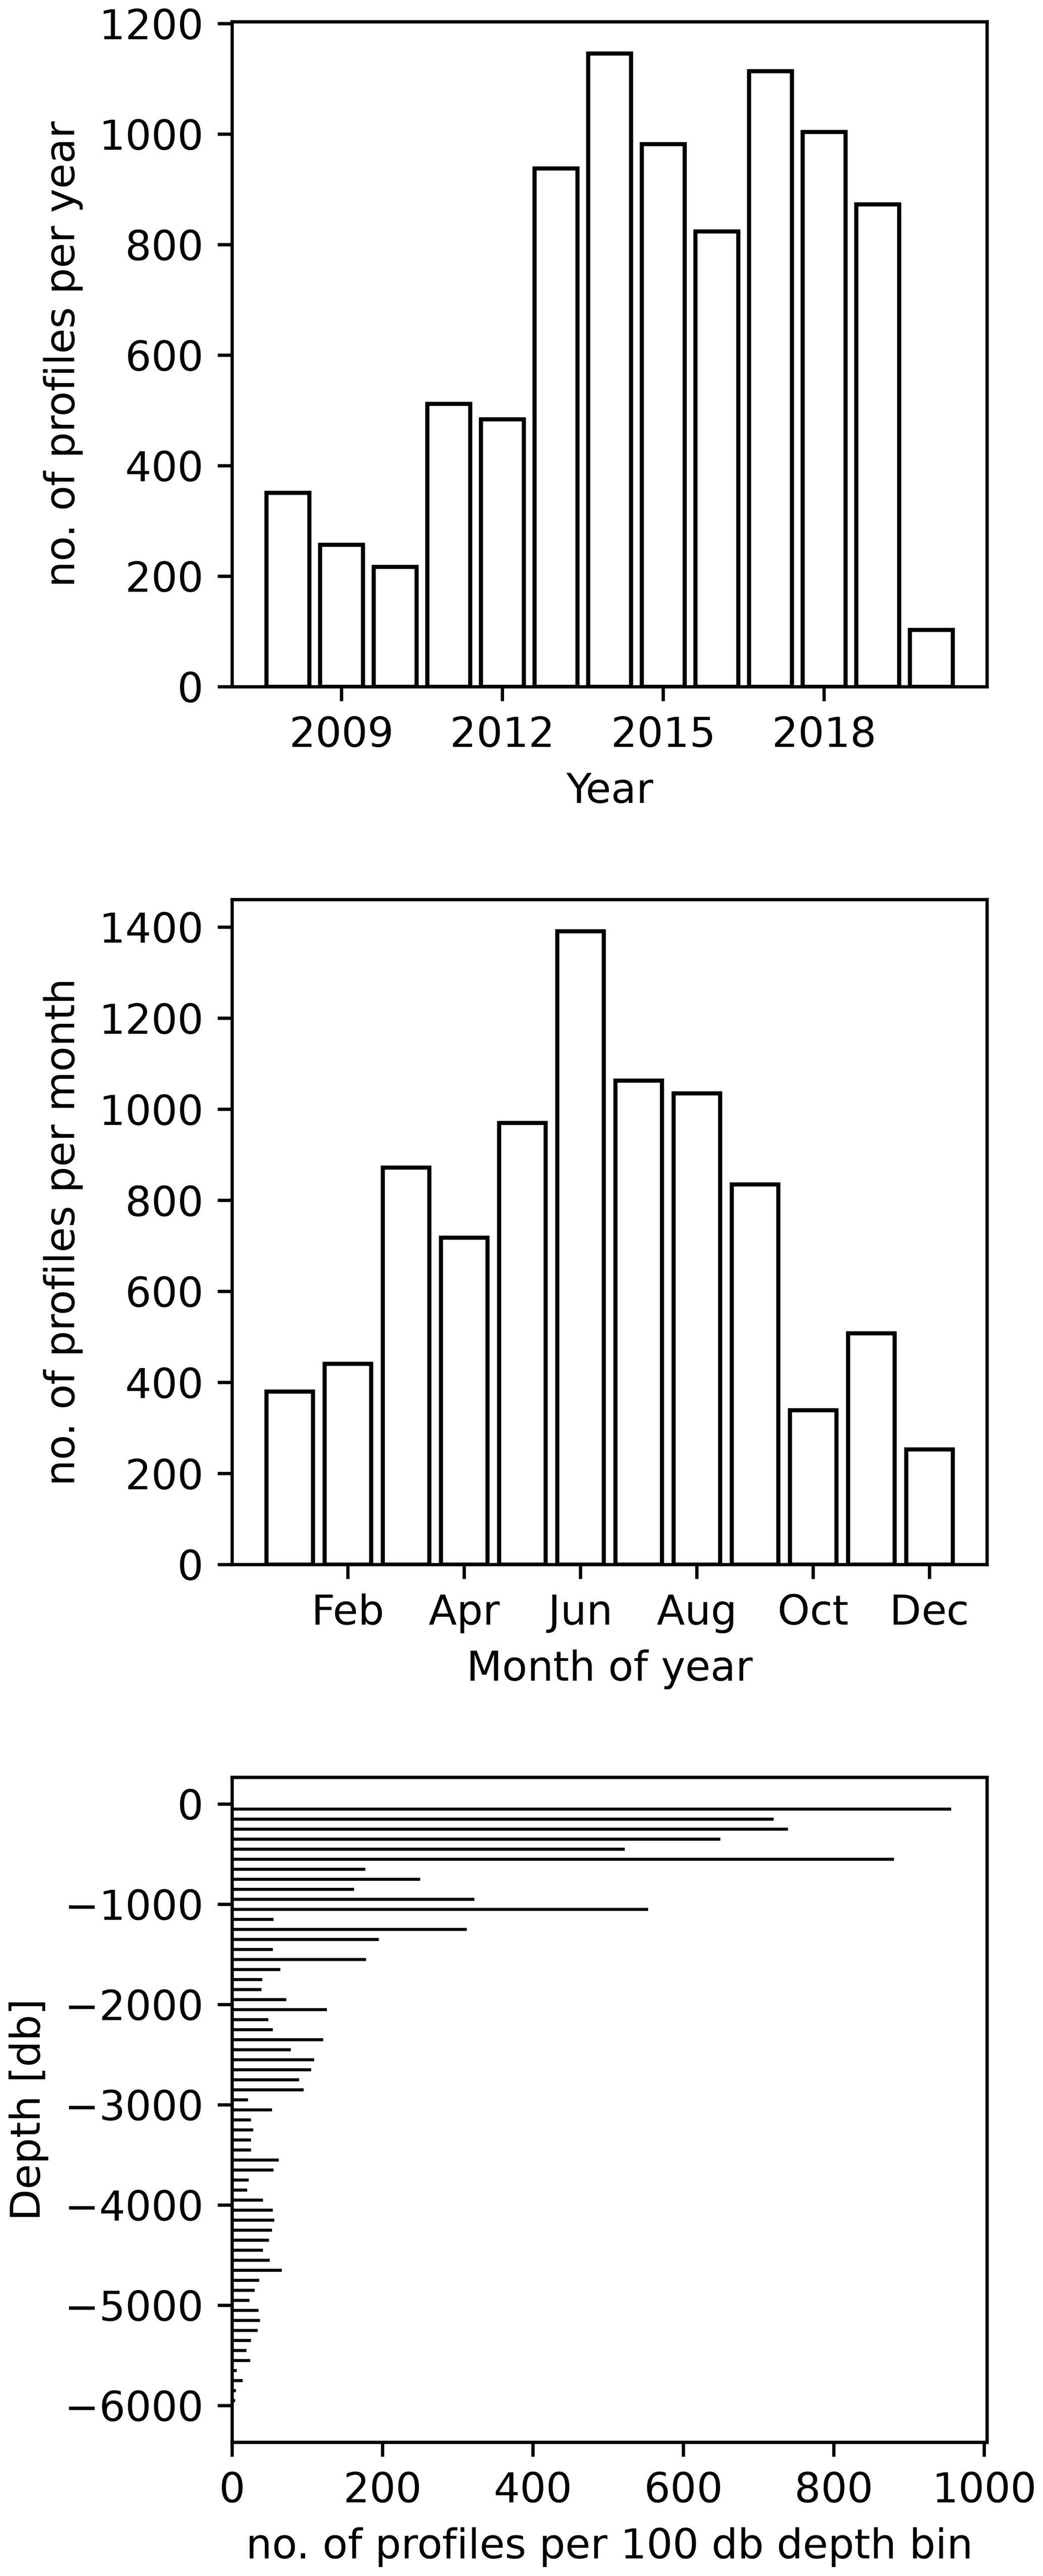
Figure 3The UVP5 data distribution per year and per month as well as the maximum profile depth (aggregated into 100 dbar depth bins).
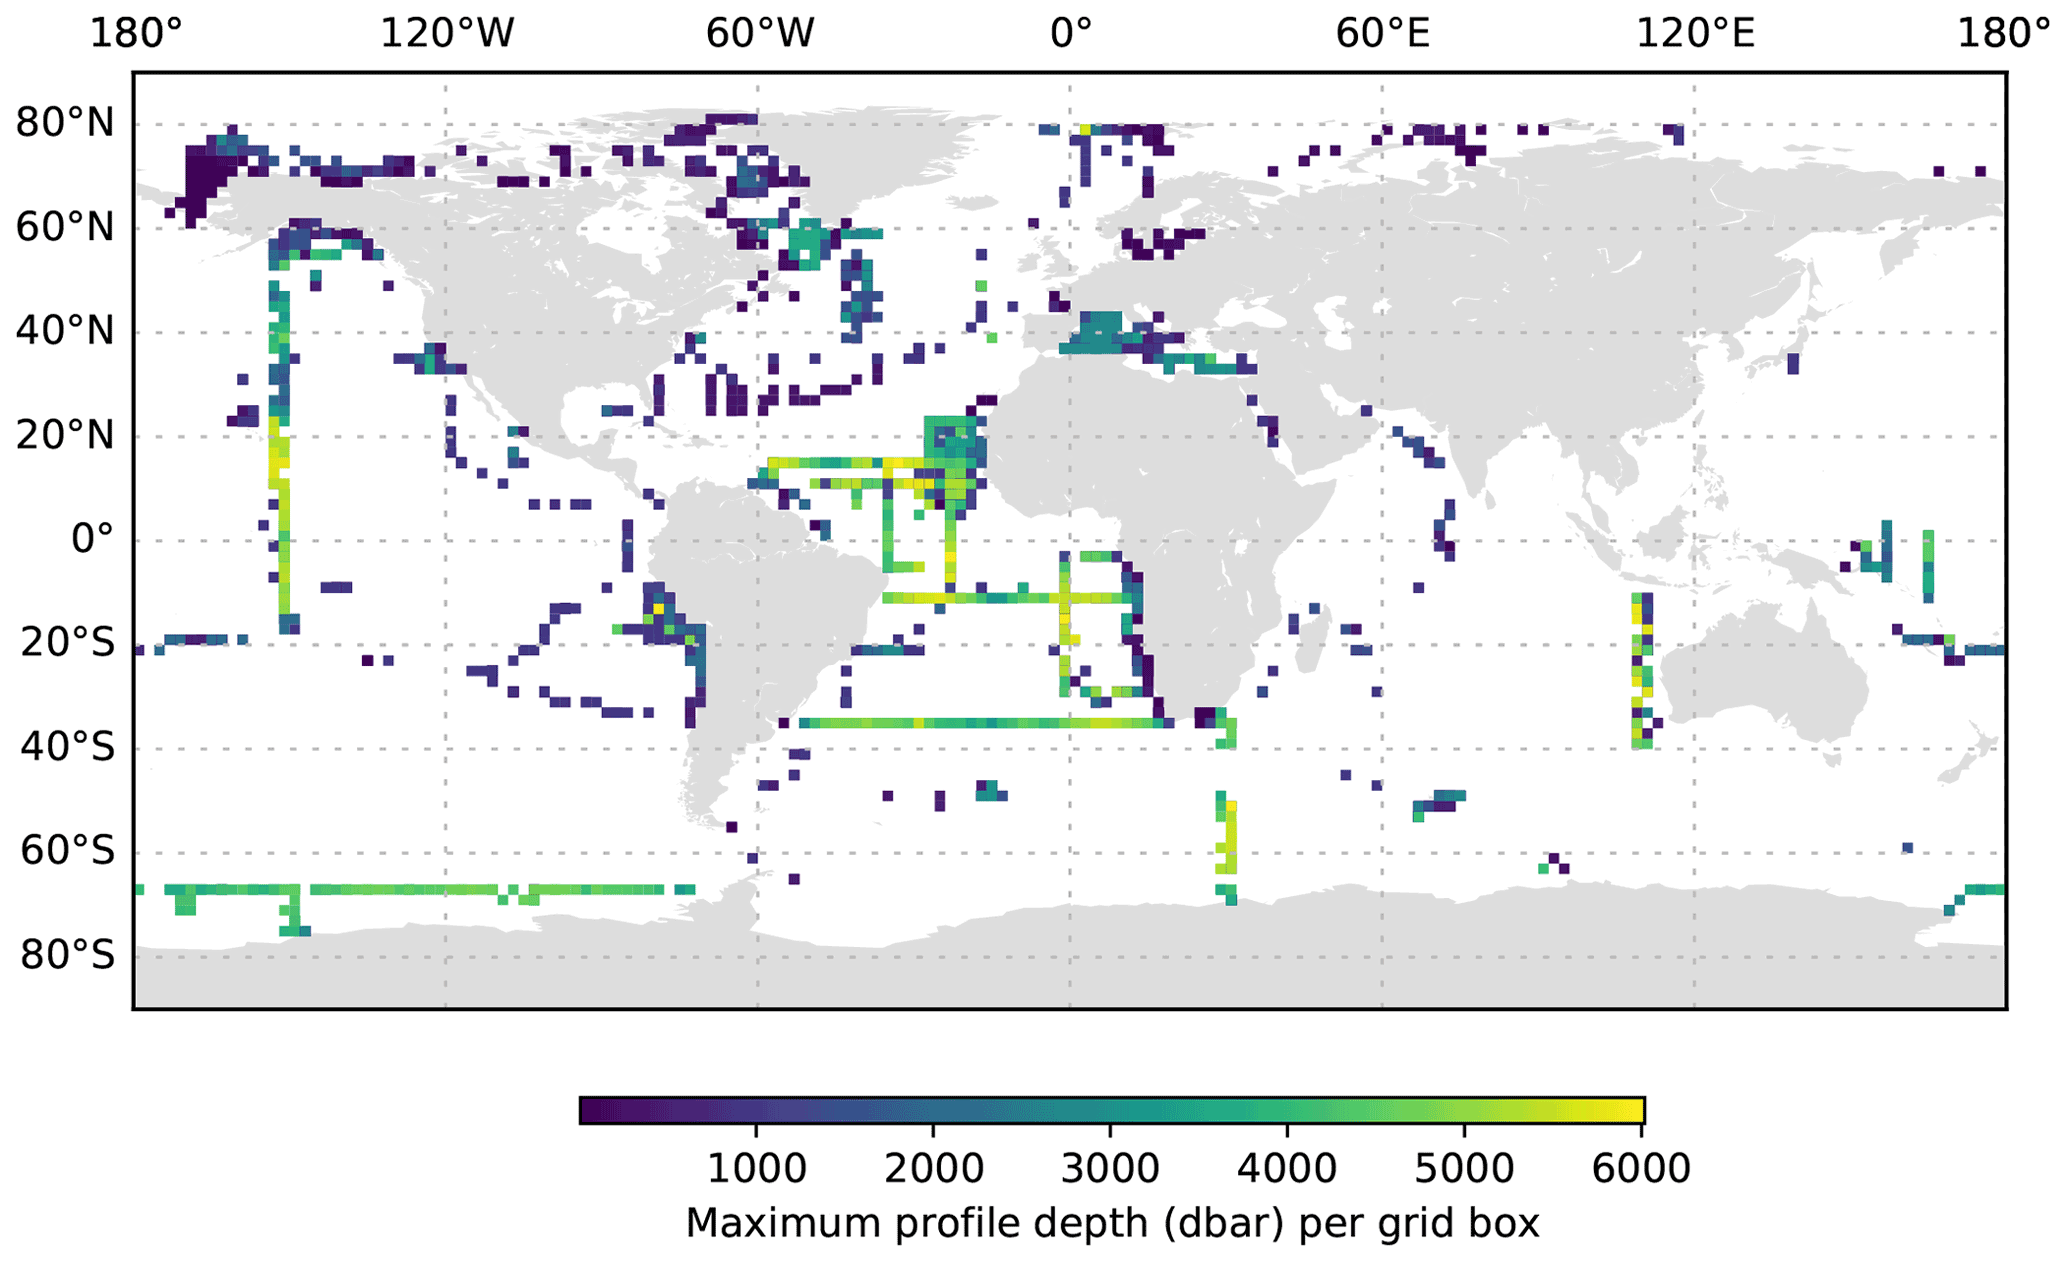
Figure 4The maximum UVP5 profile depth per 2∘ grid box.
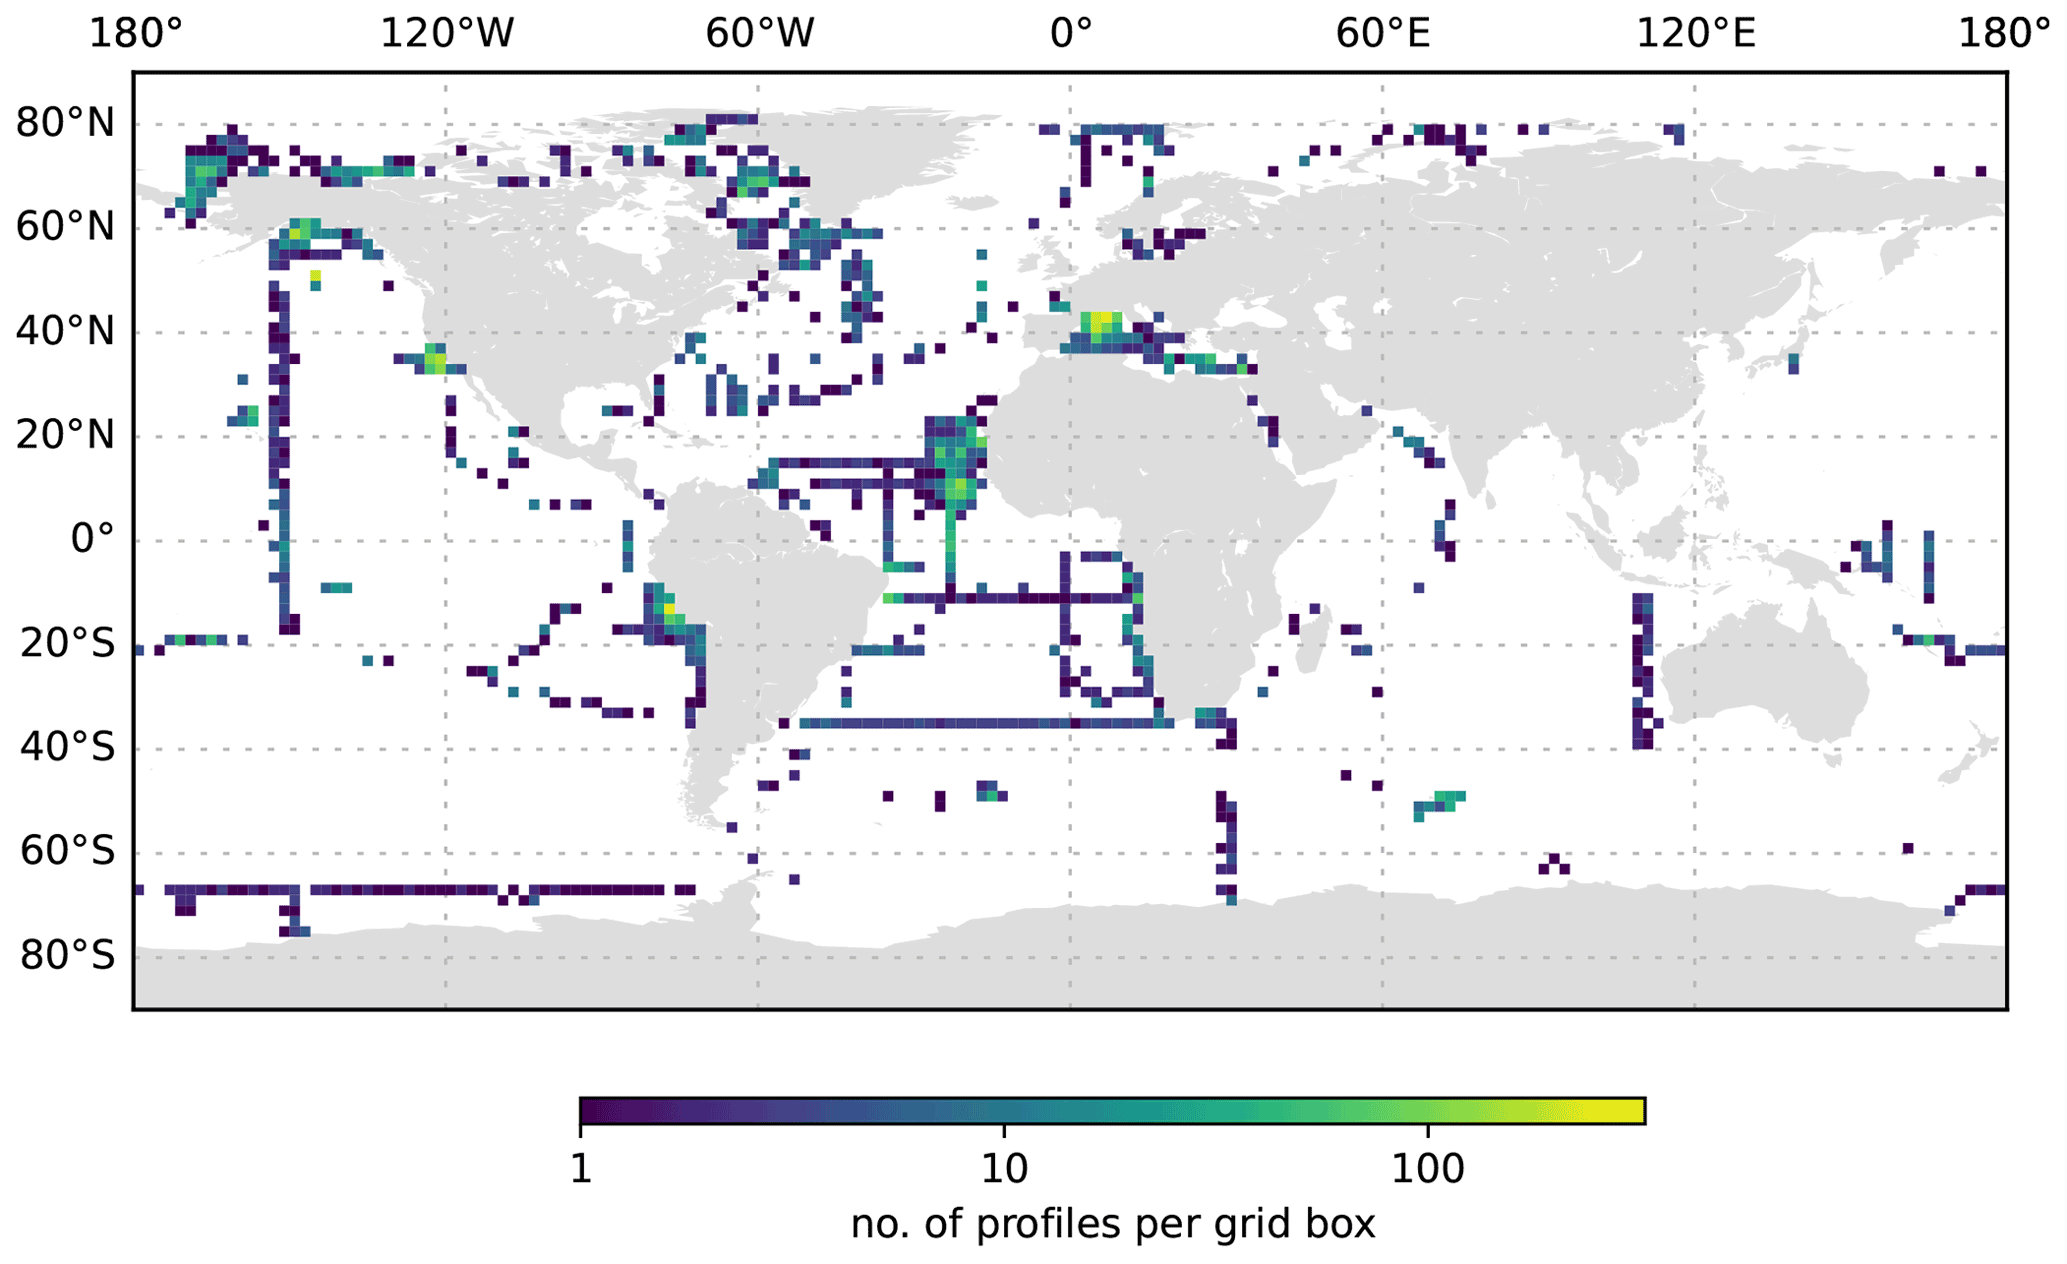
Figure 5The UVP5 data distribution per 2∘ grid box.
3.1 Data distribution
The global distribution of UVP5 profiles contained in the published dataset is shown in Fig. 2a; in total, it comprises 8805 profiles collected between 19 June 2008 and 23 November 2020 and between 81.3695∘ N and −75.29∘ S. The dataset represents a compilation of particle data from numerous small regional-scale research cruises as well as several large-scale hydrographic transects with bathypelagic and cross-basin coverage. All major ocean basins as well as the Mediterranean Sea and the Baltic Sea were sampled. Most data are available from the Mediterranean Sea, the tropical Atlantic and Pacific, the Gulf of Alaska, and the Arctic. Information on the number of profiles obtained per year, month and depth level is shown in Fig. 3. The majority of profiles was collected in the upper 1000 m of the water column in June and August. Between 217 and 1146 profiles per year were obtained between 2008 and 2020. Almost all UVP5 data obtained between 2008 and 2019 are contained in our dataset. We were not able to obtain data from all UVP5 owners; therefore, we cannot provide an exact estimate of how many profiles are currently missing from the dataset. Furthermore, some datasets obtained in 2019 and 2020 still require processing and will be added in subsequent updates of the dataset. The sampling effort is biased to the Northern Hemisphere summer. Of all 8805 profiles, 1675 (19 %) are shallower than 200 dbar, 7127 (80 %) cover the upper 200 dbar of the water column, 3426 (38 %) cover the upper 1000 dbar and 1018 (11 %) go down to at least 3000 dbar. Deep profiles are mostly full depth profiles. The deepest profile reached 6017.5 dbar depth. Figure 4 shows the maximum depth per 2∘ grid box, whereas Fig. 5 shows the number of profiles obtained per 2∘ grid box.
3.2 Global particle abundance patterns
The global UVP5 particle dataset enables the characterization of particle abundance and size structure patterns at a global scale, but it also enables specific insights into particle dynamics at several regional study sites (e.g. the Gulf of Alaska; the California, Humboldt, Benguela and Mauretania upwelling systems; and the Mediterranean Sea). Here, we aim to provide a short description of global particle distribution patterns and reference a few existing published studies. We use the terms micrometric particle (MiP) for particles with an ESD of 0.14 to 0.53 mm and macroscopic particle (MaP) for particles with an ESD of 0.53 to 16.88 mm, as in Kiko et al. (2017). We thereby also follow an approach used for marine aggregates, in which those larger than 0.5 mm ESD are defined as marine snow (Suzuki and Kato, 1953; Alldredge and Silver, 1988). Globally, MiP and MaP concentrations in the upper 200 m are very variable (Figs. 6, 9). High MiP and MaP abundances in coastal regions, upwelling zones or frontal zones (MiP maximum values of >50 000 particles L−1; MaP maximum values of >2000 particles L−1), are likely due to higher biological production and coastal inputs (Guidi et al., 2008a; Stemmann et al., 2008b; Roullier et al., 2014; Kiko et al., 2017). Particle concentrations are lower in oligotrophic gyres (MiP minimum values of 0.81 particles L−1; MaP minimum values of 0.0 particles L−1 MaP) where productivity and advective input from coastal regions are low (Guidi et al., 2008a, 2009, 2015; Stemmann et al., 2008a). Particle abundance generally declines from the surface to depth (compare Figs. 6–8 as well as Figs. 9–11). MiP and MaP in the mesopelagic and bathypelagic layers also show a pattern consistent with that of the surface layer, probably as a consequence of the passive flux of sinking particles (Guidi et al., 2015) and the active supply of particles via diel vertical migrations of zooplankton and nekton to the mesopelagic zone (Kiko et al., 2017, 2020). The strength of these supply mechanisms is dependent on the biological productivity at the surface, the strength of the active transport processes and the attenuation processes in the mesopelagic region (Guidi et al., 2009). For the following analyses of the vertical particle distribution in the open ocean, we only use data from profiles that were conducted down to at least 3000 dbar. For this subset, we find that MiP concentrations range from 0.8 to 53 486.0 particles L−1 between 0 and 200 dbar (median of 52.6, mean of 315.7 and standard deviation of 1269.5), from 1.3 to 38 580.0 particles L−1 between 200 and 1000 dbar (median of 21.8, mean of 54.4 and standard deviation of 228.9), and from 0.7 to 3184.0 particles L−1 between 1000 and 3000 dbar (median of 12.6, mean of 15.5 and standard deviation of 23.8). MaP concentrations range from 0.0 to 2130.1 particles L−1 between 0 and 200 dbar (median of 0.7, mean of 6.2 and standard deviation of 47.5), from 0.0 to 2560.0 particles L−1 between 200 and 1000 dbar (median of 0.1, mean of 0.9, standard deviation of 5.2), and from 0.0 to 77.8 particles L−1 between 1000 and 3000 dbar (median of 0.1, mean of 0.2 and standard deviation of 0.6). The decline in the particle abundance with depth has been interpreted as a consequence of microbial and metazoan flux attenuation (Stemmann et al., 2004; Guidi et al., 2009). The variability in the MiP and MaP abundance range also decreases from the epipelagic to the bathypelagic zone, suggesting a feedback mechanism where high particle abundance results in strong flux attenuation by metazoans, thereby removing peaks in particle abundance and flux (Guidi et al., 2009).
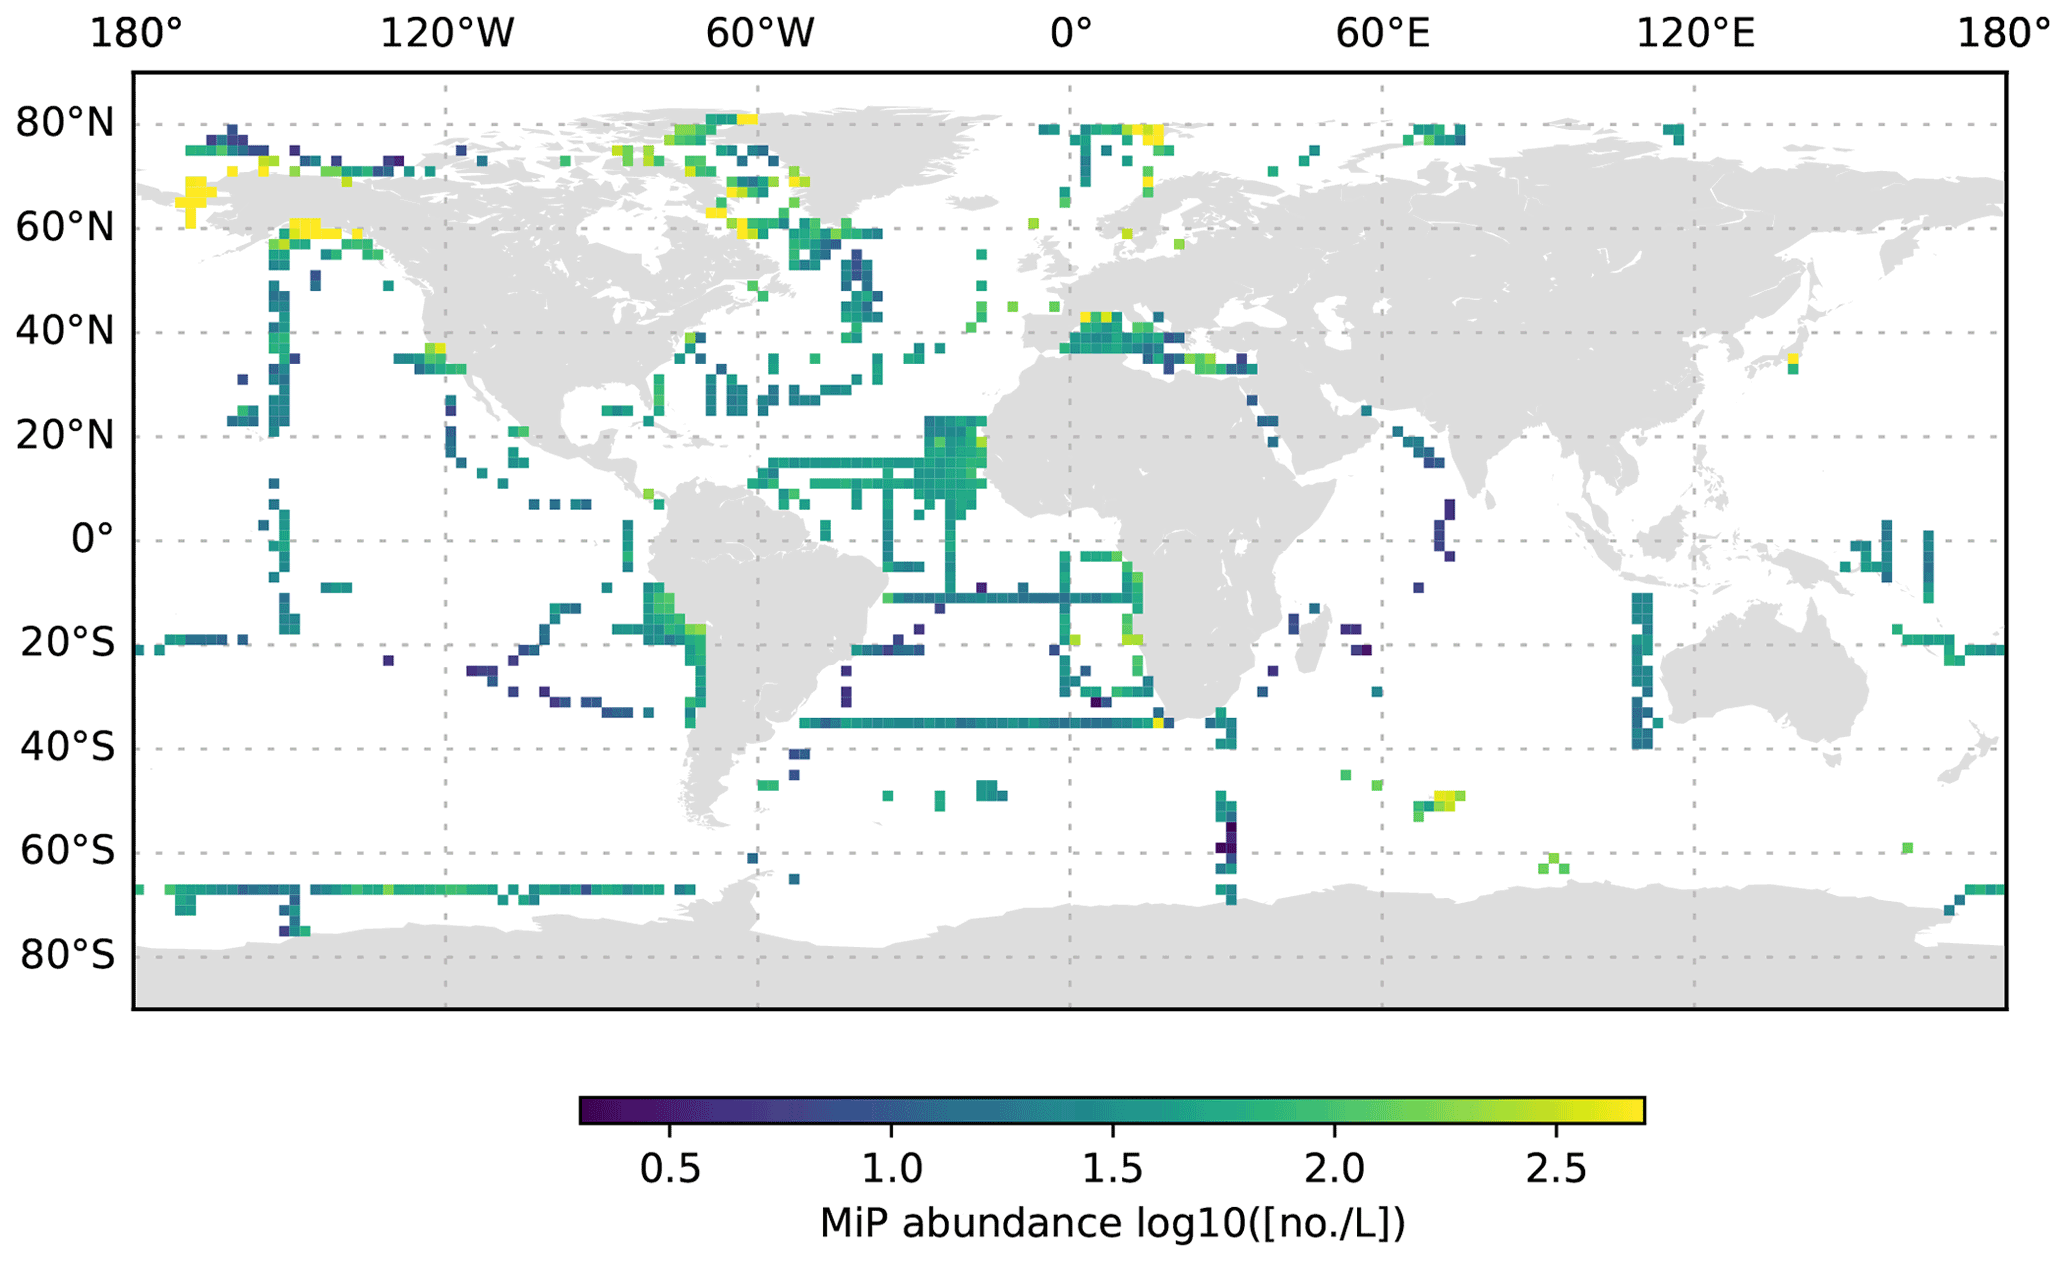
Figure 6MiP abundance (decadic logarithm) averaged for the 0 to 200 dbar depth layer and per 2∘ grid box. Only profiles at least 200 dbar deep were used for the analysis.
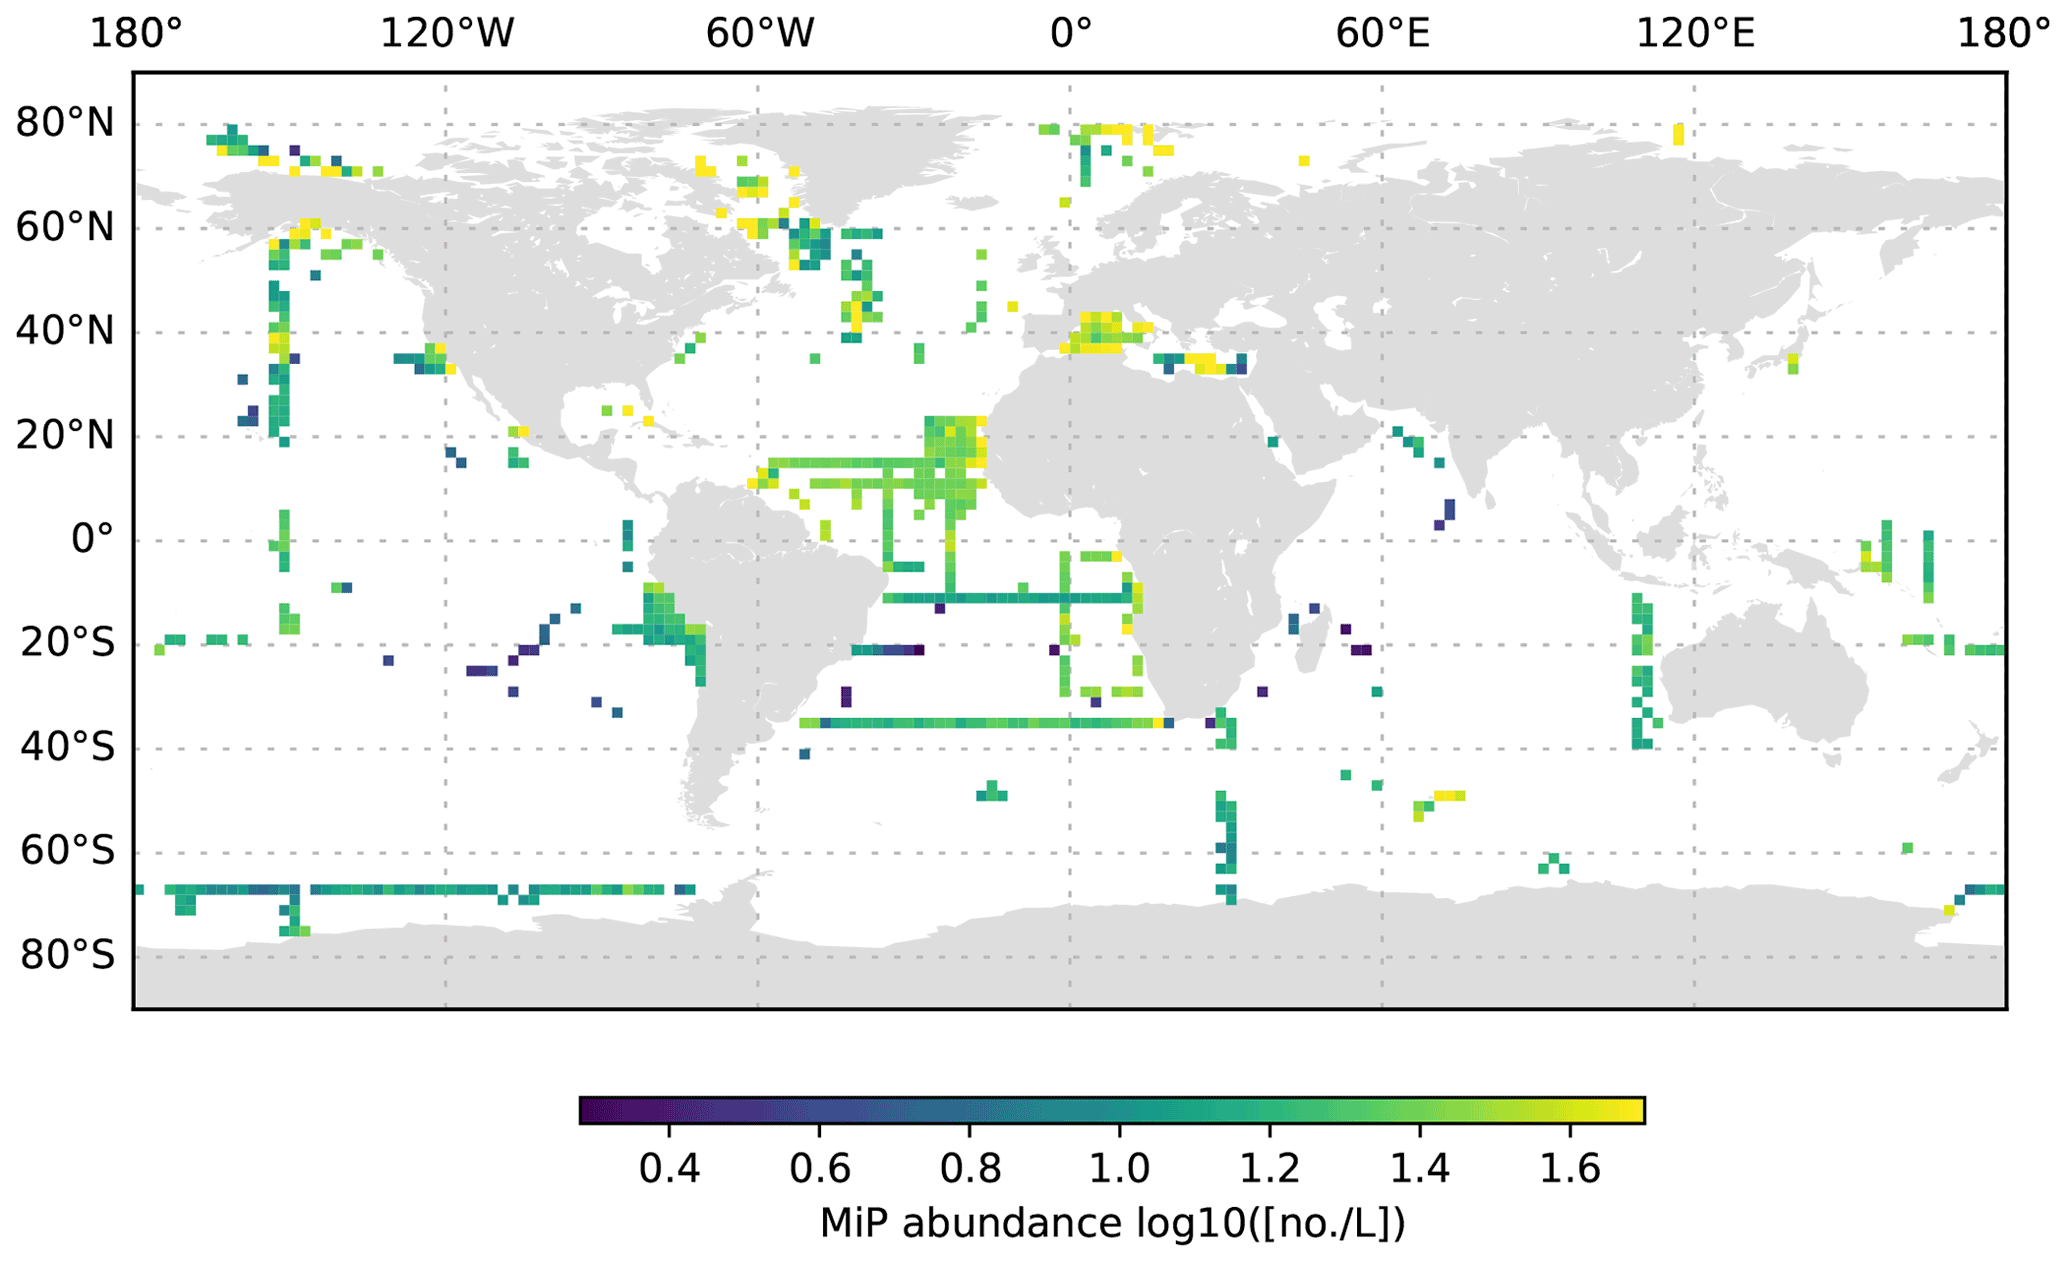
Figure 7MiP abundance (decadic logarithm) averaged for the 200 to 1000 dbar depth layer and per 2∘ grid box. Only profiles at least 1000 dbar deep were used for the analysis.
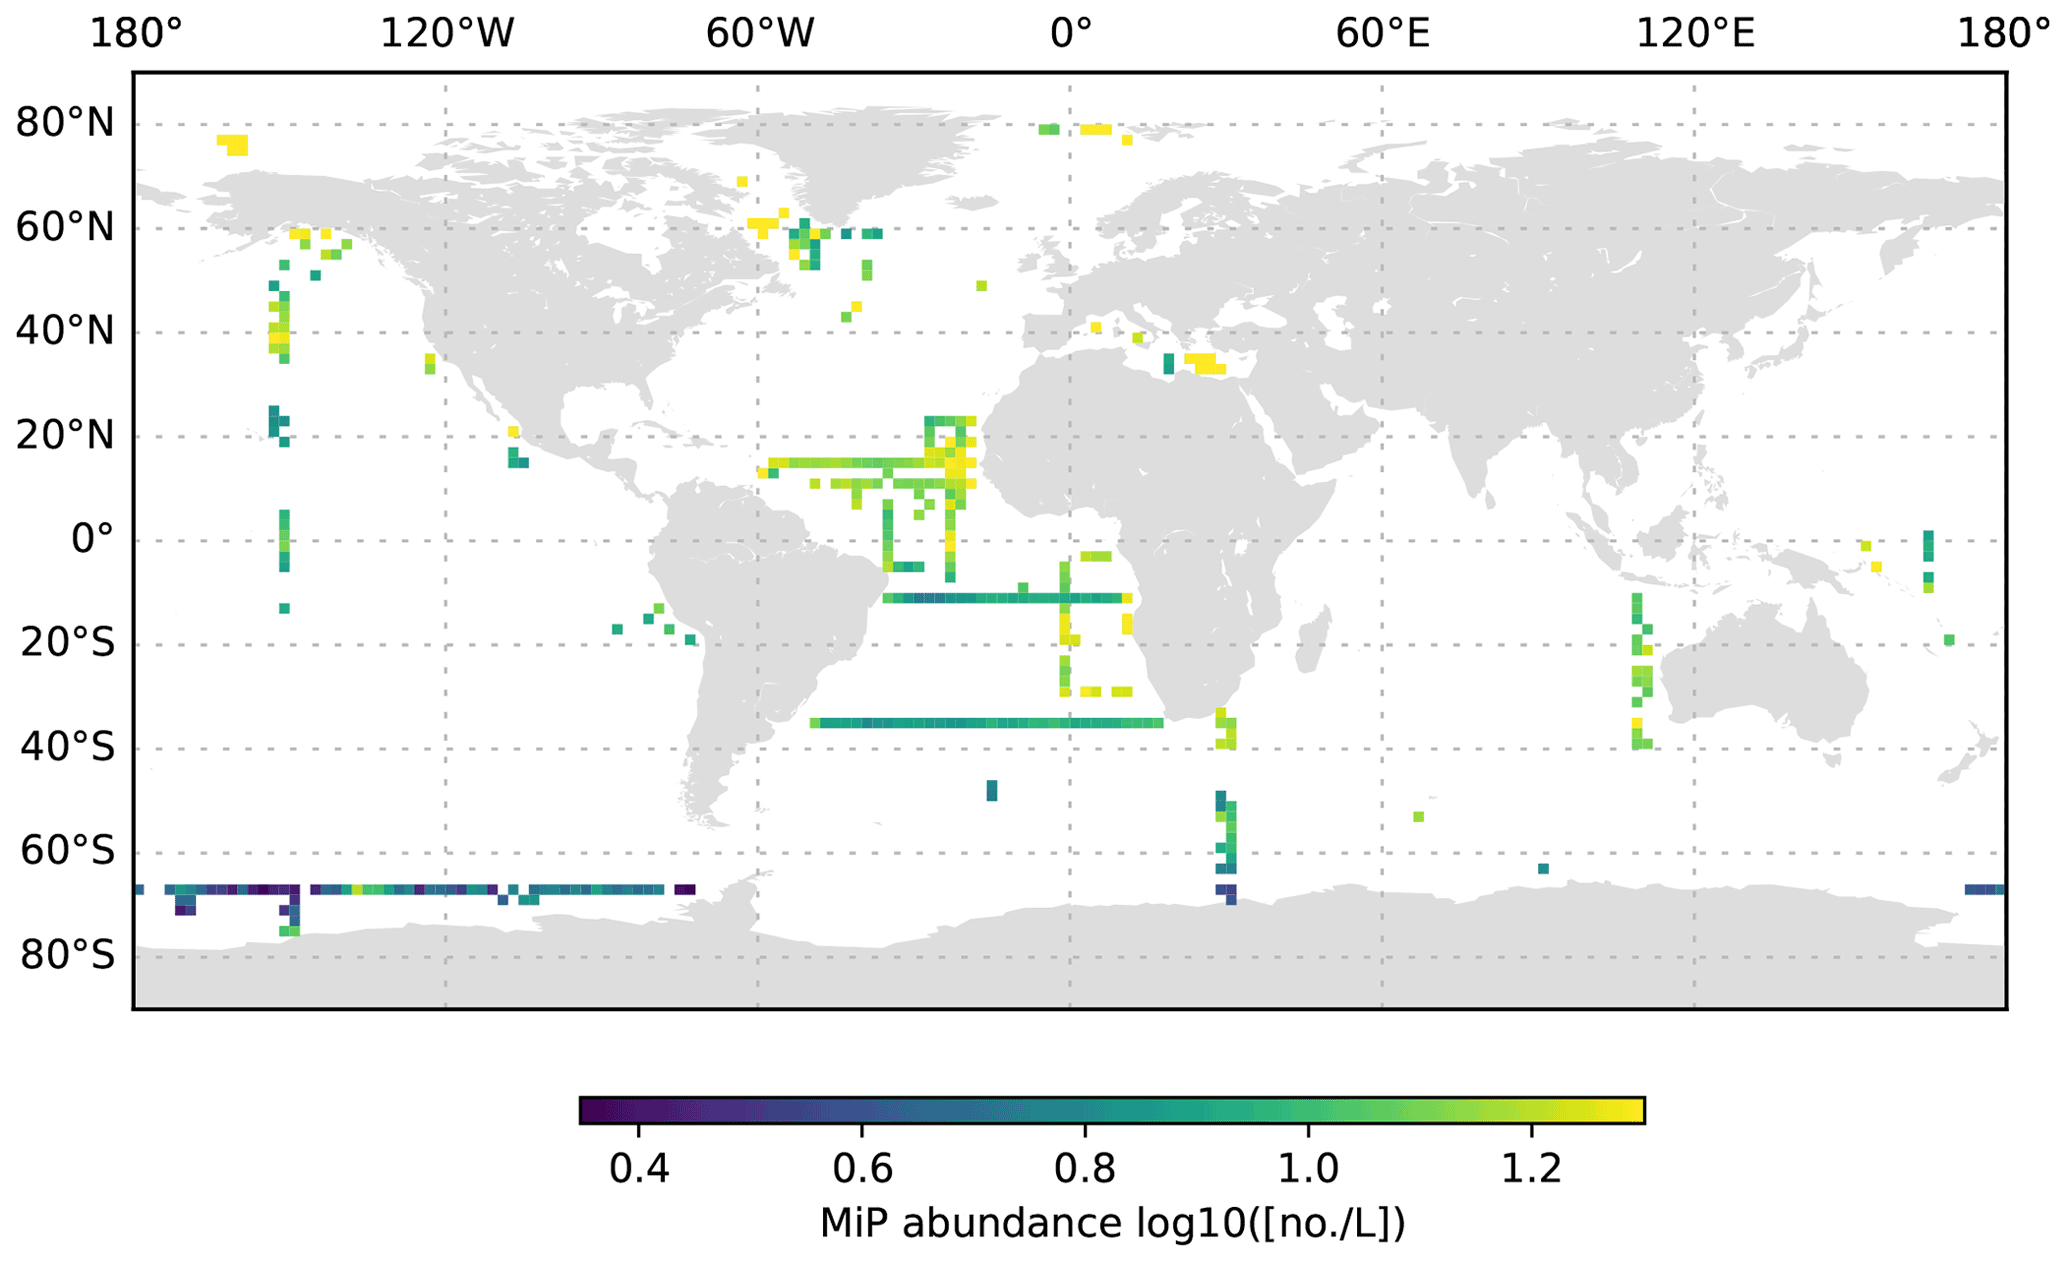
Figure 8MiP abundance (decadic logarithm) averaged for the 1000 to 3000 dbar depth layer and per 2∘ grid box. Only profiles at least 3000 dbar deep were used for the analysis.
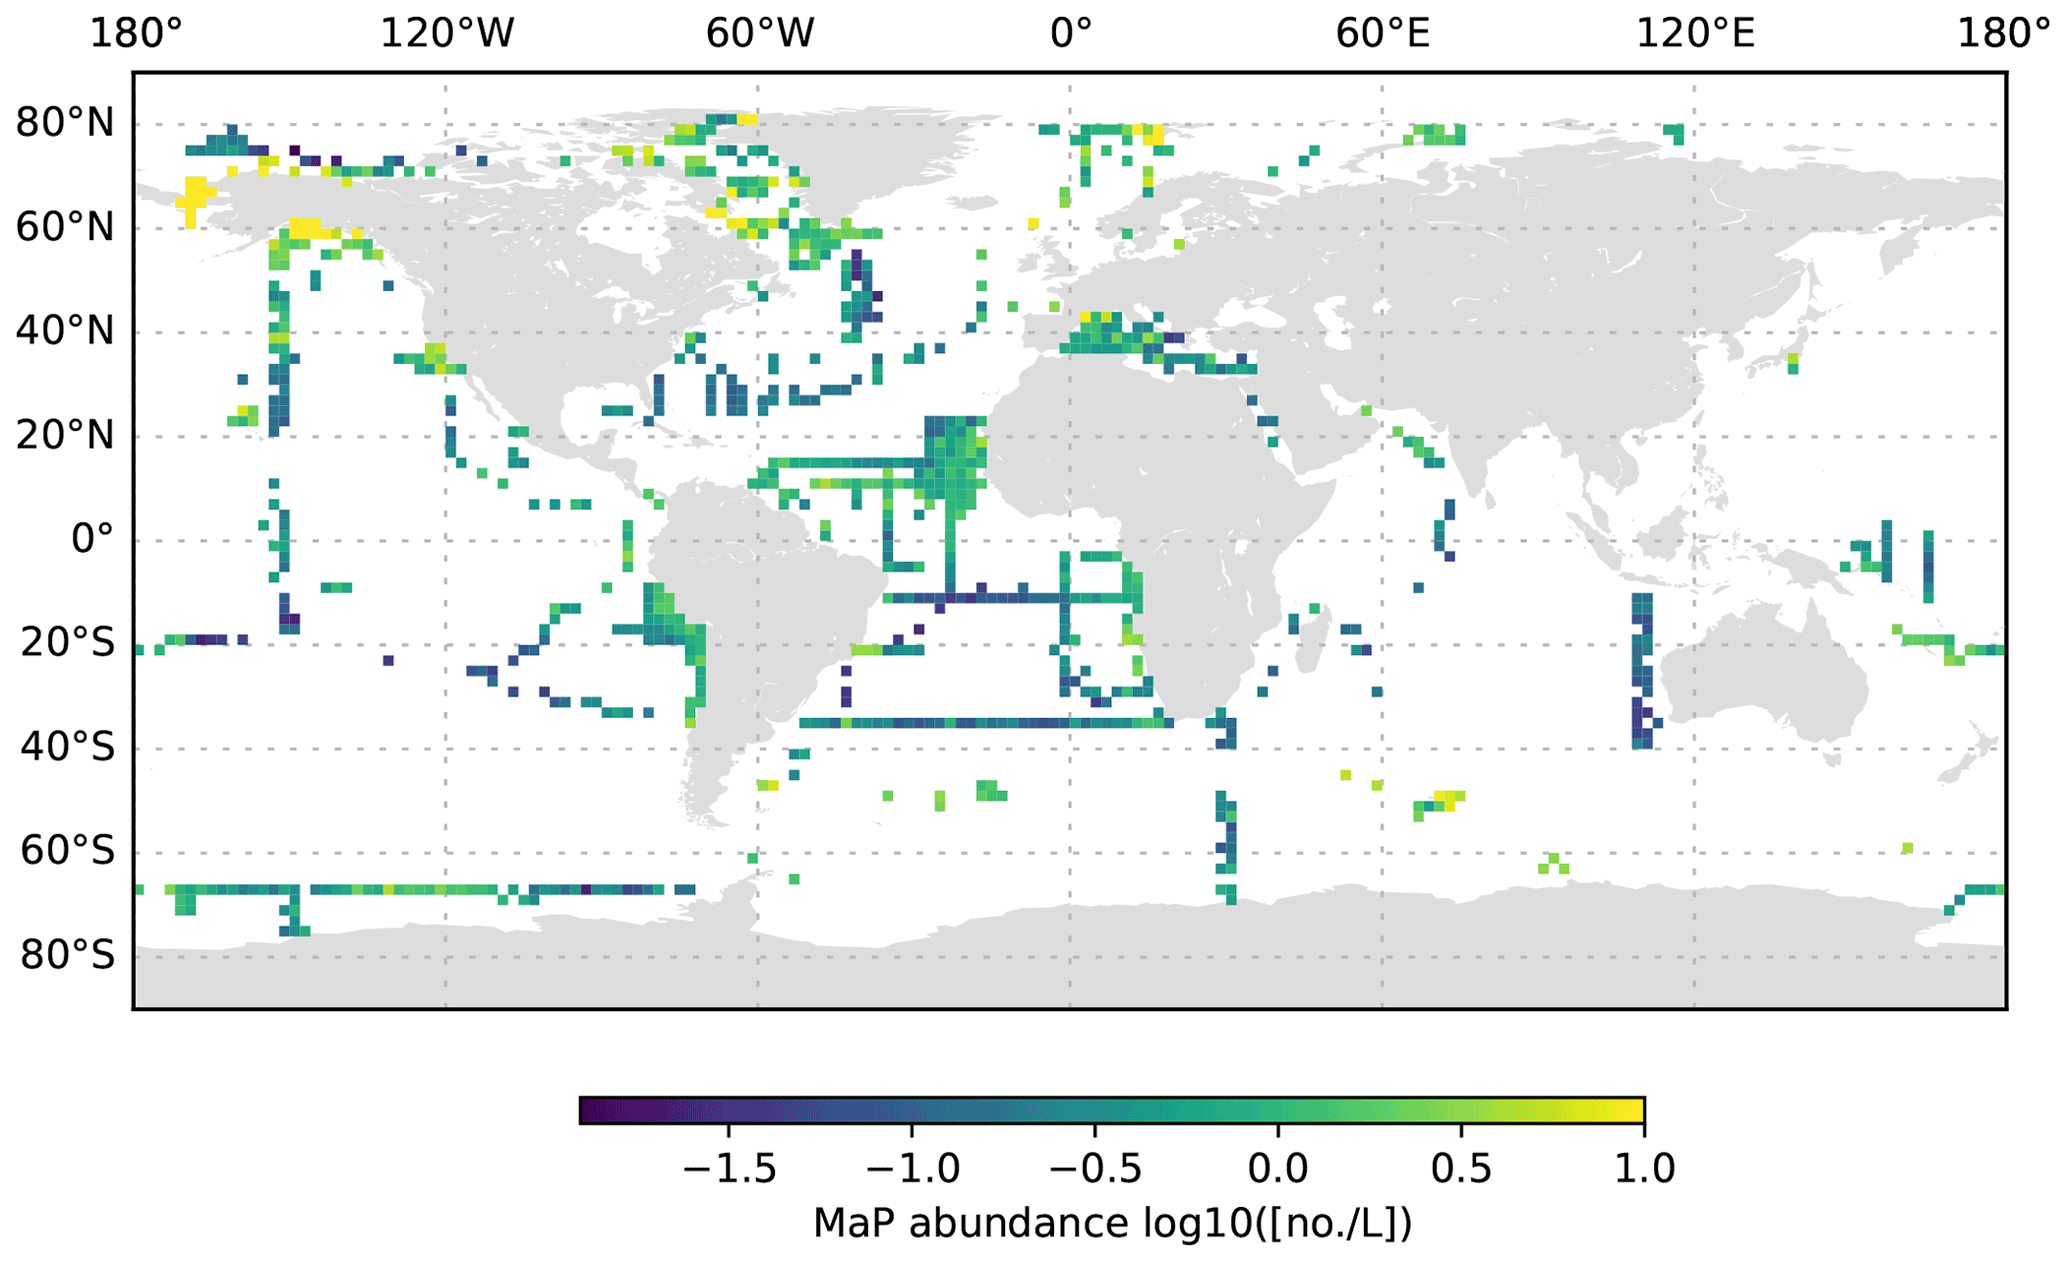
Figure 9MaP abundance (decadic logarithm) averaged for the 0 to 200 dbar depth layer and per 2∘ grid box. Only profiles at least 200 dbar deep were used for the analysis.
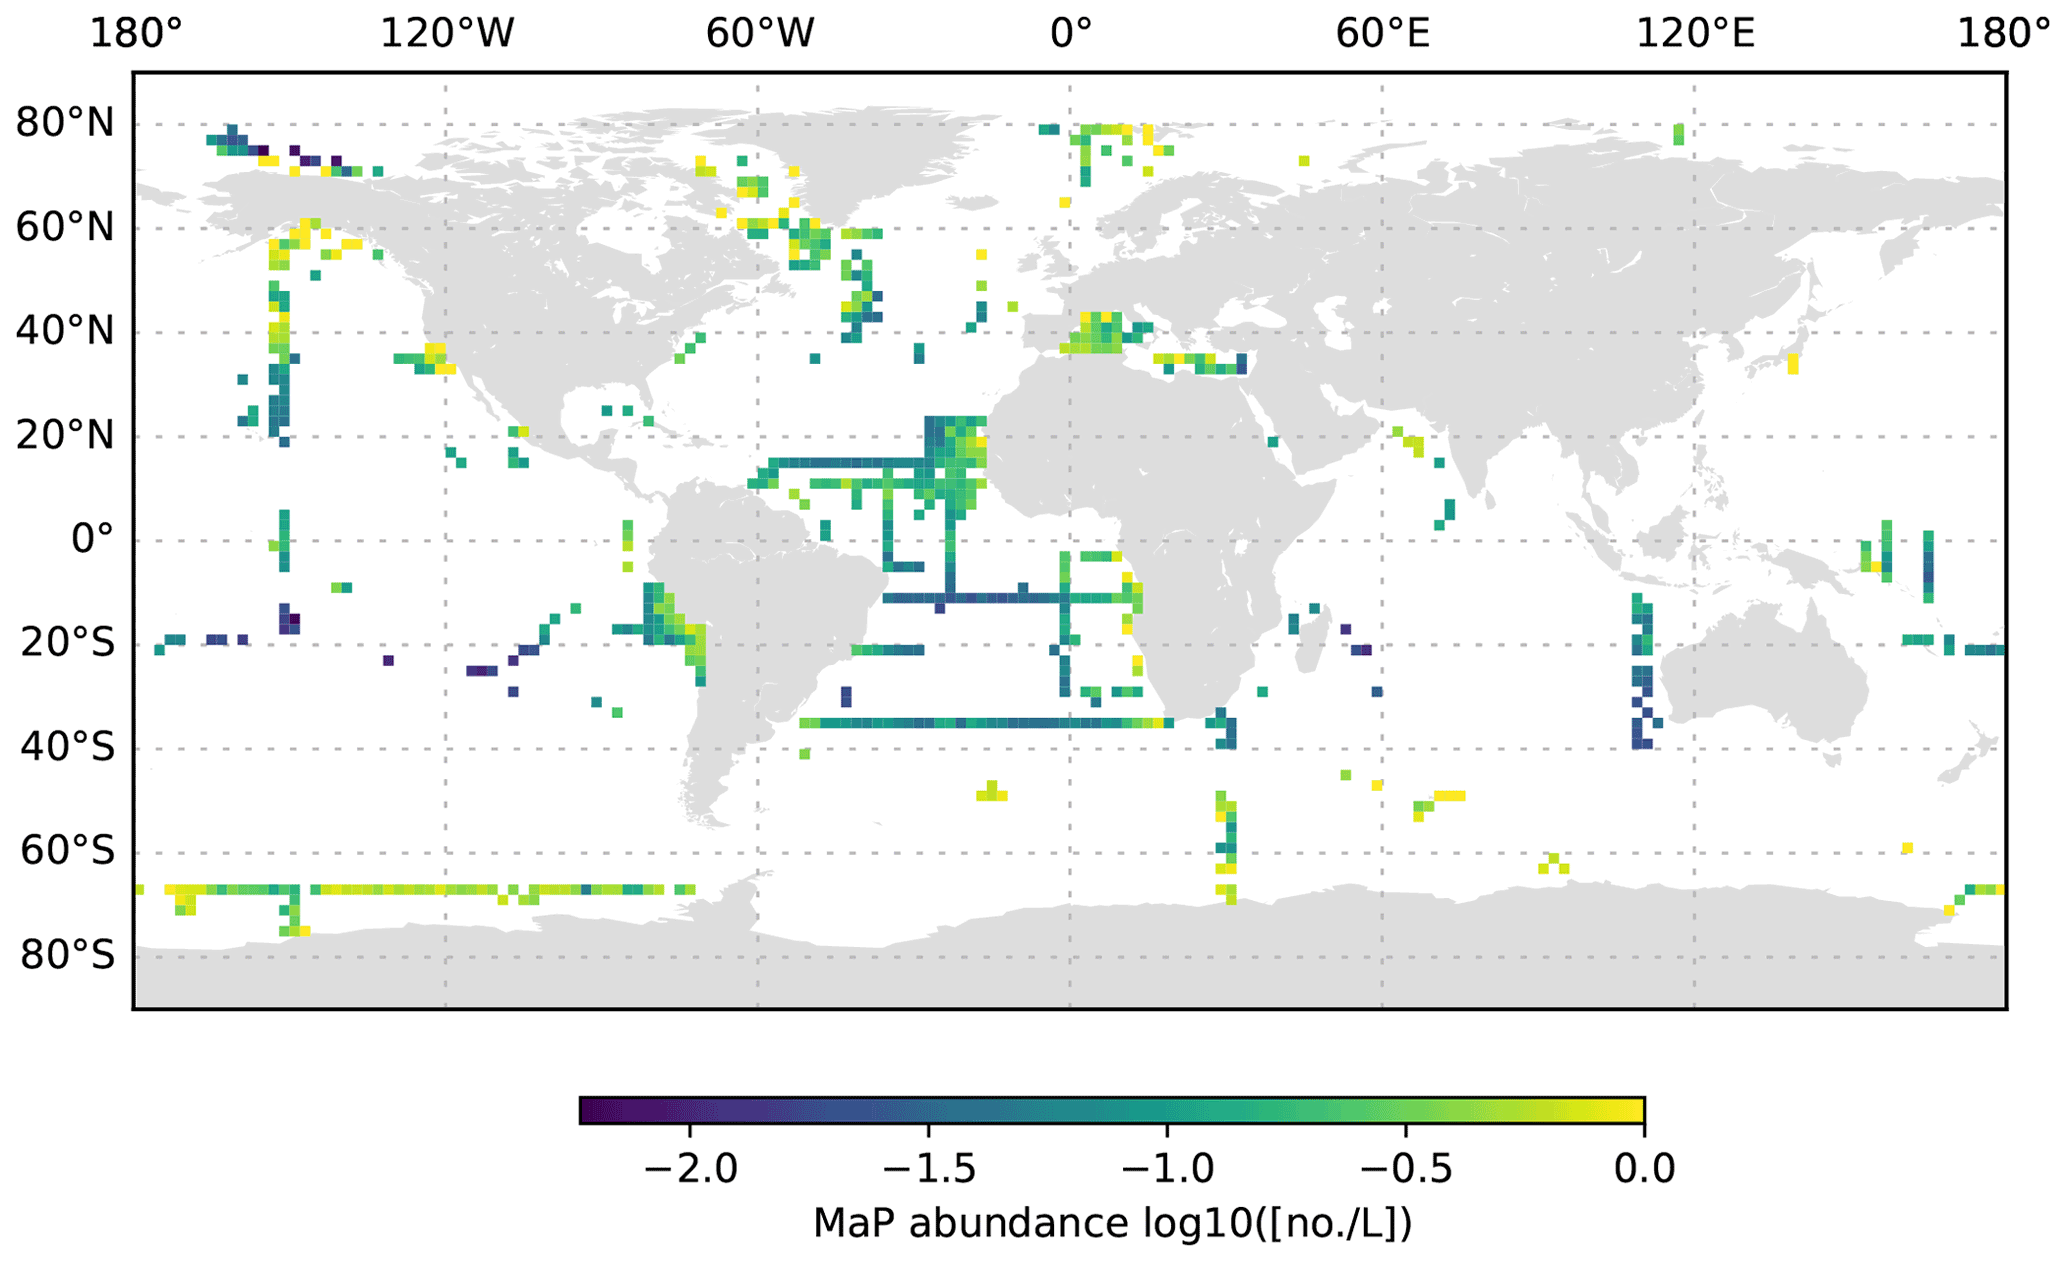
Figure 10MaP abundance (decadic logarithm) averaged for the 200 to 1000 dbar depth layer and per 2∘ grid box. Only profiles at least 1000 dbar deep were used for the analysis.
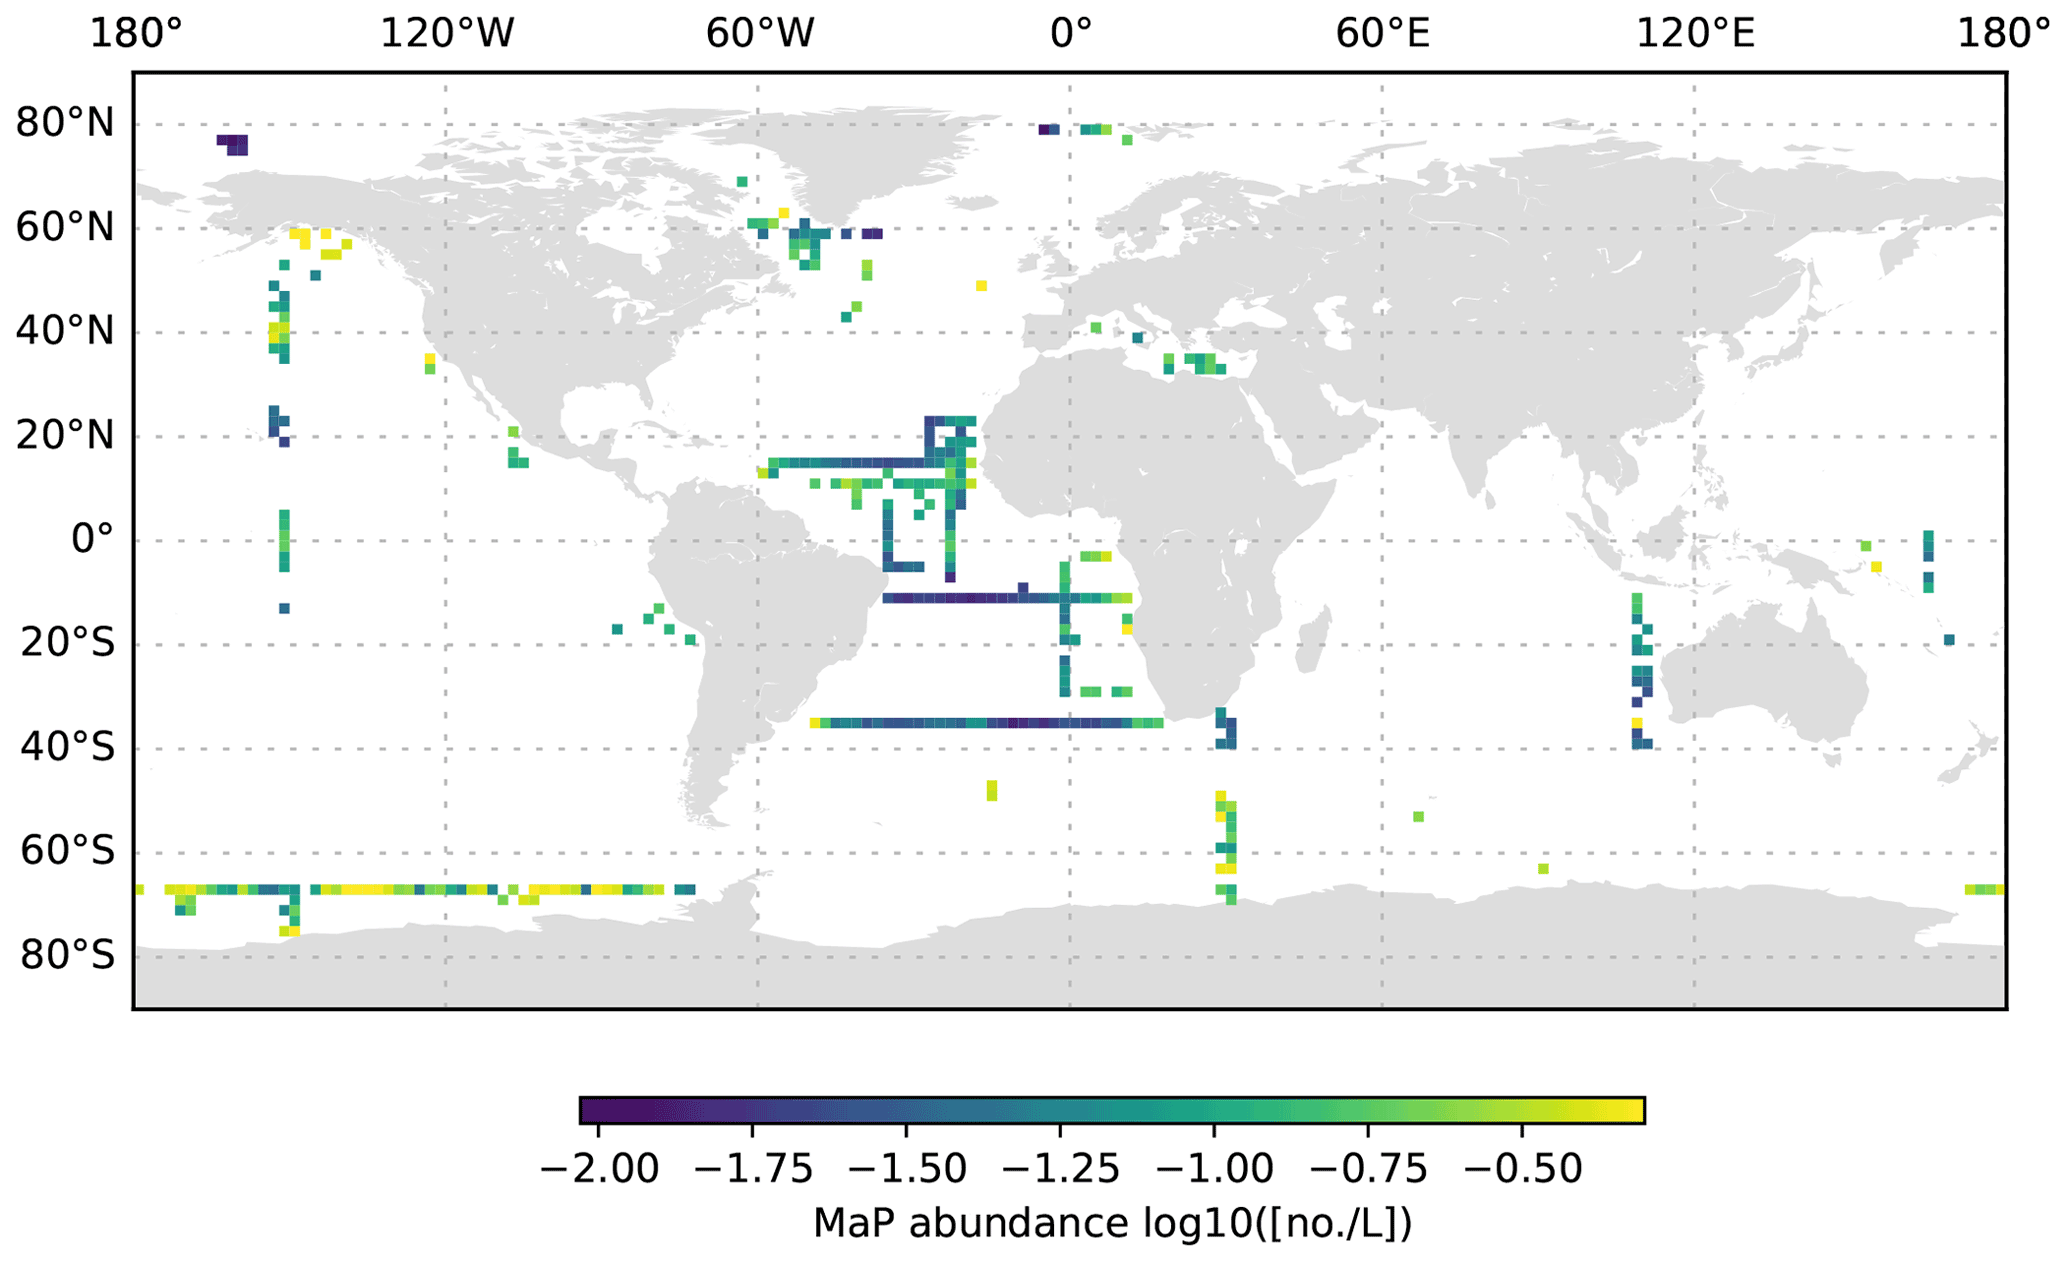
Figure 11MaP abundance (decadic logarithm) averaged for the 1000 to 3000 dbar depth layer and per 2∘ grid box. Only profiles at least 3000 dbar deep were used for the analysis.
3.3 Slope of the particle size distribution
The size distribution of particles is a basic property of marine systems, affecting trophic interactions, the vertical transmission of solar energy and the downward transport of organic matter (Stemmann and Boss, 2012). Despite its fundamental importance, the size distribution is difficult to measure because particles occur over a large range of sizes and compositions, from sub-micrometre compact particles to large, centimetre-sized loose aggregates (Jackson et al., 1995; Stemmann et al., 2008a; Lombard et al., 2019). Here, we use the differential particle size distribution as described by studies such as Stemmann and Boss (2012). A slope k of 4 of the differential particle size distribution suggests an equal amount of mass in logarithmic increasing size intervals. By combining instruments over a micrometre to centimetre size range, it was shown that the value of the slope varies greatly around the typical value of 4 (Jackson et al., 1995; Stemmann et al., 2008a). Our study also shows that the slope k varies greatly in the epipelagic, mesopelagic and bathypelagic regions (Figs. 12, 13, 14). If we constrain the dataset to profiles that go deeper than 3000 dbar, the global mean value of the slope k in the top 200 dbar of the water column is found to be −3.57 ± 0.56 standard deviation (minimum of −6.58 and maximum of −1.8), with significant variations from −4 which are likely due to local ecosystem processes and other impacts. The average slope k and the variability remain similar at greater depth (−3.59 ± 0.67 standard deviation, minimum of −8.25 and maximum of −1.37 at 200–1000 dbar depth; −3.52 ± 0.6 standard deviation, minimum of −7.34 and maximum of −1.33 at 1000 to 3000 dbar depth). Throughout all of the depth ranges, the steepest slopes are observed in oligotrophic basins such as the eastern Mediterranean Sea and the centre of the South Pacific gyre, whereas flatter spectra are observed in more productive regions such as the western Mediterranean Sea and at high latitudes. These observations confirm earlier work using more restricted datasets (Guidi et al., 2009, 2008a; Stemmann et al., 2008c). Earlier work has also shown that the slope of the size spectrum is correlated with the phytoplankton community composition (Guidi et al., 2009; Stemmann et al., 2002) and can show diel variability related to zooplankton migration (Stemmann et al., 2000). Deeper in the water column, the spatial pattern of the slope k mostly reflects the upper-ocean variability. Interestingly, bathypelagic values of k in the Antarctic are relatively flat, compared with temperate and tropical regions, which suggests that the relative role of larger, aggregated particles in the Antarctic deep sea is more important than that in the temperate and tropical regions. Such a trend is not observed in data from Arctic regions.
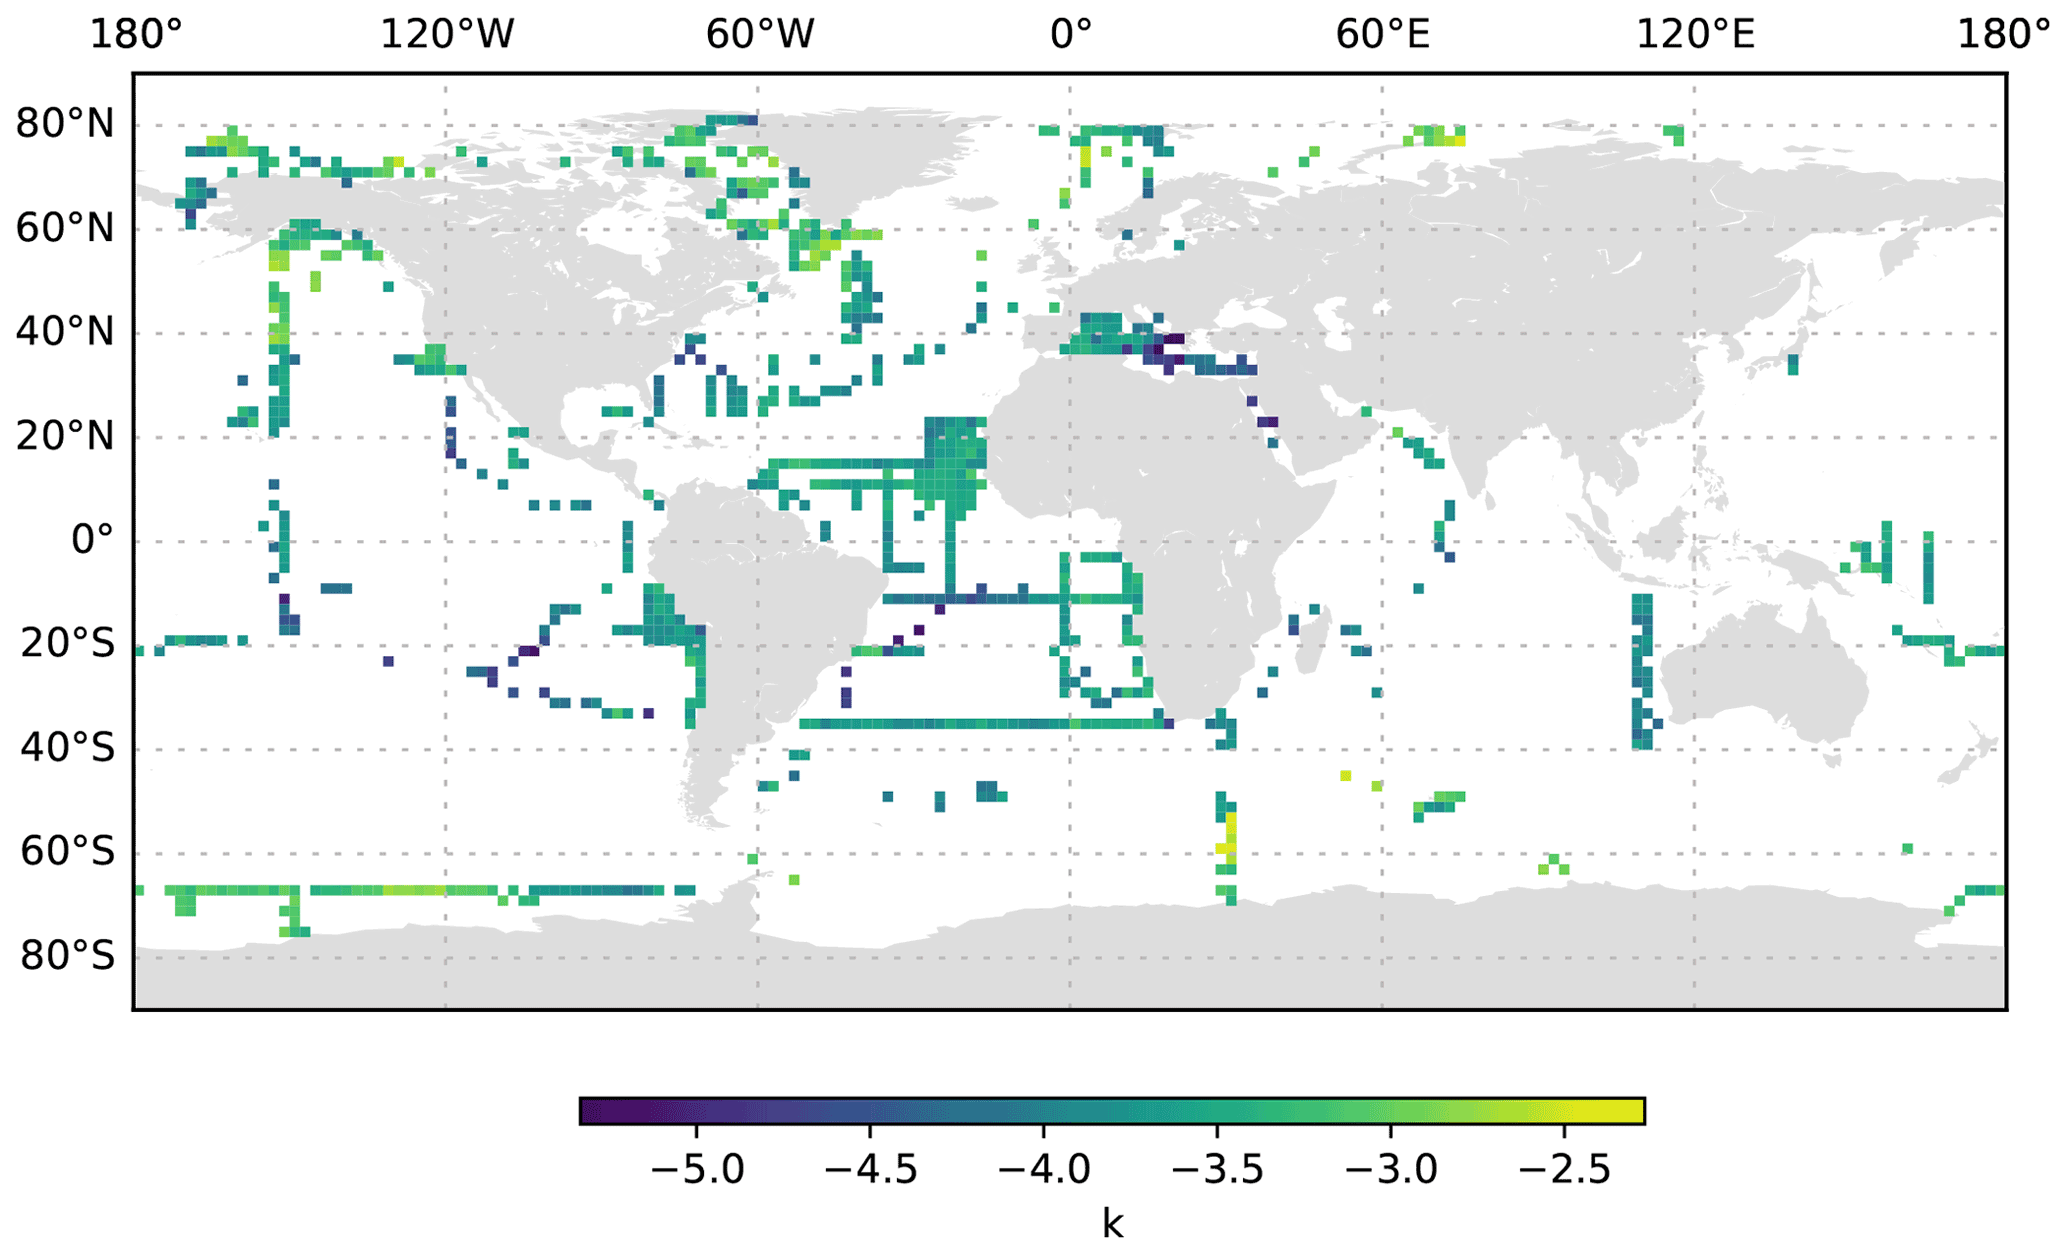
Figure 12k averaged for the 0 to 200 dbar depth layer and per 2∘ grid box. Only profiles at least 200 dbar deep were used for the analysis.
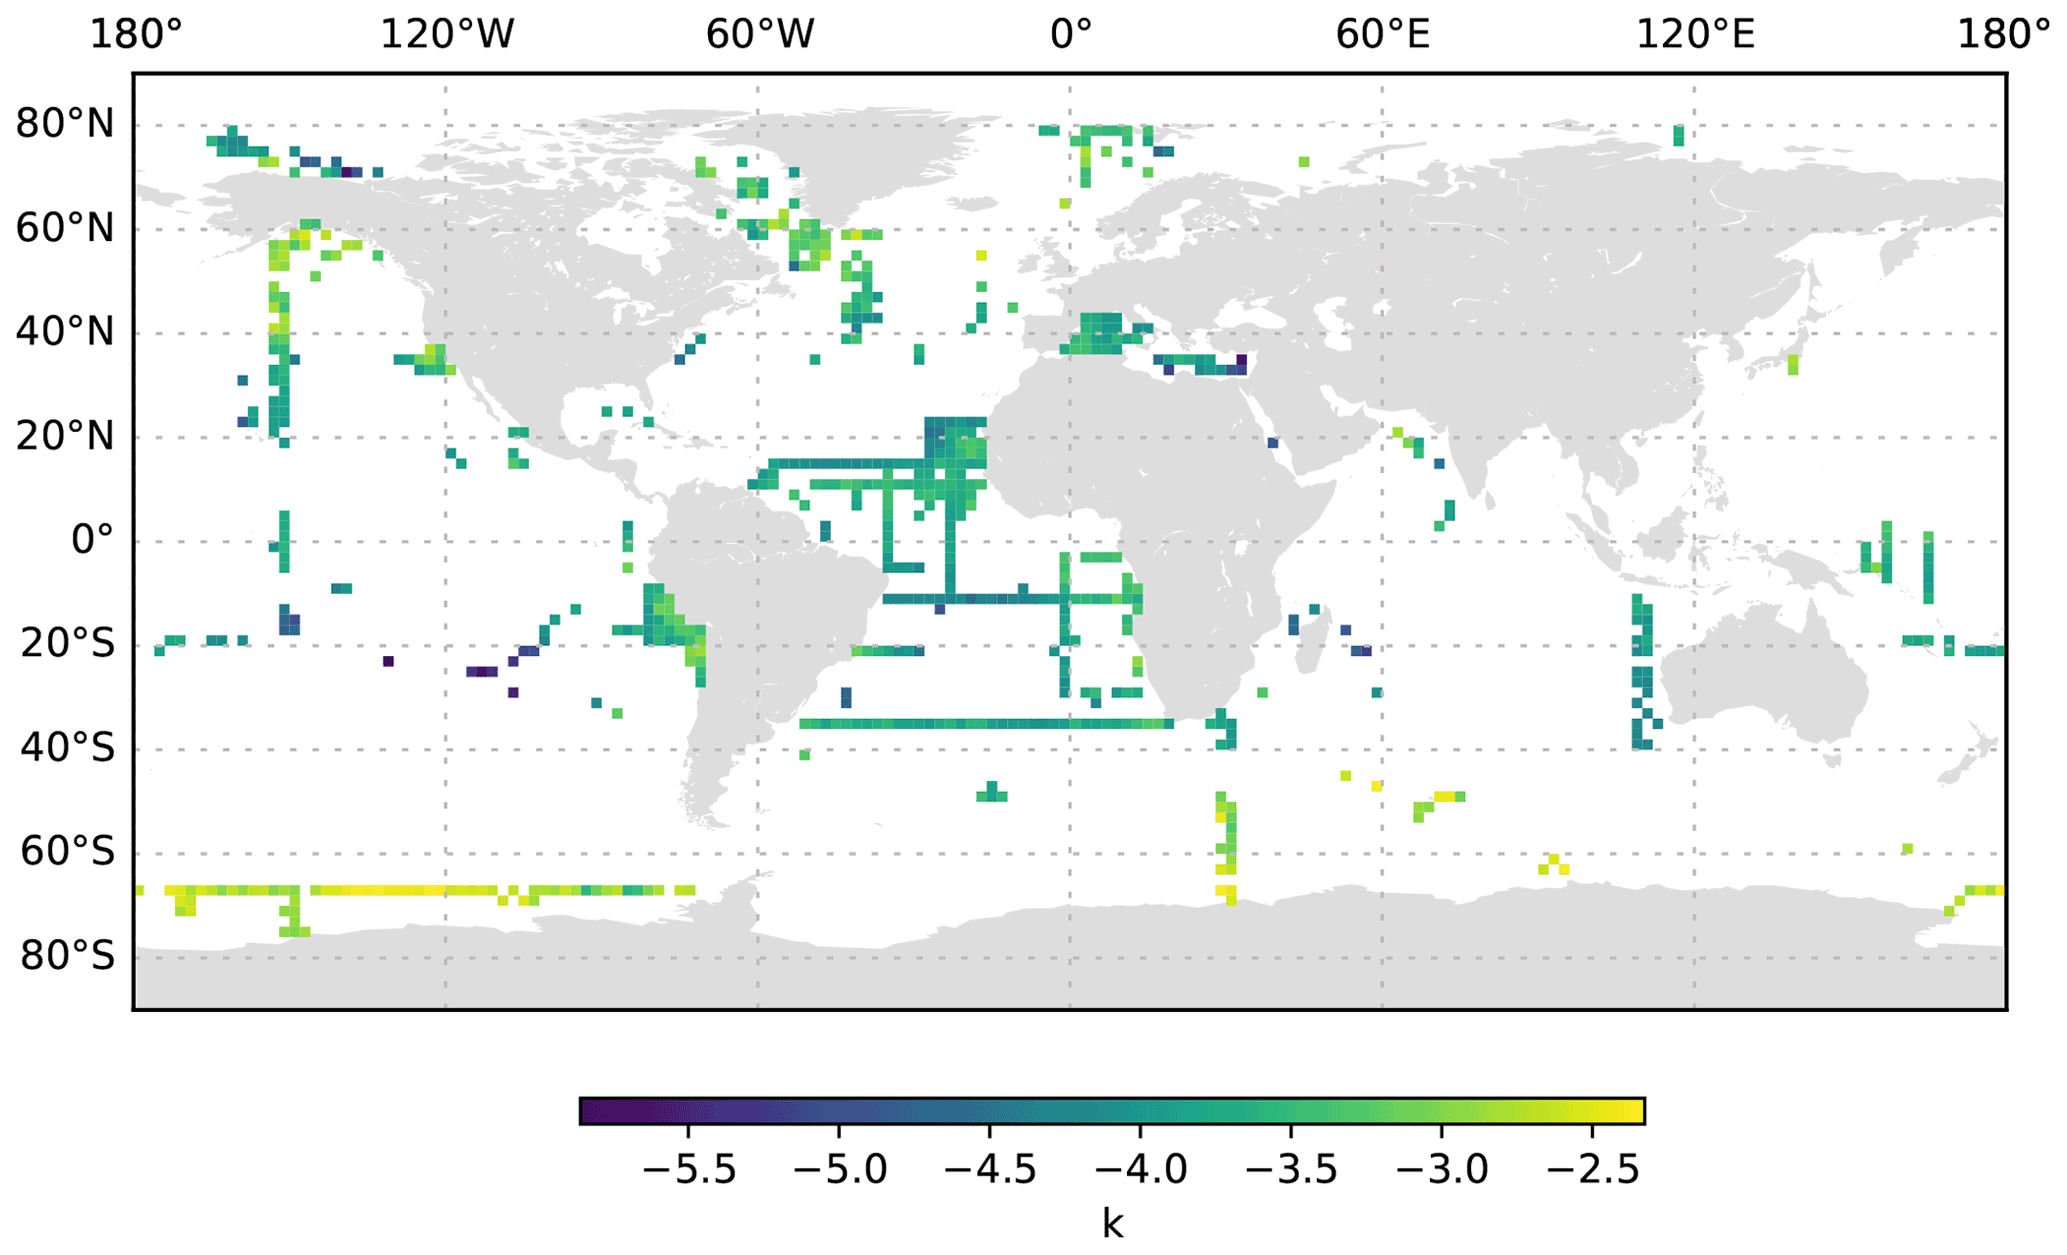
Figure 13k averaged for the 200 to 1000 dbar depth layer and per 2∘ grid box. Only profiles at least 1000 dbar deep were used for the analysis.
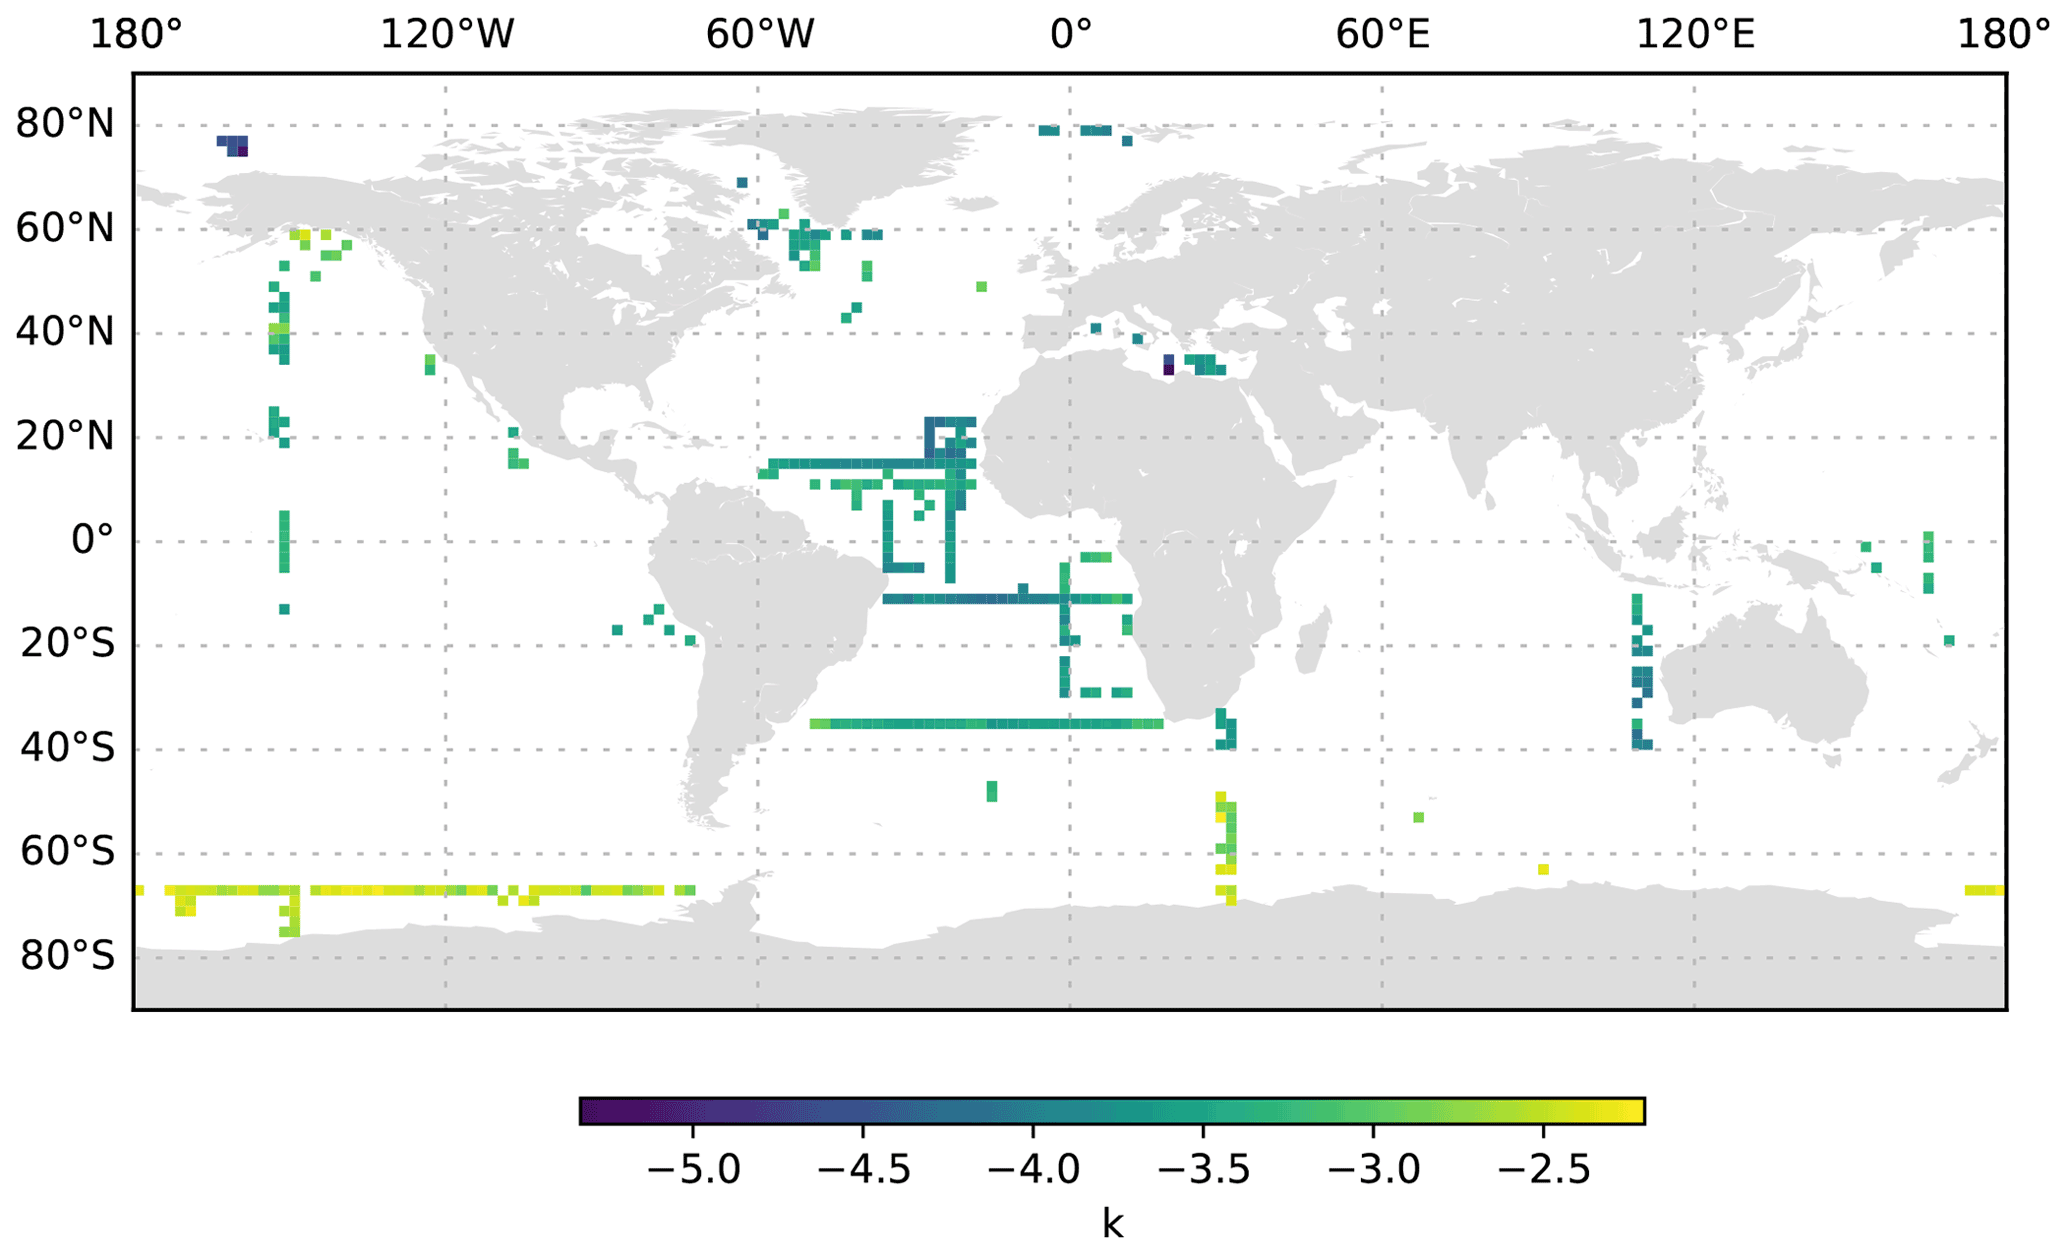
Figure 14k averaged for the 1000 to 3000 dbar depth layer and per 2∘ grid box. Only profiles at least 3000 dbar deep were used for the analysis.
3.4 Potential uses of the data
A further, detailed analysis of the provided dataset is beyond the scope of this article. Observation of a particle at a certain depth always generates the question of how it was formed or how it arrived at the given location. Many attempts have been carried out to relate the UVP particle size spectrum to flux measured in sediment traps or using thorium isotope measurements (Guidi et al., 2008b, 2015; Forest et al., 2013), sinking speed (Stemmann et al., 2002) and POC (Stemmann et al., 2008a), but deriving biogeochemical properties from particle size is certainly an area for future progress. In this regard, our dataset should enable further regional and global analyses of particle dynamics (see e.g. Bisson et al., 2021) and – in combination with flux estimates from sediment traps and/or thorium isotope measurements as well as environmental data from satellites and other sources – enable us to better constrain the particle flux component of the biological pump (see e.g. Clements et al., 2021, 2022). However, we would like to stress that, although the particles in our dataset are not sinking per se (e.g. living zooplankton are also treated as particles), the particle abundance and size alone are still important information. Therefore, the data are also especially useful to constrain models that explicitly generate a particle size spectrum (Bianchi et al., 2018; Niemeyer, 2020; Weber and Bianchi, 2020; Stemmann et al., 2004; Jouandet et al., 2014). Moreover, particle data can also be used to estimate remineralization rates (Kalvelage et al., 2015; Bianchi et al., 2018; Thomsen et al., 2019; Karthäuser et al., 2021) or study trace element scavenging.
3.5 Recommendations for further instrument usage and growth of the dataset
This work presents the first attempt to establish a calibrated global dataset of UVP measurements. Our analysis led us to develop a set of recommendations for future expansion of the global UVP dataset. First of all, we recommend that full depth profiles are always taken at locations shallower than 1000 m depth; otherwise, it is recommended that at least the full mesopelagic region down to 1000 m depth be sampled when using the UVP5. This is motivated by the fact that particle processes (indicated via a large range of e.g. MiP and MaP abundance) at these depths are very dynamic and require high-resolution sampling. Below 1000 m depth, particle spatial patterns are less variable. Nevertheless, if sampling during a research cruise is conducted at water depths >1000 m, full depth profiles or profiles down to the maximum depth rating of the used instruments (typically 6000 m) should be done as often as possible. The deep sea is not well characterized with respect to the abundance and size of particles, and these comparatively small demands on ship time will generate important added value, as this will, for example, enable us to further assess carbon sequestration in the deep sea. It needs to be reiterated that a larger sampling volume will improve count statistics, especially for larger, rarer particles (Bisson et al., 2021). Therefore, sampling programmes should consider conducting repeated profiles at a station to increase the effective sampled volume for a given station. Regions that are currently not well sampled include the Indian Ocean, Antarctic waters and the western Pacific. Furthermore, winter data from both hemispheres are mostly lacking. In general, the UVP should be used during repeat hydrography programmes, as the operational goals of these programmes to cover a representative fraction of the ocean (global and full depth coverage) align with our goals to create a global particle size distribution dataset. The Scientific Committee on Oceanic Research (SCOR) working group 154 “Integration of Plankton-Observing Sensor Systems to Existing Global Sampling Programs (P-OBS)” recommended the use of the UVP during the GO-SHIP programme and similar seagoing expeditions (Boss et al., 2020). Data from the smaller and more versatile UVP6 (Picheral et al., 2022) that can also be deployed on gliders, floats, moorings and other vectors should also be integrated in future datasets and will enable the study of particle dynamics at spatial and temporal scales that are not accessible with the UVP5. Ancillary data that are useful for the interpretation of UVP data are temperature, salinity, oxygen and nutrient measurements; measurements of current dynamics; any measurements of particle dynamics and characteristics (e.g. thorium isotope measurements, lipid content, elemental composition, particle sinking speed and sedimentation flux); and data on bacterioplankton phytoplankton and zooplankton composition. The latter are especially needed to understand the ecological processes behind the observed size spectra of particles and their subsequent export. The evaluation of the relative proportions of living and non-living particles is particularly important at the large size range (a few hundreds of micrometres) because large, possibly sinking particles may be confused with zooplankton and lead to an overestimation of the particle stock and flux (Kiko et al., 2020). In the future, better automatic image classification algorithms may help to discriminate between non-living particles and plankton organisms and even provide information on properties other than their size (Stemmann and Boss, 2012; Trudnowska et al., 2021). We strongly recommend that regular inter-calibration experiments of all instruments against one or several standard units take place to maintain the data quality of all UVP units at an inter-operable level.
The global UVP5 particle dataset (Kiko et al., 2021) is publicly available at https://doi.org/10.1594/PANGAEA.924375. The dataset was downloaded from https://ecopart.obs-vlfr.fr/ on 15 February 2022.
Here, we provide the first global particle size spectra dataset containing 8805 profiles that were obtained with the UVP5 between 2008 and 2020. All of the UVP5 units used were inter-calibrated with a standard procedure, calibration coefficients and metadata were checked, and all profile data were reprocessed. Therefore, this dataset is internally consistent and supersedes earlier versions of cruise-specific UVP5 particle size spectrum data. The analysis of this global dataset shows that particle abundances are high in regions of high primary productivity and in coastal areas. Further analysis of the dataset should enable insights into different aspects of particle dynamics such as the effects of mesoscale features and oxygen minimum zones, the fate of particulate matter in the deep sea, and many other important aspects of the oceans' biogeochemistry.
RK, MP and LS formulated the goals for data aggregation, quality control and the publication of a global UVP5 dataset. RK and MP led the quality control endeavours, supported by all co-authors. RK and LS conceived and drafted the article. All authors participated in writing the article.
The contact author has declared that none of the authors has any competing interests.
Publisher's note: Copernicus Publications remains neutral with regard to jurisdictional claims in published maps and institutional affiliations.
The authors would like to thank Hela Mehrtens (GEOMAR Helmholtz Centre for Ocean Research Kiel, Germany) for her help with the submission to the PANGAEA data archive.
Nelson Mandela University research was supported, in part, by the National Research Foundation of South Africa (grant no. 120174). Lionel Guidi and Fabien Lombard received support via a EU H2020 grant (AtlantEco project; grant no. 862923). Rainer Kiko received support from a “Make Our Planet Great Again” grant from the French National Research Agency within the “Programme d'Investissements d'Avenir” (grant no. ANR-19-MPGA-0012) and from an EU H2020 grant (grant no. 817578; TRIATLAS project). Rainer Kiko and Helena Hauss also received support from the DFG-funded Collaborative Research Center 754 “Climate–Biogeochemistry Interactions in the Tropical Ocean” project (work package B8) and the “CUSCO – Coastal Upwelling System in a Changing Ocean” project (grant no. 03F0813A; work package 5) funded by the Federal Ministry of Education and Research (Germany). The McDonnell Laboratory at the University of Alaska Fairbanks received support from the US National Science Foundation (grant nos. 1654663 and 1656070), the US National Aeronautics and Space Administration (grant no. 80NSSC17K0692), and the M. J. Murdock Charitable Trust. The collection of data by the University of Maine was supported by NASA grants NNX15AE67G (NAAMES) and 80NSSC17K0568 (EXPORTS). This work was also supported by CNRS-INSU through the MISTRALS-MERMEX programme. Lars Stemmann was supported by the Chair Vision between CNRS and Sorbonne University.
This paper was edited by Dirk Fleischer and reviewed by two anonymous referees.
Alldredge, A. L. and Gotschalk, C.: In situ settling behavior of marine snow 1, Limnol. Oceanogr., 33, 339–351, 1988. a
Alldredge, A. L. and Silver, M. W.: Characteristics, dynamics and significance of marine snow, Prog. Oceanogr., 20, 41–82, 1988. a, b, c
Asper, V. L.: Measuring the flux and sinking speed of marine snow aggregates, Deep-Sea Res., 34, 1–17, 1987. a
Beebe, W.: A Round Trip to Davy Jone's Locker, National Geographic Magazine, LIX, 653–678, 1931. a
Benfield, M. C., Grosjean, P., Culverhouse, P. F., Irigoien, X., Sieracki, M. E., Lopez-Urrutia, A., Dam, H. G., Hu, Q., Davis, C. S., Hansen, A., Pilskaln, C. H., Riseman, E. M., Schultz, H., Utgoff, P. E., and Gorsky, G.: RAPID: research on automated plankton identification, Oceanography, 20, 172–187, 2007. a
Bianchi, D., Weber, T. S., Kiko, R., and Deutsch, C.: Global Niche of Marine Anaerobic Metabolisms Expanded by Particle Microenvironments, Nat. Geosci., 11, 263–268, https://doi.org/10.1038/s41561-018-0081-0, 2018. a, b, c, d, e
Biard, T., Stemmann, L., Picheral, M., Mayot, N., Vandromme, P., Hauss, H., Gorsky, G., Guidi, L., Kiko, R., and Not, F.: In situ imaging reveals the biomass of giant protists in the global ocean, Nature, 532, 504–507, 2016. a
Bisson, K. M., Kiko, R., Siegel, D. A., Guidi, L., Picheral, M., Boss, E., and Cael, B. B.: Sampling uncertainties of particle size distributions and derived fluxes, https://doi.org/10.1002/essoar.10508460.1, 2021. a, b, c
Boss, E., Waite, A. M., Uitz, J., Acinas, S. G., Sosik, H. M., Fennel, K., Berman-Frank, I., Cornejo, M., Thomalla, S., Yamazaki, H., Batten, S., Berg, J., Claustre, H., Grégori, G., Karstensen, J., Muller-Karger, F., Richardson, A., Sloyan, B., Wanninkhof, R., Ras, J., Dimier, C., Cetinić, I., Duforêt, L., Clemenston, L., Ferrera, I., Gasol, J. M., Massana, R., Sánchez, P., Sebastián, M., Sunagawa, S., Garczarek, L., de Vargas, C., Pesant, S., Mathew, S., Campbell, L., Brosnahan, M., Poulton, N., Marie, D., Gaube, P., Downie, R., Kloser, R., Lee, W.-J., Sato, M., Roesler, C., Dall'Olmo, G., Slade, W., Twardowski, M., Gardner, W., Briggs, N., Xing, X., Organelli, E., Frouin, R., Barone, B., McDonnel, A., Liu, Y., Chase, A., Miloslavich, P., Lombard, F., Behrenfeld, M., Jumars, P., and Karp-Boss, L.: Recommendations for plankton measurements on the GO-SHIP program with relevance to other sea-going expeditions, SCOR Working Group 154 GO-SHIP Report, https://doi.org/10.25607/OBP-718, 2020. a
Boyd, P. W., Claustre, H., Levy, M., Siegel, D. A., and Weber, T.: Multi-Faceted Particle Pumps Drive Carbon Sequestration in the Ocean, Nature, 568, 327–335, https://doi.org/10.1038/s41586-019-1098-2, 2019. a
Checkley Jr., D., Davis, R., Herman, A., Jackson, G., Beanlands, B., and Regier, L.: Assessing plankton and other particles in situ with the SOLOPC, Limnol. Oceanogr., 53, 2123–2136, 2008. a
Christiansen, S., Hoving, H.-J., Schütte, F., Hauss, H., Karstensen, J., Körtzinger, A., Schröder, S.-M., Stemmann, L., Christiansen, B., Picheral, M., Brandt, P., Robison, B., Koch, R., and Kiko, R.: Particulate matter flux interception in oceanic mesoscale eddies by the polychaete Poeobius sp., Limnol. Oceanogr., 63, 2093–2109, 2018. a, b
Clements, D. J., Yang, S., Weber, T., McDonnell, A., Kiko, R., Stemmann, L., and Bianchi, D.: Constraining the ocean's biological pump with in situ optical observations and supervised learning. Part 2: Carbon Flux, Earth and Space Sciene Open Archive, https://www.essoar.org/doi/10.1002/essoar.10509084.3 (last access: 2 September 2022), 2021. a
Clements, D. J., Yang, S., Weber, T., McDonnell, A. M. P., Kiko, R., Stemmann, L., and Bianchi, D.: Constraining the Particle Size Distribution of Large Marine Particles in the Global Ocean With In Situ Optical Observations and Supervised Learning, Global Biogeochem. Cycles, 36, e2021GB007276, https://doi.org/10.1029/2021GB007276, 2022. a
Cózar, A., Echevarría, F., González-Gordillo, J. I., Irigoien, X., Úbeda, B., Hernández-León, S., Palma, Á. T., Navarro, S., García-de-Lomas, J., Ruiz, A., Fernández-de-Puelles, M. L., and Duarte, C. M.: Plastic debris in the open ocean, P. Natl. Acad. Sci. USA, 111, 10239–10244, 2014. a
de Madron, X. D., Radakovitch, O., Heussner, S., Loye-Pilot, M., and Monaco, A.: Role of the climatological and current variability on shelf-slope exchanges of particulate matter: Evidence from the Rhône continental margin (NW Mediterranean), Deep-Sea Res. Pt. I, 46, 1513–1538, 1999. a
de Madron, X. D., Ramondenc, S., Berline, L., Houpert, L., Bosse, A., Martini, S., Guidi, L., Conan, P., Curtil, C., Delsaut, N., Kunesch, S., Ghiglione, J. F., Marsaleix, P., Pujo-Pay, M., Séverin, T., Testor, P., and Tamburini, C.: Deep sediment resuspension and thick nepheloid layer generation by open-ocean convection, J. Geophys. Res.-Oceans, 122, 2291–2318, 2017. a
Duarte, C. M., Marbà, N., Gacia, E., Fourqurean, J. W., Beggins, J., Barrón, C., and Apostolaki, E. T.: Seagrass Community Metabolism: Assessing the Carbon Sink Capacity of Seagrass Meadows, Global Biogeochem. Cy., 24, GB4032, https://doi.org/10.1029/2010GB003793, 2010. a
Fiedler, B., Grundle, D. S., Schütte, F., Karstensen, J., Löscher, C. R., Hauss, H., Wagner, H., Loginova, A., Kiko, R., Silva, P., Tanhua, T., and Körtzinger, A.: Oxygen utilization and downward carbon flux in an oxygen-depleted eddy in the eastern tropical North Atlantic, Biogeosciences, 13, 5633–5647, https://doi.org/10.5194/bg-13-5633-2016, 2016. a
Forest, A., Stemmann, L., Picheral, M., Burdorf, L., Robert, D., Fortier, L., and Babin, M.: Size distribution of particles and zooplankton across the shelf-basin system in southeast Beaufort Sea: combined results from an Underwater Vision Profiler and vertical net tows, Biogeosciences, 9, 1301–1320, https://doi.org/10.5194/bg-9-1301-2012, 2012. a, b
Forest, A., Babin, M., Stemmann, L., Picheral, M., Sampei, M., Fortier, L., Gratton, Y., Bélanger, S., Devred, E., Sahlin, J., Doxaran, D., Joux, F., Ortega-Retuerta, E., Martín, J., Jeffrey, W. H., Gasser, B., and Carlos Miquel, J.: Ecosystem function and particle flux dynamics across the Mackenzie Shelf (Beaufort Sea, Arctic Ocean): an integrative analysis of spatial variability and biophysical forcings, Biogeosciences, 10, 2833–2866, https://doi.org/10.5194/bg-10-2833-2013, 2013. a, b
German, C. R. and Von Damm, K. L.: 6.07 – Hydrothermal Processes, edited by: Holland, H. D. and Turekian, K. K., Treatise on Geochemistry, Pergamon, 181–222, ISBN 9780080437514, https://doi.org/10.1016/B0-08-043751-6/06109-0, 2003. a
Giering, S. L. C., Cavan, E. L., Basedow, S. L., Briggs, N., Burd, A. B., Darroch, L. J., Guidi, L., Irisson, J.-O., Iversen, M. H., Kiko, R., Lindsay, D., Marcolin, C. R., McDonnell, A. M. P., Möller, K. O., Passow, U., Thomalla, S., Trull, T. W., and Waite, A. M.: Sinking Organic Particles in the Ocean–Flux Estimates From in situ Optical Devices, Frontiers in Marine Science, 6, 834, https://doi.org/10.3389/fmars.2019.00834, 2020. a
Gorsky, G., Picheral, M., and Stemmann, L.: Use of the Underwater Video Profiler for the study of aggregate dynamics in the North Mediterranean, Estuar. Coast. Shelf S., 50, 121–128, 2000. a, b
Gorsky, G., Prieur, L., Taupier-Letage, I., Stemmann, L., and Picheral, M.: Large particulate matter in the Western Mediterranean: I. LPM distribution related to mesoscale hydrodynamics, J. Marine Syst., 33, 289–311, 2002. a
Guidi, L., Gorsky, G., Claustre, H., Miquel, J. C., Picheral, M., and Stemmann, L.: Distribution and fluxes of aggregates >100 µm in the upper kilometer of the South-Eastern Pacific, Biogeosciences, 5, 1361–1372, https://doi.org/10.5194/bg-5-1361-2008, 2008a. a, b, c
Guidi, L., Jackson, G. A., Stemmann, L., Miquel, J. C., Picheral, M., and Gorsky, G.: Relationship between particle size distribution and flux in the mesopelagic zone, Deep-Sea Res. Pt. I, 55, 1364–1374, https://doi.org/10.1016/j.dsr.2008.05.014, 2008b. a, b
Guidi, L., Stemmann, L., Jackson, G. A., Ibanez, F., Claustre, H., Legendre, L., Picheral, M., and Gorskya, G.: Effects of phytoplankton community on production, size, and export of large aggregates: A world-ocean analysis, Limnol. Oceanogr., 54, 1951–1963, 2009. a, b, c, d, e
Guidi, L., Calil, P. H. R., Duhamel, S., Björkman, K. M., Doney, S. C., Jackson, G. A., Li, B., Church, M. J., Tozzi, S., Kolber, Z. S., Richards, K. J., Fong, A. A., Letelier, R. M., Gorsky, G., Stemmann, L., and Karl, D. M.: Does eddy-eddy interaction control surface phytoplankton distribution and carbon export in the North Pacific Subtropical Gyre?, J. Geophys. Res.-Biogeo., 117, G02024, https://doi.org/10.1029/2012JG001984, 2012. a
Guidi, L., Legendre, L., Reygondeau, G., Uitz, J., Stemmann, L., and Henson, S. A.: A new look at ocean carbon remineralization for estimating deepwater sequestration, Global Biogeochem. Cy., 29, 1044–1059, https://doi.org/10.1002/2014GB005063, 2015. a, b, c
Hauss, H., Christiansen, S., Schütte, F., Kiko, R., Edvam Lima, M., Rodrigues, E., Karstensen, J., Löscher, C. R., Körtzinger, A., and Fiedler, B.: Dead zone or oasis in the open ocean? Zooplankton distribution and migration in low-oxygen modewater eddies, Biogeosciences, 13, 1977–1989, https://doi.org/10.5194/bg-13-1977-2016, 2016. a
Herman, A. W.: Design and calibration of a new optical plankton counter capable of sizing small zooplankton, Deep-Sea Res., 39, 395–415, 1992. a
Honjo, S., Doherty, K. W., Agrawal, Y. C., and Asper, V. L.: Direct optical assessment of large amorphous aggregates (marine snow) in the deep ocean, Deep-Sea Res., 31, 67–76, 1984. a, b
Jackson, G. A.: A model of the formation of marine algal flocs by physical coagulation processes, Deep-Sea Res., 37, 1197–1211, 1990. a, b
Jackson, G. A., Logan, B. E., Alldredge, A. L., and Dam, H. G.: Combining particle size spectra from a mesocosm experiment measured using photographic and aperture impedance (Coulter and Elzone) techniques, Deep-Sea Res. Pt. II, 42, 139–157, 1995. a, b
Jouandet, M.-P., Jackson, G. A., Carlotti, F., Picheral, M., Stemmann, L., and Blain, S.: Rapid formation of large aggregates during the spring bloom of Kerguelen Island: observations and model comparisons, Biogeosciences, 11, 4393–4406, https://doi.org/10.5194/bg-11-4393-2014, 2014. a, b, c
Kalvelage, T., Lavik, G., Jensen, M. M., Revsbech, N. P., Löscher, C., Schunck, H., Desai, D. K., Hauss, H., Kiko, R., Holtappels, M., LaRoche, J., Schmitz, R. A., Graco, M. I., and Kuypers, M. M. M.: Aerobic Microbial Respiration In Oceanic Oxygen Minimum Zones, PLoS ONE, 10, e0133526, https://doi.org/10.1371/journal.pone.0133526, 2015. a, b
Karthäuser, C., Ahmerkamp, S., Marchant, H. K., Bristow, L. A., Hauss, H., Iversen, M. H., Kiko, R., Maerz, J., Lavik, G., and Kuypers, M. M. M.: Small Sinking Particles Control Anammox Rates in the Peruvian Oxygen Minimum Zone, 12, 3235, https://doi.org/10.1038/s41467-021-23340-4, 2021. a, b
Katz, J., Donaghay, P., Zhang, J., King, S., and Russell, K.: Submersible holocamera for detection of particle characteristics and motions in the ocean, Deep-Sea Res. Pt. I, 46, 1455–1481, 1999. a
Kiko, R., Biastoch, A., Brandt, P., Cravatte, S., Hauss, H., Hummels, R., Kriest, I., Marin, F., McDonnell, A. M. P., Oschlies, A., Picheral, M., Schwarzkopf, F. U., Thurnherr, A. M., and Stemmann, L.: Biological and physical influences on marine snowfall at the equator, Nat. Geosci., 10, 852–858, 2017. a, b, c, d, e, f
Kiko, R., Brandt, P., Christiansen, S., Faustmann, J., Kriest, I., Rodrigues, E., Schütte, F., and Hauss, H.: Zooplankton-Mediated Fluxes in the Eastern Tropical North Atlantic, Frontiers in Marine Science, 7, 358, https://doi.org/10.3389/fmars.2020.00358, 2020. a, b, c
Kiko, R., Picheral, M., Antoine, D., Babin, M., Berline, L., Biard, T., Boss, E., Brandt, P., Carlotti, F., Christiansen, S., Coppola, L., de la Cruz, L., Diamond-Riquier, E., de Madron, X. D., Elineau, A., Gorsky, G., Guidi, L., Hauss, H., Irisson, J.-O., Karp-Boss, L., Karstensen, J., Gyun Kim, D., Lekanoff, R. M., Lombard, F., Lopes, R. M., Marec, C., McDonnell, A., Niemeyer, D., Noyon, M., O'Daly, S., Ohman, M., Pretty, J. L., Rogge, A., Searson, S., Shibata, M., Tanaka, Y., Tanhua, T., Taucher, J., Trudnowska, E., Turner, J. S., Waite, A. M., and Stemmann, L.: The global marine particle size distribution dataset obtained with the Underwater Vision Profiler 5 – version 1, PANGAEA [data set], https://doi.org/10.1594/PANGAEA.924375, 2021. a, b, c
Lampitt, R., Hillier, W., and Challenor, P.: Seasonal and diel variation in the open ocean concentration of marine snow aggregates, Nature, 362, 737–739, 1993. a
Lombard, F., Boss, E., Waite, A. M., Vogt, M., Uitz, J., Stemmann, L., Sosik, H. M., Schulz, J., Romagnan, J.-B., Picheral, M., Pearlman, J., Ohman, M. D., Niehoff, B., Möller, K. O., Miloslavich, P., Lara-Lpez, A., Kudela, R., Lopes, R. M., Kiko, R., Karp-Boss, L., Jaffe, J. S., Iversen, M. H., Irisson, J.-O., Fennel, K., Hauss, H., Guidi, L., Gorsky, G., Giering, S. L. C., Gaube, P., Gallager, S., Dubelaar, G., Cowen, R. K., Carlotti, F., Briseño-Avena, C., Berline, L., Benoit-Bird, K., Bax, N., Batten, S., Ayata, S. D., Artigas, L. F., and Appeltans, W.: Globally Consistent Quantitative Observations of Planktonic Ecosystems, Frontiers in Marine Science, 6, https://doi.org/10.3389/fmars.2019.00196, 2019. a
Ludwig, W. and Probst, J.-L.: River sediment discharge to the oceans; present-day controls and global budgets, Am. J. Sci., 298, 265–295, 1998. a, b
Many, G., de Madron, X. D., Verney, R., Bourrin, F., Renosh, P., Jourdin, F., and Gangloff, A.: Geometry, fractal dimension and settling velocity of flocs during flooding conditions in the Rhône ROFI, Estuar. Coast. Shelf S., 219, 1–13, 2019. a
McCave, I.: Local and global aspects of the bottom nepheloid layers in the world ocean, Neth. J. Sea Res., 20, 167–181, 1986. a
McCave, I. N.: Nepheloid Layers, in: Encyclopedia of Ocean Sciences (Second Edition), edited by: Steele, J. H., Academic Press, Oxford, 8–18, https://doi.org/10.1016/B978-012374473-9.00671-8, 2009. a
Neal, E. G., Hood, E., and Smikrud, K.: Contribution of glacier runoff to freshwater discharge into the Gulf of Alaska, Geophys. Res. Lett., 37, L06404, https://doi.org/10.1029/2010GL042385, 2010. a
Niemeyer, D.: Modelling features of the biological pump and its impact on marine oxygen distribution, PhD thesis, https://macau.uni-kiel.de/receive/macau_mods_00000642 (last access: 2 September 2022), 2020. a, b
O'Hern, T. J., d'Agostino, L., and Acosta, A. J.: Comparison of Holographic and Coulter Counter Measurements of Cavitation Nuclei in the Ocean, J. Fluids Eng., 110, 200–207, https://doi.org/10.1115/1.3243535, 1988. a
Picheral, M., Guidi, L., Stemmann, L., Karl, D. M., Iddaoud, G., and Gorsky, G.: The Underwater Vision Profiler 5: An advanced instrument for high spatial resolution studies of particle size spectra and zooplankton, Limnol. Oceanogr.-Meth., 8, 462–473, 2010. a, b, c, d, e
Picheral, M., Catalano, C., Brousseau, D., Claustre, H., Coppola, L., Leymarie, E., Coindat, J., Dias, F., Fevre, S., Guidi, L., Irisson, J. O., Legendre, L., Lombard, F., Mortier, L., Penkerch, C., Rogge, A., Schmechtig, C., Thibault, S., Tixier, T., Waite, A., and Stemmann, L.: The Underwater Vision Profiler 6: an imaging sensor of particle size spectra and plankton, for autonomous and cabled platforms, Limnol. Oceanogr.-Meth., 20, 115–129, https://doi.org/10.1002/lom3.10475, 2022. a, b
Puig, P., de Madron, X. D., Salat, J., Schroeder, K., Martín, J., Karageorgis, A. P., Palanques, A., Roullier, F., Lopez-Jurado, J. L., Emelianov, M., Moutin, T., and Houpert, L.: Thick bottom nepheloid layers in the western Mediterranean generated by deep dense shelf water cascading, Prog. Oceanogr., 111, 1–23, 2013. a, b
Ratmeyer, V. and Wefer, G.: A high resolution camera system (ParCa) for imaging particles in the ocean: System design and results from profiles and a three-month deployment, J. Mar. Res., 54, 589–603, 1996. a
Ratmeyer, V., Fischer, G., and Wefer, G.: Lithogenic particle fluxes and grain size distributions in the deep ocean off northwest Africa: Implications for seasonal changes of aeolian dust input and downward transport, Deep-Sea Res. Pt. I, 46, 1289–1337, 1999. a
Remsen, A., Hopkins, T. L., and Samson, S.: What You See Is Not What You Catch: A Comparison of Concurrently Collected Net, Optical Plankton Counter, and Shadowed Image Particle Profiling Evaluation Recorder Data from the Northeast Gulf of Mexico, Deep-Sea Res. Pt. I, 51, 129–151, https://doi.org/10.1016/j.dsr.2003.09.008, 2004. a
Roullier, F., Berline, L., Guidi, L., Durrieu De Madron, X., Picheral, M., Sciandra, A., Pesant, S., and Stemmann, L.: Particle size distribution and estimated carbon flux across the Arabian Sea oxygen minimum zone, Biogeosciences, 11, 4541–4557, https://doi.org/10.5194/bg-11-4541-2014, 2014. a, b
Sheldon, R. and Parsons, T.: A practical manual on the use of the Coulter Counter in marine science, Coulter Electronics, Toronto, 66, 1967. a
Stemmann, L. and Boss, E.: Plankton and particle size and packaging: from determining optical properties to driving the biological pump, Annu. Rev. Mar. Sci., 4, 263–290, 2012. a, b, c, d, e, f, g
Stemmann, L., Picheral, M., and Gorsky, G.: Diel variation in the vertical distribution of particulate matter (>0.15 mm) in the NW Mediterranean Sea investigated with the Underwater Video Profiler, Deep-Sea Res. Pt. I, 47, 505–531, 2000. a, b
Stemmann, L., Gorsky, G., Marty, J.-C., Picheral, M., and Miquel, J.-C.: Four-year study of large-particle vertical distribution (0–1000 m) in the NW Mediterranean in relation to hydrology, phytoplankton, and vertical flux, Deep-Sea Res. Pt. II, 49, 2143–2162, 2002. a, b, c, d
Stemmann, L., Jackson, G. A., and Ianson, D.: A vertical model of particle size distributions and fluxes in the midwater column that includes biological and physical processes – Part I: model formulation, Deep-Sea Res. Pt. I, 51, 865–884, 2004. a, b, c, d, e
Stemmann, L., Eloire, D., Sciandra, A., Jackson, G. A., Guidi, L., Picheral, M., and Gorsky, G.: Volume distribution for particles between 3.5 to 2000 µm in the upper 200 m region of the South Pacific Gyre, Biogeosciences, 5, 299–310, https://doi.org/10.5194/bg-5-299-2008, 2008a. a, b, c, d, e
Stemmann, L., Prieur, L., Legendre, L., Taupier-Letage, I., Picheral, M., Guidi, L., and Gorsky, G.: Effects of frontal processes on marine aggregate dynamics and fluxes: An interannual study in a permanent geostrophic front (NW Mediterranean), J. Marine Syst., 70, 1–20, 2008b. a, b, c
Stemmann, L., Youngbluth, M., Robert, K., Hosia, A., Picheral, M., Paterson, H., Ibanez, F., Guidi, L., Lombard, F., and Gorsky, G.: Global zoogeography of fragile macrozooplankton in the upper 100–1000 m inferred from the underwater video profiler, ICES J. Mar. Sci., 65, 433–442, 2008c. a
Stemmann, L., Picheral, M., Guidi, L., Lombard, F., Prejger, F., Claustre, H., and Gorsky, G.: Assessing the spatial and temporal distributions of zooplankton and marine particles using the Underwater Vision Profiler. In: Sensors for ecology: Towards integrated knowledge of ecosystems, edited by: Le Galliard, J. F., Guarini, J. F., and Gail, F., CNRS, Institut Ecologie et Environnement, 119–137, 2012. a
Suzuki, N. and Kato, K.: Studies on suspended materials marine snow in the sea: Part I. Sources of marine snow, Bulletin of the Faculty of Fisheries of Hokkaido University, 4, 132–137, 1953. a, b
Thomsen, S., Karstensen, J., Kiko, R., Krahmann, G., Dengler, M., and Engel, A.: Remote and local drivers of oxygen and nitrate variability in the shallow oxygen minimum zone off Mauritania in June 2014, Biogeosciences, 16, 979–998, https://doi.org/10.5194/bg-16-979-2019, 2019. a, b
Trudnowska, E., Lacour, L., Ardyna, M., Rogge, A., Irisson, J. O., Waite, A. M., Babin, M., and Stemmann, L.: Marine Snow Morphology Illuminates the Evolution of Phytoplankton Blooms and Determines Their Subsequent Vertical Export, Nat. Commun., 12, 2816, https://doi.org/10.1038/s41467-021-22994-4, 2021. a, b
Vilgrain, L., Maps, F., Picheral, M., Babin, M., Aubry, C., Irisson, J.-O., and Ayata, S.-D.: Trait-Based Approach Using in Situ Copepod Images Reveals Contrasting Ecological Patterns across an Arctic Ice Melt Zone, Limnol. Oceanogr., 66, 1155–1167, https://doi.org/10.1002/lno.11672, 2021. a
Waite, A. M., Stemmann, L., Guidi, L., Calil, P. H., Hogg, A. M. C., Feng, M., Thompson, P. A., Picheral, M., and Gorsky, G.: The wineglass effect shapes particle export to the deep ocean in mesoscale eddies, Geophys. Res. Lett., 43, 9791–9800, 2016. a
Weber, T. and Bianchi, D.: Efficient Particle Transfer to Depth in Oxygen Minimum Zones of the Pacific and Indian Oceans, Front. Earth Sci., 8, 376, https://doi.org/10.3389/feart.2020.00376, 2020. a
Wiebe, P. H. and Benfield, M. C.: From the Hensen net toward four-dimensional biological oceanography, Prog. Oceanogr., 56, 7–136, 2003. a
Zhou, M.: What Determines the Slope of a Plankton Biomass Spectrum?, J. Plankton Res., 28, 437–448, https://doi.org/10.1093/plankt/fbi119, 2006. a
Zúñiga, D., Calafat, A., Heussner, S., Miserocchi, S., Sanchez-Vidal, A., Garcia-Orellana, J., Canals, M., Sánchez-Cabeza, J. A., Carbonne, J., Delsaut, N., and Saragoni, G.: Compositional and temporal evolution of particle fluxes in the open Algero–Balearic basin (Western Mediterranean), J. Marine Syst., 70, 196–214, 2008. a
marine particlescomprises detrital aggregates; fecal pellets; bacterioplankton, phytoplankton and zooplankton; and even fish. Here, we present a global dataset that contains 8805 vertical particle size distribution profiles obtained with Underwater Vision Profiler 5 (UVP5) camera systems. These data are valuable to the scientific community, as they can be used to constrain important biogeochemical processes in the ocean, such as the flux of carbon to the deep sea.
marine particlescomprises detrital aggregates; fecal pellets; bacterioplankton,...