the Creative Commons Attribution 4.0 License.
the Creative Commons Attribution 4.0 License.
 | 09 Sep 2022
Multitemporal glacier inventory revealing four decades of glacier changes in the Ladakh region
Alagappan Ramanathan
Anshuman Bhardwaj
Millie Coleman
Brice R. Rea
Matteo Spagnolo
Shaktiman Singh
Lydia Sam
Multi-temporal inventories of glacierised regions provide an improved understanding of water resource availability. In this study, we present a Landsat-based multi-temporal inventory of glaciers in four Upper Indus sub-basins and three internal drainage basins in the Ladakh region for the years 1977, 1994, 2009 and 2019. The study records data on 2257 glaciers (of individual size >0.5 km2) covering an area of km2 which is equivalent to ∼30 % of the total glacier population and ∼89 % of the total glacierised area of the region. Glacier area ranged between 0.5±0.02 and 862±16 km2, while glacier length ranged between 0.4±0.02 and 73±0.54 km. Shayok Basin has the largest glacierised area and glacier population, while Tsokar has the least. Results show that the highest concentration of glaciers is found in the higher elevation zones, between 5000 and 6000 m a.s.l., with most of the glaciers facing towards the NW–NE quadrant. The error assessment shows that the uncertainty, based on the buffer-based approach, ranges between 2.6 % and 5.1 % for glacier area, and 1.5 % and 2.6 % for glacier length with a mean uncertainty of 3.2 % and 1.8 %, respectively. This multitemporal inventory is in good agreement with previous studies undertaken in parts of the Ladakh region. The new glacier database for the Ladakh region will be valuable for policy-making bodies, and future glaciological and hydrological studies. The data can be viewed and downloaded from PANGAEA, https://doi.org/10.1594/PANGAEA.940994 (Soheb et al., 2022).
- Article
(7310 KB) - Full-text XML
-
Supplement
(2713 KB) - BibTeX
- EndNote


The Himalaya is the largest storehouse of snow and ice outside the Polar Regions. This large reserve of water plays a crucial role in the hydro-economy of the region (Bolch, 2019; Frey et al., 2014; Maurer et al., 2019; Pritchard, 2019). Any change to the Himalayan cryosphere would have a direct impact on the hydrology, further influencing the communities downstream whose livelihood and economy relies on, and are supported by, the major river systems e.g. the Brahmaputra, Ganges and Indus, among others. In high altitude arid regions like Ladakh, where the majority of glaciers are small and restricted to higher altitudes, meltwater serves as an important driver of the economy, especially in years with low winter precipitation when glacier melt becomes the major (or only) source of water (Schmidt and Nüsser, 2012, 2017). Recent studies have reported that Himalayan glaciers are retreating at an alarming rate (Azam et al., 2021; Bolch, 2019; Kääb et al., 2015; Maurer et al., 2019; Pritchard, 2019; Shean et al., 2020, among others) with glaciers of the Western Himalayas showing less shrinkage than the glaciers of the central and eastern parts (Azam et al., 2021; Shukla et al., 2020; Singh et al., 2016). Glaciers in the nearby Karakoram region display long-term irregular behaviour with frequent glacier advances/surges and minimal shrinkage, which is yet to be fully understood (Azam et al., 2021; Bhambri et al., 2013; Bolch et al., 2012; Kulkarni, 2010; Liu et al., 2006; Minora et al., 2013; Negi et al., 2021). Glaciers of the Karakoram region experienced an increase in area post-2000, due to surge-type glaciers. In just the upper Shayok Valley, as many as 18 glaciers, occupying more than one-third of the glacierised area, showed surge-type behaviour (Bhambri et al., 2011, 2013; Negi et al., 2021). However, not all regions of Ladakh have been analysed at the same level of spatio-temporal detail. In particular, our knowledge of glacier dynamics and their response to climate change is still incomplete in the cold–arid, high-altitude Ladakh region (∼105 476 km2) comprising both the Himalayan and Karakoram ranges. Few studies have focused on the glaciers of this region (e.g. Bhambri et al., 2011, 2013; Chudley et al., 2017; Negi et al., 2021; Nüsser et al., 2012; Schmidt and Nüsser, 2012, 2017; Shukla et al., 2020).
The advent of remote sensing technologies has permitted the mapping and measuring of various glacier attributes even in the absence of sufficient in situ observations (Bhardwaj et al., 2015). Glacierised area estimations have often relied on global and regional glacier inventories such as the Randolph Glacier Inventory (RGI), Global Land Ice Measurements from Space (GLIMS), Geological Survey of India (GSI) inventory and Space Application Centre India (SAC) inventory, among others (Chinese Glacier Inventory (CGI), Glacier Area Mapping for Discharge from the Asian Mountains (GAMDAM), International Centre for Integrated Mountain Development (ICIMOD)). However, given the large scale of these inventories, automated techniques are employed, in most of the cases, to map and calculate glacier extent with differing levels of success. Additionally, the varying quality of satellite imagery acquired from different time periods are sometimes necessitated in high mountain areas, such as Ladakh. Together, these two factors can lead to over- or under-estimation of glacier areas leading to erroneous information on temporal change. Moreover, there is no multi-temporal glacier inventory available for the entire Ladakh region, which can inform us on the changes in the natural frozen water reserves which have put the water security of this entire cold–arid region under significant stress during recent years. The residents of Ladakh have witnessed a decrease in agricultural yields, the main driver of economic development of the region, due to a decrease in water resources (Barrett and Bosak, 2018). The water scarcity together with an increase in tourism footprint (four times more tourists (327 366) in 2018 than 2010, a number that is more than the entire population of Ladakh) has led to a shift in livelihood from agriculture to other commercial activities (Müller et al., 2020), though even the latter relies heavily on water resources. In order to cope with water scarcity, some people of Ladakh have developed new water management techniques, commonly known as “ice reservoirs” or “ice stupas”, to supplement agricultural activities (Nüsser et al., 2019a, b).
This study presents a new multi-temporal glacier inventory for the Union Territory of Ladakh, India, covering 42 years of change between 1977 and 2019. This new dataset and analyses of glacier distribution will help to improve understanding of the glacier dynamics and the impact of ongoing climate change on water resources in the Ladakh region, where glaciers are the only source of water in the dry season. The inventories are entirely based on Landsat images acquired mostly during late summer with additional quality control provided through high-resolution PlanetScope and Google Earth imagery. We further establish a comparison with the existing inventories and data available in recent studies from the region. The dataset produced in this study can be viewed and downloaded from PANGAEA, https://doi.org/10.1594/PANGAEA.940994 (Soheb et al., 2022).
This study focuses on glaciers in the Upper Indus Basin (UIB) upstream of Skardu and three internal drainage/endorheic basins (IDBs) within Ladakh, namely Tsokar, Tsomoriri and Pangong basins. The geographic extent of the study area lies within a latitude of 31.1 to 35.6∘ N and a longitude of 75.1 to 81.8∘ E and covers a vast region of the Karakoram and Western Himalayan ranges. UIB has an area of ∼105 476 km2, of which ∼8302 km2 (8 %) is glacierised by ∼6300 glaciers spanning elevations between ∼3400 and ∼7500 m a.s.l. (as per RGI 6.0). IDBs of Tsokar (1036 km2), Tsomoriri (5462 km2) and Pangong (21 206 km2) house ∼30, 345 and 812 glaciers, comprising a glacierised area of ∼7 (0.6 %), 185 (3.4 %) and 437 (2.1 %) km2, respectively (as per RGI 6.0). The glaciers of IDBs are at a comparatively higher elevation, spanning from ∼4800 to ∼6800 m a.s.l. Meltwater from these glaciers drains into the lakes within each basin. Pangong Lake (a saline lake), situated at an elevation of ∼4241 m a.s.l., is the largest with an area of ∼703 km2. Both Tsomoriri (freshwater lake at ∼4522 m a.s.l.) and Tsokar (saline lake at ∼4531 m a.s.l.) lakes are designated Ramsar sites which occupy areas of ∼140 and ∼15 km2, respectively. Since the majority of the investigated area (UIB and IDBs combined) falls within Ladakh, the combined area of UIB and IDBs will be referred to as “Ladakh region” hereafter.
Figure 1Location map of the study area: the boundaries of studied Upper Indus Basin and internal drainage basins are outlined in black and red on the digital elevation model (DEM) and in the inset map. Inset map shows the study area with respect to the Himalayan and Karakoram region. Black dots and stars represent the respective basins' major settlements and field-investigated glaciers. The background image (ASTER GDEM) courtesy: NASA/METI/AIST/Japan Space Systems and U.S./Japan ASTER Science Team, https://earthdata.nasa.gov/ (last access: 17 June 2020).
The Ladakh region has a cold–arid climate due to the rain shadow and elevation effects of the Himalaya and Karakoram mountains (Schmidt and Nüsser, 2017). Mean annual air temperature and annual precipitation range between 0 to 10 ∘C and 20 to 145 mm, respectively (Hersbach et al., 2020; Fig. 2). This region is inhabited by ∼700 000 people (as per Census of India, 2011; Census of China, 2020), most of which are directly, or indirectly, dependent on snow and glacier meltwater to support hydropower generation, irrigation and domestic needs.

Figure 2Mean annual (a, c) and monthly (b, d) temperature and precipitation at Shiquanhe and Leh stations.
3.1 Data
This study utilises multiple Landsat level-1 precision and terrain (L1TP) corrected scenes (63 scenes in total) from four different periods: 1977±5 (hereafter 1977), 1994±1 (hereafter 1994), 2009 and 2019±1 (hereafter 2019). Scenes from the 1970s are majorly (12 out of 17) from the year 1976 and 1977, however due to higher cloud cover and less availability of imagery during the earlier Landsat period, five scenes from 1972, 1979 and 1980 were also included to aid the digitisation of glaciers (Table S1 in the Supplement). Images from late in the ablation season (July–October), having least snow and cloud cover (<30 % overall, and not over the glacierised parts), were selected and used for glacier identification and boundary delineation. Advanced Spaceborne Thermal Emission and Reflection Radiometer global digital elevation model (ASTER GDEM) scenes were also used for basin delineation and calculating slope, aspect and elevation metrics of the glaciers. Glacier digitisation, basin delineation and calculation of area were all performed in ArcGIS 10.4. Details of the imagery used in this study are presented in (Tables 1 and S1).
Table 1Information on the satellite imagery used in this study (detailed information in Table S1).
3.2 Basin delineation
Basin delineation was carried using ASTER GDEM V003 and the hydrology tool in ArcGIS. The input DEM was first analysed to fill in all sinks with careful consideration of the potential for basin area over-estimation (Khan et al., 2014). UIB was delineated using a pour point selected at the Indus River in Skardu as we aimed to assess all the tributary basins of the Ladakh region. The UIB obtained by this approach was further divided into second-order tributary basins, i.e. Shayok, Suru, Zanskar and Leh basins. A small portion of the leftover area from UIB after second-order tributary basin delineation was merged into the Leh Basin in order to investigate the UIB upstream of Skardu. Delineation of the three endorheic basins (IDBs) that lie partially or completely in the Ladakh region, i.e. Tsokar, Tsomoriri and Pangong basins, was also carried out using the same method with the help of respective lakes as a pour point. The digitisation of the three lakes (Tsokar, Tsomoriri and Pangong lakes) was carried out manually for the years 1977, 1994, 2009 and 2019 using Landsat imagery.
3.3 Glacier mapping
Glaciers were mapped using a two-way approach, closely following the Global Land Ice Measurements from Space (GLIMS) guidelines (Paul et al., 2009): (1) automatic mapping of the clean glacier and (2) manually correcting the glacier outlines and digitisation of debris cover. First, a band ratio approach between NIR (near infrared) and SWIR (shortwave infrared) (as suggested by Paul et al., 2002, 2015; Racoviteanu et al., 2009; Bhardwaj et al., 2015; Schmidt and Nüsser, 2017; Smith et al., 2015; Winsvold et al., 2014, 2016) with a threshold of 2.0 (NIR/SWIR ice/snow) was used on 2019 Landsat OLI images to delineate the clean part of glaciers. A median filter of kernel size 3×3 was applied to remove the isolated and small pixels outside the glacier area. The NIR and SWIR band ratio approach is good at distinguishing glacier pixels from water features with similar spectral reflectance values (Racoviteanu et al., 2009; Zhang et al., 2019). This approach failed in areas with high snow/cloud cover, shadows, frozen channels/lakes and debris cover. The snow/cloud cover and frozen lakes/stream problems were addressed by selecting Landsat scenes from the ablation period (July–October) with the cloud cover <30 %. The issue with the snow-covered regions in accumulation zones, where the delineation was the most challenging, was resolved using the best available imagery of any time between 1977 and 2019 because glaciers are not expected to change their shape significantly in the higher accumulation zones. One of the major issues was the debris-covered glaciers, which had to be manually digitised, with the support of high-resolution Google Earth and PlanetScope imagery from 2019±2. The result was then used as a basis for manual digitisation of debris-covered glaciers in other years where high-resolution images are not available. In most cases, identification of the glacier terminus was made with certain contextual characteristics at the snout, e.g. the emergence of meltwater streams, proglacial lakes, ice walls, end moraines (Fig. S1 in the Supplement).
The glacier outlines from 2019 were used as a starting point for the subsequent digitisation of glacier areas in 2009, 1994 and 1977. Glacier length was measured using a semi-automatic approach, by employing the DEM to identify a central flow line for each mapped glacier (Ji et al., 2017; Le Bris and Paul, 2013). Further manual corrections were undertaken to account for the flow lines of glaciers that have multiple tributaries and multiple highest/lowest points. Furthermore, some mapping errors are still expected to be present in this inventory due to a possible misinterpretation of glacier features, and the quantification of such errors are difficult owing to the lack of reliable reference in situ data in the Ladakh region. Such errors were minimised by keeping a fixed map–scale of 1:10 000 in most cases, and undertaking a quality check on glacier outlines using high-resolution images. In case of MSS images and smaller glaciers, a map–scale of 1:25 000 was also used whenever required.
Other specific glacier attributes were also extracted including new glacier IDs, Global Land Ice Measurements from Space (GLIMS)-0IDs, Randolph Glacier Inventory (RGI 6.0)–IDs, coordinates (latitude and longitude), elevation (maximum, mean and minimum), aspect (mean), slope (mean), area, length (maximum), area uncertainty and length uncertainty.
3.4 Uncertainty
This study involves the use of satellite imagery to extract various glacier parameters. It is therefore subject to uncertainties which may arise mainly from four different sources: (1) the quality of the image (with potential issues due to seasonal snow, shadows and cloud cover), (2) sensor characteristics (spatial/spectral resolution), (3) interpretation of glacial features and methodology used and (4) post-processing techniques (Le Bris and Paul, 2013; Paul et al., 2013, 2017; Racoviteanu et al., 2009, 2019). Error due to sources 1, 3 and 4 are generally minor and can be visually identified and corrected (Sect. 3.3), but an exact quantification is difficult due to the lack of reference data available from the region (Racoviteanu et al., 2009; Shukla et al., 2020). Type 4 errors are significant and have an impact on both glacier area and length estimation. Therefore, we applied a buffer-based assessment to glacier areas with the buffer width set to one pixel for debris-covered and a half pixel for clean ice (Bolch et al., 2010; Granshaw and Fountain, 2006; Mölg et al., 2018; Paul et al., 2017; Racoviteanu et al., 2009; Shukla et al., 2020; Tielidze and Wheate, 2018), given that the level 1TP Landsat images were corrected to sub-pixel geometric accuracy (Bhambri et al., 2013). A buffer-based method provides the maximum and minimum estimates of uncertainty with respect to glacier size, where the values vary with size of the glacier and spatial resolution of the imagery used. Thus, it is more specific to the dataset and most recommended when there are no reliable reference data available (Paul et al., 2017; Racoviteanu et al., 2009; Shukla et al., 2020). The same approach was also followed to estimate the uncertainties in lake areas with one pixel as the buffer width.
The associated uncertainty for smaller glaciers (< 0.5 km2) amounts to ∼12 %–25 %. Therefore, all the glaciers with an area of less than 0.5 km2, which comprise ∼70 % and ∼10 % of the total glacier count and glacierised area, respectively, are not included in this study. For the remaining glaciers, the uncertainty in glacier area ranged between ±2.1 % and ±7.2 % depending on the spatial resolution of the satellite imagery and the individual glacier size. The highest uncertainty was for the year 1977 due to the coarser spatial resolution of Landsat MSS data when applied to the smallest glaciers (0.5–1 km2). For most of the glaciers, lengths are assumed to be accurate to ±1 pixel at the terminus (Le Bris and Paul, 2013). Therefore, a buffer of one pixel was set to determine the uncertainty in glacier length. The length uncertainty ranged between ±1.5 % and ±2.6 % with maximum uncertainty observed for the smallest glacier category (0.5–1 km2). The methods yielded an overall uncertainty of 4.2 %, 1.8 % and 1.5 % for glacier area, glacier length and lake area, respectively (Table S2).
Uncertainties related to other attributes (mean elevation, mean slope and mean aspect) of the inventory are difficult to estimate due to the use of the ASTER GDEM product in this study, which was developed using a collage of archived scenes acquired between 2000 and 2013. In addition, the local undulations and surface change over time will have only marginal effects on parameters (elevation, slope and aspect) that are averaged over the entire glacier as averaging compensates for most of the changes (Frey and Paul, 2012). However, for parameters like maximum and minimum elevations, where one cell is used and no averaging is applied, the uncertainty is m, as the vertical accuracy of ASTER GDEM is ±8.55 m for glacierised areas of high Asia (Yao et al., 2020) and ±8.86 m elsewhere (Mukherjee et al., 2013).
4.1 General statistics
In total, 2257 glaciers (>0.5 km2) were compiled in the current inventory (Table 2), with a total glacierised area of , 8173±215, 8096±214 and 7923±106 km2 for the years 1977, 1994, 2009 and 2019, respectively. The glacierised area corresponds to ∼6 % of the Ladakh region with individual areas ranging between 0.5±0.02 and 862±16 km2. Glacier length in the Ladakh region varies between 0.4±0.02 and 73±0.54 km with a mean length of 2.9±0.05 km. About 90 % of the glaciers are shorter than 5 km in length while only 6 % of glaciers have a length of <1 km. Larger glaciers are mainly located in the Shayok and Zanskar basins with the Siachen Glacier being the largest (862±16 km2), longest (73±0.54 km) and covering the greatest elevation range of ∼3616 m (3702–7318 m a.s.l.). The major lakes in each endorheic basins of Pangong, Tsokar and Tsomoriri occupy an area of 3 %, 2 % and 2.5 %, respectively. The lake areas for the year 1977, 1994, 2009 and 2019 were 610±14, 619±8, 669±8 and 705±8 km2 for Pangong, 13.5±0.9, 17±0.7, 18.3±0.7 and 18.8±0.6 km2 for Tsokar, and 140±2.6, 141±1.3, 141±1.3 and 141±1.1 km2, respectively.
4.2 Glacier distribution in the Ladakh region
Glacierised areas and population in the Ladakh region vary across basins. Shayok Basin has the largest distribution of glacierised area and population (74 % and 56 %), whereas the Tsokar Basin has the least (0.04 % and 0.1 %), respectively (Table 2). Based on size distribution, the glacier area category of 1–5 km2 comprises the highest area (28 % of the total), while the category of 50–100 km2 occupies the least glacierised area (9 %) of the region. Most glaciers (∼90 % of the total) in the Ladakh region have an area of <5 km2 but occupy only 37 % of the total glacierised area. The population and area of glaciers in each area class are different in each basin but the proportion of glaciers, smaller than 5 km2, is greater than 87 % in all basins. Glaciers larger than 100 km2 (n=7, <1 % of the total) are only present in the Shayok Basin and occupy ∼24 % and 32 % of the total glacierised area of Ladakh and Shayok Basin, respectively.
4.3 Glacier hypsometry, slope and aspect
Figure 3iii and iv show the glacier elevations and hypsometry with 100 m elevation intervals of seven basins of the Ladakh region. The highest and lowest glacier elevation are 7740 and 3249 m a.s.l., both in the Shayok Basin. Whereas mean elevation of the glacier ranges between 4345–6355 m a.s.l. (Fig. 3iii). Small glaciers mainly occupy the higher elevations above 5500, and vice versa. The majority (73 %, 5810 km2) of the glacierised area is distributed in the 5000–6000 m a.s.l. elevation range, while only 14 % is located below 5000 m and 13 % above 6000 m a.s.l. (Fig. 3iv). The mean slope of these glaciers ranges between 8 and 46∘, and is found to decrease with increasing glacier area. Glaciers with an area greater than 100 km2 (n=7, <1 % of the total) have the lowest mean slope of 13∘ wherea higher mean slopes (23∘) are found for smaller glaciers (43 % of the total). Overall, the mean glacier slope is ∼21∘ (Fig. 3v). Around 74 % (1665) of the glaciers face the northern quadrant (NW–NE) amounting to ∼50 % (3940 km2) of the glacierised area. While 9 %, 5 %, 3 %, 3 % and 4 % of the glaciers face East, South-East, South, South-West and West which constitute 24 %, 6 %, 8 %, 6 % and 6 % of the glacierised area, respectively. However, the orientation and respective area coverage of glaciers vary within individual basins (Fig. 3i and ii).
Table 2Basin-wide glacier information of Ladakh region based on present study for the year 2019.
Figure 3General statistics of the glaciers in the Ladakh region: orientation of glaciers (i) and associated area distribution (ii), maximum, minimum and mean elevation of glaciers (iii), hypsometry of glacierised area (iv) and slope against glacier area (v) and elevation (vi).
5.1 The produced dataset and limitations
The multitemporal inventory of glaciers (>0.5 km2) in the Ladakh region for the years 1977, 1994, 2009 and 2019 is available at PANGAEA portal (https://doi.org/10.1594/PANGAEA.940994; Soheb et al., 2022). The dataset is provided in two different GIS-ready file formats, i.e. GeoPackages (*.gpkg) and Shapefiles (*.dbf, *.prj, *.sbn, *.sbx, *.shp, *.shx) to support wider end users. GeoPackage is a relatively new and open-source file format which is now being widely used and supported, whereas Shapefile format is one of the most widely used proprietary but open file formats for vector datasets, supported by open-source GIS tools such as QGIS. The outlines of glaciers, basins and lakes are all referenced to the WGS 84/UTM zone 43N datum. For each region, there is one file for basin outlines, and four files for glacier and lake (if present) outlines for 1977, 1994, 2009 and 2019. Each glacier outline file contains glacier IDs (New glacier IDs, Randolph Glacier Inventory 6.0 IDs, and Global Land Ice Measurements from Space initiative IDs), coordinates (latitude and longitude), elevation (maximum, mean and minimum), aspect (mean), slope (mean), area, length (maximum), area uncertainty and length uncertainty. Whereas the lake outline file contains coordinates, area, elevation and area uncertainty.
When using this dataset it is important to understand the key limitations of such regional-scale glacier inventories. Some of the key user limitations of the dataset are: (1) glaciers smaller than 0.5 km2 (which comprise ∼70 % and ∼10 % of the total glacier population and glacierised area, respectively) were not included in this inventory due to the higher uncertainty (∼12 %–25 %) associated with these glacier outlines; (2) inventories produced in this study are entirely based on the medium-resolution Landsat imagery, in the same way as other global or regional-scale glacier inventories. Although the uncertainty associated with these inventories do not considerably impact regional-scale analyses, care should be taken while using these data for a small subset of glaciers. It should also be noted that it is not feasible to produce multitemporal inventories regionally using high-resolution datasets due to the paucity and high costs of such high-resolution datasets; (3) the inventories of 1977±5, 1994±1 and 2019±1 are produced using images with a range of acquisition dates due to the lack of data continuity within a particular year (more details in Sect. 3.1); and (4) the time periods chosen in this study are based on the availability of datasets and sufficient temporal gaps between the datasets to allow multitemporal glacio-hydrological analyses.
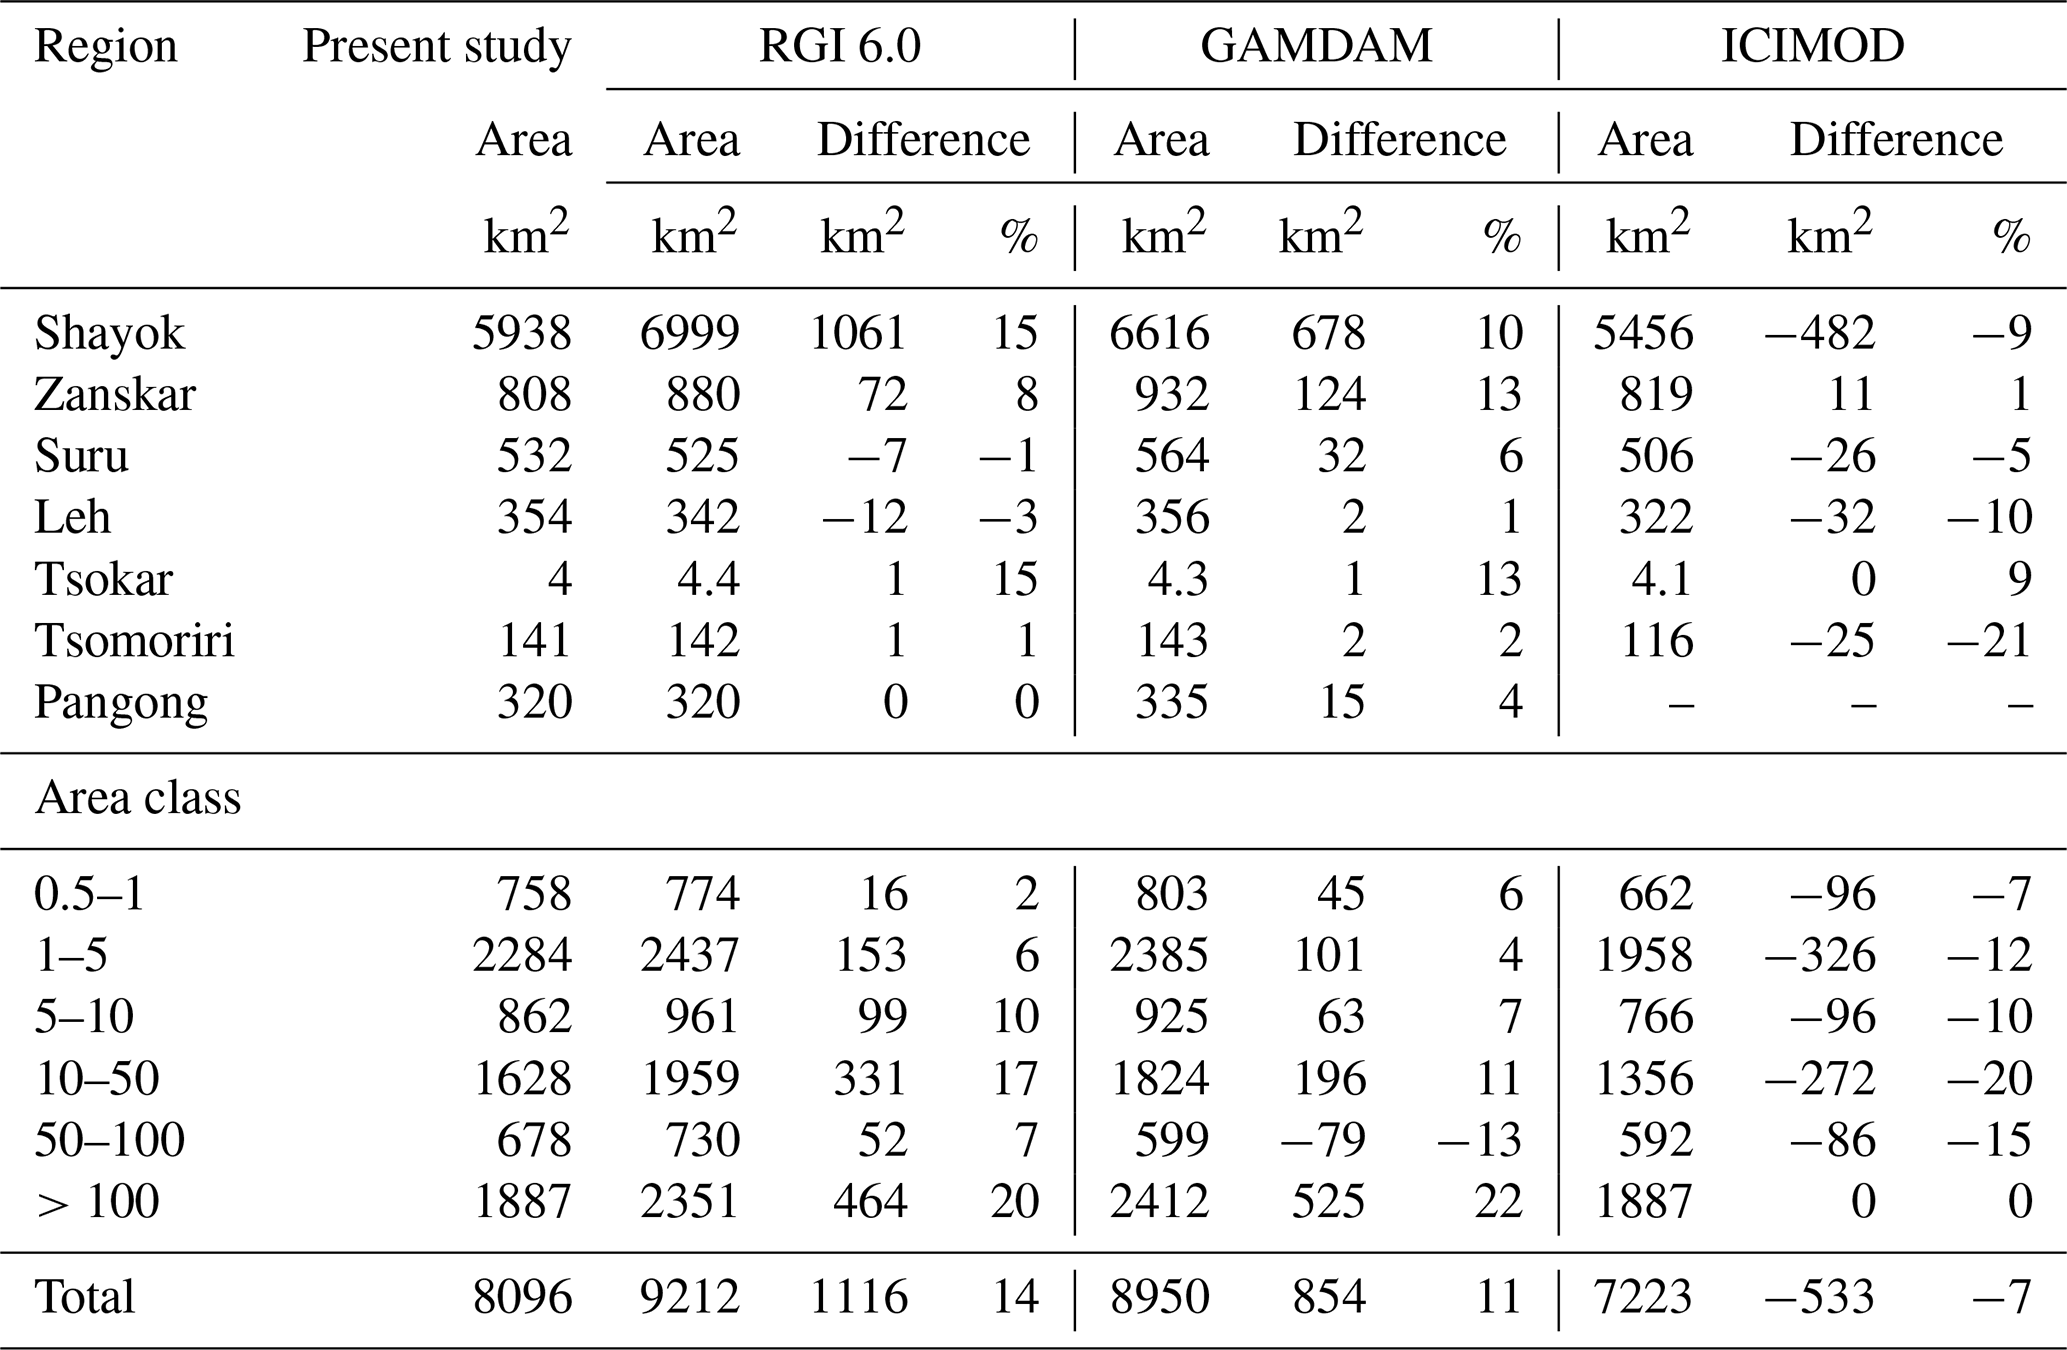
Table 3Basin and class-wise comparison of the glacierised area between the present study and other inventories (RGI 6.0, ICIMOD and GAMDAM).
5.2 Significance of the present inventory
The glacier inventory presented here has several improvements compared to the existing regional and global inventories. Firstly, it covers the glaciers (>0.5 km2; n=2257; km2) for the entire Ladakh region with manual correction and quality control undertaken using freely available high-resolution images. The analyses were further extended to estimate the distribution of ice masses at the sub-basin scale. Secondly, the temporal aspect of the glacierised area will aid hydrological and glaciological modelling aimed at understanding past and future system evolution. Finally, the new inventory will aid both the scientific community studying the glaciers and water resources of the Ladakh region, and the administration of the Union Territory of Ladakh, Government of India in developing efficient mitigation and adaptation strategies by improving the projections of change on timescales relevant to policy makers.
5.3 Comparison of inventories in the Ladakh region
Differences in estimates of the glacierised areas are meaningful as they can lead to an over or underestimation of the available water resources. Therefore, correctly estimating glacier area over time is necessary for understanding glacier dynamics, future response to climate forcing and the water resources they provide. Table 3 presents a comparison between the present inventory and the Randolph Glacier Inventory (RGI) 6.0 (Pfeffer et al., 2014), the International Centre for Integrated Mountain Development (ICIMOD) inventory (Bajracharya et al., 2011, 2019; Williams, 2013) and the Glacier Area Mapping for Discharge in Asian Mountains (GAMDAM) inventory (Guo et al., 2015; Nuimura et al., 2015; Sakai, 2019) for the Ladakh region. The comparison involves glacier outlines for 2009 from the present study and excludes glaciers smaller than 0.5 km2 from regional inventories to achieve the closest match temporally and for glacier size categories. This should be taken as a first-order comparison, given the fact that the uncertainties have been estimated with different approaches for the different inventories. Specifically, the uncertainty estimated for the GAMDAM and ICIMOD inventories differs only slightly to the one applied here, given that they used a normalised standard deviation approach on the datasets produced by several operators on the same subset of glaciers (Bajracharya et al., 2011, 2019; Guo et al., 2015; Nuimura et al., 2015; Sakai, 2019). Whereas, in case of RGI 6.0 inventory, the uncertainty estimation approach differs significantly from the one presented here, because their errors were calculated on a collection of glaciers due to the vast quantity of data acquired from multiple sources and approaches used to produced them (Pfeffer et al., 2014). Figure 4 presents a comparison of the only three inventories (present, RGI 6.0 and ICIMOD) for the five field-investigated glaciers of Ladakh region because RGI and GAMDAM inventories share the same outlines for these glaciers.
The comparison showed a higher glacierised area in the RGI/GAMDAM inventories and lower in the ICIMOD inventory (Table 3) than the present inventory, with most of the differences contributed by the basins having the higher glacierised areas (Shayok and Zanskar) and from the larger glaciers (>10 km2). Such inconsistencies among the inventories are a product of several factors, e.g. (1) absence of change in glaciers over time due to the use of imagery with a wide range of acquisition years (Fig. 4a, c, d); (2) misinterpretation of the glacier terminus due to icing, debris, snow and cloud cover (Nagai et al., 2016); and (3) the methodology used. The smaller difference between the present and the ICIMOD inventory is mainly due to the adoption of a similar technique (i.e. a semi-automated approach) and the shorter time frame of the analysis that generated the ICIMOD inventory (i.e. 2002–2009).
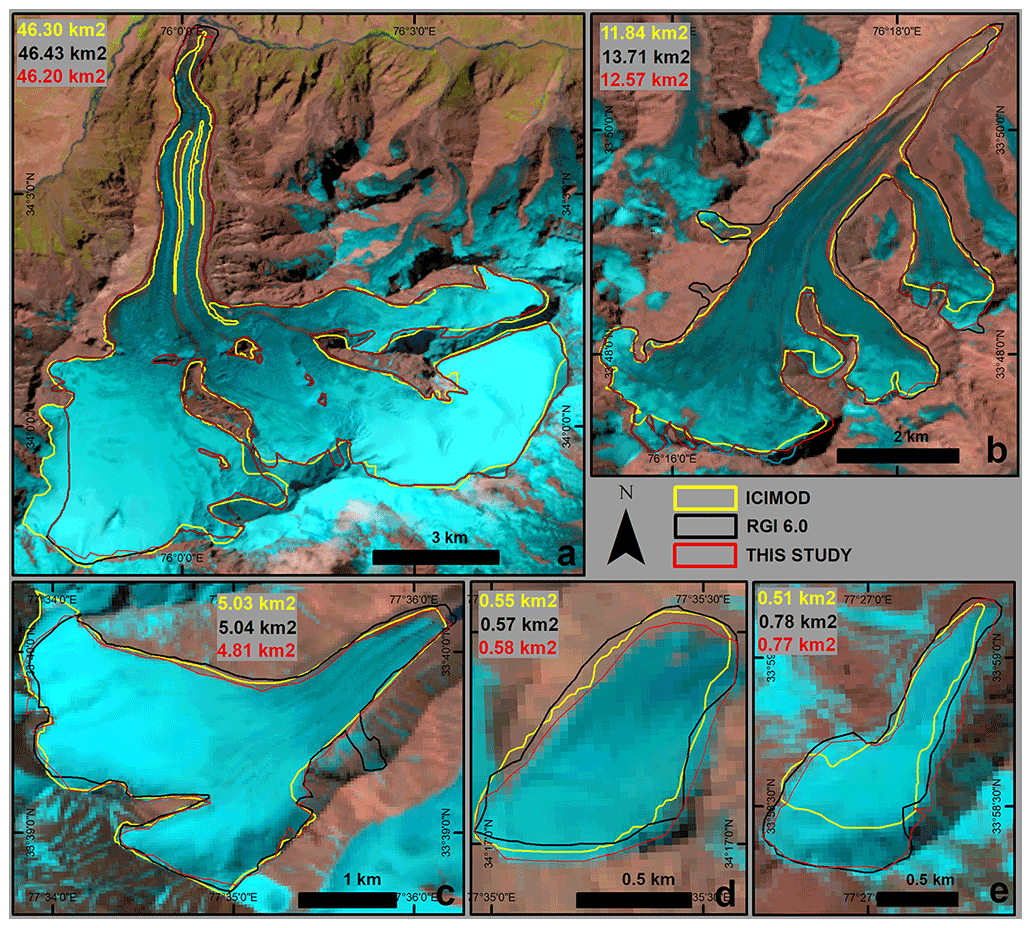
Figure 4Comparison of inventories on the field-investigated glaciers of the Ladakh region: (a) Parkachik Glacier, Suru Basin; (b) Pensila Glacier, Suru Basin; (c) Lato Glacier, Leh Basin; (d) Khardung Glacier, Shayok Basin; (e) Stok Glacier, Leh Basin. The background image (Landsat) courtesy: U.S. Geological Survey/NASA, https://earthexplorer.usgs.gov/ (last access: 17 June 2020).
5.4 Comparison with recent studies
The data from the recent spatio-temporal change studies from different sub-regions of Ladakh (Fig. 5) are not in the public domain, except from Shukla et al. (2020). Hence, it is not possible to use these to validate our results. Therefore, our comparison mostly focuses on the rate of change for some of the individual glaciers (n=21, Fig. 5) from the literature and the bulk properties of a set of glaciers in different regions (Table S3, Fig. 6). Our results agree well with the studies conducted by others (Bhambri et al., 2013; Chudley et al., 2017; Garg et al., 2022a, b, 2021; Negi et al., 2021; Schmidt and Nüsser, 2012, 2017; Shukla et al., 2020) on individual glaciers of various sizes and on a set of glaciers, respectively (Fig. 6, Table S3). However, the results differ significantly only on some glaciers and especially in a part of the Shayok Basin (e.g. Kumdan (D), Aktash (E) and Thusa glaciers(I)). In the Shayok Basin, surge-type glaciers are common (Bhambri et al., 2013, 2017); the difference in analysis period between the present and other studies is the likely cause of the difference in glacier area statistics. Figure S2 presents the dynamics of the Kumdan and Aktash glaciers as an example of surge-type glacier of this region.
No significant difference was observed in rate of change of glacierised areas between the present study and other studies in the Leh, Tsomoriri, Zaskar and Suru basins. In contrast, the number of glaciers and glacierised area vary among these studies (present and others) but paint a similar picture of relatively lower retreat in the Shayok Basin (Bhambri et al., 2013; Negi et al., 2021), higher in Leh, Tsokar, Tsomoriri (Chudley et al., 2017; Schmidt and Nüsser, 2012, 2017), and moderate in Zanskar and Suru basins (Garg et al., 2022a, b; Shukla et al., 2020).
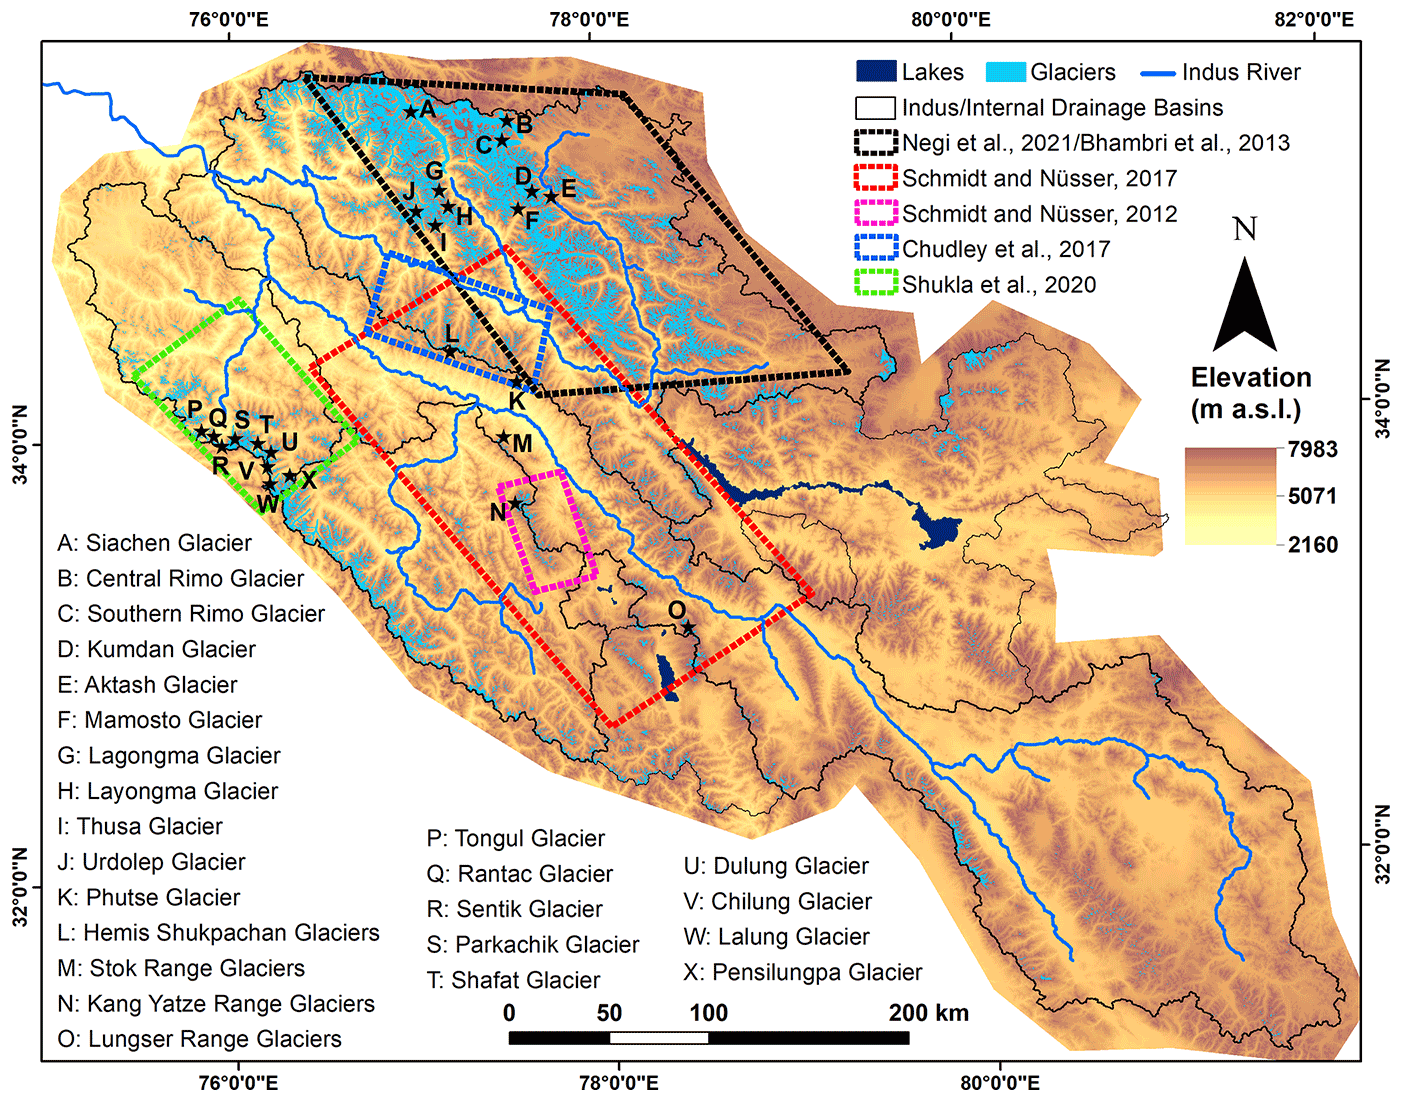
Figure 5Presenting the spatial extent of different studies undertaken in Ladakh region. Black stars represent the individual glaciers. The background image (ASTER GDEM) courtesy: NASA/METI/AIST/Japan Space Systems and U.S./Japan ASTER Science Team, https://earthdata.nasa.gov/ (last access: 17 June 2020).

Figure 6Comparison between the present study and other studies undertaken in different basins of Ladakh region over different time periods.
The entire dataset of the Landsat-based multitemporal inventory of glaciers, larger than 0.5 km2, in Ladakh region for the years 1977, 1994, 2009 and 2019 is available at PANGAEA, https://doi.org/10.1594/PANGAEA.940994 (Soheb et al., 2022).
We compiled a new glacier inventory of the Ladakh region for 1977, 1994, 2009 and 2019 based on 63 Landsat (MSS, TM and OLI) images, with least cloud/snow cover, acquired during the summertime (July–October). The inventory includes 2257 glaciers, larger than 0.5 km2, covering an area of km2 which is ∼14 % and ∼11 % less than the RGI 6.0 and the GAMDAM, and 7 % more than the ICIMOD inventories. The glacierised area accounts for ∼6 % of the Ladakh region with individual glacier areas ranging between 0.5±0.02 and 862±16 km2. About 90 % of the glacier population are smaller than 5 km2 but combined they occupy only 37 % of the glacierised area. The seven largest glaciers, larger than 100 km2, account for ∼1879 km2 or 24 % of the total. The Shayok Basin and glacier area category 1–5 km2 hosts the highest number of glacier population and glacierised area; whereas, Tsokar Basin accounts for the least. More than 70 % of the glaciers are in the north-facing quadrant (NW–NE) and are concentrated in the higher elevation zones, between 5000 and 6000 m a.s.l. The error assessment shows that the uncertainty, based on a buffer-based approach, ranges between 2.6 % and 5.1 % for glacier area, and 1.5 % and 2.6 % for glacier length with a mean uncertainty of 3.2 % and 1.8 %, respectively. The uncertainty varies depending on the quality of the images and size of the glaciers. Our results also show a good agreement with other studies undertaken in parts of the Ladakh region for individual glaciers (n=21) and bulk properties of a set of glaciers.
The new multi-temporal inventory presented here will assist in planning the management of water resources, and for guiding scientific research focusing on glacier mass balance, hydrology and glacier change within the region. The detailed information and multi-temporal nature of this inventory will also aid in improving the existing global and regional glacier inventories especially in the cold–arid Ladakh region where the majority of the population is highly dependent on glacier-derived melt water resources for domestic, irrigation and hydropower generation needs.
The supplement related to this article is available online at: https://doi.org/10.5194/essd-14-4171-2022-supplement.
MoS, AR and AB conceptualised and designed the study. MoS, AB and MC did the analysis. MoS wrote and AR, AB, MaS, BRR, SS and LS edited the article. All the authors have equally contributed to interpretation of the results.
The contact author has declared that none of the authors has any competing interests.
Publisher's note: Copernicus Publications remains neutral with regard to jurisdictional claims in published maps and institutional affiliations.
The authors are thankful to the School of Environmental Sciences, Jawaharlal Nehru University, New Delhi, India, for the lab facilities and the United States Geological Survey for the Landsat and ASTER imageries. The authors also thank Planet Labs and Google for the high resolution PlanetScope and Google Earth imageries. We are also thankful to the Scottish Funding Council and the University Of Aberdeen, United Kingdom for financially supporting our work.
This paper was edited by Kenneth Mankoff and reviewed by Marcus Nüsser and Pratima Pandey.
Azam, M. F., Kargel, J. S., Shea, J. M., Nepal, S., Haritashya, U. K., Srivastava, S., Maussion, F., Qazi, N., Chevallier, P., Dimri, A. P., Kulkarni, A. V., Cogley, J. G., and Bahuguna, I. M.: Glaciohydrology of the Himalaya-Karakoram, Science 373, eabf3668, https://doi.org/10.1126/science.abf3668, 2021.
Bajracharya, S. R. and Shrestha, B. R., International Centre for Integrated Mountain Development, and Sweden (Eds.): The status of glaciers in the Hindu Kush-Himalayan region, International Centre for Integrated Mountain Development, Kathmandu, 127 pp., https://doi.org/10.53055/ICIMOD.551, 2011.
Bajracharya, S. R., Maharjan, S. B., and Shrestha, F.: Glaciers in the Indus Basin, in: Indus River Basin, Elsevier, 123–144, https://doi.org/10.1016/B978-0-12-812782-7.00006-0, 2019.
Barrett, K. and Bosak, K.: The Role of Place in Adapting to Climate Change: A Case Study from Ladakh, Western Himalayas, Sustainability, 10, 898, https://doi.org/10.3390/su10040898, 2018.
Bhambri, R., Bolch, T., Chaujar, R. K., and Kulshreshtha, S. C.: Glacier changes in the Garhwal Himalaya, India, from 1968 to 2006 based on remote sensing, J. Glaciol., 57, 543–556, https://doi.org/10.3189/002214311796905604, 2011.
Bhambri, R., Bolch, T., Kawishwar, P., Dobhal, D. P., Srivastava, D., and Pratap, B.: Heterogeneity in glacier response in the upper Shyok valley, northeast Karakoram, The Cryosphere, 7, 1385–1398, https://doi.org/10.5194/tc-7-1385-2013, 2013.
Bhambri, R., Hewitt, K., Kawishwar, P., and Pratap, B.: Surge-type and surge-modified glaciers in the Karakoram, Sci. Rep.-UK, 7, 15391, https://doi.org/10.1038/s41598-017-15473-8, 2017.
Bhardwaj, A., Joshi, P., Snehmani., Sam, L., Singh, M. K., Singh, S., and Kumar, R.: Applicability of Landsat 8 data for characterizing glacier facies and supraglacial debris, Int. J. Appl. Earth Obs. Geoinformation, 38, 51–64, https://doi.org/10.1016/j.jag.2014.12.011, 2015.
Bolch, T.: Past and Future Glacier Changes in the Indus River Basin, in: Indus River Basin, Elsevier, 85–97, https://doi.org/10.1016/B978-0-12-812782-7.00004-7, 2019.
Bolch, T., Menounos, B., and Wheate, R.: Landsat-based inventory of glaciers in western Canada, 1985–2005, Remote Sens. Environ., 114, 127–137, https://doi.org/10.1016/j.rse.2009.08.015, 2010.
Bolch, T., Kulkarni, A., Kaab, A., Huggel, C., Paul, F., Cogley, J. G., Frey, H., Kargel, J. S., Fujita, K., Scheel, M., Bajracharya, S., and Stoffel, M.: The State and Fate of Himalayan Glaciers, Science, 336, 310–314, https://doi.org/10.1126/science.1215828, 2012.
Census of China: National Bureau of Statistics, Communiqué of the seventh National Population Census, http://www.stats.gov.cn/tjsj/ (last access: 30 September 2021), 2020.
Census of India: Jammu and Kashmir, Series 02 – Part XII A-B, District Census Handbook, Leh and Kargil, India - Census of India 2011 – Jammu & Kashmir – Series 02 – Part XII A – District Census Handbook, Leh, http://censusindia.gov.in (last assess: 30 September 2021), 2011.
Chudley, T. R., Miles, E. S., and Willis, I. C.: Glacier characteristics and retreat between 1991 and 2014 in the Ladakh Range, Jammu and Kashmir, Remote Sens. Lett., 8, 518–527, https://doi.org/10.1080/2150704X.2017.1295480, 2017.
Frey, H. and Paul, F.: On the suitability of the SRTM DEM and ASTER GDEM for the compilation of topographic parameters in glacier inventories, Int. J. Appl. Earth Obs. Geoinformation, 18, 480–490, https://doi.org/10.1016/j.jag.2011.09.020, 2012.
Frey, H., Machguth, H., Huss, M., Huggel, C., Bajracharya, S., Bolch, T., Kulkarni, A., Linsbauer, A., Salzmann, N., and Stoffel, M.: Estimating the volume of glaciers in the Himalayan–Karakoram region using different methods, The Cryosphere, 8, 2313–2333, https://doi.org/10.5194/tc-8-2313-2014, 2014.
Garg, S., Shukla, A., Garg, P. K., Yousuf, B., Shukla, U. K., and Lotus, S.: Revisiting the 24 year (1994-2018) record of glacier mass budget in the Suru sub-basin, western Himalaya: Overall response and controlling factors, Sci. Total Environ., 800, 149533, https://doi.org/10.1016/j.scitotenv.2021.149533, 2021.
Garg, P. K., Garg, S., Yousuf, B., Shukla, A., Kumar, V., and Mehta, M.: Stagnation of the Pensilungpa glacier, western Himalaya, India: causes and implications, J. Glaciol., 68, 221–235, https://doi.org/10.1017/jog.2021.84, 2022a.
Garg, S., Shukla, A., Garg, P. K., Yousuf, B., and Shukla, U. K.: Surface evolution and dynamics of the Kangriz glacier, western Himalaya in past 50 years, Cold Reg. Sci. Technol., 196, 103496, https://doi.org/10.1016/j.coldregions.2022.103496, 2022b.
Granshaw, F. D. and Fountain, G. A.: Glacier change (1958–1998) in the North Cascades National Park Complex, Washington, USA, J. Glaciol., 52, 251–256, https://doi.org/10.3189/172756506781828782, 2006.
Guo, W., Liu, S., Xu, J., Wu, L., Shangguan, D., Yao, X., Wei, J., Bao, W., Yu, P., Liu, Q., and Jiang, Z.: The second Chinese glacier inventory: data, methods and results, J. Glaciol., 61, 357–372, https://doi.org/10.3189/2015JoG14J209, 2015.
Hersbach, H., Bell, B., Berrisford, P., Hirahara, S., Horányi, A., Muñoz-Sabater, J., Nicolas, J., Peubey, C., Radu, R., Schepers, D., Simmons, A., Soci, C., Abdalla, S., Abellan, X., Balsamo, G., Bechtold, P., Biavati, G., Bidlot, J., Bonavita, M., Chiara, G., Dahlgren, P., Dee, D., Diamantakis, M., Dragani, R., Flemming, J., Forbes, R., Fuentes, M., Geer, A., Haimberger, L., Healy, S., Hogan, R. J., Hólm, E., Janisková, M., Keeley, S., Laloyaux, P., Lopez, P., Lupu, C., Radnoti, G., Rosnay, P., Rozum, I., Vamborg, F., Villaume, S., and Thépaut, J.: The ERA5 global reanalysis, Q. J. Roy. Meteor. Soc., 146, 1999–2049, https://doi.org/10.1002/qj.3803, 2020.
Ji, Q., Yang, T., He, Y., Qin, Y., Dong, J., and Hu, F.: A simple method to extract glacier length based on Digital Elevation Model and glacier boundaries for simple basin type glacier, J. Mt. Sci., 14, 1776–1790, https://doi.org/10.1007/s11629-016-4243-5, 2017.
Kääb, A., Treichler, D., Nuth, C., and Berthier, E.: Brief Communication: Contending estimates of 2003–2008 glacier mass balance over the Pamir–Karakoram–Himalaya, The Cryosphere, 9, 557–564, https://doi.org/10.5194/tc-9-557-2015, 2015.
Khan, A., Richards, K. S., Parker, G. T., McRobie, A., and Mukhopadhyay, B.: How large is the Upper Indus Basin? The pitfalls of auto-delineation using DEMs, J. Hydrol., 509, 442–453, https://doi.org/10.1016/j.jhydrol.2013.11.028, 2014.
Kulkarni, A. V.: Monitoring Himalayan cryosphere using remote sensing techniques, J. India Inst. Sci. 90, 457–469, 2010.
Le Bris, R. and Paul, F.: An automatic method to create flow lines for determination of glacier length: A pilot study with Alaskan glaciers, Comput. Geosci., 52, 234–245, https://doi.org/10.1016/j.cageo.2012.10.014, 2013.
Liu, S., Ding, Y., Shangguan, D., Zhang, Y., Li, J., Han, H., Wang, J., and Xie, C.: Glacier retreat as a result of climate warming and increased precipitation in the Tarim river basin, northwest China, Ann. Glaciol., 43, 91–96, https://doi.org/10.3189/172756406781812168, 2006.
Maurer, J. M., Schaefer, J. M., Rupper, S., and Corley, A.: Acceleration of ice loss across the Himalayas over the past 40 years, Sci. Adv., 5, eaav7266, https://doi.org/10.1126/sciadv.aav7266, 2019.
Minora, U., Bocchiola, D., D'Agata, C., Maragno, D., Mayer, C., Lambrecht, A., Mosconi, B., Vuillermoz, E., Senese, A., Compostella, C., Smiraglia, C., and Diolaiuti, G.: 2001–2010 glacier changes in the Central Karakoram National Park: a contribution to evaluate the magnitude and rate of the “Karakoram anomaly”, The Cryosphere Discuss., 7, 2891–2941, https://doi.org/10.5194/tcd-7-2891-2013, 2013.
Mölg, N., Bolch, T., Rastner, P., Strozzi, T., and Paul, F.: A consistent glacier inventory for Karakoram and Pamir derived from Landsat data: distribution of debris cover and mapping challenges, Earth Syst. Sci. Data, 10, 1807–1827, https://doi.org/10.5194/essd-10-1807-2018, 2018.
Mukherjee, S., Joshi, P. K., Mukherjee, S., Ghosh, A., Garg, R. D., and Mukhopadhyay, A.: Evaluation of vertical accuracy of open source Digital Elevation Model (DEM), Int. J. Appl. Earth Obs. Geoinformation, 21, 205–217, https://doi.org/10.1016/j.jag.2012.09.004, 2013.
Müller, J., Dame, J., and Nüsser, M.: Urban Mountain Waterscapes: The Transformation of Hydro-Social Relations in the Trans-Himalayan Town Leh, Ladakh, India, Water, 12, 1698, https://doi.org/10.3390/w12061698, 2020.
Nagai, H., Fujita, K., Sakai, A., Nuimura, T., and Tadono, T.: Comparison of multiple glacier inventories with a new inventory derived from high-resolution ALOS imagery in the Bhutan Himalaya, The Cryosphere, 10, 65–85, https://doi.org/10.5194/tc-10-65-2016, 2016.
Negi, H. S., Kumar, A., Kanda, N., Thakur, N. K., and Singh, K. K.: Status of glaciers and climate change of East Karakoram in early twenty-first century, Sci. Total Environ., 753, 141914, https://doi.org/10.1016/j.scitotenv.2020.141914, 2021.
Nuimura, T., Sakai, A., Taniguchi, K., Nagai, H., Lamsal, D., Tsutaki, S., Kozawa, A., Hoshina, Y., Takenaka, S., Omiya, S., Tsunematsu, K., Tshering, P., and Fujita, K.: The GAMDAM glacier inventory: a quality-controlled inventory of Asian glaciers, The Cryosphere, 9, 849–864, https://doi.org/10.5194/tc-9-849-2015, 2015.
Nüsser, M., Schmidt, S., and Dame, J.: Irrigation and Development in the Upper Indus Basin: Characteristics and Recent Changes of a Socio-hydrological System in Central Ladakh, India, Mt. Res. Dev., 32, 51–61, https://doi.org/10.1659/MRD-JOURNAL-D-11-00091.1, 2012.
Nüsser, M., Dame, J., Kraus, B., Baghel, R., and Schmidt, S.: Socio-hydrology of “artificial glaciers” in Ladakh, India: assessing adaptive strategies in a changing cryosphere, Reg. Environ. Change, 19, 1327–1337, https://doi.org/10.1007/s10113-018-1372-0, 2019a.
Nüsser, M., Dame, J., Parveen, S., Kraus, B., Baghel, R., and Schmidt, S.: Cryosphere-Fed Irrigation Networks in the Northwestern Himalaya: Precarious Livelihoods and Adaptation Strategies Under the Impact of Climate Change, Mt. Res. Dev., 39, R1–R11, https://doi.org/10.1659/MRD-JOURNAL-D-18-00072.1, 2019b.
Paul, F., Kääb, A., Maisch, M., Kellenberger, T., and Haeberli, W.: The new remote-sensing-derived Swiss glacier inventory: I. Methods, Ann. Glaciol., 34, 355361, https://doi.org/10.3189/172756402781817941, 2002.
Paul, F., Barry, R. G., Cogley, J. G., Frey, H., Haeberli, W., Ohmura, A., Ommanney, C. S. L., Raup, B., Rivera, A., and Zemp, M.: Recommendations for the compilation of glacier inventory data from digital sources, Ann. Glaciol., 50, 119–126, https://doi.org/10.3189/172756410790595778, 2009.
Paul, F., Barrand, N. E., Baumann, S., Berthier, E., Bolch, T., Casey, K., Frey, H., Joshi, S. P., Konovalov, V., Le Bris, R., Mölg, N., Nosenko, G., Nuth, C., Pope, A., Racoviteanu, A., Rastner, P., Raup, B., Scharrer, K., Steffen, S., and Winsvold, S.: On the accuracy of glacier outlines derived from remote-sensing data, Ann. Glaciol., 54, 171–182, https://doi.org/10.3189/2013AoG63A296, 2013.
Paul, F., Bolch, T., Kääb, A., Nagler, T., Nuth, C., Scharrer, K., Shepherd, A., Strozzi, T., Ticconi, F., Bhambri, R., Berthier, E., Bevan, S., Gourmelen, N., Heid, T., Jeong, S., Kunz, M., Lauknes, T. R., Luckman, A., Merryman Boncori, J. P., Moholdt, G., Muir, A., Neelmeijer, J., Rankl, M., VanLooy, J., and Van Niel, T.: The glaciers climate change initiative: Methods for creating glacier area, elevation change and velocity products, Remote Sens. Environ., 162, 408426, https://doi.org/10.1016/j.rse.2013.07.043, 2015.
Paul, F., Bolch, T., Briggs, K., Kääb, A., McMillan, M., McNabb, R., Nagler, T., Nuth, C., Rastner, P., Strozzi, T., and Wuite, J.: Error sources and guidelines for quality assessment of glacier area, elevation change, and velocity products derived from satellite data in the Glaciers_cci project, Remote Sens. Environ., 203, 256–275, https://doi.org/10.1016/j.rse.2017.08.038, 2017.
Pfeffer, W. T., Arendt, A. A., Bliss, A., Bolch, T., Cogley, J. G., Gardner, A. S., Hagen, J.-O., Hock, R., Kaser, G., Kienholz, C., Miles, E. S., Moholdt, G., Mölg, N., Paul, F., Radić, V., Rastner, P., Raup, B. H., Rich, J., Sharp, M. J., and The Randolph Consortium: The Randolph Glacier Inventory: a globally complete inventory of glaciers, J. Glaciol., 60, 537–552, https://doi.org/10.3189/2014JoG13J176, 2014.
Pritchard, H. D.: Asia's shrinking glaciers protect large populations from drought stress, Nature, 569, 649–654, https://doi.org/10.1038/s41586-019-1240-1, 2019.
Racoviteanu, A. E., Paul, F., Raup, B., Khalsa, S. J. S., and Armstrong, R.: Challenges and recommendations in mapping of glacier parameters from space: results of the 2008 Global Land Ice Measurements from Space (GLIMS) workshop, Boulder, Colorado, USA, Ann. Glaciol., 50, 53–69, https://doi.org/10.3189/172756410790595804, 2009.
Racoviteanu, A. E., Rittger, K., and Armstrong, R.: An Automated Approach for Estimating Snowline Altitudes in the Karakoram and Eastern Himalaya From Remote Sensing, Front. Earth Sci., 7, 220, https://doi.org/10.3389/feart.2019.00220, 2019.
Sakai, A.: Brief communication: Updated GAMDAM glacier inventory over high-mountain Asia, The Cryosphere, 13, 2043–2049, https://doi.org/10.5194/tc-13-2043-2019, 2019.
Schmidt, S. and Nüsser, M.: Changes of High Altitude Glaciers from 1969 to 2010 in the Trans-Himalayan Kang Yatze Massif, Ladakh, Northwest India, Arct. Antarct. Alp. Res., 44, 107–121, https://doi.org/10.1657/1938-4246-44.1.107, 2012.
Schmidt, S. and Nüsser, M.: Changes of High Altitude Glaciers in the Trans-Himalaya of Ladakh over the Past Five Decades (1969–2016), Geosciences, 7, 27, https://doi.org/10.3390/geosciences7020027, 2017.
Shean, D. E., Bhushan, S., Montesano, P., Rounce, D. R., Arendt, A., and Osmanoglu, B.: A Systematic, Regional Assessment of High Mountain Asia Glacier Mass Balance, Front. Earth Sci., 7, 363, https://doi.org/10.3389/feart.2019.00363, 2020.
Shukla, A., Garg, S., Mehta, M., Kumar, V., and Shukla, U. K.: Temporal inventory of glaciers in the Suru sub-basin, western Himalaya: impacts of regional climate variability, Earth Syst. Sci. Data, 12, 1245–1265, https://doi.org/10.5194/essd-12-1245-2020, 2020.
Singh, S., Kumar, R., Bhardwaj, A., Sam, L., Shekhar, M., Singh, A., Kumar, R., and Gupta, A.: Changing climate and glacio-hydrology in Indian Himalayan Region: a review, WIREs Clim. Change, 7, 393–410, https://doi.org/10.1002/wcc.393, 2016.
Smith, T., Bookhagen, B., and Cannon, F.: Improving semi-automated glacier mapping with a multi-method approach: applications in central Asia, The Cryosphere, 9, 1747–1759, https://doi.org/10.5194/tc-9-1747-2015, 2015.
Soheb, M., Ramanathan, A., Bhardwaj, A., Coleman, M., Spagnolo, M., Rea, B. R., Singh, S., and Sam, L.: Landsat-based multitemporal glacier inventory data of over four decades (1977–2019) for Ladakh region, PANGAEA [data set], https://doi.org/10.1594/PANGAEA.940994, 2022.
Tielidze, L. G. and Wheate, R. D.: The Greater Caucasus Glacier Inventory (Russia, Georgia and Azerbaijan), The Cryosphere, 12, 81–94, https://doi.org/10.5194/tc-12-81-2018, 2018.
Williams, M. W.: The Status of Glaciers in the Hindu Kush–Himalayan Region, Mt. Res. Dev., 33, 114, https://doi.org/10.1659/mrd.mm113, 2013.
Winsvold, S. H., Andreassen, L. M., and Kienholz, C.: Glacier area and length changes in Norway from repeat inventories, The Cryosphere, 8, 1885–1903, https://doi.org/10.5194/tc-8-1885-2014, 2014.
Winsvold, S. H., Kaab, A., and Nuth, C.: Regional Glacier Mapping Using Optical Satellite Data Time Series, IEEE J. Sel. Top. Appl. Earth Obs. Remote Sens., 9, 3698–3711, https://doi.org/10.1109/JSTARS.2016.2527063, 2016.
Yao, J., Chao-lu, Y., and Ping, F.: Evaluation of the Accuracy of SRTM3 and ASTER GDEM in the Tibetan Plateau Mountain Ranges, E3S Web Conf., 206, 01027, https://doi.org/10.1051/e3sconf/202020601027, 2020.
Zhang, M., Wang, X., Shi, C., and Yan, D.: Automated Glacier Extraction Index by Optimization of Red/SWIR and NIR /SWIR Ratio Index for Glacier Mapping Using Landsat Imagery, Water, 11, 1223, https://doi.org/10.3390/w11061223, 2019.