the Creative Commons Attribution 4.0 License.
the Creative Commons Attribution 4.0 License.
 | 17 Aug 2022
Mapping photovoltaic power plants in China using Landsat, random forest, and Google Earth Engine
Xunhe Zhang
Ming Xu
Shujian Wang
Yongkai Huang
Zunyi Xie
Photovoltaic (PV) technology, an efficient solution for mitigating the impacts of climate change, has been increasingly used across the world to replace fossil fuel power to minimize greenhouse gas emissions. With the world's highest cumulative and fastest built PV capacity, China needs to assess the environmental and social impacts of these established PV power plants. However, a comprehensive map regarding the PV power plants' locations and extent remains scarce on the country scale. This study developed a workflow, combining machine learning and visual interpretation methods with big satellite data, to map PV power plants across China. We applied a pixel-based random forest (RF) model to classify the PV power plants from composite images in 2020 with a 30 m spatial resolution on the Google Earth Engine (GEE). The resulting classification map was further improved by a visual interpretation approach. Eventually, we established a map of PV power plants in China by 2020, covering a total area of 2917 km2. We found that most PV power plants were situated on cropland, followed by barren land and grassland, based on the derived national PV map. In addition, the installation of PV power plants has generally decreased the vegetation cover. This new dataset is expected to be conducive to policy management, environmental assessment, and further classification of PV power plants. The dataset of photovoltaic power plant distribution in China by 2020 is available to the public at https://doi.org/10.5281/zenodo.6849477 (Zhang et al., 2022).
- Article
(13885 KB) - Full-text XML
- BibTeX
- EndNote


Solar power is the most available renewable energy source, with great potential to replace fossil fuels to reduce greenhouse gas (GHG) emissions and mitigate climate change (Nemet, 2009; Creutzig et al., 2017). Photovoltaic (PV) technology can convert solar energy directly into electricity with large PV arrays. With the development of PV technology and the decline in the cost of PV power generation in recent years, the number of PV power plants has been rising fast (Zou et al., 2017). China's PV industry leads the world regarding the cumulative installed and newly installed capacity. According to the National Energy Administration of China, the cumulative installed capacity of PV power in China had reached 253 GW (gigawatts) by the end of 2020, with 48.2 GW being newly installed in 2020. As China aims to achieve a carbon emissions peak before 2030 and carbon neutrality before 2060, it is expected that PV power generation will keep growing rapidly across China. As the development of PV power plants requires a large amount of land (Capellán-Pérez et al., 2017), knowing the distributions of PV power plants is crucial for evaluating the eco-environmental effects and predicting the power generation of PV power plants in China (Taha, 2013; Hernandez et al., 2014, 2015; Li et al., 2018; Grodsky and Hernandez, 2020). However, data regarding the distributions of PV power plants remain scarce in China, which has greatly hindered the national policy management and environmental assessment of PV power plants in China.
Remote sensing techniques can acquire the features of different ground objects from images in spectral, temporal, and spatial dimensions globally (Zhu et al., 2012). A few studies have mapped the PV panels or power plants by using manually annotating (Bradbury et al., 2016; Dunnett et al., 2020) and machine learning methods with various remote sensing imagery (Malof et al., 2016a, b, 2017; Zhang et al., 2021). Machine learning algorithms can classify ground features with high accuracy by incorporating various input predictor data from remote sensing imagery without making assumptions about the data distribution (Maxwell et al., 2018). While machine learning methods have improved the efficiency in identifying PV power plants, mapping PV power plants is still challenging on a continental scale, which is limited by the computing resources and accuracy in complex environments.
Training an applicable machine learning model requires massive labeled training samples to cover as much system parameter space as possible. PV power plants are built in various landscapes, including deserts, mountains, coasts, and lakes (Sahu et al., 2016; Al Garni and Awasthi, 2017; Hammoud et al., 2019). The limited labeled data are insufficient to cover most of the spectral parameter space of PV power plants in complicated geographical environments. Thus, machine learning models will generate unavoidable misclassification when identifying PV power plants. Especially on a continental scale, the model's inaccuracy will lead to many misclassified PV areas because the background non-PV area is thousands of times larger than the actual PV area. Since the PV power plants will not change in a short time, visual interpretation provides a potential way to filter out misclassifications from machine learning results.
Deep learning models, including convolutional neural networks (CNNs), recurrent neural networks (RNNs), and residual networks (ResNet; He et al., 2016; Schmidhuber, 2015; Krizhevsky et al., 2012), have also been applied to map the PV power plants in the United States (Yu et al., 2018), China (Hou et al., 2019), and worldwide (Kruitwagen et al., 2021). As a branch of machine learning, deep learning is characterized by neural networks (NNs) involving several to hundreds of layers that exploit feature representations learned exclusively from data. Deep learning models can accurately identify PV power plants from remote sensing data by developing in-depth information without hand-crafting features, but these tasks need extensive computation resources. For example, Kruitwagen et al. (2021) used deep learning models and over 106 CPU hours, 20 000 GPU hours, 71 MWh, and approximately 2 months in real time to map the PV power plants worldwide with remote sensing imagery. It goes without saying that these tasks usually require additional storage resources to store an enormous amount of remote sensing imagery. As a result, updating or modifying such PV maps derived from deep learning methods for the regional places of interest such as China is infeasible for researchers in most of the countries who do not have access to supercomputing facilities.
Cloud computing platforms facilitate classification tasks on a global scale with shared data and computing resources. The Google Earth Engine (GEE) is a cloud geospatial computing platform that supports freely available petabyte remote sensing data, multiple machine learning algorithms, and shared computing resources (Gorelick et al., 2017). With GEE's support, researchers in the remote sensing community have completed numerous classification works on a planetary scale (Deines et al., 2019; Li et al., 2019; Gong et al., 2019, 2020; Xie et al., 2019; Mao et al., 2021).
In this study, we integrated the advantage of cloud computing, machine learning, and visual interpretation to map the PV power plants in China in 2020. We used GEE to acquire the preliminary classified result using a random forest model from Landsat 8 imagery. We further refined the classified results by visual interpretation. Based on the final filtering result, we also investigated the stats of the PV power plants within different climatic and geographic areas. The proposed approach in this study is easy to repeat, and the result will help future policymaking and environmental assessment for PV power facilities. A great number of labeled PV power plant samples across China derived from visual interpretation could offer valuable data for future studies to update and improve maps of PV power plants.
In summary, the objectives of this study are to (1) build a workflow to map the PV power plants on a continental scale with Landsat imagery on GEE, (2) produce a fine-resolution map of PV power plants in China, and (3) analyze the distribution characteristics of PV power plants in China.
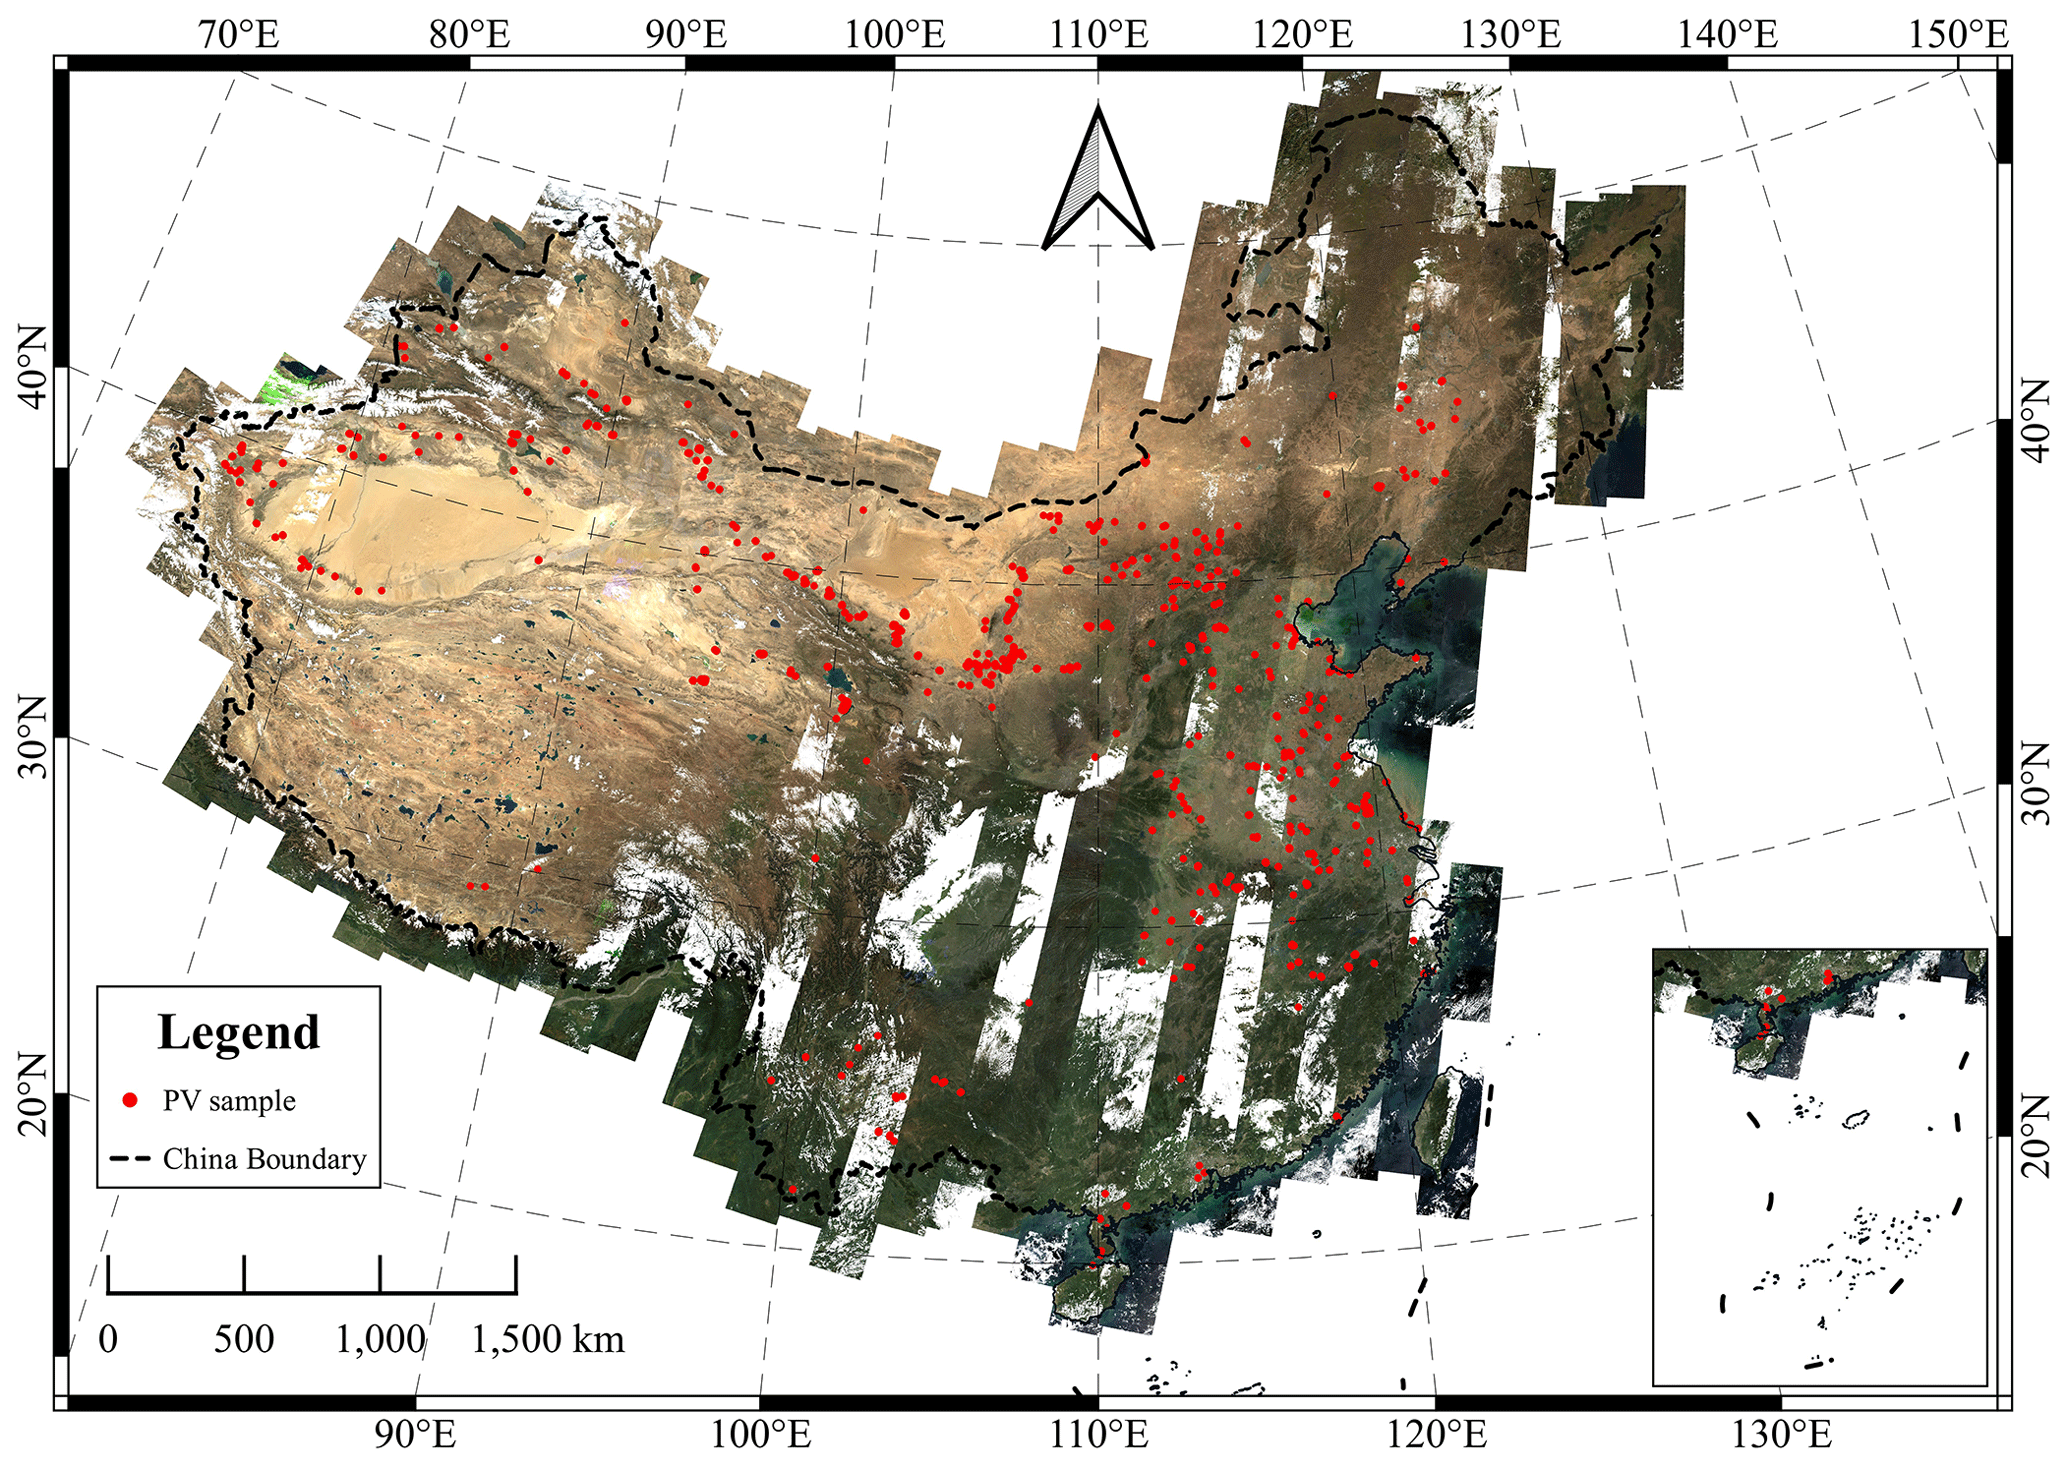
Figure 1The composite image from Landsat 8 imagery during autumn 2020 (background) and PV samples of training and validation (red regions) in this study.
Table 1Training and validation dataset.
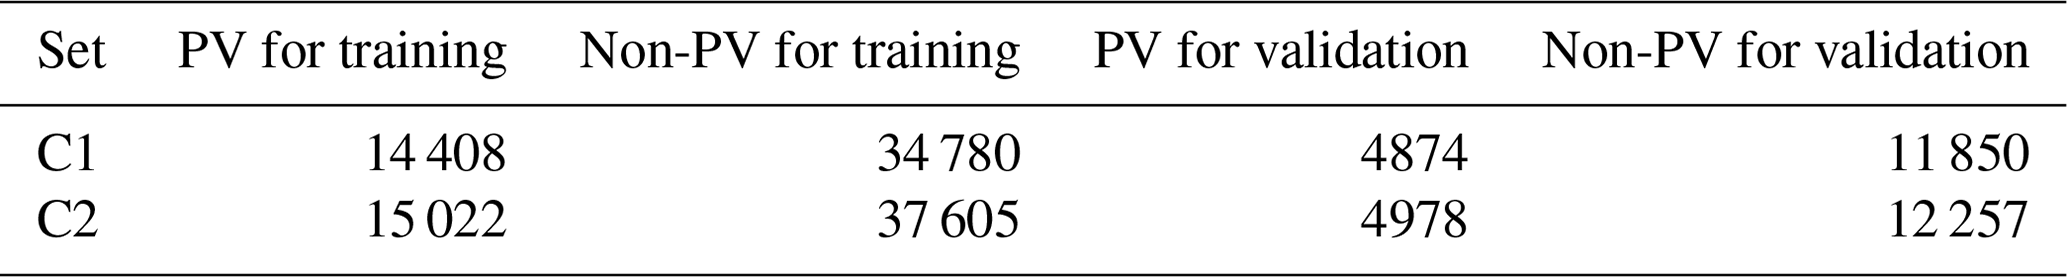
Note: composite image one (CS1) is composited from Landsat images during September–November 2020. Composite image two (CS2) is composited from Landsat images during January–December 2020.
2.1 Machine learning classification
2.1.1 Landsat 8 surface reflectance imagery
This study used the Landsat 8 (L-8) surface reflectance (SR) product with a 30 m spatial resolution. The L-8 product has been atmospherically and topographically corrected and is accessible on GEE. We removed the pixels contaminated by clouds and shadows in each image using the pixel quality control bands. We further composited L-8 image datasets using the median value of six reflective bands during a specific period. The composite image was robust against extreme values and provided enough information about the particular period (Flood, 2013). We composited the images of autumn 2020 (September to November) and the whole year of 2020 (January to December) over China, respectively. The composite image in autumn (C1) has the advantage of fewer clouds, snow, and vegetation in China compared to the image from other seasons. The composite image of the whole year (C2) was involved in nearly 4 times as many images as the C1, so the C2 is less affected by the contaminated pixels than C1 but has less timeliness. Therefore, we used C2 as a substitute in the regions where the quality of C1 was poor.
2.1.2 Random forest classification
We used a pixel-based random forest (RF) algorithm on GEE to map the PV power plants over China (Zhang et al., 2021). The RF classifier is an ensemble classifier that uses a set of decision trees to predict classification or regression with the advantages of high precision, efficiency, and stability (Belgiu and Drăguţ, 2016). The RF classifier has also been proven to be better than other machine learning classifiers on GEE (Zhou et al., 2020; Phalke et al., 2020) for mapping rangelands and croplands. For the RF classifier, we set the number of trees to 500 and left the rest of the parameters at GEE's default. Compared with the object-based model classification, the pixel-based model classification uses the raw resolution pixel and does not require further segmentation of the classified image.

Figure 2The visual interpretation examples (six sites) from (a) Landsat 8, (b) Sentinel-2, and (c) Google Earth RGB true color images. The green dashed line is the boundary of the PV panels. © Google Earth 2021.
2.1.3 Training and validation samples
The RF classifier is sensitive to the sampling design (Belgiu and Drăguţ, 2016). Suitable training samples are crucial for an RF model's classification accuracy and stable performance. We collected and labeled samples as PV and non-PV regions, respectively, hereafter shortened to PV and NPV. We primarily collected the PV samples from Dunnett's dataset, which is a global solar plants dataset annotated by volunteers (Dunnett et al., 2020). The total area of the PV power plants in China is about 897 km2, based on Dunnett's dataset.
We manually modified this dataset with Google Earth's background to ensure that the PV samples are located inside the PV power plants. We found that the labeled PV power plants in Dunnett's dataset are rarely found in eastern China, which will limit our model's performance to identify the PV power plant in similar areas. With high-resolution Google Earth images of 2017, we further enriched the training dataset by manually selecting and labeling PV power plants over regions of eastern China, where PV power plants are rarely labeled in Dunnett's dataset. The improved training dataset aims to ensure that the labeled data covered most of the parameter space of PV power plants in China. We stored all the PV samples as polygon vectors. The area of the modified labeled PV polygons was 1121 km2. We randomly sampled points within the polygons with a balanced quantity from humid and arid regions (Fig. 1).
We collected the NPV samples from adjacent regions of the PV power plant region within 5 km buffer regions, including the samples from manually selected typical land types and the samples from the whole of China, respectively. We prepared 20 000 points labeled as PV and 50 000 points labeled NPV in this study. At last, after filtering out the low-quality pixels, we randomly chose 75 % of the total points as the training set and the left 25 % of the total points as the validation set (Table 1).
2.1.4 Calculation of variables
We collected nine variables from the Landsat 8 SR images data, including six original bands and three calculated indexes (Zhang et al., 2021). We used these variables to train machine learning models to distinguish the PV and NPV regions. The six original bands included blue (B2), green (B3), red (B4), near-infrared (B5), and two shortwave infrared bands (B6 and B7) from the L-8 images. The three indices included the normalized difference vegetation index (NDVI; Tucker, 1979), the normalized difference built-up index (NDBI; Zha et al., 2003), and the modified normalized difference water index (MNDWI; Xu, 2006).
2.1.5 Classification accuracy assessment
We evaluated the pixel-based RF model by using a validation set. By comparing the confusion matrix of categorized and labeled points in the validation set, we used the kappa coefficient, overall accuracy, producer's accuracy, and user's accuracy to assess the model's performance with the validation set (Congalton, 1991). The kappa coefficient calculated from the confusion matrix is widely used to check consistency and evaluate model performance. The overall accuracy is measured to examine the overall efficacy of the model. The producer's accuracy indicates the proportion of truth samples correctly judged as the target class. The user's accuracy indicates the proportion of samples judged as the target class on the classification map presented as truth samples.
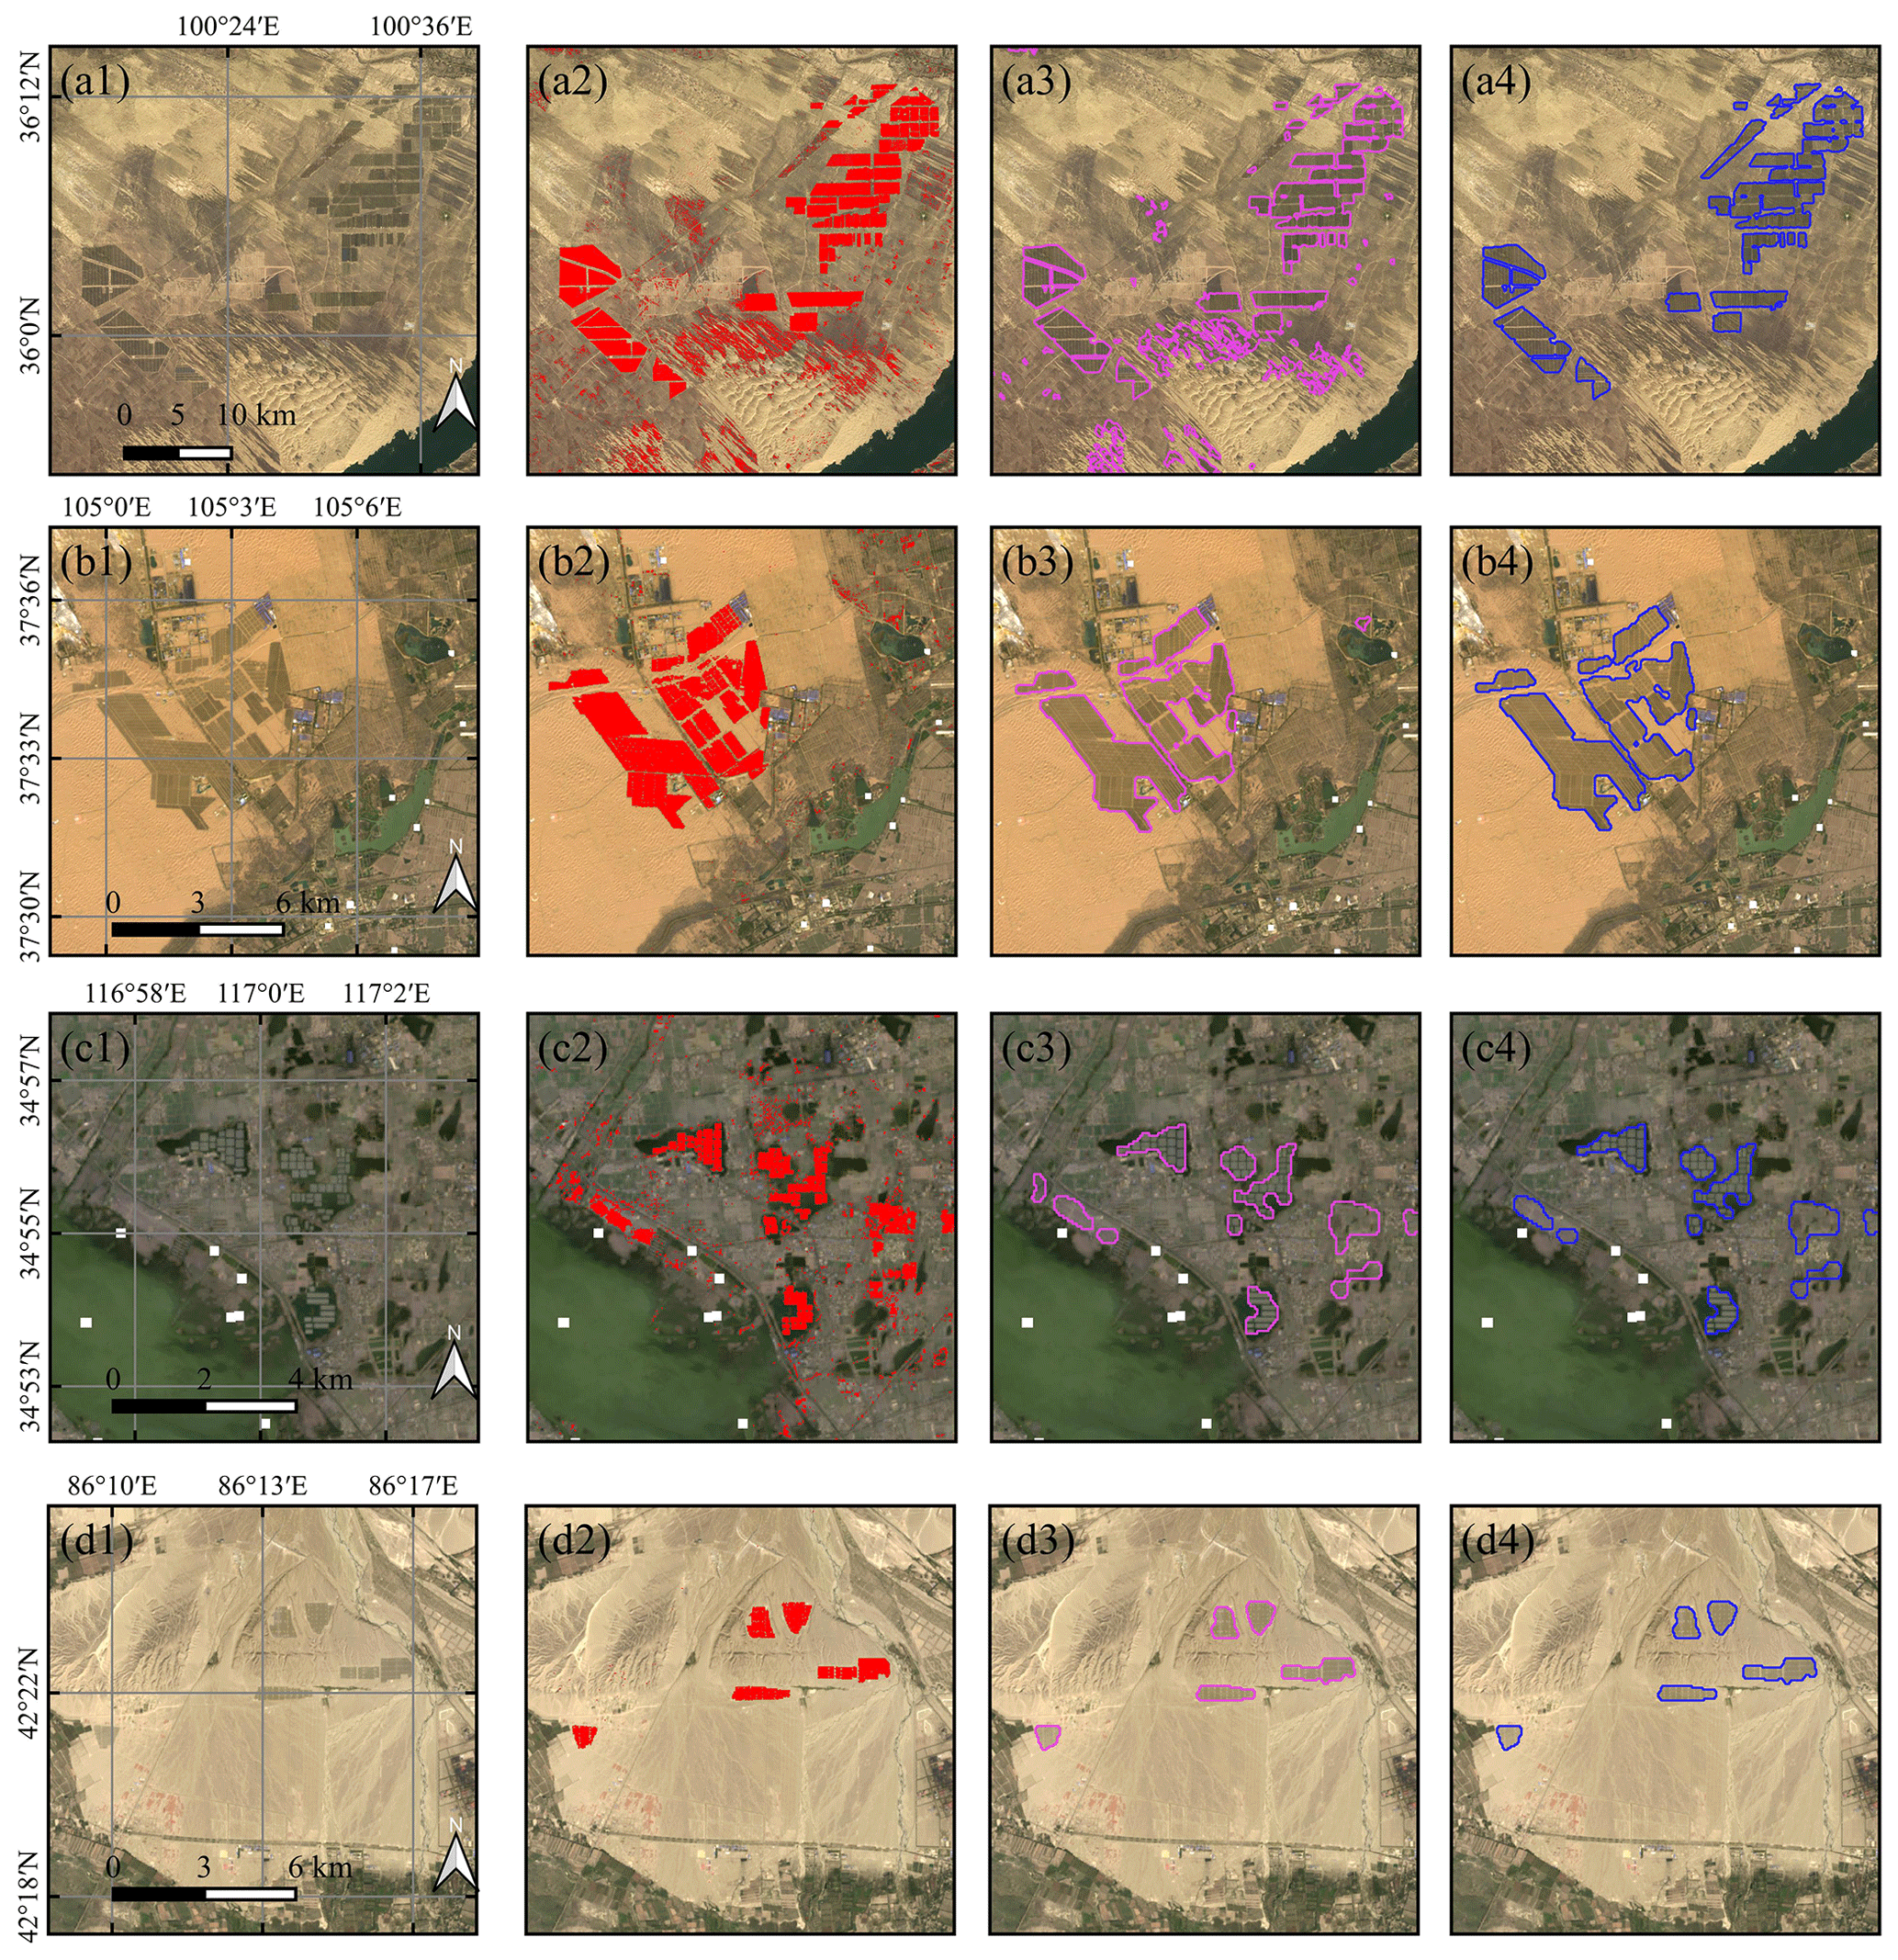
Figure 4The examples of different steps (a1–d1) in true color of a Landsat 8 composite image in autumn 2020. (a2–d2) The random forest classification result in red. (a3–d3) The result in pink after filtering, morphological operations, and vector converting. (a4–d4) The result in blue after manually selecting and improving.

Table 3Validation parameters for the model trained model with different variables sets.
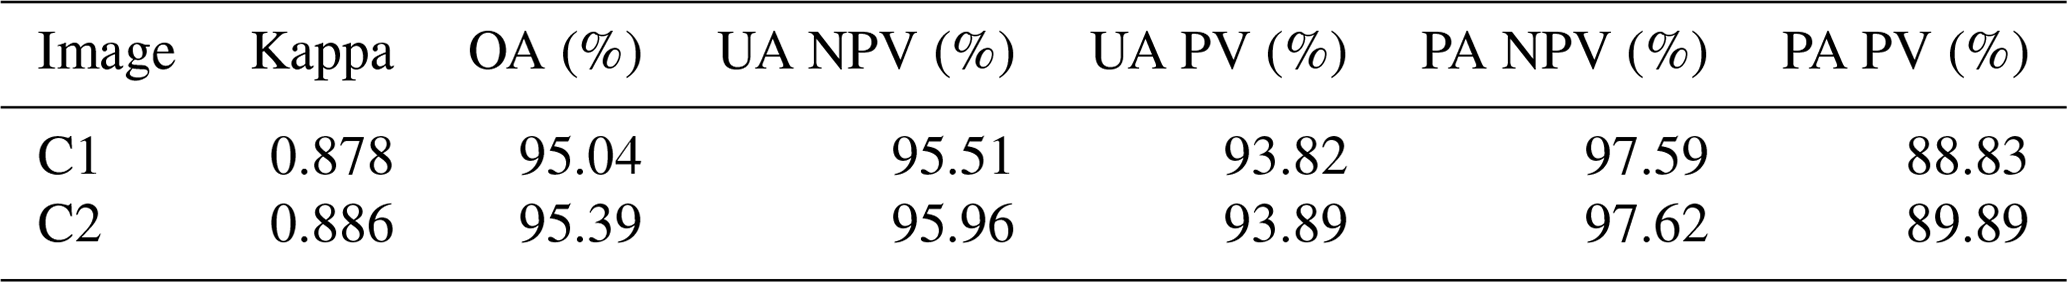
Note: kappa coefficient is shown as Kappa; overall accuracy is OA; producer's accuracy is PA; user's accuracy is UA.
2.2 Visual interpretation
2.2.1 Filter and morphological operations
By applying the RF classification, we found pixels categorized as PV region and NPV region over entire China. We then filtered the pixels by topography. The PV power plants are not suitable for being built in locations with large slopes and shady slopes (Al Garni and Awasthi, 2017; Aydin et al., 2013). We calculated slope and hillshade from the Shuttle Radar Topography Mission (SRTM) with 30 m spatial resolution (Farr et al., 2007). We calculated the hillshade by setting azimuth as 180∘ and elevation angle as 45∘. We filtered the pixels where the slope was over 30∘ and the value of the hillshade was less than 150.
In pixel-based classification, sudden disturbances in the image signal and different objects with the same spectrum or the same objects with a different spectrum can cause a salt-and-pepper noise (i.e., impulse noise) which presents as image speckles. We filtered categorized PV pixels that connect fewer than 9 pixels to neighbors to reduce the salt-and-pepper noise. Additionally, the edge of the PV power plants mixed with roads or other PV facilities that are not categorized as PV regions should be part of the PV power plants. We then used morphological operations on the GEE platform to dilate the PV pixel clusters. The morphological operations included one round max filter and one round mode filter with a circle kernel of 1 pixel radius to conduct spatial filtering.
2.2.2 Visual interpretation
We further convert the clusters of PV pixels into polygonal vectors on GEE. We used visual interpretation to identify all polygons categorized as the PV power plants by the RF model. To meet the visual interpretation needs, we calculated each polygon's area and filtered the PV power plants with fewer than 0.04 km2, which equaled 45 adjacent pixels. According to Kruitwagen's dataset, PV power plants over 0.04 km2 account for 94.2 % of the total area of PV power plants in China (Kruitwagen et al., 2021).
With QGIS software (http://www.qgis.org/, last access: 11 August 2022) and the GEE plugin (https://gee-community.github.io/qgis-earthengine-plugin/, last access: 11 August 2022), we filter the PV polygons with visual interpretation based on their sizes, shapes, color, and texture with background true color images from Landsat 8, Sentinel-2, and Google Earth (Fig. 2). We first collected the PV power plants from the classified result of CS1, which stood for the image in autumn of 2020, and we then collected the PV power plants from the result of CS2, where clouds still contaminate CS1.
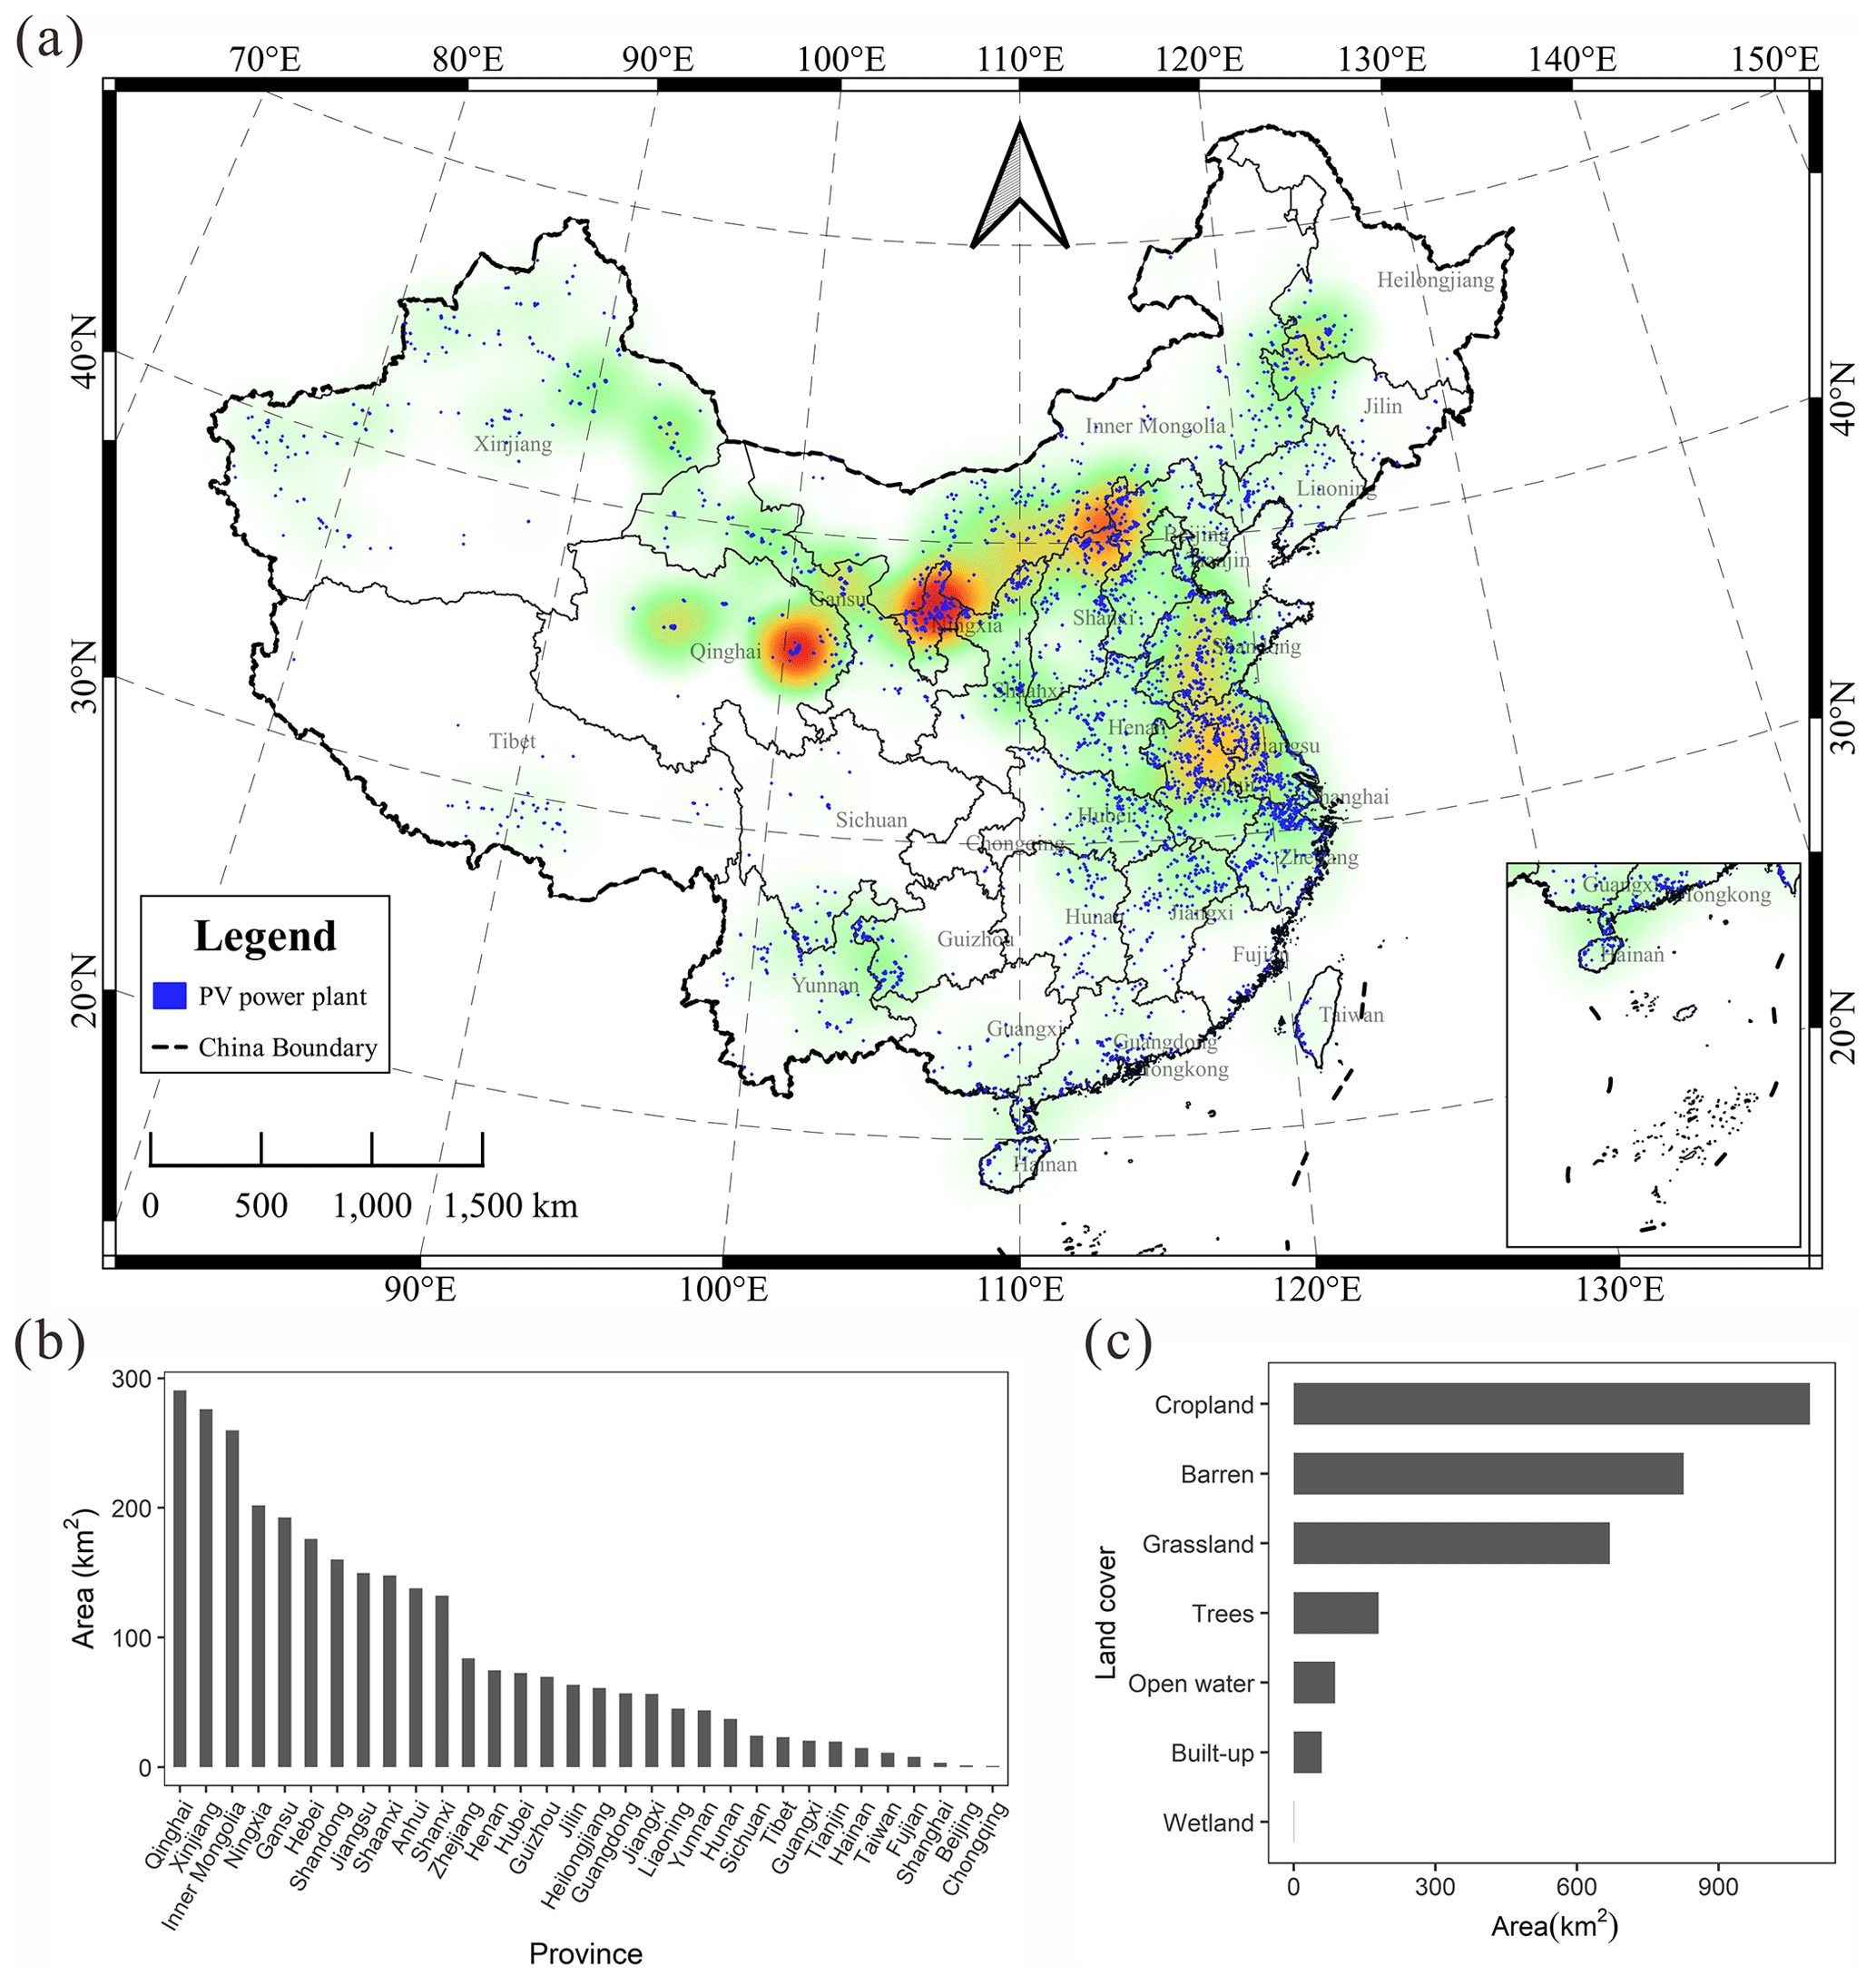
Figure 5(a) The distribution and the heat map of the PV power plants in China. (b) The areas of PV power plants in each province in China. (c) The areas of PV power plants by the land cover in China.
2.3 Dataset organization and statistical analysis
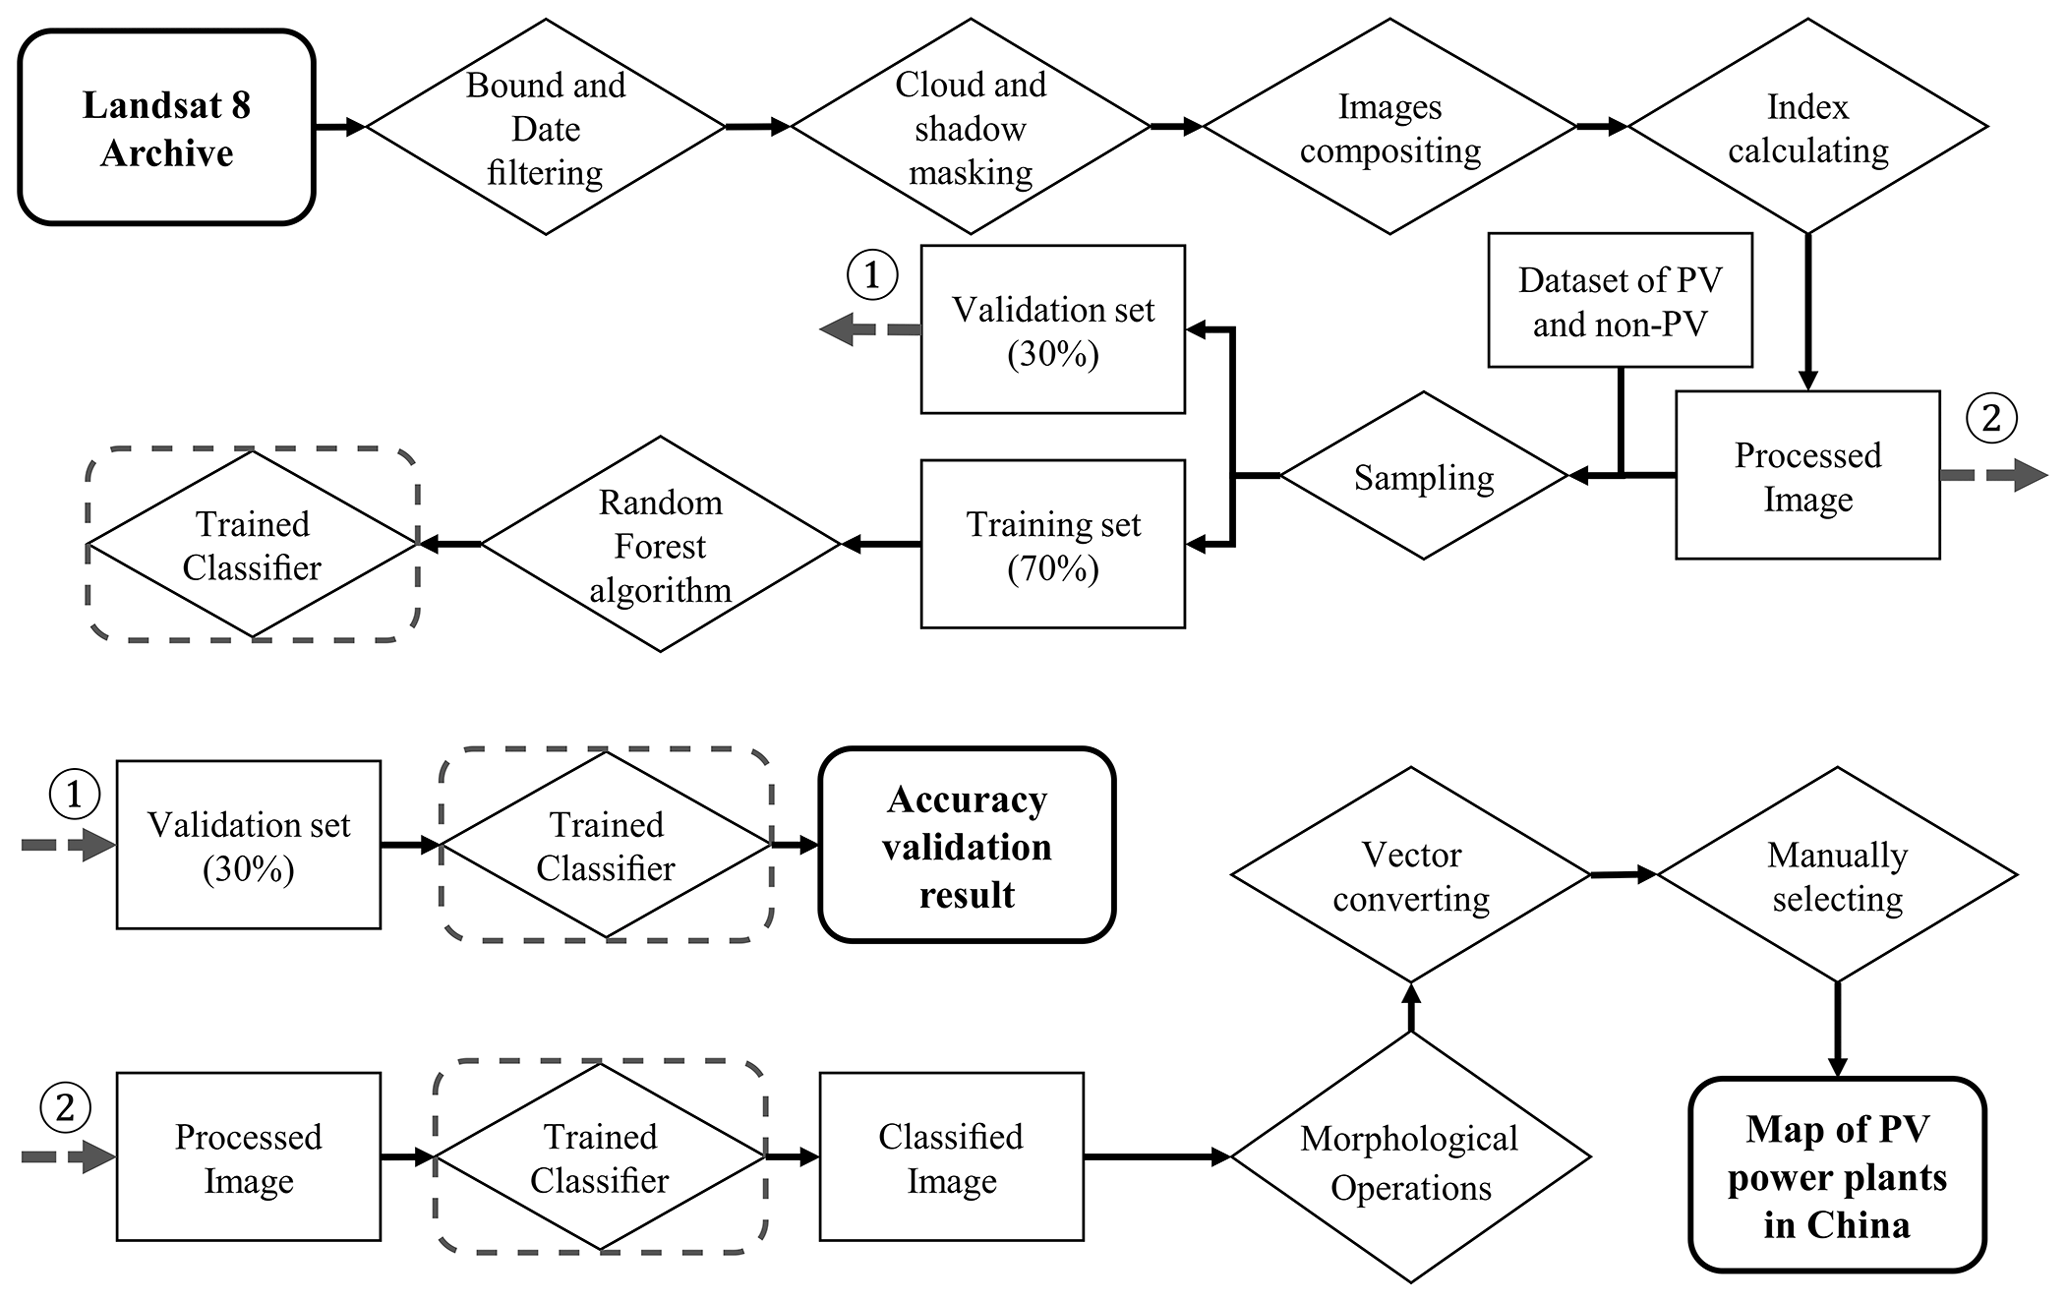
We show a flowchart of this study in Fig. 3. We also mapped some regions containing PV power plants as examples to show the changes in different steps in Fig. 4.
We built a dataset of PV power plants in China. We stored the PV power plants as polygon objects with a shapefile format (Falge et al., 2017). Since PV power plants are not entirely adjacent, we group the PV power plants within 10 km for further analysis. We calculated area, average elevation, annual mean air temperature, cumulative yearly precipitation, population density, annual mean enhanced vegetation index (EVI), and land cover type for each PV power plant (Table 2). All the datasets are available on GEE.
The map indicating the distributions of the PV power plants in China is shown below (Fig. 5a). The PV power plant mapped in this study was 2917 km2 by the autumn at the end of 2020. In the machine learning classification process, the result showed that the model with the dataset of CS1 had a comparable result with the model with the dataset of CS2 (Table 3). The kappa coefficient (kappa), overall accuracy (OA), user's accuracy (UA) of PV and non-PV (NPV), and producer's accuracy (PA) of PV and non-PV were 0.878, 95.04 %, 95.51 %, 93.82 %, 97.59 %, and 88.83 % for the CS1. The kappa, OA, UA of PV and NPV, and PA of PV and NPV were 0.886, 95.39 %, 95.961 %, 93.89 %, 97.62 %, and 89.89 % for the CS2, respectively (Table 3).
The result showed that the top three provinces for installing PV power plants were Qinghai, Xinjiang, and Inner Mongolia, respectively (Fig. 5b). The result based on the land cover showed that most PV power plants were situated on cropland, followed by barren land and grassland (Fig. 5c).
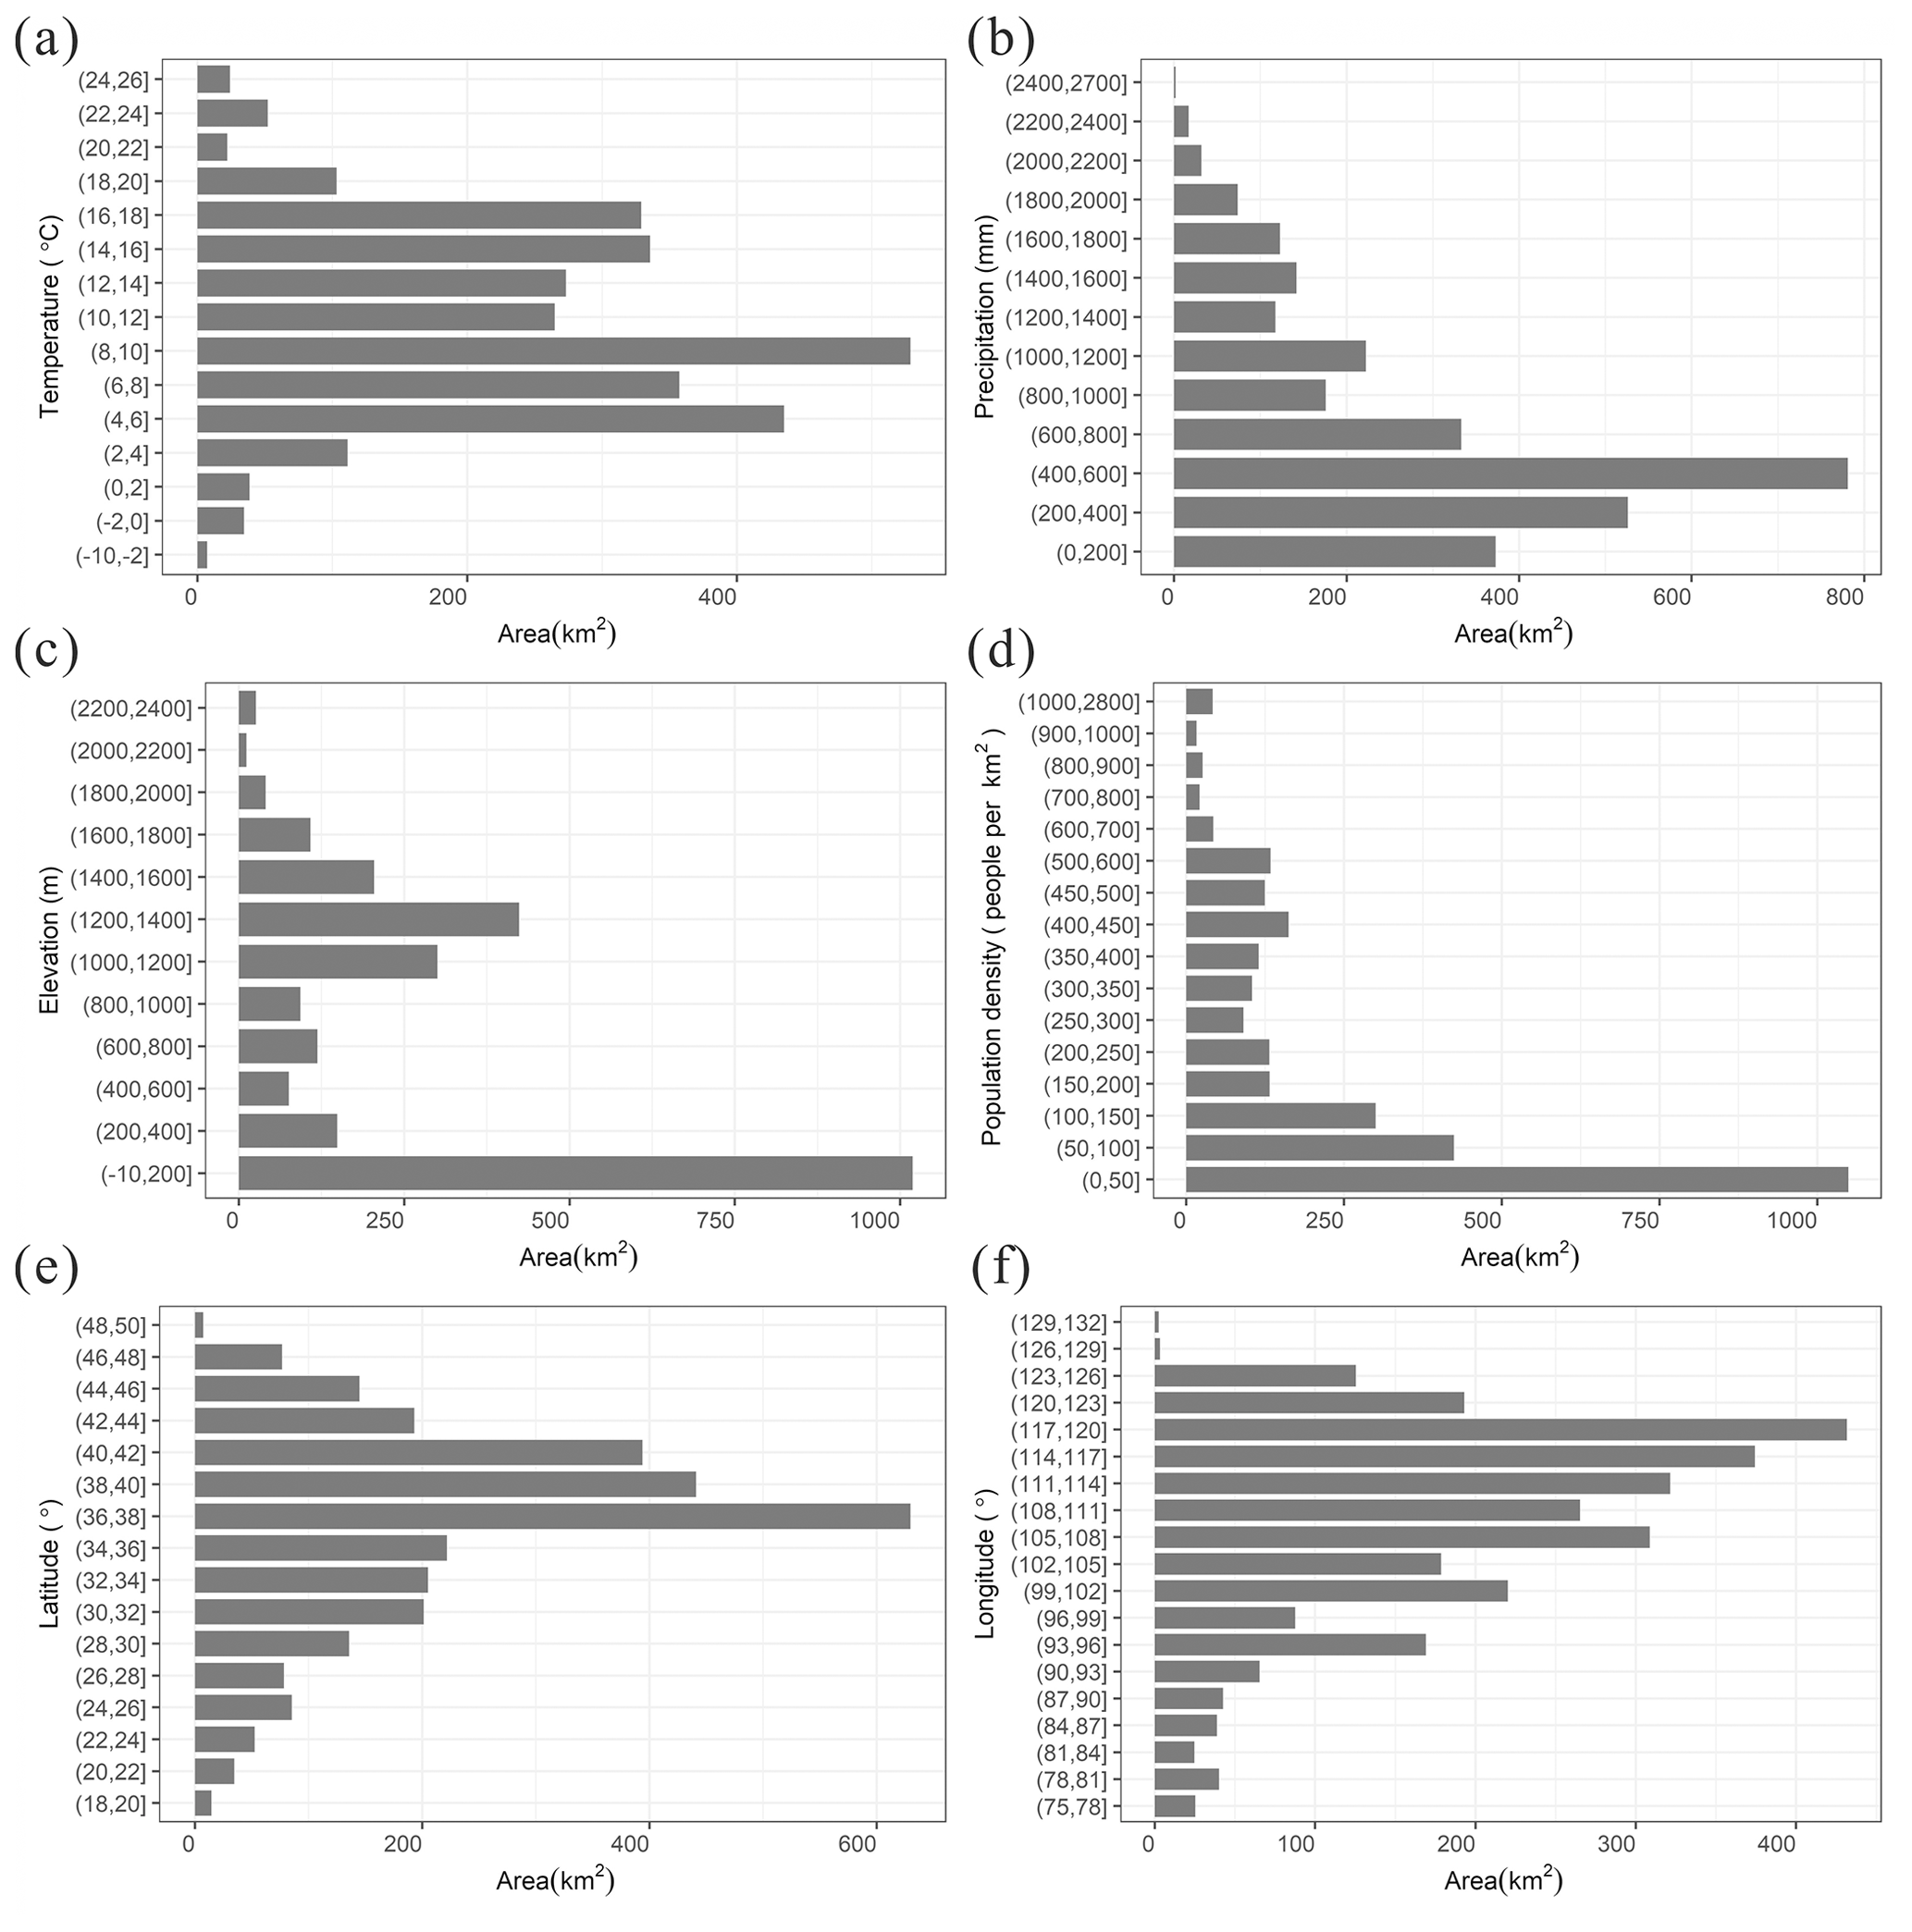
Figure 6The area of PV power plants is counted by (a) temperature, (b) precipitation, (c) elevation, (d) population density, (e) latitude, and (f) longitude.
We have further counted the distributions of PV power plants by temperature, precipitation, elevation, population density, and location. From the result, many PV power plants are located in China's arid and alpine region, where solar energy resources are plentiful, precipitation is low, vegetation is sparse, population density is low, and elevation is relativity high (Fig. 6). Additionally, some PV power plants are located in the industrially developed eastern coastal provinces of China, where precipitation is high, density population is high, and elevation is low. This distribution result also shows two tendencies in China's site selection of PV power plants. One tendency is to install PV power plants in areas with suitable natural conditions but less power demand. The other tendency is to install PV power plants in the areas with more local energy demand.
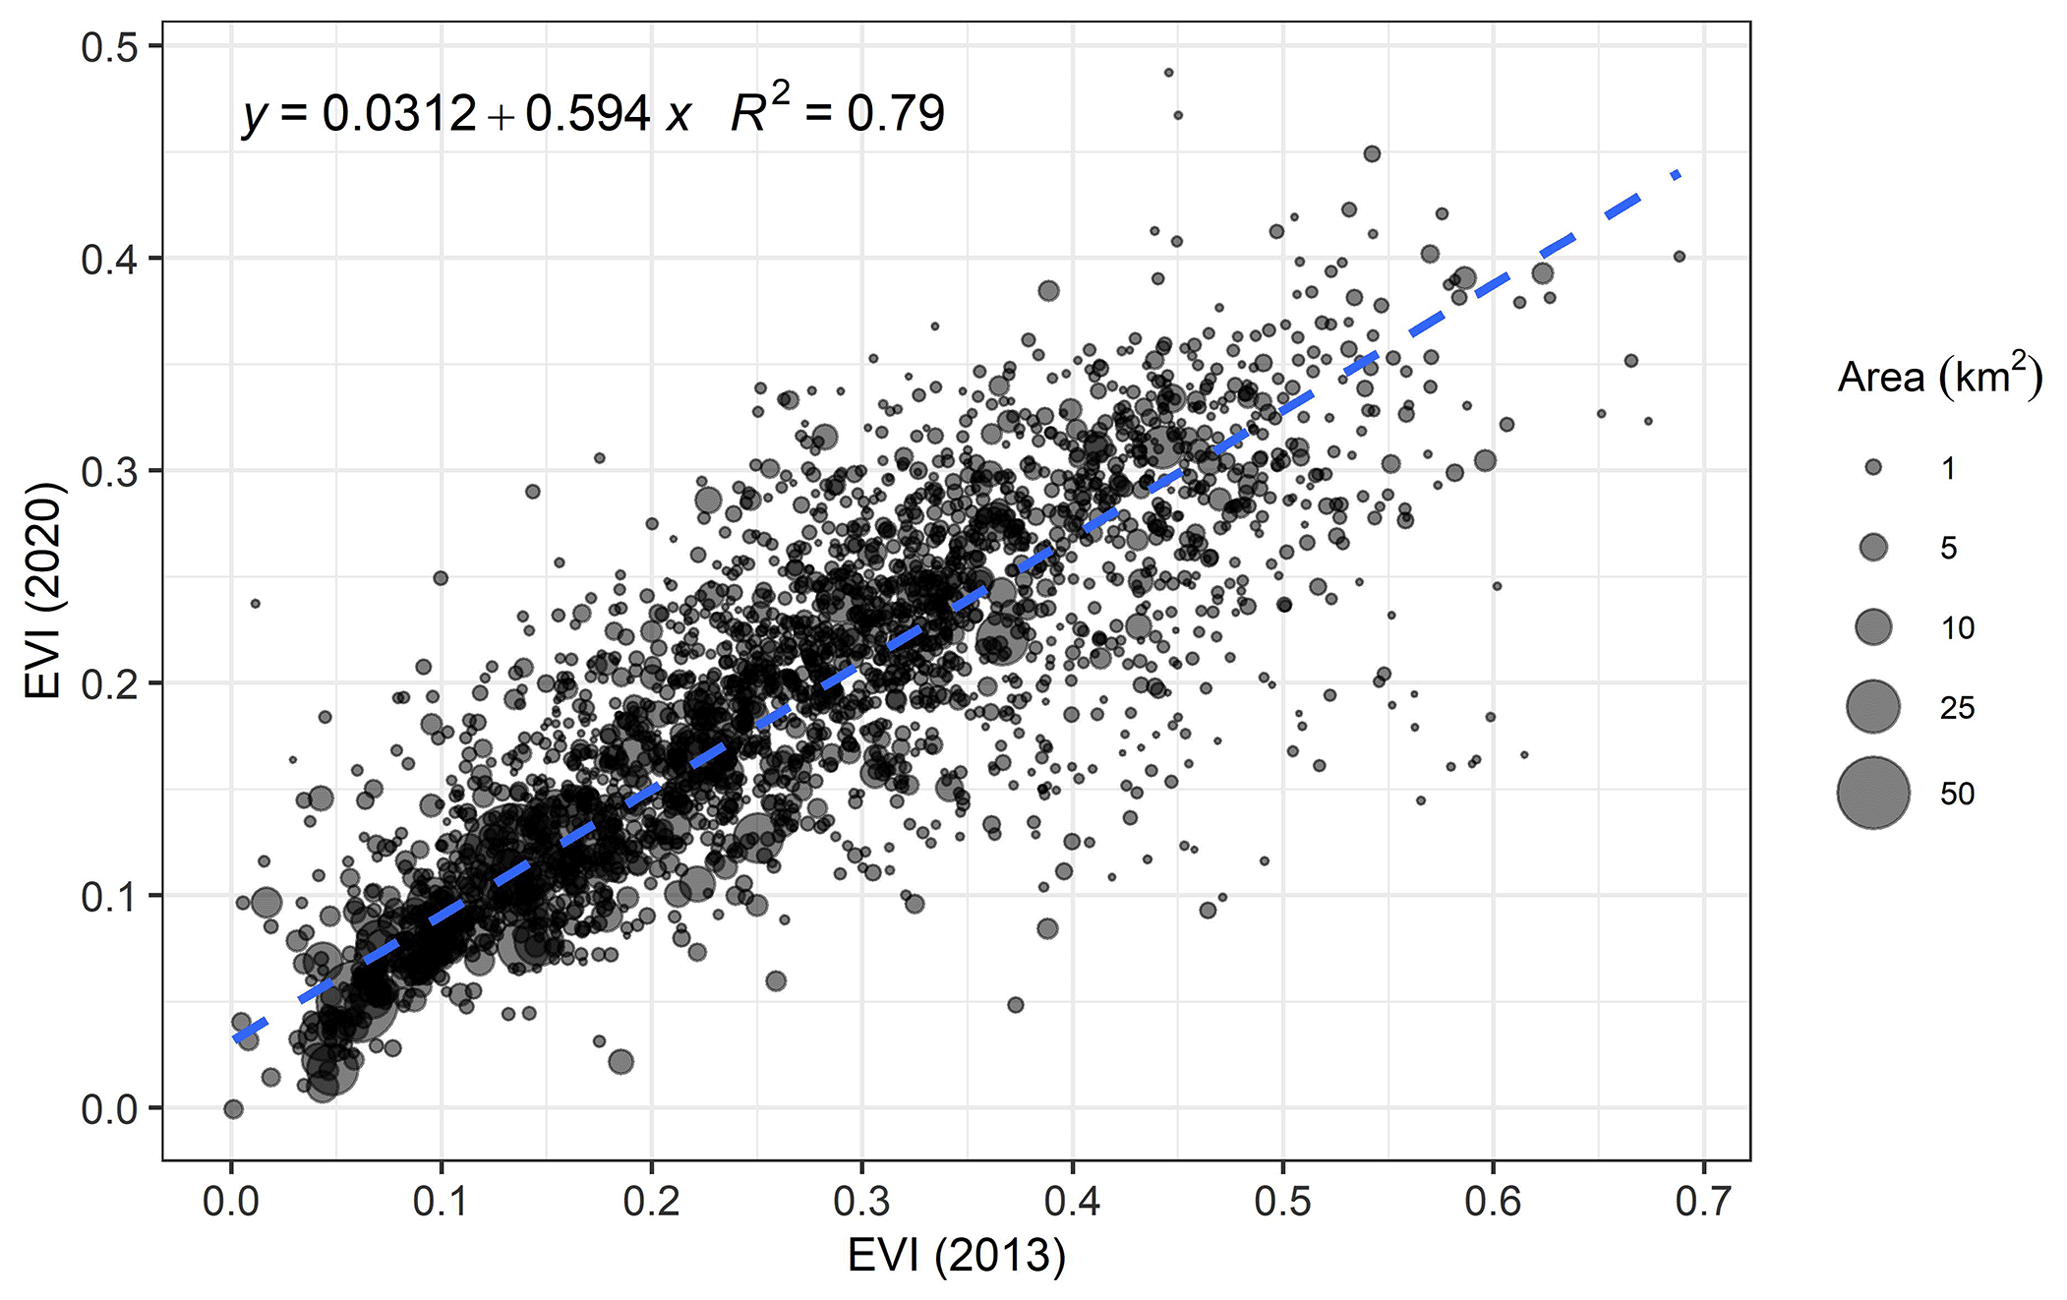
The installation of PV power plants affects the local vegetation under different climate conditions (Zhang and Xu, 2020; Nghiem et al., 2019; Liu et al., 2019). We calculated and compared each PV power plant's annual mean EVI (larger than 0) in 2013 and 2020 from Landsat 8 images. By the record of the National Energy Administration of China, the cumulative installation of the PV capacity is 19.4 GW by 2013 and 252.8 GW by 2020, which indicates that over 92 % of PV power plants are installed after 2013. We compared the EVI values in 2013 and 2020 and discovered the EVI values of PV power plants in 2020 were strongly and positively linked with the EVI values in 2013, of which the linear regression with area weight (p < 0.01) showed that the estimated slope was 0.594 and intercept was 0.0312 (Fig. 7). From the linear regression result, we found that the installation of PV power plants generally decreased the EVI in regions of high vegetation cover. In contrast, in the hyper-arid regions, where EVI was lower than 0.07, the installation of PV power plants slightly increased the EVI values.
The dataset of the photovoltaic power plant distribution in China by 2020 and the training set are stored in a shapefile format and are available to the public at https://doi.org/10.5281/zenodo.6849477 (Zhang et al., 2022).
In this study, we have successfully established a dataset for PV power plants with a total area of 2917 km2 in China until 2020. To our knowledge, our dataset is the latest and most complete public dataset for the spatial extent of PV power plants in China. Our method integrates the efficiency of machine learning and the accuracy of visual interpretation. The two pixel-wise RF models performed well, with the producer's accuracy being over 84 % and overall accuracy being over 96 %.
PV power plants are a mixture of PV panels and their occupied lands, which often cause challenges in mapping PV power plants. The PV power plants are more likely to have similar spectral features to other objects, such as plastic-covered sheds and biological soil crust. PV power plants in different regions have different PV panel spacing and tilt angles due to the sunlight incident angle and terrain, which could cause spectral variability (Yadav and Chandel, 2013; Ji et al., 2021). The model trained by large and scattered training samples ensures that most PV power plants are successfully identified in China under various conditions.
Nevertheless, there are still some omission errors in the RF classification result. Misclassified PV regions with sporadic distribution among the PV power plants will not impact the morphological operations and visual interpretation results. However, some PV power plants, which are of the lower density of PV panels, would be misclassified as non-PV objects. In particular, these PV power plants situated in mountainous areas typically have unique installation spacing and installation angles for their solar panels. Additionally, the mountainous terrain also impacts the reflectance of the PV power plants (Wen et al., 2018). These PV power plants were thus mainly missed in our study but only took up a small portion of the total number.
A large number of misclassified PV power plants due to commission errors in the machine learning step still exists in China. After transferring the pixel clusters to objects of vectors, we have spent dozens of hours on visual interpretation work to filter the misclassification regions with commission error.
In the previous study, Dunnett et al. (2020) provided a harmonized solar plants dataset obtained from an open-access map containing PV power plants in China. The total area of PV power plants in China from Dunnett's dataset is 897.4 km2, of which 842 km2 have spatially intersected with our dataset. The solar panel areas not intersected are 55.4 km2. Some of them are too small for our method to recognize. The comparison between the two datasets suggested that the dataset relying on voluntary annotation is incomplete and with no guarantee of timely updates in China. We also compared our result with Kruitwagen's dataset (Kruitwagen et al., 2021), which was classified by deep learning methods. The total area of PV power plants in China from Kruitwagen's dataset is 2169.8 km2 by 2018, of which 1873.5 km2 have spatially intersected with our dataset. The PV power plants in Kruitwagen's dataset that do not intersect with our dataset are 296.3 km2, some of which are too small to be identified by our method and some of which are misidentified in Kruitwagen's dataset.
Our dataset could provide the training samples for researchers to identify PV power plants in the future. We calculated each PV power plant's geographical and climatic conditions based on the PV map and auxiliary data. The PV power plants in China are more likely to be installed in suitable natural conditions but with low power demand or in areas with high local energy demand. We also found that installing PV power plants will generally decrease the vegetation. Our dataset is conducive to policy management and environmental assessment.
XZ and MX designed the research and performed the analysis. XZ wrote the paper. XZ and SW performed the analysis. ZX edited and revised the paper. XZ, SW, and YH prepared the data.
The contact author has declared that none of the authors has any competing interests.
Publisher's note: Copernicus Publications remains neutral with regard to jurisdictional claims in published maps and institutional affiliations.
This research has been supported by the National Key Research and Development Program of China (grant nos. 2017YFA0604300 and 2018YFA0606500).
This paper was edited by Hanqin Tian and reviewed by three anonymous referees.
Al Garni, H. Z. and Awasthi, A.: Solar PV power plant site selection using a GIS-AHP based approach with application in Saudi Arabia, Appl. Energ., 206, 1225–1240, https://doi.org/10.1016/j.apenergy.2017.10.024, 2017.
Aydin, N. Y., Kentel, E., and Duzgun, H. S.: GIS-based site selection methodology for hybrid renewable energy systems: A case study from western Turkey, Energ. Convers. Manage., 70, 90–106, 2013.
Belgiu, M. and Drăguţ, L.: Random forest in remote sensing: A review of applications and future directions, ISPRS J. Photogramm., 114, 24–31, https://doi.org/10.1016/j.isprsjprs.2016.01.011, 2016.
Bradbury, K., Saboo, R., L. Johnson, T., Malof, J. M., Devarajan, A., Zhang, W., M. Collins, L., and G. Newell, R.: Distributed solar photovoltaic array location and extent dataset for remote sensing object identification, Sci. Data, 3, 160106, https://doi.org/10.1038/sdata.2016.106, 2016.
Capellán-Pérez, I., de Castro, C., and Arto, I.: Assessing vulnerabilities and limits in the transition to renewable energies: Land requirements under 100 % solar energy scenarios, Renew. Sust. Energ. Rev., 77, 760–782, https://doi.org/10.1016/j.rser.2017.03.137, 2017.
Congalton, R. G.: A review of assessing the accuracy of classifications of remotely sensed data, Remote Sens. Environ., 37, 35–46, 1991.
Creutzig, F., Agoston, P., Goldschmidt, J. C., Luderer, G., Nemet, G., and Pietzcker, R. C.: The underestimated potential of solar energy to mitigate climate change, Nat. Energy, 2, 1–9, https://doi.org/10.1038/nenergy.2017.140, 2017.
Deines, J. M., Kendall, A. D., Crowley, M. A., Rapp, J., Cardille, J. A., and Hyndman, D. W.: Mapping three decades of annual irrigation across the US High Plains Aquifer using Landsat and Google Earth Engine, Remote Sens. Environ., 233, 111400, https://doi.org/10.1016/j.rse.2019.111400, 2019.
Dunnett, S., Sorichetta, A., Taylor, G., and Eigenbrod, F.: Harmonised global datasets of wind and solar farm locations and power, Sci. Data, 7, 130, https://doi.org/10.1038/s41597-020-0469-8, 2020.
Falge, E., Aubinet, M., Bakwin, P. S., Baldocchi, D., Berbigier, P., Bernhofer, C., Black, T. A., Ceulemans, R., Davis, K. J., Dolman, A. J., Goldstein, A., Goulden, M. L., Granier, A., Hollinger, D. Y., Jarvis, P. G., Jensen, N., Pilegaard, K., Katul, G., Kyaw Tha Paw, P., Law, B. E., Lindroth, A., Loustau, D., Mahli, Y., Monson, R., Moncrieff, P., Moors, E., Munger, J. W., Meyers, T., Oechel, W., Schulze, E.-D., Thorgeirsson, H., Tenhunen, J., Valentini, R., Verma, S. B., Vesala, T., and Wofsy, S. C.: FLUXNET Research Network Site Characteristics, Investigators, and Bibliography, ORNL DAAC, Oak Ridge, Tennessee, USA. [data set], https://doi.org/10.3334/ORNLDAAC/1530, 2017.
Farr, T. G., Rosen, P. A., Caro, E., Crippen, R., Duren, R., Hensley, S., Kobrick, M., Paller, M., Rodriguez, E., and Roth, L.: The shuttle radar topography mission, Rev. Geophys., 45, 1–33, https://doi.org/10.1029/2005RG000183, 2007.
Flood, N.: Seasonal Composite Landsat TM/ETM+ Images Using the Medoid (a Multi-Dimensional Median), Remote Sens.-Basel, 5, 6481–6500, https://doi.org/10.3390/rs5126481, 2013.
Gong, P., Li, X., and Zhang, W.: 40-Year (1978–2017) human settlement changes in China reflected by impervious surfaces from satellite remote sensing, Sci. Bull., 64, 756–763, https://doi.org/10.1016/j.scib.2019.04.024, 2019.
Gong, P., Li, X., Wang, J., Bai, Y., Chen, B., Hu, T., Liu, X., Xu, B., Yang, J., Zhang, W., and Zhou, Y.: Annual maps of global artificial impervious area (GAIA) between 1985 and 2018, Remote Sens. Environ., 236, 111510, https://doi.org/10.1016/j.rse.2019.111510, 2020.
Gorelick, N., Hancher, M., Dixon, M., Ilyushchenko, S., Thau, D., and Moore, R.: Google Earth Engine: Planetary-scale geospatial analysis for everyone, Remote Sens. Environ., 202, 18–27, 2017.
Grodsky, S. M. and Hernandez, R. R.: Reduced ecosystem services of desert plants from ground-mounted solar energy development, Nat. Sustain., 3, 1036–1043, https://doi.org/10.1038/s41893-020-0574-x, 2020.
Hammoud, M., Shokr, B., Assi, A., Hallal, J., and Khoury, P.: Effect of dust cleaning on the enhancement of the power generation of a coastal PV-power plant at Zahrani Lebanon, Sol. Energy, 184, 195–201, 2019.
He, K., Zhang, X., Ren, S., and Sun, J.: Deep residual learning for image recognition, Proceedings of the IEEE conference on computer vision and pattern recognition, 2016 IEEE Conference on Computer Vision and Pattern Recognition (CVPR), Las Vegas, NV, USA, 770–778, https://doi.org/10.1109/CVPR.2016.90, 27–30 June 2016.
Hernandez, R. R., Easter, S., Murphy-Mariscal, M. L., Maestre, F. T., Tavassoli, M., Allen, E. B., Barrows, C. W., Belnap, J., Ochoa-Hueso, R., and Ravi, S.: Environmental impacts of utility-scale solar energy, Renew. Sust. Energ. Rev., 29, 766–779, 2014.
Hernandez, R. R., Hoffacker, M. K., and Field, C. B.: Efficient use of land to meet sustainable energy needs, Nat. Clim. Change., 5, 353–358, https://doi.org/10.1038/nclimate2556, 2015.
Hou, X., Wang, B., Hu, W., Yin, L., and Wu, H.: SolarNet: A Deep Learning Framework to Map Solar Power Plants In China From Satellite Imagery, arXiv [preprint], arXiv:1912.03685, 2019.
Huete, A., Didan, K., Miura, T., Rodriguez, E. P., Gao, X., and Ferreira, L. G.: Overview of the radiometric and biophysical performance of the MODIS vegetation indices, Remote Sens. Environ., 83, 195–213, 2002.
Ji, C., Bachmann, M., Esch, T., Feilhauer, H., Heiden, U., Heldens, W., Hueni, A., Lakes, T., Metz-Marconcini, A., and Schroedter-Homscheidt, M.: Solar photovoltaic module detection using laboratory and airborne imaging spectroscopy data, Remote Sens. Environ., 266, 112692, https://doi.org/10.1016/j.rse.2021.112692, 2021.
Krizhevsky, A., Sutskever, I., and Hinton, G. E.: Imagenet classification with deep convolutional neural networks, Adv. Neur. In., 25, 1–9, 2012.
Kruitwagen, L., Story, K., Friedrich, J., Byers, L., Skillman, S., and Hepburn, C.: A global inventory of photovoltaic solar energy generating units, Nature, 598, 604–610, 2021.
Li, X., Zhou, Y., Meng, L., Asrar, G. R., Lu, C., and Wu, Q.: A dataset of 30 m annual vegetation phenology indicators (1985–2015) in urban areas of the conterminous United States, Earth Syst. Sci. Data, 11, 881–894, https://doi.org/10.5194/essd-11-881-2019, 2019.
Li, Y., Kalnay, E., Motesharrei, S., Rivas, J., Kucharski, F., Kirk-Davidoff, D., Bach, E., and Zeng, N.: Climate model shows large-scale wind and solar farms in the Sahara increase rain and vegetation, Science, 361, 1019–1022, 2018.
Liu, Y., Zhang, R. Q., Huang, Z., Cheng, Z., López-Vicente, M., Ma, X. R., and Wu, G. L.: Solar photovoltaic panels significantly promote vegetation recovery by modifying the soil surface microhabitats in an arid sandy ecosystem, Land Degrad. Dev., 30, 2177–2186, https://doi.org/10.1002/ldr.3408, 2019.
Malof, J. M., Bradbury, K., Collins, L. M., and Newell, R. G.: Automatic detection of solar photovoltaic arrays in high resolution aerial imagery, Appl. Energ., 183, 229–240, https://doi.org/10.1016/j.apenergy.2016.08.191, 2016a.
Malof, J. M., Bradbury, K., Collins, L. M., Newell, R. G., Serrano, A., Wu, H., and Keene, S.: Image features for pixel-wise detection of solar photovoltaic arrays in aerial imagery using a random forest classifier, 2016 IEEE International Conference on Renewable Energy Research and Applications (ICRERA), Birmingham, UK, 799–803, 20–23 November 2016b.
Malof, J. M., Collins, L. M., and Bradbury, K.: A deep convolutional neural network, with pre-training, for solar photovoltaic array detection in aerial imagery, 2017 IEEE International Geoscience and Remote Sensing Symposium (IGARSS), Fort Worth, Texas, USA, 874–877, 23–28 July 2017.
Mao, Y., Harris, D. L., Xie, Z., and Phinn, S.: Efficient measurement of large-scale decadal shoreline change with increased accuracy in tide-dominated coastal environments with Google Earth Engine, ISPRS J. Photogramm., 181, 385–399, 2021.
Maxwell, A. E., Warner, T. A., and Fang, F.: Implementation of machine-learning classification in remote sensing: an applied review, Int. J. Remote Sens., 39, 2784–2817, https://doi.org/10.1080/01431161.2018.1433343, 2018.
Nemet, G. F.: Net radiative forcing from widespread deployment of photovoltaics, Environ. Sci. Technol., 43, 2173–2178, 2009.
Nghiem, J., Potter, C., and Baiman, R.: Detection of Vegetation Cover Change in Renewable Energy Development Zones of Southern California Using MODIS NDVI Time Series Analysis, 2000 to 2018, Environments, 6, 40, https://doi.org/10.3390/environments6040040, 2019.
Phalke, A. R., Özdoğan, M., Thenkabail, P. S., Erickson, T., Gorelick, N., Yadav, K., and Congalton, R. G.: Mapping croplands of Europe, Middle East, Russia, and Central Asia using Landsat, Random Forest, and Google Earth Engine, ISPRS J. Photogramm., 167, 104–122, https://doi.org/10.1016/j.isprsjprs.2020.06.022, 2020.
Roy, D. P., Wulder, M. A., Loveland, T. R., Woodcock, C., Allen, R. G., Anderson, M. C., Helder, D., Irons, J. R., Johnson, D. M., and Kennedy, R.: Landsat-8: Science and product vision for terrestrial global change research, Remote Sens. Environ., 145, 154–172, 2014.
Sahu, A., Yadav, N., and Sudhakar, K.: Floating photovoltaic power plant: A review, Renew. Sust. Energ. Rev., 66, 815–824, https://doi.org/10.1016/j.rser.2016.08.051, 2016.
Schmidhuber, J.: Deep learning in neural networks: An overview, Neural Networks, 61, 85–117, 2015.
Copernicus Climate Change Service: ERA5: Fifth generation of ECMWF atmospheric reanalyses of the global climate, Copernicus Climate Change Service Climate Data Store (CDS), https://cds.climate.copernicus.eu/cdsapp#!/home (last access: 11 August 2022), 2017.
Taha, H.: The potential for air-temperature impact from large-scale deployment of solar photovoltaic arrays in urban areas, Sol. Energy, 91, 358–367, 2013.
Tatem, A. J.: WorldPop, open data for spatial demography, Sci. Data, 4, 1–4, 2017.
Tucker, C. J.: Red and photographic infrared linear combinations for monitoring vegetation, Remote Sens. Environ., 8, 127–150, 1979.
Wen, J., Liu, Q., Xiao, Q., Liu, Q., You, D., Hao, D., Wu, S., and Lin, X.: Characterizing Land Surface Anisotropic Reflectance over Rugged Terrain: A Review of Concepts and Recent Developments, Remote Sens.-Basel, 10, 370, https://doi.org/10.3390/rs10030370, 2018.
Xie, Z., Phinn, S. R., Game, E. T., Pannell, D. J., Hobbs, R. J., Briggs, P. R., and McDonald-Madden, E.: Using Landsat observations (1988–2017) and Google Earth Engine to detect vegetation cover changes in rangelands – A first step towards identifying degraded lands for conservation, Remote Sens. Environ., 232, 111317, https://doi.org/10.1016/j.rse.2019.111317, 2019.
Xu, H.: Modification of normalised difference water index (NDWI) to enhance open water features in remotely sensed imagery, Int. J. Remote Sens., 27, 3025–3033, 2006.
Yadav, A. K. and Chandel, S. S.: Tilt angle optimization to maximize incident solar radiation: A review, Renew. Sust. Energ. Rev., 23, 503–513, https://doi.org/10.1016/j.rser.2013.02.027, 2013.
Yu, J., Wang, Z., Majumdar, A., and Rajagopal, R.: DeepSolar: A Machine Learning Framework to Efficiently Construct a Solar Deployment Database in the United States, Joule, 2, 2605–2617, https://doi.org/10.1016/j.joule.2018.11.021, 2018.
Zanaga, D., Van De Kerchove, R., De Keersmaecker, W., Souverijns, N., Brockmann, C., Quast, R., Wevers, J., Grosu, A., Paccini, A., Vergnaud, S., Cartus, O., Santoro, M., Fritz, S., Georgieva, I., Lesiv, M., Carter, S., Herold, M., Li, L., Tsendbazar, N.-E., Ramoino, F., and Arino, O.: ESA WorldCover 10 m 2020 v100, Zenodo [data set], https://doi.org/10.5281/zenodo.5571936, 2021.
Zha, Y., Gao, J., and Ni, S.: Use of normalized difference built-up index in automatically mapping urban areas from TM imagery, Int. J. Remote Sens., 24, 583–594, 2003.
Zhang, X. and Xu, M.: Assessing the Effects of Photovoltaic Powerplants on Surface Temperature Using Remote Sensing Techniques, Remote Sens.-Basel, 12, 1825, https://doi.org/10.3390/rs12111825, 2020.
Zhang, X., Zeraatpisheh, M., Rahman, M. M., Wang, S., and Xu, M.: Texture Is Important in Improving the Accuracy of Mapping Photovoltaic Power Plants: A Case Study of Ningxia Autonomous Region, China, Remote Sens., 13, 3909, https://doi.org/10.3390/rs13193909, 2021.
Zhang, X., Wang, S., Huang, Y., Zunyi Xie, Z., and Xu, M.: The dataset of photovoltaic power plant distribution in China by 2020 (002), Zenodo [data set], https://doi.org/10.5281/zenodo.6849477, 2022.
Zhou, B., Okin, G. S., and Zhang, J.: Leveraging Google Earth Engine (GEE) and machine learning algorithms to incorporate in situ measurement from different times for rangelands monitoring, Remote Sens. Environ., 236, 111521, https://doi.org/10.1016/j.rse.2019.111521, 2020.
Zhu, Z., Woodcock, C. E., Rogan, J., and Kellndorfer, J.: Assessment of spectral, polarimetric, temporal, and spatial dimensions for urban and peri-urban land cover classification using Landsat and SAR data, Remote Sens. Environ., 117, 72–82, 2012.
Zou, H., Du, H., Brown, M. A., and Mao, G.: Large-scale PV power generation in China: A grid parity and techno-economic analysis, Energy, 134, 256–268, https://doi.org/10.1016/j.energy.2017.05.192, 2017.