the Creative Commons Attribution 4.0 License.
the Creative Commons Attribution 4.0 License.
 | 16 Aug 2022
OCTOPUS database (v.2)
Alexandru T. Codilean
Henry Munack
Wanchese M. Saktura
Tim J. Cohen
Zenobia Jacobs
Sean Ulm
Paul P. Hesse
Jakob Heyman
Katharina J. Peters
Alan N. Williams
Rosaria B. K. Saktura
Xue Rui
Kai Chishiro-Dennelly
Adhish Panta
OCTOPUS v.2 is an Open Geospatial Consortium (OGC) compliant web-enabled database that allows users to visualise, query, and download cosmogenic radionuclide, luminescence, and radiocarbon ages and denudation rates associated with erosional landscapes, Quaternary depositional landforms, and archaeological records, along with ancillary geospatial (vector and raster) data layers. The database follows the FAIR (Findability, Accessibility, Interoperability, and Reuse) data principles and is based on open-source software deployed on the Google Cloud Platform. Data stored in the database can be accessed via a custom-built web interface and via desktop geographic information system (GIS) applications that support OGC data access protocols. OCTOPUS v.2 hosts five major data collections. CRN Denudation and ExpAge consist of published cosmogenic 10Be and 26Al measurements in modern fluvial sediment and glacial samples respectively. Both collections have a global extent; however, in addition to geospatial vector layers, CRN Denudation also incorporates raster layers, including a digital elevation model, gradient raster, flow direction and flow accumulation rasters, atmospheric pressure raster, and CRN production scaling and topographic shielding factor rasters. SahulSed consists of published optically stimulated luminescence (OSL) and thermoluminescence (TL) ages for fluvial, aeolian, and lacustrine sedimentary records across the Australian mainland and Tasmania. SahulArch consists of published OSL, TL, and radiocarbon ages for archaeological records, and FosSahul consists of published late-Quaternary records of direct and indirect non-human vertebrate (mega)fauna fossil ages that have been systematically quality rated. Supporting data are comprehensive and include bibliographic, contextual, and sample-preparation- and measurement-related information. In the case of cosmogenic radionuclide data, OCTOPUS also includes all necessary information and input files for the recalculation of denudation rates using the open-source program CAIRN. OCTOPUS v.2 and its associated data curation framework allow for valuable legacy data to be harnessed that would otherwise be lost to the research community. The database can be accessed at https://octopusdata.org (last access: 1 July 2022). The individual data collections can also be accessed via their respective digital object identifiers (DOIs) (see Table 1).
- Article
(5973 KB) - Full-text XML
- Companion paper
- BibTeX
- EndNote


Cosmogenic radionuclide (CRN) exposure dating (Granger et al., 2013; Schaefer et al., 2022), luminescence dating (Rhodes, 2011; Murray et al., 2021), and radiocarbon dating (Hajdas et al., 2021) are geochronological techniques that are the most widely applicable to the recent geological past. All three of the techniques allow determination of the deposition age of sediments and associated materials, and cosmogenic radionuclides can also be used to quantify the rate at which landforms or landscapes are lowered by physical and chemical erosion processes. The three techniques have made important contributions to the reconstruction of past environments (Roberts et al., 2001; Singhvi and Porat, 2008; Balco, 2019; Hocknull et al., 2020), and CRN and luminescence dating have revolutionised the field of quantitative geomorphology (Granger and Schaller, 2014; Dixon and Riebe, 2014; Guralnik et al., 2015; King et al., 2016). Radiocarbon dating, luminescence dating, and (to some extent) CRN exposure dating have also made substantial contributions to archaeology (Akcar et al., 2008; Renfrew, 2011; Roberts et al., 2015), including to the debates on the timing of human evolution and migration (Granger et al., 2015; Clarkson et al., 2017; Jacobs et al., 2019; Zilhão et al., 2020; Crabtree et al., 2021).
Like most geochronological techniques, the three dating techniques require specialised training, laboratories, and equipment, and they involve lengthy and costly sample preparation procedures. As a result, studies relying on CRN, luminescence, or radiocarbon techniques will often produce relatively small datasets (n<100) that address very specific research questions and focus on relatively small study areas. For example, of the 285 publications reporting CRN-derived denudation rates over the past 25 years, only 18 publications include datasets of n≥50 10Be measurements, with the median number of data points per publication remaining constant over this period at a value of ∼15. Furthermore, the lack of formal reporting standards (Schaefer et al., 2022; Murray et al., 2021; Hajdas et al., 2021) coupled with the disconnect that exists in some cases between the researchers collecting the samples and interpreting the ages and/or rates and the researchers preparing the samples and undertaking the measurements means that the techniques often produce datasets that are unmanaged. These datasets may become forgotten once the study has been completed and results are published, and they may not include sufficient levels of supporting information for the quality of the raw data to be easily determined or for the raw data to be reusable with confidence – for example, in instances where data need to be recalculated due to updated measurement standards and/or data reduction protocols. The above limitations mean that carefully curated compilations of CRN, luminescence, and radiocarbon data are necessary to allow for larger-scale synoptic studies and instances where the quality rating of ages/denudation rates is desirable; moreover, carefully curated compilations of these data are critical to ensuring the longevity and value of often irreplaceable legacy data.
In 2018, we published the OCTOPUS database (Codilean et al., 2018), which consists of a global compilation of cosmogenic 10Be and 26Al measurements from modern fluvial sediment as well as a compilation of optically stimulated luminescence (OSL) and thermoluminescence (TL) measurements from fluvial sediment archives from Australia. The database was hosted at the University of Wollongong (although is has since been moved) and served to the research community via an Open Geospatial Consortium (OGC) compliant web service (https://www.opengeospatial.org, last access: 1 July 2022). Since its launch, the OCTOPUS database has become an important resource to the global geomorphology community (Fig. 1), logging over 900 data requests, mainly for CRN data to be used for both research (∼80 % of requests) and classroom teaching (∼20 % of requests), and, as intended, it has enabled several regional- to global-scale synoptic studies (van Dongen et al., 2019; Godard et al., 2019; Sternai et al., 2019; Delunel et al., 2020; Fülöp et al., 2020; Chen et al., 2021; Codilean et al., 2021a; Godard and Tucker, 2021). Here, we describe the upgraded and updated version of the database – OCTOPUS v.2. The application part of the database has been extensively rewritten, and it is now running on the Google Cloud Platform (https://cloud.google.com, last access: 1 July 2022). The data are stored in a relational database, and the data collections have been extended to include a global collection of CRN exposure ages on glacial landforms; an Australian collection of OSL and TL ages from aeolian and lacustrine sedimentary archives; OSL, TL, and radiocarbon ages from Sahul (Australia, New Guinea, and the Aru Islands joined by lower sea levels) archaeological records; and a collection of late-Quaternary records of non-human vertebrate fauna fossil ages from Sahul. Supporting data are comprehensive and include bibliographic, contextual, and sample-preparation- and measurement-related information. In the case of fluvial sediment CRN data, the database also includes all necessary information and input files for the recalculation of denudation rates using CAIRN, an open-source program for calculating basin-wide denudation rates from 10Be and 26Al data (Mudd et al., 2016). Further, all CRN data have been recalculated and harmonised using the same program. OCTOPUS v.2 can be accessed at https://octopusdata.org (last access: 1 July 2022).
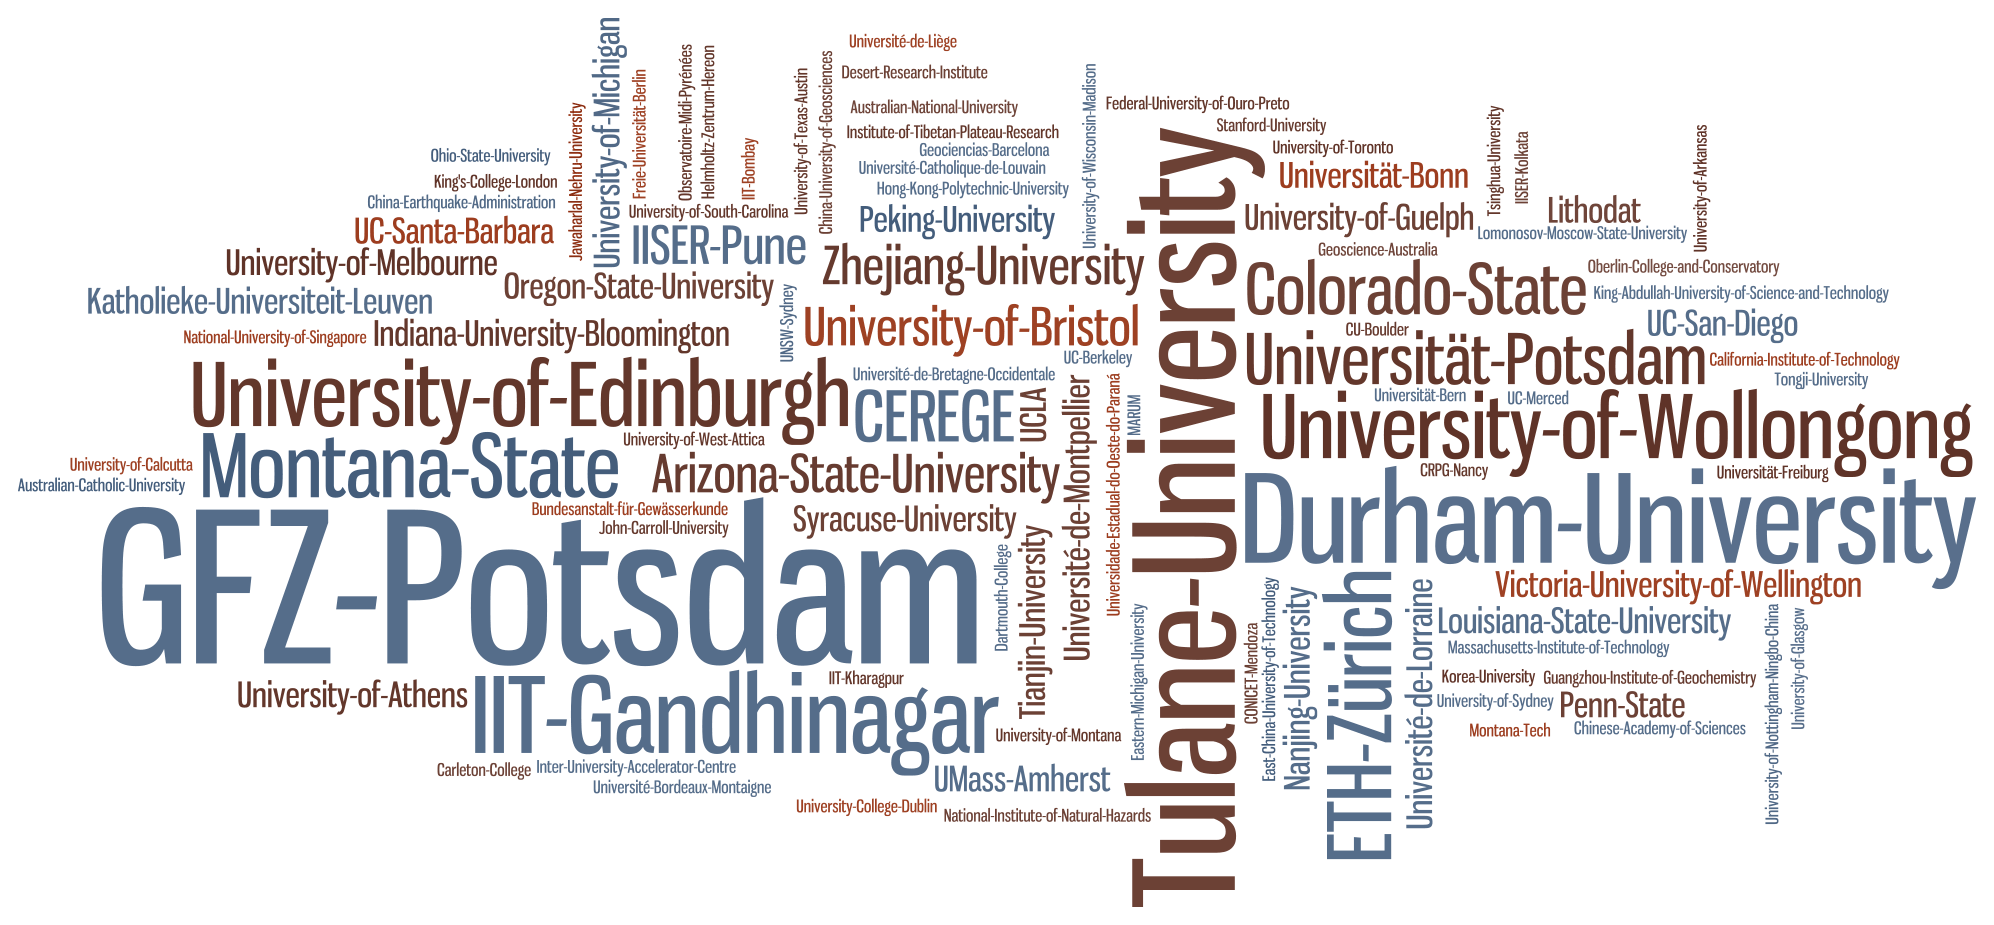
Figure 1List of institutions whose members (researchers and students) requested data from OCTOPUS up to end of year 2021. The size of the words is proportional to the number of unique individuals requesting data from each institution, rather than the number of individual requests.
The software architecture behind OCTOPUS v.2 is illustrated in Fig. 2. The software and data are deployed on the Google Cloud Platform (GCP) and follow a modular set-up aimed at optimal leveraging of cloud services available within the GCP. Although migration of the OCTOPUS platform to a cloud-hosted infrastructure such as the GCP adds complexity to the system architecture, Google Cloud offers extensive infrastructure and software solutions which are constantly updated with the latest technologies and architectures. This constant evolution ensures that any future work and redesigns of the OCTOPUS platform have access to best-in-class solutions. Further, the OCTOPUS platform is completely reproducible with access to a GCP environment, as the source code contains the entire project and required documentation, including infrastructure definitions, application definitions, and deployment steps.
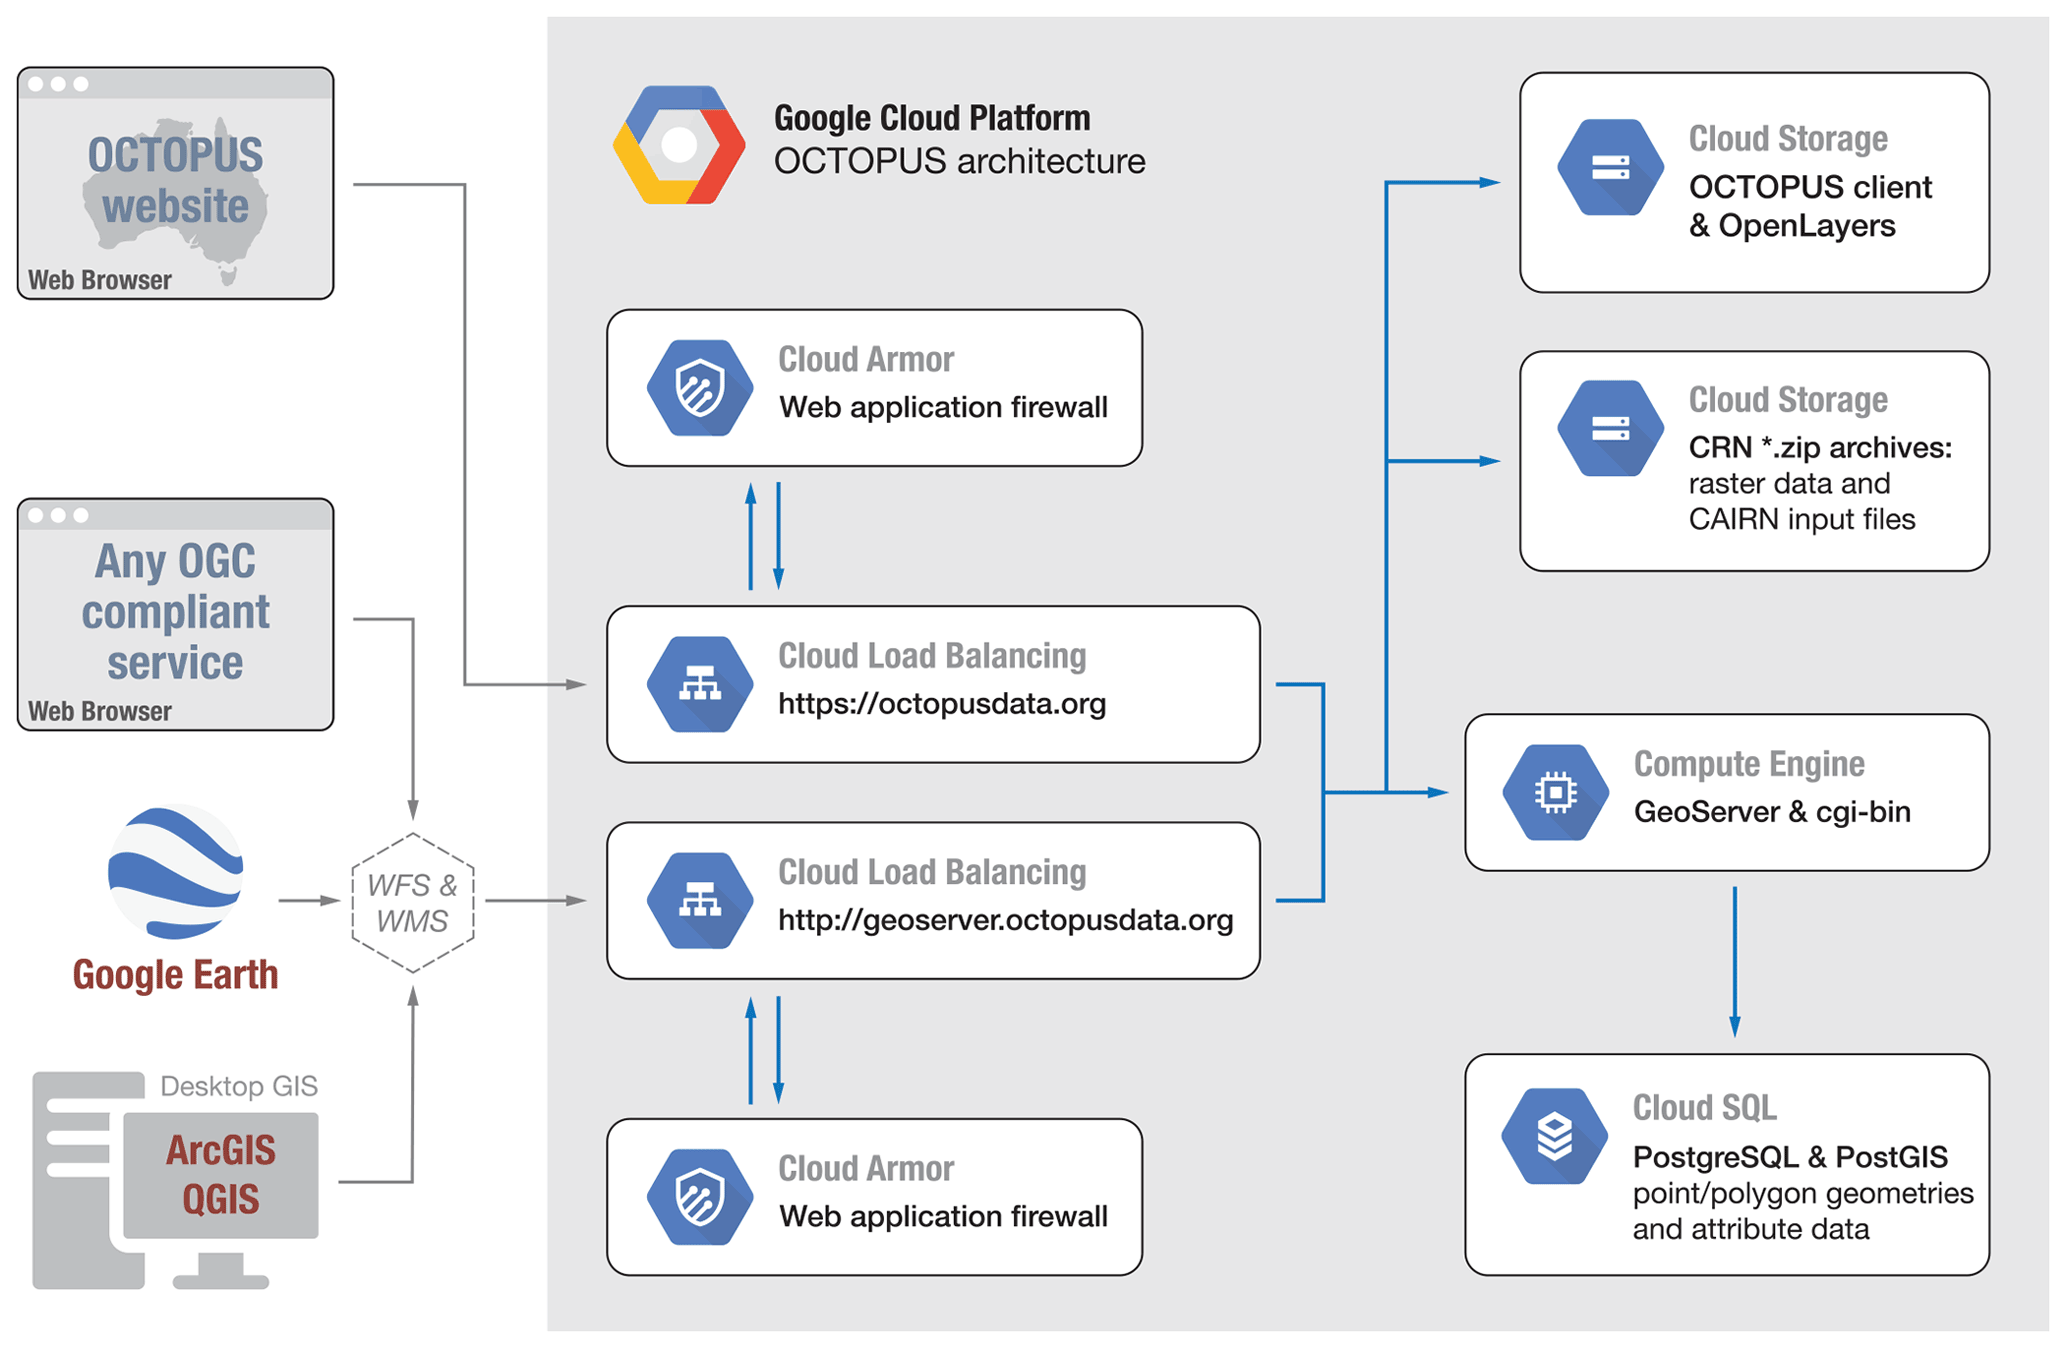
Figure 2Schematic of the OCTOPUS v.2 Google Cloud Platform (GCP) set-up. See the text for more details.
Most components of OCTOPUS v.2 run natively on the GCP apart from GeoServer and Tomcat, which are deployed within a Google Compute Engine using a single bespoke Docker container (https://www.docker.com, last access: 1 July 2022). Tabular data as well as the point and polygon geometries associated with each observation (see below) are stored in a PostgreSQL/PostGIS (https://postgis.net, last access: 1 July 2022) relational database running in Cloud SQL. The latter is a SaaS (Software as a Service) meaning that installation, set-up, and running activities of the database are automatically managed by the GCP, decreasing maintenance overhead and providing a monthly uptime/availability of 99.95 %. Raster data and all CAIRN input and output files are stored separately within a Cloud Storage bucket in .zip archives. Unlike the first version of OCTOPUS (Codilean et al., 2018), the .zip archives in OCTOPUS v.2 no longer include the tabular and vector data that are now hosted in the PostgreSQL/PostGIS relational database. Thus, we avoid duplication and make future maintenance of the data more straightforward. The relational database is linked to a GeoServer instance (Fig. 2). GeoServer (http://geoserver.org, last access: 1 July 2022) implements a range of OGC data-sharing standards, including the widely used Web Feature Service (WFS) and the Web Map Service (WMS) standards that allow, in addition to connections from a web browser, direct connections to the database from a variety of desktop geographic information system (GIS) applications, including ArcGIS and QGIS (via WFS; see below) and Google Earth (via WMS). GeoServer exports data to various formats, including GML, JSON, Google Earth KML and KMZ, and Esri shapefile. GeoServer (along with Tomcat) is hosted in a Google Compute Engine, an IaaS (Infrastructure as a Service) that allows for a virtualised environment to be run on Google hardware. Geoserver and Tomcat currently exist as a single bespoke Docker container due to limitations of the deployed Geoserver and Tomcat versions that cannot run with separate runtimes. More recent Geoserver and Tomcat versions, however, exist as standard Docker containers that can be run independently aligned with a microservice architecture. Utilising these dockerised versions would permit the applications to be run on managed server-less platforms such as Google Cloud Run, allowing modular horizontal scaling. Further, Tomcat's Common Gateway Interface (CGI) that provides functionality to the OCTOPUS frontend, such as downloading files and retrieving study bounding boxes, could also be separated into independent resources that run on Google Cloud Functions and allow for near-infinite horizontal scalability to meet any fluctuations in traffic volume. Next, the OCTOPUS web frontend is deployed in a Cloud Storage bucket and uses the OpenLayers (https://openlayers.org, last access: 1 July 2022) JavaScript library to display the geospatial data served by the GeoServer instance in a web browser (Fig. 2). Finally Cloud Load Balancing is used to distribute traffic and to separate connections to the web interface from those directed to GeoServer directly via WFS/WMS from third-party applications.
Unlike the prior version of the OCTOPUS database that stored data in a series of flat data tables (Codilean et al., 2018), OCTOPUS v.2 builds on a fully relational PostgreSQL database that, using PostGIS spatial extensions, organises data following a two-pronged conceptual model (Fig. 3). First, data are organised hierarchically going from a broader defined agglomeration of “sites” sharing common properties (referred to as a “metasite”) down to “observations”, namely the actual 10Be, 26Al, OSL, TL, or radiocarbon age or rate data. Second, data are also organised thematically into (i) “local” data, spatial features, and parent tables – with all of these serving a single data collection; (ii) “thematic” parent tables serving multiple data collections that are thematically linked (e.g. are based on the same method); and (iii) “global” parent tables that serve all data collections (Fig. 3).
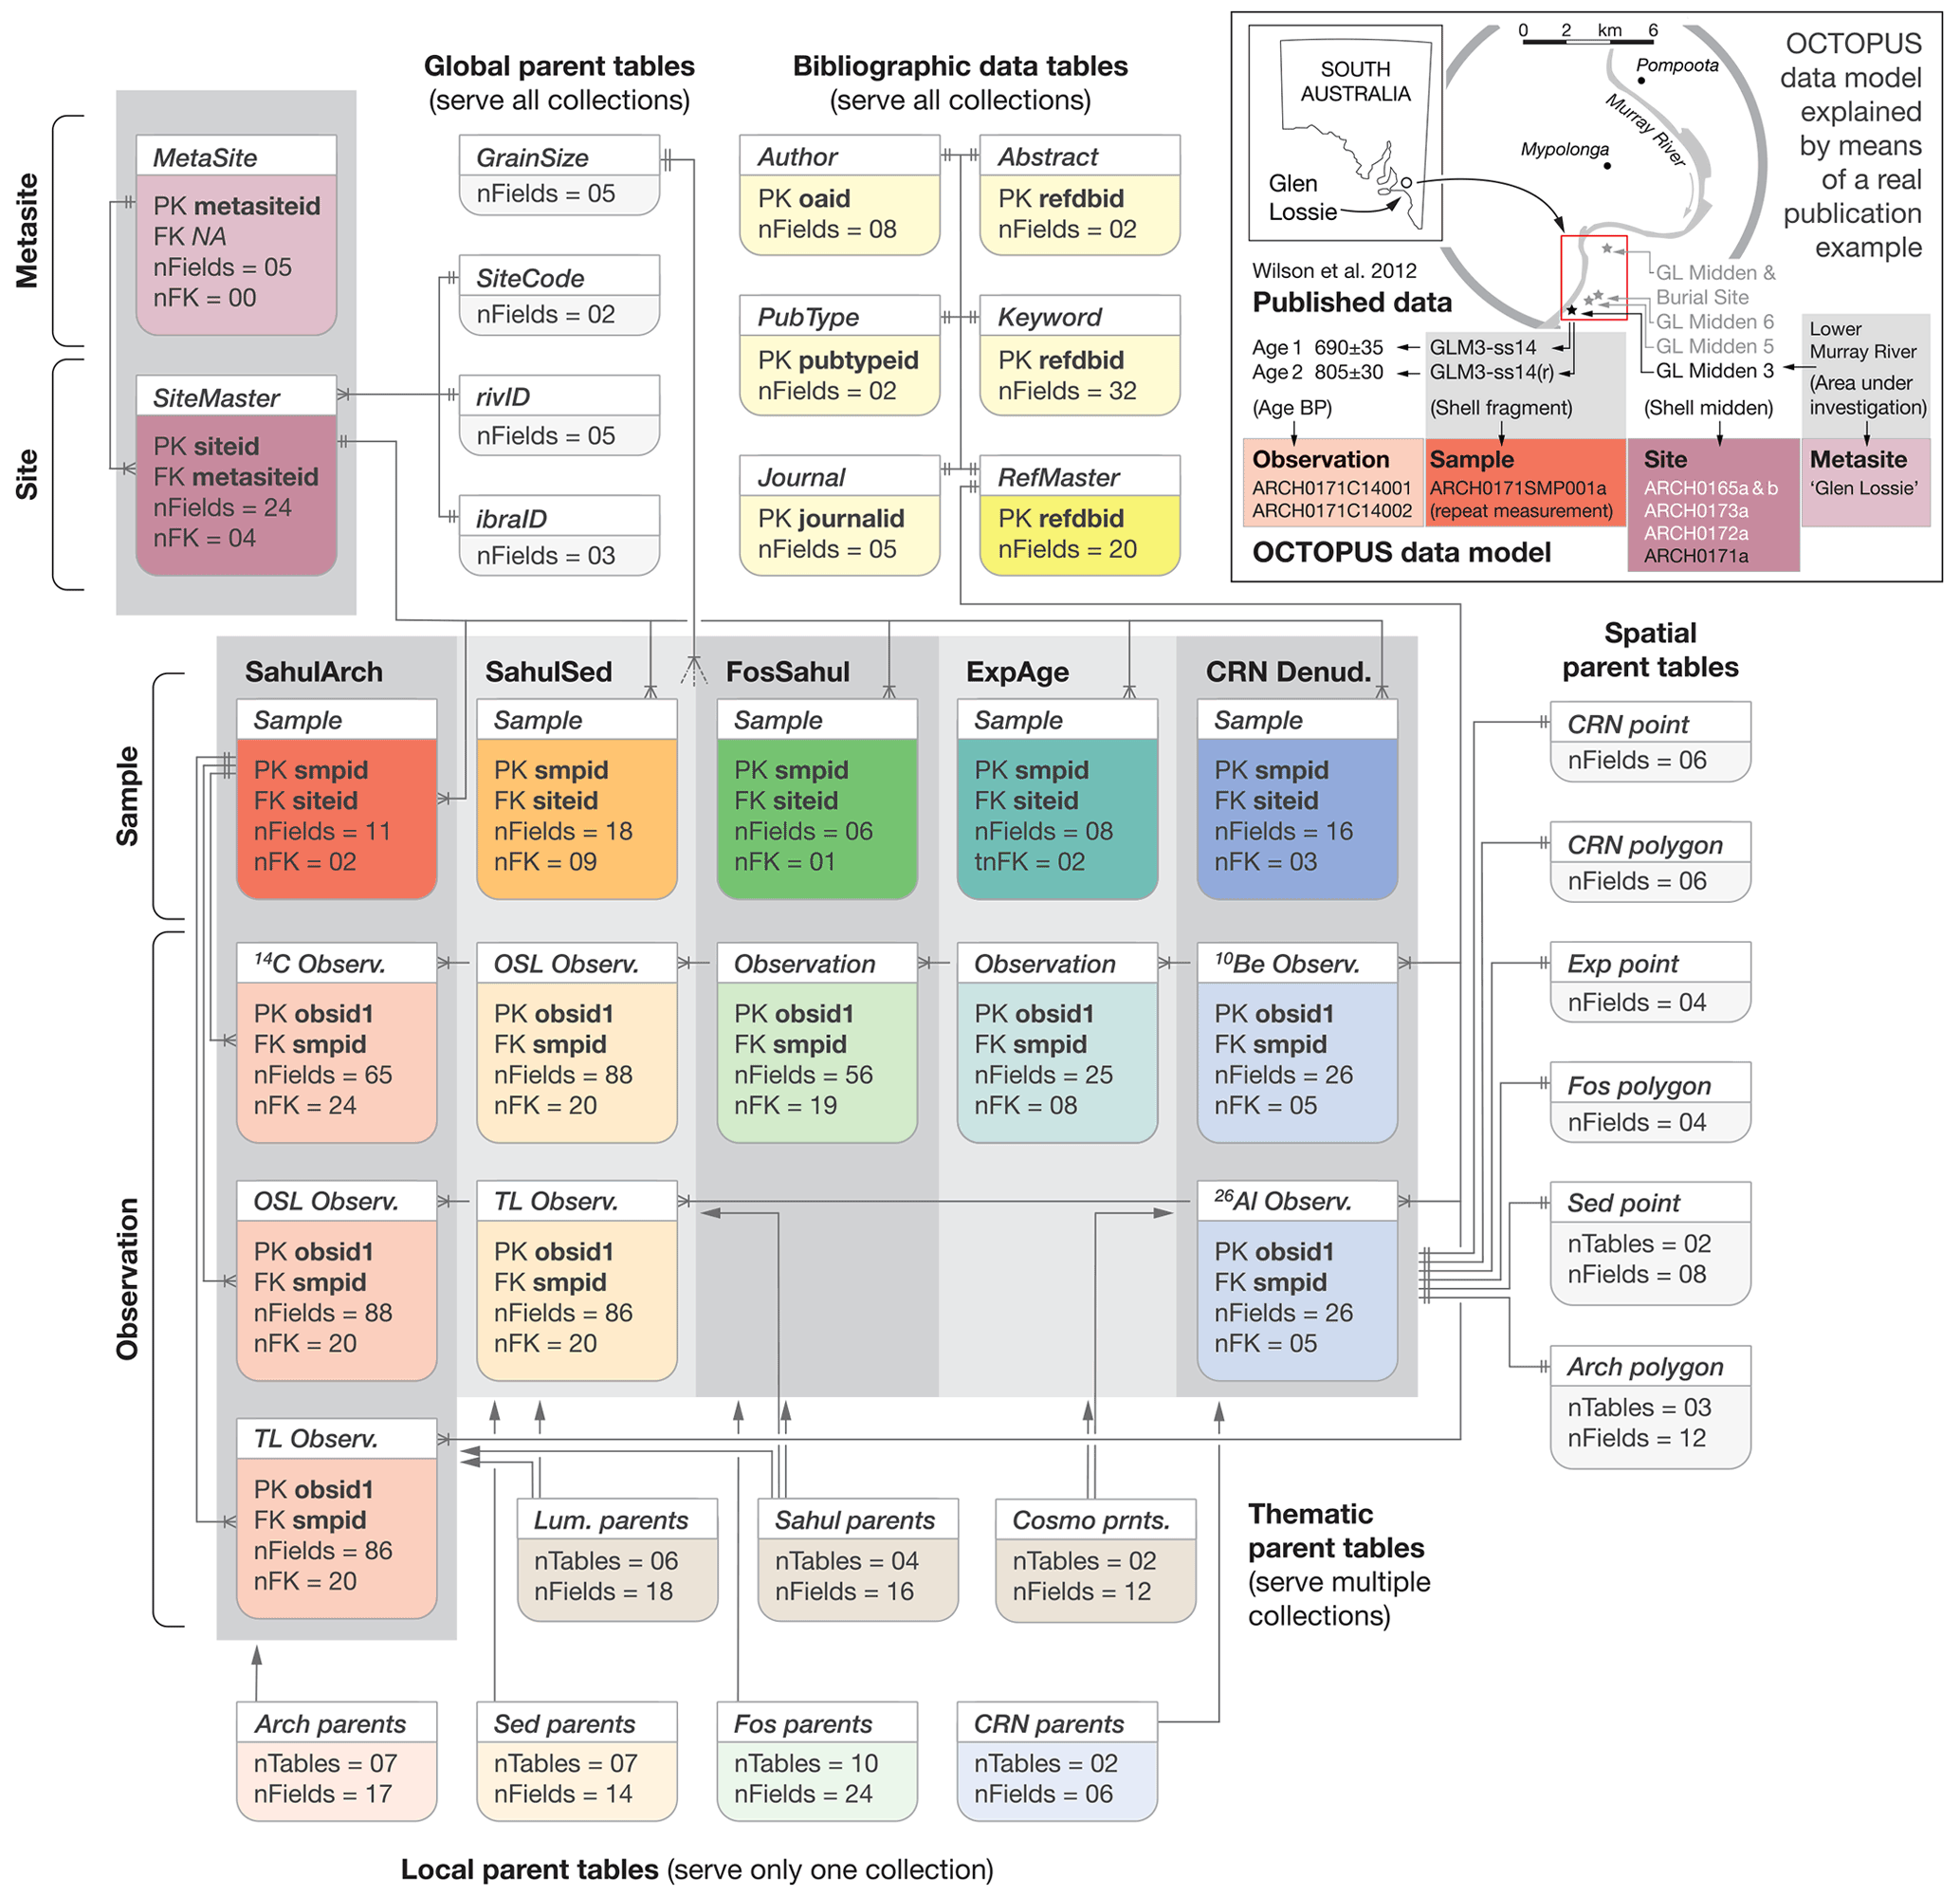
Figure 3Representation of the OCTOPUS v.2 semantic data model. The full database schema along with HTML documentation is available in Munack and Codilean (2022). The inset refers to the “Glen Lossie” metasite. See the text for more details.
In terms of hierarchy, the OCTOPUS v.2 data model includes four levels: metasite, site, sample, and observation. Whilst sites, samples, and observations apply to all data collections, metasites do not apply to the CRN Denudation and Sahul Sedimentary Archives (SahulSed) collections. A site, the hierarchical level subordinate to metasite, is a geographic point entity from which n≥1 samples have been collected. Therefore, sites without associated samples do not exist. A site is predominantly defined by geographic attributes, including georeferencing information (e.g. country, region, island, river basin, coordinates, and elevation) and other addressing/identification information (e.g. site name, alternative name, and type of site). All site description data are stored in one global table. Samples represent the material – for example, shell, bone, rock fragment, river sand – that was collected and used for the age/denudation rate determination. Therefore, samples are (or were) a tangible entity. In OCTOPUS v.2, samples are described by sets of data-collection-specific attributes; thus, each data collection will have its dedicated sample table that links records to sites via unique site identifiers. Typical sample table attributes deal with physical sample properties (e.g. grain size, material dated, sample thickness, or density) and their very local depositional contexts (e.g. facies, shielding, depth below surface, and excavation square or unit). Finally, observations (i.e. the actual age/denudation rate data) are stored in dedicated method-specific tables that include fields aimed at capturing any meaningful auxiliary data that help evaluate the quality of the age/denudation rate and, where necessary, further allow for the latter to be recalculated/reproduced.
We illustrate how the above hierarchical semantic data model is implemented in OCTOPUS v.2, using the example of a South Australian shell midden cluster (Wilson et al., 2012) (Fig. 3, inset). A cluster of shell middens that share contextual similarities form a metasite – “Glen Lossie” – that has a footprint that may be defined by a bounding box. Individual middens belonging to Glen Lossie are considered sites (point geometry) and have unique OCTOPUS site identifiers assigned (Fig. 3, inset). Shell fragments are samples from those midden sites. In the Glen Lossie case, a repeat measurement was done on a shell fragment with the original ID “GLM3-ss14”. As a result, OCTOPUS considers “GLM3-ss14” and “GLM3-ss14(r)” as a single sample with two associated observations, i.e. two separate radiocarbon ages (Obs. IDs ARCH0171C14001 and ARCH0171C14002 respectively; Fig. 3, inset).
To serve the data collected in the OCTOPUS database as geospatial layers via an interactive map interface and to allow for data manipulation via the WFS protocol, each data sub-collection is served to GeoServer as a flat data table. The deployed version of GeoServer does not accept dynamically generated PostgreSQL virtual tables (knows as “views”); therefore, the generation of static flat data tables was required to serve the purpose of a view. Newer versions of GeoServer, however, accept materialised views, and an upgrade would present a possible improvement in the database by eliminating the need to store duplicate data. When downloading data from OCTOPUS, users are presented with point or polygon geospatial data files with associated attribute tables. Codilean et al. (2021) provide field descriptions for each flat data table (n=19). Direct connections to the PostgreSQL/PostGIS database are possible upon request. Munack and Codilean (2022) provide a complete documentation of the relational database, including a detailed database model diagram and searchable HTML documentation generated using SchemaSpy (https://schemaspy.org, last access: 1 July 2022).
CRN-based exposure ages and denudation rates require periodic recalculation, as measurement standards and calculation protocols are regularly revised and updated (Phillips et al., 2016; Schaefer et al., 2022). Further, recalculating exposure ages and denudation rates is also necessary when comparing results produced by different accelerator mass spectrometry (AMS) facilities that happen to normalise results to different AMS standards (Balco et al., 2008). To this end, the published 10Be and 26Al data included in the OCTOPUS database have been recalculated so that nuclide concentrations and denudation rates are internally consistent and comparable. For completeness, the database also includes 10Be and 26Al concentrations and denudation rates as published. 10Be and 26Al concentrations (atoms g−1) were renormalised to the Nishiizumi 2007 10Be AMS standard (Nishiizumi et al., 2007) and to the Nishiizumi 2004 26Al AMS standard (Nishiizumi, 2004) respectively. Basin-wide denudation rates were recalculated with the open-source program CAIRN (Mudd et al., 2016) with the following parameter settings: (i) nuclide production from neutrons and muons was calculated with the approximation of Braucher et al. (2011) using a sea-level and high-latitude total production rate of for 10Be and of for 26Al; (ii) latitude and altitude scaling factors were calculated using the time-independent Lal–Stone scaling scheme (Stone, 2000) with atmospheric pressure calculated via interpolation from the National Centers for Environmental Prediction NCEP2 reanalysis data (Compo et al., 2011); and (iii) topographic shielding was calculated from the same digital elevation model (DEM) using the method of Codilean (2006). Although several CRN denudation rate calculators are available (Balco et al., 2008; Vermeesch, 2007; Charreau et al., 2019), we prefer the CAIRN program for several reasons. First, CAIRN is open source and is packaged in freely available software that runs on all commonly used operating systems. Second, CAIRN is automated and designed to allow for reproducibility of results. Users can simply publish a DEM of their study area, CRN data files, and CAIRN input files, and denudation rates should be reproducible. Third, the open-source framework means that the code can be modified to include updated methods for production rates and scaling factors. Thus, future users can recalculate denudation rates using updated versions of the code as well as the raster data and CAIRN input files that are provided via OCTOPUS v.2 (see below), meaning that the CRN data will remain reproducible/reusable into the future.
The data in OCTOPUS v.2 are organised into three major collections: (i) CRN Denudation – a global collection of publicly available cosmogenic 10Be and 26Al measurements in modern fluvial sediment and respective basin-averaged denudation rates; (ii) Sahul Sedimentary Archives (SahulSed) – a collection of publicly available OSL and TL ages for fluvial, aeolian, and lacustrine sedimentary records from Australia; and (iii) Sahul Archaeology (SahulArch) – a collection of publicly available radiocarbon, OSL, and TL ages for archaeological records from Sahul. Each of the above collections is further organised in several sub-collections based on geographic area, method, or sedimentary archive type (Table 1). In addition to the above collections – which we refer to as the OCTOPUS v.2 “core” data collections – the database also includes two “partner” collections, namely, (i) FosSahul – a collection of publicly available quality-ranked ages for the late-Quaternary non-human vertebrate fauna fossil records of Sahul; and (ii) ExpAge – a global collection of publicly available cosmogenic 10Be and 26Al measurements in glacial samples and respective recalculated exposure ages. The two partner collections have been fully integrated into the OCTOPUS v.2 relational database; however, currently these are not maintained nor officially supported by the OCTOPUS project, so versions that are more up to date (albeit less rich in auxiliary data) may exist elsewhere.
Codilean and Munack (2021a)Codilean and Munack (2021b)Cohen et al. (2021f)Cohen et al. (2021e)Cohen et al. (2021b)Cohen et al. (2021a)Cohen et al. (2021d)Cohen et al. (2021c)Saktura et al. (2021c)Saktura et al. (2021a)Saktura et al. (2021b)Table 1Summary of the OCTOPUS v.2 core data collections and sub-collections.
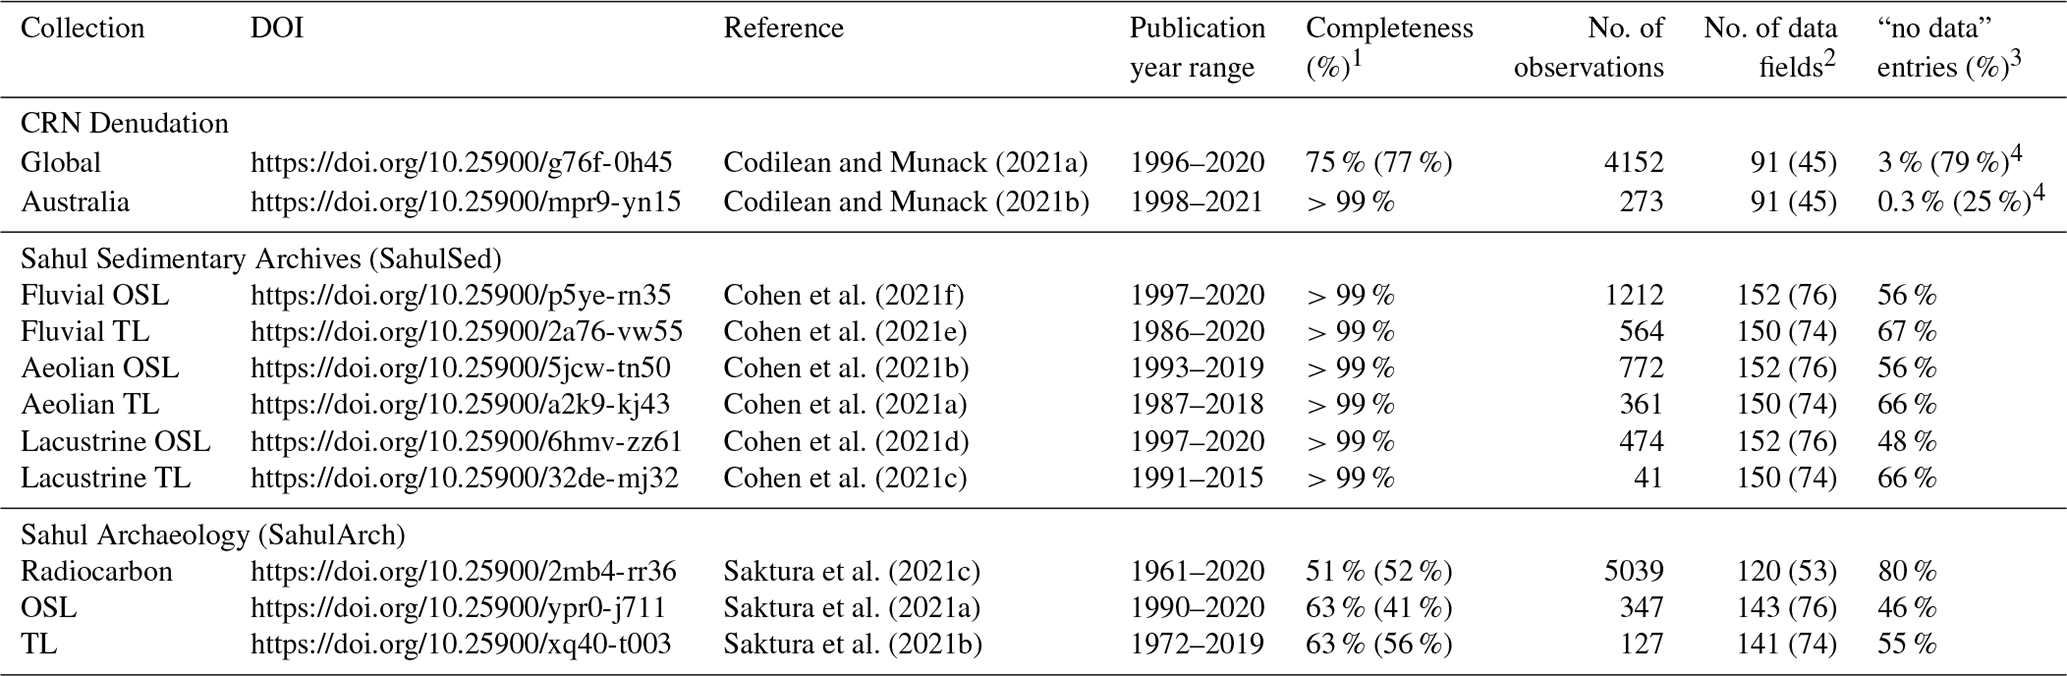
1 Percentage of studies and observations (in parentheses) captured compared with the total number of studies and observations published up to end of year 2021. For example, the CRN Denudation Global collection captures 75 % of publications and 77 % of data points that were available in the literature at the end of 2021. 2 Values in parentheses represent the number of fields containing information specific to the dating method (i.e. sample-preparation- and measurement-related information), whereas values outside of parentheses represent the total number of fields in each data table. The latter includes bibliographic details (i.e. details of publications from which data were collected) and contextual information related to samples and sample sites. 3 Percentage of records that are missing data due to information not being reported in the source. This refers only to fields containing information specific to the dating method. 4 Values in parentheses indicate the percentage of “no data” entries for both 10Be and 26Al, whereas values outside of parentheses consider only 10Be. The relatively large values in parentheses are due to most studies only including 10Be measurements and 26Al data fields for those studies designated as “no data”.
5.1 CRN Denudation
The CRN Denudation collection is composed of four sub-collections, two of which are officially supported as part of the OCTOPUS project and have been minted DOIs – namely CRN Denudation “Global” and CRN Denudation “Australia”. The other two sub-collections – namely CRN Denudation “Large Basins” and CRN Denudation “UOW (in preparation)” – are included only for completeness and have been described in more detail in Codilean et al. (2018). CRN Denudation Global and Australia consist of cosmogenic 10Be (and, where available, cosmogenic 26Al) basin-wide denudation rates published in the peer-reviewed literature up to the year 2021 and include a total of 4425 10Be data points (Table 1, Fig. 4), with 1083 of those added as part of the update to version 2 (n=878 for CRN Denudation Global, and n=205 for CRN Denudation Australia). The Australian sub-collection captures every known study published up to 2021, whereas the Global sub-collection includes about 77 % of all published 10Be data (75 % of publications). In terms of 26Al data, CRN Denudation Global and Australia include 403 data points (Fig. 4), 164 of which were added as part of the update to version 2 (n=18 for CRN Denudation Global, and n=146 for CRN Denudation Australia). As with OCTOPUS v.1, in addition to the vector and attribute data that are stored in the PostgreSQL/PostGIS database, the CRN Denudation collection also includes seven raster data layers and a series of text files representing CAIRN configuration and input/output files (Table 2). These additional files are organised in “studies” – with each study represents one publication – and are saved as separated .zip archives with names keyed to the unique identifier assigned to each study (Codilean et al., 2021). For consistency across the CRN Denudation collections, published 10Be and 26Al concentrations (atoms g−1) were renormalised to the same AMS standards, and basin-wide denudation rates (mm kyr−1) were recalculated with the open-source program CAIRN (Mudd et al., 2016).
In terms of geographical extent, the updated CRN Denudation collection is similar to the previous version (Codilean et al., 2018): the majority of data are from Northern Hemisphere drainage basins, clustering around distinct, mostly tectonically active regions, such as the Pacific coast of the United States, the Appalachians, the European Alps, and the Tibet-Himalaya region (Fig. 4a). There is also good coverage of the Andes. Large gaps in data from low-gradient and tectonically passive regions remain, although OCTOPUS v.2 includes substantially more data from Australia and southern Africa. Despite the geographical bias, the CRN Denudation collection includes basins with a wide range of slope gradients, elevations, and basin areas (Fig. 4b).
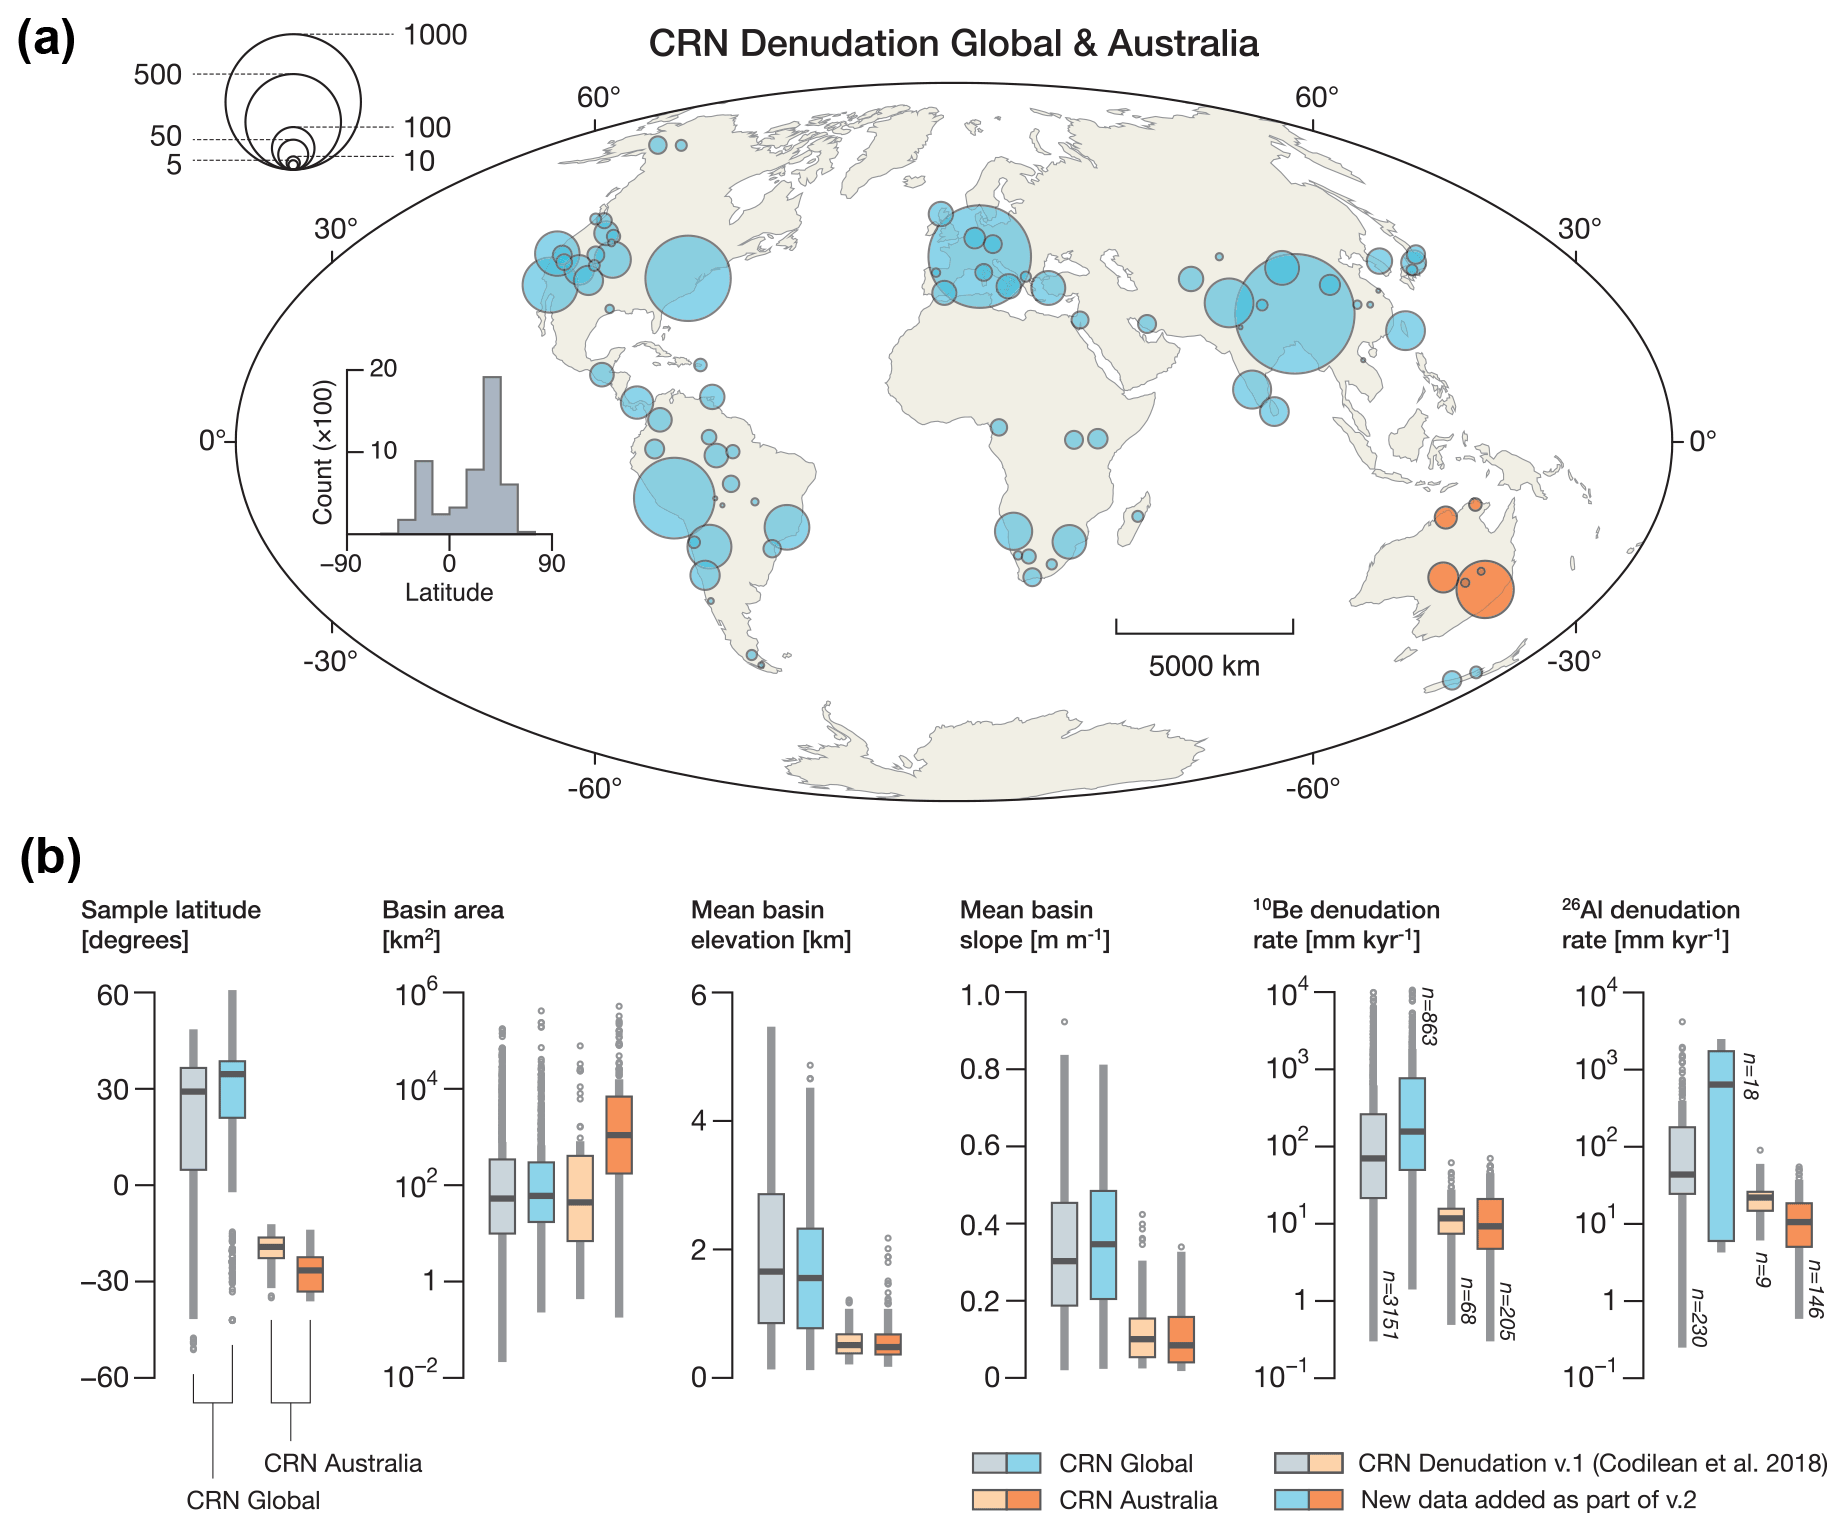
Figure 4The CRN Denudation data collection. The size of circles corresponds to the number of observations in each 250 km radius cluster. Blue circles denote CRN Global, and orange circles denote CRN Australia. Box plots are standard interquartile range (IQR) plots with outliers defined as data points . Box plots in blue hues represent the CRN Global sub-collection, box plots in orange hues represent the CRN Australia sub-collection, desaturated colours represent data available as part of OCTOPUS v.1 (Codilean et al., 2018), and saturated colours represent data added as part of OCTOPUS v.2.
Table 2Description of CRN data files available as part of .zip packages.
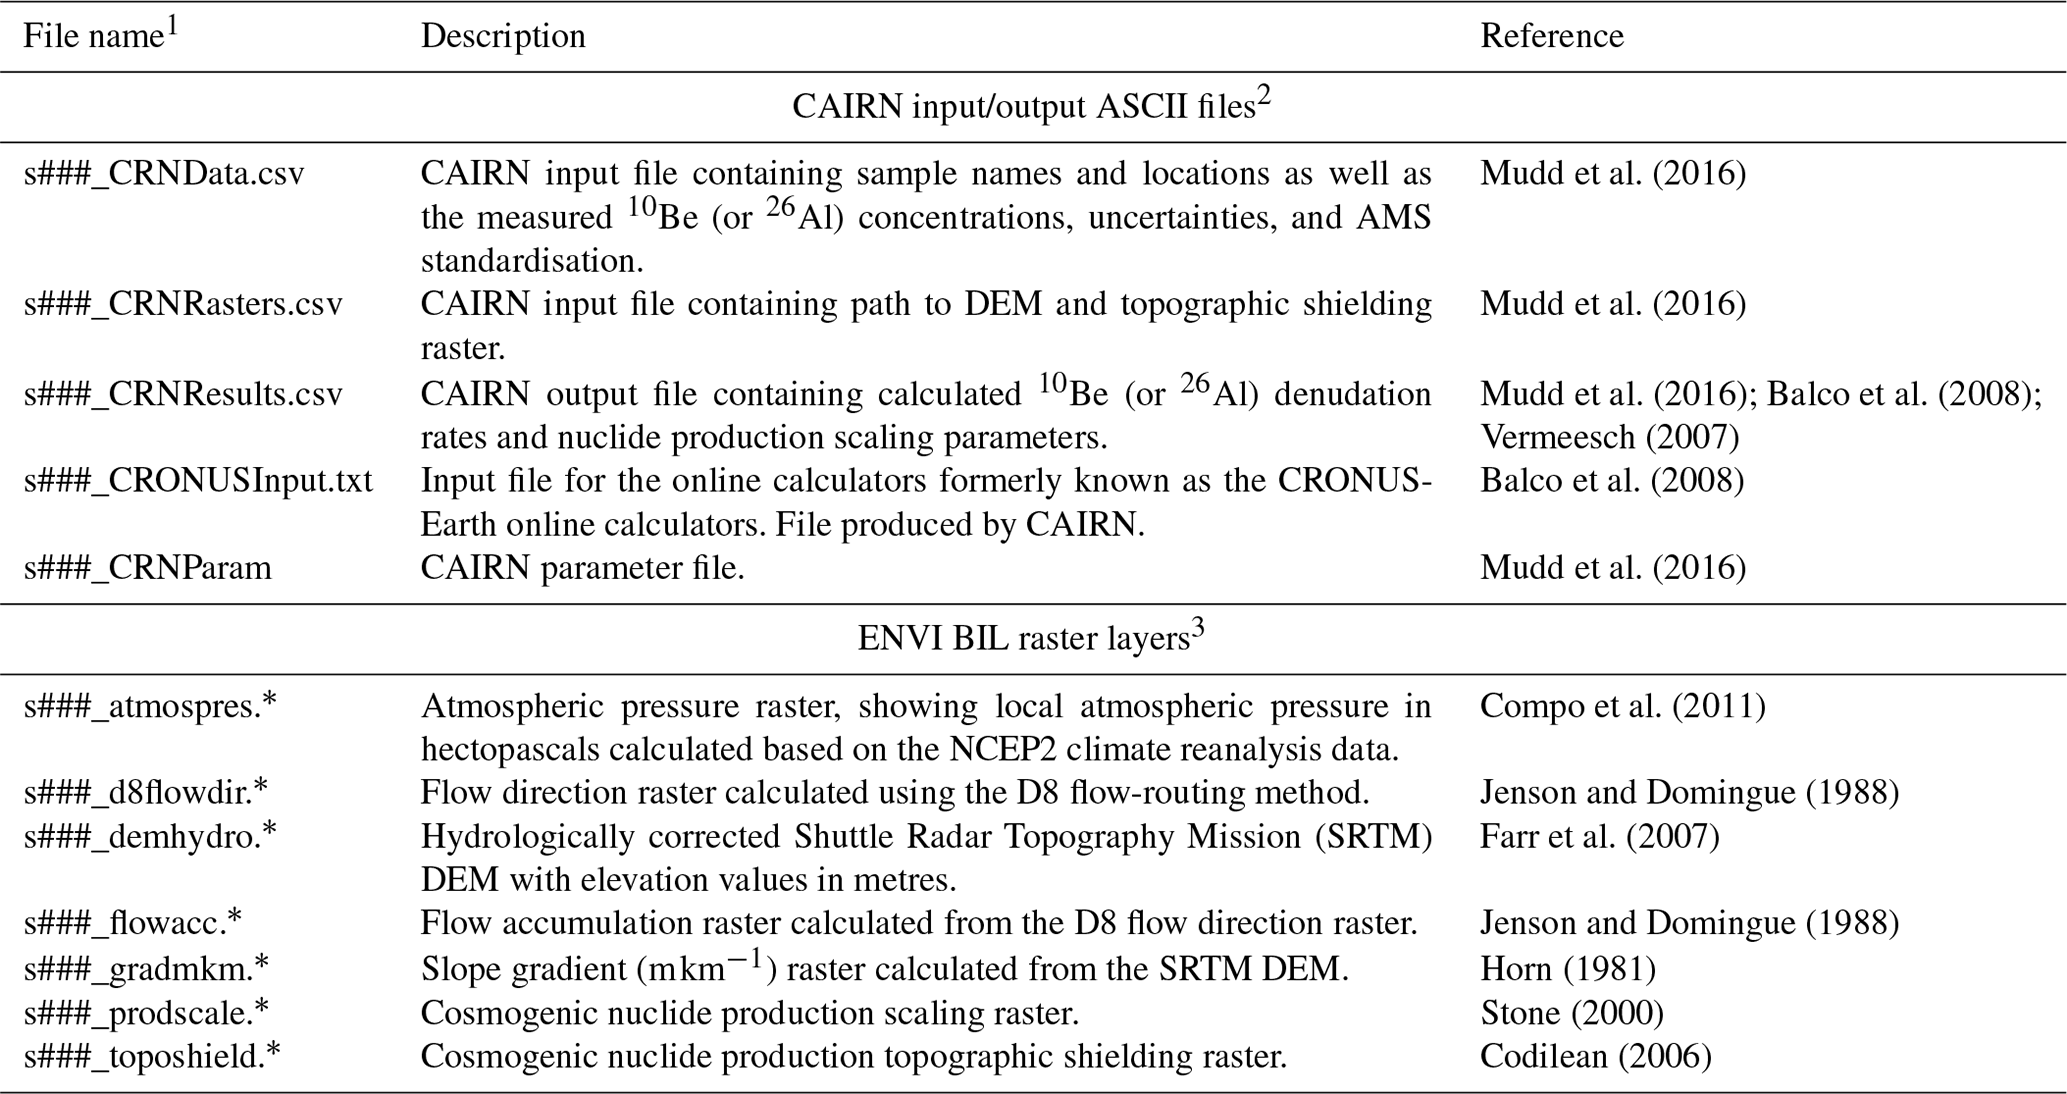
1 s###, where ### is a three digit number, refers to the identifier of the publication from which the cosmogenic radionuclide data are compiled (identical to STUDYID in data table). 2 In cases where both 10Be and 26Al data are available, two sets of input and output files will exist. Multiple sets of input/output files will also exist when a larger study has been broken up into smaller chunks. 3 Raster layers have a resolution of 90 m except for studies with very large basins; in the latter case, the resolution will be either 250 or 500 m. For most Australian studies, data layers have a resolution of 30 m. Slope gradient rasters have a resolution of 90 m in all cases and were calculated from a 90 m resolution SRTM DEM, even if other layers in the same study have resolutions of 30, 250, or 500 m respectively. Raster layers are projected to the WGS84 Universal Transverse Mercator (UTM) coordinate system, with UTM zones varying based on the location and extent of each study.
5.2 Sahul Sedimentary Archives (SahulSed)
SahulSed replaces the “OSL/TL Australia” data collection (DOI: https://doi.org/10.4225/48/5a836db1ac9b6, Codilean et al., 2017) that was part of OCTOPUS v.1 (Codilean et al., 2018). The latter consisted of OSL and TL measurements in fluvial sediment samples from stratigraphic sections and sediment cores from across the Australian mainland and Tasmania, and it included data published in the peer-reviewed literature up to 2017 as well as previously unpublished data compiled from technical reports and various Honours, MSc, and PhD theses. The OSL/TL Australia collection also included four raster layers, namely a hydrologically corrected DEM, flow direction and flow accumulation rasters, and a slope gradient raster, that were organised in .zip archives (Codilean et al., 2018). Given the size of the various raster layers and the lack of demand for them from the user community (demonstrated by the lack of download requests), the raster layers have been dropped from SahulSed. The new data collection brings the fluvial data up to date in a new sub-collection – “SahulSed FLV” – that incorporates OSL and TL ages published since 2017. Further, SahulSed has been expanded to also include OSL and TL ages from aeolian (“SahulSed AEN”) and lacustrine (“SahulSed LAC”) sedimentary records respectively. The aeolian sub-collection builds off a pre-existing database of luminescence ages of Australian desert dune fields (Hesse, 2016; Lancaster et al., 2016). SahulSed consists of a total of 3426 observations (see Table 1): ∼71 % are OSL (n=2458), and the remainder are TL ages (n=968).
In terms of the geographical distribution of samples, data for Western Australia are generally lacking except for a few data points in the north-western (SahulSed FLV and SahulSed AEN) and south-western (SahulSed LAC) parts of the state (Fig. 5a, b, c). No lacustrine samples are present in Tasmania, and the number of fluvial samples is also negligible compared with the rest of the FLV sub-collections (Fig. 5a, b, c). However, Tasmanian aeolian samples account for ∼10 % of the SahulSed AEN population. About 10 % of aeolian OSL and as little as ∼5 % of aeolian TL samples stem from the eastern seaboard (i.e. areas draining to the east of the Great Dividing Range). The picture is similar for lacustrine OSL and TL, with only ∼10 % of OSL samples and no TL samples originating from east of the Great Dividing Range. In contrast, however, ∼55 % of fluvial OSL and ∼20 % of fluvial TL samples have been derived from the eastern seaboard. The above geographical distribution reflects, to a large extent, the natural distribution of sedimentary facies across Australia as well as the areas in which research interests were/are focused – for example, the focused interest on river systems proximal to high-population-density areas where floods are a potential threat, such as the eastern seaboard, or where rivers are of great agricultural importance, such as the Murray–Darling Basin. To this end, the aeolian sub-collections mainly cover the grassland and desert zones (Fig. 5b), namely the southern parts of the Northern Territory (mainly in the drainage system of the Diamantina and Georgina rivers) and South Australia (the Diamantina–Georgina, Cooper Creek–Bulloo, Kati Thanda–Lake Eyre, and lower Murray–Darling fluvial systems). Samples of the FLV sub-collections, however, show good coverage of large parts of the northern and eastern Australian coast (Fig. 5a). Additionally, there is noticeable overlap of the aeolian and fluvial sample distribution in the central parts of Australia, namely, again, in the Diamantina–Georgina drainage system, the Kati Thanda–Lake Eyre basin, and the South Australia–Queensland borderlands of the Cooper Creek–Bulloo drainage system (Fig. 5a, b). Several additional fluvial data clusters exist in the upper and lower parts of the Murray–Darling Basin in New South Wales (Fig. 5a). SahulSed lacustrine data, compared with the aeolian and fluvial sub-collections, are sparse, with a clustering peak around Kati Thanda–Lake Eyre, Lake Blanche, Lake Callabonna, and Lake Frome in South Australia; the Lake Mungo and Lake George areas in New South Wales; Lake Lewis and Lake Woods in the Northern Territory; and Lake Gregory in Western Australia (Fig. 5c).
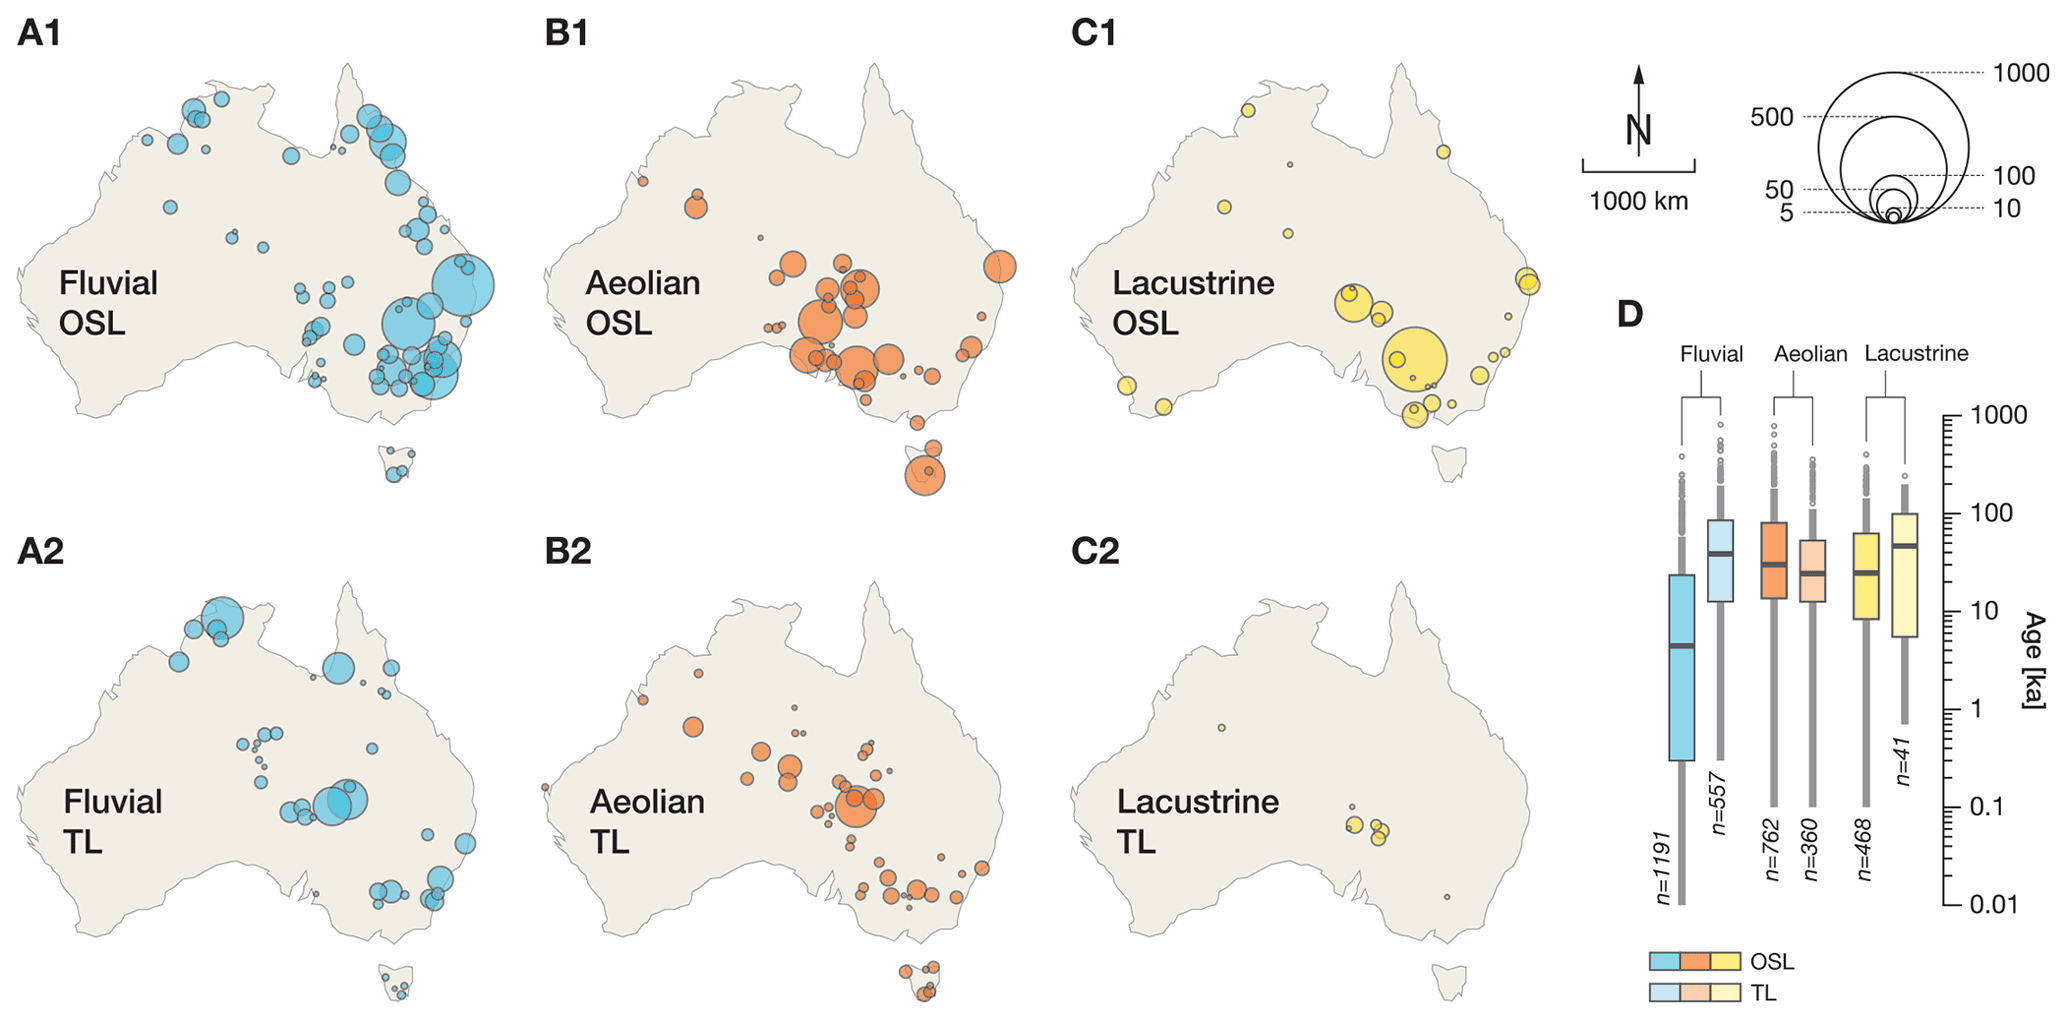
Figure 5The SahulSed data collection, showing the distribution of sample sites and ages. The size of circles corresponds to the number of observations in each 50 km radius cluster. Box plots are standard interquartile range (IQR) plots with outliers defined as data points . Box plots only include observations with non-zero ages. Box plot colours are as follows: blue – fluvial, red – aeolian, and yellow – lacustrine.
Aeolian and lacustrine sample OSL and TL age distributions (Fig. 5d), compared between the OSL and TL sub-collections, are similar (with overlapping IQRs). While the age distribution of the fluvial TL sub-collection cannot be distinguished from the aeolian and lacustrine data, fluvial OSL ages are distributed across a wider range and IQR, with a median value that is approximately 1 order of magnitude lower than its TL counterpart. SahulSed OSL ages spread across 5 orders of magnitude, ranging from tens of years back to the middle Pleistocene (0.001 to 716 ka for the FLV OSL and AEN OSL sub-collections respectively). Extreme TL age values are comparable (0.007 to 740 ka for the FLV TL and AEN TL sub-collections respectively).
5.3 Sahul Archaeology (SahulArch)
The SahulArch collection is composed of three sub-collections, namely “SahulArch Radiocarbon”, “SahulArch OSL”, and “SahulArch TL” (Fig. 6). The sub-collections comprise radiocarbon, OSL, and TL ages for archaeological records from Sahul published both in the peer-reviewed and grey literature up to the year 2021. SahulArch is ∼50 % complete (Table 1); to date, data entry has focused on (i) Australia-wide coverage of all ages older than 30 000 years, (ii) ages published since 2014 regardless of age, and (iii) the geographical areas of northern and south-eastern Australia. Data collection and entry will be progressively expanded to cover the whole of Sahul, building off the pre-2014 dataset presented in AustArch (Williams et al., 2014). To protect the location of culturally sensitive archaeological sites, sample coordinates have been randomly obfuscated within a 25 km radius using the NRand point obfuscation algorithm (Wightman et al., 2011; Zurbarán et al., 2018). To this end, the SahulArch samples are stored as polygon rather than point features, with the non-obfuscated sample coordinates stored in the PostgreSQL relational database but hidden from users.
The three SahulArch sub-collections include a total of 5513 observations (Table 1, Fig. 6), comprising 5039 radiocarbon, 347 OSL, and 127 TL ages from 1120 archaeological sites (metasites in OCTOPUS v.2 parlance). In the radiocarbon sub-collection, 50 % of metasites have between one and four observations (median of two). Only a handful of metasites have more than 10 radiocarbon dates, and only 2 metasites have more than 100 radiocarbon dates (Fig. 6b). The few metasites with OSL and TL ages generally have more observations on average, with the IQR and median being ∼50–20 observations and ∼7 observations respectively. In terms of geographical extent, the SahulArch collection is unique in that it encompasses the entire continent of Sahul, comprising Australia, Tasmania, New Guinea, and islands connected to mainland Australia and New Guinea at times of lower sea levels (Fig. 6a). Given that Australia was joined to New Guinea for most of the human history of the continent, the addition of New Guinea will articulate archaeological knowledge of New Guinea into analyses and interpretations that have, until now, been largely based on Australian data. The current as well as future expansions of SahulArch will further facilitate modelling efforts aimed to better understand the history of human occupation of the Sahul landmass. The utility of these data collections has been illustrated recently by two studies looking at the first peopling of Sahul (Bradshaw et al., 2021; Crabtree et al., 2021) that relied on a precursor of SahulArch (Williams et al., 2014) to provide chronological data for numerical modelling of possible peopling pathways across the landmass. The SahulArch collection is currently biased towards ages published since 2014 and the geographical areas of the northern and south-eastern Australia where data entry has focused to date. The IQR of radiocarbon ages is between 1 and 10 ka whereas that of OSL and TL ages is higher, between 10 and 45 and between 10 and 60 ka respectively (Fig. 6c).

Figure 6The SahulArch data collection, showing (a) the geographic distribution of sample sites, (b) the number of ages per metasite, and (c) the distribution of ages. The size of circles corresponds to the number of observations in each 50 km radius cluster. Box plots are standard interquartile range (IQR) plots with outliers defined as data points . The frequency distribution plot in panel (b1) uses logarithmic bins for clarity. Box plots in panel (c) only include observations with non-zero ages. Box plot colours are as follows: yellow – radiocarbon, blue – OSL, and red – TL. Note that the SahulArch collection is only ∼50 % complete (see the text and Table 1).
5.4 Partner data collections
In addition to the three core data collections (above), OCTOPUS v.2 also includes two partner data collections not formally supported by the OCTOPUS project, namely FosSahul and ExpAge. The OCTOPUS versions of these collections have been fully integrated in the relational database – sharing the same semantic data model as the core data collections – and include more auxiliary data than the official versions (Codilean et al., 2021). In terms of version currency, the OCTOPUS v.2 implementation of FosSahul corresponds to FosSahul v.3 (13 April 2021), which has the following DOI: https://doi.org/10.6084/m9.figshare.8796944.v3 (Peters et al., 2019b). The OCTOPUS v.2 implementation of ExpAge corresponds to expage-202006, located at https://expage.github.io (last access: 1 July 2022).
FosSahul is a collection of publicly available late-Quaternary non-human vertebrate fauna fossil ages from Sahul. The collection includes 11 858 records. Ages are quality rated based on the dating protocols that were used and the association between the dated materials and the fossil remains. FosSahul and the methodology behind the data collection and quality rating is described elsewhere (Rodríguez-Rey et al., 2016; Peters et al., 2019a, 2021), and readers are referred to these publications for further details. As with SahulArch, sample coordinates have been randomly obfuscated within a 25 km radius (Wightman et al., 2011; Zurbarán et al., 2018), and samples are stored as polygon rather than point features.
ExpAge is a global collection of publicly available cosmogenic 10Be and 26Al measurements and associated sample data in glacial samples (e.g. erratic boulders and striated bedrock) as well as respective exposure ages. The latter were recalculated using the approach described in Balco et al. (2008), and both the original and recalculated ages are provided. The OCTOPUS v.2 version of ExpAge includes 16 009 observations (2229 of which include both 10Be and 26Al data) published in the peer-reviewed literature between 1989 and 2020 from 766 primary publications. The ExpAge collection consists of 5210 metasites – each representing a distinct group of samples derived from a single location with one expected deglaciation age. The median number of observations per metasite is two, with an IQR between one and four. The maximum number of observations per metasite is 39 (n=1), and only ∼300 of the 5210 metasites include ≥10 observations. The data collection's spatial sample distribution is determined by the global occurrence of past and recent ice bodies, with key areas being the former North American ice sheets (19 % of all observations), High Asia (17 %), the former Eurasian ice sheet (14 %), Antarctica (11 %), Greenland (7 %), the Andes (7 %), New Zealand (5 %), the European Alps (5 %), Patagonia (4 %), Inner Asia (2 %), and the Iberian Peninsula (2 %). Small data clusters (each of them accounting for less than 1 % of the total sample population) exist where comparably small ice bodies left glacial landforms, such as on the Australian mainland, in Tasmania, Morocco, or Japan. The most isolated sets of samples have been derived from the flanks of Costa Rica's Cerro Chirripó (n=9) and the Rwenzori in Uganda (n=8). More information about the ExpAge data collection, including the methodology used to recalculate exposure ages, is available from https://expage.github.io (last access: 1 July 2022).
As with the previous version of OCTOPUS (Codilean et al., 2018), data can be accessed either via the bespoke web interface (Fig. 7; https://octopusdata.org, last access: 1 July 2022) or directly via the WFS capability running on GeoServer. OCTOPUS v.2 features a completely redesigned web interface with functionality added to filter the data using SQL queries and to export spatial data directly to various geospatial vector data formats. Other notable additions include (1) the ability to change the base map (four different base maps are available: three from MapTiler – https://www.maptiler.com, last access: 1 July 2022; and one from OpenStreetMap – https://www.openstreetmap.org, last access: 1 July 2022) and (2) the clustering of sample locations with the ability to change the cluster radius and toggle clusters on and off. The web interface consists of a map view and a collapsible side pane (Fig. 7a) that contains five separate panels: (i) the “Layers” panel that displays a list of the available data layers and allows for these to be toggled on and off, (ii) the “Filter” panel that allows users to query the data and limit what is displayed on the map to only results returned by the applied filters, (iii) the “Export Data” panel that allows users to download geospatial vector data layers, (iv) the “Download Collection” panel that allows users to download raster data and CAIRN input/output files associated with the CRN Denudation collection, and (v) the “Settings” panel where users can change the choice of base map and modify clustering settings. When designing the updated web interface, our aim was to offer users more functionality while concurrently avoiding the replication of tools that are readily available within desktop GIS applications.
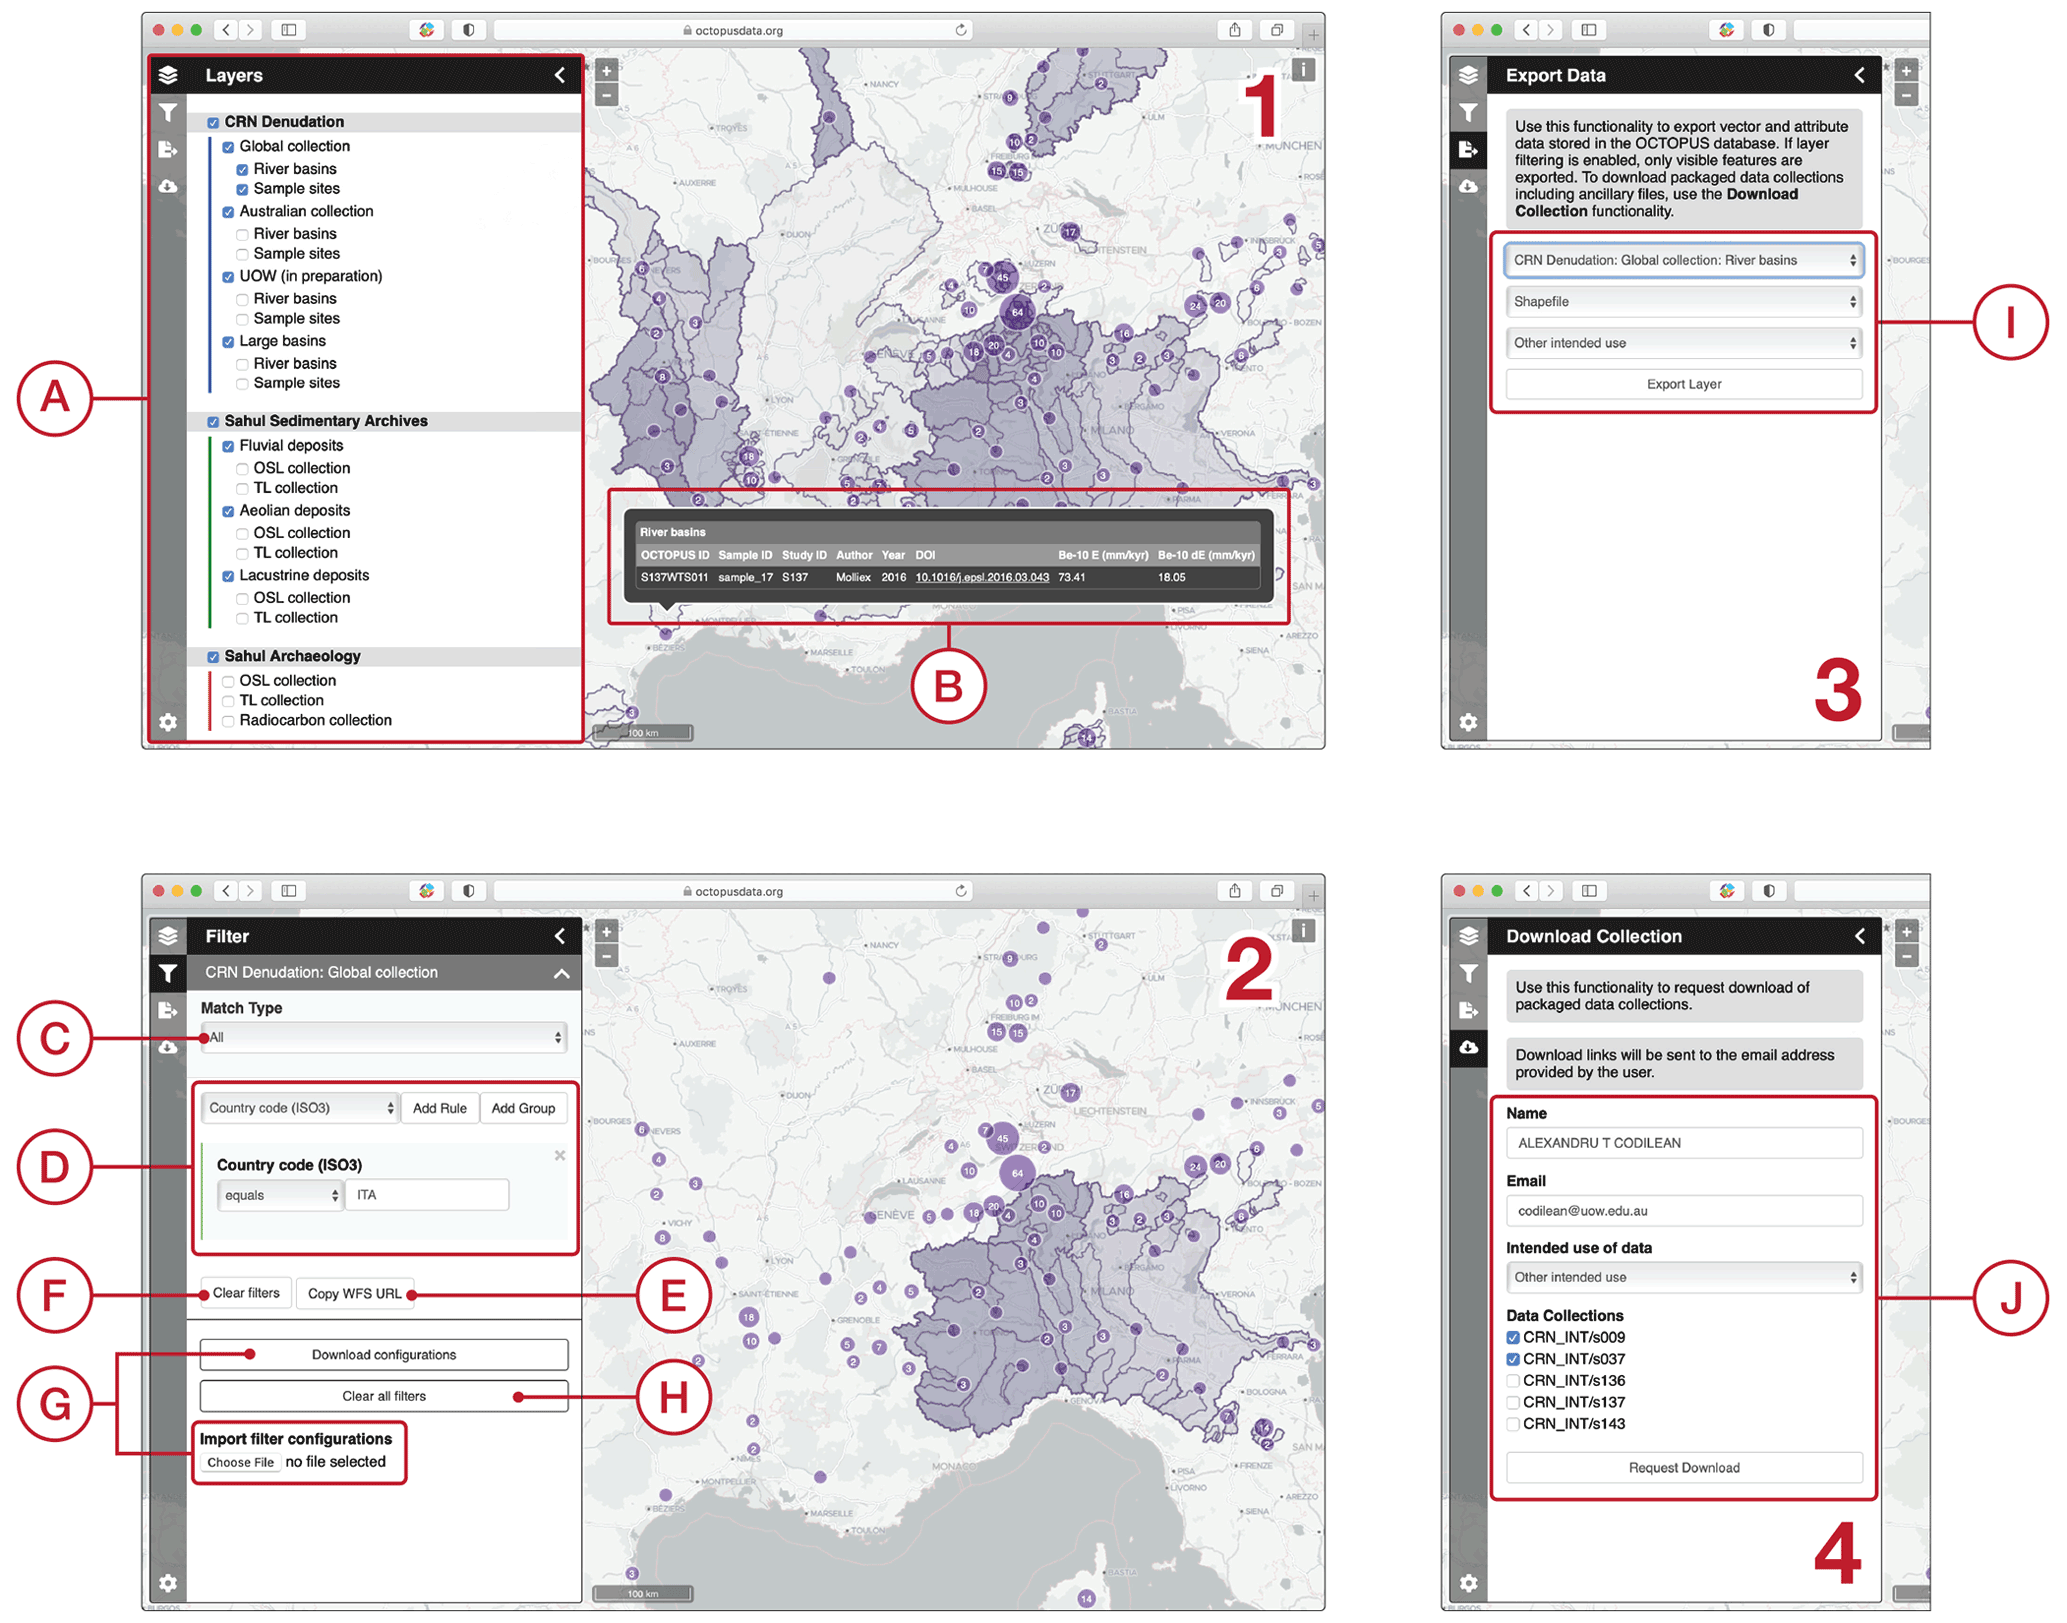
Figure 7Annotated screenshots of the OCTOPUS v.2 web interface illustrating a typical use case. See the text for more details.
6.1 Accessing data using the web interface
The sequence of screenshots in Fig. 7 illustrates a typical intended user interaction with the OCTOPUS v.2 web interface (further examples are available in Rehn, 2022). First, the user displays the data collection(s) of interest and navigates to the desired geographical region (Fig. 7, panel 1). Sample locations are displayed as clusters with the size of the circle being scaled by the number of features within the cluster (the same information is also conveyed by the number written inside each circle). In the case of the CRN Denudation collections, basin outlines are displayed as translucent polygons. Clicking on a feature will display a dialogue panel with key information about that feature, including sample identifiers, bibliographic details, information about the dating methods, and associated age/denudation rate (Fig. 7b). Where a DOI is available, it is listed as a hyperlink and will connect to the publication from which the data were sourced. The pop-up dialogue panel displays only a subset of the available attribute data and is meant to provide the user with basic information about each point or polygon record. The dialogue panel closes automatically once the user clicks anywhere outside of the panel in the map display window.
To download data from OCTOPUS, the user may next access the Export Data panel (Fig. 7, panel 3) and download one or more entire data collections, or they can first access the Filter panel and prepare a subset of the data for download (Fig. 7, panel 2). Filtering is automatically enabled for those data layers that are displayed on the map. SQL filters are entered as “rule” blocks (Fig. 7d), and multiple blocks may be combined in groups. The latter allows for a virtually unlimited number of rules to be applied to a given layer as part of a virtually unlimited number of group configurations. For each set of rules and/or groups, the user may also specify whether the “AND” or the “OR” SQL operators are to be used (Fig. 7c). The Filter panel provides the option for filters to be cleared both locally (affecting one data layer) or globally (i.e. clearing all filters) (Fig. 7f, h). Finally, users also have the option to copy the filter configuration as a WFS URL command that can be pasted into a browser window (Fig. 7e) or to save the filter configuration to disc for reloading in a different session or on a different machine (Fig. 7g).
To download vector geospatial data files, the user is asked to select, using a series of drop-down lists, the data collection of interest, the exported data format, and the intended use of the data (Fig. 7i). The latter information will be used for OCTOPUS reporting purposes (to funding organisations) and when applying for future OCTOPUS support funding. In terms of data formats, the following are available: Geography Markup Language (GML) versions 2 and 3, ESRI Shapefile, JavaScript Object Notation (JSON), and Google Earth KML and KMZ. When the KML and KMZ formats are selected, the exported data will be truncated to the displayed extent of the data. For the other data formats, the entire data layer is exported, unless filtering is enabled, in which case only those data entries that are returned by the filter are exported.
Those users who are interested in downloading the raster data and the CAIRN input and output files associated with the CRN Denudation data collections may do so using the Download Collection panel. The procedure for downloading the raster/CAIRN files is the same as in the previous version of OCTOPUS (Codilean et al., 2018). When the Download Collection panel is active the cursor turns into a selection tool and the user drags a box around desired points and polygons to select. The user has the option to fine-tune the list of selected studies by toggling each study from the generated list on or off after the selection box is drawn. It is possible to select multiple studies from multiple collections at the same time (Fig. 7j). The user is also asked to enter a name, an email address, and an intended use of the data. A valid email address is required, as links to the data are sent to the user via email immediately after the download button is pressed. There is no verification of who the data requestor is or where that person is from; however, none of the fields can be left empty, and all entered information is stored in a log file. As stated above, the requested information is used for reporting purposes (see, for example, Fig. 1); thus, by providing meaningful information when downloading the data, users will support efforts to secure future funding for updating and expanding OCTOPUS.
6.2 Accessing data using the Web Feature Service (WFS) capability
A description of how to access data via WFS from OCTOPUS, including specific examples, is provided elsewhere by Codilean et al. (2018). Further, most of the core WFS functions have now been incorporated into the web interface as part of the Filter and Export Data panels. For the above reasons, we only provide some basic information on connecting to OCTOPUS v.2 from a third-party application (e.g. QGIS or R). For a more comprehensive introduction to WFS and GeoServer, the reader is referred to Iacovella and Youngblood (2013) or to the GeoServer documentation web page, accessible at http://docs.geoserver.org (last access: 1 July 2022).
With the migration of OCTOPUS to the GCP, the platform is no longer hosted at the University of Wollongong and there is a new URL for accessing the data via WFS: http://geoserver.octopusdata.org/geoserver/wfs (last access: 1 July 2022).
Probably the simplest way to access data from OCTOPUS via WFS is by using the WFS/OGC API in QGIS (https://qgis.org, last access: 1 July 2022): the only information required is the above-mentioned URL. Those preferring the R software environment (https://www.R-project.org, last access: 1 July 2022) may use the ows4R package (Lovelace et al., 2020; Blondel, 2021) to connect to OCTOPUS via WFS. The following R code snippet will establish a connection to the OCTOPUS database and fetch the list of available data layers:
library(ows4R)
OCTOPUSdata <-
  "http://geoserver.octopusdata.org
           /geoserver/wfs"
OCTOPUSdata_client <-
  WFSClient$new(
      OCTOPUSdata,
      serviceVersion = "2.0.0"
      )
OCTOPUSdata_client$
  getFeatureTypes(pretty = TRUE).
Next, the following code snippet may be used to send a WFS request to GeoServer and download some data. In the example below, the request will download all drainage basins belonging to the CRN Denudation Australia sub-collection:
library(sf)
library(httr)
url <- parse_url(OCTOPUSdata)
url$query <- list(
    service  = "wfs",
    version  = "2.0.0",
    request  = "GetFeature",
    typename = "be10-denude:crn_aus_basins",
    srsName  = "EPSG:900913"
    )
request <- build_url(url)
CRN_AUS_basins <- read_sf(request).
In the above example, “typename” tells GeoServer the name of the data layer to be served and “srsName” specifies the output coordinate system (in this case WGS 84/Pseudo-Mercator). Additional instructions may be specified, such as the desired file format (e.g. outputformat=SHAPE-ZIP for ESRI Shapefile) or, if only a subset of the data is required, by using the CQL/ECQL query language (see the GeoServer documentation).
As with the previous version of OCTOPUS, our aim was to compile and incorporate all data – both published and unpublished – that are publicly available. It is not our role to decide on the quality of the data that have already been published; thus, we make no editorial decisions on what data to include or exclude. Further, we designed the database in a way that it captures sufficient auxiliary information for individual users to be able to make informed judgements regarding data quality. However, in some instances, where a publication did not provide sufficient information for the data files to be produced (e.g. insufficient information to be able to confidently locate and delineate drainage basins) and this information could not be obtained from elsewhere, those data were not included in OCTOPUS. Further, despite our best efforts and given the sheer volume of data present, some of the sub-collections that make up OCTOPUS v.2 are only partially complete (see Table 1) with the excluded data in the queue for the next version of the database.
When recalculating CRN-based denudation rates, for simplicity and consistency across the global compilation, we do not correct for lithological differences in quartz abundance, glacier cover, and snow shielding. Performing such corrections in a consistent manner on a global scale is impossible. However, as shown in Fig. 8a, as with the basins included in the previous version of the OCTOPUS database (blue circles), the new basins added as part of version 2 (red circles) show a good agreement between the published and recalculated rate values, with the IQR of the difference being between 2 % and 20 % (median of 8 %), within the uncertainty on the calculated denudation rates. Further, as we provide all CAIRN input and configuration files, the above corrections can be readily applied to individual studies by end users if the discrepancy between the published and recalculated denudation rates deems this necessary. For consistency with the previous version of the database, the 10Be and 26Al denudation rates included in the CRN Denudation collections were corrected for topographic shielding. A recent study by DiBiase (2018) suggested that topographic shielding corrections are inappropriate for calculating basin-wide denudation rates (in most settings) and are only required for steep catchments with a non-uniform distribution of quartz and/or denudation rates. Notwithstanding, topographic shielding corrections are trivial: ignoring this correction in the basins with topographic shielding greater than the 90th percentile (n≈410) results in a difference in the calculated denudation rates of between 3.5 % and 10 % (Fig. 8b, green). In comparison, the IQR of the uncertainty in the calculated denudation rates is larger, between ∼20 % and ∼25 % (Fig. 8b, black). Therefore, although ignoring topographic shielding will produce higher denudation rates, these will be within the uncertainty of the values currently calculated in OCTOPUS v.2; therefore, a recalculation of the entire CRN Denudation collection without topographic shielding correction is not warranted.
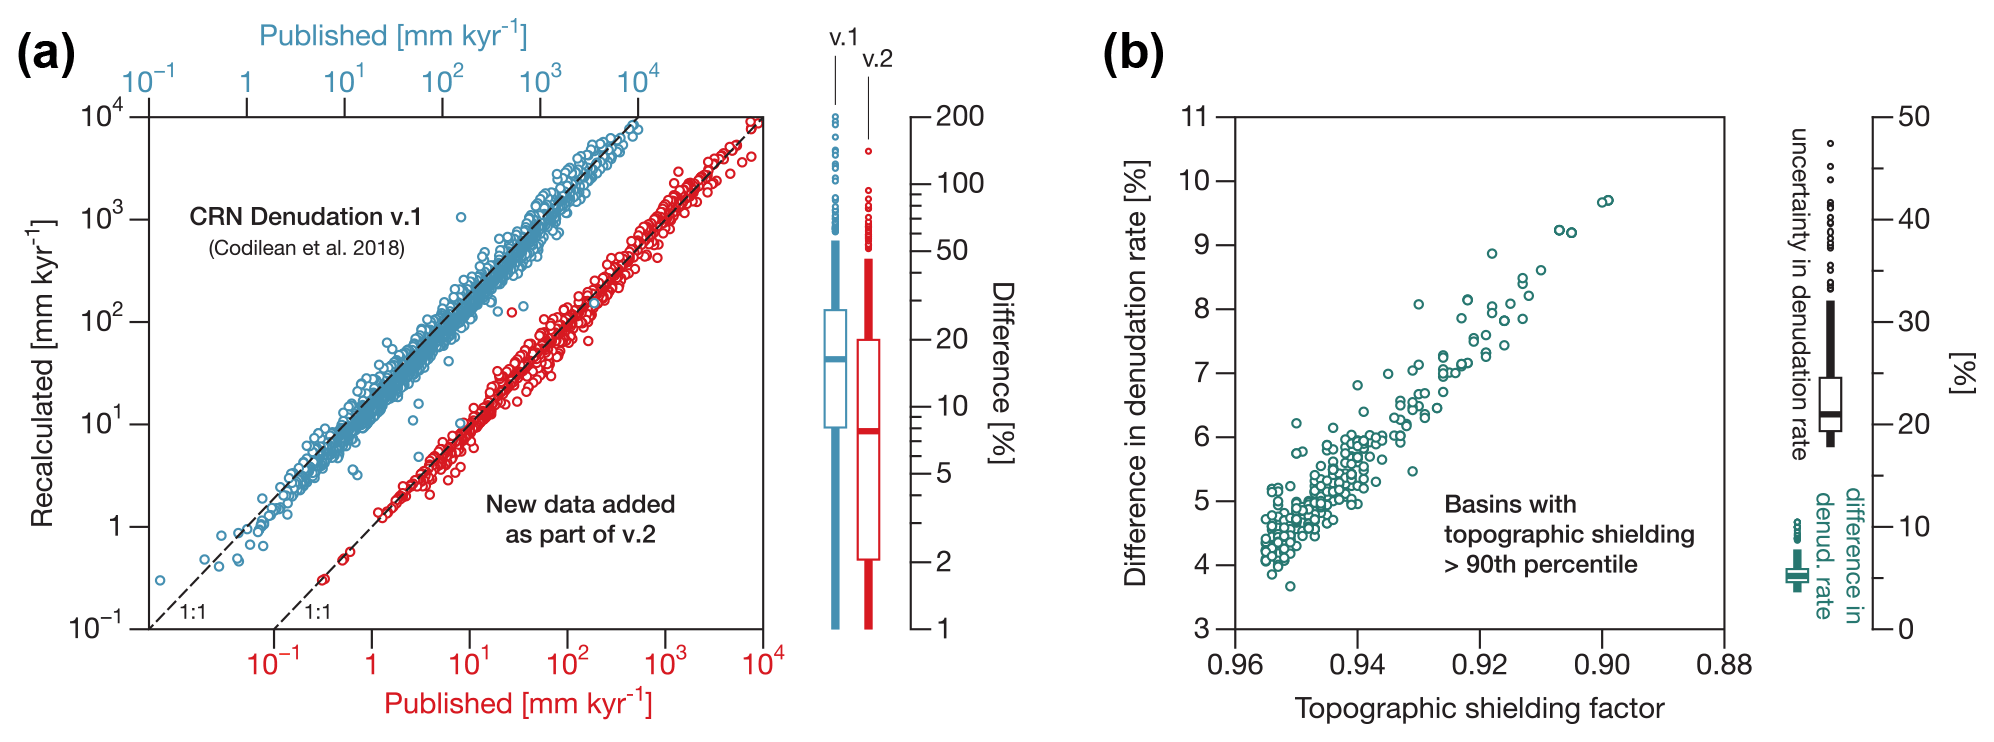
Figure 8Technical validation of the CRN Denudation data collection. (a) Published versus recalculated 10Be-based denudation rates. Blue circles represent 10Be data from the first version of the OCTOPUS database (Codilean et al., 2018), and red circles represent the 10Be data added as part of version 2. Box plots show the percent difference between published and recalculated 10Be-based denudation rates (blue – data in v.1; red – data added as part of v.2). (b) Comparison of 10Be-based denudation rates calculated with and without correcting for topographic shielding for basins from the OCTOPUS v.2 database with topographic shielding values above the 90th percentile. Box plots show the percent difference in denudation rates calculated with and without correcting for topographic shielding (in green), compared with the percent uncertainty in calculated denudation rates (in black). Note how the difference in the 10Be denudation rate obtained by ignoring topographic shielding is smaller than the uncertainty in the denudation rate calculation.
Unlike CRN-based exposure ages and denudation rates, the OSL, TL, and radiocarbon data compiled as part of SahulSed and SahulArch do not require recalculation. For this reason, the two data collections are verbatim reproductions of what was present in the various sources that the data were compiled from. We do not quality rate the published OSL, TL, or radiocarbon ages; however, to enable end users to undertake such quality rating if desired, we designed the database so that a wide range of method-related data are captured. For example, for OSL and TL ages OCTOPUS v.2 includes 76 and 74 auxiliary data fields respectively; for radiocarbon ages, the number of auxiliary data fields is 53 (Table 1). Given the lack of formal data reporting standards, however, few publications report comprehensive supporting information. In the case of the radiocarbon sub-collection, the situation is made worse by the fact that a considerable proportion of the data was published in the grey literature or was published several decades ago; therefore, supporting information is not provided in most cases. As such, about 80 % of SahulArch radiocarbon auxiliary data fields are null (Table 1). For example, of the 5,039 compiled radiocarbon ages, 3387 (67 %) do not have information about the chemical pretreatment method used, and 2778 (55 %) do not have information about the δ13C fractionation value (Fig. 9). Further, of those radiocarbon ages that were determined using AMS (n=1704), 72 % do not have information about values (Fig. 9), meaning that the former are not reproducible and need to be taken at face value.
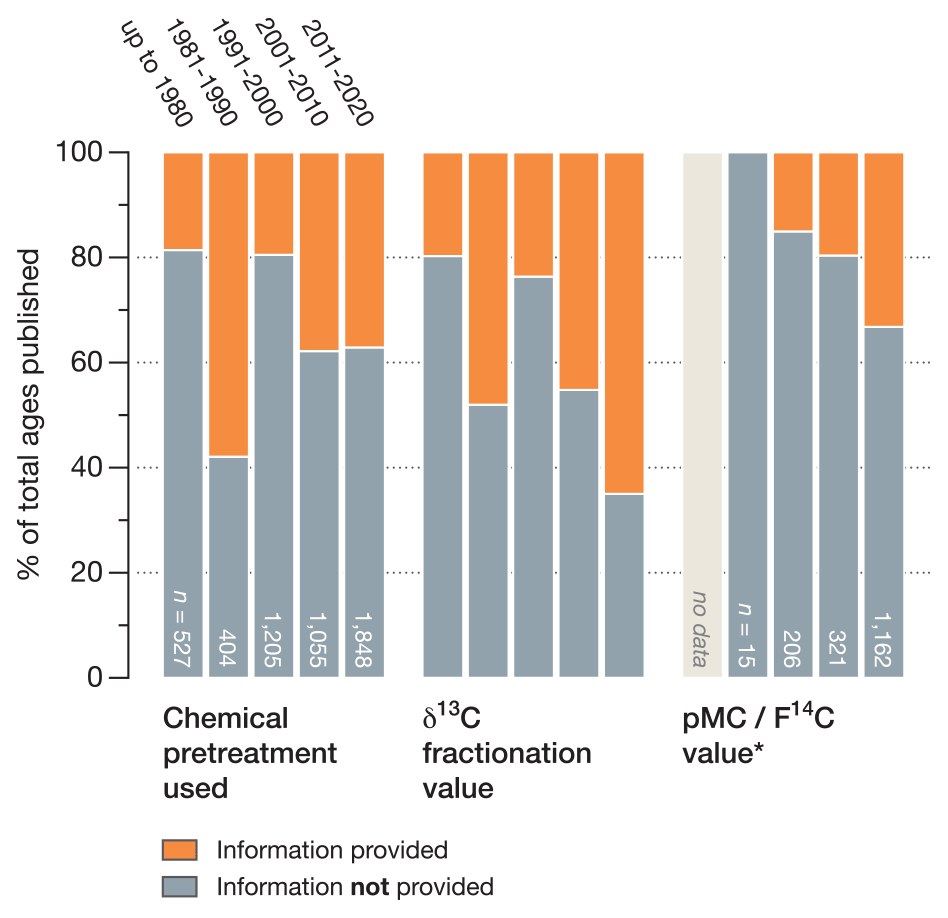
Figure 9Radiocarbon-dating-related supporting information reported in archaeology studies published between 1961 and 2020 and included in the SahulArch Radiocarbon sub-collection. The statistics for value only include AMS radiocarbon ages. Note that most studies do not report information on the chemical pretreatment method, the δ13C fractionation value, or the value.
OCTOPUS v.2 can be accessed at https://octopusdata.org (last access: 1 July 2022, Octopus Database, 2022a). If connecting through WFS via third-party applications (such as QGIS or R), users should use the following URL: http://geoserver.octopusdata.org/geoserver/wfs (last access: 1 July 2022, Octopus Database, 2022b). The DOIs assigned to each sub-collection are listed in Table 1. Users should refer to the DOIs provided to ensure that they are accessing the current and supported version of the data. Supporting information, including field descriptions, a detailed relational database model diagram, and searchable HTML documentation, is provided via Zenodo (https://doi.org/10.5281/zenodo.5808770, Codilean et al., 2021, https://doi.org/10.5281/zenodo.5874855 Munack and Codilean, 2022). The OCTOPUS database is listed in the Registry of Research Data Repositories (https://www.re3data.org; last access: 1 July 2022): https://doi.org/10.17616/R31NJN2E (re3data.org, 2018).
User contributions to OCTOPUS are welcome. Those wishing to contribute detrital CRN data should download a study and use that as the template for data structure, formats, and naming convention. As a minimum, a contribution should include point and polygon geometry files as well as an attribute table with all records listed in the database documentation (Codilean et al., 2021), except for those records that are output by CAIRN. Those wishing to contribute OSL, TL, and radiocarbon data should contact the authors for a data entry template. The data collections making up OCTOPUS v.2 have been assigned DOIs; therefore, the addition of new data needs to follow a versioning scheme, with each new version requiring new DOIs. Thus, data contributed by users will be incorporated in the next release of a given collection, rather than being added to the current one.
With the second version of the OCTOPUS database, we have extensively upgraded the software infrastructure and have updated and expanded the constituent data collections. The application part of the database was extensively rewritten and is now running on the Google Cloud Platform (https://cloud.google.com, last access: 1 July 2022). The data are stored in a relational database, and the data collections have been extended to include a global collection of CRN exposure ages on glacial landforms; an Australian collection of OSL and TL ages from aeolian and lacustrine sedimentary archives; OSL, TL, and radiocarbon ages from Sahul archaeological records; and a collection of late-Quaternary records of direct and indirect non-human vertebrate fauna fossil ages from Sahul. Since its launch in 2018, the first version of the OCTOPUS database (Codilean et al., 2018) has become an important resource to the global geomorphology community (Fig. 1), logging over 900 data requests. Although most data requests indicated that they intended to use the data for research purposes, about 20 % of requests were from undergraduate and graduate students as part of classroom teaching. We hope that with the expansion of SahulSed to include OSL and TL ages from aeolian and lacustrine sedimentary archives (in addition to the fluvial archives that were part of OCTOPUS v.1) and with the inclusion of SahulArch that OCTOPUS v.2 will become an equally important resource for the Australian Quaternary and archaeology research communities. The utility of these data collections has been illustrated recently by two high-profile studies looking at the first peopling of Sahul (Bradshaw et al., 2021; Crabtree et al., 2021) that relied on a precursor of SahulArch (Williams et al., 2014) to provide chronological constraints on numerical modelling and select the most plausible modelled scenarios. Ultimately, it is our hope that OCTOPUS will continue to ensure that data are reusable beyond the scope of the project for which they were initially collected, thereby continuing to enable large-scale synoptic studies that would otherwise not be possible.
HM designed the data model with input from ATC, WMS, TJC, ZJ, and SU. ATC and HM compiled the CRN data; WMS, ZJ, and SU compiled the OSL, TL, and radiocarbon data that is part of SahulArch, with data contributed by ANW; TJC, RBKS, and XR compiled the OSL and TL data that is part of SahulSed, with data contributed by PPH. HM adapted the ExpAge and FosSahul collections to match the OCTOPUS data model, with data compiled by JH (ExpAge) and KJP (FosSahul). ATC and HM designed the OCTOPUS v.2 platform and web interface. KCD and AP migrated OCTOPUS to the Google Cloud Platform. All authors contributed to writing the manuscript.
The contact author has declared that none of the authors has any competing interests.
Publisher's note: Copernicus Publications remains neutral with regard to jurisdictional claims in published maps and institutional affiliations.
We acknowledge financial support from the Australian Research Council Centre of Excellence for Australian Biodiversity and Heritage (CABAH). We thank Rachel Wood and Fiona Petchey for advice on radiocarbon-dating data reporting; Xiao Fu, John D. Jansen, and David Price for contributions to the SahulSed Fluvial OSL and TL sub-collections; Richard Gillespie for contributions to SahulArch; and Corey Bradshaw and Frédérik Saltré for sharing information and data regarding FosSahul. We are also grateful to Alan Young and Wenny Hidayat from Kasna for their work on migrating OCTOPUS to the Google Cloud Platform. Henry Munack thanks Jessica Blois, Jack Williams, Simon Goring, and Eric Grimm for insightful mentoring. Finally, we thank Richard G. Roberts and Julie Matarczyk for discussions and their support of the OCTOPUS project. We acknowledge the Traditional Custodians of the lands on which we have worked as well as their continued spiritual and cultural connection to country.
This research has been supported by the Australian Research Council (grant no. CE170100015).
This paper was edited by Kirsten Elger and reviewed by Alexander Prent and one anonymous referee.
Akcar, N., Ivy-Ochs, S., and Schlüchter, C.: Application of in-situ produced terrestrial cosmogenic nuclides to archaeology: A schematic review, E&G Quaternary Sci. J., 57, 226–238, https://doi.org/10.3285/eg.57.1-2.9, 2008. a
Balco, G.: Glacier Change and Paleoclimate Applications of Cosmogenic-Nuclide Exposure Dating, Annu. Rev. Earth Pl. Sc., 48, 21–48, https://doi.org/10.1146/annurev-earth-081619-052609, 2019. a
Balco, G., Stone, J. O., Lifton, N. A., and Dunai, T. J.: A complete and easily accessible means of calculating surface exposure ages or erosion rates from 10Be and 26Al measurements, Quat. Geochronol., 3, 174–195, https://doi.org/10.1016/j.quageo.2007.12.001, 2008. a, b, c, d, e
Blondel, E.: ows4R: R Interface to OGC Web-Services (0.2), Zenodo [code], https://doi.org/10.5281/zenodo.5741146, 2021. a
Bradshaw, C. J. A., Norman, K., Ulm, S., Williams, A. N., Clarkson, C., Chadœuf, J., Lin, S. C., Jacobs, Z., Roberts, R. G., Bird, M. I., Weyrich, L. S., Haberle, S. G., O'Connor, S., Llamas, B., Cohen, T. J., Friedrich, T., Veth, P., Leavesley, M., and Saltré, F.: Stochastic models support rapid peopling of Late Pleistocene Sahul, Nat. Commun., 12, 2440, https://doi.org/10.1038/s41467-021-21551-3, 2021. a, b
Braucher, R., Merchel, S., Borgomano, J., and Bourles, D. L.: Production of cosmogenic radionuclides at great depth: A multi element approach, Earth Planet. Sc. Lett., 309, 1–9, https://doi.org/10.1016/j.epsl.2011.06.036, 2011. a
Charreau, J., Blard, P., Zumaque, J., Martin, L. C., Delobel, T., and Szafran, L.: Basinga: A cell-by-cell GIS toolbox for computing basin average scaling factors, cosmogenic production rates and denudation rates, Earth Surf. Proc. Land., 44, 2349–2365, https://doi.org/10.1002/esp.4649, 2019. a
Chen, Y., Wu, B., Xiong, Z., Zan, J., Zhang, B., Zhang, R., Xue, Y., Li, M., and Li, B.: Evolution of eastern Tibetan river systems is driven by the indentation of India, Communications Earth & Environment, 2, 256, https://doi.org/10.1038/s43247-021-00330-4, 2021. a
Clarkson, C., Jacobs, Z., Marwick, B., Fullagar, R., Wallis, L., Smith, M., Roberts, R. G., Hayes, E., Lowe, K., Carah, X., Florin, S. A., McNeil, J., Cox, D., Arnold, L. J., Hua, Q., Huntley, J., Brand, H. E. A., Manne, T., Fairbairn, A., Shulmeister, J., Lyle, L., Salinas, M., Page, M., Connell, K., Park, G., Norman, K., Murphy, T., and Pardoe, C.: Human occupation of northern Australia by 65,000 years ago, Nature, 547, 306–310, https://doi.org/10.1038/nature22968, 2017. a
Codilean, A., Fülöp, R.-H., Munack, H., Wilcken, K., Cohen, T., Rood, D., Fink, D., Bartley, R., Croke, J., and Fifield, L.: Controls on denudation along the East Australian continental margin, Earth-Sci. Rev., 214, 103543, https://doi.org/10.1016/j.earscirev.2021.103543, 2021a. a
Codilean, A. T.: Calculation of the cosmogenic nuclide production topographic shielding scaling factor for large areas using DEMs, Earth Surf. Proc. Land., 31, 785–794, https://doi.org/10.1002/esp.1336, 2006. a, b
Codilean, A. T. and Munack, H.: OCTOPUS Database v.2: The CRN Denudation Global collection, University of Wollongong Australia [data set], https://doi.org/10.25900/g76f-0h45, 2021a. a
Codilean, A. T. and Munack, H.: OCTOPUS Database v.2: The CRN Denudation Australian collection, University of Wollongong Australia [data set], https://doi.org/10.25900/mpr9-yn15, 2021b. a
Codilean, A. T., Cohen, T. J., Munack, H., and Saktura, W. M.: OCTOPUS – OSL/TL Australia. University of Wollongong, Australia [data set], https://doi.org/10.4225/48/5a836db1ac9b6, 2017. a
Codilean, A. T., Munack, H., Cohen, T. J., Saktura, W. M., Gray, A., and Mudd, S. M.: OCTOPUS: an open cosmogenic isotope and luminescence database, Earth Syst. Sci. Data, 10, 2123–2139, https://doi.org/10.5194/essd-10-2123-2018, 2018. a, b, c, d, e, f, g, h, i, j, k, l, m
Codilean, A. T., Munack, H., and Saktura, W. M.: OCTOPUS Database v.2: Database field description tables (v.1), Zenodo [data set], https://doi.org/10.5281/zenodo.5808770, 2021. a, b, c, d, e
Cohen, T. J., Fu, X., Hesse, P., Price, D., Rui, X., Saktura, R. B. K., Munack, H., and Codilean, A. T.: OCTOPUS Database v.2: The SahulSed Aeolian TL collection, University of Wollongong Australia [data set], https://doi.org/10.25900/a2k9-kj43, 2021a. a
Cohen, T. J., Fu, X., Hesse, P., Rui, X., Saktura, R. B. K., Munack, H., and Codilean, A. T.: OCTOPUS Database v.2: The SahulSed Aeolian OSL collection, University of Wollongong Australia [data set], https://doi.org/10.25900/5jcw-tn50, 2021b. a
Cohen, T. J., Fu, X., Price, D., Rui, X., Saktura, R. B. K., Munack, H., and Codilean, A. T.: OCTOPUS Database v.2: The SahulSed Lacustrine TL collection, University of Wollongong Australia [data set], https://doi.org/10.25900/32de-mj32, 2021c. a
Cohen, T. J., Fu, X., Rui, X., Saktura, R. B. K., Munack, H., and Codilean, A. T.: OCTOPUS Database v.2: The SahulSed Lacustrine OSL collection, University of Wollongong Australia [data set], https://doi.org/10.25900/6hmv-zz61, 2021d. a
Cohen, T. J., Saktura, W. M., Jansen, J. D., Price, D., Rui, X., Saktura, R. B. K., Munack, H., and Codilean, A. T.: OCTOPUS Database v.2: The SahulSed Fluvial TL collection, University of Wollongong Australia [data set], https://doi.org/10.25900/2a76-vw55, 2021e. a
Cohen, T. J., Saktura, W. M., Jansen, J. D., Rui, X., Saktura, R. B. K., Munack, H., and Codilean, A. T.: OCTOPUS Database v.2: The SahulSed Fluvial OSL collection, University of Wollongong Australia [data set], https://doi.org/10.25900/p5ye-rn35, 2021f. a
Compo, G. P., Whitaker, J. S., Sardeshmukh, P. D., Matsui, N., Allan, R. J., Yin, X., Gleason, B. E., Vose, R. S., Rutledge, G., Bessemoulin, P., Brönnimann, S., Brunet, M., Crouthamel, R. I., Grant, A. N., Groisman, P. Y., Jones, P. D., Kruk, M. C., Kruger, A. C., Marshall, G. J., Maugeri, M., Mok, H. Y., Nordli, Ø., Ross, T. F., Trigo, R. M., Wang, X. L., Woodruff, S. D., and Worley, S. J.: The Twentieth Century Reanalysis Project, Q. J. Roy. Meteor. Soc., 137, 1–28, https://doi.org/10.1002/qj.776, 2011. a, b
Crabtree, S. A., White, D. A., Bradshaw, C. J. A., Saltré, F., Williams, A. N., Beaman, R. J., Bird, M. I., and Ulm, S.: Landscape rules predict optimal superhighways for the first peopling of Sahul, Nature Human Behaviour, 5, 1303–1313, https://doi.org/10.1038/s41562-021-01106-8, 2021. a, b, c
Delunel, R., Schlunegger, F., Valla, P. G., Dixon, J., Glotzbach, C., Hippe, K., Kober, F., Molliex, S., Norton, K. P., Salcher, B., Wittmann, H., Akçar, N., and Christl, M.: Late-Pleistocene catchment-wide denudation patterns across the European Alps, Earth-Sci. Rev., 211, 103407, https://doi.org/10.1016/j.earscirev.2020.103407, 2020. a
DiBiase, R. A.: Short communication: Increasing vertical attenuation length of cosmogenic nuclide production on steep slopes negates topographic shielding corrections for catchment erosion rates, Earth Surf. Dynam., 6, 923–931, https://doi.org/10.5194/esurf-6-923-2018, 2018. a
Dixon, J. L. and Riebe, C. S.: Tracing and Pacing Soil Across Slopes, Elements, 10, 363–368, https://doi.org/10.2113/gselements.10.5.363, 2014. a
Farr, T. G., Rosen, P. A., Caro, E., Crippen, R., Duren, R., Hensley, S., Kobrick, M., Paller, M., Rodriguez, E., Roth, L., Seal, D., Shaffer, S., Shimada, J., Umland, J., Werner, M., Oskin, M., Burbank, D., and Alsdorf, D.: The Shuttle Radar Topography Mission, Rev. Geophys., 45, RG2004, https://doi.org/10.1029/2005RG000183, 2007. a
Fülöp, R.-H., Codilean, A. T., Wilcken, K. M., Cohen, T. J., Fink, D., Smith, A. M., Yang, B., Levchenko, V. A., Wacker, L., Marx, S. K., Stromsoe, N., Fujioka, T., and Dunai, T. J.: Million-year lag times in a post-orogenic sediment conveyor, Science Advances, 6, eaaz8845, https://doi.org/10.1126/sciadv.aaz8845, 2020. a
Godard, V. and Tucker, G. E.: Influence of Climate‐Forcing Frequency on Hillslope Response, Geophys. Res. Lett., 48, e2021GL094305, https://doi.org/10.1029/2021gl094305, 2021. a
Godard, V., Dosseto, A., Fleury, J., Bellier, O., Siame, L., and ASTER Team: Transient landscape dynamics across the Southeastern Australian Escarpment, Earth Planet. Sc. Lett., 506, 397–406, https://doi.org/10.1016/j.epsl.2018.11.017, 2019. a
Granger, D. E. and Schaller, M.: Cosmogenic Nuclides and Erosion at the Watershed Scale, Elements, 10, 369–373, https://doi.org/10.2113/gselements.10.5.369, 2014. a
Granger, D. E., Lifton, N. A., and Willenbring, J. K.: A cosmic trip: 25 years of cosmogenic nuclides in geology, Geol. Soc. Am. Bull., 125, 1379–1402, https://doi.org/10.1130/B30774.1, 2013. a
Granger, D. E., Gibbon, R. J., Kuman, K., Clarke, R. J., Bruxelles, L., and Caffee, M. W.: New cosmogenic burial ages for Sterkfontein Member 2 Australopithecus and Member 5 Oldowan, Nature, 522, 85–88, https://doi.org/10.1038/nature14268, 2015. a
Guralnik, B., Ankjærgaard, C., Jain, M., Murray, A., Müller, A., Wälle, M., Lowick, S., Preusser, F., Rhodes, E., Wu, T.-S., Mathew, G., and Herman, F.: OSL-thermochronometry using bedrock quartz: A note of caution, Quat. Geochronol., 25, 37–48, https://doi.org/10.1016/j.quageo.2014.09.001, 2015. a
Hajdas, I., Ascough, P., Garnett, M. H., Fallon, S. J., Pearson, C. L., Quarta, G., Spalding, K. L., Yamaguchi, H., and Yoneda, M.: Radiocarbon dating, Nature Reviews Methods Primers, 1, 62, https://doi.org/10.1038/s43586-021-00058-7, 2021. a, b
Hesse, P. P.: How do longitudinal dunes respond to climate forcing? Insights from 25 years of luminescence dating of the Australian desert dunefields, Quatern. Int., 410, 11–29, https://doi.org/10.1016/j.quaint.2014.02.020, 2016. a
Hocknull, S. A., Lewis, R., Arnold, L. J., Pietsch, T., Joannes-Boyau, R., Price, G. J., Moss, P., Wood, R., Dosseto, A., Louys, J., Olley, J., and Lawrence, R. A.: Extinction of eastern Sahul megafauna coincides with sustained environmental deterioration, Nat. Commun., 11, 2250, https://doi.org/10.1038/s41467-020-15785-w, 2020. a
Horn, B. K. P.: Hill shading and the reflectance map, P. IEEE, 69, 14–47, 1981. a
Iacovella, S. and Youngblood, B.: GeoServer Beginner's Guide, Packt Publishing, Birmingham, ISBN 9781849516693, 2013. a
Jacobs, Z., Li, B., Shunkov, M. V., Kozlikin, M. B., Bolikhovskaya, N. S., Agadjanian, A. K., Uliyanov, V. A., Vasiliev, S. K., O’Gorman, K., Derevianko, A. P., and Roberts, R. G.: Timing of archaic hominin occupation of Denisova Cave in southern Siberia, Nature, 565, 594–599, https://doi.org/10.1038/s41586-018-0843-2, 2019. a
Jenson, S. K. and Domingue, J. O.: Extracting topographic structure from digital elevation data for geographic information system analysis, Photogramm. Eng. Rem. S., 54, 1593–1600, 1988. a, b
King, G., Herman, F., Lambert, R., Valla, P., and Guralnik, B.: Multi-OSL-thermochronometry of feldspar, Quat. Geochronol., 33, 76–87, https://doi.org/10.1016/j.quageo.2016.01.004, 2016. a
Lancaster, N., Wolfe, S., Thomas, D., Bristow, C., Bubenzer, O., Burrough, S., Duller, G., Halfen, A., Hesse, P., Roskin, J., Singhvi, A., Tsoar, H., Tripaldi, A., Yang, X., and Zárate, M.: The INQUA Dunes Atlas chronologic database, Quatern. Int., 410, 3–10, https://doi.org/10.1016/j.quaint.2015.10.044, 2016. a
Lovelace, R., Nowosad, J., and Muenchow, J.: Geocomputation with R (The R Series), Routledge, ISBN 9780367670573, 2020. a
Mudd, S. M., Harel, M.-A., Hurst, M. D., Grieve, S. W. D., and Marrero, S. M.: The CAIRN method: automated, reproducible calculation of catchment-averaged denudation rates from cosmogenic nuclide concentrations, Earth Surf. Dynam., 4, 655–674, https://doi.org/10.5194/esurf-4-655-2016, 2016. a, b, c, d, e, f, g
Munack, H. and Codilean, A. T.: OCTOPUS Database v.2: Relational database schema and documentation (v.2), Zenodo [data set], https://doi.org/10.5281/zenodo.5874855, 2022. a, b, c
Murray, A., Arnold, L. J., Buylaert, J.-P., Guérin, G., Qin, J., Singhvi, A. K., Smedley, R., and Thomsen, K. J.: Optically stimulated luminescence dating using quartz, Nature Reviews Methods Primers, 1, 72, https://doi.org/10.1038/s43586-021-00068-5, 2021. a, b
Nishiizumi, K.: Preparation of 26Al AMS standards, Nuclear Instruments and Methods in Physics Research Section B: Beam Interactions with Materials and Atoms, 223, 388–392, https://doi.org/10.1016/j.nimb.2004.04.075, 2004. a
Nishiizumi, K., Imamura, M., Caffee, M. W., Southon, J. R., Finkel, R. C., and Mcaninch, J.: Absolute calibration of 10Be AMS standards, Nuclear Instruments & Methods In Physics Research Section B: Beam Interactions With Materials And Atoms, 258, 403–413, https://doi.org/10.1016/j.nimb.2007.01.297, 2007. a
Octopus Database: https://octopusdata.org, last access: 1 July 2022a. a
Octopus Database: Geoserver, http://geoserver.octopusdata.org/geoserver/wfs, last access: 1 July 2022b. a
Peters, K. J., Saltré, F., Friedrich, T., Jacobs, Z., Wood, R., McDowell, M., Ulm, S., and Bradshaw, C. J. A.: FosSahul 2.0, an updated database for the Late Quaternary fossil records of Sahul, Scientific Data, 6, 272, https://doi.org/10.1038/s41597-019-0267-3, 2019a. a
Peters, K. J., Saltre, F, Friedrich, T., Jacobs, Z., Wood, R., McDowell, M., Ulm, S., and Bradshaw, C.: FosSahul 2.0 database and R code, figshare [data set], https://doi.org/10.6084/m9.figshare.8796944.v3, 2019b. a
Peters, K. J., Saltré, F., Friedrich, T., Jacobs, Z., Wood, R., McDowell, M., Ulm, S., and Bradshaw, C. J. A.: Addendum: FosSahul 2.0, an updated database for the Late Quaternary fossil records of Sahul, Scientific Data, 8, 133, https://doi.org/10.1038/s41597-021-00918-7, 2021. a
Phillips, F. M., Argento, D. C., Balco, G., Caffee, M. W., Clem, J., Dunai, T. J., Finkel, R., Goehring, B., Gosse, J. C., Hudson, A. M., Jull, A. T., Kelly, M. A., Kurz, M., Lal, D., Lifton, N., Marrero, S. M., Nishiizumi, K., Reedy, R. C., Schaefer, J., Stone, J. O., Swanson, T., and Zreda, M. G.: The CRONUS-Earth Project: A synthesis, Quat. Geochronol., 31, 119–154, https://doi.org/10.1016/j.quageo.2015.09.006, 2016. a
re3data.org: OCTOPUS database, re3data.org – Registry of Research Data Repositories [data set], https://doi.org/10.17616/R31NJN2E, 2018. a
Rehn, E.: OCTOPUS Web Interface User Guide (v.1), Zenodo, https://doi.org/10.5281/zenodo.6469039, 2022. a
Renfrew, C.: Before Civilization, Random House, ISBN 9781446466964, 2011. a
Rhodes, E. J.: Optically Stimulated Luminescence Dating of Sediments over the Past 200,000 Years, Annu. Rev. Earth Pl. S., 39, 461–488, https://doi.org/10.1146/annurev-earth-040610-133425, 2011. a
Roberts, R. G., Flannery, T. F., Ayliffe, L. K., Yoshida, H., Olley, J. M., Prideaux, G. J., Laslett, G. M., Baynes, A., Smith, M. A., Jones, R., and Smith, B. L.: New Ages for the Last Australian Megafauna: Continent-Wide Extinction About 46,000 Years Ago, Science, 292, 1888–1892, https://doi.org/10.1126/science.1060264, 2001. a
Roberts, R. G., Jacobs, Z., Li, B., Jankowski, N. R., Cunningham, A. C., and Rosenfeld, A. B.: Optical dating in archaeology: thirty years in retrospect and grand challenges for the future, J. Archaeol. Sci., 56, 41–60, https://doi.org/10.1016/j.jas.2015.02.028, 2015. a
Rodríguez-Rey, M., Herrando-Pérez, S., Brook, B. W., Saltré, F., Alroy, J., Beeton, N., Bird, M. I., Cooper, A., Gillespie, R., Jacobs, Z., Johnson, C. N., Miller, G. H., Prideaux, G. J., Roberts, R. G., Turney, C. S., and Bradshaw, C. J.: A comprehensive database of quality-rated fossil ages for Sahul's Quaternary vertebrates, Scientific Data, 3, 160053, https://doi.org/10.1038/sdata.2016.53, 2016. a
Saktura, W. M., Munack, H., Codilean, A. T., Jacobs, Z., Williams, A., and Ulm, S.: OCTOPUS Database v.2: The SahulArch OSL collection, University of Wollongong Australia [data set], https://doi.org/10.25900/ypr0-j711, 2021a. a
Saktura, W. M., Munack, H., Codilean, A. T., Jacobs, Z., Williams, A., and Ulm, S.: OCTOPUS Database v.2: The SahulArch TL collection, University of Wollongong Australia [data set], https://doi.org/10.25900/xq40-t003, 2021b. a
Saktura, W. M., Munack, H., Codilean, A. T., Wood, R., Petchey, F., Jacobs, Z., Williams, A., and Ulm, S.: OCTOPUS Database v.2: The SahulArch Radiocarbon collection, University of Wollongong Australia [data set], https://doi.org/10.25900/2mb4-rr36, 2021c. a
Schaefer, J. M., Codilean, A. T., Willenbring, J. K., Lu, Z.-T., Keisling, B., Fülöp, R.-H., and Val, P.: Cosmogenic nuclide techniques, Nature Reviews Methods Primers, 2, 18, https://doi.org/10.1038/s43586-022-00096-9, 2022. a, b, c
Singhvi, A. K. and Porat, N.: Impact of luminescence dating on geomorphological and palaeoclimate research in drylands, Boreas, 37, 536–558, https://doi.org/10.1111/j.1502-3885.2008.00058.x, 2008. a
Sternai, P., Sue, C., Husson, L., Serpelloni, E., Becker, T. W., Willett, S. D., Faccenna, C., Giulio, A. D., Spada, G., Jolivet, L., Valla, P., Petit, C., Nocquet, J.-M., Walpersdorf, A., and Castelltort, S.: Present-day uplift of the European Alps: Evaluating mechanisms and models of their relative contributions, Earth-Sci. Rev., 190, 589–604, https://doi.org/10.1016/j.earscirev.2019.01.005, 2019. a
Stone, J. O.: Air pressure and cosmogenic isotope production, J. Geophys. Res.-Sol. Ea., 105, 23753–23759, https://doi.org/10.1029/2000JB900181, 2000. a, b
van Dongen, R., Scherler, D., Wittmann, H., and von Blanckenburg, F.: Cosmogenic 10Be in river sediment: where grain size matters and why, Earth Surf. Dynam., 7, 393–410, https://doi.org/10.5194/esurf-7-393-2019, 2019. a
Vermeesch, P.: CosmoCalc: An Excel add-in for cosmogenic nuclide calculations, Geochem. Geophy. Geosy., 8, Q08003, https://doi.org/10.1029/2006GC001530, 2007. a, b
Wightman, P., Coronell, W., Jabba, D., Jimeno, M., and Labrador, M.: Evaluation of Location Obfuscation Techniques for Privacy in Location Based Information Systems, 2011 IEEE Third Latin-American Conference on Communications, Belem, Brazil, 24–26 October 2011, 1–6, https://doi.org/10.1109/latincom.2011.6107399, 2011. a, b
Williams, A., Ulm, S., Smith, M., and Reid, J.: AustArch: A Database of 14C and Non-14C Ages from Archaeological Sites in Australia – Composition, Compilation and Review (Data Paper), Internet Archaeology, https://doi.org/10.11141/ia.36.6, 2014. a, b, c
Wilson, C., Fallon, S., and Trevorrow, T.: New radiocarbon ages for the Lower Murray River, South Australia, Archaeol. Ocean., 47, 157–160, https://doi.org/10.1002/j.1834-4453.2012.tb00128.x, 2012. a
Zilhão, J., Angelucci, D. E., Igreja, M. A., Arnold, L. J., Badal, E., Callapez, P., Cardoso, J. L., d'Errico, F., Daura, J., Demuro, M., Deschamps, M., Dupont, C., Gabriel, S., Hoffmann, D. L., Legoinha, P., Matias, H., Soares, A. M. M., Nabais, M., Portela, P., Queffelec, A., Rodrigues, F., and Souto, P.: Last Interglacial Iberian Neandertals as fisher-hunter-gatherers, Science, 367, eaaz7943, https://doi.org/10.1126/science.aaz7943, 2020. a
Zurbarán, M., Wightman, P., Brovelli, M., Oxoli, D., Iliffe, M., Jimeno, M., and Salazar, A.: NRand-K: Minimizing the impact of location obfuscation in spatial analysis, T. GIS, 22, 1257–1274, https://doi.org/10.1111/tgis.12462, 2018. a, b
- Abstract
- Introduction
- System architecture
- Semantic data model
- CRN data recalculation
- The OCTOPUS v.2 data collections
- Accessing data from OCTOPUS v.2
- Technical validation
- Data availability
- Conclusions
- Author contributions
- Competing interests
- Disclaimer
- Acknowledgements
- Financial support
- Review statement
- References