the Creative Commons Attribution 4.0 License.
the Creative Commons Attribution 4.0 License.
 | 28 Jun 2022
Multispecies and high-spatiotemporal-resolution database of vehicular emissions in Brazil
Leonardo Hoinaski
Thiago Vieira Vasques
Camilo Bastos Ribeiro
Bianca Meotti
In this article, we present the BRAzilian Vehicular Emissions inventory Software (BRAVES) database, a multispecies and high-spatiotemporal-resolution database of vehicular emissions in Brazil. We provide this database using spatial disaggregation based on road density, temporal disaggregation using vehicular flow profiles, and chemical speciation based on local studies and the SPECIATE 5.1 database from the United States Environmental Protection Agency (US EPA). Our BRAVES database provides hourly and annual emissions of 41 gaseous and particle pollutants, where users can define the spatial resolution, which ranges from a coarse to a very refined scale. Spatial correlation analysis reveals that the BRAVES database reaches better performance than the vehicular emissions inventory from the Emissions Database for Global Atmospheric Research (EDGAR). A comparison with the Modern-Era Retrospective analysis for Research and Applications, Version 2 (MERRA-2) surface concentration confirms the consistency and reliability of the BRAVES database in representing the spatial pattern of vehicular emissions. Compared to EDGAR, the BRAVES database brings more spatial, temporal, and chemical details. These additional features are crucial to understanding important atmospheric chemistry processes in Brazil. All codes and inputs are freely available, and the outputs are compatible with the input requirements of sophisticated chemical transport models. We envision that our database will enable the scientific and environmental community to gain new insights into vehicular emissions and their effects in Brazil, where emissions inventories are scarce and urgently needed. The BRAVES database is freely available at https://doi.org/10.5281/zenodo.6588692 (Hoinaski et al., 2022).
- Article
(9879 KB) - Full-text XML
-
Supplement
(4887 KB) - BibTeX
- EndNote


Vehicular emissions threaten urban air quality (Brito et al., 2018; Sawyer, 2010) and cause several environmental damages from local to global scales. These emissions deleteriously affect human health (Anenberg et al., 2017; Krzyzanowski et al., 2005) and contribute to the increase in the concentration of greenhouse gases in the atmosphere (Shindell et al., 2011; Unger et al., 2010).
It is challenging to control vehicular emissions in developing countries where city growth is disorganized and vehicle population increases dramatically (Lyu et al., 2020; Sun et al., 2020). Furthermore, vehicular emissions inventories, an essential tool to control air pollution, are scarce and limited to wealthy cities (Huneeus et al., 2020) and developed countries. When available, an emissions inventory often does not provide the required data to design air quality management systems.
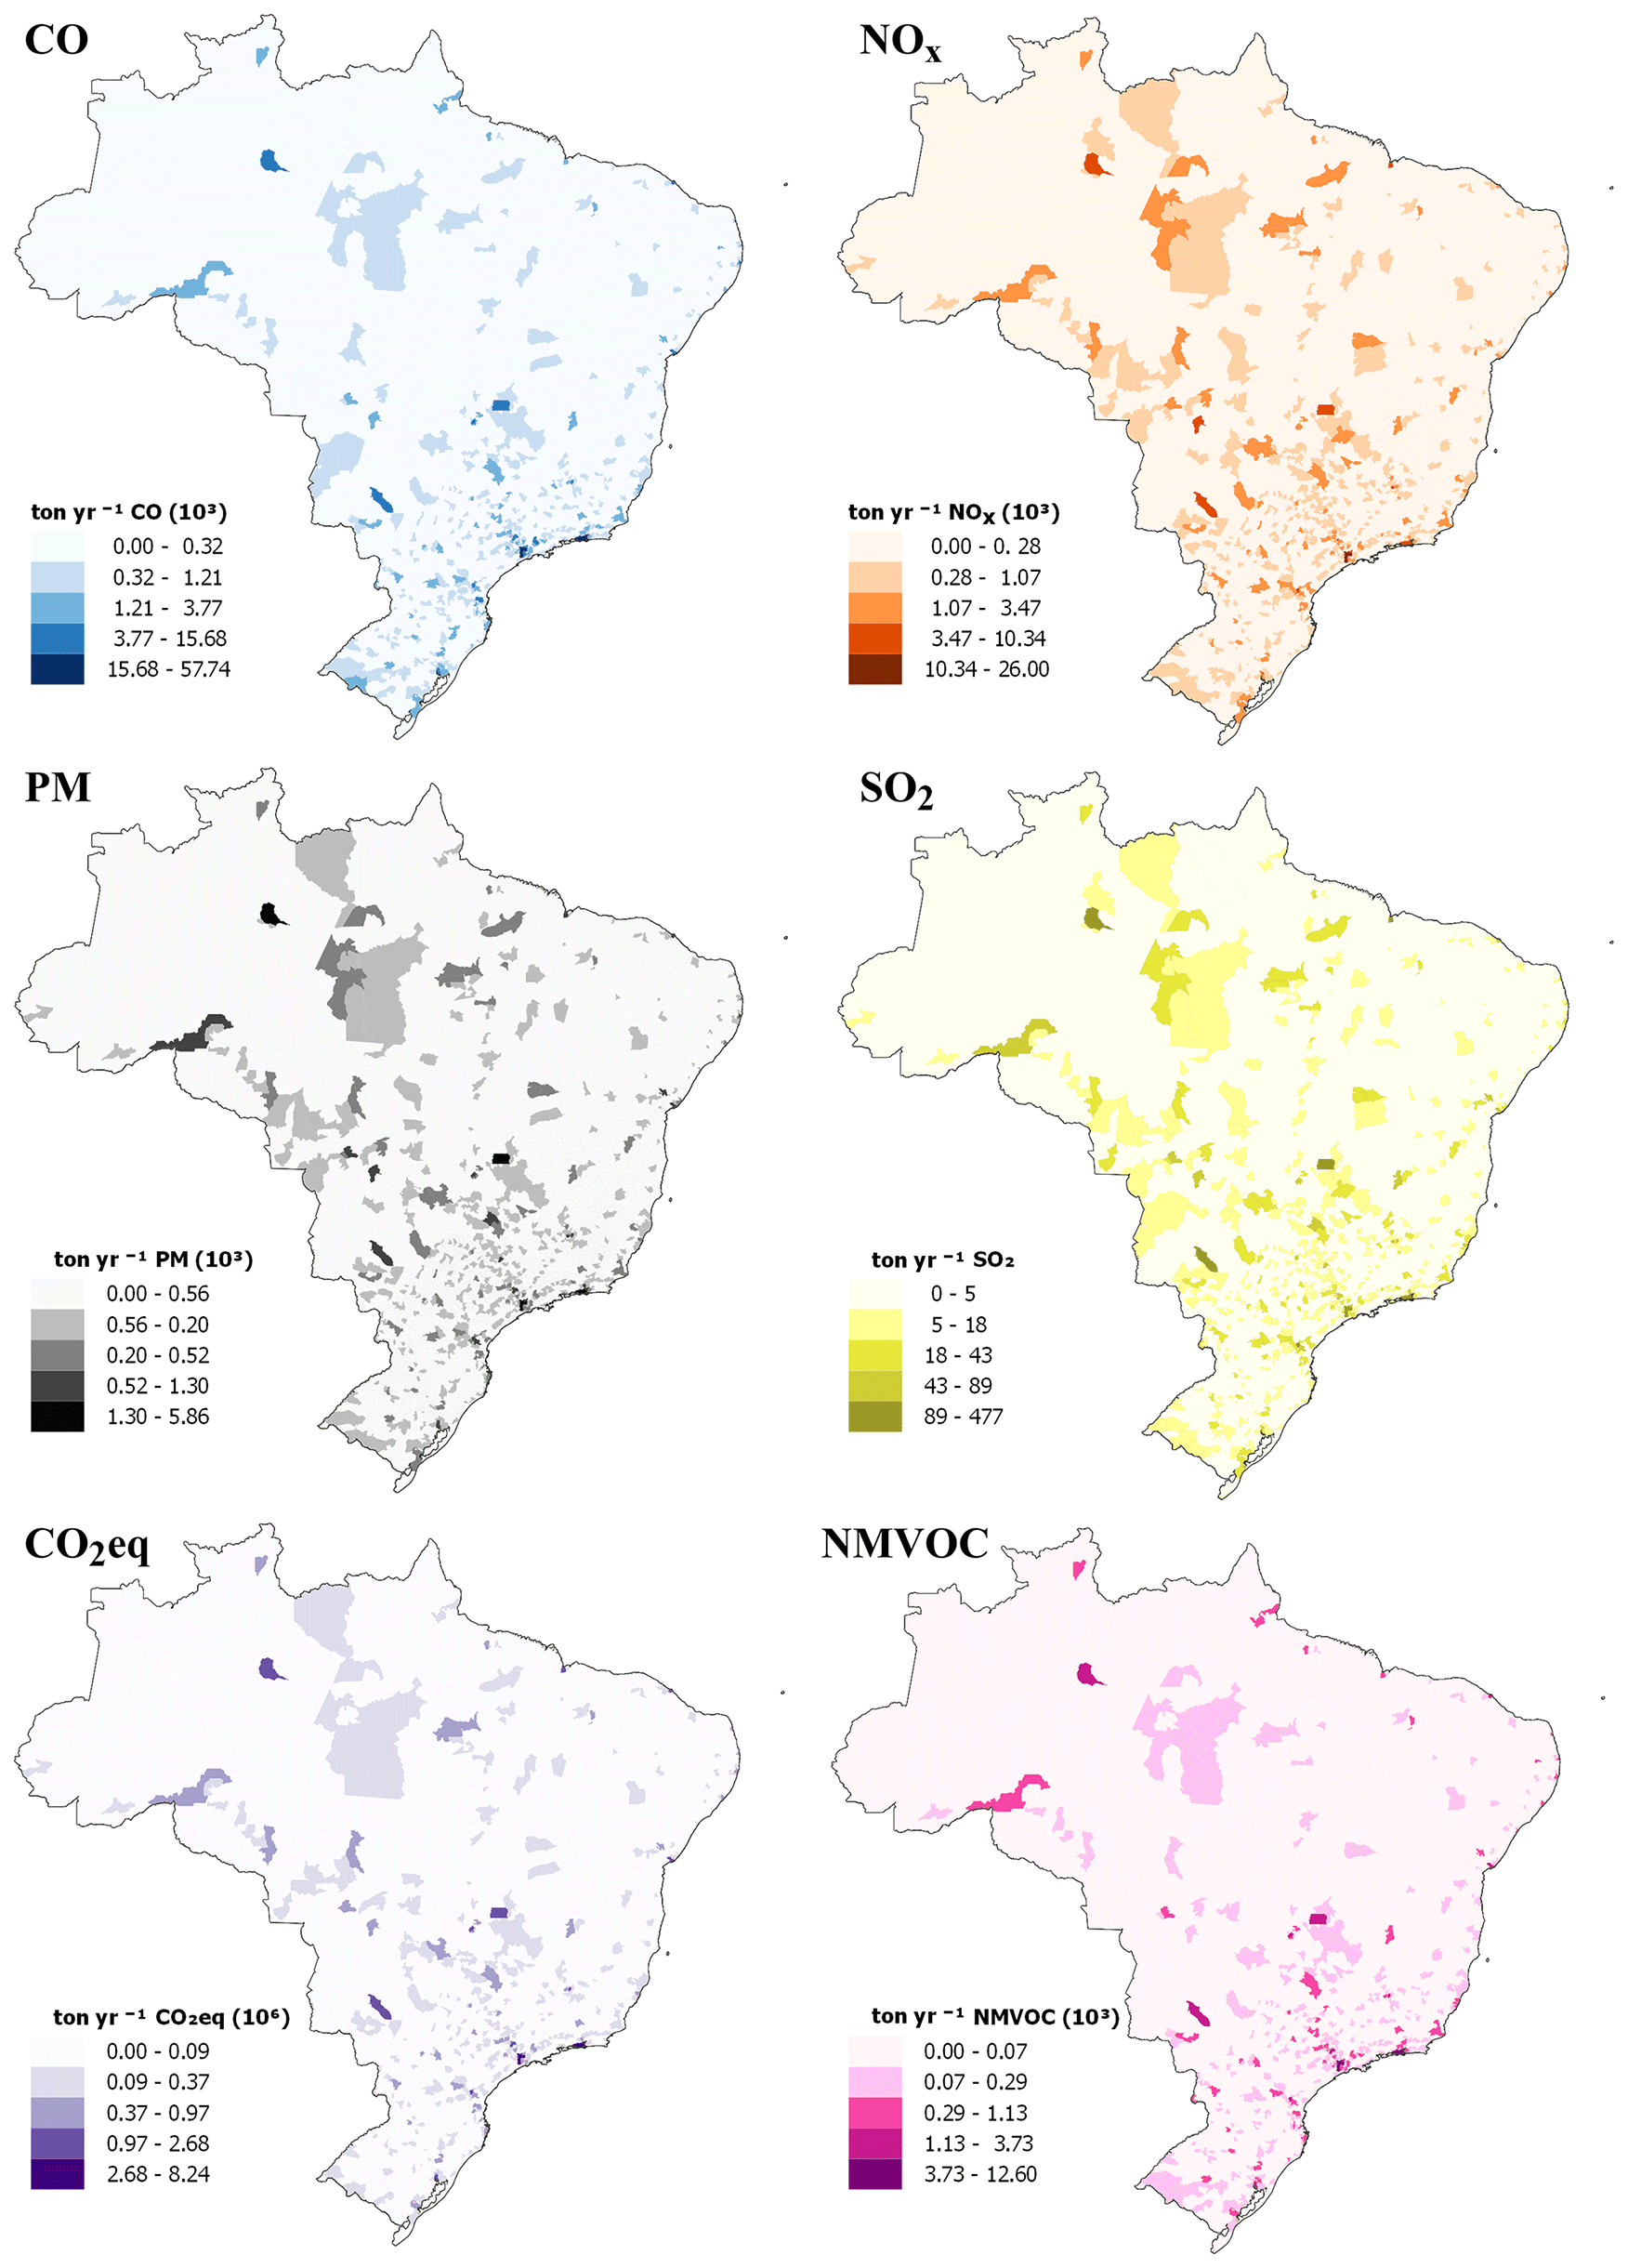
Figure 1Vehicular emissions inventory in 2019 of (a) CO, (b) NOx, (c) PM, (d) SO2, (e) CO2, and (f) NMVOC provided by BRAVES (Vasques and Hoinaski, 2021).
Brazil has experienced a rapid rise in its vehicular fleet (Carvalho et al., 2015) and transport volume. Even though the program to control vehicular emissions has reduced the emissions from the transport sector in Brazil (Andrade et al., 2017), vehicles are still potentially the dominant source of air pollution in several municipalities.
The impact of vehicular emissions in many Brazilian municipalities is still unknown (Ribeiro et al., 2021). Current inventories provide only annual emissions from national to municipality scales, not reaching the spatial and temporal resolution necessary for air quality modeling (Álamos et al., 2022), nor the emission of chemical species that participate in chemical reactions in the atmosphere. For this reason, most regional air quality assessments in Brazil rely on global emissions inventories, which have proved to be biased against local inventories. Also, global inventories do not present enough spatial and temporal resolution for regional and local studies (Ibarra-Espinosa et al., 2018). Even in the megacity of São Paulo, where the air quality network is well developed and multiple inventories have been developed, there is still room for improvement in emissions inventories (Andrade et al., 2017), especially regarding chemical species involved in the photochemical process in the atmosphere.
In this article, we present the first comprehensive multispecies high-spatiotemporal-resolution database of vehicular emissions for the entire Brazilian territory. The BRAzilian Vehicular Emissions inventory Software (BRAVES) database has spatial disaggregation based on road density, temporal disaggregation using vehicular flow profiles, and chemical speciation from local studies and the United States Environmental Protection Agency (US EPA) SPECIATE 5.1 database. The BRAVES database provides hourly and annual emissions of 41 gaseous and particle pollutants. Users can define the spatial resolution from coarse to very refined scales. The emissions are derived from the BRAVES model (Vasques and Hoinaski, 2021), which uses a probabilistic approach that accounts for the fleet characteristics, fuel consumption, vehicle deterioration, and intensity of use, to calculate the vehicular emissions from the exhaust, tires, roads, brake wear, soil resuspension, refueling, and evaporative emissions. Here, we present methods and a comparison between the BRAVES database and independent databases. We also make all codes and inputs freely available.
Our database uses output data from BRAVES (Vasques and Hoinaski, 2021), which employ a probabilistic bottom-up method to estimate vehicular emissions aggregated by the municipality (Fig. 1). The BRAVES estimates the vehicular emissions from the exhaust, tires, roads, brake wear, soil (road dust) resuspension, refueling, and evaporative emissions. The software provides annual emissions of carbon monoxide (CO), carbon dioxide (CO2), methane (CH4), hydrocarbons (HC), aldehydes (RCHO), non-methane volatile organic compounds (NMVOC), nitrogen oxides (NOx), particulate material (PM), nitrous oxide (N2O), and sulfur dioxide (SO2) by fleet category (i.e., commercial light vehicles, motorcycles, light-duty, and heavy-duty vehicles). Throughout this article, we call the current database the BRAVES database. Codes and outputs from BRAVES are available by registering at https://hoinaski.prof.ufsc.br/BRAVES/ (last access: 7 June 2022) and https://github.com/leohoinaski/BRAVES (last access: 7 June 2022), where users can access instructions to run the database and download the input files. The outputs are generated in the NetCDF format and with annual or hourly resolutions.

Figure 2Road density factor in Brazil with spatial resolution of 0.05×0.05∘.
Since vehicular emissions from BRAVES are aggregated by municipalities, we use a road density approach to distribute the emissions of each municipality in pixels with user-defined resolution. Previous work by Tuia et al. (2007) and Gómez et al. (2018) shows that road density is one of the most reliable approaches to disaggregate vehicular emissions. In this article, the road density factor (RDp,m) is calculated by the sum of road lengths (Lp) on each pixel (p) divided by the total road length (Lm) inside a municipality (m) (Eq. 1). Road shapefile data derived from OpenStreetMap (https://www.openstreetmap.org/#map=7/51.330/10.453, last access: 7 June 2022) can be downloaded at https://download.geofabrik.de/south-america/brazil.html (last access: 7 June 2022) for Brazilian territory. Figure 2 shows the spatial distribution of RDp,m in Brazil. Multiplying RDp,m by the vehicular emissions in each municipality derived from BRAVES provides the spatialized emission () of compound (c) in pixel (p) within a municipality (m) (Eq. 2). We provide a parallelized method to estimate the road density in Brazil at https://github.com/leohoinaski/BRAVES (last access: 7 June 2022).
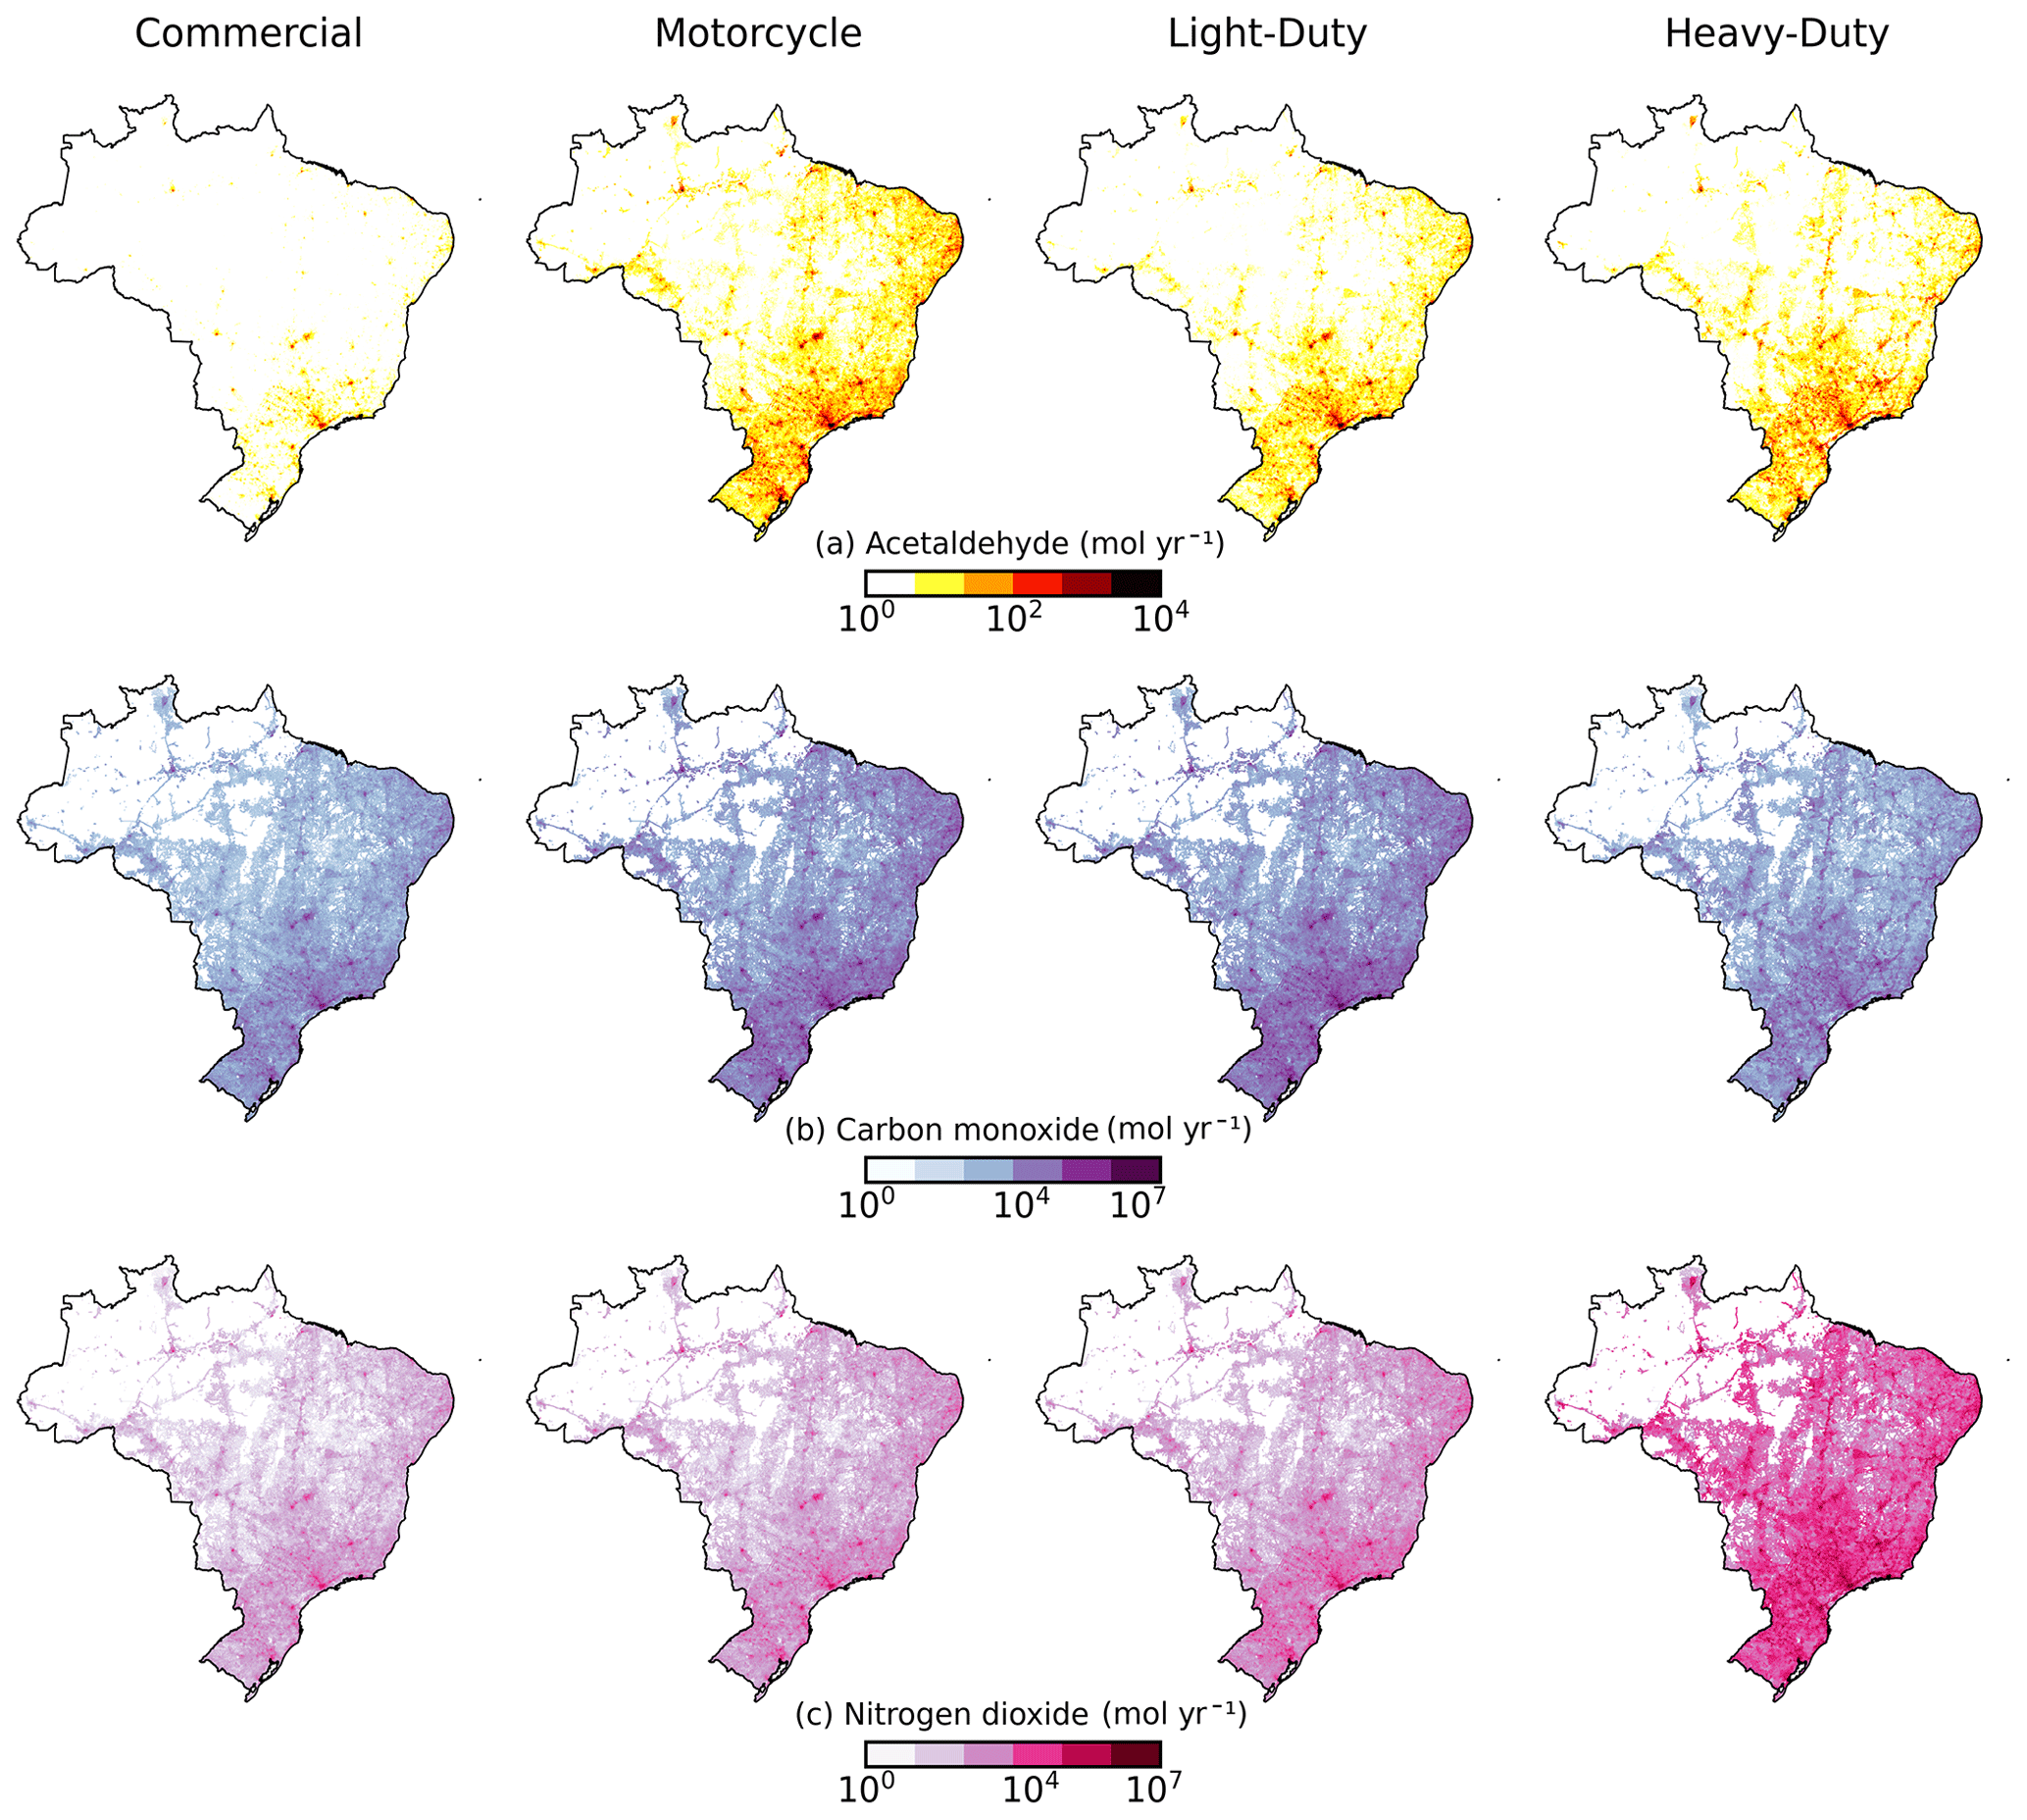
Figure 3Vehicular emissions of (a) acetaldehyde, (b) carbon monoxide, and (c) nitrogen dioxide from commercial light vehicles, motorcycles, light-, and heavy-duty vehicles in 2019.
Figure 3 shows the annual emissions of acetaldehyde, CO, and nitrogen dioxide from 2019 in Brazil by fleet category using spatial distribution based on the road density approach. Hotspots of vehicular emissions concentrate in urbanized areas of Brazil (Fig. 3). Among fleet categories, heavy-duty vehicles are the major emitters of nitrogen dioxide, while light-duty vehicles and motorcycles emit the most CO. Regarding acetaldehyde emissions, motorcycles are the major emitters. Vasques and Hoinaski (2021) compared vehicular emissions from each fleet category in Brazil using BRAVES. Figures 1–5 in the Supplement demonstrate the BRAVES database by Brazilian state.
Temporal disaggregation based on traffic flow observations from the Environment and Water Resources Institute from Espírito Santo (IEMA ES, 2019) splits original annual emissions from BRAVES into hourly basis emissions. In this article, the temporal disaggregation factor (Fig. 4) is composed of hourly, weekly, and monthly traffic factors. Hourly emissions () of each air pollutant are obtained by the multiplication of and the temporal disaggregation factor (Tf) (Eq. 3).
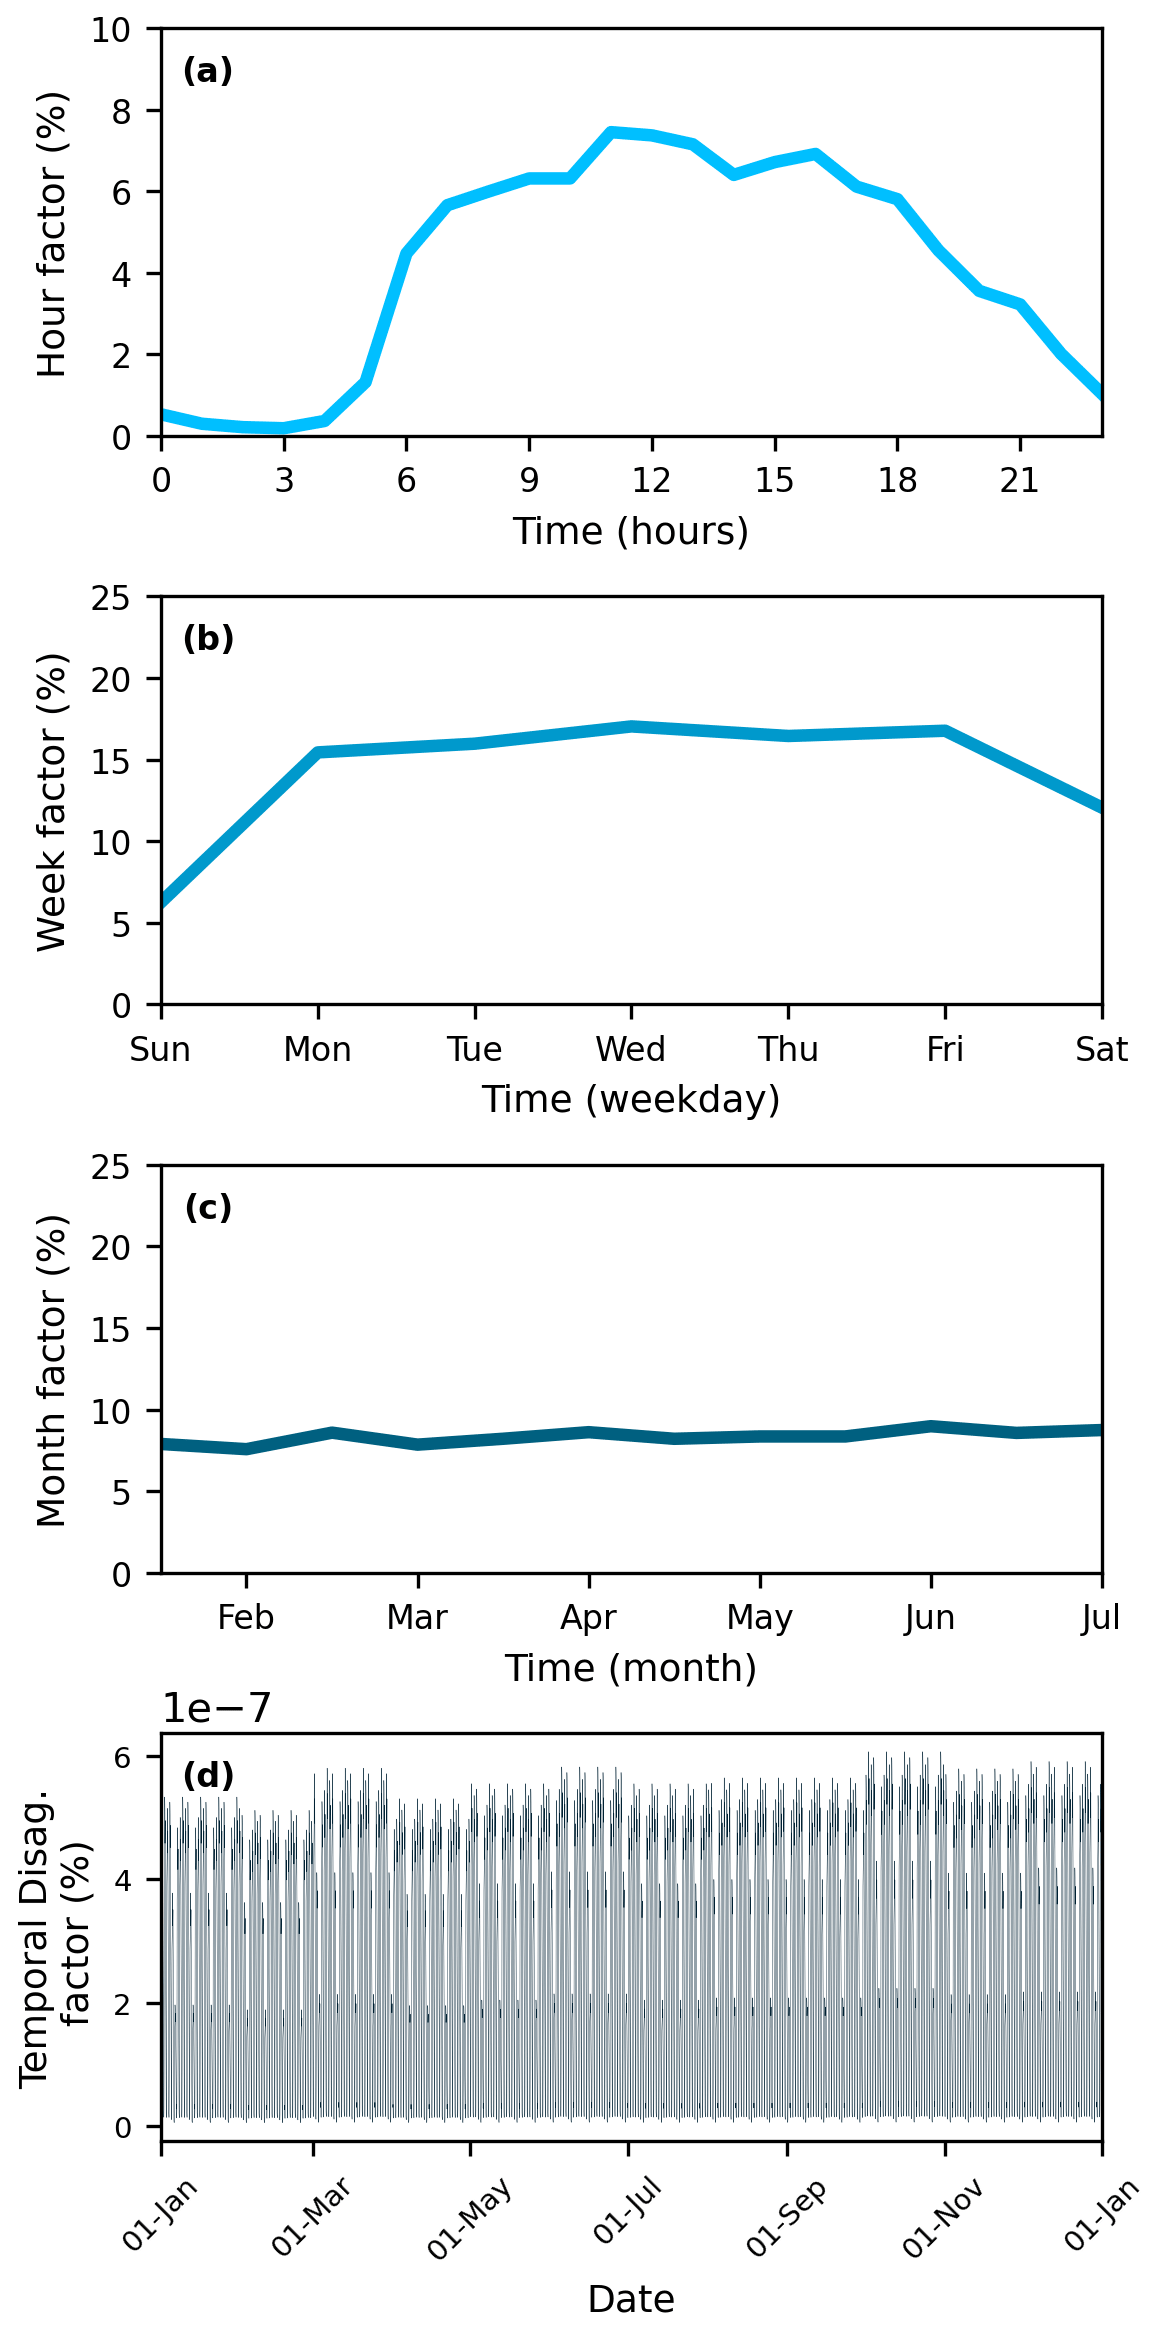
Figure 4Temporal disaggregation factor and its components (a) hourly factor, (b) weekly factor, (c) monthly factor, (d) annual to hourly basis temporal disaggregation factor.
We use data from SPECIATE 5.1 (US EPA, 2020; Eyth et al., 2020) from US EPA (https://www.epa.gov/air-emissions-modeling/speciate, last access: 11 March 2022) to speciate emissions of chemical constituents of volatile organic compounds (VOCs) and PM, which have not previously been estimated by BRAVES. The chemical speciation method also converts NOx to NO and NO2.
Regarding the speciation procedures, in this article, we group light-duty and commercial light vehicles, and motorcycles as light vehicles. We select profiles to speciate PM emissions from the exhaust of heavy and light vehicles, soil resuspension (road dust), tire wear, and brake wear. The VOC emissions from the exhaust and evaporative process are also speciated. Table 6 in the Supplement summarizes the profiles from SPECIATE 5.1 used in the chemical speciation. We have targeted the species required for use in complex three-dimensional atmospheric models (Yarwood et al., 2010a, b). Table 1 presents the VOC and PM compounds considered in the chemical speciation in this database.
Table 1List of chemical species included in the BRAVES database (Yarwood et al., 2010b).

We speciate the acetaldehydes (ALD2 and ALD2_PRIMARY), formaldehyde (FORM and FORM_PRIMARY), and aldehydes with three or more carbons (ALDX) using original RCHO estimates from BRAVES, which are based on the local emissions factors from Companhia de Tecnologia de Saneamento Ambiental do Estado de São Paulo – CETESB (CETESB, 2022). We have considered that acetaldehyde represents 50 % of RCHO emissions from light-duty vehicles. Formaldehyde emissions (FORM and FORM_PRIMARY) represent 39 % of RCHO emissions from light-duty vehicles (Nogueira et al., 2015). The ALDX has been considered as 10 % of RCHO emissions, while acetone (ACET) accounts for 8 % of these emissions.
We have also kept the original estimates using the local emissions factor for ethanol (ETOH), which has been the best way of representing the particularities of biofuels in Brazil. Since 2008, CETESB has provided the ETOH emission factors for light-duty vehicles running with ethanol and gasoline (CETESB, 2022). Since CETESB's RCHO and ETOH emissions factors are available only for light-duty and commercial light vehicles, we have used percentage factors from SPECIATE 5.1 to estimate RCHO and ETOH emissions from non-methane hydrocarbons (NMHC) for motorcycles and heavy-duty vehicles.
The Brazilian gasoline C, which has fueled light-duty vehicles, is a mixture of pure gasoline and 20 % to 25 % of anhydrous ethanol. Since 2008, heavy-duty vehicles have run with a blend of diesel and up to 15 % of biodiesel. This unique chemical signature of the biofuels in Brazil reflected significantly in the vehicular emissions, especially those of carbonyls and ethanol (Nogueira et al., 2015; CNPE, 2018). These last compounds deserve attention since they are major precursors of tropospheric ozone (Atkinson, 2000; Jacob, 2000).
The chemical speciation factors employed to split VOC and PM emissions are calculated by the average of the weighting percentage of the corresponding species from SPECIATE 5.1. We consider exhaust, evaporative, and particulate emissions of light and heavy vehicles. Figures 5 and 6 show the speciation factor used to generate the database. Multiplication factors of 0.495 and 0.505 derived from SPECIATE 5.1 convert NOx emissions to NO and NO2, respectively. The table at https://github.com/leohoinaski/BRAVES/tree/main/ChemicalSpec (last access: 7 June 2022) summarizes the speciation factors used to build this database.

Figure 5VOC chemical speciation factors for (a) exhaust and (b) evaporative emissions from light and heavy vehicles. Data derived from US EPA SPECIATE 5.1 (US EPA, 2020; Eyth et al. 2020).
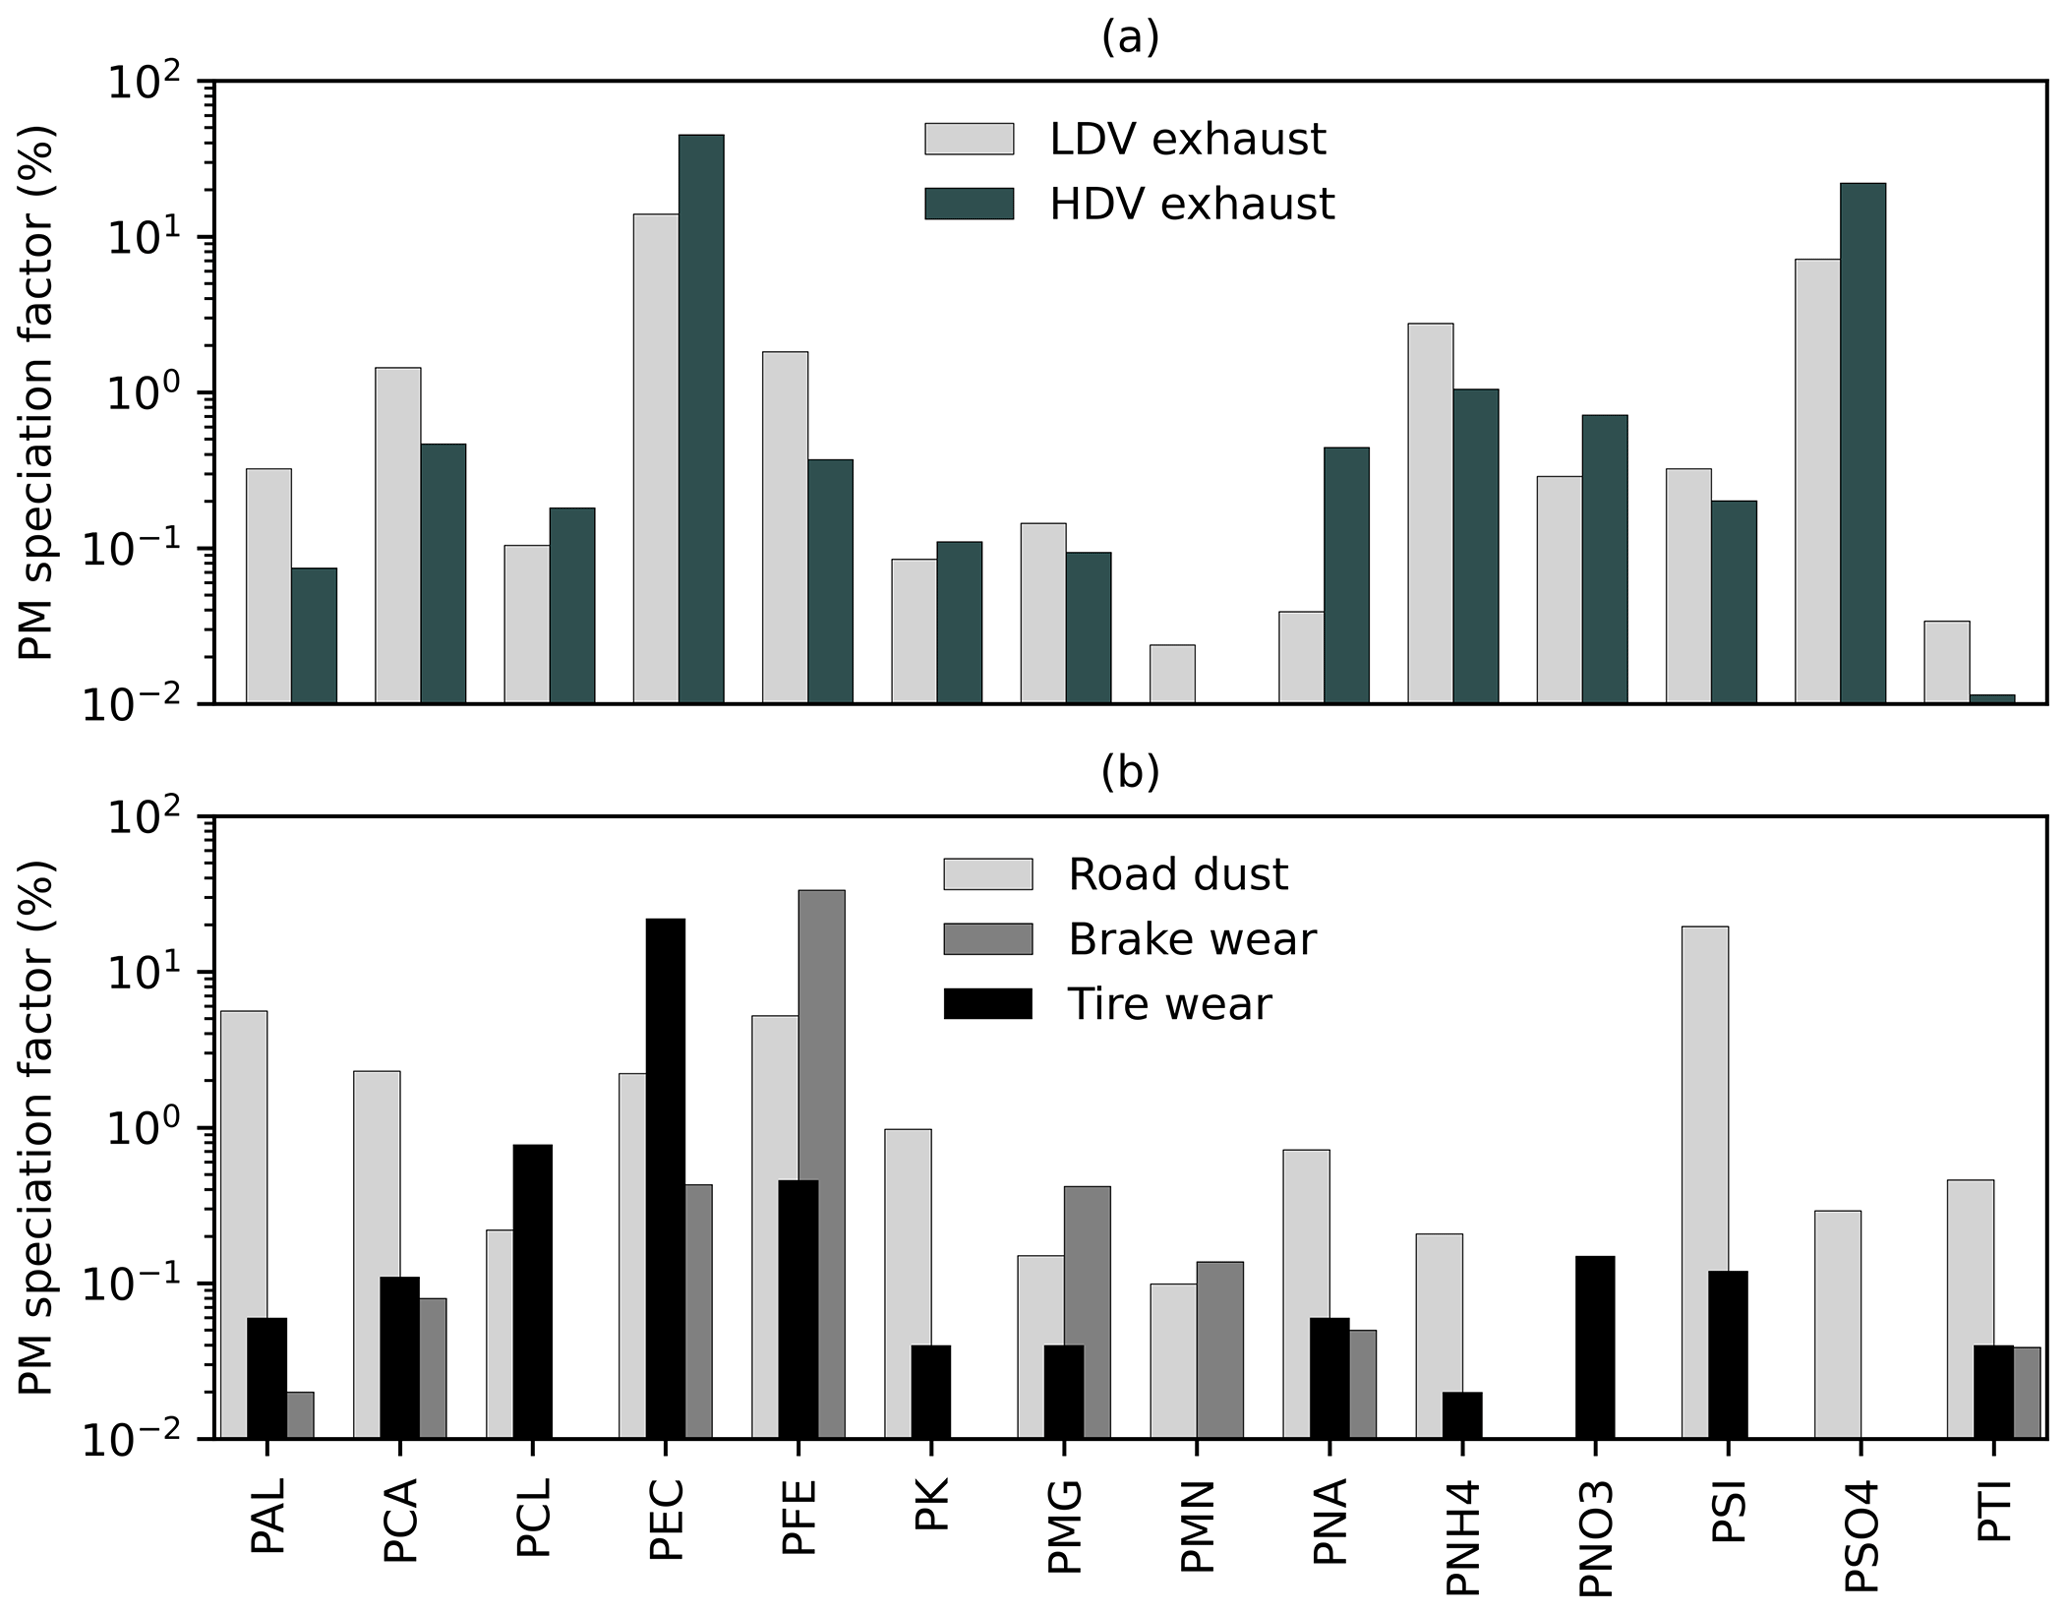
Figure 6PM chemical speciation factors for (a) exhaust emissions from light and heavy vehicles (b) road-dust resuspension, brake wear, and tire wear. Data derived from US EPA SPECIATE 5.1 (US EPA, 2020; Eyth et al., 2020).
The database contains hourly emissions of 41 chemical species, such as ACET, ACROLEIN, ALD2, BENZ, BUTADIENE13, CH4, CO, CO2, ETH, ETHA, ETHY, ETOH, FORM, ISO, N2O, NAPH, NO, NO2, PAL, PCA, PCL, PEC, PFE, PK, coarse mode primary PM (PMC), PMG, PMN, unspeciated PM2.5 (PMOTHR), PNA, PNH4, PNO3, POC, PRPA, PSI, PSO4, PTI, SO2, TERP, TOL, VOC, and XYLMN. We provide a code to generate hourly resolved files with a user-defined grid for a single or whole group of species (https://github.com/leohoinaski/BRAVES, last access: 7 June 2022). These files are compatible with the input requirements of sophisticated chemical transport models, such as the Community Multiscale Air Quality Model (CMAQ), the Weather Research and Forecasting (WRF) model coupled with Chemistry (WRF-Chem), the Comprehensive Air Quality Model with Extensions (CMAx), and others. Flags have been included in the NetCDF files to provide the area and time zones of each pixel, so users can choose the option to generate ready-to-use hourly input files for CMAQ (in mass or mol per second) or WRF-Chem (in mass or mol flux per area).
Smaller domains and finer resolution can be easily created by modifying the python codes. Figure 7 shows the vehicular emissions of Benzene in Brazil on 1 January 2019 using the BRAVES database.
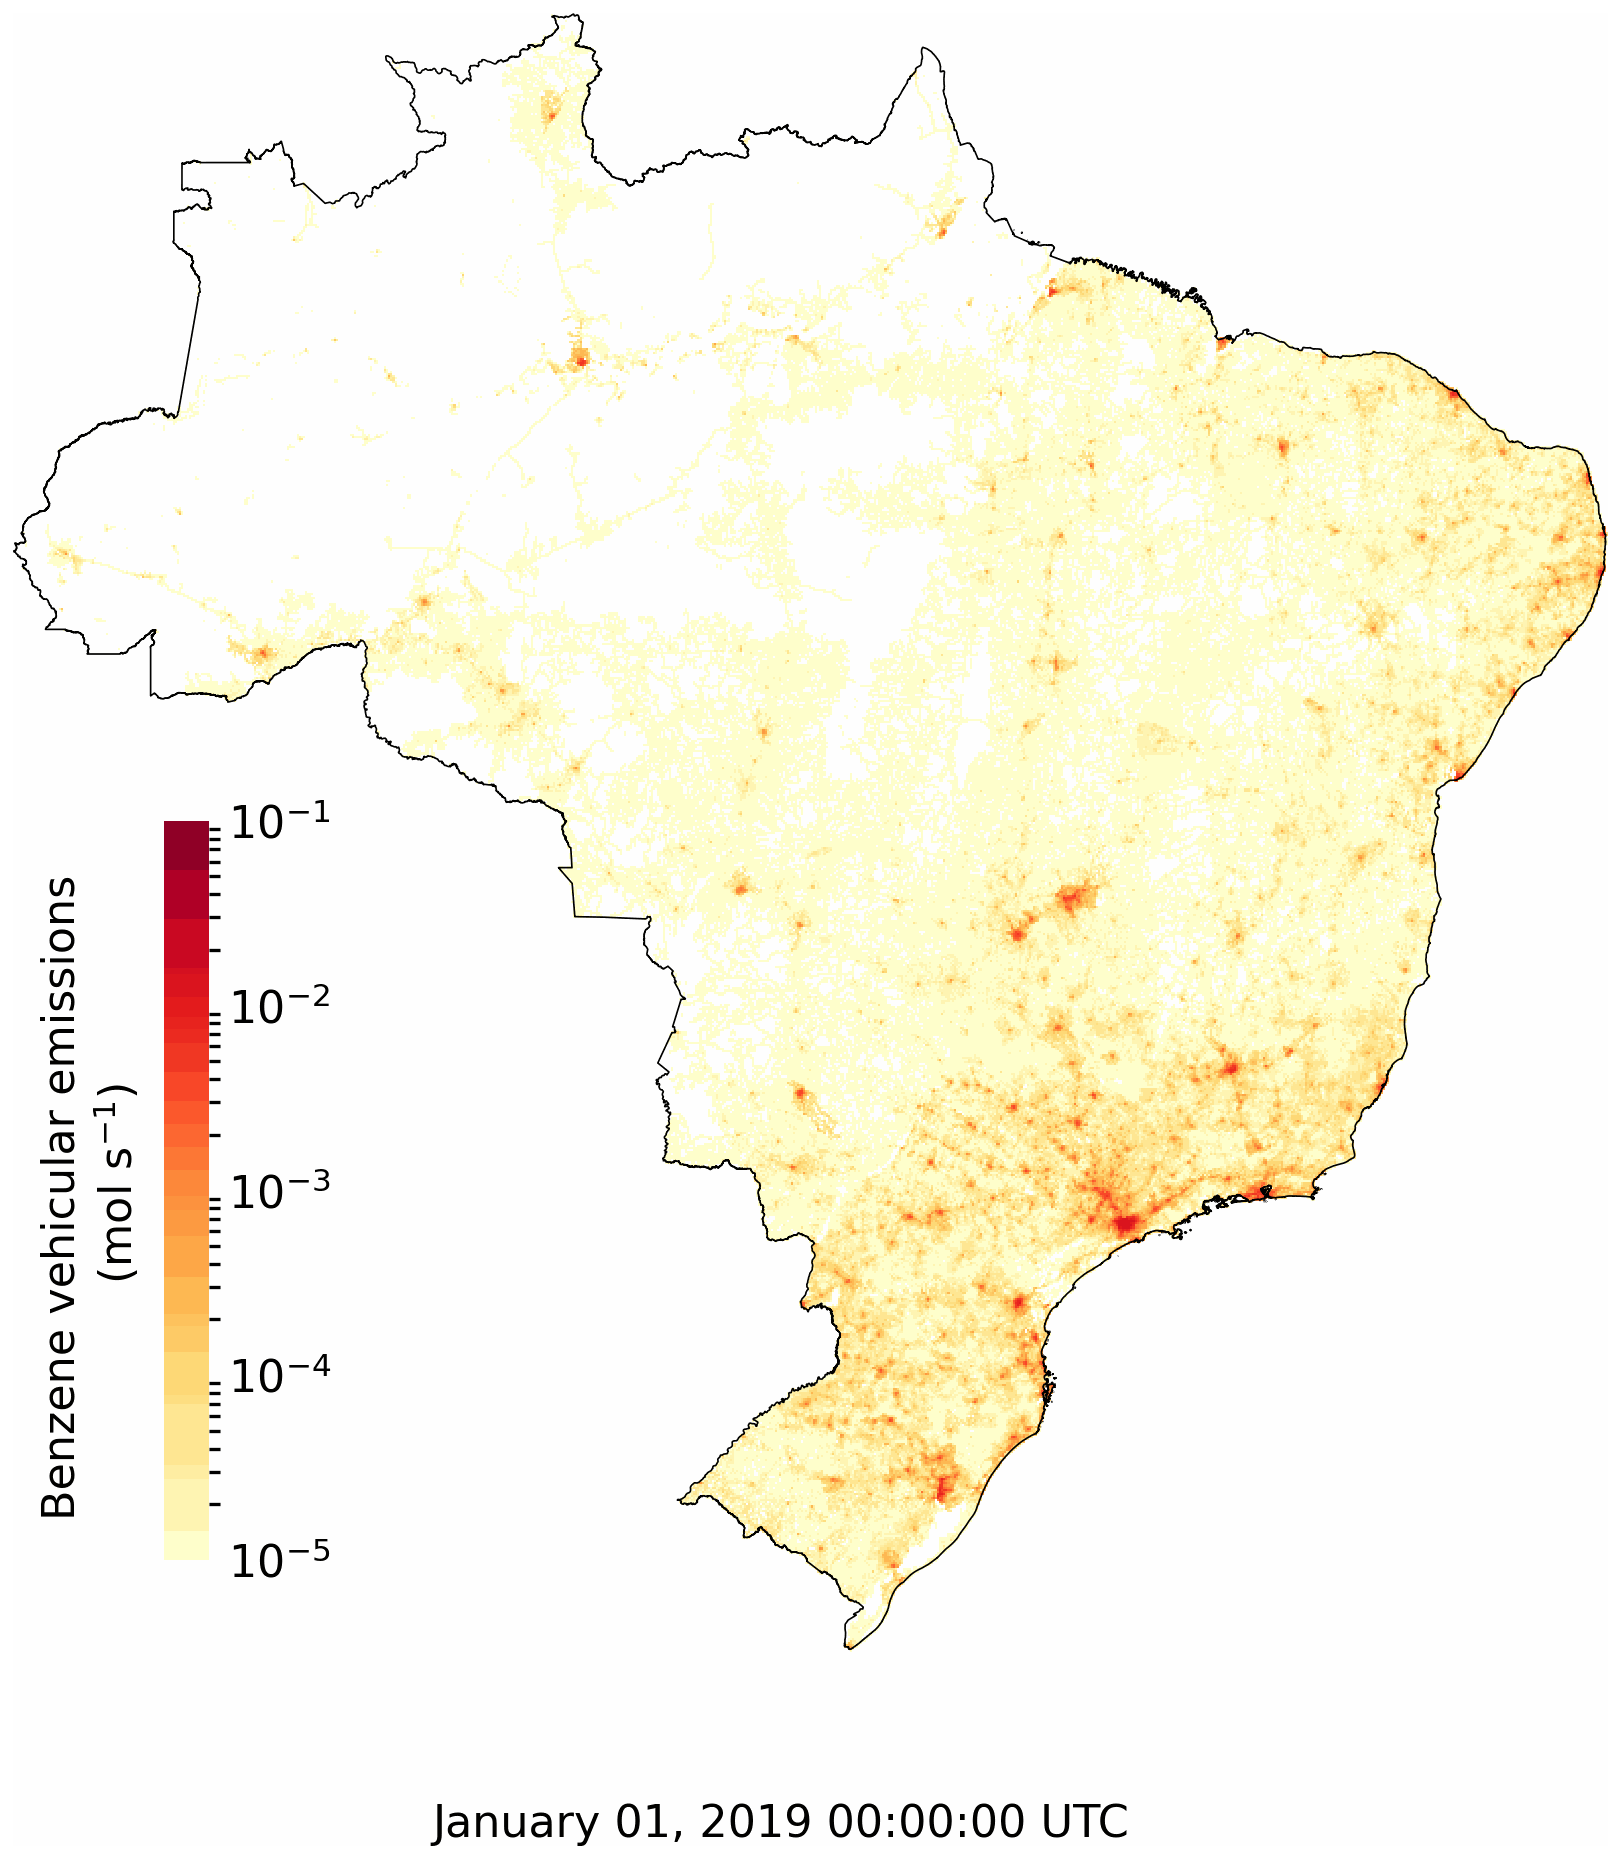
Figure 7Vehicular emissions of Benzene in Brazil on 1 January 2019 using the BRAVES database.
We provide the BRAVES database annual speciated emissions with 0.05×0.05∘ of resolution covering the entire Brazilian territory at: https://doi.org/10.5281/zenodo.6588692 (Hoinaski et al., 2022).
We analyze the spatial correlation and bias between the BRAVES database and the annual grid maps of the Emissions Database for Global Atmospheric Research (EDGAR – version 5.0 https://edgar.jrc.ec.europa.eu/dataset_ap50, last access: 18 February 2022) (Crippa et al., 2018, 2019). We performed the comparison using the “Road Transportation” emissions from EDGAR for the Brazilian territory, including soil resuspension emission rates of PM10 from EDGAR. The BRAVES database emission rates in tons per year from 2015 were regridded to the same spatial resolution of EDGAR. The Spearman coefficient estimates the spatial correlation, while the difference in absolute emissions calculates the bias between the datasets. We compare the disaggregated emissions of CO, PM10, NOx, and COV from BRAVES and EDGAR. Table 7 in the Supplement also shows a comparison of the total vehicular emissions aggregate in Brazilian territory, considering BRAVES, EDGAR, and other available national inventories.
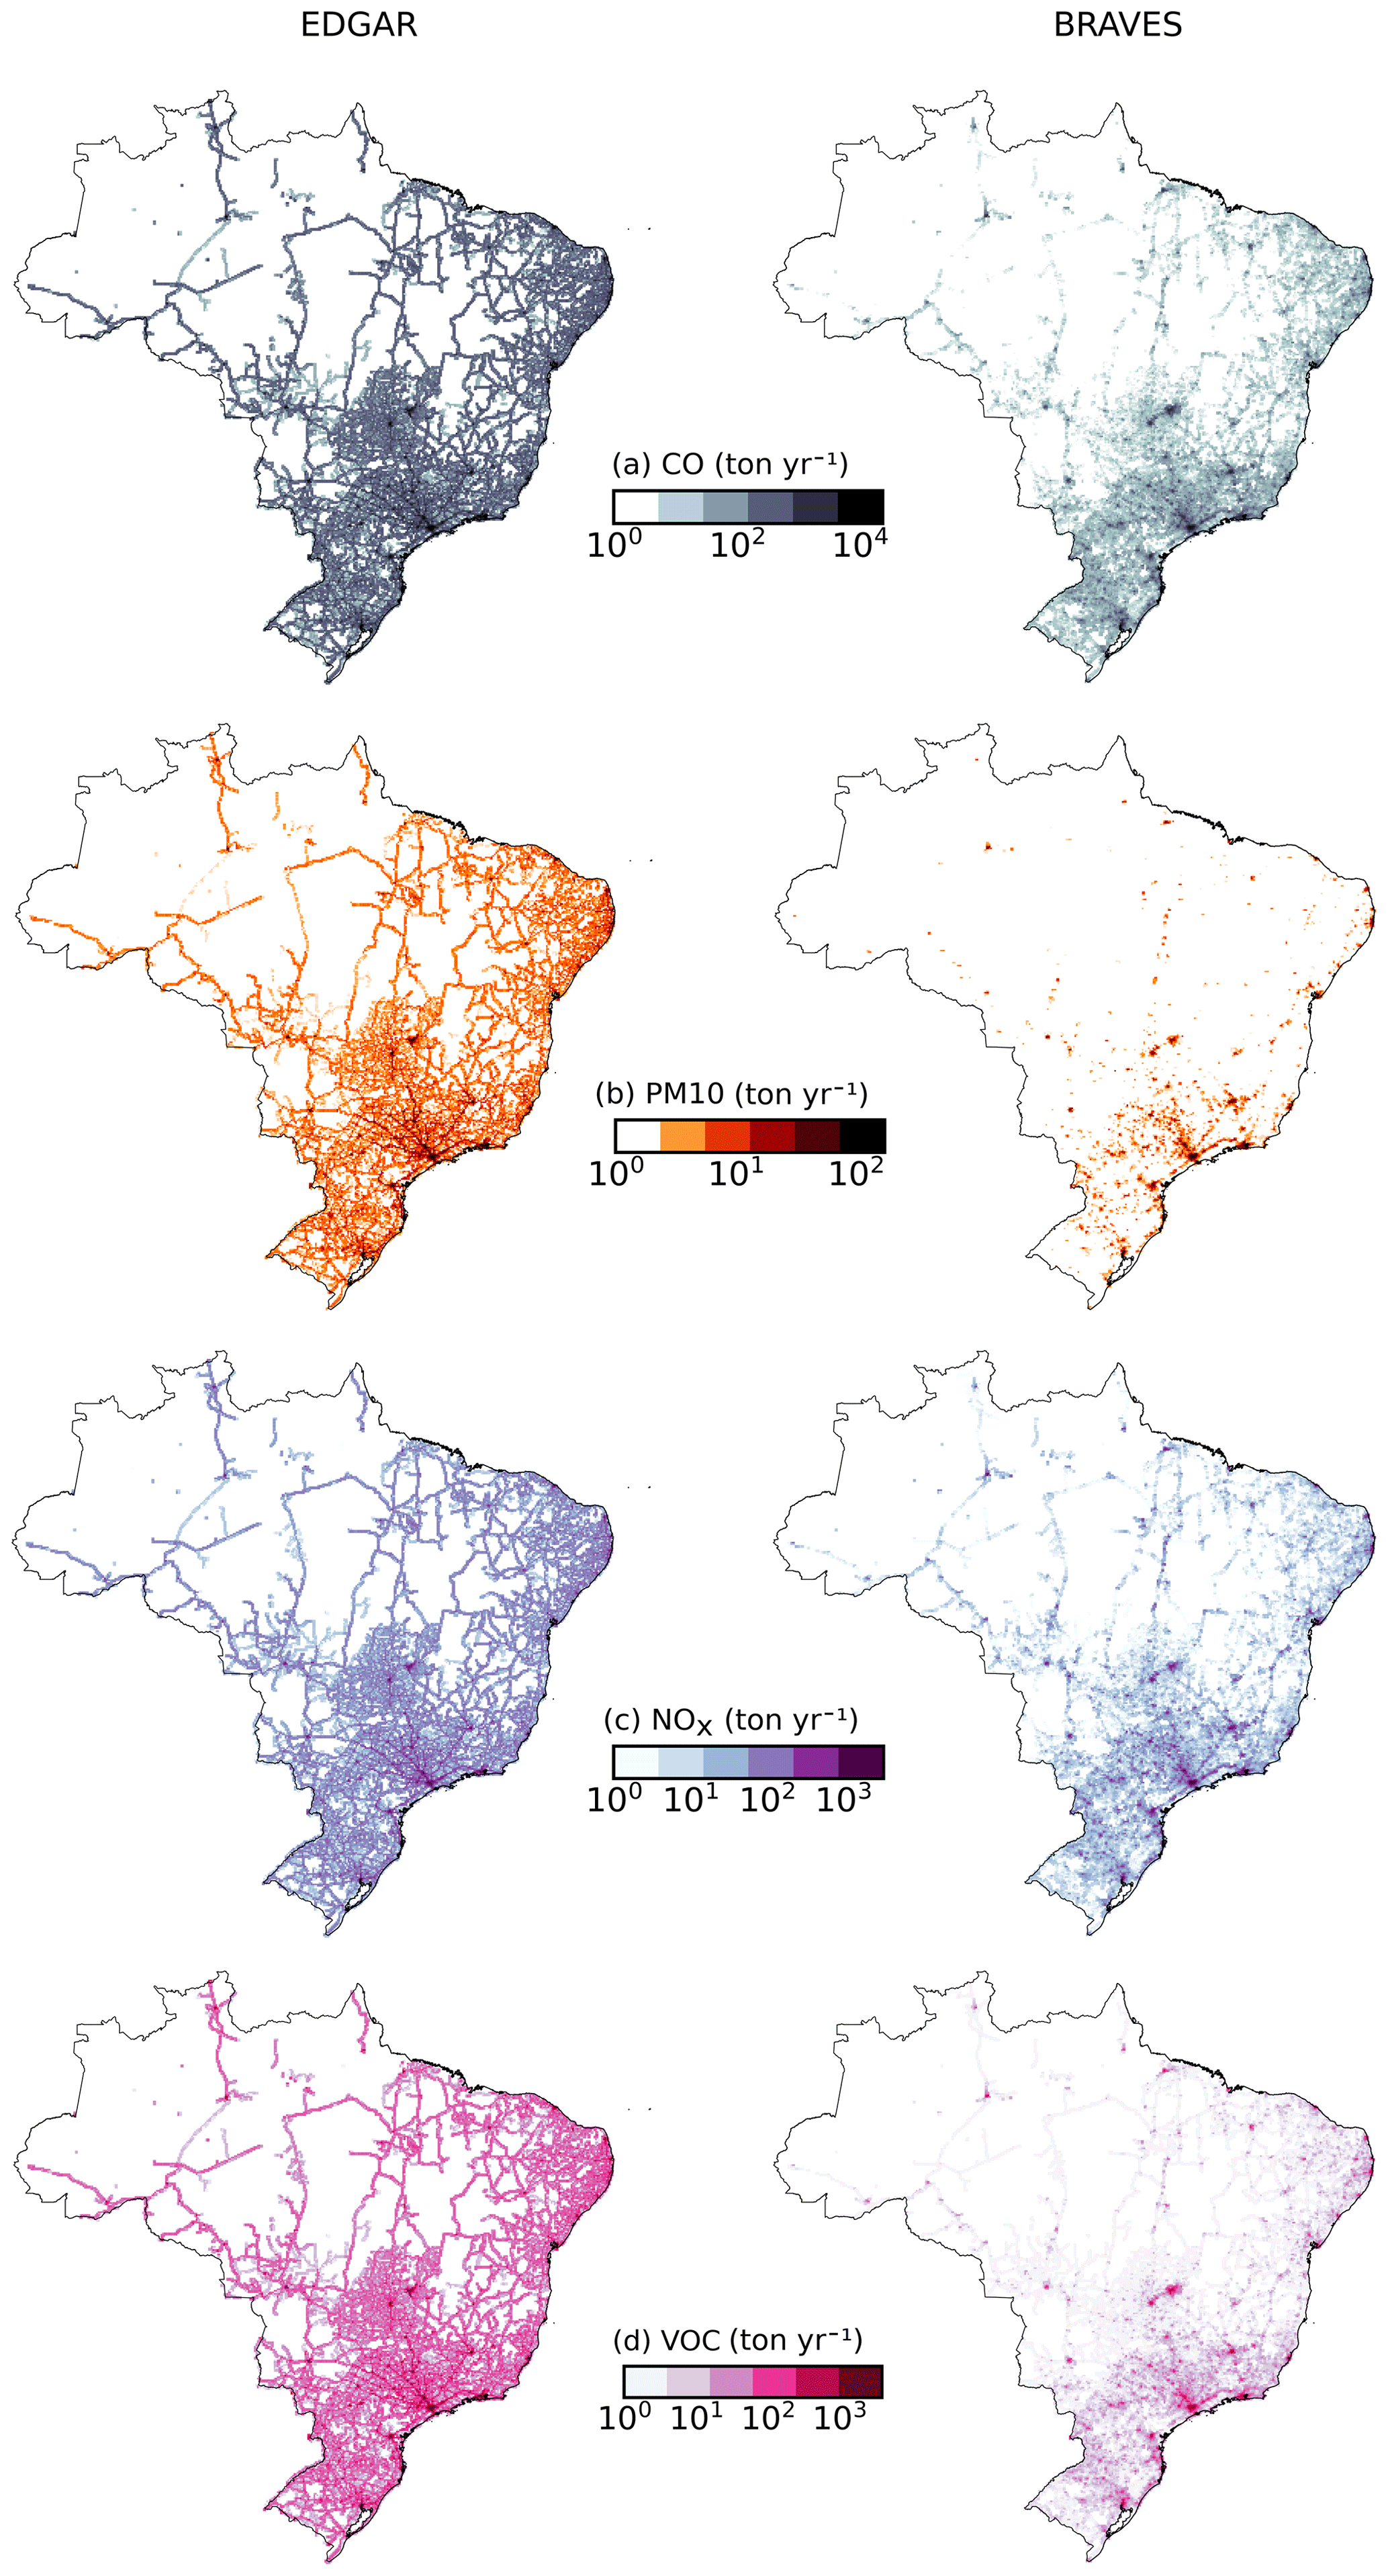
Figure 8Comparison of (a) CO, (b) PM10, (c) NOx, and (d) VOC spatial distribution (log scale) provided by the EDGAR and BRAVES databases.
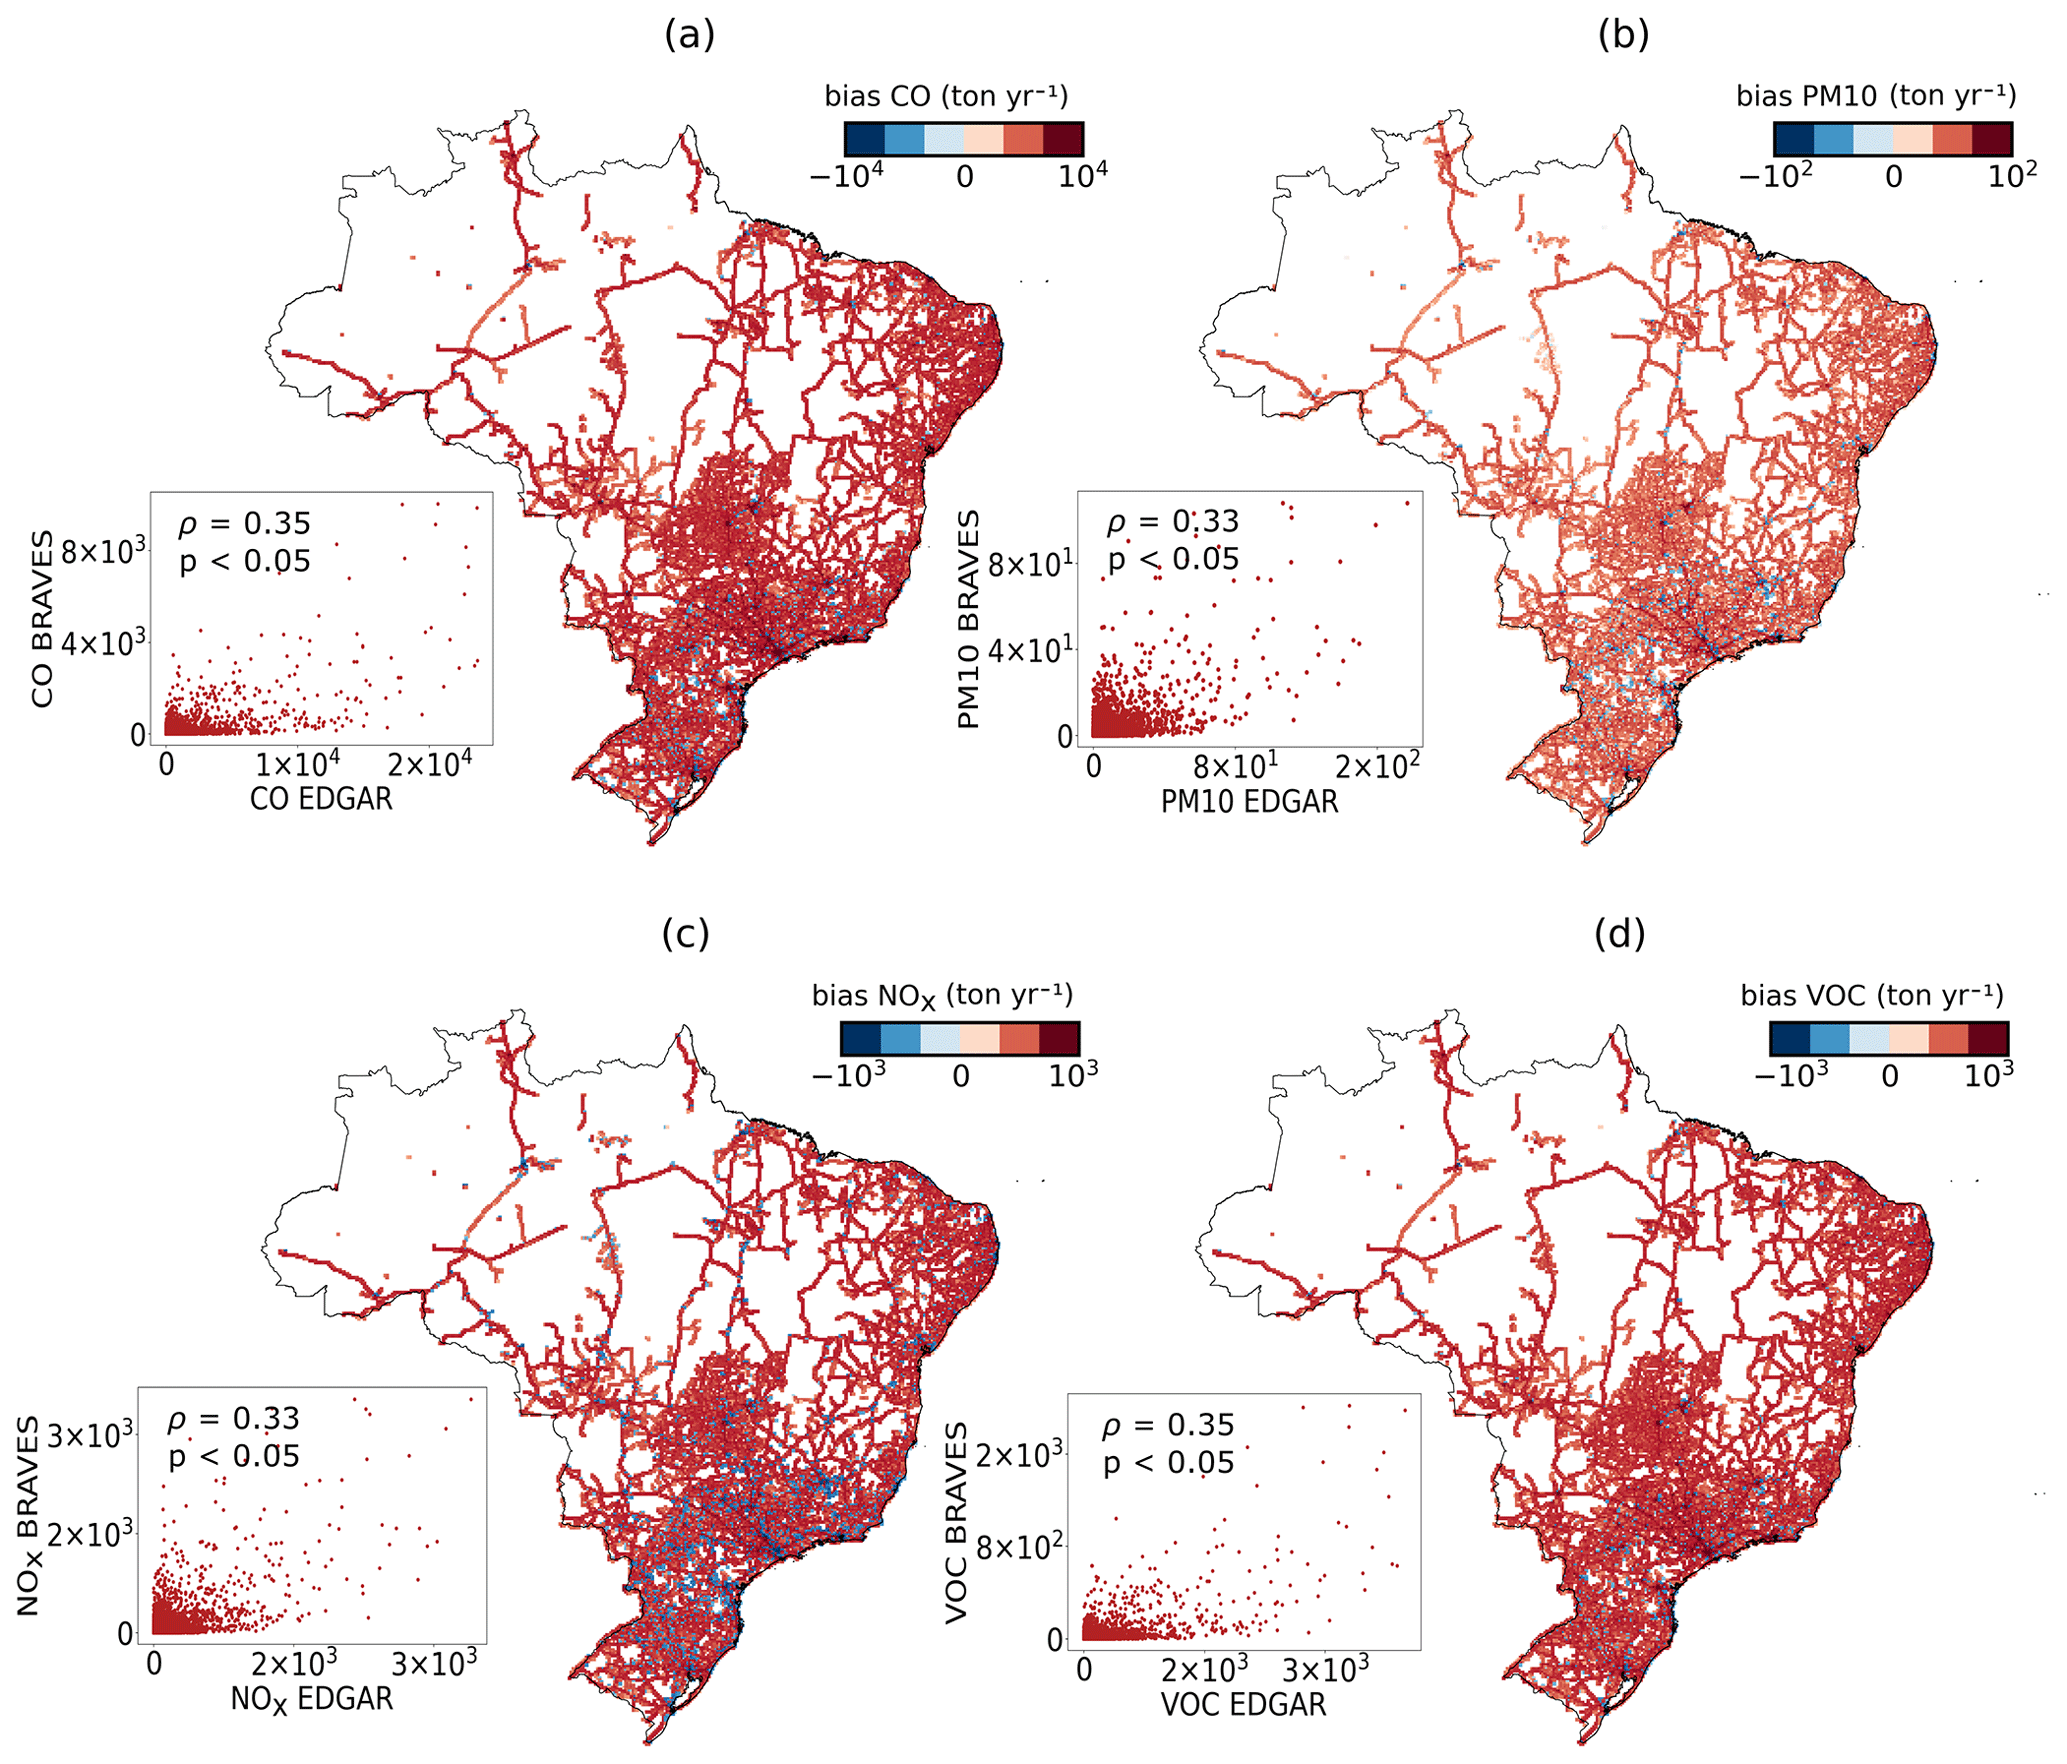
Figure 9Bias (log scale) and scatter plots of (a) CO, (b) PM 10, (c) NOx, and (d) VOC emission rates provided by the BRAVES database and EDGAR in 2015.
Emissions from BRAVES and EDGAR present overall spatial correlation (p<0.05) of ρ=0.35 for CO, ρ=0.33 for PM10, ρ=0.33 for NOx, and ρ=0.35 for VOC (Fig. 9). Emissions from EDGAR are higher overall (Fig. 9) than emissions from BRAVES, as also reported by Vasques and Hoinaski (2021). The largest differences are observed in CO emissions, followed by VOC, NOx, and PM10. Madrazo et al. (2018) explain that most of the road transport emissions factors are overestimated in EDGAR, while Huneeus et al. (2020) found discrepancies between EDGAR and local/national city emissions. Álamos et al. (2022) also reported an overestimation of EDGAR emissions. Compared with the present database, we have observed higher estimates from EDGAR in pixels with low-road densities and less-populated areas, while in high population areas EDGAR has estimated lower values. A similar pattern has been also observed by Ibarra-Espinosa et al. (2018) when comparing EDGAR with the Vehicular Emissions Inventory (VEIN).
We analyze the spatial correlation between CO vehicular emissions estimated by BRAVES and EDGAR, and CO surface concentration estimated by the Modern-Era Retrospective Analysis for Research and Applications – MERRA-2. The Global Modeling and Assimilation Office (GMAO), managed by NASA, provides MERRA-2 reanalysis products in a spatial resolution of 0.5×0.625∘, covering from 1980 to the present (Gelaro et al., 2017; Randles et al., 2017). We calculate the annual average concentration in 2015 from monthly data in NetCDF files available at the GES-DISC platform (https://disc.gsfc.nasa.gov/datasets/M2TMNXCHM_5.12.4/summary, last access: 7 June 2022). The MERRA-2 hourly dataset used in Fig. 10 can be downloaded at https://disc.gsfc.nasa.gov/datasets/M2T1NXCHM_5.12.4/summary (last access: 7 June 2022). All grids are realigned to match the MERRA-2 spatial resolution. We analyze the spatial correlation by Brazilian states since the vehicular emissions have more influence in urbanized ones. We assume that those cells which have vehicular emissions as the major source of air pollutants also have higher-surface concentrations. However, this assumption has several limitations and should be carefully evaluated since it does not account for the dispersion process and other source types (i.e., industrial, biomass burning, biogenic sources).
Figure 10 shows the (a) CO concentrations from MERRA-2 in the São Paulo (SP) state, (b) vehicular emission of CO from EDGAR, and (c) vehicular emission of CO from the BRAVES database. In 2021, ∼ 31 million vehicles were registered in the SP state, being considered the state with the highest vehicular emissions in Brazil (SENATRAN, 2021; Vasques and Hoinaski, 2021). The BRAVES database and EDGAR reach a similar spatial correlation with MERRA-2 when using annual averages (Fig. 8 in the Supplement). The zoom-in quadrant in the SP metropolitan region in Fig. 10 reveals a greater level of details from the BRAVES database compared to EDGAR. In addition, BRAVES has higher-temporal resolution and chemical speciated emissions and has presented a better correlation with MERRA-2 when comparing hourly averages (Fig. 10). In Fig. 10, we have compared MERRA-2 and emissions on 1 January 2015 at 08:00 UTC, when the boundary layer is low and the concentrations are representative of the emissions, as shown by Gallardo et al. (2012). It is worth emphasizing that the straightforward comparison between emissions and concentrations from monitors or reanalysis data must be made carefully and under specific conditions.
In other Brazilian states, such as Minas Gerais (MG) and Rio Grande do Sul (RS), there is also a positive correlation between vehicle emissions and surface concentrations of CO (Table 9 in the Supplement). It shows that both databases consistently capture the spatial variability of vehicular emissions, and the BRAVES database brings additional features for air quality studies in Brazil.
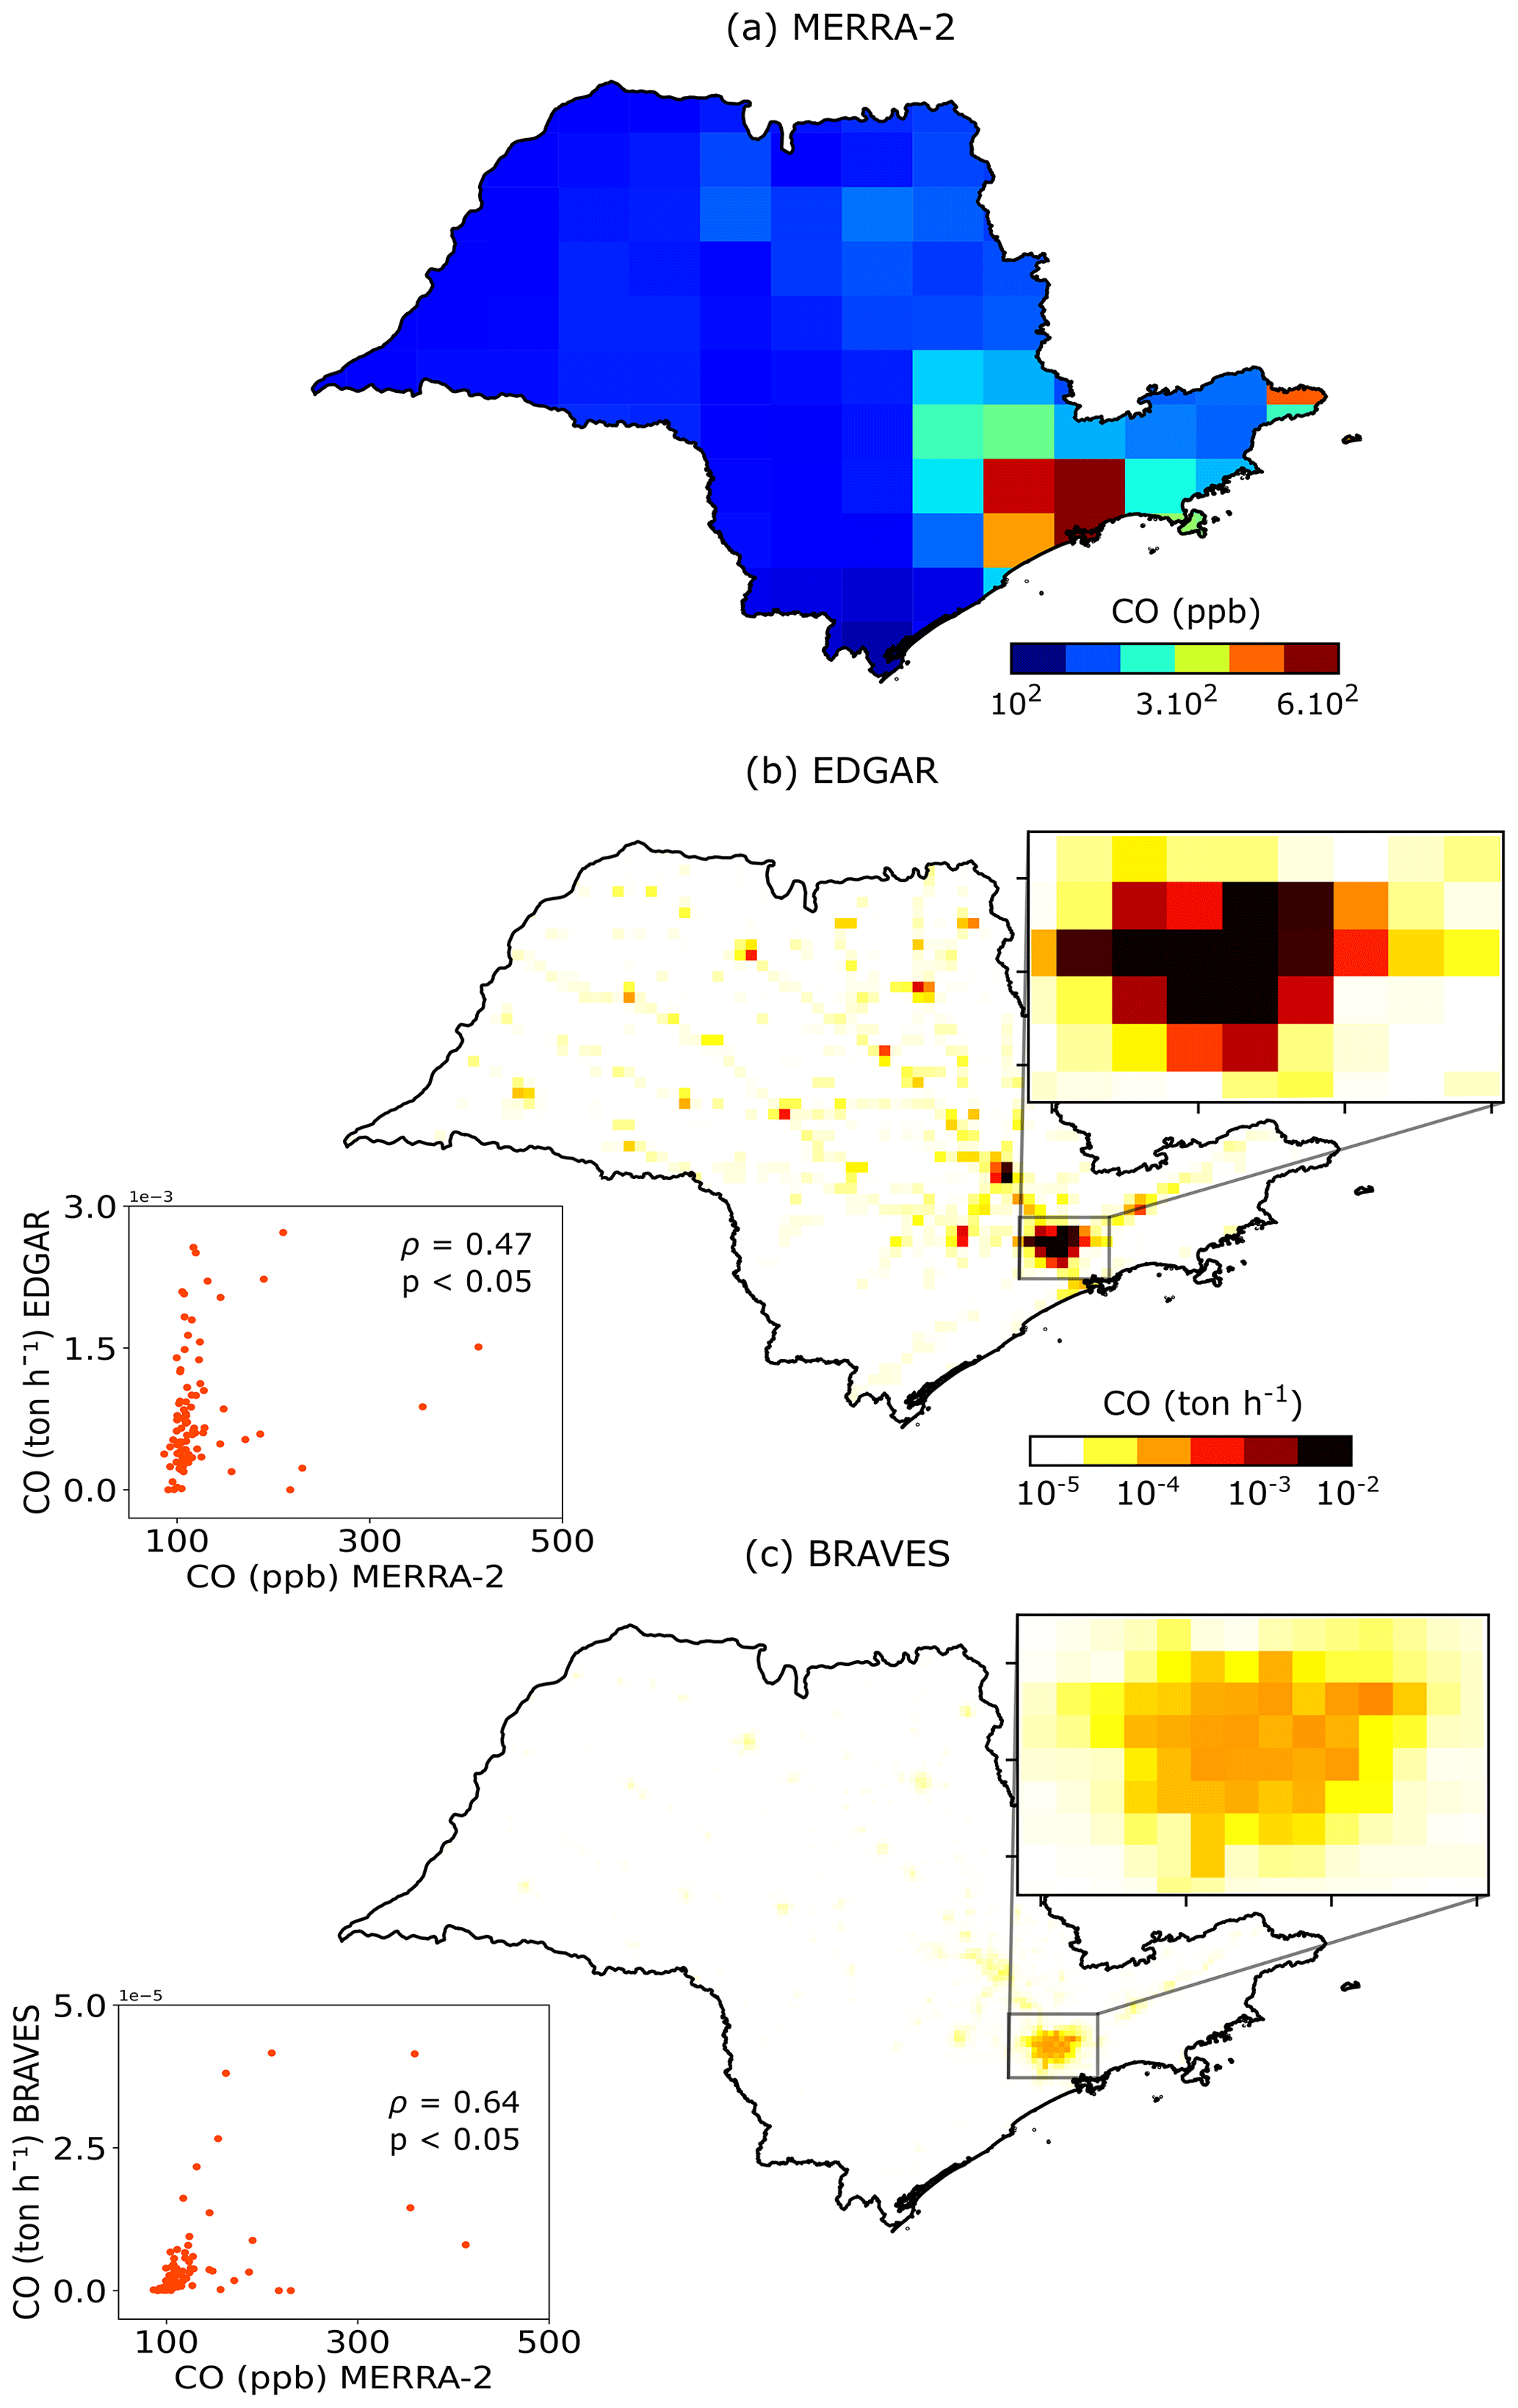
Figure 10CO spatial distribution provided by (a) MERRA-2, (b) EDGAR, and (c) BRAVES. Scatter plots of CO vehicle emission and CO hourly surface concentrations in SP on 1 January 2015 at 08:00 UTC.
The BRAVES database is freely available at https://doi.org/10.5281/zenodo.6588692 (Hoinaski et al., 2022). We provide annual speciated emissions with 0.05×0.05∘ of resolution covering the entire Brazilian territory.
Codes to generate the database are available at: https://github.com/leohoinaski/BRAVES (last access: 7 June 2022; https://doi.org/10.5281/zenodo.6588692, Hoinaski et al., 2022). Using the annual files, users can derive emissions on an hourly basis through the available codes.
Here, we introduce the BRAVES database, the first high-resolution and chemical speciated database of vehicular emissions covering the entire Brazilian territory. The BRAVES database contains emissions of 41 air pollutants, from annual to hourly basis temporal resolution and user-defined spatial resolution. The attributes of this emission database are fully compatible with sophisticated air quality models. Moreover, the emissions of multiple chemical species presented here provide essential information to understand important atmospheric chemistry processes in Brazil. We also provide python scripts for users who want to create their custom gridded inventory.
Even though detailed emission inventories are required to control air pollution, vehicular emissions are scarce in most developing countries. So far, Brazil has lacked a comprehensive and easily accessible database of vehicular emissions, and creating gridded inventories in South America is urgently needed. This work contributes to overcoming this gap.
The spatial correlation analysis reveals that the BRAVES database agrees with the vehicular emissions from EDGAR, even though EDGAR emissions are consistently higher than those of BRAVES. We conclude that this database can be a better alternative to represent the spatial variability of vehicular emissions in Brazil. The BRAVES database has a similar performance representing the spatial pattern of vehicular emissions, with more spatial, temporal, and chemical details when compared with EDGAR. Moreover, the BRAVES database is in closer agreement with local and very detailed emissions inventories. A comparison with the MERRA-2 surface concentration confirms the consistency of the BRAVES database.
Even though the present database is a step forward for air pollution research in Brazil, there are several opportunities for expanding and improving this work. Most heavy-duty emissions occur on high flow and high-speed limit roads, such as expressways. Future versions could improve the spatial disaggregation in pixels containing roads with high traffic flow and high-speed traffic through the optimization of the disaggregation factors. Different criteria for light and heavy vehicles would also be needed. Moreover, the chemical speciation could include profiles to consider the Brazilian reality as biofuels, fleet motorization, and regionalized soil resuspension properties. Temporal variability would also be improved by regionalizing the profiles to account for the traffic flow in each location or by including monthly fuel consumption data. An evaluation using BRAVES database as input in air quality models would bring important information about the model's errors and representativeness. As reported by Nogueira et al. (2021), the emission factors from CETESB used in this work would require future corrections to better represent field measurements.
The supplement related to this article is available online at: https://doi.org/10.5194/essd-14-2939-2022-supplement.
LH and TVV designed the methodology and developed the software. LH, TVV, CBR, and BM processed the data curation, formal analysis, and created the figures. LH, CBR, and BM prepared the original draft and revised the manuscript. LH is the project administrator and laboratory supervisor.
The contact author has declared that neither they nor their co-authors have any competing interests.
Publisher’s note: Copernicus Publications remains neutral with regard to jurisdictional claims in published maps and institutional affiliations.
The authors would like to thank Pedro Luiz Borges Chaffe and the Secretaria de Estado do Desenvolvimento Econômico Sustentável do governo de Santa Catarina.
This research has been supported by the Fundação de Amparo à Pesquisa e Inovação do Estado de Santa Catarina (grant no. 2018/TR/499) (“Avaliação do impacto das emissões veiculares, queimadas, industriais e naturais na qualidade do ar em Santa Catarina.”).
This paper was edited by Nellie Elguindi and reviewed by Sergio Ibarra and one anonymous referee.
Álamos, N., Huneeus, N., Opazo, M., Osses, M., Puja, S., Pantoja, N., Denier van der Gon, H., Schueftan, A., Reyes, R., and Calvo, R.: High-resolution inventory of atmospheric emissions from transport, industrial, energy, mining and residential activities in Chile, Earth Syst. Sci. Data, 14, 361–379, https://doi.org/10.5194/essd-14-361-2022, 2022.
Andrade, M. de F., Kumar, P., de Freitas, E. D., Ynoue, R. Y., Martins, J., Martins, L. D., Nogueira, T., Perez-Martinez, P., de Miranda, R. M., Albuquerque, T., Gonçalves, F. L. T., Oyama, B., and Zhang, Y.: Air quality in the megacity of São Paulo: Evolution over the last 30 years and future perspectives, Atmos. Environ., 159, 66–82, https://doi.org/10.1016/J.ATMOSENV.2017.03.051, 2017.
Anenberg, S. C., Miller, J., Minjares, R., Du, L., Henze, D. K., Lacey, F., Malley, C. S., Emberson, L., Franco, V., Klimont, Z., and Heyes, C.: Impacts and mitigation of excess diesel-related NOx emissions in 11 major vehicle markets, Nature, 545, 467–471, https://doi.org/10.1038/nature22086, 2017.
Atkinson, R.: Atmospheric chemistry of VOCs and NOx, Atmos. Environ., 34, 2063–2101, https://doi.org/10.1016/S1352-2310(99)00460-4, 2000.
Brito, J., Carbone, S., Monteiro Dos Santos, D. A., Dominutti, P., De Oliveira Alves, N., Rizzo, L., and Artaxo, P.: Disentangling vehicular emission impact on urban air pollution using ethanol as a tracer, Sci. Reports, 8, 1–10, https://doi.org/10.1038/s41598-018-29138-7, 2018.
Carvalho, V. S. B., Freitas, E. D., Martins, L. D., Martins, J. A., Mazzoli, C. R., and de Fátima Andrade, M.: Air quality status and trends over the Metropolitan Area of São Paulo, Brazil as a result of emission control policies, Environ. Sci. Policy, 47, 68–79, https://doi.org/10.1016/j.envsci.2014.11.001, 2015.
CETESB, Emissões veiculares no Estado de São Paulo, ano base 2020, ISBN 9786555770315, https://cetesb.sp.gov.br/veicular/wp-content/ (last access: 8 June 2022), 2020.
CNPE: Resolução CNPE No. 16 de 29/10/2018, https://www.legisweb.com.br/legislacao/?id=369098 (last access: 8 June 2022), 2018.
Crippa, M., Guizzardi, D., Muntean, M., Schaaf, E., Dentener, F., van Aardenne, J. A., Monni, S., Doering, U., Olivier, J. G. J., Pagliari, V., and Janssens-Maenhout, G.: Gridded emissions of air pollutants for the period 1970–2012 within EDGAR v4.3.2, Earth Syst. Sci. Data, 10, 1987–2013, https://doi.org/10.5194/essd-10-1987-2018, 2018.
Crippa, M., Guizzardi, D., Muntean, M., Schaaf, E., and Oreggioni, G.: EDGAR v5.0 Global Air Pollutant Emissions. European Commission, Joint Research Centre (JRC) [data set] PID, http://data.europa.eu/89h/377801af-b094-4943-8fdc-f79a7c0c2d19 (last access: 7 June 2022), 2019.
Eyth, A., Strum, M., Murphy, B., Epa, U. S., Shah, T., Shi, Y., Beardsley, R., Yarwood, G., and Houyoux, M.: Speciation Tool User's Guide Version 5.0 Ramboll-Speciation Tool User's Guide, https://www.cmascenter.org/speciation_tool/documentation/5.0/Ramboll_sptool_users_guideV5.pdf (last access: 8 June 2022), 2020.
Gallardo, L., Escribano, J., Dawidowski, L., Rojas, N., de Fátima Andrade, M., and Osses, M.: Evaluation of vehicle emission inventories for carbon monoxide and nitrogen oxides for Bogotá, Buenos Aires, Santiago, and São Paulo, Atmos. Environ., 47, 12–19, https://doi.org/10.1016/J.ATMOSENV.2011.11.051, 2012.
Gelaro, R., McCarty, W., Suárez, M. J., Todling, R., Molod, A., Takacs, L., Randles, C. A., Darmenov, A., Bosilovich, M. G., Reichle, R., Wargan, K., Coy, L., Cullather, R., Draper, C., Akella, S., Buchard, V., Conaty, A., da Silva, A. M., Gu, W., Kim, G. K., Koster, R., Lucchesi, R., Merkova, D., Nielsen, J. E., Partyka, G., Pawson, S., Putman, W., Rienecker, M., Schubert, S. D., Sienkiewicz, M., and Zhao, B.: The Modern-Era Retrospective Analysis for Research and Applications, Version 2 (MERRA-2), J. Clim., 30, 5419–5454, https://doi.org/10.1175/JCLI-D-16-0758.1, 2017.
Gómez, C. D., González, C. M., Osses, M., and Aristizábal, B. H.: Spatial and temporal disaggregation of the on-road vehicle emission inventory in a medium-sized Andean city. Comparison of GIS-based top-down methodologies, Atmos. Environ., 179, 142–155, https://doi.org/10.1016/J.ATMOSENV.2018.01.049, 2018.
Hoinaski, L., Vasques, T. V., Ribeiro, C. B., and Meotti, B.: BRAVES database Version 1.1 (REVISED): multispecies and high spatiotemporal resolution database of vehicular emissions in Brazil, Zenodo [data set], https://doi.org/10.5281/ZENODO.6588692, 2022.
Huneeus, N., Denier van der Gon, H., Castesana, P., Menares, C., Granier, C., Granier, L., Alonso, M., de Fatima Andrade, M., Dawidowski, L., Gallardo, L., Gomez, D., Klimont, Z., Janssens-Maenhout, G., Osses, M., Puliafito, S. E., Rojas, N., Ccoyllo, O. S., Tolvett, S., and Ynoue, R. Y.: Evaluation of anthropogenic air pollutant emission inventories for South America at national and city scale, Atmos. Environ., 235, 117606, https://doi.org/10.1016/J.ATMOSENV.2020.117606, 2020.
Ibarra-Espinosa, S., Ynoue, R., O'Sullivan, S., Pebesma, E., Andrade, M. D. F., and Osses, M.: VEIN v0.2.2: an R package for bottom–up vehicular emissions inventories, Geosci. Model Dev., 11, 2209–2229, https://doi.org/10.5194/gmd-11-2209-2018, 2018.
Instituto de Meio Ambiente e Recursos Hídricos do Espírito Santo (IEMA ES): Inventário de Fontes de Emissões Atmosféricas, https://iema.es.gov.br/qualidadedoar/inventariodefontes/2015 (last access: 8 June 2022), 2019.
Jacob, D. J.: Heterogeneous chemistry and tropospheric ozone, Atmos. Environ., 34, 2131–2159, https://doi.org/10.1016/S1352-2310(99)00462-8, 2000.
Krzyzanowski, M., Kuna-Dibbert, B., and Schneider, J.: Health effects of transport-related air pollution, https://www.euro.who.int/en/publications/abstracts/health-effects-of-transport-re-405lated-air-pollution (last access: 8 June 2022), 2005.
Lyu, M., Bao, X., Zhu, R., and Matthews, R.: State-of-the-art outlook for light-duty vehicle emission control standards and technologies in China, Clean Technol. Environ. Policy, 22, 757–771, https://doi.org/10.1007/s10098-020-01834-x, 2020.
Madrazo, J., Clappier, A., Belalcazar, L. C., Cuesta, O., Contreras, H., and Golay, F.: Screening differences between a local inventory and the Emissions Database for Global Atmospheric Research (EDGAR), Sci. Total Environ., 631–632, 934–941, https://doi.org/10.1016/J.SCITOTENV.2018.03.094, 2018.
Nogueira, T., de Souza, K. F., Fornaro, A., Andrade, M. de F., and de Carvalho, L. R. F.: On-road emissions of carbonyls from vehicles powered by biofuel blends in traffic tunnels in the Metropolitan Area of Sao Paulo, Brazil, Atmos. Environ., 108, 88–97, https://doi.org/10.1016/J.ATMOSENV.2015.02.064, 2015.
Nogueira, T., Kamigauti, L. Y., Pereira, G. M., Gavidia-Calderón, M. E., Ibarra-Espinosa, S., De Oliveira, G. L., De Miranda, R. M., De Castro Vasconcellos, P. D., De Freitas, E. D., and De Fatima Andrade, M.: Evolution of Vehicle Emission Factors in a Megacity Affected by Extensive Biofuel Use: Results of Tunnel Measurements in São Paulo, Brazil, Environ. Sci. Technol., 55, 6677–6687, https://doi.org/10.1021/ACS.EST.1C01006, 2021.
Randles, C. A., da Silva, A. M., Buchard, V., Colarco, P. R., Darmenov, A., Govindaraju, R., Smirnov, A., Holben, B., Ferrare, R., Hair, J., Shinozuka, Y., and Flynn, C. J.: The MERRA-2 Aerosol Reanalysis, 1980 Onward, Part I: System Description and Data Assimilation Evaluation, J. Clim., 30, 6823–6850, https://doi.org/10.1175/JCLI-D-16-0609.1, 2017.
Ribeiro, C. B., Rodella, F. H. C., and Hoinaski, L.: Regulating light-duty vehicle emissions: an overview of US, EU, China and Brazil programs and its effect on air quality, Clean Technol. Environ. Policy, 24, 851–862, https://doi.org/10.1007/S10098-021-02238-1, 2022.
Sawyer, R. F.: Vehicle emissions: progress and challenges, J. Expo. Sci. Environ. Epidemiol., 20, 487–488, https://doi.org/10.1038/jes.2010.44, 2010.
SENATRAN: Frota de Veículos, https://www.gov.br/infraestrutura/pt-br/assuntos/transito/conteudo-Senatran/frota-de-veiculos-2021 (last access: 8 June 2022), 2021 (in Portuguese).
Shindell, D., Faluvegi, G., Walsh, M., Anenberg, S. C., Van Dingenen, R., Muller, N. Z., Austin, J., Koch, D., and Milly, G.: Climate, health, agricultural and economic impacts of tighter vehicle-emission standards, Nat. Clim. Chang., 1, 59–66, https://doi.org/10.1038/nclimate1066, 2011.
Sun, S., Jin, J., Xia, M., Liu, Y., Gao, M., Zou, C., Wang, T., Lin, Y., Wu, L., Mao, H., and Wang, P.: Vehicle emissions in a middle-sized city of China: Current status and future trends, Environ. Int., 137, 105514, https://doi.org/10.1016/j.envint.2020.105514, 2020.
Tuia, D., Ossés de Eicker, M., Zah, R., Osses, M., Zarate, E., and Clappier, A.: Evaluation of a simplified top-down model for the spatial assessment of hot traffic emissions in mid-sized cities, Atmos. Environ., 41, 3658–3671, https://doi.org/10.1016/J.ATMOSENV.2006.12.045, 2007.
Unger, N., Bond, T. C., Wang, J. S., Koch, D. M., Menon, S., Shindell, D. T., and Bauer, S.: Attribution of climate forcing to economic sectors, Proc. Natl. Acad. Sci. USA, 107, 3382–3387, https://doi.org/10.1073/pnas.0906548107, 2010.
US EPA, SPECIATE 5.1 and 5.0 Addendum and Final Report: https://www.epa.gov/air-emissions-modeling/speciate-51-and-50-addendum-and-final-report (last access: 8 June 2022), 2020.
Vasques, T. V. and Hoinaski, L.: Brazilian vehicular emission inventory software – BRAVES, Transp. Res. Part D Transp. Environ., 100, 103041, https://doi.org/10.1016/J.TRD.2021.103041, 2021.
Yarwood, G., Jung, J., Whitten, G. Z., Heo, G., Mellberg, J., and Estes, M.: Updates to the Carbon Bond Mechanism for version 6 (CB6), 9th CMAS Conference, Chapel Hill, NC, October 11–13, https://www.cmascenter.org/conference/2010/agenda.cfm (last access: 22 June 2022), 2010a.
Yarwood, G., Whitten, G. Z., Jung, J., Heo, G., and Allen, D. T.: Final Report Development, Evaluation and Testing of Version 6 of the Carbon Bond Chemical Mechanism (CB6), https://www.tceq.texas.gov/assets/public/implementation/air/am/contracts/reports/pm/5820784005FY1026-20100922-environ-cb6.pdf (last access: 22 June 2022), 2010b.
- Abstract
- Introduction
- Vehicular emissions data
- Spatial disaggregation
- Temporal disaggregation
- Chemical speciation
- The database and codes
- Comparison with independent databases
- Data availability
- Code availability
- Conclusions
- Author contributions
- Competing interests
- Disclaimer
- Acknowledgements
- Financial support
- Review statement
- References
- Supplement