the Creative Commons Attribution 4.0 License.
the Creative Commons Attribution 4.0 License.
 | 10 Jun 2022
The CISE-LOCEAN seawater isotopic database (1998–2021)
Gilles Reverdin
Claire Waelbroeck
Catherine Pierre
Camille Akhoudas
Giovanni Aloisi
Marion Benetti
Bernard Bourlès
Magnus Danielsen
Jérôme Demange
Denis Diverrès
Jean-Claude Gascard
Marie-Noëlle Houssais
Hervé Le Goff
Pascale Lherminier
Claire Lo Monaco
Herlé Mercier
Nicolas Metzl
Simon Morisset
Aïcha Naamar
Thierry Reynaud
Jean-Baptiste Sallée
Virginie Thierry
Susan E. Hartman
Edward W. Mawji
Solveig Olafsdottir
Torsten Kanzow
Anton Velo
Antje Voelker
Igor Yashayaev
F. Alexander Haumann
Melanie J. Leng
Carol Arrowsmith
Michael Meredith
The characteristics of the CISE-LOCEAN seawater isotope dataset (δ18O, δ2H, referred to as δD) are presented (https://doi.org/10.17882/71186; Waterisotopes-CISE-LOCEAN, 2021). This dataset covers the time period from 1998 to 2021 and currently includes close to 8000 data entries, all with δ18O, three-quarters of them also with δD, associated with a date stamp, space stamp, and usually a salinity measurement. Until 2010, samples were analyzed by isotopic ratio mass spectrometry and since then mostly by cavity ring-down spectroscopy (CRDS). Instrumental uncertainty in this dataset is usually as low as 0.03 ‰ for δ18O and 0.15 ‰ for δD. An additional uncertainty is related to the isotopic composition of the in-house standards that are used to convert data to the Vienna Standard Mean Ocean Water (VSMOW) scale. Different comparisons suggest that since 2010 the latter have remained within at most 0.03 ‰ for δ18O and 0.20 ‰ for δD. Therefore, combining the two uncertainties suggests a standard deviation of at most 0.05 ‰ for δ18O and 0.25 ‰ for δD.
For some samples, we find that there has been evaporation during collection and storage, requiring adjustment of the isotopic data produced by CRDS, based on d-excess (δD − 8×δ18O). This adjustment adds an uncertainty in the respective data of roughly 0.05 ‰ for δ18O and 0.10 ‰ for δD. This issue of conservation of samples is certainly a strong source of quality loss for parts of the database, and “small” effects may have remained undetected.
The internal consistency of the database can be tested for subsets of the dataset when time series can be obtained (such as in the southern Indian Ocean or North Atlantic subpolar gyre). These comparisons suggest that the overall uncertainty of the spatially (for a cruise) or temporally (over a year) averaged data is less than 0.03 ‰ for δ18O and 0.15 ‰ for δD. However, 18 comparisons with duplicate seawater data analyzed in other laboratories or with other datasets in the intermediate and deep ocean suggest a larger scatter. When averaging the 18 comparisons done for δ18O, we find a difference of 0.082 ‰ with a standard error of 0.016 ‰. Such an average difference is expected due to the adjustments applied at LOCEAN to saline water data produced either by CRDS or isotope ratio mass spectrometry (IRMS), but the scatter found suggests that care is needed when merging datasets from different laboratories. Examples of time series in the surface North Atlantic subpolar gyre illustrate the temporal changes in water isotope composition that can be detected with a carefully validated dataset.
- Article
(1419 KB) - Full-text XML
- BibTeX
- EndNote


Stable isotope analyses of ocean water (δ18O, δ2H later referred to as δD) were first discussed by Craig and Gordon (1965) as tracers of water masses and of the different components of the global hydrological cycle, in particular the signals gained through evaporation, precipitation, the interaction with sea ice, and continental water inputs, for example from the ice caps of Greenland and Antarctica and their ice shelves. Seawater stable isotopes have been used to verify the circulation in ocean models and to characterize processes controlling their spatial variability (Xu et al., 2012). Seawater isotopes have also been used to provide information on the controls of the oxygen isotopic ratio of calcite plankton shells in order to reconstruct past ocean salinity and circulation. The GEOSECS program (Östlund et al., 1987) provided the first consistent global dataset of seawater isotopes, but with limited data coverage. The Global Seawater Oxygen-18 Database at NASA GISS (Schmidt et al., 1999) has assembled most water isotope data collected prior to 1998, with an effort to homogenize the dataset, when possible, by estimating biases based on multiple measurements of deep-water samples (Schmidt, 1999; Bigg and Rohling, 1999). A large part of the early analyses was done by isotope ratio mass spectrometry (IRMS) and more recently using cavity ring-down spectrometry (CRDS). Walker et al. (2016) illustrated that the two measurement techniques can provide equivalent results with no obvious biases.
Since 1998, the isotopic platform facility at LOCEAN (later “CISE-LOCEAN”) has measured seawater isotopic composition of samples collected on a series of oceanographic cruises or ships of opportunity, mostly in the North Atlantic, the equatorial Atlantic, the southern Indian Ocean, and the Southern Ocean. This dataset of δ18O and δD of marine water covers the period 1998 to 2021 and is ongoing. Most data prior to 2010 (only δ18O) were produced using an Isoprime IRMS coupled with a Multiprep system (dual inlet method), whereas most data collected since 2010 (and a few earlier data) were obtained by CRDS, usually with a Picarro L2130-i or less commonly a Picarro L2120-i. Occasionally, some samples were also run on an Isoprime IRMS coupled to a GasBench (dual-inlet method) at the university of Iceland (Reykjavik). There are also a few pairs of samples measured on both systems. Most of these LOCEAN data are not currently included in the Global Seawater Oxygen-18 Database at NASA GISS (Schmidt et al., 1999), except for the 1998 OISO cruise data (note that earlier datasets measured by co-author C. Pierre on other mass spectrometers preceding the current IRMS are included in the NASA GISS database). Subsets of the LOCEAN data have been used in publications (Akhoudas et al., 2020, 2021; Benetti et al., 2015, 2017a, b, 2019; Reverdin et al., 2019), with the subsets corresponding to measurements at LOCEAN over a short period with specific instrumental and analysis protocols. A regional surface North Atlantic subset of the data was also presented in Reverdin et al. (2018a).
Here, we review the errors and uncertainties in this published dataset (Waterisotopes-CISE-LOCEAN, 2021) and the extent to which the overall dataset of δ18O, δD, and d-excess (d-excess =δD O) presented as ‰ versus VSMOW is internally consistent. We will also discuss how the CISE-LOCEAN seawater isotopic database compares with other datasets, in particular NASA GISS, and provide some overall statistics on the number of data and their distribution.
We will first review the different sources of uncertainties relevant for this dataset, before discussing the scale used and correction and flagging of data.
Uncertainties in the data reported originate from the water collection and storage in bottles (Sect. 2.1), the uncertainties resulting from the experimental laboratory setup and analysis protocols (Sect. 2.2), and the uncertainties in the internal standards which are used in the experimental setup (Sect. 2.3).
2.1 Collection and storage
At LOCEAN, we have mostly used glass-tinted bottles (volume 20 or 30 mL) with a hard cap including an internal rim to minimize water exchange through the cap (referred to later on as a “common” cap). No independent internal stopper or insert is used, and the bottles are not collected full. For some, but not all, cruises, the cap has been secured with parafilm after sample collection. When arriving in the laboratory, samples are commonly stored in a cold room or in a refrigerator at 4 ∘C, except when the analysis is expected within 3 months after the arrival of the samples. The analysis has commonly been done within 1 year to 18 months after collection, and for some subsets such as for SURATLANT (Reverdin et al., 2018a) the analysis was usually done within 3 months after collection. However, due to various changes at LOCEAN, there has been a long backlog at times, with some samples having been stored in the cold room for 5 years or more. The longest storage time was for OISO-18 data collected in 2010 and analyzed 9 years later in 2019. Storage time was also very long for most samples from cruises OISO-21, OISO-22, OISO-23, OISO-25, and OISO-26 (southern Indian Ocean, 2012 to 2016). Before analysis, samples are checked for obvious signs of evaporation, such as low water level or salt crystals around the bottle's neck.
We tested whether the samples in common cap bottles change during storage by aging three reference waters of the same deep equatorial Atlantic origin over 2 years in a laboratory room which is not air-conditioned and without securing the common caps with parafilm. Water is extracted every 3 months for isotopic analysis, which so far over 23 months has not revealed any significant drift, certainly not larger than 0.02 ‰ in δ18O and 0.1 ‰ in δ D. We expect that drifts would be even smaller when samples are stored at 4 ∘C or with parafilm if the caps are properly tightened.
In 2019, new caps were introduced which were not rigid and would often not provide a tight seal, with very large sample evolution over less than a year, sometimes reaching close to 1 ‰ in δ18O. This was the case in particular for the samples collected on M/V Nuka Arctica in April 2019, resulting in 32 % of samples with suspected water vapor exchange (indicated by unexpected low d-excess and high δ18O; we verified this hypothesis by aging water in bottles with this cap, which also showed large drifts after 3 months at room temperature).
Even for bottles with the common caps, issues of poor conservation have been suspected in some cases, in particular after long storage (typically, for 5 years or more). There is also the possibility that water vapor exchange has happened during transport, in particular when the samples have experienced very high temperatures, for instance for cruises ending in tropical ports and with long storage times in containers. This issue was probably the case for samples from the EUREC4A-OA cruise collected in February 2020 (Stevens et al., 2021) with an almost 2-month storage period in a container placed without sun shielding in Pointe-à-Pitre (Guadeloupe, France), for which close to 22 % of the bottles with no parafilm securing the cap are suspected to have signs of evaporation (during analysis, we noticed that the cap was often not tightly closed; their isotopic values also contrasted with the ones from special tightly closed nutrient vials pasteurized at 80 ∘C for 40 min after collection that did not present any anomalous d-excess). There are also other subsets with data presenting obvious evaporation issues. The extreme case is for samples collected on M/V Nuka Arctica in 2018 and 2019, for which we suspect evaporation for 20 % of the water samples. In this case, the water was transferred from salinity bottles during the salinity analysis to be stored in bottles with the common cap, where they stayed for close to 18 months before analysis.
2.2 Laboratory measurements
2.2.1 Method and protocol of analysis
Until 2010 and later in exceptional cases, the seawater sample δ18O values were directly measured on an Isoprime IRMS coupled to a Multiprep system (dual inlet method). A typical run lasted more than 24 h, with a few in-house standards interspersed in the run. Drifts in the values corresponding to the internal standard used at the time (“Eau de Paris”, referred to as EDP) were corrected for, assuming that the correction is not dependent on salinity or isotopic value. When checking the records, we found that δ18O drifts between successive EDP samples were often larger than 0.05 ‰. Uncertainty in correcting these drifts is probably on the order of 0.05 ‰.
Since late 2011, CRDS has been used, which simultaneously measures the sample δ18O and δD. Each sample is vaporized, then injected in the cavity, a process repeated 6 to 12 times. The average and standard deviation (SD) of the sample's δ18O and δD are computed out of the last (two to eight) injections after stabilization is reached (Skrzypek and Ford, 2014). This technique is applied to minimize the contamination from the previous sample, even though such memory effects should be small, in particular for δ18O (Lis et al., 2008; Skrzypek and Ford, 2014; Vallet-Coulomb et al., 2021). The SD computed for the two to eight selected injections is taken as an estimate of the instrumental error in the sample's δ18O and δD measurements.
When a Picarro CRDS was first used at LOCEAN between 2011 and 2015, samples were distilled, and the measurement was thus done on fresh water (see Benetti et al., 2017c, for the average effect of the distillation on isotopic composition). Since 2016, seawater samples have been most often directly measured using a wire mesh (liner) to limit the spreading of sea salt in the vaporizer (https://www.picarro.com/sites/default/files/Salt%20Liner%20App%20Note_180323_final.pdf, last access: November 2021).
We most commonly used a Picarro L2130-i CRDS, but at times, a Picarro L2120-i CRDS was used, resulting in a larger standard deviation, in particular for δD. On both CRDS analyzers, when repeatability of the different injections of the sample was not sufficient or the daily run presented an unacceptably drift, the samples were analyzed at least a second time. In that case, either the best value or an average of the different values was retained.
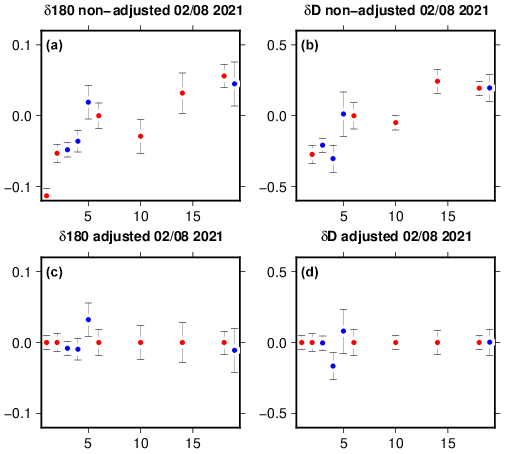
Figure 1A typical run (on 2 August 2021) of 19 samples using three internal standards and Kona Deep water samples (left for δ18O and right for δD). Top panels (a, b): the deviations of isotopic values (‰) of internal standards (in blue) and of the Kona Deep water samples (in red) relative to their expected values (horizontal axis is sample number). Error bars are the standard deviation of the different injections, and the vertical scale is arbitrarily set so that 0 corresponds to Kona Deep sample 6 (after the three internal standards). The lower panels (c, d) present the values obtained after adjusting for the drifts identified with the Kona Deep water samples through the run.
The typical daily run at LOCEAN currently includes one or two reference water samples followed by three freshwater standards at the beginning to establish a slope calibration, as well as regularly interspersed reference water samples afterwards (usually, from Kona Deep mineral water with a value close to 0.8 ‰ in δ18O and 2.0 ‰ δD). In addition to these freshwater in-house reference materials, a series can contain up to 12 isotopically uncharacterized water samples using a little over 1 mL of the sample placed in a cap-closed vial. Until 2015, when samples were distilled, series typically included 12 water samples. Since 2015, when salt water was directly placed in the vials, we have mostly used not more than nine samples in a run because the deposit of salt in the liner induces water retention or release and thus noise in the measurements after roughly 60 injections of salty samples, as well as drifts in the reference water (Fig. 1a and b) and possibly slope calibration. Another source of drift is the appearance of condensation on the top cap of the vials after a few hours, which will result in enriching the residual vial water, although it is very likely a small source of drift.
Each seawater sample is injected 6 times, and the internal standards are injected usually 9 to 12 times at the beginning and end of the run. Whenever possible, samples expected to be in the same range of values are placed together in the run to minimize the memory effect on the CRDS, which is largest for δD. We reject the first injection, as well as later injections if they are not stable, retaining between two and eight injections that we average. Two methods were tested: an empirical one when we look for successive injections of the sample with close values (typically 0.02 ‰ in δ18O) and the systematic selection of the values within 1 SD starting with the last three injections. The retained injection values are then averaged. Differences in the estimates produced by the two methods are usually within 0.02 ‰ in δ18O (0.10 ‰ in δD for the L2103-i). In the current database, the data retained are the ones obtained with the empirical approach.
If a significant drift in the reference water values is noticed throughout the run, it is corrected, usually by adjusting the data linearly between the successive values of the reference water (Fig. 1c and d). We thus assume that the estimated drift is independent of the δ18O and δD values. In addition, between 2017 and 2019, the response slope of the Picarro CRDS was adjusted by interpolating between the three-point slope estimate (based on three internal standards) at the beginning and at the end of the runs when that was deemed possible. However, this adjustment was discontinued in 2020 because the last internal standard samples were often not as reliably measured, with values more sensitive to the number of injections, probably as a result of salt deposits in the liner. Since 2020, we have only checked the instrument's response at the end of the run with one of the freshwater internal standards.
Accuracy is best when samples are distilled, and for δD it is better on the Picarro CRDS L2130-i compared to the Picarro CRDS L2120-i. Usually, the reproducibility of the δ18O measurements between the different selected injections is within ±0.05 ‰ and reproducibility of the δD measurements is within ±0.15 ‰, which should be considered an upper estimate of the random error in a measurement with the Picarro L2130-i CRDS. Samples with an SD larger than 0.06 ‰ in δ18O were considered too uncertain and were rerun, as were often (after 2015) the first and last samples of each run.
In addition to the instrumental error of each sample's δ18O and δD value described above, other uncertainties arise from the data processing and conversion of measured δ18O and δD to the Vienna Standard Mean Ocean Water (VSMOW) scale. These additional sources of uncertainties are detailed in the next sections.
2.2.2 Data processing
For the Picarro CRDS, a second source of uncertainty is due to the way we process the data from a daily run with salty water samples. As mentioned above, we first adjust the values to compensate for the drift in reference water. Usually, this drift during the run is relatively small, not exceeding 0.10 ‰ in δ18O and 0.6 ‰ in δD, but in about 10 % of the runs, it exceeded 0.20 ‰ in δ18O over the whole run or 0.10 ‰ in δ18O over successive reference water samples (23 out of 214 daily runs over which statistics were established from June 2020 to April 2021). When these large changes are encountered, the run is estimated as noisy and is usually rerun. However, even for the other runs, a drift is usually observed with salty samples, and it often is a positive drift, in particular between the reference water samples before and after the three initial internal standards (Fig. 1a and b). The average (SD) drift in reference water during a run was +0.081 ‰ (0.106 ‰) in δ18O and +0.62 ‰ (0.53 ‰) in δD in the 191 (out of 214) daily runs retained. The drift is also found in the internal standard water analyzed at the end of the run compared with the one analyzed just after the initial reference waters with an average (SD) drift of +0.069 ‰ (0.073 ‰) in δ18O, and +0.43 ‰ (0.34 ‰) in δD for the same 191 daily runs subset. These values slightly differ from the drifts for the reference water, which at the 99 % confidence level is not significant for δ18O but significant for δD. This may be indicative of errors resulting from linearly adjusting the drift, in particular for the initial standard water samples. This suspicion of a slight nonlinearity in the initial drift is reinforced by seven runs in 2020 and 2021 when the three standards were also measured at the end of the run. However, correcting for a nonlinear drift is too uncertain, and a correction has not been attempted. The nonlinear drift, in addition to being a source of random error (at least 0.02 ‰ in δ18O and 0.1 ‰ in δD) for individual runs, might also contribute to absolute errors (i.e., on the VSMOW scale) in the range of 0.01 ‰ in δ18O and 0.05 ‰ in δD.
Occasionally, after the correction of the drift, the value of the last internal standard (last sample port of the run) is shifted for no obvious reason, sometimes by more than 0.10 ‰ in δ18O from what is expected. This shift might result from temporary pollution that influences the measurements (organic matter or particles either left in the cavity of the vaporizer, on the filter, or on the salt liner), which can also happen for other sample ports. Often, when this happens, there is also a larger scatter between the different injections either for this sample or the initial in-house standards. Running the set of samples again or a selection of them sometimes evidences isotopic shifts that can exceed 0.05 ‰ in δ18 and 0.2 ‰ in δD. Repeating the analysis helps mitigate this source of uncertainty. But, this has not always been done, except for datasets on which there was a specific emphasis.
Table 1Comparison of standards measured at LOCEAN and in other laboratories (in ‰). The 2013–2014 laboratory comparisons took place at LSCE (France), LDEO (Columbia University, USA), NIOZ (Netherlands), VRIJE (Brussels, Belgium), Dalhousie Univ (Dalhousie, Canada), BGS (Nottingham, UK), U. Ottawa (Ottawa, Canada), and in 2018–2019, at Geozentrum Nordbayern (Erlangen, Germany), AWI (Bremerhaven, Germany), U. Kiel (Kiel, Germany), LSCE (France), and U. Bergen (Bergen, Norway).

2.3 Internal standard waters
The last large source of uncertainty is the value (on the VSMOW scale) attributed to the internal standards used. On the Isoprime IRMS, most internal standards were extracted from different batches of Eau de Paris (EDP) stored in a tank covered with paraffin, whereas since 2012, three internal standards have been regularly extracted from metal tanks in which they are kept for up to 5–6 years with a slight overpressure of dry air (following Gröning, 2018, TEL Technical Note No. 03). The internal standards have been calibrated using VSMOW and GISP (or GRESP), usually more than once, and some were also sent to other laboratories at different times to independently evaluate their characteristics. Comparisons were done in 2013 and 2014 for three internal LOCEAN standards with six laboratories for δ18O and four laboratories for δD, which, taken together, did not reveal an average bias larger than 0.01 ‰ for δ18O or 0.10 ‰ for δD. However, there seem to be differences for the individual standards (Table 1), with the one at −3.26 ‰ for δ18O and −21.32 ‰ for δD presenting an average positive difference of +0.029 ‰ for δ18O and +0.19 ‰ for δD, whereas the other two present a negative difference (i.e., LOCEAN standards seemed too low) smaller than or equal to −0.01 ‰ for δ18O and −0.19 ‰ for δD.
The next round of comparisons of the LOCEAN internal standards took place between 2019 and 2021 with five other European laboratories, and for two of them, there were two different setups for δ18O (most of those with IRMS, except for one with a PICARRO L2130-i CRDS). Thus, this includes seven comparisons for δ18O and five for δD. This set of comparisons (Table 1) was done for the three internal standards used in 2019–2021 and presents a large scatter between the different laboratories, with standard deviation on the order of 0.055 ‰ in δ18O and 0.7 ‰ in δD. As the differences between laboratories are similar for the three internal standards, this comparison suggests some systematic differences between laboratories. However, the large scatter implies that the average differences found are very uncertain. The differences in δ18O and δD found for the three internal standards used in 2019–2021 range between +0.029 ‰ in δ18O and +0.21 ‰ in δD for the less enriched standard to −0.010 ‰ in δ18O and +0.02 ‰ in δD for the most enriched one, respectively (Table 1). This comparison might indicate that we have a positive bias for two of our recent internal standards, which would also produce a small difference in the response slopes of the Picarro CRDS adopted since 2020. A set of four calibration runs done in November 2021 at LOCEAN using new VSMOW, GRESP, and three USGS standards with intermediate values confirmed a positive bias in the most negative internal standard (MIX2). This run, however, did not confirm the average biases in the other internal standards at LOCEAN suggested by Table 1, nor any major slope error. Therefore, the correction of a systematic bias has only been applied to the MIX2 value for analyses since August 2020. For some internal standards, we witnessed larger differences for measurements done in June 2020 after the L2130-i just returned from a cruise with long shipping and storage for more than 9 months. We assume that this anomaly is instrumental and did not last for a long time, as the anomaly was not reproduced during later tests in August 2020 or in November 2021.
The two storage methods used successively for internal standard waters were designed to minimize water vapor exchange. It is, however, possible that small isotopic drifts of the internal standards have taken place with time due to evaporation or possible oxidation of the tanks (rust was found in one nearly empty tank). As mentioned, based on different comparisons over time, sometimes on remnants of the tank waters, we could verify that these drifts have remained smaller than 0.02 ‰ in δ18O and 0.1 ‰ in δD. Finally, standards for the daily runs are temporarily stored for up to a month in glass bottles at 4 ∘C, which are briefly opened every day to extract water. Through its storage life, this water will slightly exchange with the outside air that penetrates when the bottle is briefly opened. Back-of-the-envelope estimates suggest that the effect should be less than 0.01 ‰ in δ18O and 0.05 ‰ in δD, even after a month.
2.4 Concentration scale
Both oxygen and hydrogen isotope compositions are reported in parts per thousand (‰) on the VSMOW scale. One issue is that we analyze saline samples, while the internal standards are freshwater standards, and the method of analysis has changed over time. There is still a large uncertainty in the correction to be applied to account for the effect of salt on IRMS and CRDS seawater analyses. Here we have applied the corrections provided by Benetti et al. (2017c). Note that in some instances IRMS and CRDS analyses of the same seawater samples may yield similar values. For example, Walker et al. (2016) found very close δ18O values in unadjusted measurements of seawater samples from the same water mass done on different IRMS and CRDS instruments. We have adjusted LOCEAN CRDS and IRMS data on the concentration scale based on the study of Benetti et al. (2017c) as well as on complementary tests with the different wire meshes used more recently and between duplicated IRMS–CRDS samples. The values we report are thus internally consistent but could present differences with datasets processed in other institutions without this proposed adjustment or with other changes of scale of up to 0.10 ‰ in δ18O and 0.20 ‰ in δD, as indicated in Benetti et al. (2017c). We thus expect that adjusted LOCEAN CRDS δ18O data would be higher (more enriched in heavy isotopes) than these other CRDS and more common IRMS data.
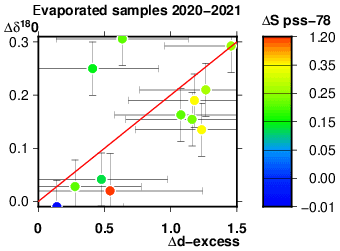
Figure 2Scatter diagram of the deviation of δ18O (‰) versus the deviation of d-excess (‰) for a set of samples extracted from salinity bottles with no plastic inserts that had evaporated (2021, mostly from MV Tukuma in the North Atlantic). The deviations are estimated by subtracting the isotopic value estimated as a function of practical salinity from the isotopic data based on the other regional data. The error bars on each sample are the standard deviation between the different injections, assuming that the standard deviations of δ18O and δD are independent when estimating d-excess. The red line is the regression used in Benetti et al. (2016).
2.5 Correction and flagging of samples having probably breathed
In regions where there is enough information in the LOCEAN dataset to establish an average relationship between d-excess and salinity (Benetti et al., 2017b), a large breathing of a sample during storage can be detected using its d-excess value, which is then too low compared to the expected relationship. This was recently checked on a set of 10 water samples originating from salinity bottles collected in the surface North Atlantic in 2021 on MV Tukuma Arctica that did not have the usual plastic insert and thus had evaporated as witnessed by the comparison of salinity with thermosalinograph records. These samples indeed present higher practical salinity (S), d-excess lower than expected, and δ18O and δD higher than the expected values, estimated by average linear fits of d-excess versus salinity and δ18O versus S for this region. The average values of the deviations are , Δδ18O ‰, ‰, and Δd-excess ‰. The deviations from these expected values present a loose relationship with the deviation in δ18O (Δδ18O) on the order of −20 % of the deviation of d-excess (Δd-excess) (Fig. 2). This relationship is close to the one used by Benetti et al. (2017b) based on other data in the Labrador Sea, where Δδ18O Δd-excess, ΔδDO, and Δd-excess S. On the other hand, the correlation between Δd-excess and ΔS is not significantly different from 0, which might be caused by uncertainties in sampling time causing errors in estimating salinity deviation.
In cases when breathing was not too large (resulting in an increase of less than +0.11 ‰ in δ18O), we used the deviation from the expected d-excess relationship to S to estimate an adjusted δ18O and δD (Benetti et al., 2017b). When this method is used, δ18O and δD data are flagged to “probably good” and d-excess to probably bad, as these data are certainly not as accurate as the data with no “correction”, with the adjustment adding an uncertainty on the order of 0.05 ‰ in (δ18O and 0.10 ‰ in δD). For larger suspected evaporation, δ18O and δD data are not adjusted and flagged as “probably bad”. Altogether, we have flagged 12.3 % of the CRDS-measured samples, most of which (11.3 %) correspond to data with anomalously low d-excess and thus suspected evaporation. There is of course also the possibility that for some samples (for 1 % of the samples), d-excess that is too low or too high might just result from an occasional large uncertainty in the analysis.
We recently tested the effectiveness of applying this adjustment for 32 samples collected during cruise OVIDE2018 (North Atlantic Ocean in 2018; Lherminer, 2018) which were stored in two sets of bottles. One set of bottles was analyzed by CRDS at LOCEAN and the other set by IRMS for δ18O at Geozentrum Erlangen. Among the 32 LOCEAN samples, 11 show indications of breathing and have been slightly adjusted based on their negative d-excess deviation. The comparison between the 32 LOCEAN and Geozentrum Erlangen isotopic values suggests that the adjustment we applied to 11 of the LOCEAN data results in decreasing the standard deviation of the δ18O differences between the two sets from 0.060 ‰ to 0.041 ‰. The adjustment of the 11 LOCEAN samples also decreased the standard deviation in the differences between d-excess and d-excess estimated from the d-excess versus S relationship derived for the entire LOCEAN dataset from 0.25 ‰ to 0.15 ‰. As a comparison, when the set is restricted to the 21 non-adjusted LOCEAN samples, the corresponding standard deviations for the δ18O differences between LOCEAN and Geozentrum Erlangen values and the d-excess differences to the expected d-excess versus S relationship were 0.043 and 0.14 ‰, respectively. These values are very close to what is found for the set of 32 LOCEAN samples including the 11 adjusted samples, suggesting some homogeneity in the adjusted dataset.
For earlier IRMS analyses at LOCEAN, we base the identification of possible evaporated data on excessive scatter in the δ18O versus S scatter plots or between successive data compared to what we have previously measured in regions with repeated cruises, and outliers (6 %) are flagged as probably bad. The smaller (by half) proportion of flagged IRMS analyses than for the CRDS analyses suggests either that this validation missed some evaporated IRMS samples, that these earlier data had evaporated less than the more recent ones (some were analyzed sooner after collection), or that the IRMS runs had smaller uncertainties than the latter CRDS runs.
As discussed in Sect. 2, in addition to random errors or to issues related to evaporation of samples, there is the possibility of shifts between subsets of the data due to the different internal standard waters, methods of processing, and adjustment (for CRDS) or conversion from the activity to the concentration scale (for IRMS). We thus need to compare this database with data analyzed in other laboratories and evaluate time series when the data have been repeated in time at the same location. In particular, the LOCEAN dataset contains a limited number of samples for different cruises in deep-water masses that are unlikely to have experienced much change in their isotopic composition over the last 50 years due to their weak ventilation and small salinity variability. Examining data in such deep waters can thus provide a test of consistency between subsets of the LOCEAN data or relative to other datasets.
Table 2Comparison of LOCEAN annually averaged data in a few selected deep-water masses which exhibit little variability in their salinity and have likely not been recently ventilated. S, δ18O, δD, and d-excess values are first averaged for each year. The values reported are the mean and standard deviations of these yearly averages. The number of years (N years) refers to the δ18O data. 1: OISO cruises (1998 to 2021) near 1000–1500 m in the southern Indian Ocean Antarctic sector of the Southern Ocean (50–58∘ S) (1998a, 2002a, and most years since 2010). 2: OISO cruises (1998 to 2021) near 2000 m in the western–southern Indian Ocean subtropical gyre (1998a, 2002a, and most years since 2010). 3: PIRATA and EGEE cruises (2005–2021) near 1000 m in the eastern equatorial Atlantic (2005a, 2006a, 2007a, 2015, 2020, 2021). 4: OVIDE and RREX2017 data between 2000 and 3500 m in the eastern North Atlantic subpolar gyre (data in 2002a, 2016, 2017, 2018, 2021).
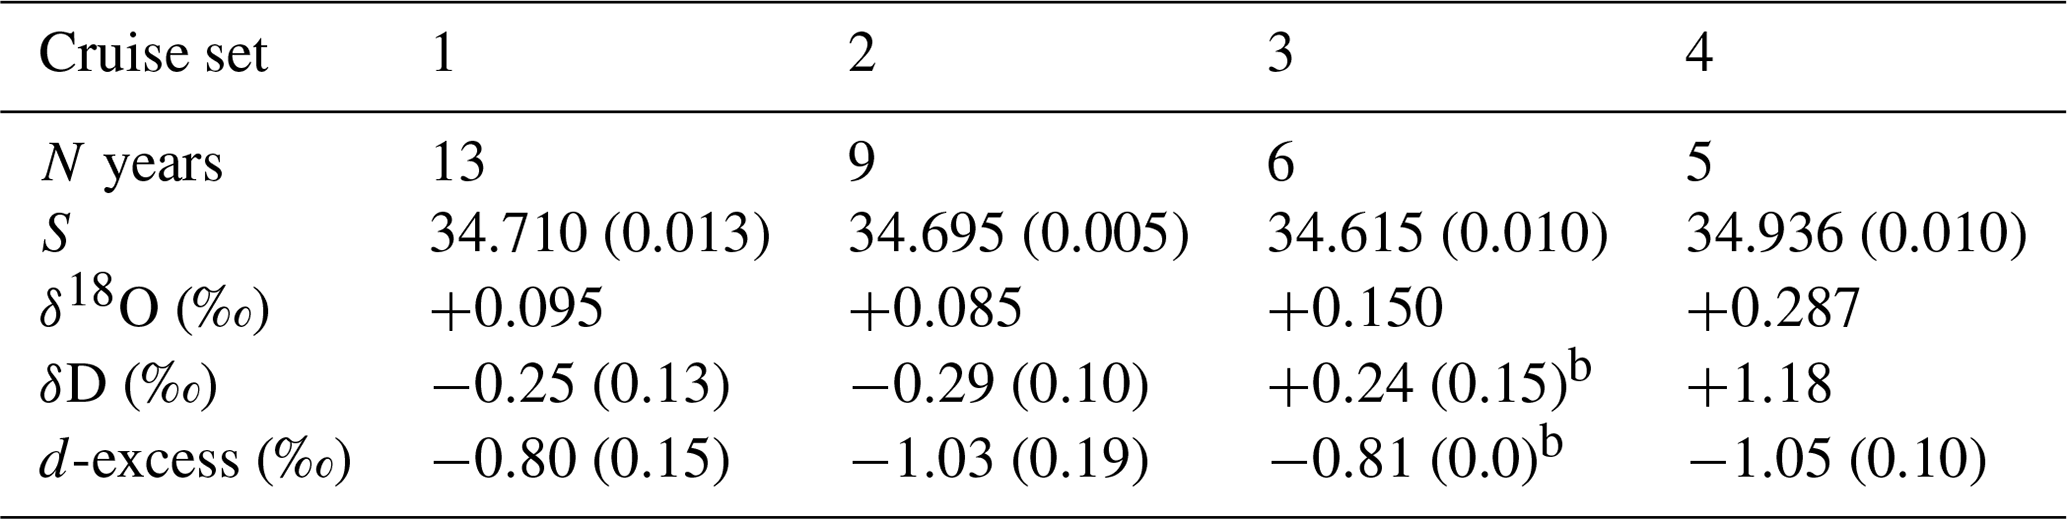
a IRMS estimates for δ18O only. b Only 2 years.
Within the LOCEAN dataset, relevant deep waters have been sampled in different years (in the southern Indian Ocean – OISO cruises, in the equatorial Atlantic – PIRATA cruises, and in the North Atlantic subpolar gyre – mostly OVIDE cruises), with statistics presented in Table 2. These comparisons on a limited set of cruises, but corresponding to analyses done throughout the last 22 years of the spectrometry platform, suggest that internally the δ18O dataset is coherent in time to within 0.035 ‰ (after an adjustment applied to LOCEAN IRMS data, which most of the time was +0.09 ‰ to adjust to CRDS data). For δD, the period of comparison is more limited with data from Picarro CRDS only since 2010, and the standard error of yearly δD averages is typically on the order of 0.15 ‰. The comparison also highlights cruises with more noisy data than others. This is, for example, the case of the 2002 OISO08 IRMS data; without the OISO08 data, the mean (standard error) δ18O for subset 1 decreases to +0.078 (0.030 ‰). There are also some suggestions of systematic differences between cruises (for example, for subsets 1–2, OISO29 samples from 2019 tend to have lower δ18O and δD values, whereas OISO31 samples from 2021 tend to have higher values). However, this is within the uncertainties of the means and is not fully understood. Thus, no further correction is warranted.
There are δ18O data from a few cruises sampling deep waters, which can be compared with subsets of the LOCEAN data. These, together with duplicate sets of samples between LOCEAN and other facilities, form the basis for estimating consistency relative to the other data (details in Appendix A). The different comparisons yielded varied results. It is often difficult to understand what is the source of the differences, but one commonly suspects choices of protocols, characteristics of the instrument used, or internal standards (see also Aoki et al., 2017; Wassenaar et al., 2021). Altogether, although the limited intercomparisons listed above have a large scatter (the standard deviation in the set of 18 average differences listed in Appendix A is 0.055 ‰), there is a tendency for LOCEAN δ18O values reported in the concentration scale to be higher (relatively enriched in heavy isotopes). The average of these 18 different comparisons is +0.082 ‰ with a standard error of 0.016 ‰ (assuming that the 18 comparisons have the same uncertainty). This average difference happens to be close to the +0.09 ‰ adjustment that was applied to recent CRDS salty water samples analyzed since 2015 at LOCEAN based on Benetti (2017c), an adjustment that was not done on CRDS or IRMS datasets produced in other facilities.
In summary, these external comparisons, together with the internal consistency tests on the LOCEAN database in a few regions, suggest that the LOCEAN δ18O dataset is within +0.035 ‰ absolute accuracy, at least when averaged spatially or in time (Table 2). Individual data have larger uncertainties as discussed before because of the instrumental and internal standard uncertainty (resulting in a total uncertainty of usually less than 0.05 ‰ in δ18O) as well as possible aging and/or evaporation during collection and storage. We are not able to provide similar comparisons for δD or d-excess, as the database for comparison is very reduced.
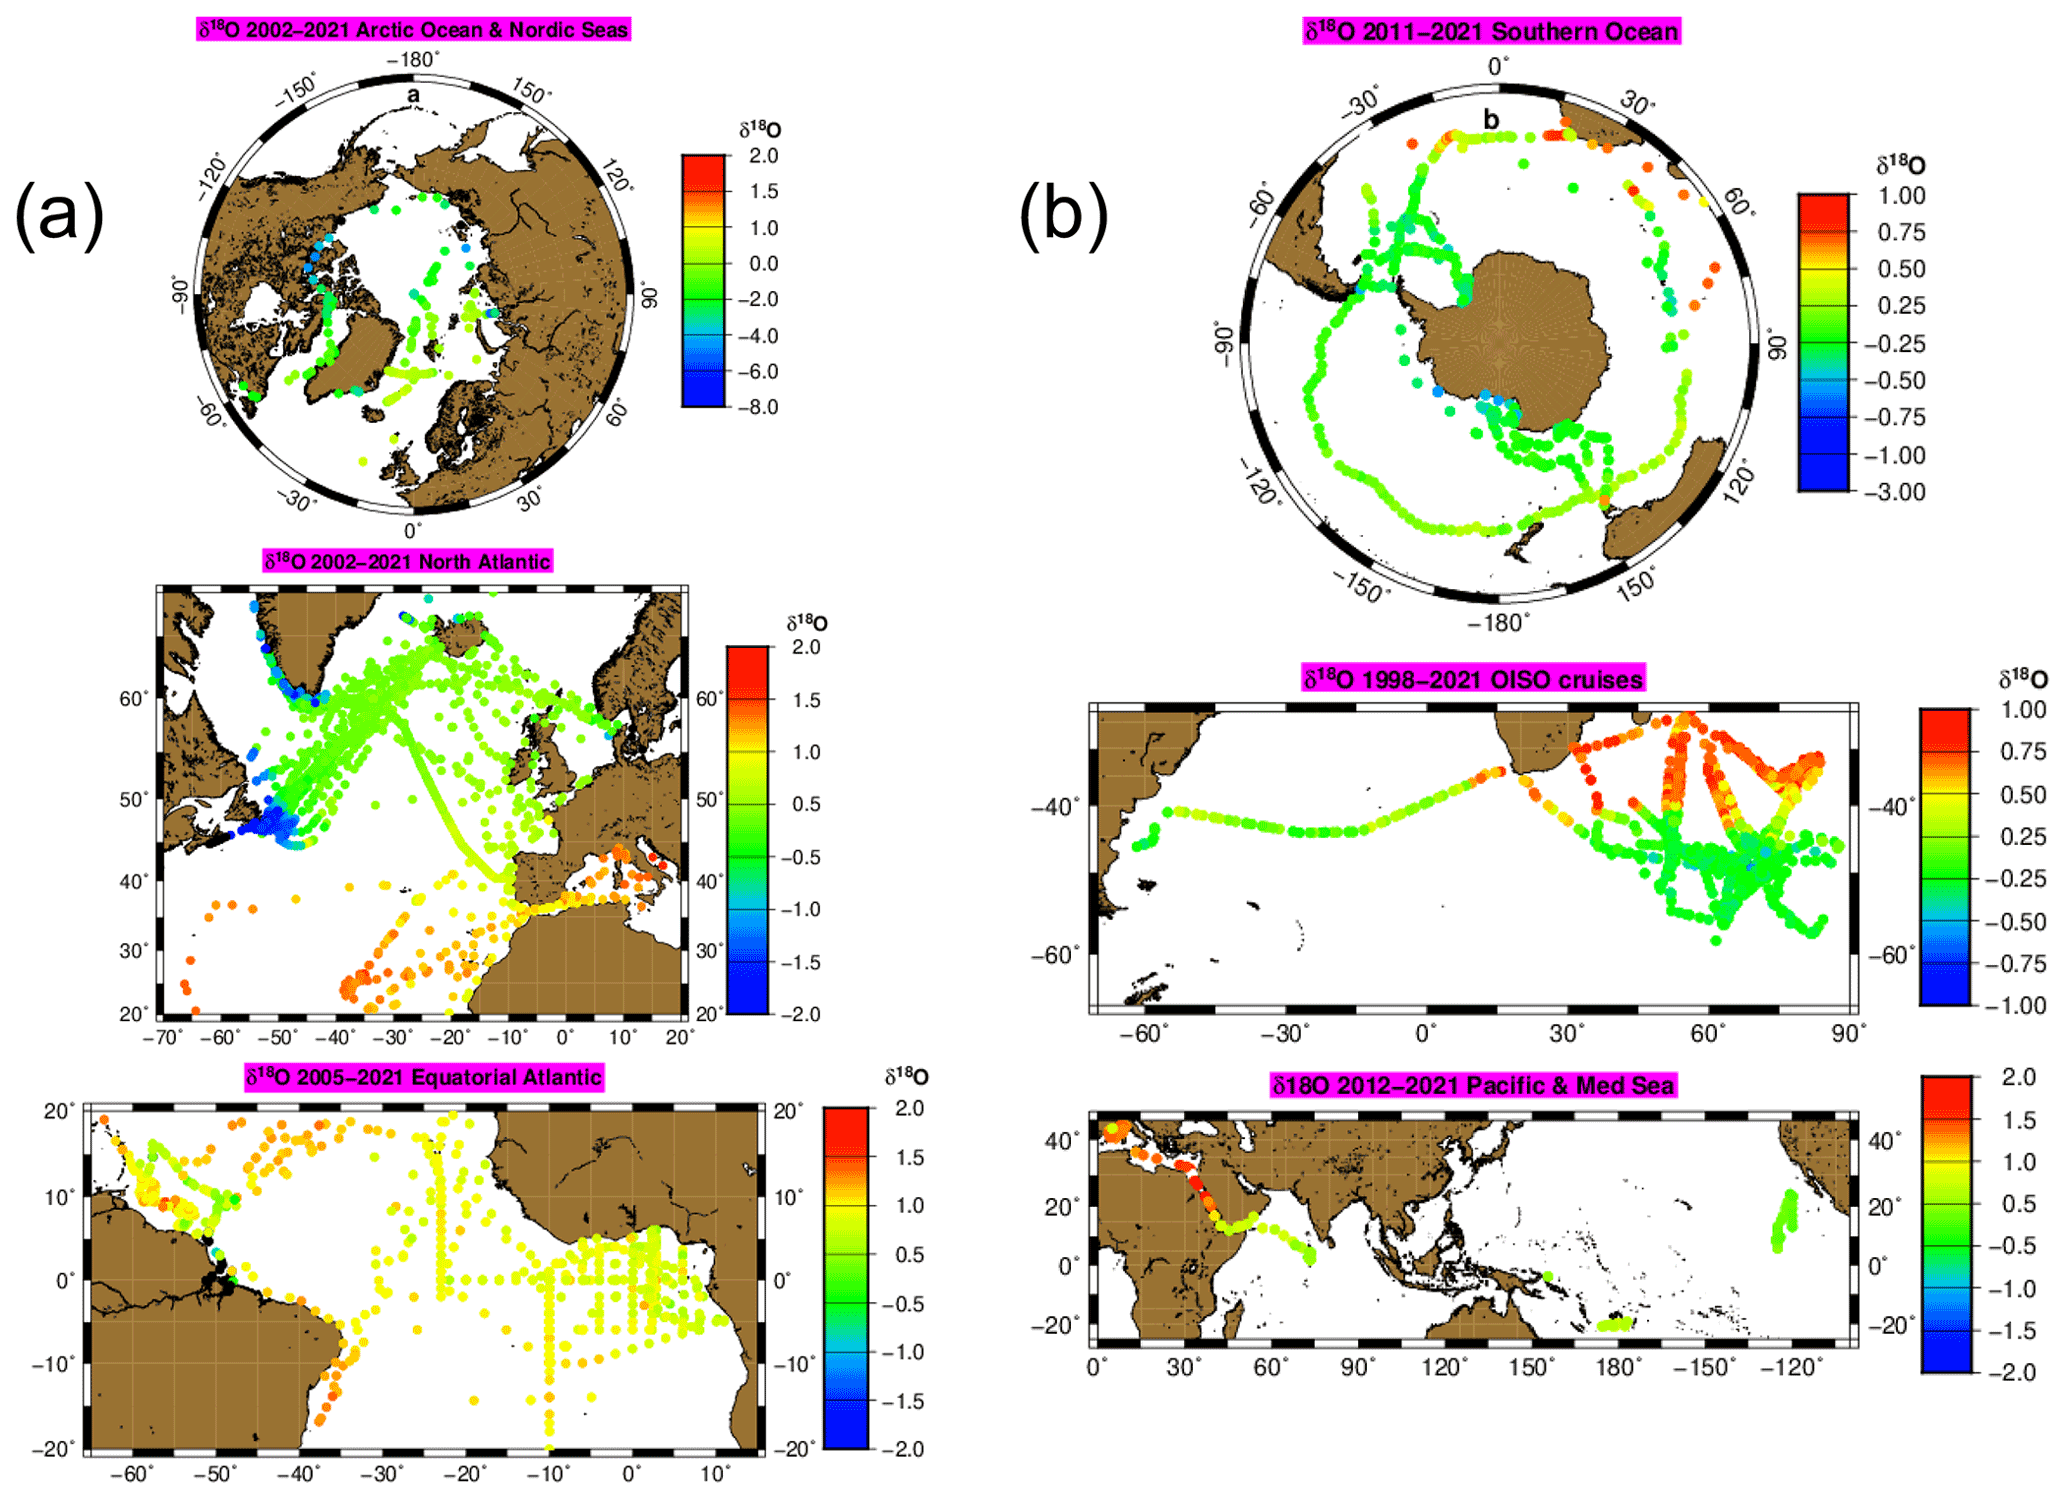
Figure 3Maps which include most of the near-surface δ18O data in the LOCEAN archive (color scale δ18O in ‰). (a) Arctic and Atlantic oceans; (b) other oceanic regions.
4.1 Data distribution
Figure 3 presents the spatial distribution of the LOCEAN-analyzed data close to the surface, with the largest data collection being in the North Atlantic (Fig. 3a) (in particular, with OVIDE cruises since 2002 and the SURATLANT ship of opportunity dataset since 2011), the tropical Atlantic (in particular, the EGEE and PIRATA cruises since 2005), and the southern Indian Ocean (Fig. 3b) (OISO cruises since 1998).
Table 3Number of valid seawater isotopic data by depth range in Waterisotopes-CISE-LOCEAN (2021, version V2) (a total of 7595 valid data entries for δ18O out of 7703 data entries).
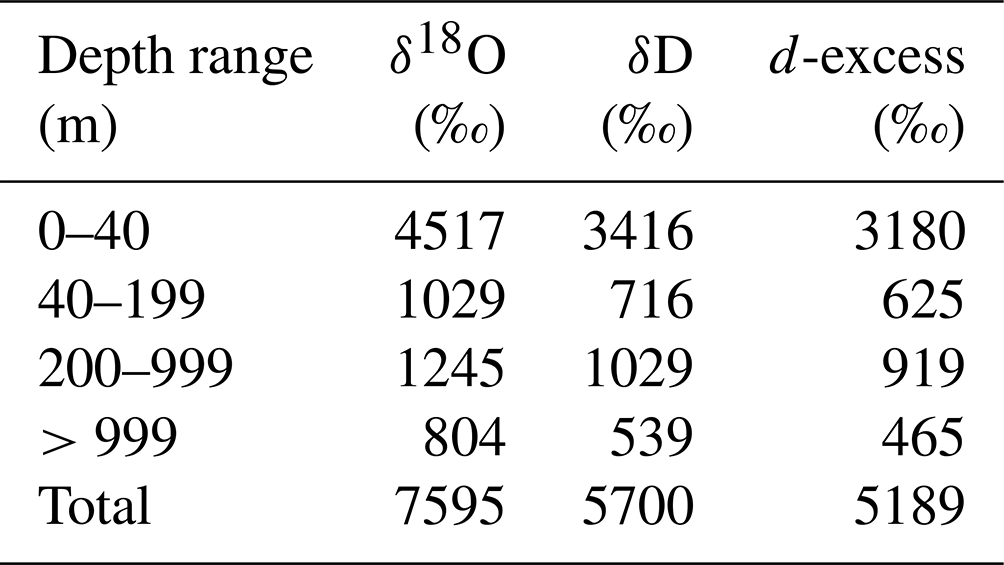
Table 3 reports the number of valid data points by depth range, which indicates that the emphasis in this set has been on near-surface data (58 % of the δ18O data above 40 m depth, 13 % between 40 and 200 m depth, and only 12 % at 1000 m or deeper). There is less valid δD than δ18O data, the difference corresponding to IRMS-measured data, which correspond to 25 % of the total number of water samples in the database. There is even less valid d-excess than δD (by 10 %), the difference corresponding to samples for which an adjustment for slight evaporation was done on δ18O and δD data. The database contains fewer deep samples since the transition to CRDS than before because of a recent emphasis on sampling the upper ocean.
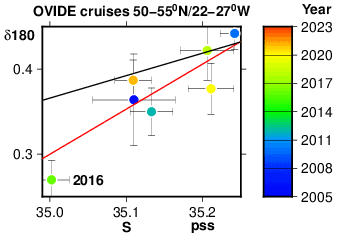
Figure 4Scatter plot of cruise averages of near-surface (upper 100 m) δ18O (‰) versus practical salinity in the Iceland Basin, close to the North Atlantic Current fronts. The bars indicate the standard deviation between the individual data that are averaged. Notice the fresher and isotopically lighter data from the BOCATS (OVIDE transect) cruise in 2016. The red line corresponds to the average linear relationship in the southwestern NA SPG (SURATLANT dataset within 47–55∘ N and 30–49∘ W, with practical salinity between 33.1 and 35.5), whereas the black line reports the slope expected from mixing with the local rainfall end-member.
4.2 Time series
We illustrate the dataset with time series of June (or July) data between 50 and 55∘ N in the eastern North Atlantic subpolar gyre (NASPG) collected mostly during the OVIDE cruises (Fig. 4). This scatter plot of cruise-averaged S and δ18O indicates a near alignment of the values. It is striking that the strongest negative (fresher and lighter) anomalies in 2016 fit rather well on the regression line (in red) for water samples in the southwestern NASPG. This regression line is derived from data from the 47–55∘ N, 30–49∘ W region, excluding very low-salinity data from seasonal sea ice melt or from shelf waters, and is very similar to the distribution in Frew et al. (2000). Thus, this reinforces the hypothesis of Holliday et al. (2020) that the strong freshening present in the eastern subpolar gyre in 2016 originated from the transport of Arctic fresh water from the western boundary current into the eastern basins and not from local rainfall, which would have likely resulted in higher δ18O at the same “low” salinity such as depicted by the black line (Frew et al., 2000; Camille Risi, personal communication, 2021).
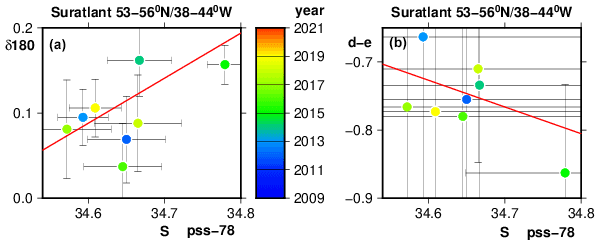
Figure 5Scatter plots in the southern Irminger Sea and NASPG of annually averaged SURATLANT survey data. Panel (a) presents δ18O (‰) versus practical salinity, whereas panel (b) presents d-excess (‰) versus practical salinity. The bars indicate the standard deviation between the individual data that are averaged. The red lines correspond to the average linear relationships in the SURATLANT dataset within 47–55∘ N and 30–49∘ W, with salinity between 33.1 and 35.5 (see Reverdin et al., 2018a); the red line in the left panel is the same as in Fig. 4.
The SURATLANT surveys provided a seasonal sampling of water isotopes between late 2011 and 2019 along the western flank of the Reykjanes Ridge in the central part of the gyre (53–56∘ N, 38–44∘ W). Annual summaries of these data are provided in Fig. 5a. There is less alignment of the interannual values on the average southwestern NASPG linear regression line than for the OVIDE surveys (Fig. 4). However, there is some aliasing of the seasonal cycle in the annual averages (see Reverdin et al., 2018a), which contributes to the scatter, as well as noise in the data and natural variability. On this plot the freshest year appears to be 2017, in agreement with an analysis using a much more complete salinity dataset (Reverdin et al., 2018b). 2017 is also one of the lighter δ18O years. The corresponding d-excess versus S diagram (Fig. 5b) presents yearly anomalies that are fairly aligned with the average regression between southwestern NASPG d-excess and salinity data. Error bars are large, but nevertheless, low-salinity waters exhibit high d-excess, as described in Benetti et al. (2017a, b).
The dataset described is version V2 at https://doi.org/10.17882/71186 (Waterisotopes-CISE-LOCEAN, 2021).
Instrumental uncertainty in individual data in this dataset is as low as 0.03 ‰ in δ18O and 0.15 ‰ in δD for most runs, with occasional much larger uncertainties. One needs to add to that the uncertainties in the internal standards that are used to convert measured values into the VSMOW scale. Different comparisons suggest that the internal standard values have almost always remained defined within at most 0.03 ‰ for δ18O and 0.2 ‰ for δD since 2012. There was, however, a short-term larger difference found for the most negative standard (equal to 0.1 ‰ for δ18O), most likely related to the readjustment of the instrument to laboratory conditions in May 2021. When using the CRDS Picarro L2130-i, we also found periods with quite uncertain analyses, in particular due to salt or particle deposits in the vaporizer or filters. These samples could often be run again afterwards to reach lower resulting uncertainty.
Finally, there is the issue of possible evaporation during collection and storage. When the analysis is done on a CRDS, we are usually able to detect possible biases larger than 0.05 ‰ in δ18O by comparing d-excess with the expected d-excess derived from regional d-excess–S linear relationships. Attempts were made here to correct δ18O and δD when the resulting uncertainty did not exceed 0.05 ‰ and 0.1 ‰, respectively. In particular, this was done for some OISO cruise samples which were analyzed many years after collection, in the case of faulty caps being used, or in the case of caps that were not properly closed and wrapped with parafilm. This is certainly a strong source of quality loss for part of the database, and “small” effects may have remained undetected.
Possible long-term drifts due to changes in internal standards, storage, instrumentation, and protocols are difficult to estimate. This is done here by checking the consistency of different subsets of the database, for instance when time series can be obtained (such as in the southern Indian Ocean or North Atlantic subpolar gyre), by comparison with duplicate data analyzed in other laboratories, or by comparison with other datasets in deep regions commonly sampled. These comparisons are encouraging. On one hand, they suggest that the internal consistency in the database is usually within an uncertainty of 0.03 ‰ for δ18O and 0.15 ‰ for δD. On the other hand, although other datasets sometimes differ by much more with a large scatter between the 18 comparisons (with a standard deviation of 0.055 ‰ for δ18O), the average difference (+0.082 ‰) found with them is close to the adjustment that is applied to the LOCEAN data to report them on the concentration scale (+0.09 ‰ for δ18O analyzed with a salt liner since 2015). Of course, there is still the possibility of errors and biases in subsets that could not be compared in a similar way, such as surface samples collected from ships of opportunity or sailing vessels in the tropics, that could result from different handling of the samples during collection and more uncertain storage conditions. There are also small errors originating from memory effects in the Picarro CRDS runs that could be better corrected and taken into account (Vallet-Coulomb et al., 2021).
We also illustrated the possibility of using this dataset to investigate ocean variability. Of course, the interest of a data archive is to merge datasets from different institutes such as this one, while retaining similar accuracy. This was attempted with the Global Seawater Oxygen-18 Database at GISS (Schmidt et al., 1999), although biases between subsets of this mostly δ18O dataset remain at a level that makes the overall analysis of variability difficult to carry out. The few comparisons we could do suggest that differences with other datasets are at times large. Effort to correctly adjust for these differences and produce a larger coherent archive is required to get full use of the data collected. There is still a need for more and better-calibrated seawater isotope data to reconstruct tropical hydroclimate variability, such as formulated for the tropical coral archives by the PAGES CoralHydro2k Project, or for high-latitude studies of the various sources of fresh water in the ocean, including continental runoff, sea ice, iceberg melt, and air–sea exchanges.
This includes, on one hand, comparisons with data from other cruises in areas where we expect variability to have been weak, such as in the deep ocean, and, on the other hand, considering duplicate sets of samples analyzed in different institutions.
Akhoudas et al. (2021) used the first approach in the deep Weddell Sea, comparing the LOCEAN 2017 Wapiti cruise data with data from other cruises over a fairly large range of neutral density surfaces. They identified a cruise whose δ18O values were lower by 0.13 ‰ than at LOCEAN, as well as datasets that fit the Wapiti cruise values to within the data uncertainties (for example, from ANT-X12 cruise on RV Polarstern in 1995). Another water mass which can be used for comparison is the near-bottom waters in Fram Strait (below 2000 m), which either originate from the Arctic Ocean or recirculate from the Greenland Sea. This water mass is regularly sampled and has not been strongly ventilated recently. In 1998–2015 during German-led cruises, these waters presented an average δ18O value close to +0.28 ‰ (after removing suspiciously high data from a cruise in 2011 and large positive outliers in 2012; Paul Dodd, personal communication, 2020). The LOCEAN database contains seven δ18O samples close to the bottom across Fram Strait from the MSM76 cruise on RV Maria S Merian in 2018, with an average (SD) value close to +0.395 (0.035) ‰, thus averaging higher by 0.115 ‰ than the other set in 1998–2015.
We extracted individual profiles from the GISS Global Seawater Oxygen-18 Database (Schmidt et al., 1999) that can be compared with the LOCEAN station data in deep and old water masses. In the southern Indian Ocean, for example, numerous profiles collected during 1993–1994 cruises (CIVA1 (Archambeau et al., 1998), ADOX1, SWINDEX, ADOX2) suggest that LOCEAN δ18O in the deep layers are higher by 0.10 ‰ to 0.17 ‰ depending on the cruise. There is also one GEOSECS 1978 station with a single deep value within 0.01 ‰ of nearby OISO stations, as well as some 1984 (INDIVAT1) and 1996 (CIVA2) station data with larger uncertainties that indicate higher LOCEAN δ18O values by 0.15 ‰ to 0.22 ‰, depending on how outliers are identified and removed.
In the North Atlantic, there are data from three cruises that can be directly compared with LOCEAN data, focusing on deep waters with T–S properties close to the ones of the LOCEAN dataset. Comparison with one GEOSECS 1972 station south of Greenland suggests higher δ18O LOCEAN values by ∼0.060 ‰ (there is a small salinity shift between the two profiles that required adjusting the LOCEAN δ18O value to the same salinity based on the average δ18O–S relationship). Data from four stations of the CONVEX1991 cruise (Frew et al., 2000) indicate higher δ18O in the LOCEAN dataset by ∼0.090 ‰ (after adjustment done to consider small salinity differences). On the other hand, data close to the northeastern Atlantic deep-water layer from stations collected in June 1995 in the southern Labrador Sea (Khatiwala et al., 1999) do not show a significant difference with LOCEAN stations closer to southern Greenland (southern Irminger Sea) at a similar salinity. In the equatorial Atlantic there are deep data from two GEOSECS stations collected in October 1972 and February 1973 that can be compared with the LOCEAN data (mostly near 1000–2000 m depth). These limited comparisons (often at large distance but at a similar salinity) suggest that LOCEAN values are larger than the GEOSECS δ18O by 0.055 ‰.
Finally, there are a few instances of seawater samples that have been duplicated and shared with other laboratories. Some of these were used in 2013–2014 to validate how to convert IRMS or CRDS measurements into the concentration scale, with or without distillation (Benetti et al., 2017c), that we will not include here and that suggested a scatter in the comparisons with different IRMS laboratories for natural or artificial seawater samples often on the order of 0.10 ‰. More recently, 18 samples of the WAPITI2017 cruise were duplicated with analyses at both LOCEAN and the British Geological Survey stable isotope facility (BGS), which indicated lower LOCEAN δ18O averaging −0.09 ‰ (SD = 0.035 ‰) (Akhoudas et al., 2021). In the same region, a small set of 11 samples was duplicated in 2020 with Hokkaido University, which suggests that LOCEAN δ18O values are higher by +0.139 ‰ with an SD of 0.019 ‰ (Shigeru Aoki, personal communication, 2021). Another set of 137 samples was duplicated in 2017 in the Southern Ocean from the Antarctic Circumnavigation Experiment cruise with samples analyzed at BGS (Haumann et al., 2019), which yielded an average difference of +0.004 (SD = 0.055 ‰).
Duplicates of LOCEAN samples during OVIDE cruises in 2010, 2016, and 2018 have also been analyzed in different facilities (Voelker et al., 2015; Antje Voelker, personal communication, 2021), which suggested diverse average offsets for the different years. In particular, for 2016 samples close to 2500 m, LOCEAN values average higher by +0.035 ‰, whereas in 2018, the average difference is closer to +0.07 ‰, but with a few stations at the northwestern end of the section in the Irminger Sea with differences on the order of +0.02 ‰.
GR and CW have measured parts of the isotopic data, contributed to their validation, and written the paper. CP, CAk, GA, and MB have measured parts of the isotopic data and contributed to their validation. JD has maintained the CISE-LOCEAN IRMS and CRDS, and AN has measured parts of the isotopic data. DD, MD, and TR have contributed water samples from ships of opportunity with associated salinity measurements. BB, JCG, HLG, MNH, PL, CLM, HM, NM, SM, JBS, VT, SEH, EWM, SO, TK, AVo, IY, AVe, and FAH have contributed to the sample collection and in some cases provided duplicate samples from other institutions. MJL and CAr analyzed water samples and contributed to the qualification of some of the reference materials. MM contributed to the planning and sampling strategy of the ACE fieldwork with the ACE and ORCHESTRA projects.
The contact author has declared that neither they nor their co-authors have any competing interests.
Publisher's note: Copernicus Publications remains neutral with regard to jurisdictional claims in published maps and institutional affiliations.
Data were measured at the CISE-LOCEAN facility housed by the LOCEAN laboratory and part of the OSU ECCE Terra analytical services. Support by OSU ECCE Terra, by LOCEAN, and by various French national institutes and programs is gratefully acknowledged (including INSU/CNRS, IFREMER, IPSL, IRD, IPEV, LEFE program, ANR GEOVIDE), as is support by different French “Services nationaux d'Observation”, such as PIRATA, SSS, and OISO/CARAUS. Many of the data originate from research cruises on French Research vessels: RV Suroit, Thalassa, Atalante, Marion Dufresne 2, and Tara. Some data were collected during research cruises on non-French vessels, such as MIDAS in 2013 as well as BOCATS1 in 2016 and BOCATS2 in 2021 on the Spanish RV Sarmiento de Gamboa, HUD2014007 on the Canadian RV Hudson, JR302 in 2014 and JR16004 in 2017 cruises on the UK HMS James Clarke Ross, the Arctic cruises in 2006–2008 and 2013 along with the 2020–2021 Microbiome cruise on French SV Tara, the Nordic seas MIZEX cruises in 2002–2004 on Swedish RV Oden, the 2017 SPURS2 cruise on RV Revelle, and the 2018 eastern Greenland cruise MSM76 on German RV Maria S. Merian. The SURATLANT data were collected on merchant vessels with support from the Iceland-based EIMSKIP and Marine and Fisheries Research Institute, and the Nuka Arctica/Tukuma Arctica dataset was collected on the merchant vessels Nuka Arctica and Tukuma Arctica from the Greenland-based company RAL. Data were also collected from different merchant vessels recruited by SNO SSS for Atlantic Ocean monitoring. Finally, data were collected from sailing vessels, including the Rara Avis (AJD), the Boogaloo and Ragnar (OceanoScientific), and the Northabout (UnoMundo) and the UltimIII (SODEBO). In all instances, we are thankful for the contribution of the crew and numerous scientists and technicians who contributed to the sampling. We also acknowledge the contribution of the scientists and technicians of the Vigo CO2 group who participated in the CATARINA, BOCATS1, and BOCATS2 (PID2019-104279GB-C21/AEI/10.13039/501100011033) campaigns funded by the Spanish Research Agency, as well as in other OVIDE cruises. The WAPITI project received funding from the European Research Council (ERC) under the European Union's Horizon 2020 research and innovation program (grant agreement 637770). The Antarctic Circumnavigation Expedition was made possible by funding from the Swiss Polar Institute and Ferring Pharmaceuticals, and F. Alexander Haumann was supported by SNSF grant numbers P2EZP2_175162 and P400P2_186681. Intercomparisons of samples were done with various other institutions to which we are very grateful. In particular, we acknowledge the contributions by Robert van Geldern at Geozentrum Nordbayern, Melanie Leng at the British Geological Survey, Arne E. Sveinbjörnsdóttir and Rosa Ólafsdóttir at the University of Reykjavik, Pal Morkved at the University of Bergen, Bénédicte Minster at LSCE, Penny Holliday at NOC in Southampton, Paul Dodd at the Norwegian Polar Institute in Tromsø, and Shigeru Aoki at Hokkaido University. We thank the two reviewers for their helpful comments.
This research has been supported by the LEFE/INSU LASSO project.
This paper was edited by Giuseppe M. R. Manzella and reviewed by two anonymous referees.
Akhoudas, C., Sallée, J.-B., Reverdin, G., Aloisi, G., Benetti, M., Vignes, L., and Gelado, M.: Ice-shelf basal melt and influence on dense water outflow in the southern Weddell Sea, J. Geophys. Res.-Oceans, 125, e2019JC015710, https://doi.org/10.1029/2019JC015710, 2020.
Akhoudas, C. H., Sallée, J. B., Reverdin, G., Meredith, M. P., Naveira Garabato, A., Haumann, F. A., Jullion, L., Aloisi, G., Benetti, M., Leng, M. L., and Arrowsmith, C.: Ventilation of the abyss in the Atlantic sector of the Southern Ocean, Nat. Sci. Rep., 11, 16733, https://doi.org/10.1038/s41598-021-95949-w, 2021.
Aoki, S., Kobayashi, R., Rintoul, S. R., Tamura, T., and Kusahara, K.: Changes in water properties and flow regime on the continental shelf off the Adélie/George V Land coast, East Antarctica, after glacier tongue calving, J. Geophys. Res.-Oceans, 122, 6277–6294, 2017.
Archambeau, A. S., Pierre, C., Poisson, A., and Schauer, B.: Distribution of CFC-12, Oxygen and carbon stable isotopes in the Water masses of the Southern Ocean at 30∘ E from Africa to Antarctica, J. Mar. Syst., 17, 25–38, 1998.
Benetti, M., Reverdin, G., Pierre, C., Khatiwala, S., Tournadre, B., Olafsdottir, S., and Naamar, A.: Variability of sea ice melt and meteoric water input in the surface Labrador Current off Newfoundland, J. Geophys. Res.-Oceans, 121, 2841–2855, https://doi.org/10.1002/2015JC011302, 2015.
Benetti, M., Reverdin, G., Pierre, C., Khatiwala, S., Tournadre, B., Olafsdottir, S., and Naamar, A.: Variability of sea ice melt and meteoric water input in the surface Labrador Current off Newfoundland, J. Geophys. Res.-Oceans, 121, 2841–2855, https://doi.org/10.1002/2015JC011302, 2016.
Benetti, M., Reverdin, G., Aloisi, G., and Sveinbjörnsdóttir, A.: Stable isotopes in surface waters of the Atlantic Ocean: indicators of ocean-atmosphere water fluxes and oceanic mixing processes, J. Geophys. Res.-Oceans, 122, 4723–4742, https://doi.org/10.1002/2017JC012712, 2017a.
Benetti, M., Reverdin, G., Yashayaev, I., Holliday, N. P., Tynuan, E., Torres-Valdes, S., Lherminier, P., Tréguer, P., Sarthou, G., and Lique, C.: Composition of freshwater in the spring of 2014 on the southern Labrador shelf and slope. J. Geophys. Res.-Oceans, 122, 1102–1121, https://doi.org/10.1002/2016JC012244, 2017b.
Benetti, M., Sveinbjörnsdottir, A. E., Leng, M. J., Arrowsmith, C., Debondt, K., Fripiat, F., and Aloisi, G.: Inter-comparison of salt effect correction for δ 18O and δ 2H measurements in seawater by CRDS and IRMS using the gas-H2O equilibration method, Mar. Chem., 194, 114–123, https://doi.org/10.1016/j.marchem.2017.05.010, 2017c.
Benetti, M., Reverdin, G., Clarke, J. S.,Tynan, E., Holliday, N. P., Torres-Valdes, S., Lherminier, P., and Yashayaev, I.: Sources and distribution of fresh water around Cape Farewell in 2014, J. Geophys. Res., https://doi.org/10.1029/2019JC015080, 2019.
Bigg, G. R. and Rohling, E. J.: An oxygen isotope dataset for marine water, J. Geophys. Res.-Atmos., 105, 8527–8536, https://doi.org/10.1029/2000JC900005, 1999.
Craig, H. and Gordon, L. I.: Deuterium and oxygen18 variations in the ocean and marine atmosphere, in: Proc. Stable Isotopes in Oceanographic Studies and Paleotemperatures, edited by: Tongiogi, E., 9–130, V. Lishie e F., Pisa, 1965.
Frew, R., Dennis, P. F., Heywood, K., Meredith, M. P., and Boswell, S. M.: The oxygen isotope composition of water masses in the Northern North Atlantic, Deep-Sea Res. Pt. I, 47, 2265–2286, https://doi.org/10.1016/S0967-0637(00)00023-6, 2000.
Gröning, M.: Stable Isotope Internal Laboratory Water Standards: Preparation, Calibration and Storage, TEL Technical Note No. 03, (revised from IHL Technical Procedure Note No.43, Tanweer et al., as of May 2009), 2018.
Haumann, F. A., Leonard, K., Meredith, M. P., Arrowsmith, C., Gorodetskaya, I. V., Hutchings, J., Lehning, M., Leng, M. J., Stammerjohn, S., Tsukernik, M., and Weber, Y.: Seawater stable isotope sample measurements from the Antarctic Circumnavigation Expedition (ACE) (Version 1.0), Zenodo [data set], https://doi.org/10.5281/zenodo.1494915, 2019.
Holliday, N. P., Bersch, M., Berx, B., Chafik, L., Cunningham, S., Florindo-López, C., Hátún, H., Johns, W., Josey, S. A., Larsen, K. M. H., Mulet, S., Oltmanns, M., Reverdin, G., Rossby, T., Thierry, V., Valdimarsson, H., and Yashayaev, I.: Ocean circulation changes cause the largest freshening event for 20 years in the eastern subpolar North Atlantic, Nat. Commun., 11, 585, https://doi.org/10.1038/s41467-020-14474-y, 2020.
Khatiwala, S. P., Fairbanks, R. G., and Houghton, R. W.: Freshwater sources to the coastal ocean off northeastern North America: Evidence from HO/HO, J. Geophys. Res., 104, 18241–18255, https://doi.org/10.1029/1999JC900155, 1999.
Lherminier, P.: OVIDE 2018 cruise, RV Thalassa, Catalogue des campagnes océanographiques, https://doi.org/10.17600/18000510, 2018.
Lis, G., Wassenaar, L., and Hendry, M.: High-precision laser spectroscopy D/H and 18O/16O measurements of microliter natural water samples, Anal. Chem., 80, 287–293, 2008.
Östlund, H., Gote, C., Harmon, C., Broecker, W. S., Spencer, D. W.: GEOSECS Atlantic, Pacific and Indian Ocean Expeditions: Shorebased Data and Graphics. National Science Foundation, US Government Printing Office, Washington, D.C., 7, 200 pp., hdl:10013/epic.43023.d001, 1987.
Reverdin, G., Metzl, N., Olafsdottir, S., Racapé, V., Takahashi, T., Benetti, M., Valdimarsson, H., Benoit-Cattin, A., Danielsen, M., Fin, J., Naamar, A., Pierrot, D., Sullivan, K., Bringas, F., and Goni, G.: SURATLANT: a 1993–2017 surface sampling in the central part of the North Atlantic subpolar gyre, Earth Syst. Sci. Data, 10, 1901–1924, https://doi.org/10.5194/essd-10-1901-2018, 2018a.
Reverdin, G., Valdimarsson, H., Alory, G., Diverres, D., Bringas, F., Goni, G., Heilmann, L., Chafik, L., Szekely, T., and Friedman, A. R.: North Atlantic subpolar gyre along predetermined ship tracks since 1993: a monthly data set of surface temperature, salinity, and density, Earth Syst. Sci. Data, 10, 1403–1415, https://doi.org/10.5194/essd-10-1403-2018, 2018b.
Reverdin, G., Metzl, N., Reynaud, T., Poli, P., and Griboval, Y.: L'Exploreur OceanoScientific “Boogaloo” – Une campagne péri-Antarctique, 26/01/2017–04/04/2017, La Météorologie, April 2020, https://doi.org/10.1002/2016JC012244, 2019.
Schmidt, G. A.: Error analysis of paleosalinity calculations, Paleoceanography, 14, 422–429, https://doi.org/10.1029/1999PA900008, 1999.
Schmidt, G. A., Bigg, G. R., and Rohling, E. J.: Global Seawater Oxygen-18 Database – Data, GISS, http://www.giss.nasa.gov/data/o18data/ (last access: November 2021), 1999.
Skrzypek, G. and Ford, D.: Stable isotope analysis of saline water samples on a cavity ringdown spectroscopy instrument, Environ. Sci. Technol., 48, 2827–2834, https://doi.org/10.1021/es4049412, 2014.
Stevens, B., Bony, S., Farrell, D., Ament, F., Blyth, A., Fairall, C., Karstensen, J., Quinn, P. K., Speich, S., Acquistapace, C., Aemisegger, F., Albright, A. L., Bellenger, H., Bodenschatz, E., Caesar, K.-A., Chewitt-Lucas, R., de Boer, G., Delanoë, J., Denby, L., Ewald, F., Fildier, B., Forde, M., George, G., Gross, S., Hagen, M., Hausold, A., Heywood, K. J., Hirsch, L., Jacob, M., Jansen, F., Kinne, S., Klocke, D., Kölling, T., Konow, H., Lothon, M., Mohr, W., Naumann, A. K., Nuijens, L., Olivier, L., Pincus, R., Pöhlker, M., Reverdin, G., Roberts, G., Schnitt, S., Schulz, H., Siebesma, A. P., Stephan, C. C., Sullivan, P., Touzé-Peiffer, L., Vial, J., Vogel, R., Zuidema, P., Alexander, N., Alves, L., Arixi, S., Asmath, H., Bagheri, G., Baier, K., Bailey, A., Baranowski, D., Baron, A., Barrau, S., Barrett, P. A., Batier, F., Behrendt, A., Bendinger, A., Beucher, F., Bigorre, S., Blades, E., Blossey, P., Bock, O., Böing, S., Bosser, P., Bourras, D., Bouruet-Aubertot, P., Bower, K., Branellec, P., Branger, H., Brennek, M., Brewer, A., Brilouet , P.-E., Brügmann, B., Buehler, S. A., Burke, E., Burton, R., Calmer, R., Canonici, J.-C., Carton, X., Cato Jr., G., Charles, J. A., Chazette, P., Chen, Y., Chilinski, M. T., Choularton, T., Chuang, P., Clarke, S., Coe, H., Cornet, C., Coutris, P., Couvreux, F., Crewell, S., Cronin, T., Cui, Z., Cuypers, Y., Daley, A., Damerell, G. M., Dauhut, T., Deneke, H., Desbios, J.-P., Dörner, S., Donner, S., Douet, V., Drushka, K., Dütsch, M., Ehrlich, A., Emanuel, K., Emmanouilidis, A., Etienne, J.-C., Etienne-Leblanc, S., Faure, G., Feingold, G., Ferrero, L., Fix, A., Flamant, C., Flatau, P. J., Foltz, G. R., Forster, L., Furtuna, I., Gadian, A., Galewsky, J., Gallagher, M., Gallimore, P., Gaston, C., Gentemann, C., Geyskens, N., Giez, A., Gollop, J., Gouirand, I., Gourbeyre, C., de Graaf, D., de Groot, G. E., Grosz, R., Güttler, J., Gutleben, M., Hall, K., Harris, G., Helfer, K. C., Henze, D., Herbert, C., Holanda, B., Ibanez-Landeta, A., Intrieri, J., Iyer, S., Julien, F., Kalesse, H., Kazil, J., Kellman, A., Kidane, A. T., Kirchner, U., Klingebiel, M., Körner, M., Kremper, L. A., Kretzschmar, J., Krüger, O., Kumala, W., Kurz, A., L'Hégaret, P., Labaste, M., Lachlan-Cope, T., Laing, A., Landschützer, P., Lang, T., Lange, D., Lange, I., Laplace, C., Lavik, G., Laxenaire, R., Le Bihan, C., Leandro, M., Lefevre, N., Lena, M., Lenschow, D., Li, Q., Lloyd, G., Los, S., Losi, N., Lovell, O., Luneau, C., Makuch, P., Malinowski, S., Manta, G., Marinou, E., Marsden, N., Masson, S., Maury, N., Mayer, B., Mayers-Als, M., Mazel, C., McGeary, W., McWilliams, J. C., Mech, M., Mehlmann, M., Meroni, A. N., Mieslinger, T., Minikin, A., Minnett, P., Möller, G., Morfa Avalos, Y., Muller, C., Musat, I., Napoli, A., Neuberger, A., Noisel, C., Noone, D., Nordsiek, F., Nowak, J. L., Oswald, L., Parker, D. J., Peck, C., Person, R., Philippi, M., Plueddemann, A., Pöhlker, C., Pörtge, V., Pöschl, U., Pologne, L., Posyniak, M., Prange, M., Quiñones Meléndez, E., Radtke, J., Ramage, K., Reimann, J., Renault, L., Reus, K., Reyes, A., Ribbe, J., Ringel, M., Ritschel, M., Rocha, C. B., Rochetin, N., Röttenbacher, J., Rollo, C., Royer, H., Sadoulet, P., Saffin, L., Sandiford, S., Sandu, I., Schäfer, M., Schemann, V., Schirmacher, I., Schlenczek, O., Schmidt, J., Schröder, M., Schwarzenboeck, A., Sealy, A., Senff, C. J., Serikov, I., Shohan, S., Siddle, E., Smirnov, A., Späth, F., Spooner, B., Stolla, M. K., Szkółka, W., de Szoeke, S. P., Tarot, S., Tetoni, E., Thompson, E., Thomson, J., Tomassini, L., Totems, J., Ubele, A. A., Villiger, L., von Arx, J., Wagner, T., Walther, A., Webber, B., Wendisch, M., Whitehall, S., Wiltshire, A., Wing, A. A., Wirth, M., Wiskandt, J., Wolf, K., Worbes, L., Wright, E., Wulfmeyer, V., Young, S., Zhang, C., Zhang, D., Ziemen, F., Zinner, T., and Zöger, M.: EUREC4A, Earth Syst. Sci. Data, 13, 4067–4119, https://doi.org/10.5194/essd-13-4067-2021, 2021.
Vallet-Coulomb, C., Couapel, M., and Sonzogni, C.: Improving memory effect correction to achieve high-precision analysis of delta O-17, delta O-18, delta H-2, O-17-excess and d-excess in water using cavity ring-down laser spectroscopy, Rapid Comm. Mass Spectr., 35, e9108, ISSN 0951-4198, 2021.
Voelker, A. H., Colman, A., Olack, G., and Waniek, J.: Oxygen and hydrogen isotope signatures of northeast Atlantic water masses, Deep-Sea Res. Pt. II, 116, 89–106, https://doi.org/10.1016/j.dsr2.2014.11.006, 2015.
Walker, S. A., Azetsu-Scott, K., Normandeau, C., Kelley, D. E., Friedrich, R., Newton, R., Schlosser, V, McKay, J. L., Abdi, W., Kerrigan, E., Craig, S. E., and Wallace, D. W. R.: A comparison of cavity ring-down spectroscopy (CRDS) and isotope ratio mass spectrometry (IRMS), Limnol. Oceanogr.-Meth., 14, 31–38, https://doi.org/10.1002/lom3.10067, 2016.
Wassenaar, L. I., Terzer-Wassmuth, S., and Douence, C.: Progress and challenges in dual- and triple-isotope (δ18O, δ2H, Δ17O) analyses of environmental waters: an international assessment of laboratory performance, Rap. Comm. Mass Spectrom., 35, e9193, https://doi.org/10.1002/rcm.9193, 2021.
Waterisotopes-CISE-LOCEAN, Water isotopes of seawater analyzed since 1998 at LOCEAN, SEANOE [data set], https://doi.org/10.17882/71186, 2021.
Xu, X., Werner, M., Butzin, M., and Lohmann, G.: Water isotope variations in the global ocean model MPI-OM, Geosci. Model Dev., 5, 809–818, https://doi.org/10.5194/gmd-5-809-2012, 2012.