the Creative Commons Attribution 4.0 License.
the Creative Commons Attribution 4.0 License.
 | 09 Jun 2022
New gridded dataset of rainfall erosivity (1950–2020) on the Tibetan Plateau
Yueli Chen
Xingwu Duan
Wei Qi
Ting Wei
Jianduo Li
Yun Xie
The risk of water erosion on the Tibetan Plateau (TP), a typical fragile ecological area, is increasing with climate change. A rainfall erosivity map is useful for understanding the spatiotemporal pattern of rainfall erosivity and identifying hot spots of soil erosion. This study generates an annual gridded rainfall erosivity dataset on a 0.25∘ grid for the TP in 1950–2020. The 1 min precipitation observations at 1787 weather stations for 7 years and 0.25∘ hourly European Center for Medium-Range Weather Forecasts Reanalysis 5 (ERA5) precipitation data for 71 years are employed in this study. Our results indicate that the ERA5-based estimates have a marked tendency to underestimate annual rainfall erosivity when compared to the station-based estimates, because of the systematic biases of ERA5 precipitation data including the large underestimation of the maximum contiguous 30 min peak intensity and relatively slight overestimation of event erosive precipitation amounts. The multiplier factor map over the TP, which was generated by the inverse distance-weighted method based on the relative changes between the available station-based annual rainfall erosivity grid values and the corresponding ERA5-based values, was employed to correct the ERA5-based annual rainfall erosivity and then reconstruct the annual rainfall erosivity dataset. The multiyear average correction coefficient over the TP between the station-based annual rainfall erosivity values and the newly released data is 0.67. In addition, the probability density and various quantile values of the new data are generally consistent with the station-based values. The data offer a view of large-scale spatiotemporal variability in the rainfall erosivity and address the growing need for information to predict rainfall-induced hazards over the TP. The dataset is available from the National Tibetan Plateau/Third Pole Environment Data Center (https://doi.org/10.11888/Terre.tpdc.271833; Chen, 2021).
- Article
(5931 KB) - Full-text XML
- BibTeX
- EndNote


Precipitation is the main driver of water erosion because it directly affects the detachment of soil particles, breakdown of aggregates, and transport of eroded particles via runoff (Wischmeier and Smith, 1965, 1978). The R factor, i.e., the multiyear average rainfall erosivity, which is described by the universal soil loss equation (USLE; Wischmeier and Smith, 1965, 1978) and revised USLE (RUSLE; Renard et al., 1997), is an indicator of the potential ability of rainfall and runoff to affect soil erosion. Generally, the R factor is calculated by using the classical (Wischmeier and Smith, 1965) or statistical algorithms (e.g., Liu et al., 2002) according to the temporal resolution of the available precipitation data.
The classical algorithm for rainfall erosivity requires a continuous precipitation data series with <15 min temporal resolution (Angulo-Martínez and Beguería, 2009). As networks of weather stations and observation platforms have matured considerably in the past two decades, rainfall erosivity has been calculated using the classical algorithm at the local level (Agnese et al., 2006; Ma et al., 2014; Wang et al., 2017), and the application of the algorithm has been gradually extended to the national (Panagos et al., 2015; Kim et al., 2020; Yue et al., 2022) and global levels (Panagos et al., 2017; Liu et al., 2020). Despite substantial progress, it is still notable that the relative error of the estimated rainfall erosivity increases rapidly with increasing time interval of the precipitation data. For example, the relative error based on hourly data was more than 80 %, compared with the results based on 1 min data (Lobo and Bonilla, 2015; Yin et al., 2015; Shin et al., 2019). In addition, the accuracy of the rainfall erosivity map is greatly reduced by inadequate weather station coverage, especially in areas with complex climates and terrains (Yue et al., 2021). Therefore, the accuracy of rainfall erosivity estimation strongly depends on both the temporal and spatial resolution of the precipitation data (Panagos et al., 2017; Kim et al., 2020).
Compared with in situ observations, gridded precipitation data (e.g., satellite-based, reanalysis and fused datasets) are not subjected to topographical limitations and could supply continuous precipitation data (Beck et al., 2017). These data have been widely used to estimate the rainfall erosivity in China, especially in the regions with scarce in situ observations (Teng et al., 2018), Germany (Risal et al., 2018), Africa (Vrieling et al., 2010), the USA (Kim et al., 2020), and other regions. They have greatly contributed to our knowledge of the spatiotemporal patterns of rainfall erosivity; however, the uncertainties in rainfall erosivity directly calculated by using gridded precipitation data have not been quantified, although obvious biases between gridded and observed precipitation values have been demonstrated (Freitas et al., 2020).
The Tibetan Plateau (TP) referred to as the Third Pole is one of the highest plateaus worldwide and has an average altitude of more than 4000 m (Yao et al., 2012). Since the mid-1950s, the TP has experienced significant warming exceeding that of other regions in the same latitude zone (Liu and Chen, 2000). Owing to increasing snowmelt and more frequent heavy precipitation events, which may cause more severe soil erosion, knowledge of the rainfall erosivity on the TP is highly important for soil sustainability and thus water and food security. The accuracy of the rainfall erosivity estimation depends mainly on the spatiotemporal accuracy of the precipitation data, especially on the TP, where the seasonal and regional precipitation patterns exhibit significant variability owing to westerly winds, the Indian monsoon, and land-atmosphere interaction.
Many efforts have been made to study the rainfall erosivity on the TP (Table 1). Most studies employed empirical methods; however, our study has demonstrated that these empirical methods always resulted to obvious biases over the TP, when compared with the values based on the 1 min precipitation data by using the standard method (paper submitted). In terms of the type of precipitation data, dozens of station-based precipitation data were commonly used to calculate the rainfall erosivity (e.g., Qin et al., 2016; Gu et al., 2020). Yue et al. (2022) reported that the scarce weather stations can significantly reduce the estimation accuracy of the rainfall erosivity in the regions with complex terrains and climates, especially on the TP. Therefore, the accuracy of the estimated rainfall erosivity on the TP is largely reduced by the current empirical estimation models and the scarcity of historical weather stations. In other words, the precipitation data with high spatiotemporal resolution are essential to calculate the rainfall erosivity on the TP.
Table 1R factor of TP in previous studies.

CRU_TS4: Climatic Research Unit Time Series 4 gridded precipitation product. TRMM: Tropical Rainfall Measuring Mission gridded precipitation product. HASM: High accuracy surface modeling. Empirical method means the rainfall erosivity values are calculated by using the empirical equations based on daily or monthly precipitation data. The standard method is proposed by USLE or RUSLE. The boundaries of the TP used in these studies have some slight differences.
To expand the spatial coverage and extend the time series of rainfall erosivity over the TP, the various gridded precipitation datasets, for example, satellite-based Tropical Rainfall Measuring Mission (TRMM) and station-based Climatic Research Unit Time Series 4 gridded precipitation datasets (CRU_TS4), have also been introduced into the soil erosion study of the TP in recent decades (Yan et al., 2010; Teng et al., 2017; Cao et al., 2018). The performances of these gridded precipitation datasets mainly depend on the spatiotemporal accuracy of the gauge observations, and thus these datasets always present obvious biases due to insufficient density of the weather station network over the TP (Yuan et al., 2021). It is notable that the significant biases of various gridded precipitation datasets have also been widely identified (Sun et al., 2018), and their impacts on the rainfall erosivity estimation have not been assessed.
In recent hydrometeorology studies, the model-based gridded precipitation datasets are taken into consideration (Li et al., 2020; Zhou et al., 2021), because they could resolve the complex topography and climate effects over the TP and provide long-term data by setting simulation periods. The European Center for Medium-Range Weather Forecasts Reanalysis 5 (ERA5) as the new generation is one of the most widely used precipitation datasets in the world (Hersbach et al., 2019). Compared with other gridded precipitation datasets, ERA5 succeeded in reproducing the interannual and decadal variabilities of precipitation reflecting the spatiotemporal patterns (Yuan et al., 2021), and performed marginally better in detecting daily precipitation over the whole TP for long-term periods (Jiang et al., 2021), despite the fact that a bias in precipitation amounts was also reported (Jiang et al., 2021; Jiao et al., 2021). Therefore, this study aims to reconstruct the historical annual rainfall erosivity with 0.25∘ spatial resolution in 1950–2020 over the TP, by employing the 0.25∘ hourly ERA5 precipitation data for 71 years to generate long-term background values and utilizing the 1 min precipitation observations at 1787 weather stations for 7 years to identify and correct the biases of the estimates. In detail, this paper describes (1) the performance of ERA5 precipitation data at the weather stations, (2) the performance of the ERA5-based annual rainfall erosivity calculated by using the standard method recommended by the USLE model and (3) the correction of the ERA5-based annual rainfall erosivity and the validation of the newly generated dataset.
2.1 Tibetan Plateau
The study area is the TP (26–40∘ N, 73–105∘ E), which is located in southwestern China and covers an area of approximately 2.5 million km2. The elevation of the TP ranges from 84 to 8246 m, with an average value of 4379 m. Precipitation in the southeastern TP is influenced by warm, humid Indian monsoons, whereas in the western TP, it is influenced more strongly by the mid-latitude westerlies (Yao et al., 2012). The annual precipitation is concentrated in the period from May to October (Gu et al., 2020), and shows a spatial pattern of a wet east and west with a dry middle (Li et al., 2020). Along with the significant climate change and a very fragile ecological environment, the TP has high potential for soil loss, especially in the eastern TP and Hengduan Mountains, which are among the most severely eroded areas in China (Teng et al., 2019).
2.2 Precipitation data
Previous studies of the TP have used in situ precipitation observations with <50 stations and coarse temporal resolution, e.g., hourly (Yue et al., 2021), daily (Wang et al., 2017), or half-monthly (Teng et al., 2018; Gu et al., 2020; Liu et al., 2020). By contrast, this study estimated the rainfall erosivity on the TP using precipitation observations at 1 min intervals in 2013–2020 at 1787 weather stations obtained from the National Meteorology Information Center of the China Meteorological Administration (Fig. 1a).
To ensure the accuracy of the in situ precipitation data, we evaluated their quality. The data integrity of each station was first checked using quality control codes at 1 min intervals by month. Because precipitation on the TP occurs mainly from May to September, observed data with an integrity of >90 % from May to September in a year can be used to calculate the annual rainfall at the station. The number of stations with data suitable for calculating the annual rainfall erosivity for each year is shown in the lower left corner of Fig. 1a; it ranges from 628 to 1472, with an average of 1114 stations for 2013–2020 (excluding 2017, because a disruption in data reception caused the loss of precipitation observations in August 2017). Moreover, we examined the station density in each 0.25∘ grid, which is consistent with the spatial resolution of the ERA5 data (Fig. 1b). The number of stations in each grid varies from 1 to 29, and the mean value is 2.1. A total of 836 grids (20 % of the grids covering the TP) have observed precipitation values. Because the data quality varies, the available grids with observations change annually; on average, there are 589 available grids with observation records for 2013–2020, excluding 2017.
The hourly 0.25∘ ERA5 data represent the most recent generation of ECMWF global atmospheric reanalysis and provide higher spatial resolution than ERA-Interim and other improvements since 1979 (Hersbach et al., 2019). The precipitation data are the sum of large-scale precipitation and convective precipitation consisting of rain and snow, as determined by the ECMWF Integrated Forecasting System.
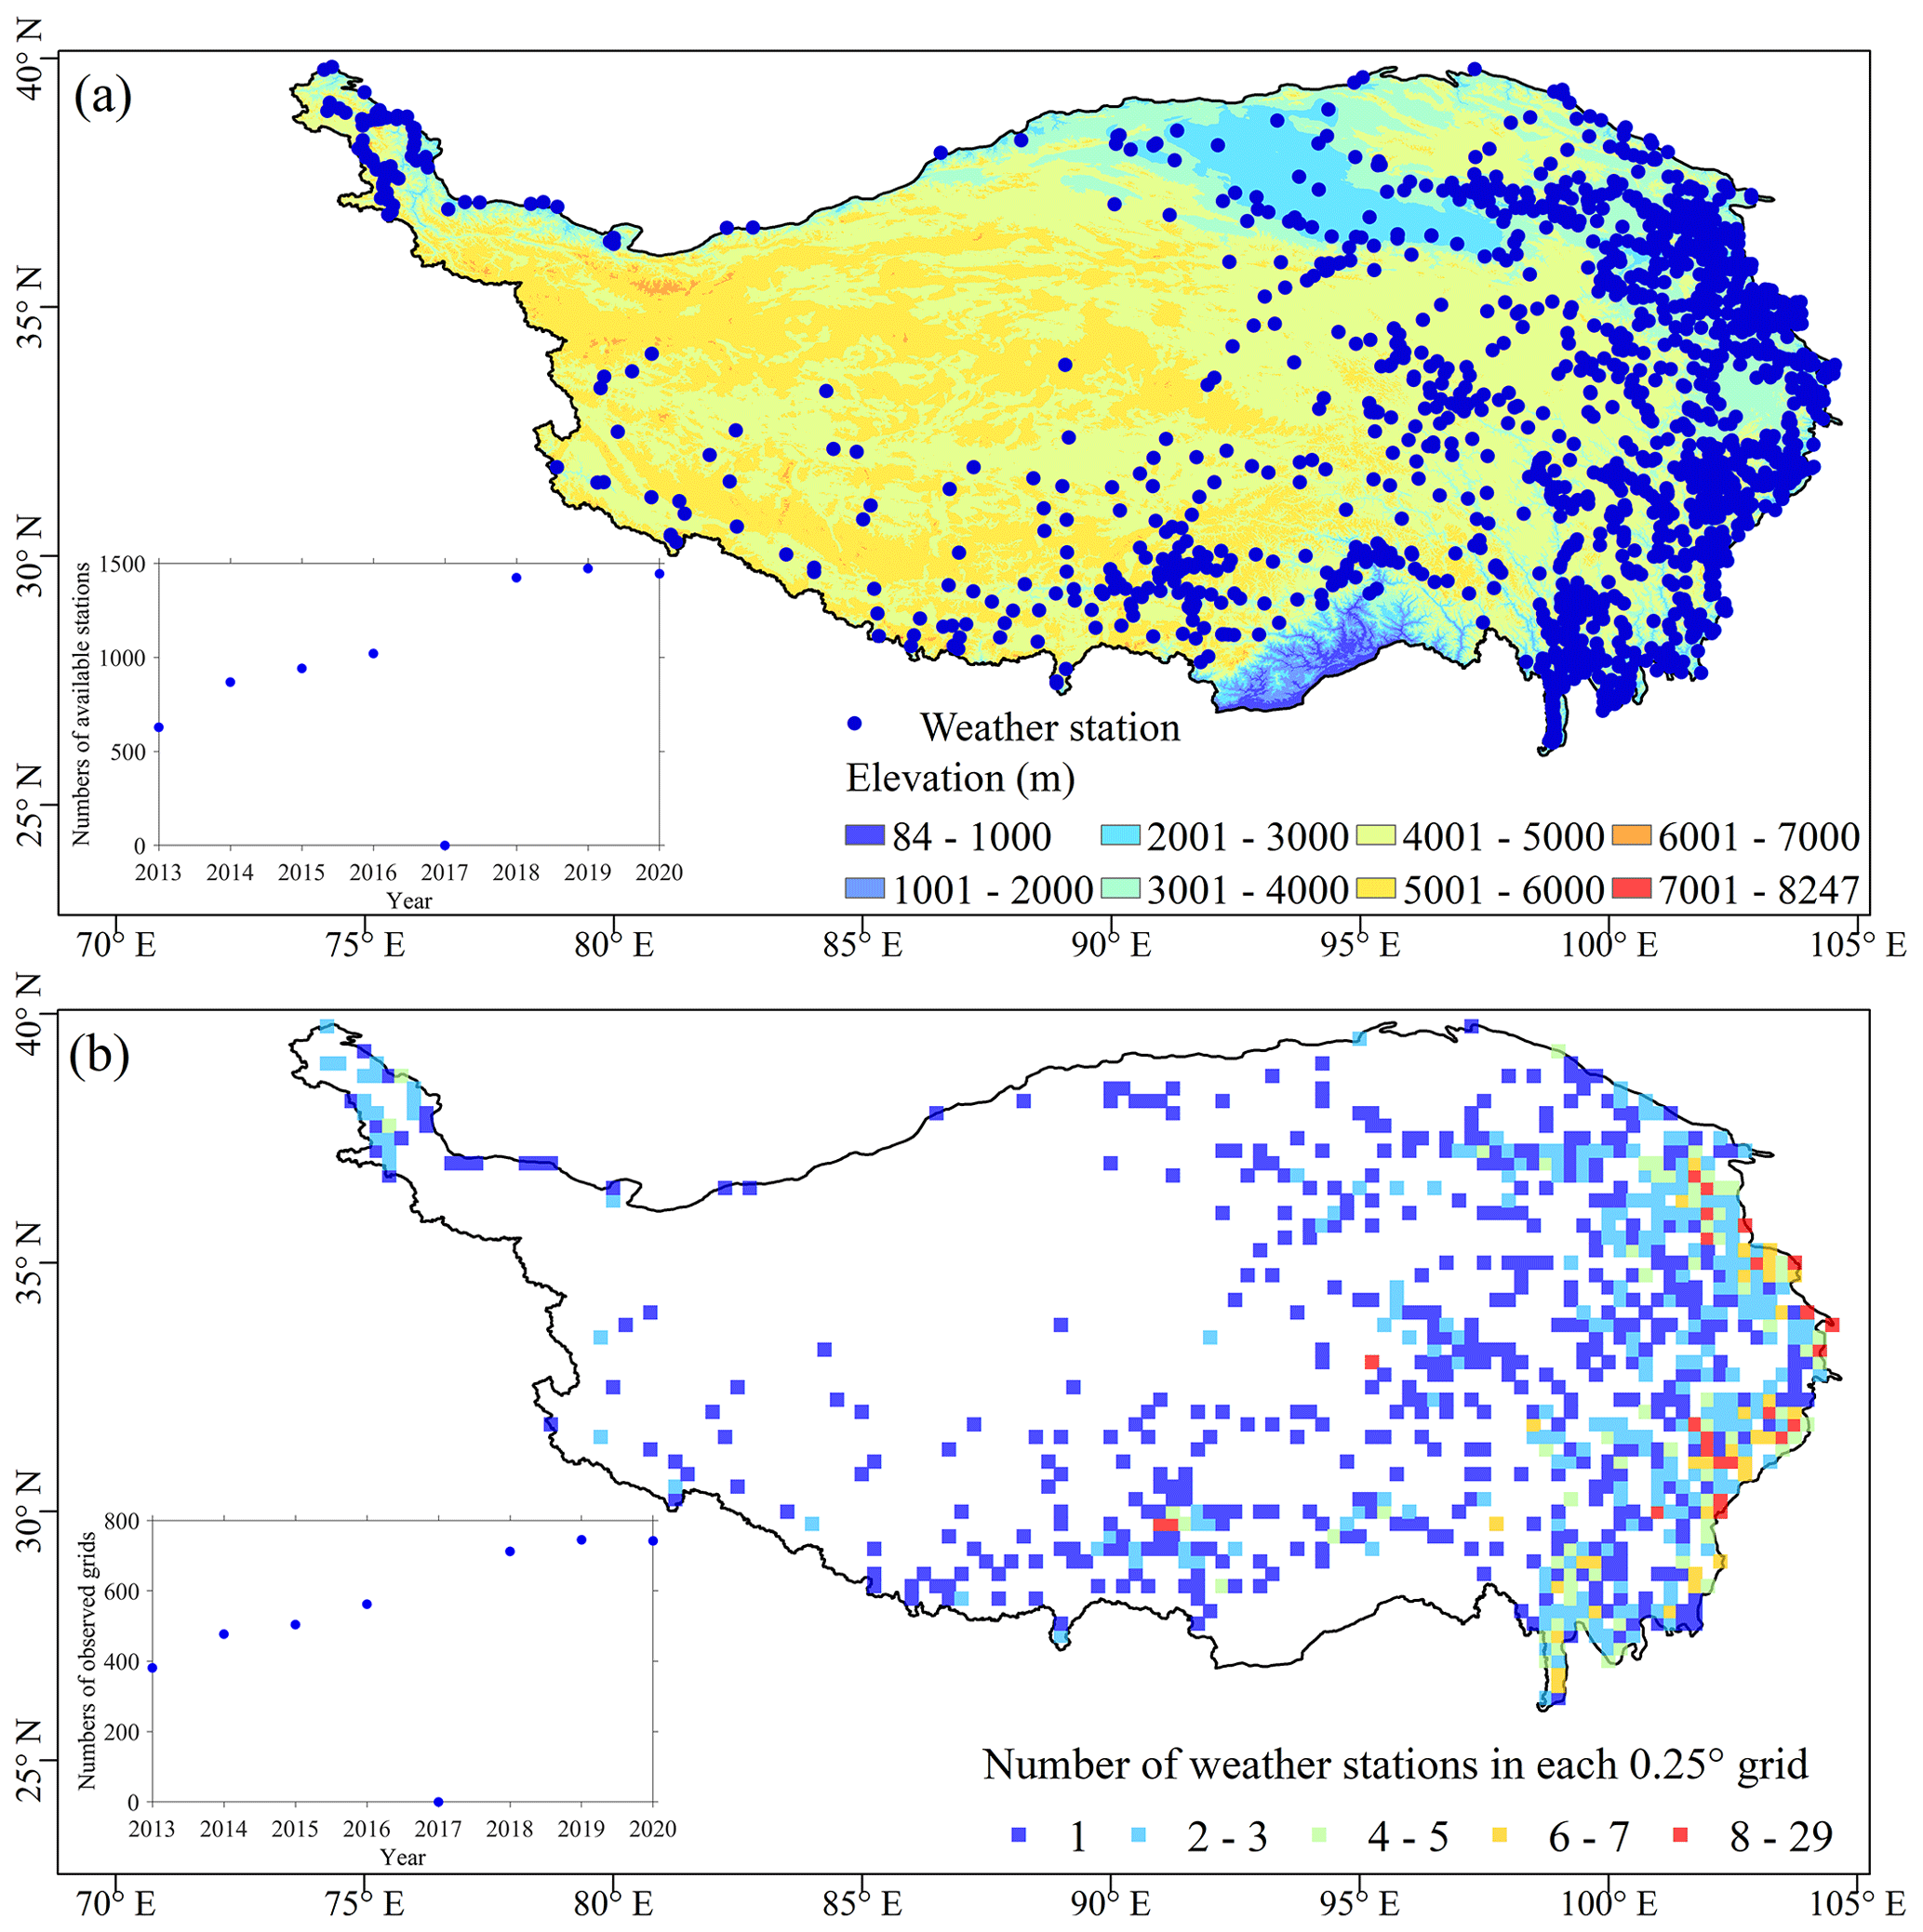
Figure 1(a) Spatial distribution of weather stations on TP; the inset shows the number of available weather stations by year. (b) Number of available weather stations in each grid with 0.25∘ spatial resolution; the inset shows the number of available weather stations by year.
Figure 2 shows the overall algorithm for generating the annual rainfall erosivity dataset with the 0.25∘ spatial resolution over the TP in 1950–2020. We firstly calculated the annual rainfall erosivity by using the standard method of rainfall erosivity based on the 1 min in situ precipitation observations and 0.25∘ hourly ERA5 precipitation data. Secondly, the performances of the ERA5 were systematically assessed in terms of the detection accuracy of the precipitation for erosive events and the estimation accuracy of ERA5-based annual rainfall erosivity. Finally, the historical annual rainfall erosivity data for the TP were produced after correcting the ERA5-based annual rainfall erosivity.
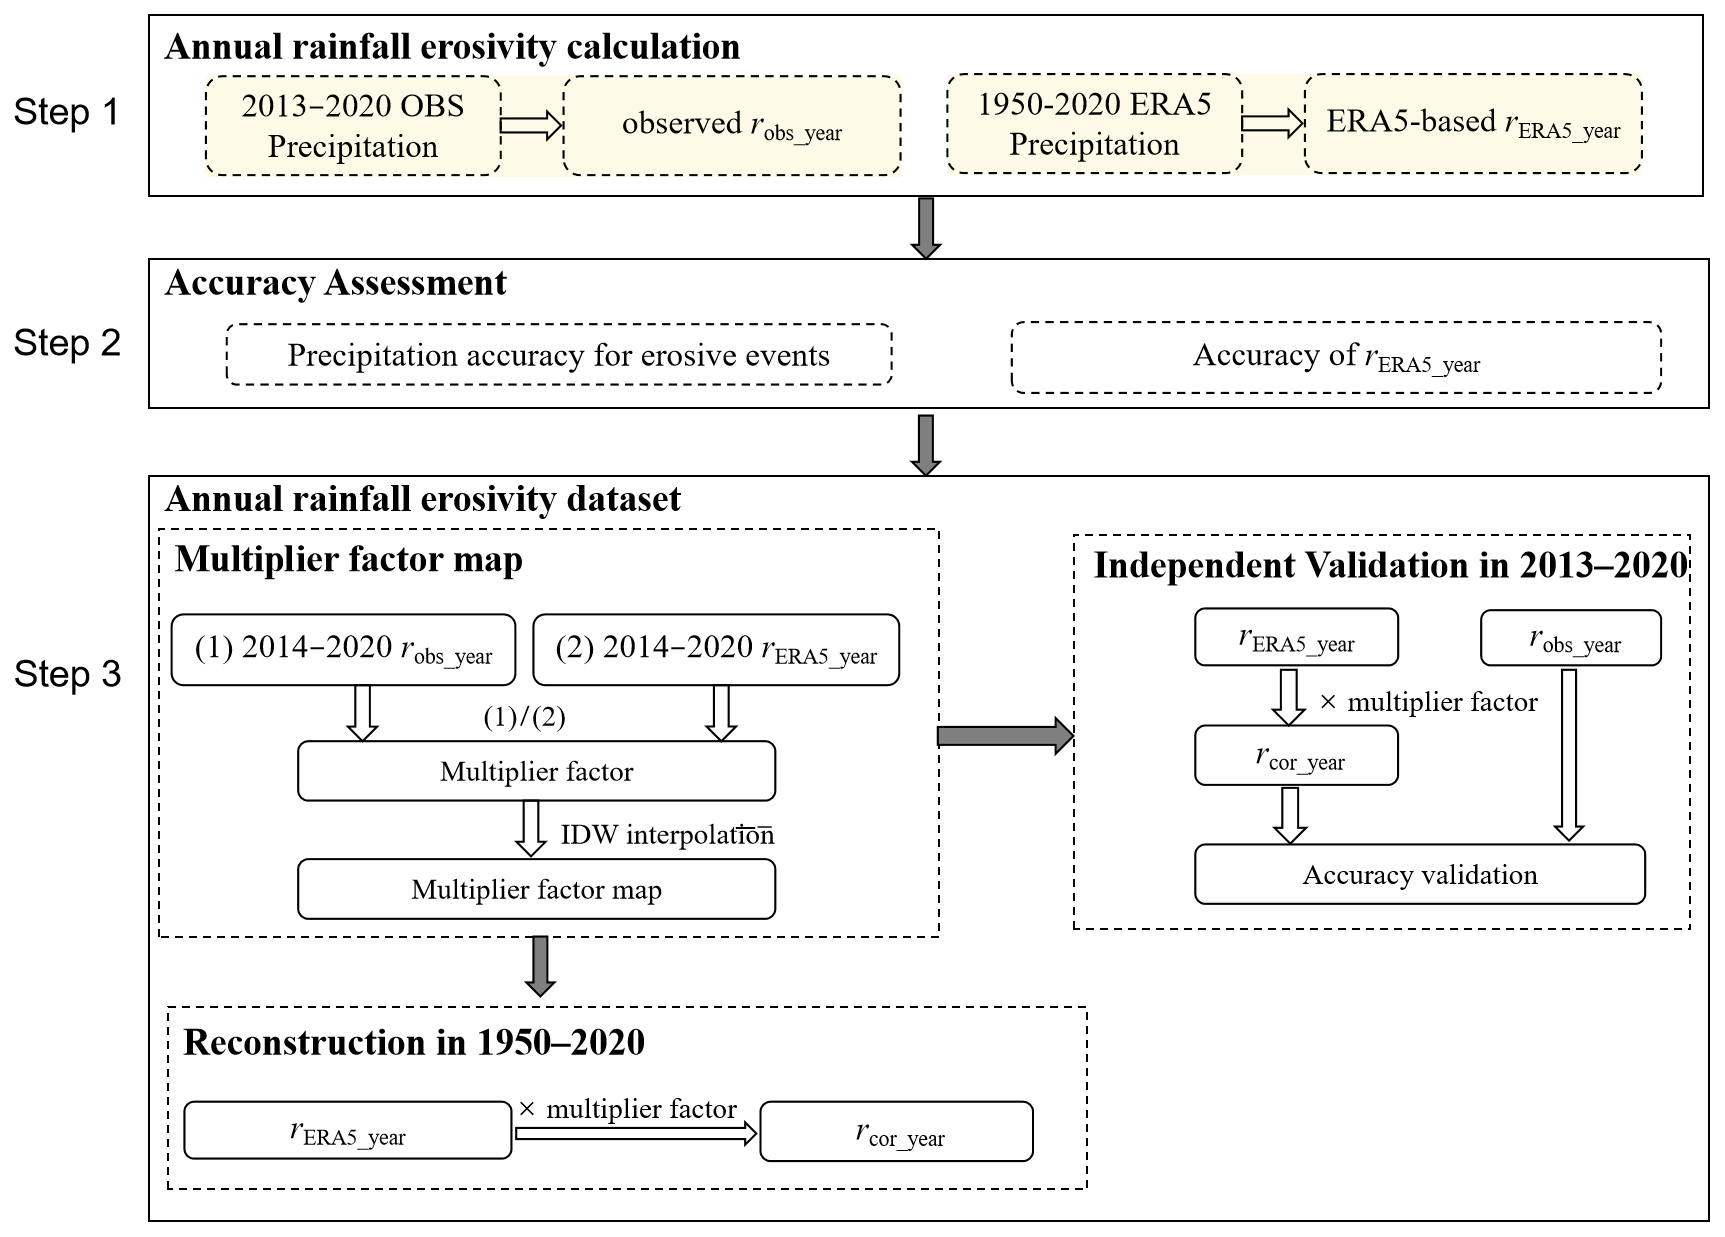
Figure 2Schematic representation of algorithm for generating annual rainfall erosivity dataset for 1950–2020. robs_year and rERA5_year represent the station-based and ERA5-based annual rainfall erosivity values, respectively. rcor_year means the corrected values of the rERA5_year by using the multiplier factor map.
3.1 Algorithm of annual rainfall erosivity
A rainfall event is defined following Wischmeier and Smith (1978) as having measurable rainfall with no interruption or at most a 6 h interruption. If a rainfall event is interrupted for more than 6 h, subsequent rainfall is considered to belong to a new rainfall event. Rainfall events of more than 12 mm are selected as erosive events following Xie et al. (2000), and the EI30 index of the erosive event is calculated. Specifically, the rainfall erosivity of an erosive rainfall event is calculated as follows (Brown and Foster, 1987):
where E (MJ ha−1) is the total energy of the erosive event, and revent (MJ mm ha−1 h−1) is the event rainfall erosivity of the event. For the 1 min precipitation data (ERA5 data), ir (mm h−1) is the rainfall intensity for the rth minute (hour), er (MJ ha−1 mm−1) is the unit energy for the rth minute (hour), Pr (mm) is the rainfall amount for the rth minute (hour), n is the rainfall duration, and I30 (mm h−1) is the maximum contiguous 30 min (1 h) peak intensity. After the event rainfall erosivity at all stations was calculated, we identified and removed extreme outliers of the event rainfall erosivity at each site, which resulted from temporary abnormalities in the automatic observation equipment and were not identified during quality control of the precipitation data. We used boxplots to detect extreme outliers. The lower and upper quartiles were defined as the 25th percentile of event rainfall erosivity (Q1) and the 75th percentile (Q2); the difference (Q2 − Q1) is called the interquartile range (IQR). Event rainfall erosivity data at a station outside the lower and upper bounds (Q1 − 3IQR, Q2 + 3IQR) are considered extreme outliers.
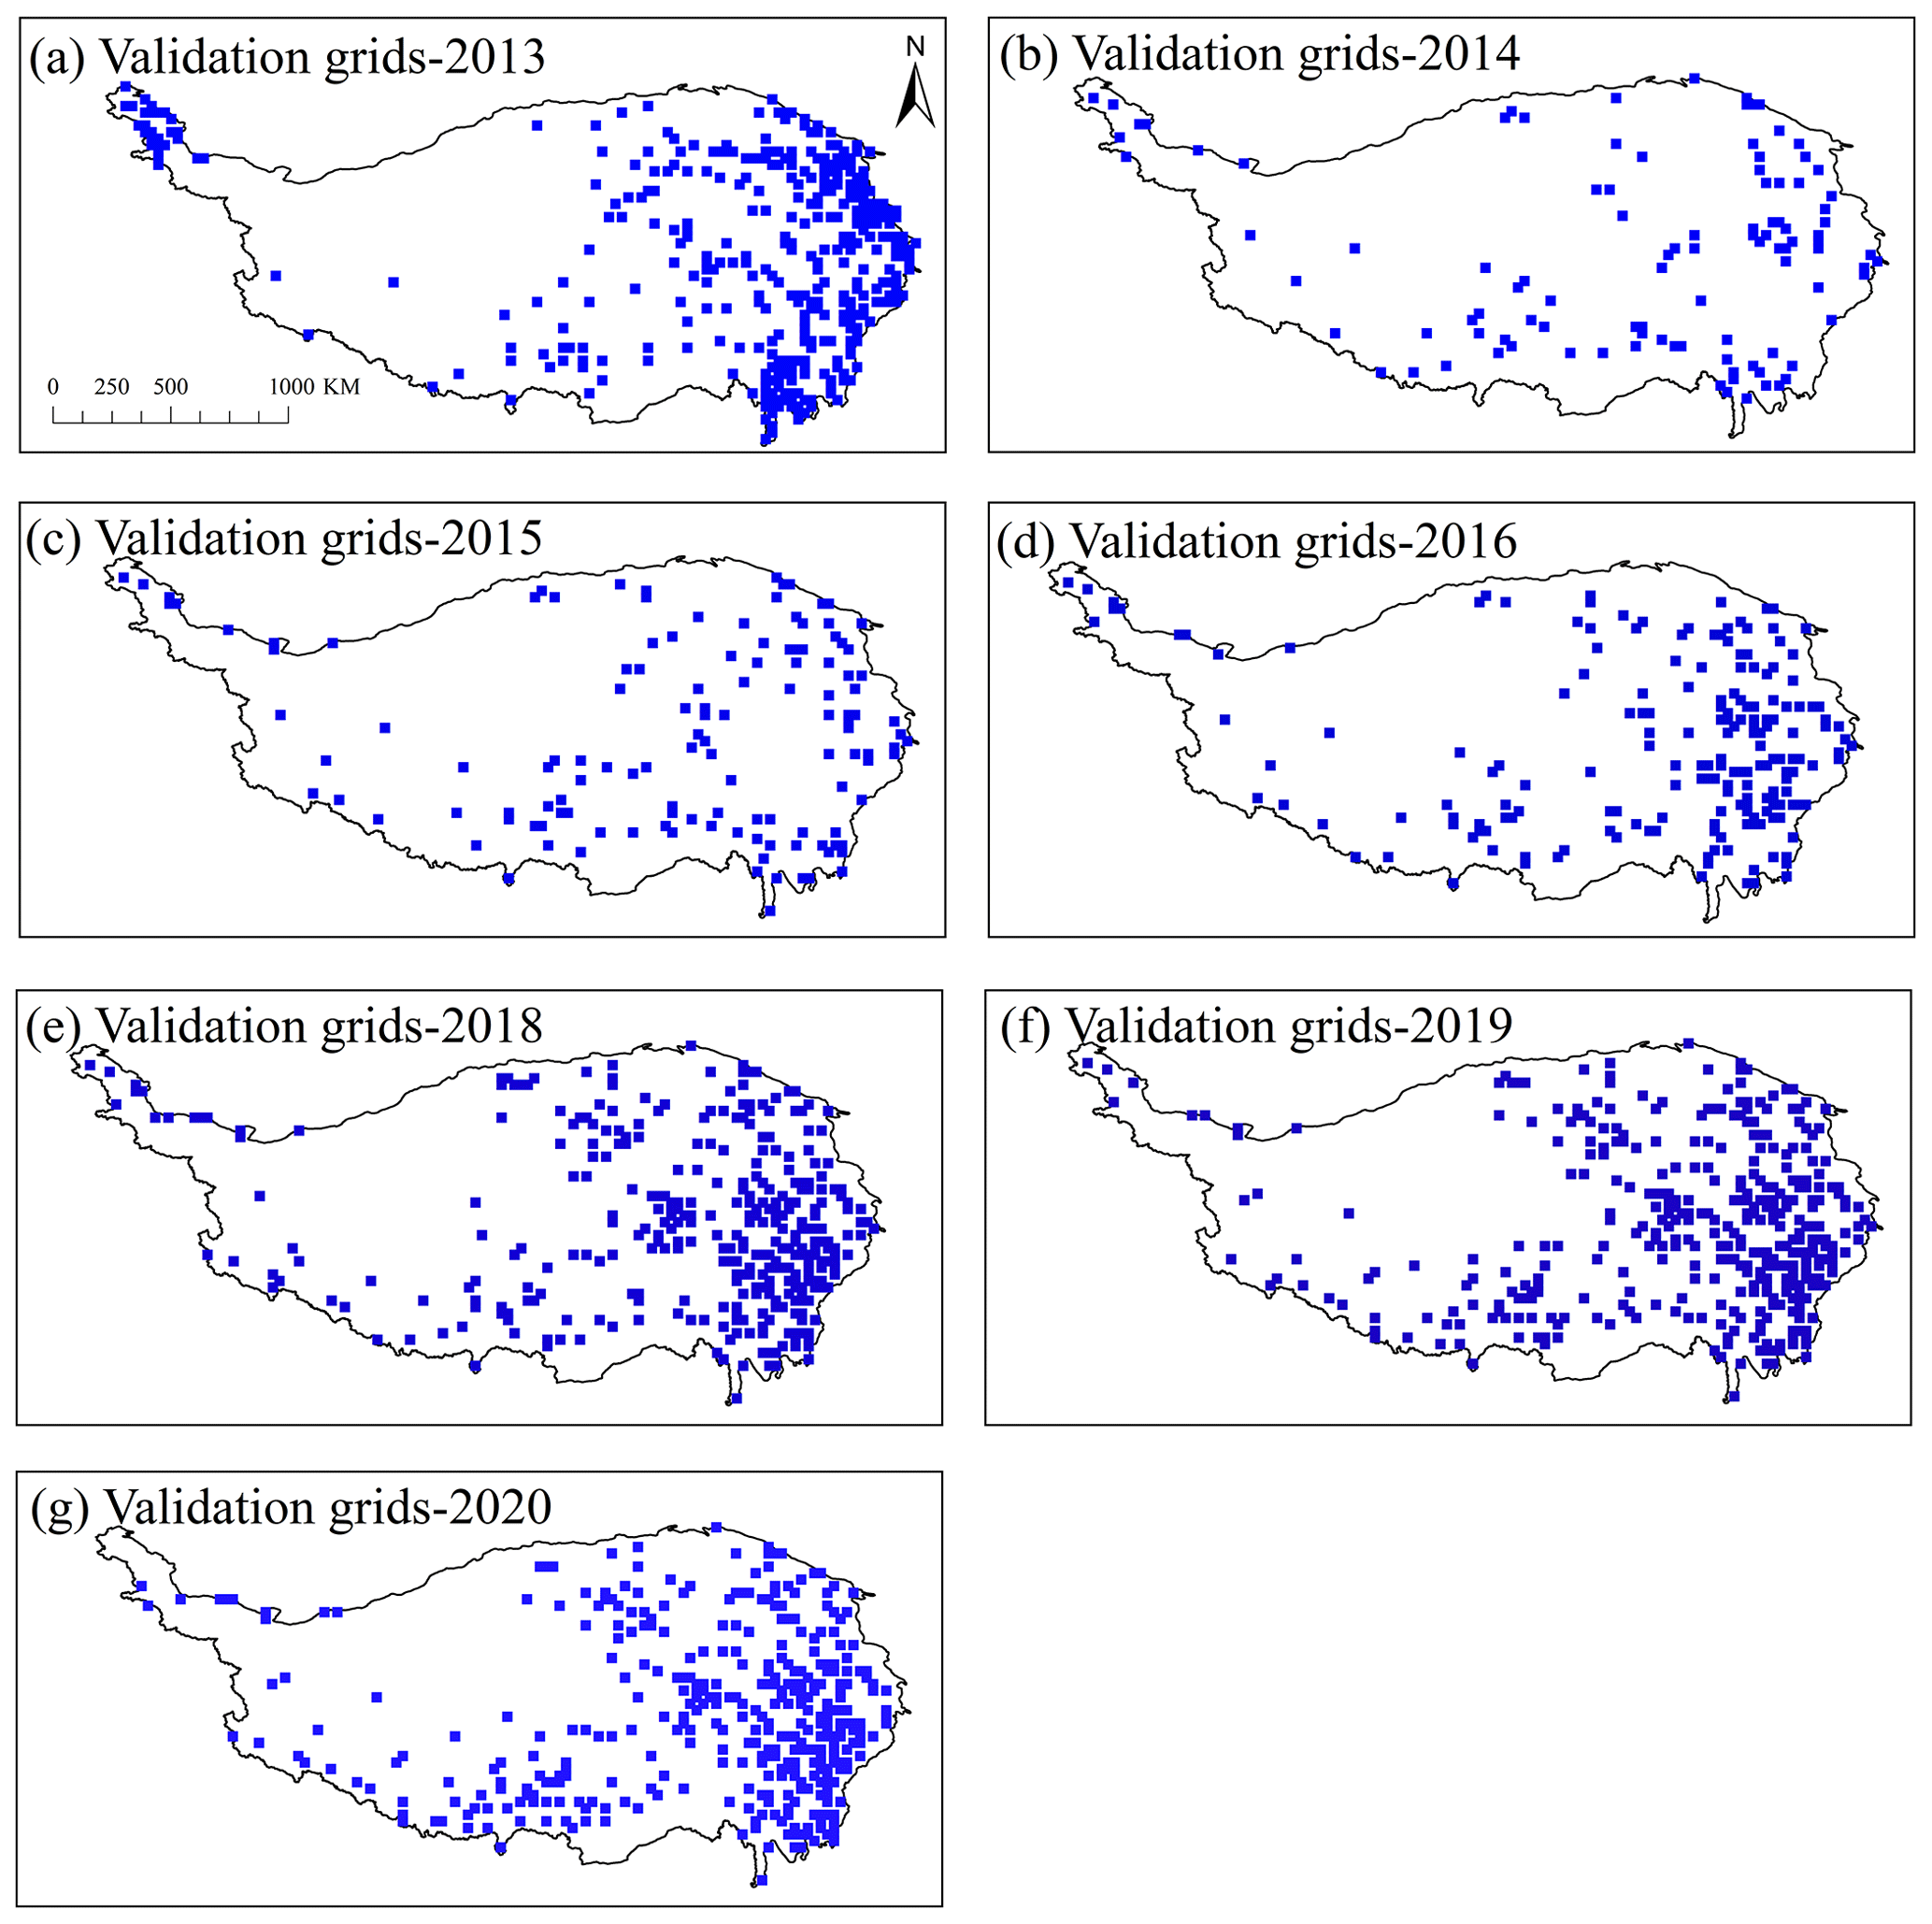
Figure 3Spatial distribution of validation grids covering the TP for 2013–2020 (excluding 2017).
The observed annual rainfall erosivity values (rstation_year) were obtained by summing the rainfall erosivity for all erosive events per year by station. Next, the ERA5-based annual rainfall erosivity (rERA5_year) for all the grids in the TP was calculated. Notably, for easy comparison of rstation_year and rERA5_year, the rstation_year values were upscaled to the grid values (robs_year) with 0.25∘ spatial resolution by averaging the station-based values in the same grid. Figure 1b shows the spatial distribution of the available grids with robs_year. Steps 2 and 3 in Fig. 2 are based on robs_year and rERA5_year data at grid scale.
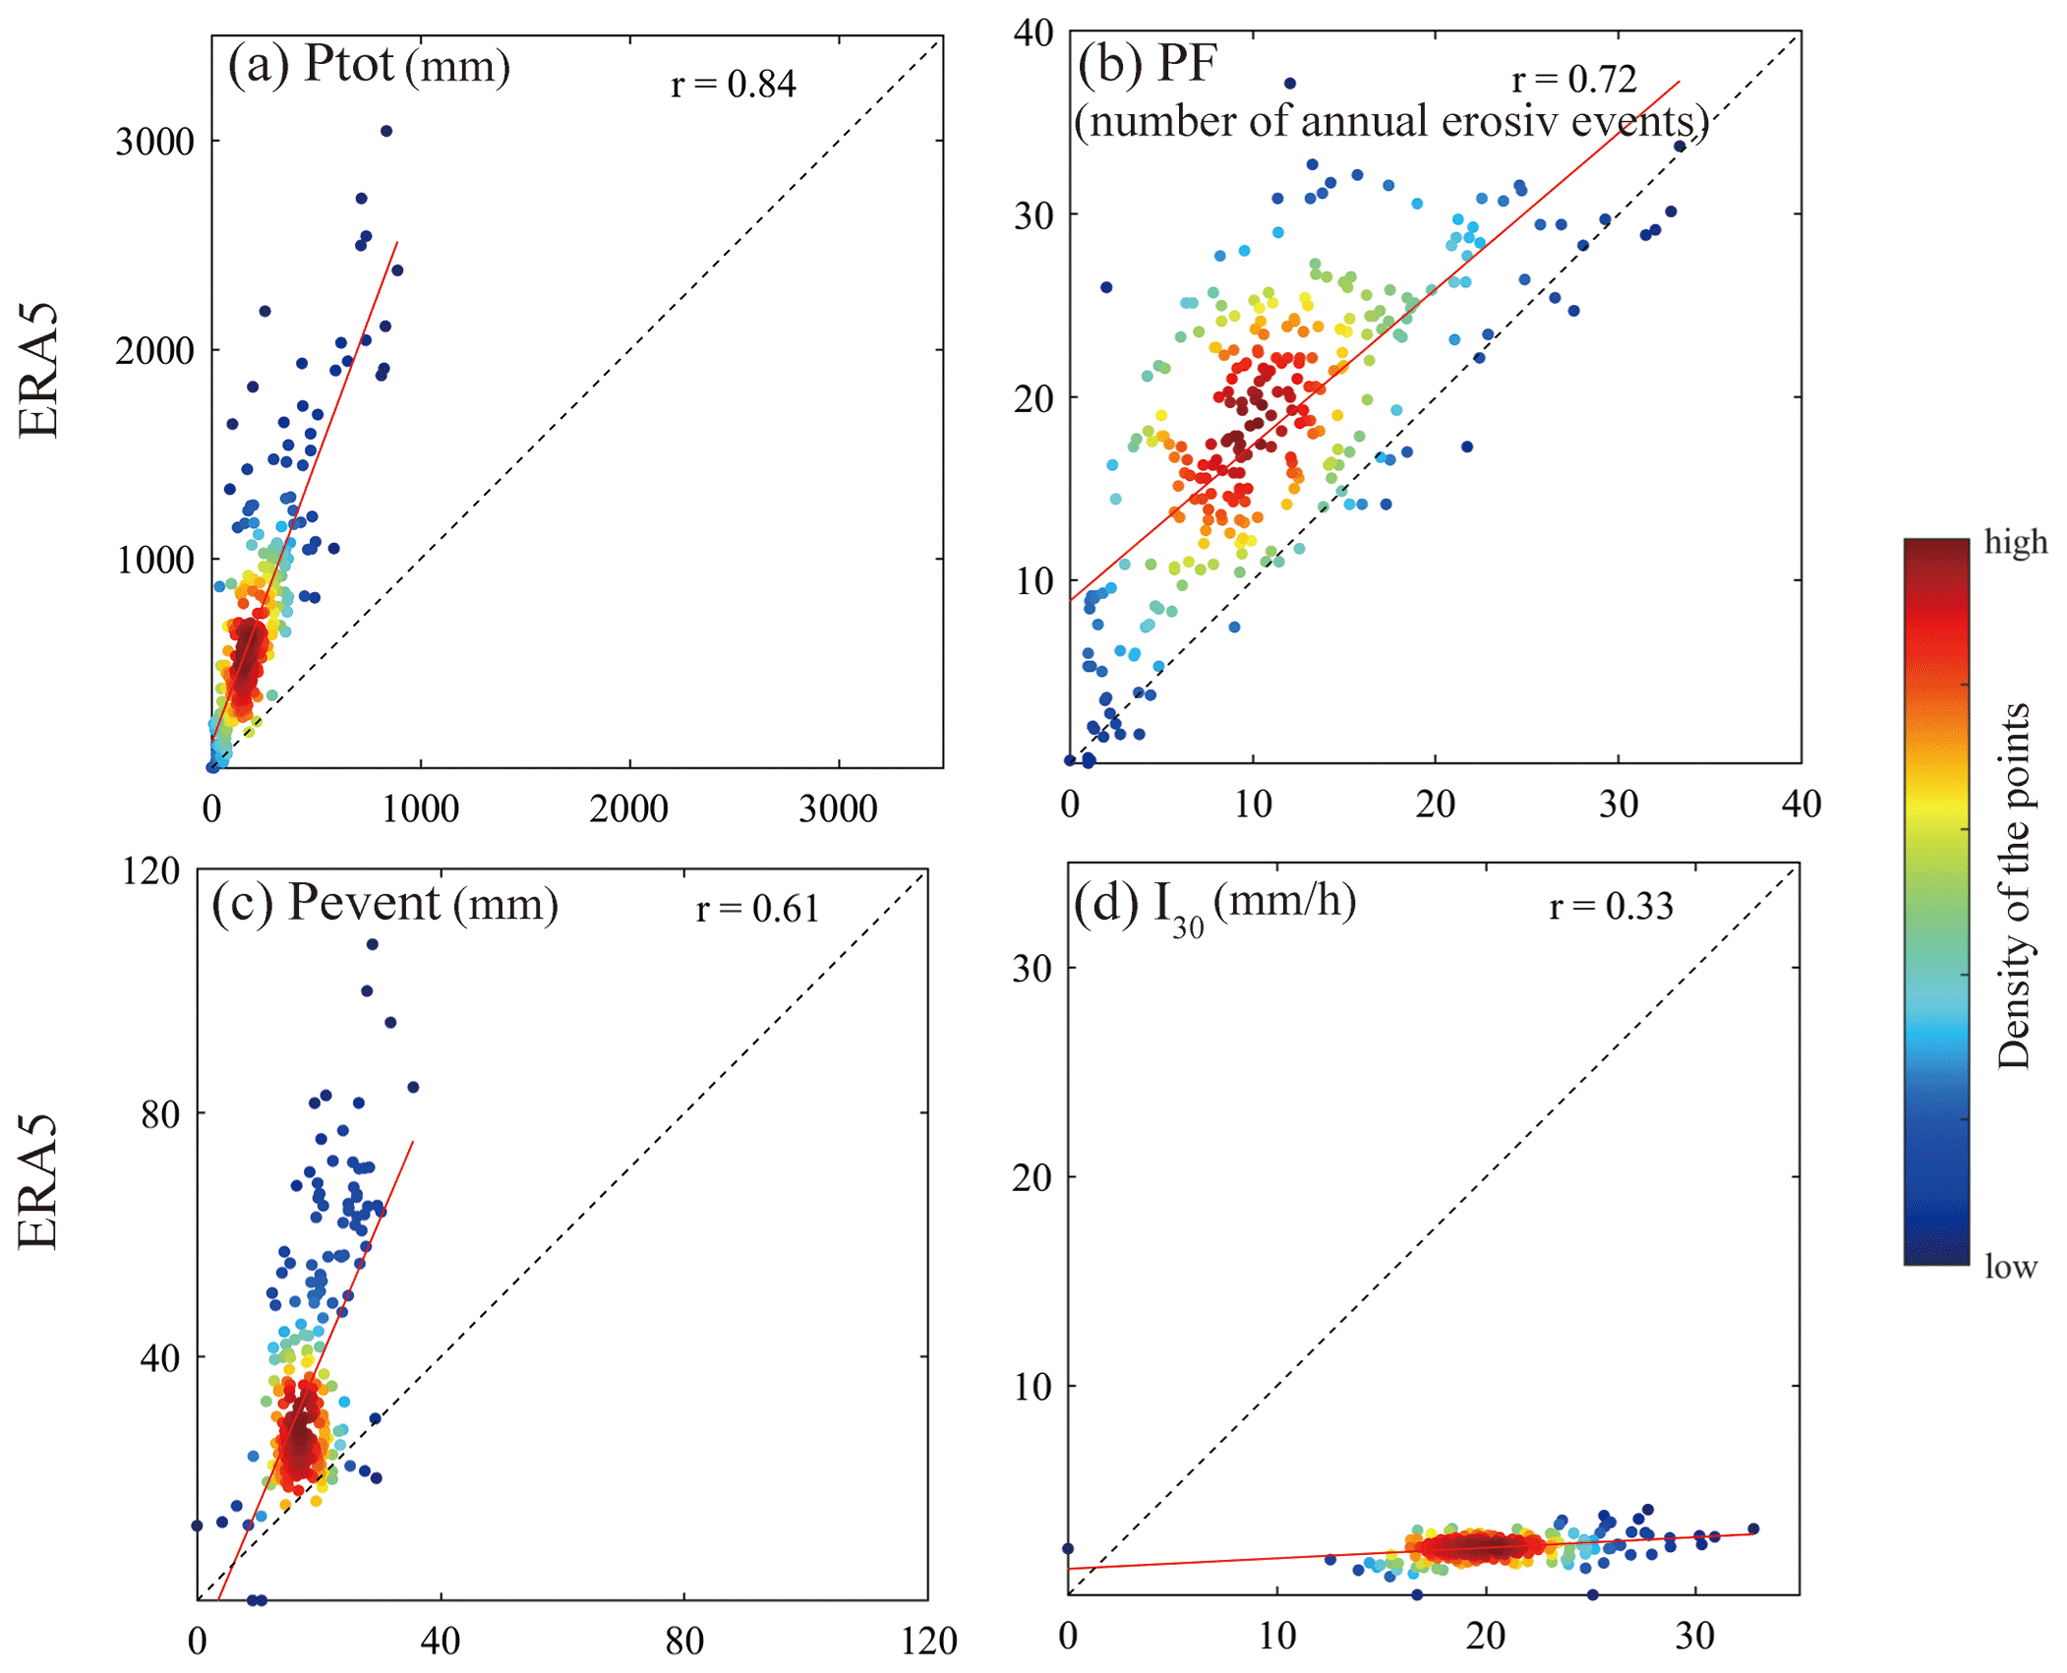
Figure 4Scatterplots of the station-based multiyear average (a) annual erosive precipitation amount (Ptot), (b) annual erosive precipitation frequency (PF), (c) mean erosive event precipitation amount (Pevent), (d) mean I30 for erosive events (I30) vs. those derived from ERA5 data at the corresponding grid cells in 2013–2020.
3.2 Assessment of the performance of the ERA5 precipitation data
The performance of the ERA5 precipitation data was assessed at 280 grid cells, which corresponded to 7 % of all the grids over the TP. Given the importance of erosive rainfall events to soil erosion, we focused on the performance of the ERA5 precipitation data in detecting characteristics of erosive rainfall event, including multiyear averaged annual erosive precipitation amount and frequency, and mean erosive event precipitation amount and I30.
The mean values of rERA5_year for 2013–2020 were compared with those of robs_year by station. The absolute bias (AB) and correction coefficient (r) were used to evaluate the accuracy of annual rainfall erosivity estimation using ERA5 data. The AB is calculated as shown in Eq. (4).
where i is the ith annual rainfall erosivity value, is the ERA5-based annual rainfall erosivity in the ith year, is the observed annual rainfall erosivity in the ith year, and n is the number of years of data. Moreover, the empirical orthogonal function (EOF) was employed to assess the spatiotemporal pattern of annual rainfall erosivity revealed by the ERA5 reanalysis precipitation data by comparing it with the pattern revealed by the observed values.
3.3 Reconstruction and validation of annual rainfall erosivity
For the soil erosion process it is known that not all the precipitation events but the erosive events have a close relationship with the water erosion process. Our study indicated the precipitation characteristics derived from ERA5 data for erosive events showed high correlation with those from in situ precipitation observations over the TP (Fig. 4). In addition, there was a high correlation between the station-based and ERA5-based annual rainfall erosivity (Fig. 5), and their spatiotemporal distribution patterns also showed good agreement (Fig. 7). These findings demonstrate that it is reasonable to generate the rainfall erosivity dataset for the TP by using the ERA5 precipitation data, and the correction is also essential because of the obvious biases identified in the ERA5-based rainfall erosivity values.
Relative changes between the in situ and modeled precipitation are always used to correct the modeled precipitation for accuracy improvement, such as the global precipitation data from WorldClim (Fick et al., 2017), the gridded precipitation data of the China Meteorological Forcing Dataset (He et al., 2020) and the bias adjusted ERA5 precipitation data (Cucchi et al., 2020). Given the close correlation between the precipitation and rainfall erosivity, the relative changes were also employed to correct the ERA5-based annual rainfall erosivity in this study. Here, we have used a hypothesis that the bias of the ERA5-based annual rainfall erosivity resulting from ERA5 precipitation data at each grid remains steady by year. In detail, the correction process can be divided into three steps. Firstly, the robs_yearvalues were divided by rERA5_year for each year, and then the calculated results, i.e., the multiplier factor values, were averaged for years. Secondly, inverse distance weighted (IDW) interpolation was used to generate a multiplier factor map of the TP with 0.25∘ spatial resolution. Thirdly, the corrected annual rainfall erosivity dataset (rcor_year) was obtained as the product of rERA5_year and the multiplier factor for each grid.
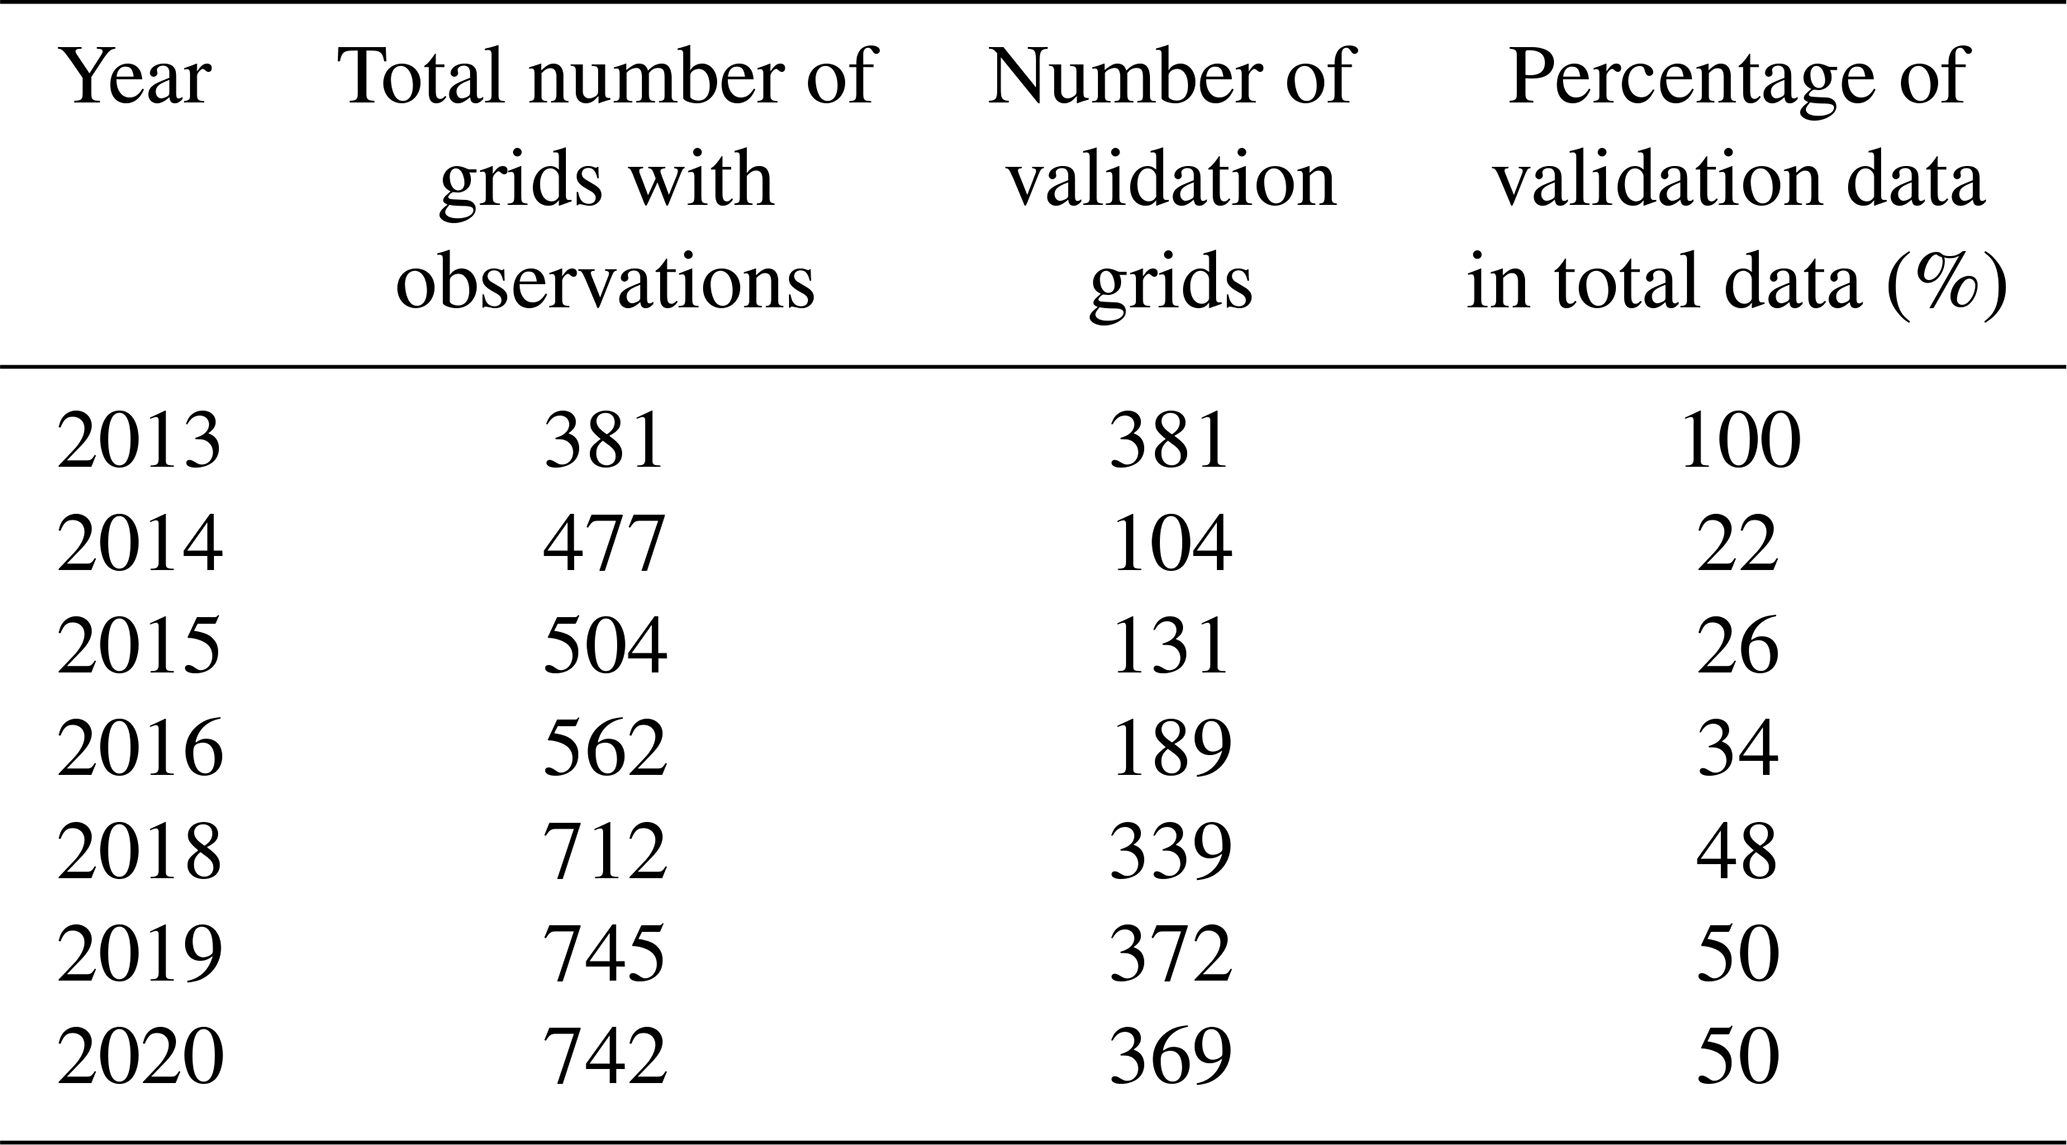
Specifically, there are 373 grids with observed annual rainfall erosivity values from 2014 to 2020. The robs_year and rERA5_year values in these grids were used to generate the multiplier factor map. The robs_yearand rERA5_year values in other grids for 2014–2020, which were not used before, are available for assessing the accuracy. Moreover, the year 2013 was regarded as a complete verification year, in which the assessment of the rcor_year was conducted in all the TP grids with robs_year values. Table 2 lists the number of validation grids in each year, and Fig. 3 shows the spatial distribution of the validation grids for 2013–2020 (excluding 2017).
4.1 Detecting accuracy of ERA5 for erosive rainfall events
Figure 4 compares the multiyear average annual erosive precipitation amount and frequency, and mean erosive event precipitation amount and I30 derived from ERA5 precipitation data with those from in situ observations. In detail, the EA5-based multiyear average annual erosive precipitation amount is three times more than the station-based value across the TP. The overestimation of the multiyear average annual precipitation amount was also reported by Jiao et al. (2021). The ERA5 overestimated the annual erosive precipitation frequency by 1.6 times. For the erosive event rainfall amount, the ERA5 value was almost twice as much as the station-based value, which differed from the findings of Jiao et al. (2021) that the daily precipitation amounts with more than 10 mm are underestimated by ERA5. This result demonstrates that the erosive rainfall events in the TP cannot be simply equivalent to the daily precipitation events (Chen et al., 2022). In addition, the mean I30 of ERA5 for erosive events are only one ninth of the station-based value. Because the relatively slight overestimation of ERA5 precipitation data in the erosive event precipitation amount could not offset the substantial underestimation in I30, the ERA5-based estimates showed a marked tendency to underestimate the rainfall erosivity when compared to the station-based estimates. Overall, the comparison between the two data sources indicates that there were significant biases of ERA5 data in detecting precipitation characteristics for erosive events in the TP, but also presented high corrections with correlation coefficients being 0.33–0.84.
4.2 Evaluation of rainfall erosivity estimations using ERA5 data
The accuracy of annual rainfall erosivity estimations using the ERA5 precipitation data for 2013–2020 was assessed and compared with the robs_year values in 280 grids covering the TP. The correlation coefficient of the mean annual rainfall erosivity based on the observed and ERA5 precipitation data is 0.71. For most stations, the ERA5-based values were significantly underestimated (Fig. 5).
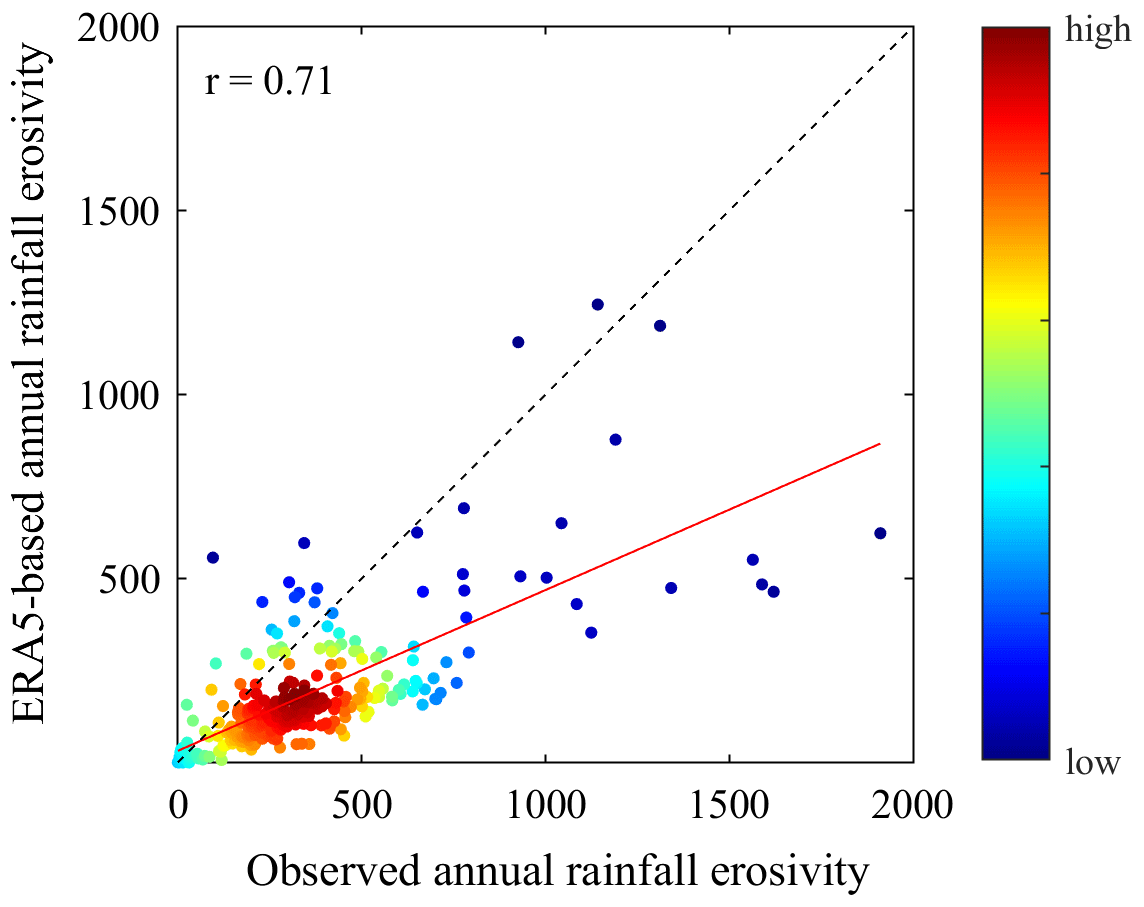
Figure 5Comparison of mean annual rainfall erosivity based on observed and ERA5-based results for 7 years (2013–2020, excluding 2017). The dashed line is the result of an optimal model (with an intercept of 0 and regression coefficient of 1). The red line is the regression result. Colors of dots represent the grid density. Unit: MJ mm ha−1 h−1 yr−1.

Figure 6Mean annual rainfall erosivity in 2013–2020 (excluding 2017) based on (a) in situ precipitation observations and (b) ERA5 reanalysis precipitation data. (c) Absolute bias between the values based on ERA5 reanalysis data and precipitation observations. Unit: MJ mm ha−1 h−1 yr−1.
To further evaluate the quality of the mean annual rainfall erosivity estimation using ERA5 data, the performance of the ERA5 data in each grid was evaluated, as shown in Fig. 6. The spatial pattern of the ERA5-based mean annual rainfall erosivity is consistent with that of the observed values. Specifically, areas with large annual rainfall erosivity are located mainly in the southeastern part of the plateau, especially at the southeast edge, whereas the mean annual values in the northwestern part of the plateau are relatively small; however, the observed mean annual rainfall erosivity on the TP is 344 MJ mm ha−1 h−1 yr−1, and the ER5-based results underestimate this value by 47 %. Moreover, except for most of the grids in the northwest corner and individual grids in the southeastern part of the plateau, the mean annual rainfall erosivity values in most grids in the TP are lower than the observed values.
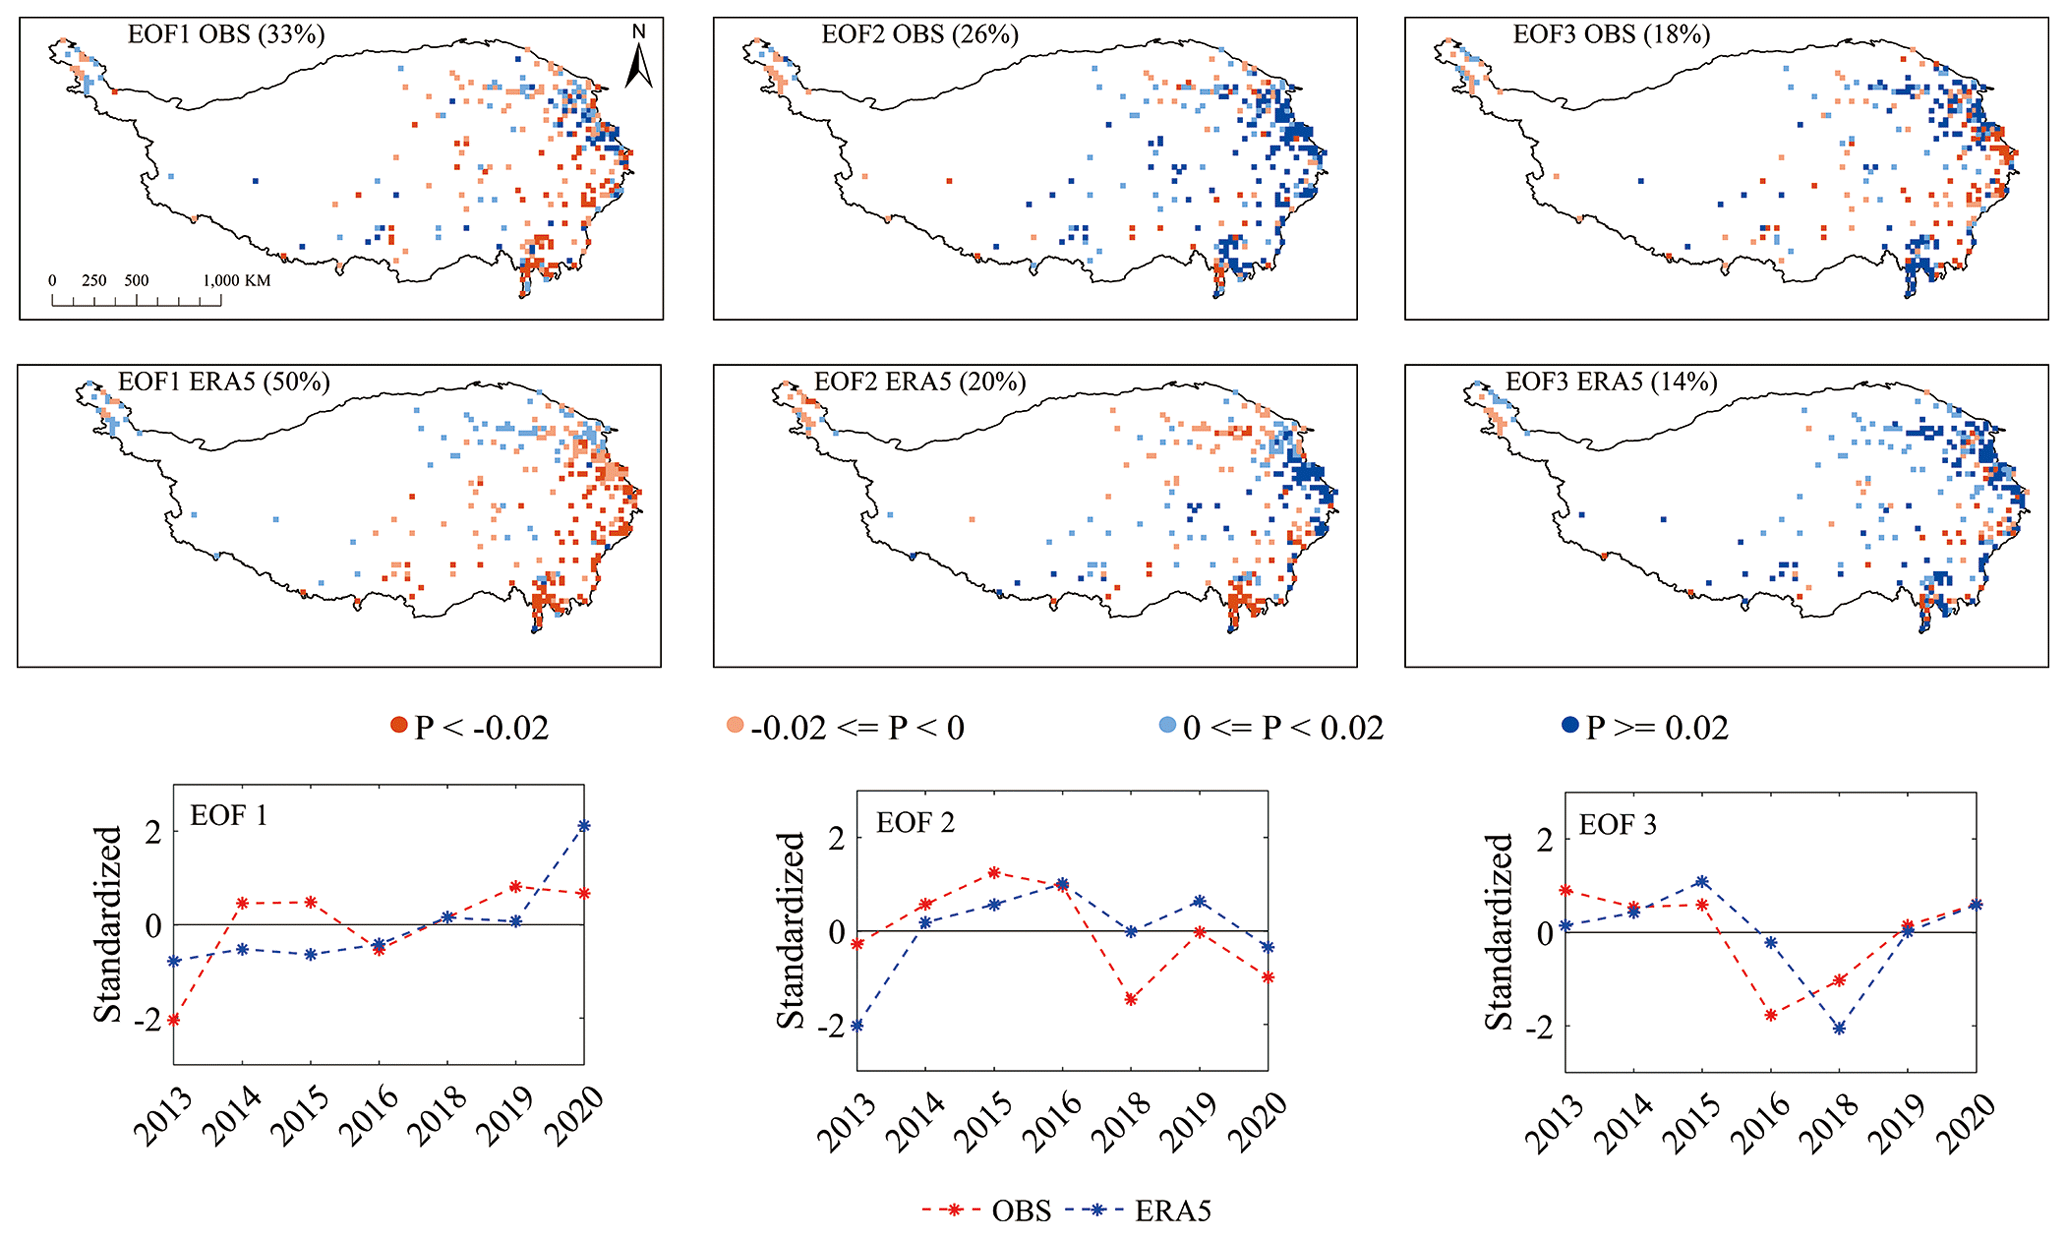
Figure 7First three empirical orthogonal function (EOF) modes of observed and ERA5-based mean annual rainfall erosivity on the TP in 2013–2020 (excluding 2017).
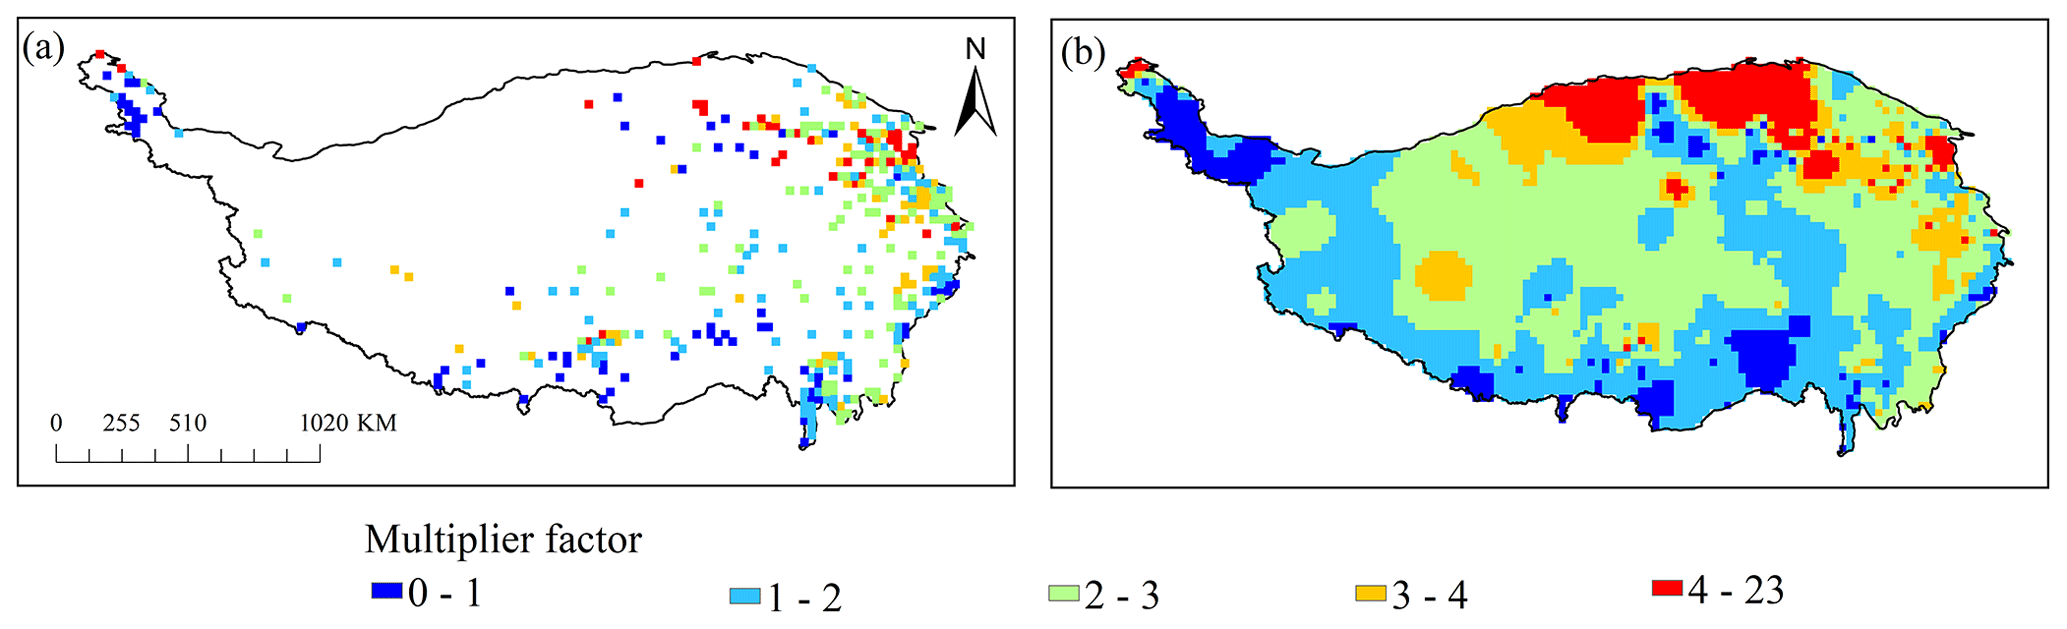
Figure 8(a) Spatial distribution of multiplier factors of 373 grids, (b) multiplier factor map of TP generated by IDW interpolation.
The accuracy of the spatiotemporal variability of the mean annual rainfall erosivity on the TP obtained using the ERA5 dataset is also crucial for determining whether ERA5 is suitable for rainfall erosivity calculations. We used the first three EOF modes, which are considered to provide the most valuable information, for evaluation. The spatial pattern of the first three EOFs of the observed values accounts for 77 % of the total variance, and that of the first three EOFs of the ERA5-based values accounts for 84 % of the total variance (Fig. 7). Clearly, ERA5 successfully captured the spatial pattern of the EOF modes, especially the first two EOF modes, revealed by the observed values. In addition, the corresponding principal components of the EOF modes of the ERA5-based values are also consistent with the temporal variation trend of the observed values. Therefore, it can be concluded that the ERA5-based mean annual rainfall erosivity generally reproduces the spatiotemporal patterns of the rainfall erosivity on the TP.

Figure 9Comparison of ERA5-based annual rainfall erosivity (MJ mm ha−1 h−1 yr−1) (left-hand graphs) and the corrected annual rainfall erosivity (right-hand graphs) with observed values in validation grids for 2013–2020 (excluding 2017). The dashed line is the result of an optimal model (with an intercept of 0 and a regression coefficient of 1). The solid black lines are the regression result. Colors of dots represent the grid density.
4.3 Reconstruction and validation of corrected annual rainfall erosivity
Using the observed and ERA5-based annual rainfall erosivity, we calculated the multiplier factors for 373 grids (Fig. 8a). The multiplier factors for the TP range from 0 to 23, with a mean value of 2.4. Multiplier factors of <1 indicate that the ERA5-based annual rainfall erosivity is overestimated, and conversely, the annual rainfall erosivity in the grid is underestimated. Most of the areas with overestimated ERA5-based mean annual rainfall erosivity are located in the Tarim, Qaidam, and Yarlung Zangpo basins. In other areas, the annual rainfall erosivity is typically underestimated, and areas with greater underestimation appear east of the Qaidam basin and in the source area of the Yellow River. We also produced a multiplier factor map of the TP by IDW interpolation based on the multiplier factors of 373 grids (Fig. 8b).
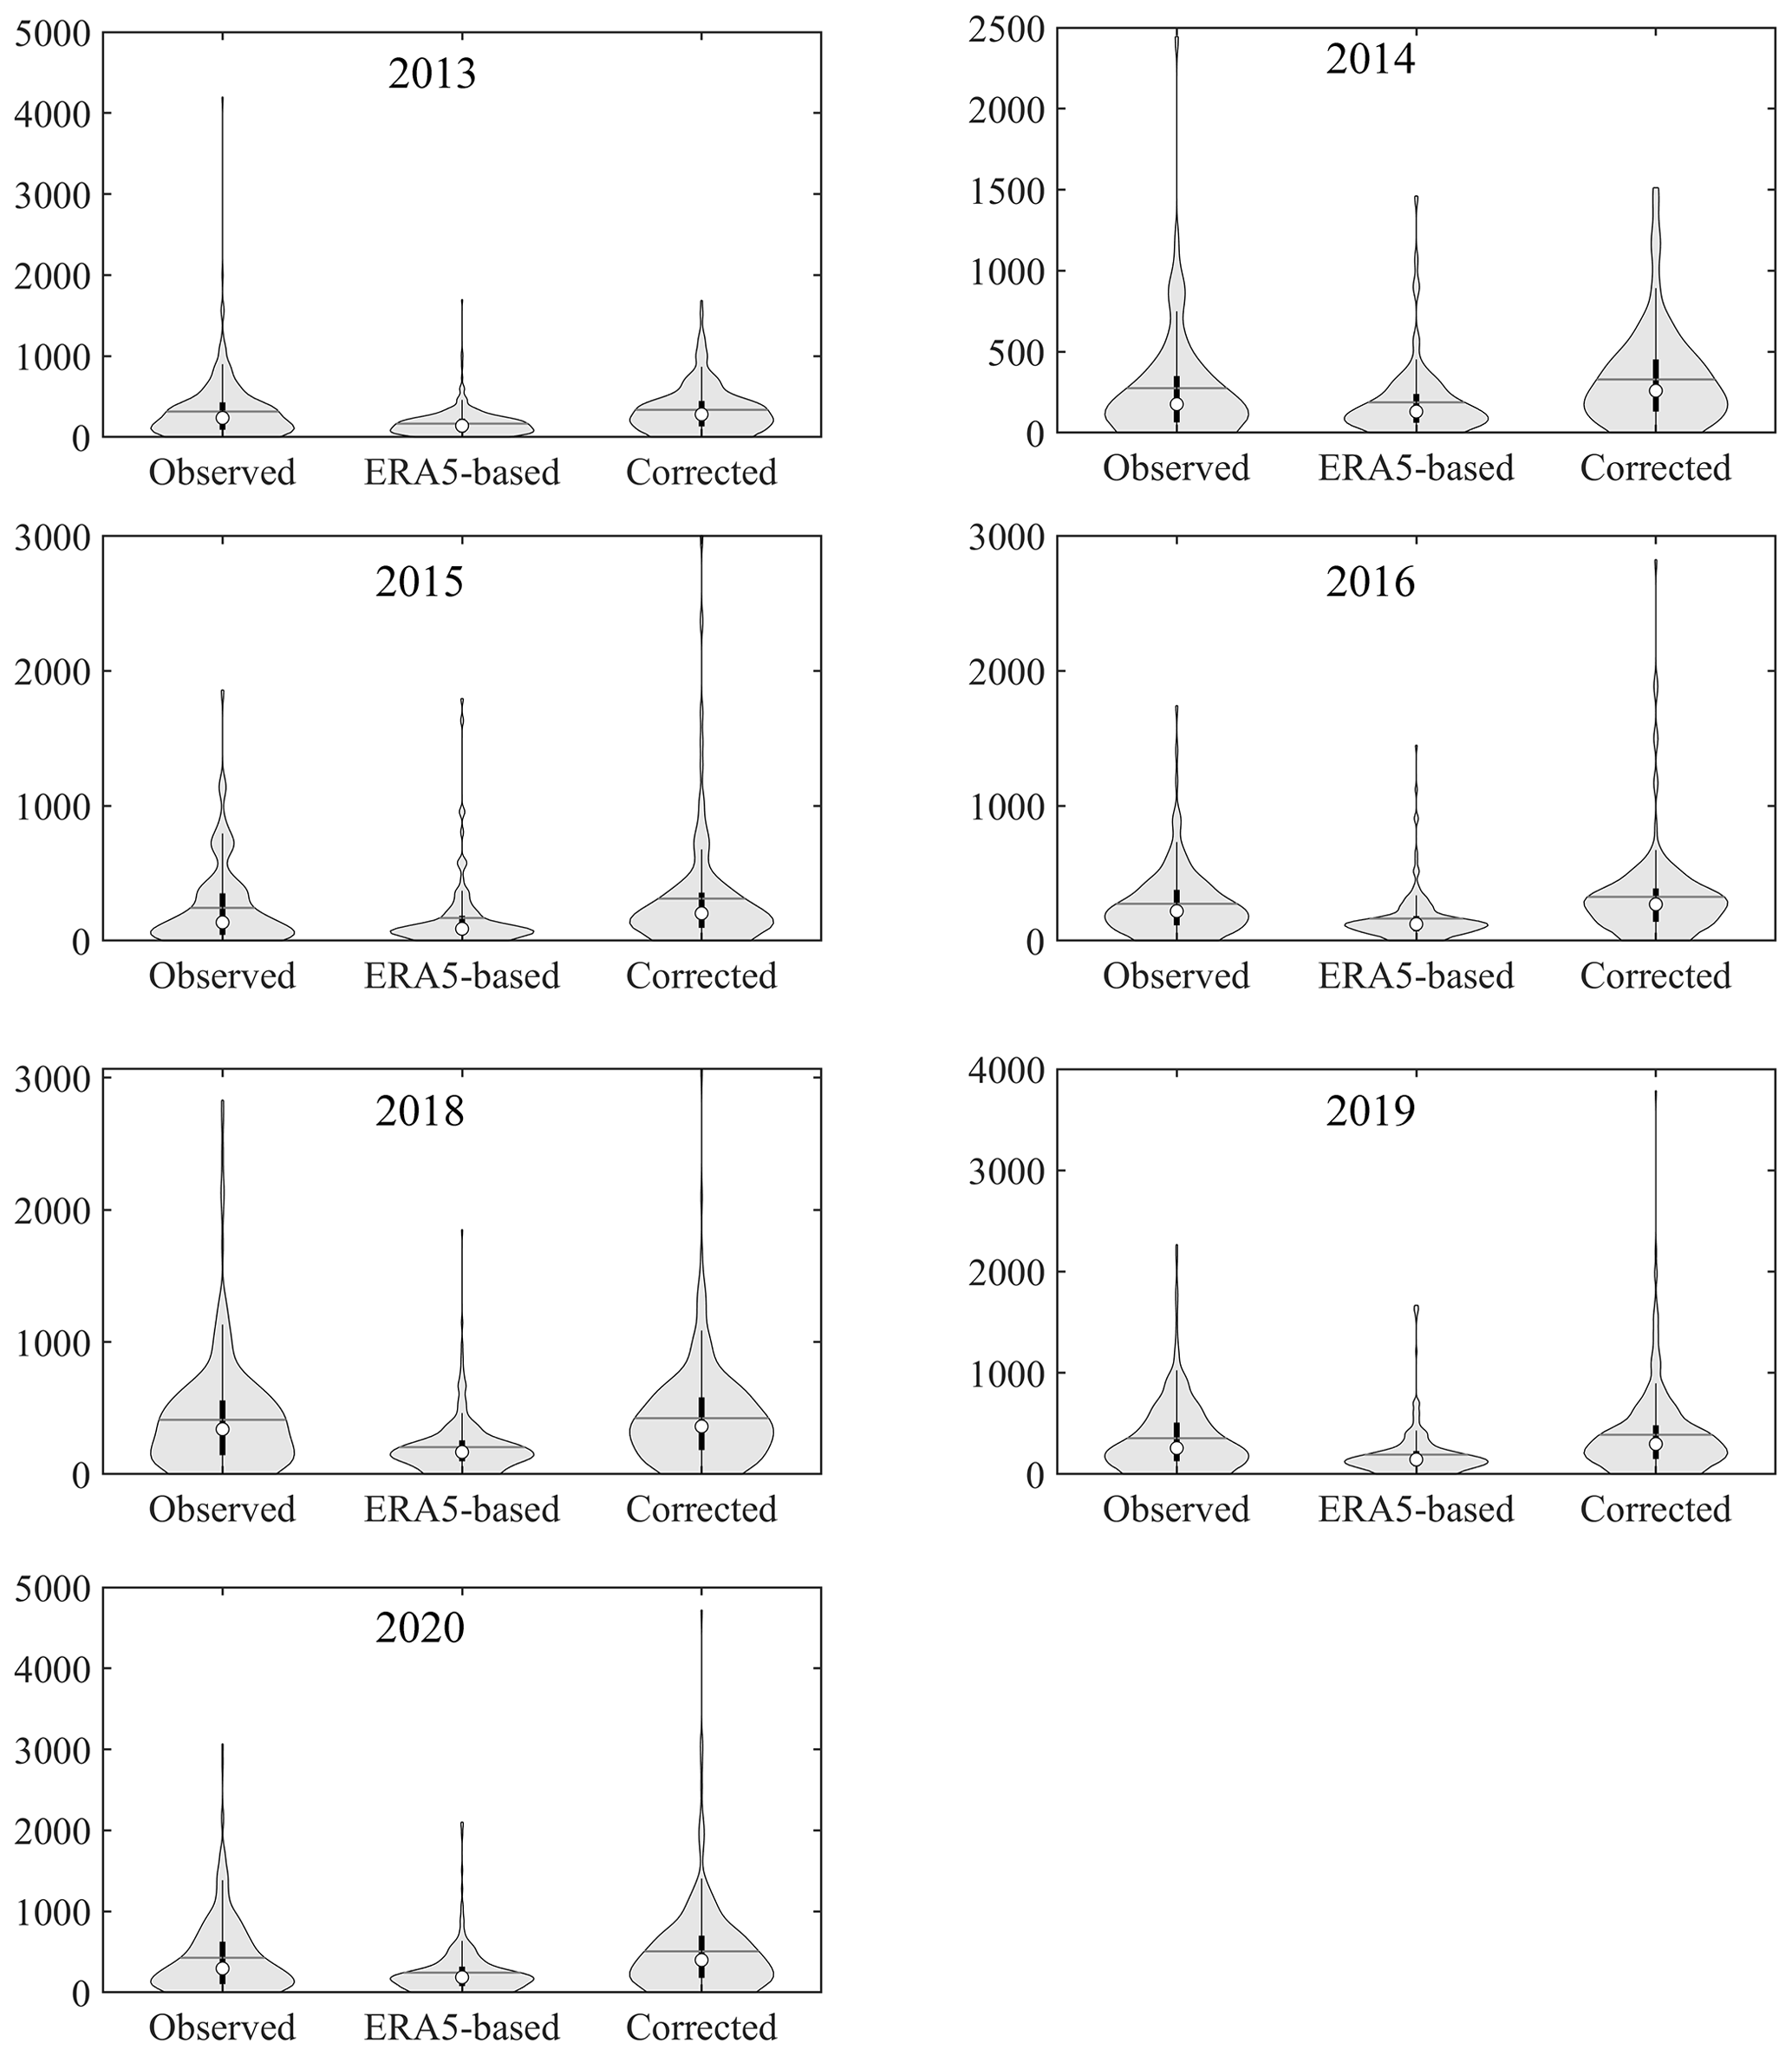
Figure 10Violin plots of observed, ERA5-based, and corrected annual rainfall erosivity in validation grids for 2013–2020 (excluding 2017). The Y axis shows the annual rainfall erosivity in MJ mm ha−1 h−1. The boxplot diagram of the median of the violin plots shows the maximum value, 75 % quantile value, 50 % quantile value, 25 % quantile value, and minimum value. The horizontal lines represent average values.

Figure 11R factor map of TP with the 0.25∘ spatial resolution for 1950–2020. The inset represents the yearly change in annual rainfall erosivity.
The corrected annual rainfall erosivity in 2013–2020 (excluding 2017) was then calculated in the validation grids as the product of the ERA5-based annual values and multiplier factors from the map. Figure 9 compares the observed and ERA5-based annual rainfall erosivity in the validation grids by year. In 2014–2020 (excluding 2017), the multiyear averaged correction coefficient between robs_year and rcor_year is 0.67, which is 0.13 larger than the value between robs_year and rERA5_year. Moreover, all of the data for 2013, which were not used to produce the multiplier factor map, were used to conduct an independent assessment. The results show that the correction coefficient also increases from 0.53 to 0.67 after the ERA5-based annual rainfall erosivity is corrected, indicating a significant improvement.
Violin plots are an alternative method of synthetically evaluating the accuracy of the corrected annual rainfall erosivity. Figure 10 compares the observed, ERA5-based, and corrected annual rainfall erosivity in the validation grids for 2013–2020 (excluding 2017). The corrected annual rainfall erosivity values for 2014–2020 are better than the ERA5-based values in terms of both the probability density and the values corresponding to different quantiles. Even in 2013, a completely independent verification year, the accuracy of the corrected annual rainfall erosivity is greatly improved. Specifically, the observed grid-averaged multiyear mean annual rainfall erosivity is 329 MJ mm ha−1 h−1 yr−1 in 2013–2020 (excluding 2017), where the ERA5-based value is 190 MJ mm ha−1 h−1 yr−1, and the corrected value is 374 MJ mm ha−1 h−1 yr−1. The relative error is significantly reduced, from −42 % to 14 %, by multiplier factor correction.
4.4 Rainfall erosivity in the TP and related uncertainties
Because of the large variability of the spatiotemporal patterns of precipitation, the R factor, an essential input for soil loss estimation, must be calculated using a minimum of 20 years of precipitation data (Renard et al., 1997). In this study, the annual rainfall erosivity values of the TP for 71 years based on the 0.25∘ hourly ERA5 precipitation data were calculated by the algorithm shown in Sect. 3.1. Next, after correction by the multiplier factor map, the new annual rainfall erosivity dataset for 1950–2020 and R factor map were produced.
The annual rainfall erosivity fluctuates considerably within a range of 239–408 MJ mm ha−1 h−1 yr−1 (Fig. 11); however, no obvious increasing or decreasing trend appears in the past 71 years across the TP. Regarding the spatial distribution, the R factor generally shows a decreasing trend from southeast to northwest. The areas with R factors below 200 MJ mm ha−1 h−1 yr−1 are concentrated in the northwestern part of the TP, whereas regions with high R factors appear mainly in the southeastern TP, especially in the Bomi–West Sichuan and Dawang–Chayu areas. The TP-averaged R factor is 307 MJ mm ha−1 h−1 yr−1, which is obviously lower than those from previous studies (e.g., Qin et al., 2016; Cao et al., 2018), excluding Liu et al. (2013) and Yue et al. (2022).
Compared with previous studies, there are two essential improvements by using the data-driven approach in this study. One the one hand, the 1 min precipitation observations from 1787 weather stations are firstly used to calculate the accuracy of rainfall erosivity values by employing the standard algorithm. With the densely spaced rainfall erosivity values, it is able to yield a realistic spatial distribution and identify the high spatial heterogeneity of the rainfall erosivity over the TP. On the other hand, apart from an R factor map, we also produced a high-precision time series of annual rainfall erosivity for 71 years after correcting the ERA5-based estimations, which may offer great help to reveal the spatiotemporal evolution over the TP under the climate changes.
It is also notable that some uncertainties are also unavoidably involved in the newly reconstructed dataset. As biases of the ERA5 precipitation data in detecting the characteristics of the erosive rainfall events have been revealed, we used multiple factors to correct the ERA5-based rainfall erosivity values by grid, to reduce the biases resulting from the ERA5 data. Limited by the scarcity of the in situ precipitation observations from weather stations before 2013 (less than 100 weather stations), it is hardly possible to yield a realistic spatial distribution of the multiple factor map by year. Here, we made a hypothesis that the biases of the ERA5-based annual rainfall erosivity always remained steady in various years, and thus the multiyear average annual multiple factor map from 2014–2020 is used in the correction process. With the improvement of the weather/climate forecast models in the future, the biases of the estimated rainfall erosivity by using gridded precipitation data will continue to be reduced.
The dataset is available from the National Tibetan Plateau/Third Pole Environment Data Center (https://doi.org/10.11888/Terre.tpdc.271833; Chen, 2021).
This study presents a new gridded dataset of annual rainfall erosivity over the TP based on the 1 min in situ precipitation data from 1787 weather stations and the long-term ERA5 precipitation data. The annual rainfall erosivity data are available over 71 years (from 1950 to 2020) on a 0.25∘ grid. The TP-averaged correction coefficient between the station-based annual rainfall erosivity and the newly released data is 0.67. In addition, the probability density and various quantile values of the new data are generally consistent with the station-based values across the TP.
This dataset provides a unique view of large-scale to local-scale features in rainfall erosivity variability over the TP, where it is hardly possible to obtain the long-term in situ precipitation data with sufficient spatiotemporal resolution. This availability of new data opens up many interesting applications in soil erosion studies and disaster research, including
-
providing input data of the R factor for the TP, which is needed for soil erosion modeling,
-
understanding the present processes of water erosion over the TP and improving future projections,
-
identifying the hot spots at high risk of landslide and flooding hazards.
The data are available in Network Common (NC) data format that can be readily imported into standard geographical information system software (e.g., ArcGIS) or accessed programmatically (e.g., MATLAB, Python).
YC designed the study and wrote the manuscript. XD and MD contributed to the manuscript preparation and dataset generation. WQ, TW and JL contributed to the analysis method used in this study. YX contributed to the suggestions for manuscript revision and visualization.
The contact author has declared that neither they nor their co-authors have any competing interests.
Publisher's note: Copernicus Publications remains neutral with regard to jurisdictional claims in published maps and institutional affiliations.
This research was jointly supported by the Second Tibetan Plateau Scientific Expedition and Research (STEP) Program (Grant No. 2019QZKK0106, Grant No. 2019QZKK0307), and the Basic Research Special Project of the Chinese Academy of Meteorological Sciences (Grant No. 2020Z003).
This research has been supported by the Second Tibetan Plateau Scientific Expedition and Research Program (STEP; Grant No. 2019QZKK0106, Grant No. 2019QZKK0307) and the Basic Research Special Project of the Chinese Academy of Meteorological Sciences (Grant No. 2020Z003).
This paper was edited by Hanqin Tian and reviewed by three anonymous referees.
Agnese, C., Bagarello, V., Corrao, C., D Agostino, L., and D'Asaro, F.: Influence of the rainfall measurement interval on the erosivity determinations in the Mediterranean area, J. Hydrol., 329, 39–48, https://doi.org/10.1016/j.jhydrol.2006.02.002, 2006.
Angulo-Martínez, M. and Beguería, S.: Estimating rainfall erosivity from daily precipitation records: A comparison among methods using data from the Ebro Basin (NE Spain), J. Hydrol., 379, 111–121, https://doi.org/10.1016/j.jhydrol.2009.09.051, 2009.
Beck, H. E., Vergopolan, N., Pan, M., Levizzani, V., van Dijk, A. I. J. M., Weedon, G. P., Brocca, L., Pappenberger, F., Huffman, G. J., and Wood, E. F.: Global-scale evaluation of 22 precipitation datasets using gauge observations and hydrological modeling, Hydrol. Earth Syst. Sci., 21, 6201–6217, https://doi.org/10.5194/hess-21-6201-2017, 2017.
Brown, C. L. and Foster, R. G.: Storm erosivity using idealized intensity distributions, T. ASAE, 30, 379–386, https://doi.org/10.13031/2013.31957, 1987.
Cao, Y., Wang, S. J., Bai, X. Y., and Li, H. W.: Inversion calculation and spatial-temporal pattern of rainfall erosivity in southwestern China over one hundred years, Acta Ecologica Sinica, 38, 8766–8773, https://doi.org/10.5846/stxb201805241142, 2018 (in Chinese).
Chen, Y.: A new gridded dataset of rainfall erosivity (1950–2020) in the Tibetan Plateau, National Tibetan Plateau Data Center [dataset], https://doi.org/10.11888/Terre.tpdc.271833, 2021.
Chen, Y., Duan, X., Zhang, G., Ding, M., and Lu, S.: Rainfall erosivity estimation over the Tibetan Plateau based on high spatial-temporal resolution rainfall records, Int. Soil Water Conse., https://doi.org/10.1016/j.iswcr.2022.01.004, in press, 2022.
Cucchi, M., Weedon, G. P., Amici, A., Bellouin, N., Lange, S., Müller Schmied, H., Hersbach, H., and Buontempo, C.: WFDE5: bias-adjusted ERA5 reanalysis data for impact studies, Earth Syst. Sci. Data, 12, 2097–2120, https://doi.org/10.5194/essd-12-2097-2020, 2020.
Fick, S. E. and Hijmans, R. J.: WorldClim 2: new 1km spatial resolution climate surfaces for global land areas, Int. J. Climatol., 37, 4302–4315, https://doi.org/10.1002/joc.5086, 2017.
Freitas, E. D. S., Coelho, V. H. R., Xuan, Y., Melo, D. D. C. D., Gadelha, A. N., Santos, E. A., Galvão, C. D. O., Ramos Filho, G. M., Barbosa, L. R., Huffman, G. J., Petersen, W. A., and Almeida, C. D. N.: The performance of the IMERG satellite-based product in identifying sub-daily rainfall events and their properties, J. Hydrol., 589, 125128, https://doi.org/10.1016/j.jhydrol.2020.125128, 2020.
Gu, Z., Feng, D., Duan, X., Gong, K., Li, Y., and Yue, T.: Spatial and temporal patterns of rainfall erosivity in the Tibetan Plateau, Water, 12, 200, https://doi.org/10.3390/w12010200, 2020.
He, J., Yang, K., Tang, W., Lu, H., Qin, J., Chen, Y., and Li, X.: The first high-resolution meteorological forcing dataset for land process studies over China, Sci. Data, 7, 25, https://doi.org/10.1038/s41597-020-0369-y, 2020.
Hersbach, H., Bell, W., Berrisford, P., Horányi, A., J., M.-S., Nicolas, J., Radu, R., Schepers, D., Simmons, A., Soci, C., and Dee, D.: Global reanalysis: goodbye ERA-Interim, hello, https://doi.org/10.21957/VF291HEHD7, 2019.
Jiang, Q., Li, W., Fan, Z., He, X, Sun, W., Chen, S., Wen, J., Gao, J., and Wang, J.: Evaluation of the ERA5 reanalysis precipitation dataset over Chinese Mainland, J. Hydrol., 595, 125660, https://doi.org/10.1016/j.jhydrol.2020.125660, 2021.
Jiao D., Xu N., Yang F., and Xu K.: Evaluation of spatial-temporal variation performance of ERA5 precipitation data in China, Sci. Rep.-UK, 11, 17956, https://doi.org/10.1038/s41598-021-97432-y, 2021.
Kim, J., Han, H., Kim, B., Chen, H., and Lee, J.: Use of a high-resolution-satellite-based precipitation product in mapping continental-scale rainfall erosivity: A case study of the United States, Catena, 193, 104602, https://doi.org/10.1016/j.catena.2020.104602, 2020.
Li, D., Yang, K., Tang, W., Li, X., Zhou, X., and Guo, D.: Characterizing precipitation in high altitudes of the western Tibetan plateau with a focus on major glacier areas, Int. J. Climatol., 40, 5114–5127, https://doi.org/10.1002/joc.6509, 2020.
Liu, B., Tao, H., Song, C., Guo, B., Shi, Z., Zhang, C., Kong, F., and He, B.: Temporal and spatial variations of rainfall erosivity in China during 1960 to 2009, Geogr. Res., 32, 245–256, 2013 (in Chinese).
Liu, B., Xie, Y., Li, Z., Liang, Y., Zhang, W., Fu, S., Yin, S., Wei, X., Zhang, K., Wang, Z., Liu, Y., Zhao, Y., and Guo, Q.: The assessment of soil loss by water erosion in China, Int. Soil Water Conse., 8, 430–439, https://doi.org/10.1016/j.iswcr.2020.07.002, 2020.
Liu, B. Y., Zhang, K. L., and Xie, Y.: An empirical soil loss equation//Proceedings-Process of soil erosion and its environment effect, 12th international soil conservation organization conference, 26–31 May 2002, Beijing, China, Tsinghua University Press, Beijing, China, ISBN 7-5046-3189-2, 2002.
Liu, X. and Chen, B.: Climatic warming in the Tibetan Plateau during recent decades, Int. J. Climatol., 20, 1729–1742, https://doi.org/10.1002/1097-0088(20001130)20:14<1729::AID-JOC556>3.0.CO;2-Y, 2000.
Lobo, G. P. and Bonilla, C. A.: Sensitivity analysis of kinetic energy-intensity relationships and maximum rainfall intensities on rainfall erosivity using a long-term precipitation dataset, J. Hydrol., 527, 788–793, https://doi.org/10.1016/j.jhydrol.2015.05.045, 2015.
Ma, X., He, Y., Xu, J., van Noordwijk, M., and Lu, X.: Spatial and temporal variation in rainfall erosivity in a Himalayan watershed, Catena, 121, 248–259, https://doi.org/10.1016/j.catena.2014.05.017, 2014.
Panagos, P., Meusburger, K., Ballabio, C., Borrelli, P., Beguería, S., Klik, A., Rymszewicz, A., Michaelides, S., Olsen, P., Tadić, M. P., Aalto, J., Lakatos, M., Dumitrescu, A., Rousseva, S., Montanarella, L., and Alewell, C.: Reply to the comment on “Rainfall erosivity in Europe” by Auerswald et al., Sci. Total Environ., 532, 853–857, https://doi.org/10.1016/j.scitotenv.2015.05.020, 2015.
Panagos, P., Borrelli, P., Meusburger, K., Yu, B., Klik, A., Jae Lim, K., Yang, J. E., Ni, J., Miao, C., Chattopadhyay, N., Sadeghi, S. H., Hazbavi, Z., Zabihi, M., Larionov, G. A., Krasnov, S. F., Gorobets, A. V., Levi, Y., Erpul, G., Birkel, C., Hoyos, N., Naipal, V., Oliveira, P. T. S., Bonilla, C. A., Meddi, M., Nel, W., Al Dashti, H., Boni, M., Diodato, N., Van Oost, K., Nearing, M., and Ballabio, C.: Global rainfall erosivity assessment based on high-temporal resolution rainfall records, Sci. Rep.-UK, 7, 4175, https://doi.org/10.1038/s41598-017-04282-8, 2017.
Qin, W., Guo, Q., Zuo, C., Shan, Z., Ma, L., and Sun, G.: Spatial distribution and temporal trends of rainfall erosivity in mainland China for 1951–2010, Catena, 147, 177–186, https://doi.org/10.1016/j.catena.2016.07.006, 2016.
Renard, K. G., Foster, G. A., Weesies, D. K., McCool, D. K., and Yoder, D. C.: Predicting soil erosion by water: a guide to conservation planning with the revised universal soil loss equation (RUSLE), U.S. Department of Agriculture, Agriculture Handbook No. 703, ISBN 0-16-048938-5, 1997.
Risal, A., Lim, K. J., Bhattarai, R., Yang, J. E., Noh, H., Pathak, R., and Kim, J.: Development of web-based WERM-S module for estimating spatially distributed rainfall erosivity index (EI30) using RADAR rainfall data, Catena, 161, 37–49, https://doi.org/10.1016/j.catena.2017.10.015, 2018.
Shin, J., Kim, T., Heo, J., and Lee, J.: Spatial and temporal variations in rainfall erosivity and erosivity density in South Korea, Catena, 176, 125–144, https://doi.org/10.1016/j.catena.2019.01.005, 2019.
Sun, Q., Miao C., Duan Q., Ashouri H., Sorooshian S., and Hsu K.: A Review of Global Precipitation Data Sets: Data Sources, Estimation, and Intercomparisons, Rev. Geophys., 56, 79–107, https://doi.org/10.1002/2017RG000574, 2018.
Teng, H., Ma, Z., Chappell, A., Shi, Z., Liang, Z., and Yu, W.: Improving rainfall erosivity estimates using merged TRMM and gauge data, Remote Sens., 9, 1134, https://doi.org/10.3390/rs9111134, 2017.
Teng, H., Liang, Z., Chen, S., Liu, Y., Viscarra Rossel, R. A., Chappell, A., Yu, W., and Shi, Z.: Current and future assessments of soil erosion by water on the Tibetan Plateau based on RUSLE and CMIP5 climate models, Sci. Total Environ., 635, 673–686, https://doi.org/10.1016/j.scitotenv.2018.04.146, 2018.
Teng, H., Hu, J., Zhou, Y., Zhou, L., and Shi, Z.: Modelling and mapping soil erosion potential in China, J. Integr. Agr., 18, 251–264, https://doi.org/10.1016/S2095-3119(18)62045-3, 2019.
Vrieling, A., Sterk, G., and de Jong, S. M.: Satellite-based estimation of rainfall erosivity for Africa, J. Hydrol., 395, 235–241, https://doi.org/10.1016/j.jhydrol.2010.10.035, 2010.
Wang, Y., Cheng, C., Xie, Y., Liu, B., Yin, S., Liu, Y., and Hao, Y.: Increasing trends in rainfall-runoff erosivity in the Source Region of the Three Rivers, Sci. Total. Environ., 592, 639–648, https://doi.org/10.1016/j.scitotenv.2017.02.235, 2017.
Wischmeier, W. H. and Smith, D. D.: Predicting rainfall-erosion losses from cropland east of the Rocky Mountains: Guide for selection of practices for soil and water conservation, US Department of Agriculture, Agriculture Handbook No. 282, https://handle.nal.usda.gov/10113/CAT87208342 (last access: 6 June 2022), 1965.
Wischmeier, W. H. and Smith, D. D.: Predicting rainfall erosion losses: a guide to conservation planning, Department of Agriculture, Science and Education Administration, US Department of Agriculture, Agriculture Handbook No. 537, Stock Number 001-000-03903-2, 1978.
Xie, Y., Liu, B. Y., and Zhang, W. B.: Study on standard of erosive rainfall, J. Soil Water Conserv., 14, 6–11, https://doi.org/10.3321/j.issn:1009-2242.2000.04.002, 2000 (in Chinese).
Yan, D., Fan, J., Guo, F., Guo, X., and Gong, K.F.: Spatiotemporal distribution of precipitation erosivity in Tibet autonomous region, Bulletin of Soil and Water Conservation, 30, 17–21, https://doi.org/10.13961/j.cnki.stbctb.2010.04.025, 2010 (in Chinese).
Yang, F. and Lu, C.: Spatiotemporal variation and trends in rainfall erosivity in China's dryland region during 1961–2012, Catena, 133, 362–372, https://doi.org/10.1016/j.catena.2015.06.005, 2015.
Yao, T., Thompson, L., Yang, W., Yu, W., Gao, Y., Guo, X., Yang, X., Duan, K., Zhao, H., Xu, B., Pu, J., Lu, A., Xiang, Y., Kattel, D. B., and Joswiak, D.: Different glacier status with atmospheric circulations in Tibetan Plateau and surroundings, Nat. Clim. Change, 2, 663–667, https://doi.org/10.1038/nclimate1580, 2012.
Yin, S., Xie, Y., Liu, B., and Nearing, M. A.: Rainfall erosivity estimation based on rainfall data collected over a range of temporal resolutions, Hydrol. Earth Syst. Sci., 19, 4113–4126, https://doi.org/10.5194/hess-19-4113-2015, 2015.
Yuan, X., Yang, K., Lu, H., He, J., Sun, J., and Wang, Y.: Characterizing the features of precipitation for the Tibetan Plateau among four gridded datasets: Detection accuracy and spatio-temporal variabilities, Atmos. Res., 264, 105875, https://doi.org/10.1016/j.atmosres.2021.105875, 2021.
Yue, T., Yin, S., Xie, Y., Yu, B., and Liu, B.: Rainfall erosivity mapping over mainland China based on high-density hourly rainfall records, Earth Syst. Sci. Data, 14, 665–682, https://doi.org/10.5194/essd-14-665-2022, 2022.
Zhang, W., Xie, Y., and Liu, B.: Spatial distribution of rainfall erosivity in China, J. Mountain Sci., 21, 33–40, 2003 (in Chinese).
Zhou, X., Yang, K., Ouyang, L., Wang, Y., Jiang, Y., Li, X., Chen, D., and Prein, A.: Added value of kilometer-scale modeling over the third pole region: a CORDEXCPTP pilot study, Clim. Dynam., 57, 1673–1687, https://doi.org/10.1007/s00382-021-05653-8, 2021.