the Creative Commons Attribution 4.0 License.
the Creative Commons Attribution 4.0 License.
 | 13 May 2022
High-resolution bathymetry models for the Lena Delta and Kolyma Gulf coastal zones
Juri Palmtag
Bennet Juhls
Pier Paul Overduin
Guido Grosse
Ahmed Abdelwahab
Michael Bedington
Tina Sanders
Olga Ogneva
Irina V. Fedorova
Nikita S. Zimov
Paul J. Mann
Jens Strauss
Arctic river deltas and deltaic near-shore zones represent important land–ocean transition zones influencing sediment dynamics and nutrient fluxes from permafrost-affected terrestrial ecosystems into the coastal Arctic Ocean. To accurately model fluvial carbon and freshwater export from rapidly changing river catchments as well as assess impacts of future change on the Arctic shelf and coastal ecosystems, we need to understand the sea floor characteristics and topographic variety of the coastal zones. To date, digital bathymetrical data from the poorly accessible, shallow, and large areas of the eastern Siberian Arctic shelves are sparse. We have digitized bathymetrical information for nearly 75 000 locations from large-scale (1:25 000–1:500 000) current and historical nautical maps of the Lena Delta and the Kolyma Gulf region in northeastern Siberia. We present the first detailed and seamless digital models of coastal zone bathymetry for both delta and gulf regions in 50 and 200 m spatial resolution. We validated the resulting bathymetry layers using a combination of our own water depth measurements and a collection of available depth measurements, which showed a strong correlation (r>0.9). Our bathymetrical models will serve as an input for a high-resolution coupled hydrodynamic–ecosystem model to better quantify fluvial and coastal carbon fluxes to the Arctic Ocean, but they may be useful for a range of other studies related to Arctic delta and near-shore dynamics such as modeling of submarine permafrost, near-shore sea ice, or shelf sediment transport. The new digital high-resolution bathymetry products are available on the PANGAEA data set repository for the Lena Delta (https://doi.org/10.1594/PANGAEA.934045; Fuchs et al., 2021a) and Kolyma Gulf region (https://doi.org/10.1594/PANGAEA.934049; Fuchs et al., 2021b), respectively. Likewise, the depth validation data are available on PANGAEA as well (https://doi.org/10.1594/PANGAEA.933187; Fuchs et al., 2021c).
- Article
(18255 KB) - Full-text XML
- BibTeX
- EndNote


The bathymetry of the Arctic Ocean at the mouths of major rivers is at the locus of interactions between land-to-ocean sediment fluxes, fluvial discharge, alongshore currents, and sea ice dynamics. It exerts control on these processes and is also shaped by them. Therefore, it is imperative to establish a baseline by which to compare future bathymetrical changes, especially since processes at the land–ocean interface are changing rapidly due to climate change. For example, Arctic river discharge is increasing (Peterson et al., 2002; McClelland et al., 2006; Haine et al., 2015; Holmes et al., 2015; Brown et al., 2019), resulting in altered sediment, nutrient, and organic carbon loads exported from rapidly changing river catchments into near-shore regions (e.g., Rachold et al., 2000; Gordeev, 2006; Tank et al., 2016; Wild et al., 2019) with unclear effects on the Arctic shelf and ocean ecosystems (Mann et al., 2022; Sanders et al., 2022; Polimene et al., 2022). In particular, Arctic deltas will be affected by climate-change-induced increase in permafrost temperatures (Biskaborn et al., 2019), changing sea ice distribution (Stroeve and Notz, 2018), sea level rise (Box et al., 2018), increasing storm surges (Vermaire et al., 2018) and coastal erosion rates (Jones et al., 2020), and warming water temperatures in the Arctic coastal systems (Timmermans and Labe, 2020). Therefore, better baseline data are needed for Arctic deltas and their often very shallow subaquatic near-shore zones to quantify and model the effects of climate-change-induced disturbances upon these sensitive environments.
Regional-scale models have been shown to be sensitive to changes in bathymetry, particularly in the near-shore zone and shallow areas, as these significantly affect both the distribution of tidal currents and stratification dynamics (Fofonova et al., 2014, 2015; Shulman et al., 2013; Anand and Kumar, 2018; Rasquin et al., 2020). Furthermore, low-resolution bathymetry products can entirely obscure small-scale near-shore features and processes, such as vestigial river channels, which may nevertheless represent significant local oceanographic features (Lee and Valle-Levinson, 2012; Janout et al., 2017; Ye et al., 2018) or coastal groundwater dynamics, which might become even more important in the future as permafrost thaws (Connolly et al., 2020).
However, deltaic and coastal zone morphologies of Arctic rivers have been rarely studied so far, primarily due to difficulties in accessing these extensive yet often shallow and highly changeable regions, resulting in a general lack of available data. While coarse-resolution (∼200 m) bathymetry products are available for Arctic shelves, e.g., the International Bathymetrical Chart of the Arctic Ocean (IBCAO; Jakobsson et al., 2020), detailed digital bathymetry data are missing for Arctic delta and coastal areas. Bathymetrical data of these environments are important to study land-to-ocean processes and are thus a much-needed input, e.g., for models estimating the river outflow through deltas and the pathways of organic matter transport, deposition, and transformation in the coastal zones of the Arctic Ocean. A range of other modeling subjects also require high-resolution coastal zone bathymetrical data such as submarine permafrost, near-shore sea ice dynamics, coastal erosion, storm or tidal surges, or shelf sediment transport and deposition patterns.
Therefore, the aim of this study is to create two detailed, high-resolution digital coastal zone bathymetry data sets derived from analogue nautical maps for the Lena Delta and Kolyma Gulf regions in northeastern Siberia. The data set will serve as a model input for a planned high-resolution implementation of the coupled Finite Volume Community Ocean Model (FVCOM)–Arctic European Regional Shelf Seas Ecosystem Model (Arctic-ERSEM) (Butenschön et al., 2016; Bedington et al., 2021). Besides providing an important model input, a high-resolution bathymetry for coastal zones offers insights into the continuation of river channels into the non-terrestrial part of the delta or gulf as well as erosion and accumulation zones in the land–ocean interface.
For this data set, we used 28 analogue nautical charts for creating a digital high-resolution bathymetry data set for two coastal areas of river mouths in the Laptev and East Siberian seas (Fig. 1). Our first data set included the coastal zone bathymetry of the Lena River delta and the southern Laptev Sea shelf (up to 250 km north of the Lena Delta). The second data set presents the river and estuary coastal zone bathymetry from the Kolyma Gulf region (up to 70 km offshore). In addition, we use water depth information from our own field-measured conductivity temperature and depth (CTD) observations as well as compiled water depth measurements synthesized from the PANGAEA (https://pangaea.de, last access: 10 April 2022) data archive for both regions as a cross-validation data set for our digital bathymetry.
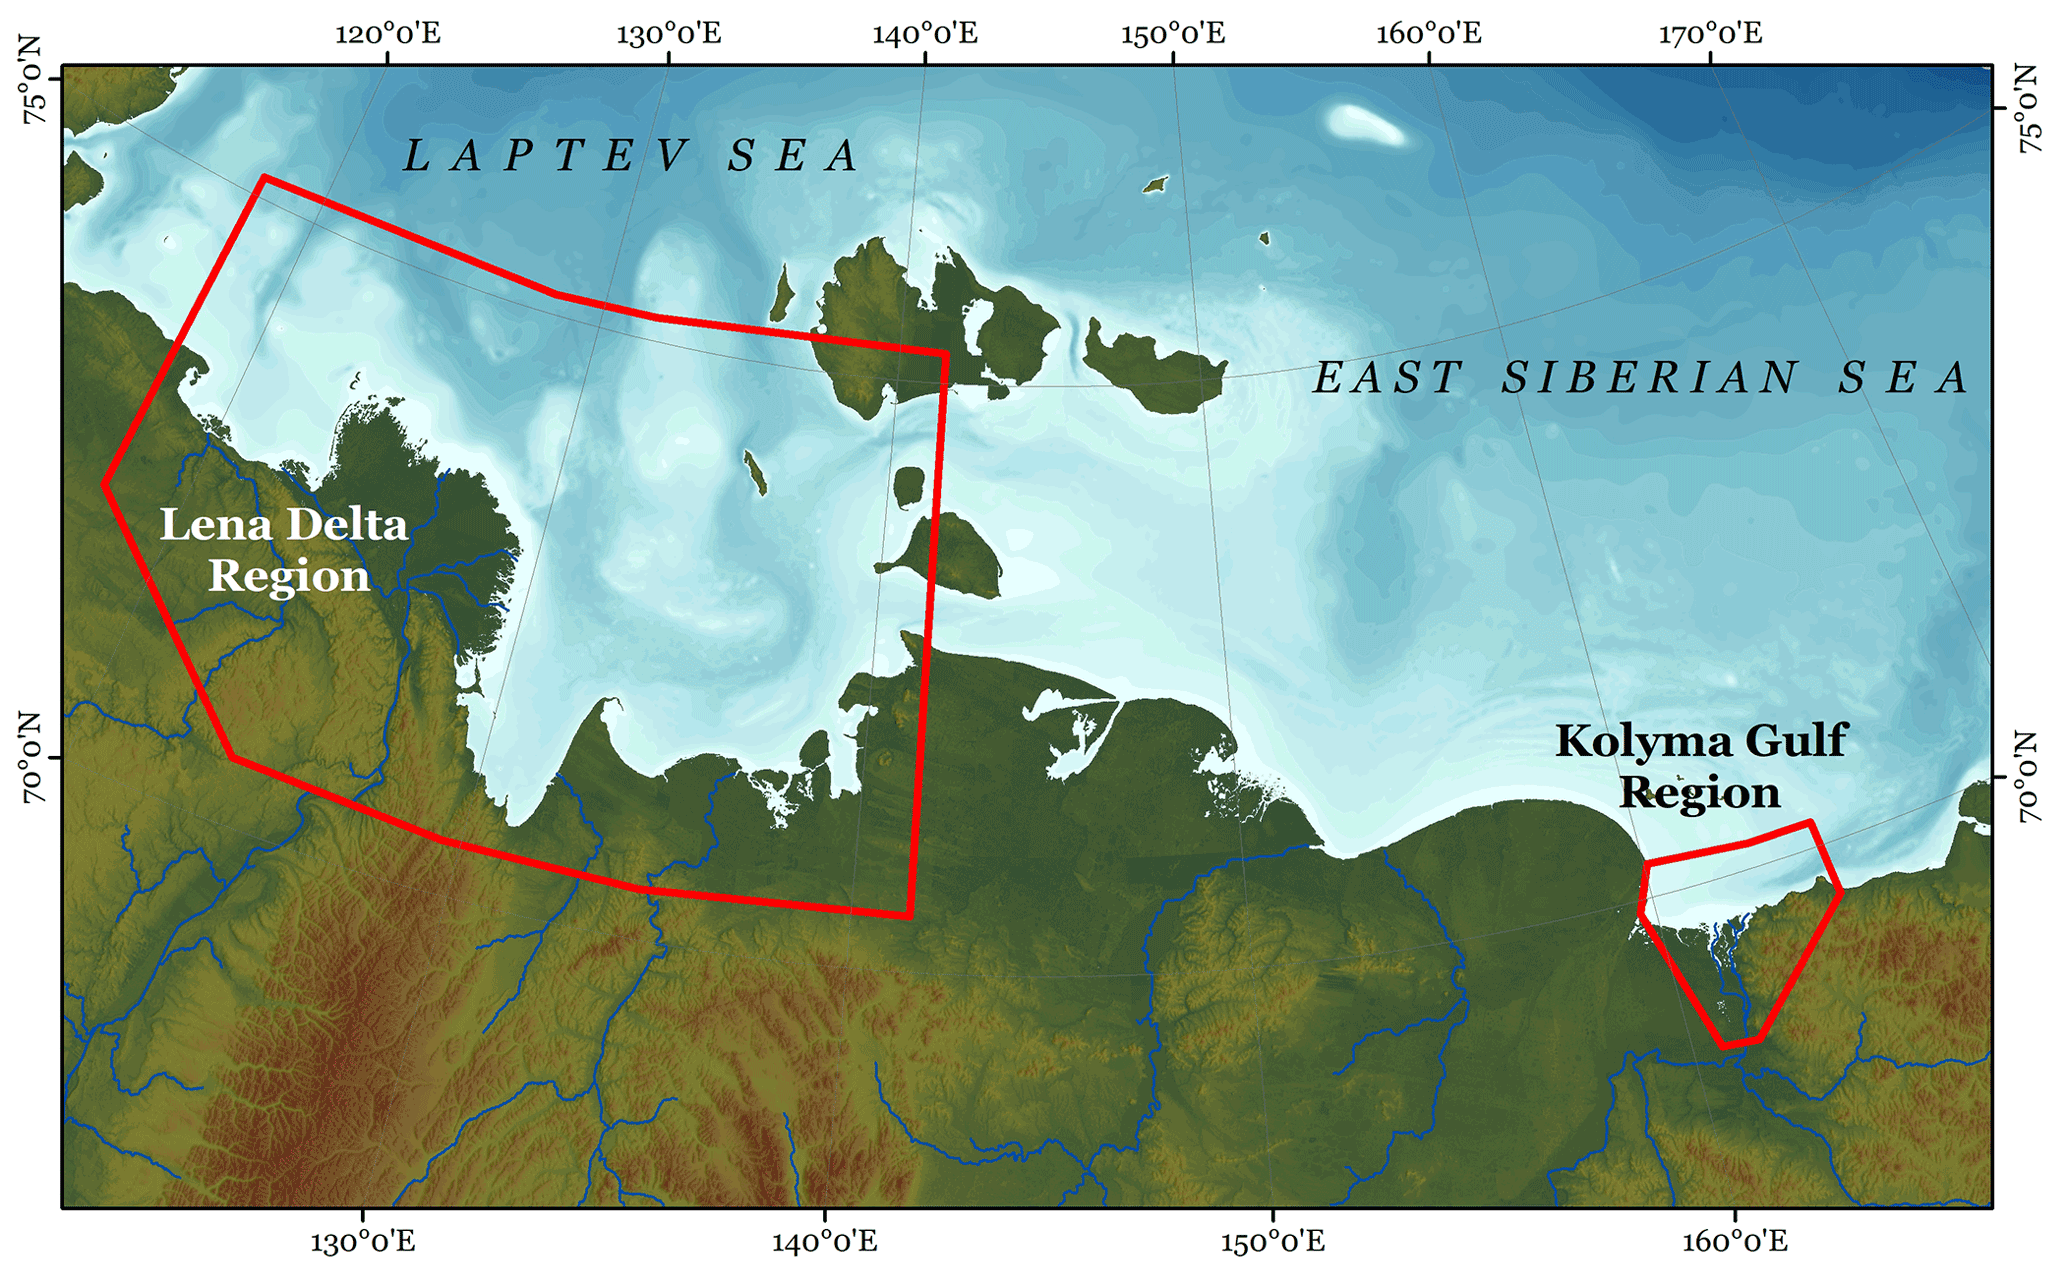
Figure 1Study areas (red frames) of the Lena Delta and Kolyma Gulf regions. The background image is the IBCAO v4 200 m spatial resolution raster map (Jakobsson et al., 2020).
2.1 Nautical maps
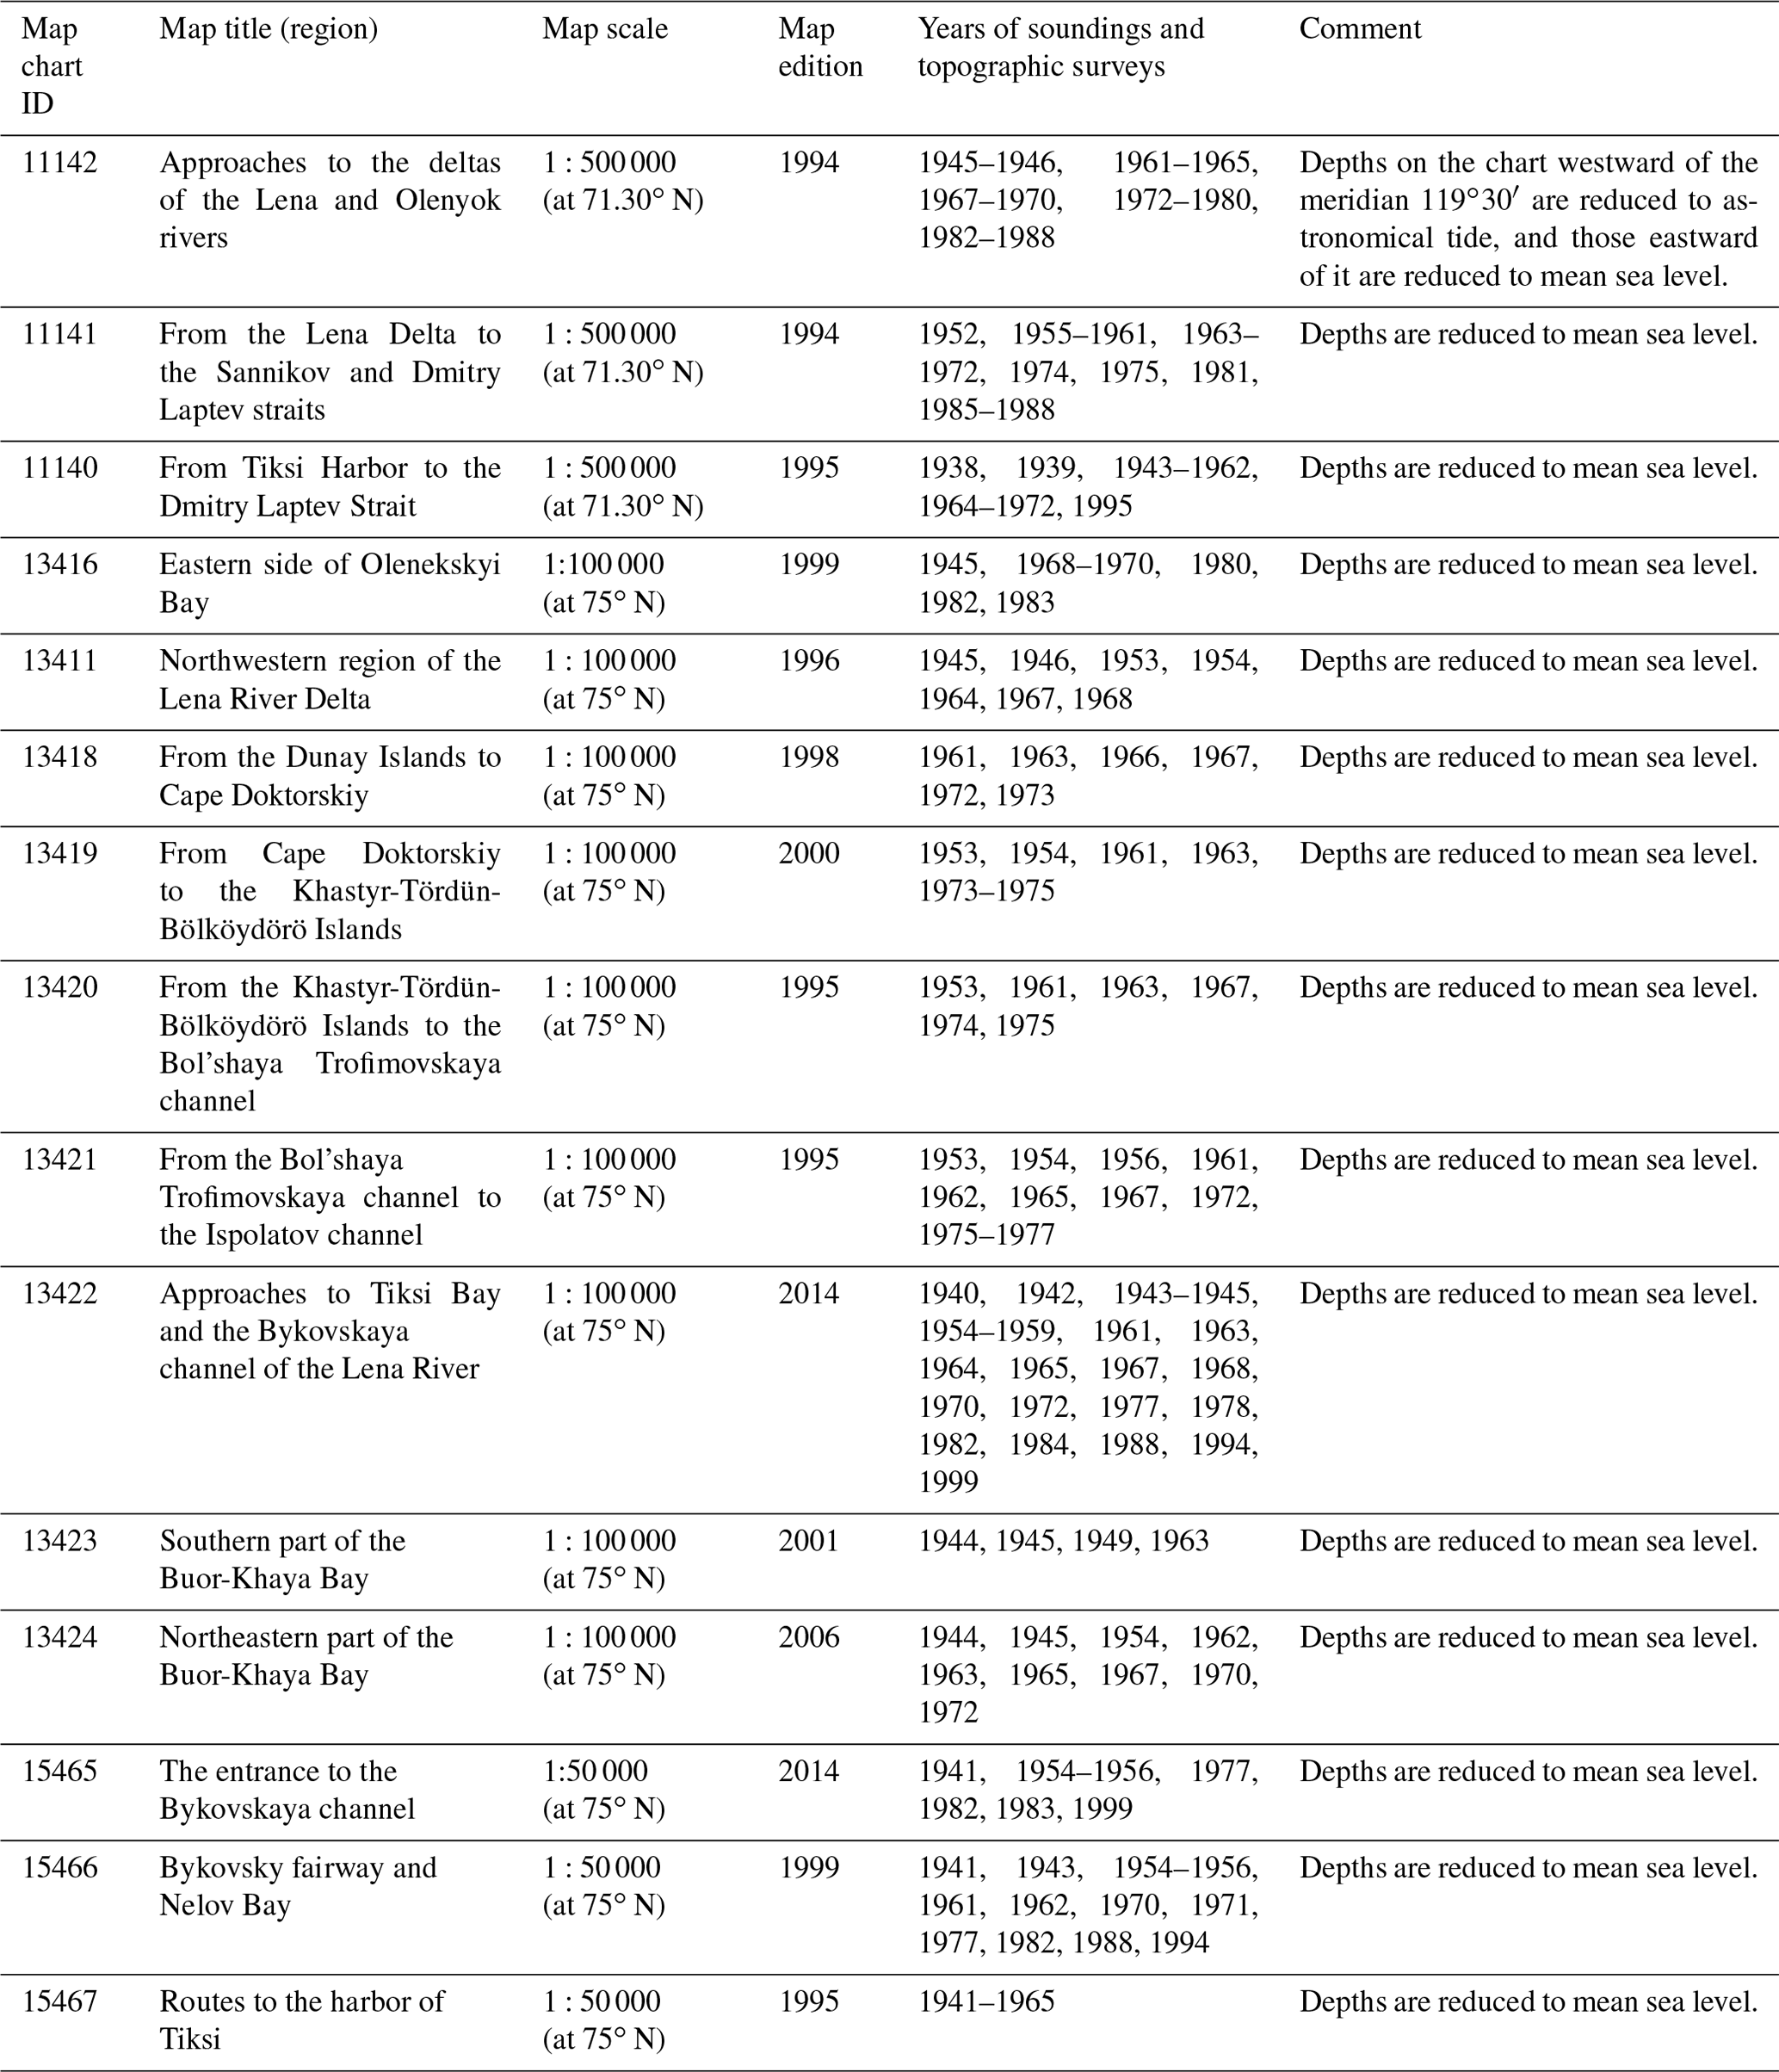
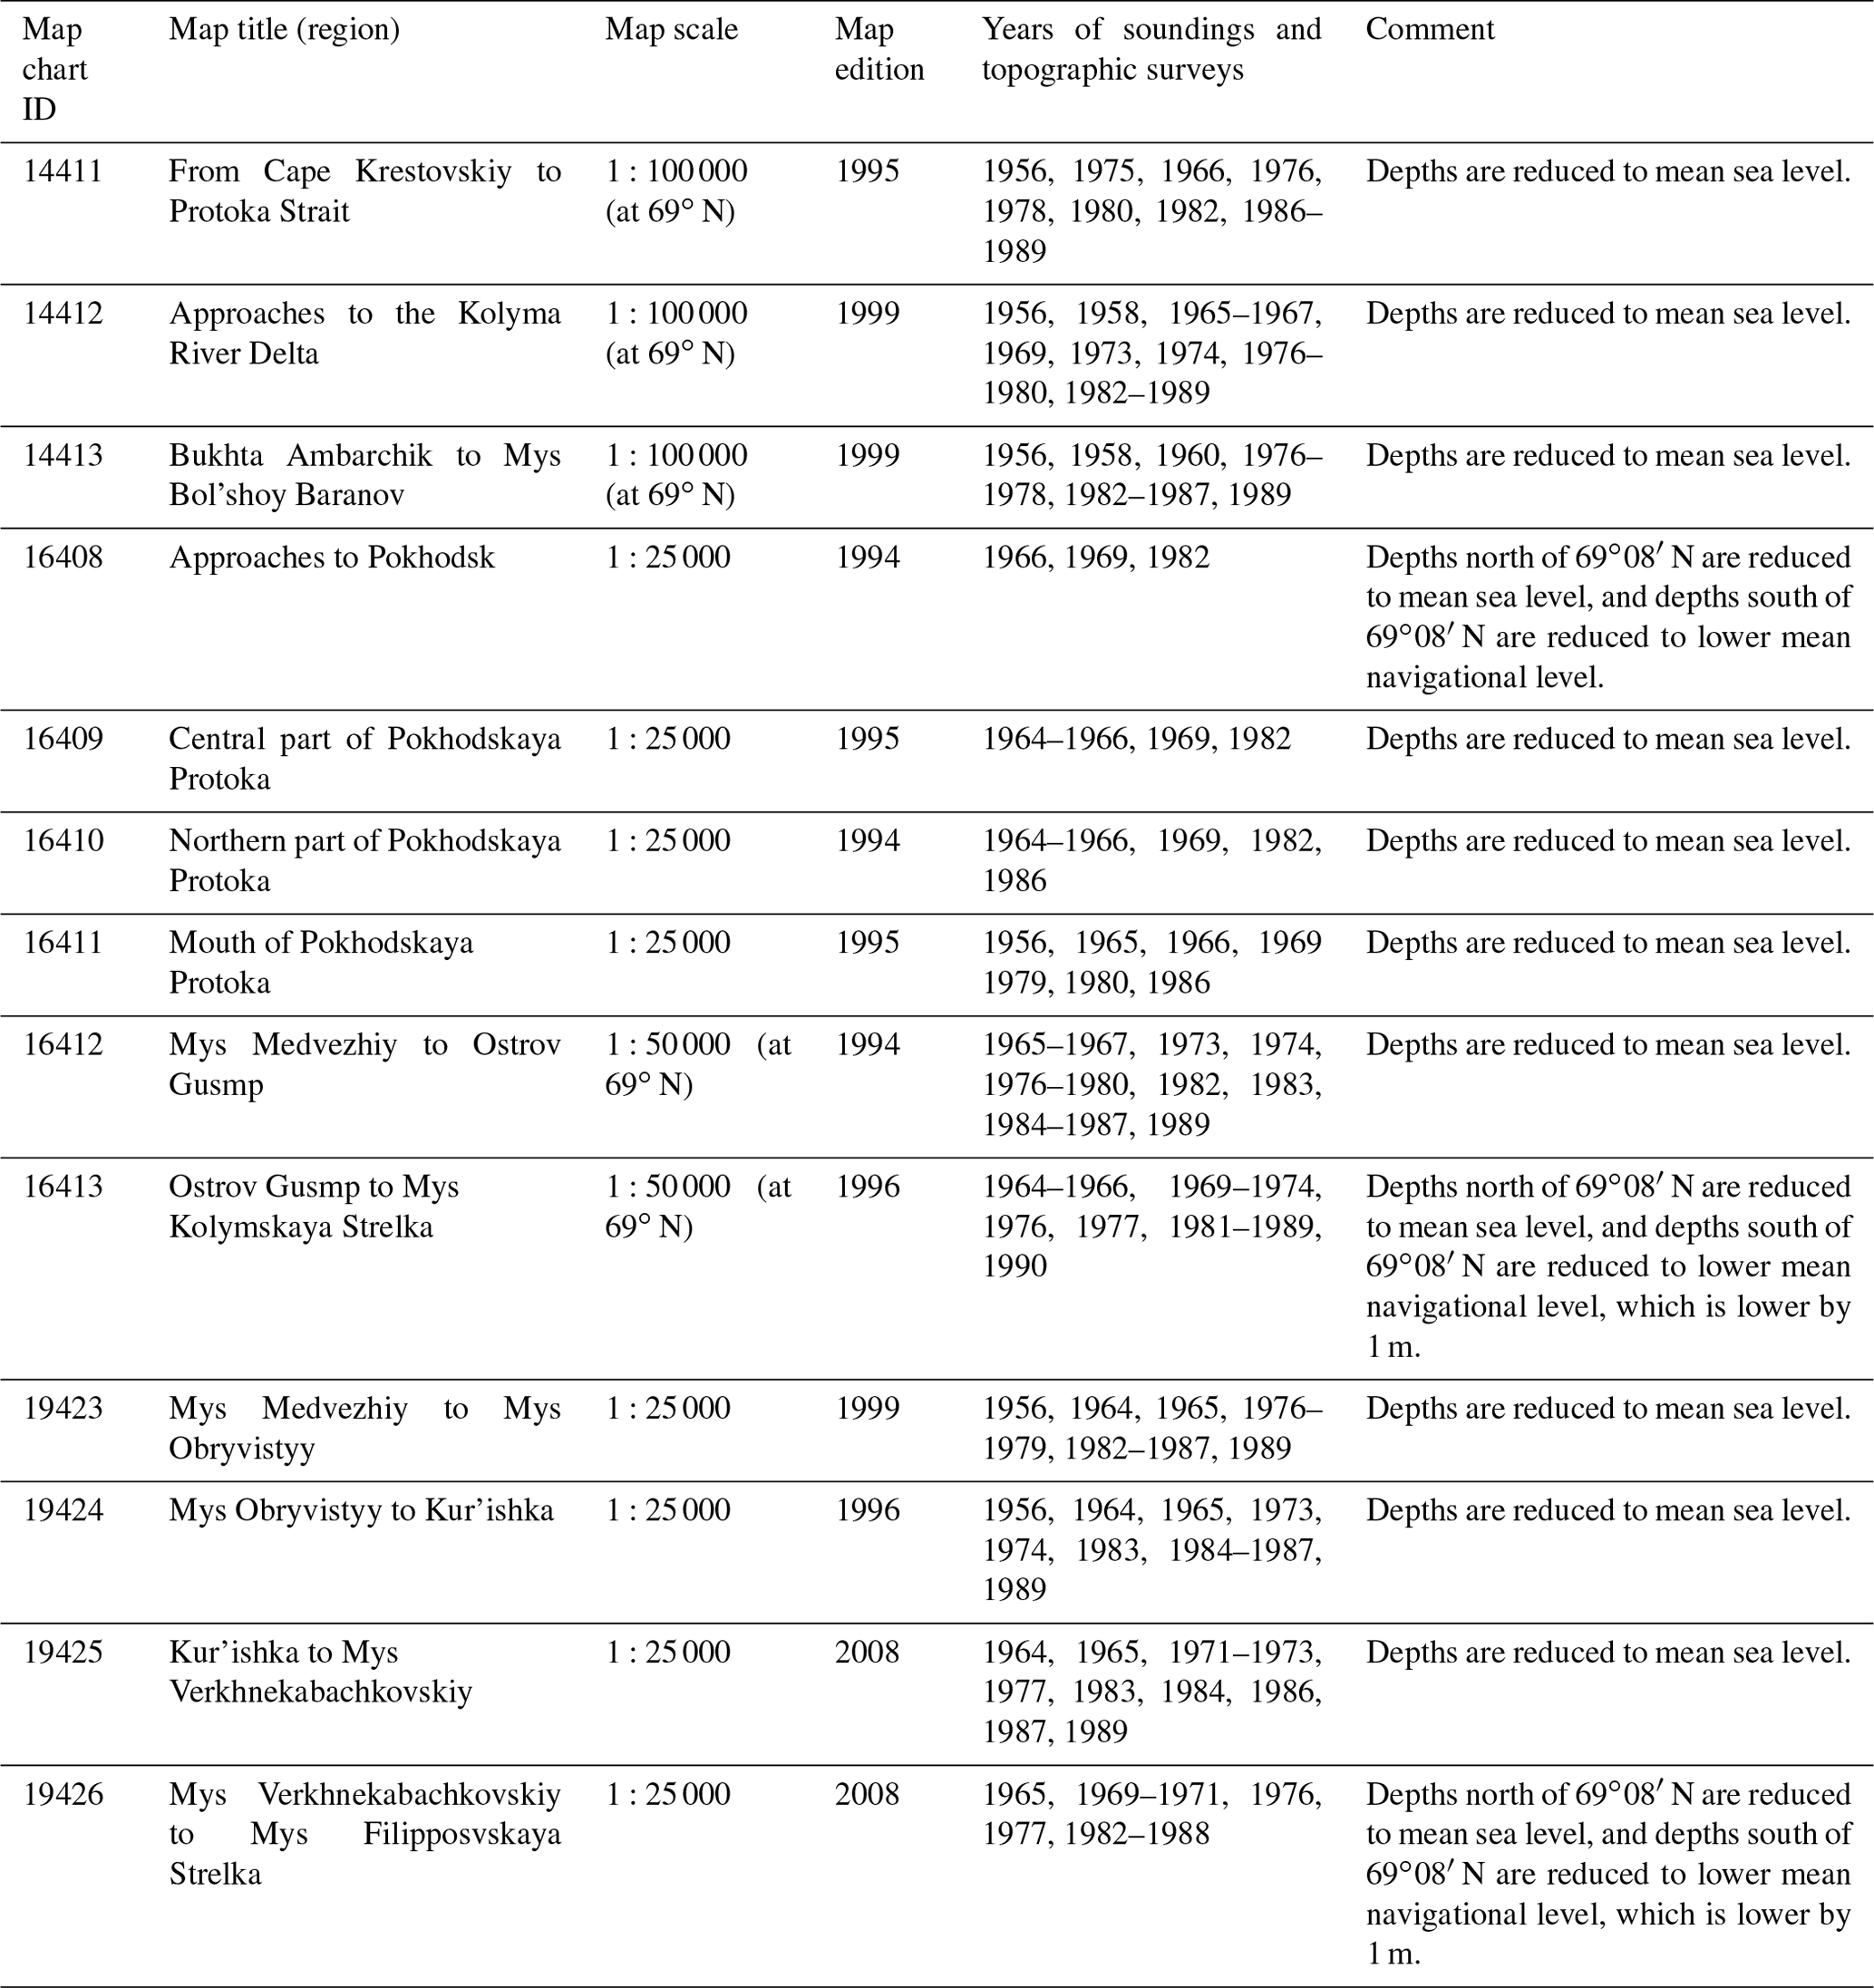
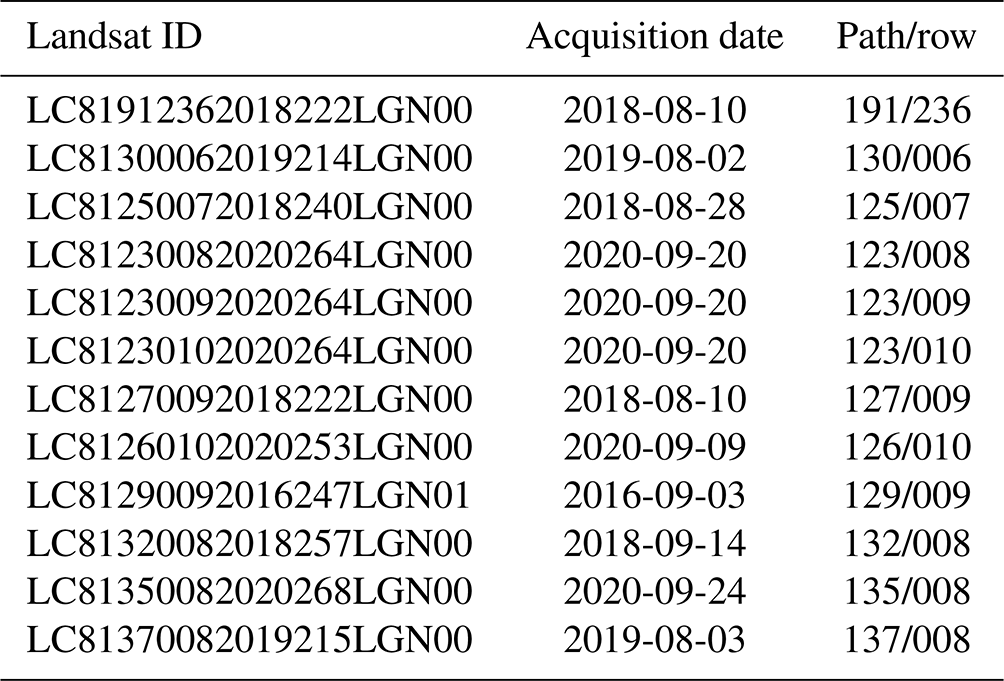
As a basis for the creation of a digital bathymetrical raster, 28 Russian nautical charts in the scales of 1:25 000–1:500 000 (Tables 1 and 2 and Figs. A1 and A2 in the Appendix) were digitized. The maps were acquired from East View Geospatial as georeferenced raster images. The projection of the maps was Gauss–Krüger (datum: Pulkovo 1942). According to the map legends, the original soundings and topographic surveys for these maps had been carried out since the 1940s (Tables 1 and 2) by the Department of Navigation and Oceanography, Russian Federation Ministry of Defense. Water depth points are given in meters and are in most cases reduced to mean sea level. Digitization of bathymetric information in the maps was manually conducted in ArcGIS™ version 10.6 and included individual water depths (points) as well as isobaths (lines), which then served as input data for our bathymetrical model. Nautical charts served previously as primary data for bathymetrical data sets in regions where input data are scarce, such as for the IBCAO (Jakobsson et al., 2020) or the International Bathymetrical Chart of the Southern Ocean (IBCSO) (Arndt et al., 2013). For shallow shelf zones (<200 m), nautical charts have been shown to be a valid data source for more accurate bathymetrical products for coastal zones in the Indian Ocean (Sindhu et al., 2007).
For the Lena Delta a total of 50 810 water depth points and 720 isobath lines were digitized from 15 nautical maps (Table 1). For the Kolyma Gulf, a total of 24 126 water depth points and 1053 isobath lines were digitized from 13 nautical maps (Table 2). The different nautical charts and various scales within a region partially overlapped with each other, leading to a denser, non-uniform point cloud of depth measurements (for the extent of the nautical charts, see Appendix A and Figs. A1 and A2). In most of the cases, depth measurements of overlapping parts were matching. If points were not congruent (e.g., due to different survey times or different map compilation dates; see Tables 1 and 2), the location of the depth measurement from the higher-resolution map was chosen. Digitization of the isobaths followed a similar strategy. Offsets in isobath lines from different charts were corrected by choosing the isobaths of the higher-resolution map.
2.2 Creation of the bathymetrical models based on the Topo to Raster interpolation method
For the interpolation of the digitized water depth points in combination with the isobath lines, we used the Esri ArcGIS 10.6 Topo to Raster (TTR) tool. TTR is a spatial interpolation method based on the ANUDEM (Australian National University Digital Elevation Model) from Hutchinson (1989) with the aim to create an accurate and hydrologically correct elevation model. We determined the outer boundary seawards by the extent of the nautical maps. Therefore, no extrapolation towards the outer East Siberian Sea and Laptev Sea outside the water depth points is calculated. For the Kolyma Gulf region, the Global Surface Water layer (Pekel et al., 2016) was used to delineate the water area. However, for the Lena Delta region this proved to not be feasible due to the many small banks and islands. Therefore, the water area was derived from a water index based on 12 Landsat 8 scenes. More information about the water area determination is compiled in the Appendix B. The following input data were used in the TTR tool for the models:
-
digitized point layer from nautical maps as “point elevation”
-
digitized isobath lines from nautical maps as “contour”
-
the water area setting the boundary of the bathymetrical model.
In addition, we set the primary data input type to points and set the parameter for drainage enforcing to “no_enforce” in order to allow sinks within the bathymetrical model since hydrological enforcing would only apply to runoff systems in terrestrial elevation models but not to bathymetrical models. We ran the tool with 20 iterations and set the maximum height to 0.0 m so that the tool did not extrapolate above mean sea level, and the resulting product only contains depths below sea level. Model runs were executed with a pixel size of 50 and 200 m, resulting in two products, a TTR50 bathymetrical data set and a TTR200 bathymetrical data set for both regions.
The advantage of the TTR tool is that it allows usage of points (e.g., the digitized depth measurements) as well as line features (e.g., the digitized isobath lines) as input data to produce the bathymetrical model. This was particularly useful for preserving channel outlets at the transition from the river to the near-shore zone in order to avoid artificial sinks caused by the interpolation from points only. Without isobath integration, the TTR models created beaded, artificial sinks in nearly all of the Kolyma and Lena river channels inside the delta or gulf as well as on the river–coastal transition zones.
2.3 Model validation and comparison to existing bathymetry products
2.3.1 Field measurements from the near-shore
Combined conductivity, temperature, and depth (CTD) data were collected on three field trips as part of the “Changing Arctic Carbon cycle in the cOastal Ocean Near-shore” (CACOON) project during spring (Strauss et al., 2021) and summer 2019 (Fuchs et al., 2021d) from the Lena Delta and Kolyma Gulf region (Fig. 2). We obtained CTD measurements in the Lena Delta using a handheld SonTekTM CastAway CTD device (for measurement accuracies see Appendix C) with an integrated GPS. With this compact device, we were able to obtain data from small dinghy boats also in shallow areas where larger vessels have no access. At each location, the CTD was lowered using additional ballast to ensure the CTD reached the sea (or river) floor. CTD measurements in the Kolyma Gulf region were made with a HYDROLAB HL7 multiparameter probe (OTT HydroMet).
For our CTD measurements, we specifically targeted the coastal near-shore and the transition from river waters to open sea since these regions have only sparse coverage in other data sets (see Sect. 2.3.2), often caused by the difficulty to access these shallow waters. With our unique and valuable data set, we complement other CTD data sets from these regions (e.g., Hölemann et al., 2020) and fill a critical gap in the coastal near-shore zone by specifically targeting the mouth of Arctic river channels. Our CTD metadata and data are available on the PANGAEA database (Fuchs et al., 2021c) from the Lena Delta near-shore zone and at the British Ocean Data Center (BODC) from the Kolyma main channel and the Kolyma near-shore zone (Palmtag and Mann, 2021; Palmtag et al., 2021).
In the Lena Delta region, CTD measurements were collected at 31 locations in the Sardakhskaya channel, spanning from Stolb Island at the apex of the Lena Delta to 80 km offshore in the Laptev Sea (Fig. 2a). Depth measurements ranged from 1.9 m (CAC19-C) to 21.5 m (CAC19-S-09) in the Lena Delta region. Aside from depth measurements, pressure (dbar), water temperature (∘C), conductivity (mS cm−1), conductance (mS cm−1), salinity (practical salinity scale), sound velocity (m s−1), and density (kg m−3) were also recorded and are provided with the data set.
In the Kolyma Gulf region, CTD measurements were collected during seven different trips, spanning from the freshet (11 June 2019) to late summer (2 September 2019). In total, 67 profiles were measured along a 140 km long transect starting from Cherskiy at the apex of the Kolyma Gulf northwards to the East Siberian Sea (Fig. 2b and c). The HYDROLAB HL7 multiparameter probe used for these measurements recorded data from a wide range of parameters (specific conductivity, mS cm−1; turbidity, NTU (nephelometric turbidity units); barometric pressure, mm Hg; dissolved oxygen, mg L−1; depth, m; water temperature, ∘C; density, kg m−3; salinity, psu; and chlorophyll-a concentration, µg L−1).
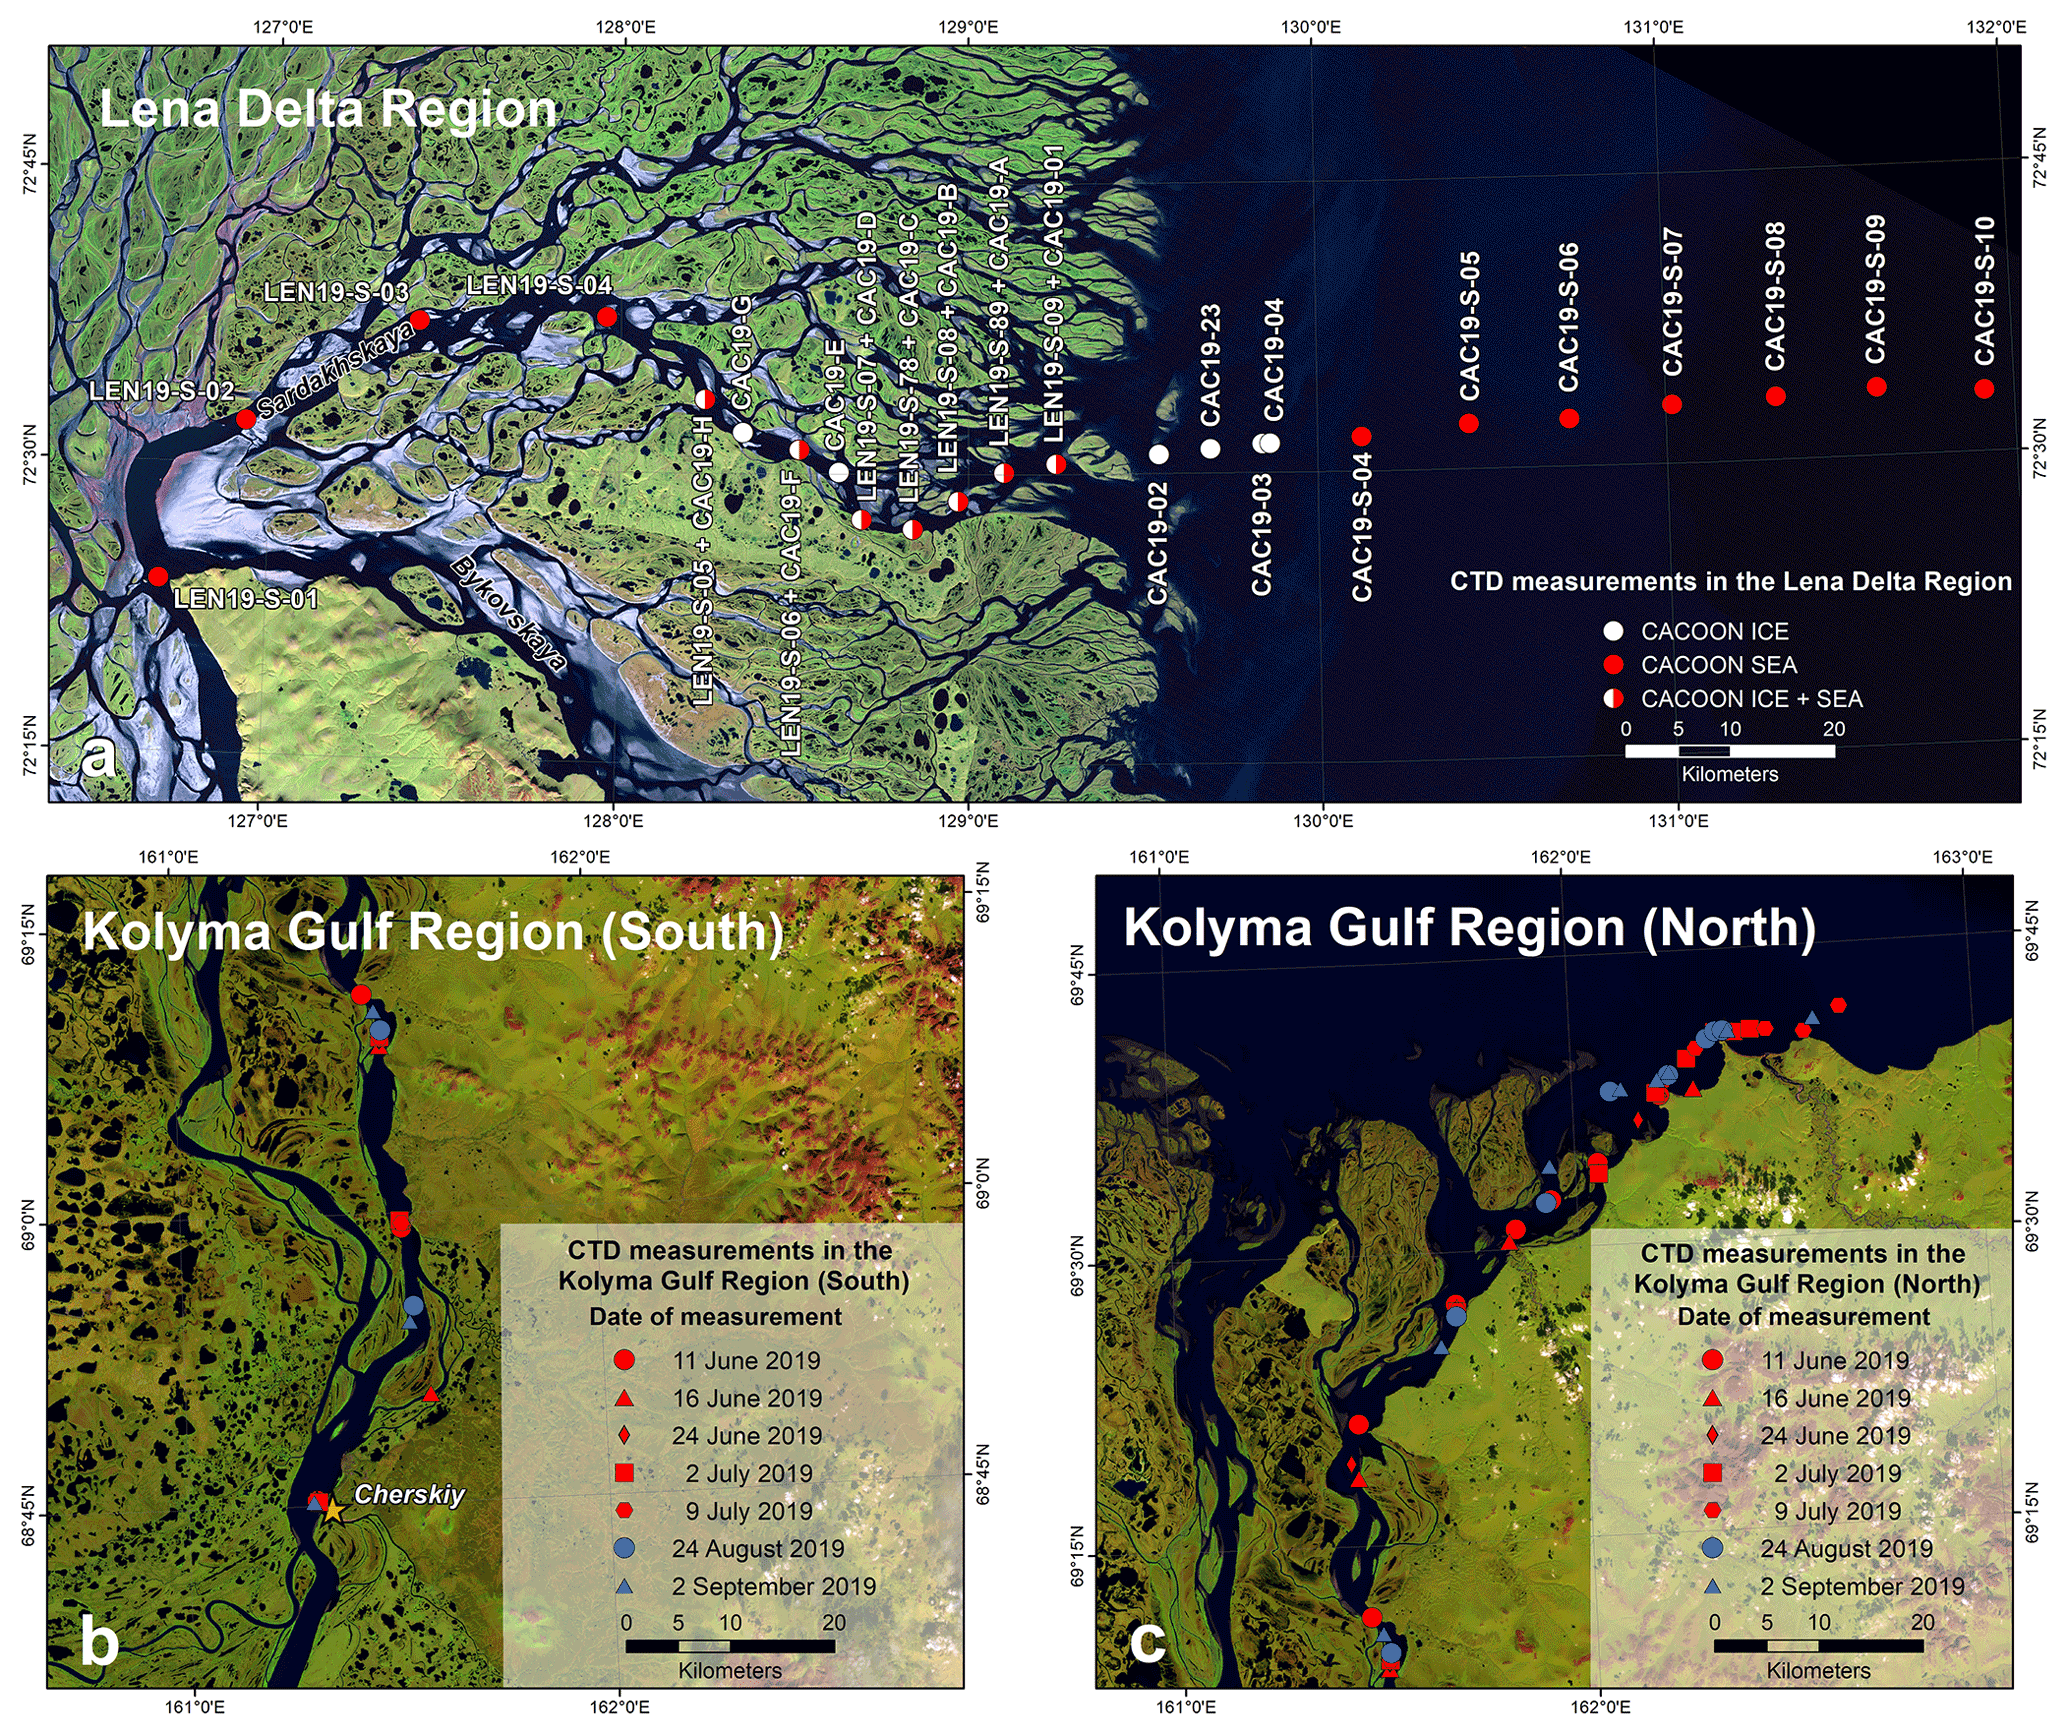
Figure 2(a) CTD measurement locations in the Lena Delta region during the CACOON 2019 expeditions (Fuchs et al., 2021c, 2021d; Strauss et al., 2021, Appendix Table C1) starting from Stolb Island (LEN19-S-01), passing through the Sardakhskaya main channel to 80 km offshore at CAC19-S-10 (background image: Landsat 5 mosaic (band combination 5, 4, 3) including scenes from 2009 and 2010; Landsat 5 image courtesy of the US Geological Survey). CTD data on the CACOON ice expeditions were collected from 30 March to 4 April 2019, and CTD data on the CACOON sea expedition were collected from 3 to 9 August 2019. (b) CTD measurement locations in the Kolyma Gulf region in the southern (b) and in the northern part (c) (Palmtag and Mann, 2021) (background image: Landsat 8 mosaic (band combination 6, 5, 3) including scenes from 2019; Landsat 8 image courtesy of the US Geological Survey). The orange star shows the city of Cherskiy. Campaigns in both regions aimed to cover the coastal near-shore and the transition zone from riverine to marine systems.
2.3.2 Additional archived data for model validation
Complementary to our own collected CTD data, we synthesized 660 historical and publicly available depth measurements from 14 additional data sets, available in the PANGAEA archive, for the Lena Delta region for an additional validation of our TTR bathymetry model. From 1994–2014, depth measurements were acquired by the Transdrift campaigns (https://www.transdrift.info/de, last access: 10 April 2022). Water depths from the Transdrift campaigns I to IX, XII, XVII, XIX, XXI, and XXII (Bauch et al., 2018, 2009; Janout et al., 2019a, b; Hölenmann et al., 2020; Transdrift Community Members, 2009a, b, c, d, e, f, g, h, i) were measured with a Sea-bird SBE 19+ CTD profiler, and we compared these to the TTR50 Lena Delta bathymetrical model. In addition to the Transdrift data, further CTD data available on PANGAEA were used (e.g., Bussmann, 2013; Dubinenkov et al., 2015; Gonçalves-Araujo et al., 2015; Wagner et al., 2012; Wetterich et al., 2011). Combined with our own CTD measurements (see Sect. 2.3.1), this resulted in 671 points for validation of the Lena Delta region bathymetrical model (Fig. 3). For the Kolyma Gulf region, the available depth measurements for comparison are sparse. Therefore, we compared our bathymetrical model only to our own collected CTD data points. In order to further validate the quality of the Kolyma Gulf region TTR50 model, we executed a cross-validation where we removed 1030 random points from the model run for validation (4.3 % of the available points). The model was then run with the remaining ∼23 000 points, and the output was compared to the 1030 omitted points.
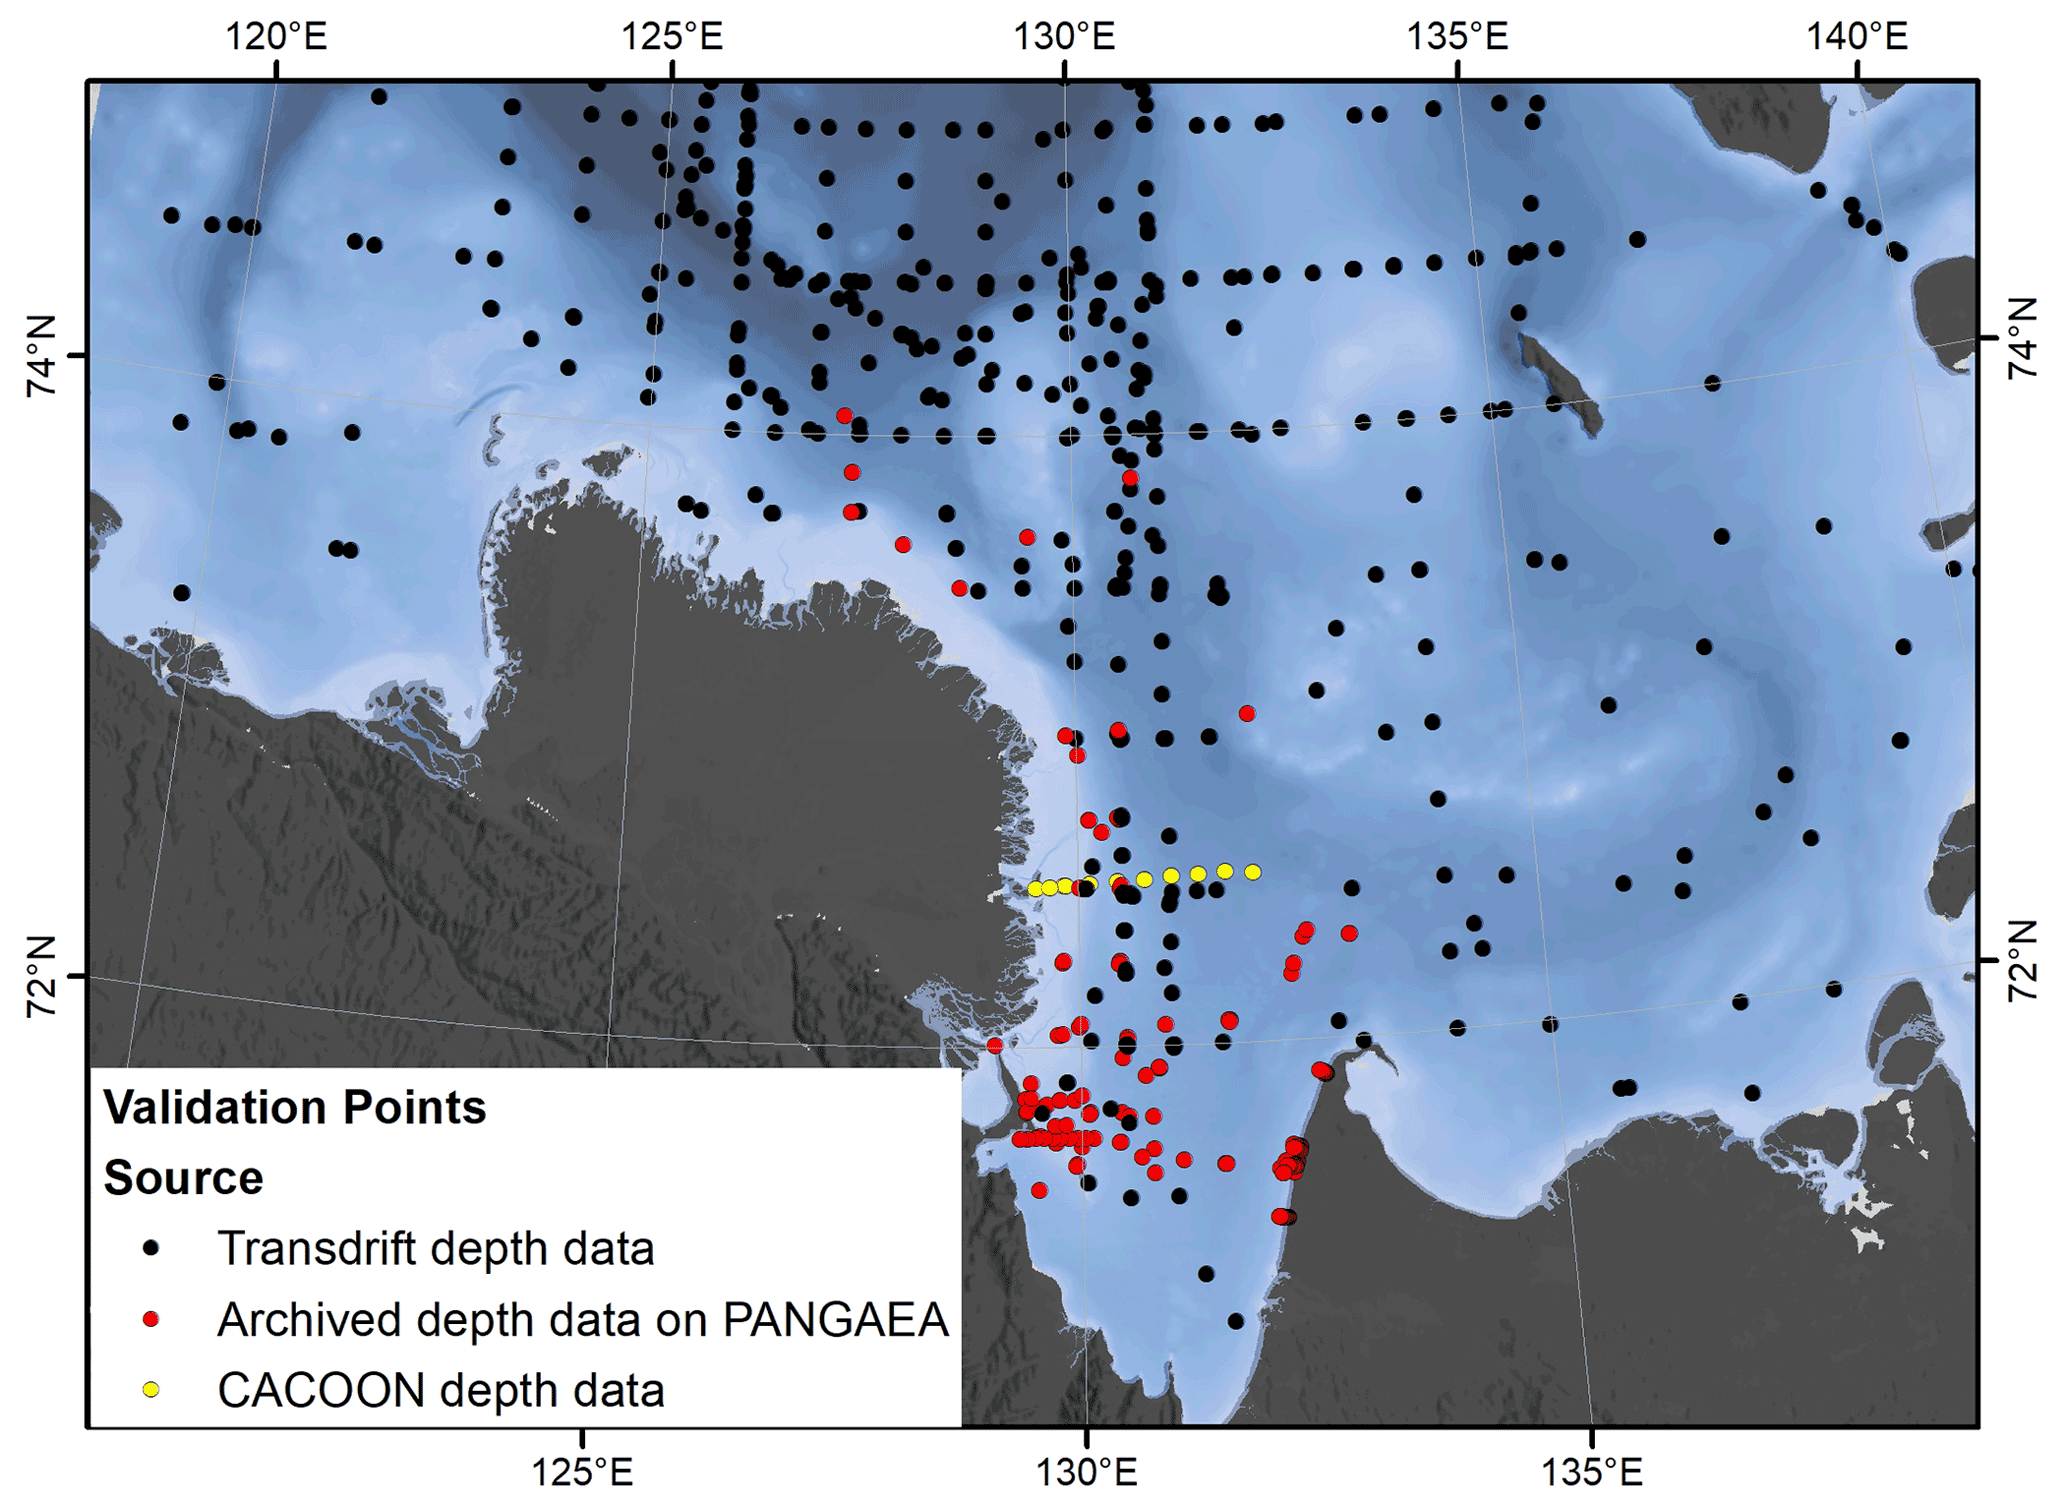
Figure 3Location of validation points for the Lena Delta region bathymetrical model.
2.3.3 Comparison of the bathymetrical models to the IBCAO
In addition to the validation of our TTR50 bathymetry models with CTD data, we compared the TTR200 models to the International Bathymetric Chart of the Arctic Ocean (IBCAO), which provides a bathymetrical model for the Arctic above 64∘ N latitude (Jakobsson et al., 2020). The latest version (v4) of the IBCAO data set was released in July 2020 with a 200 m grid size at its highest spatial resolution. The compilation of the IBCAO v4 includes different base data, such as single-beam and multi-beam echo soundings or digitized contour and isobath lines from nautical charts (Jakobsson et al., 2020). While there are numerous bathymetrical data available from the central Arctic Ocean from numerous international ship campaigns, such data are much more sparse for the often very shallow Arctic shelves and in particular the coastal zone in the Russian Arctic, resulting in high uncertainties for the IBCAO v4 accuracy for these shelf areas. In order to assess how well our digital bathymetrical products compare with the existing IBCAO v4 data set for the Lena and Kolyma coastal zones, we calculated vertical difference models. We used our 200 m resolution TTR bathymetrical model for both the Lena Delta and Kolyma Gulf region and subtracted the IBCAO v4 200 m raster from the TTR200 models to identify zones of large differences between these two data products.
For both study areas, we executed TTR model runs for a 50 and 200 m resolution bathymetrical model. Both final data sets are available on the PANGAEA data set repository as GeoTIFF raster files (Fuchs et al., 2021a, b). In addition, the published data sets include the depth point input data, the isobath line input data, and the water area polygon input data for both the Lena Delta and the Kolyma Gulf region, in shapefile format. The data sets can be accessed with the following links: https://doi.org/10.1594/PANGAEA.934045 (Fuchs et al., 2021a) and https://doi.org/10.1594/PANGAEA.934049 (Fuchs et al., 2021b).
3.1 Lena Delta region bathymetry model
The Lena Delta region bathymetry model (Fig. 4) includes more than 50 000 depth points derived from nautical charts and covers an area of 232 700 km2 stretching from Cape Mamontov Klyk in the western Laptev Sea to Kotelny Island in the New Siberian Islands. The highest point density, with an average of nearly five depth measurements per square kilometer, was found in the Tiksi Bay area and around Bykovsky Peninsula (see Fig. D1 in the Appendix). Overall, water depths in the bathymetrical model region ranged from 0 to 55.0 m, with an average depth of 17.6±9.0 m. Our TTR bathymetry models particularly show the transition and continuation of the Lena Delta main channels into the Laptev Sea (Fig. 4b and c), providing important indications of the direction and volume of water outflow from the Lena River into the Laptev Sea.
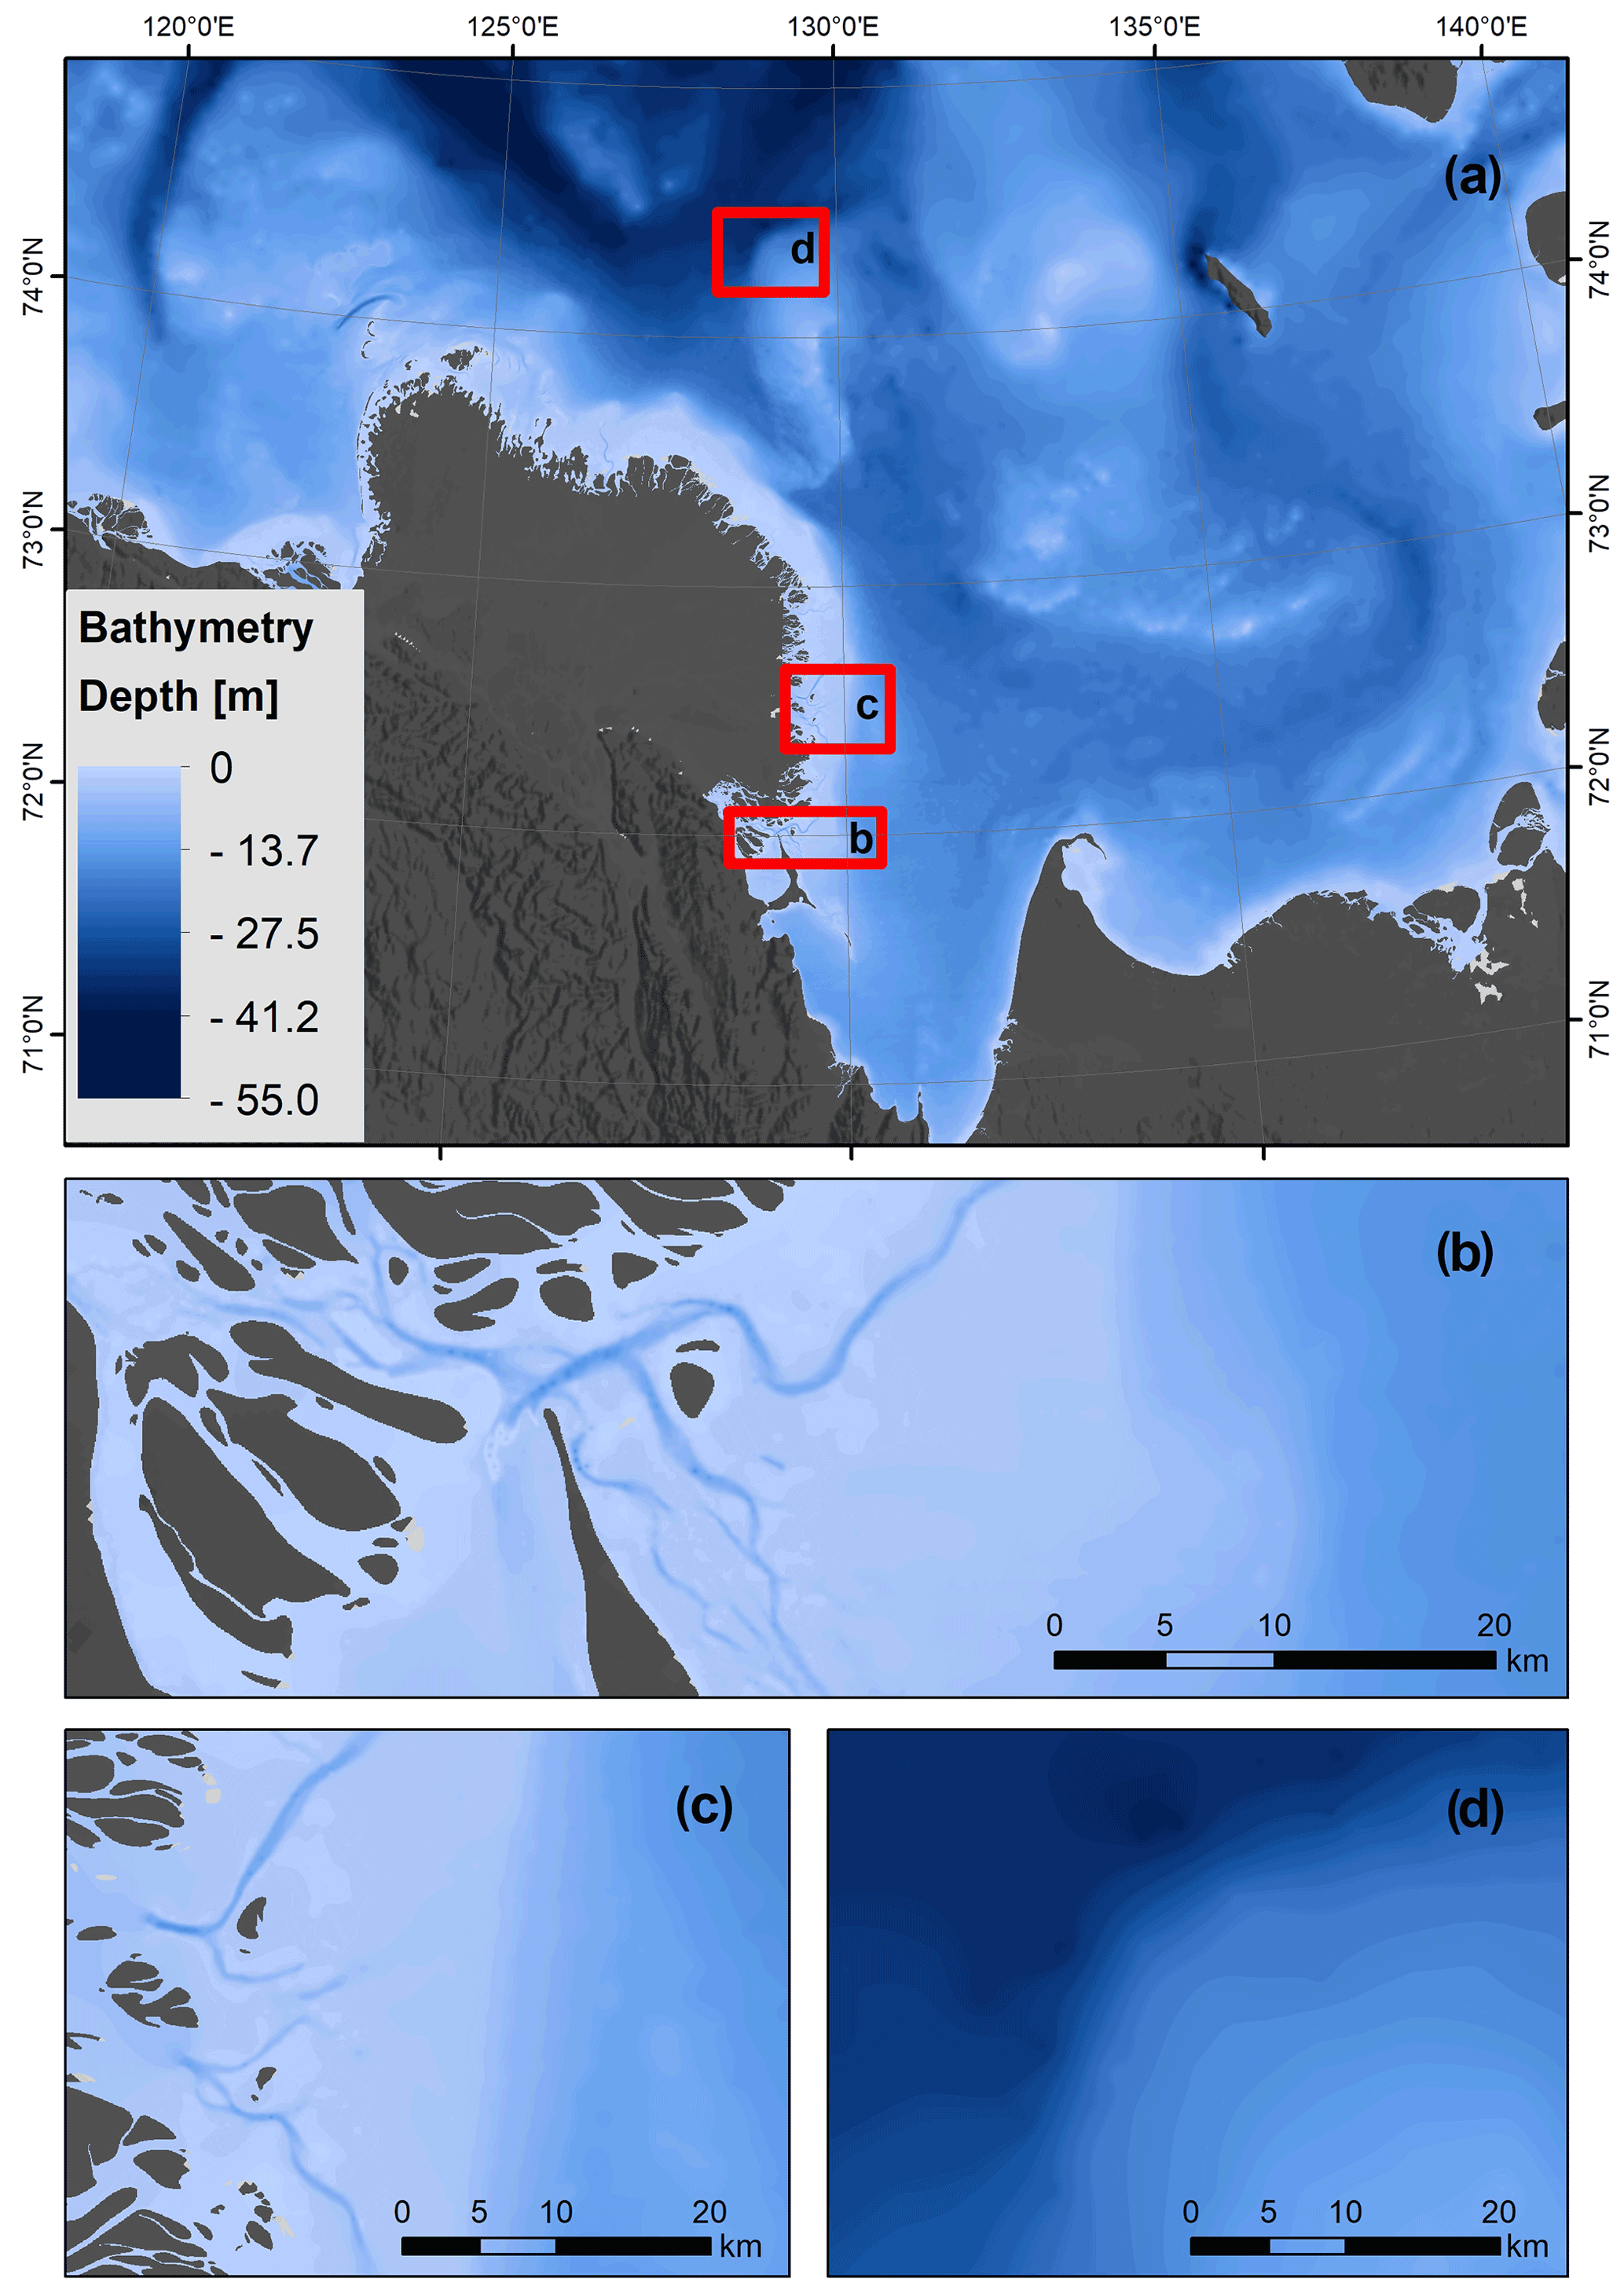
Figure 4(a) Topo-to-Raster-modeled bathymetry (TTR50) of the Lena Delta region with detailed map inlets showing the underwater channels at the outlet of the Bykovskaya channel (b), which became visible due to the inclusion of the isobath lines. Panel (c) shows the near-shore area of the Sardakhskaya channel, and panel (d) shows the transition from a shallow area into a deep open-water area 80 km north of the Lena Delta.
3.2 Kolyma Gulf region bathymetry model
The Kolyma Gulf region bathymetry model (Fig. 5a) includes more than 24 000 depth points derived from nautical charts and covers an area of 12 100 km2, starting from about 5 km downstream of the city of Cherskiy to 70 km into the East Siberian Sea. Water depths in the bathymetrical model ranged from 0 to 32.5 m, with an average depth of 10.4±6.6 m. The bathymetry shows the continuation of the Kolyma main channels into the near-shore (Fig. 5b) and the transition to deeper coastal areas. The highest point density, with an average of 17 measurements per square kilometer, was found in the Kolyma River main channel (see Fig. D2 in the Appendix). The high point resolution in the channels also shows a detailed channel morphology. Two deep river channels are present inside the Kolyma Gulf, passing through both of the main channels. Although they have varying depth (Fig. 5c and d), they indicate paths of predominant water flow, also during wintertime, when the Kolyma River is frozen.
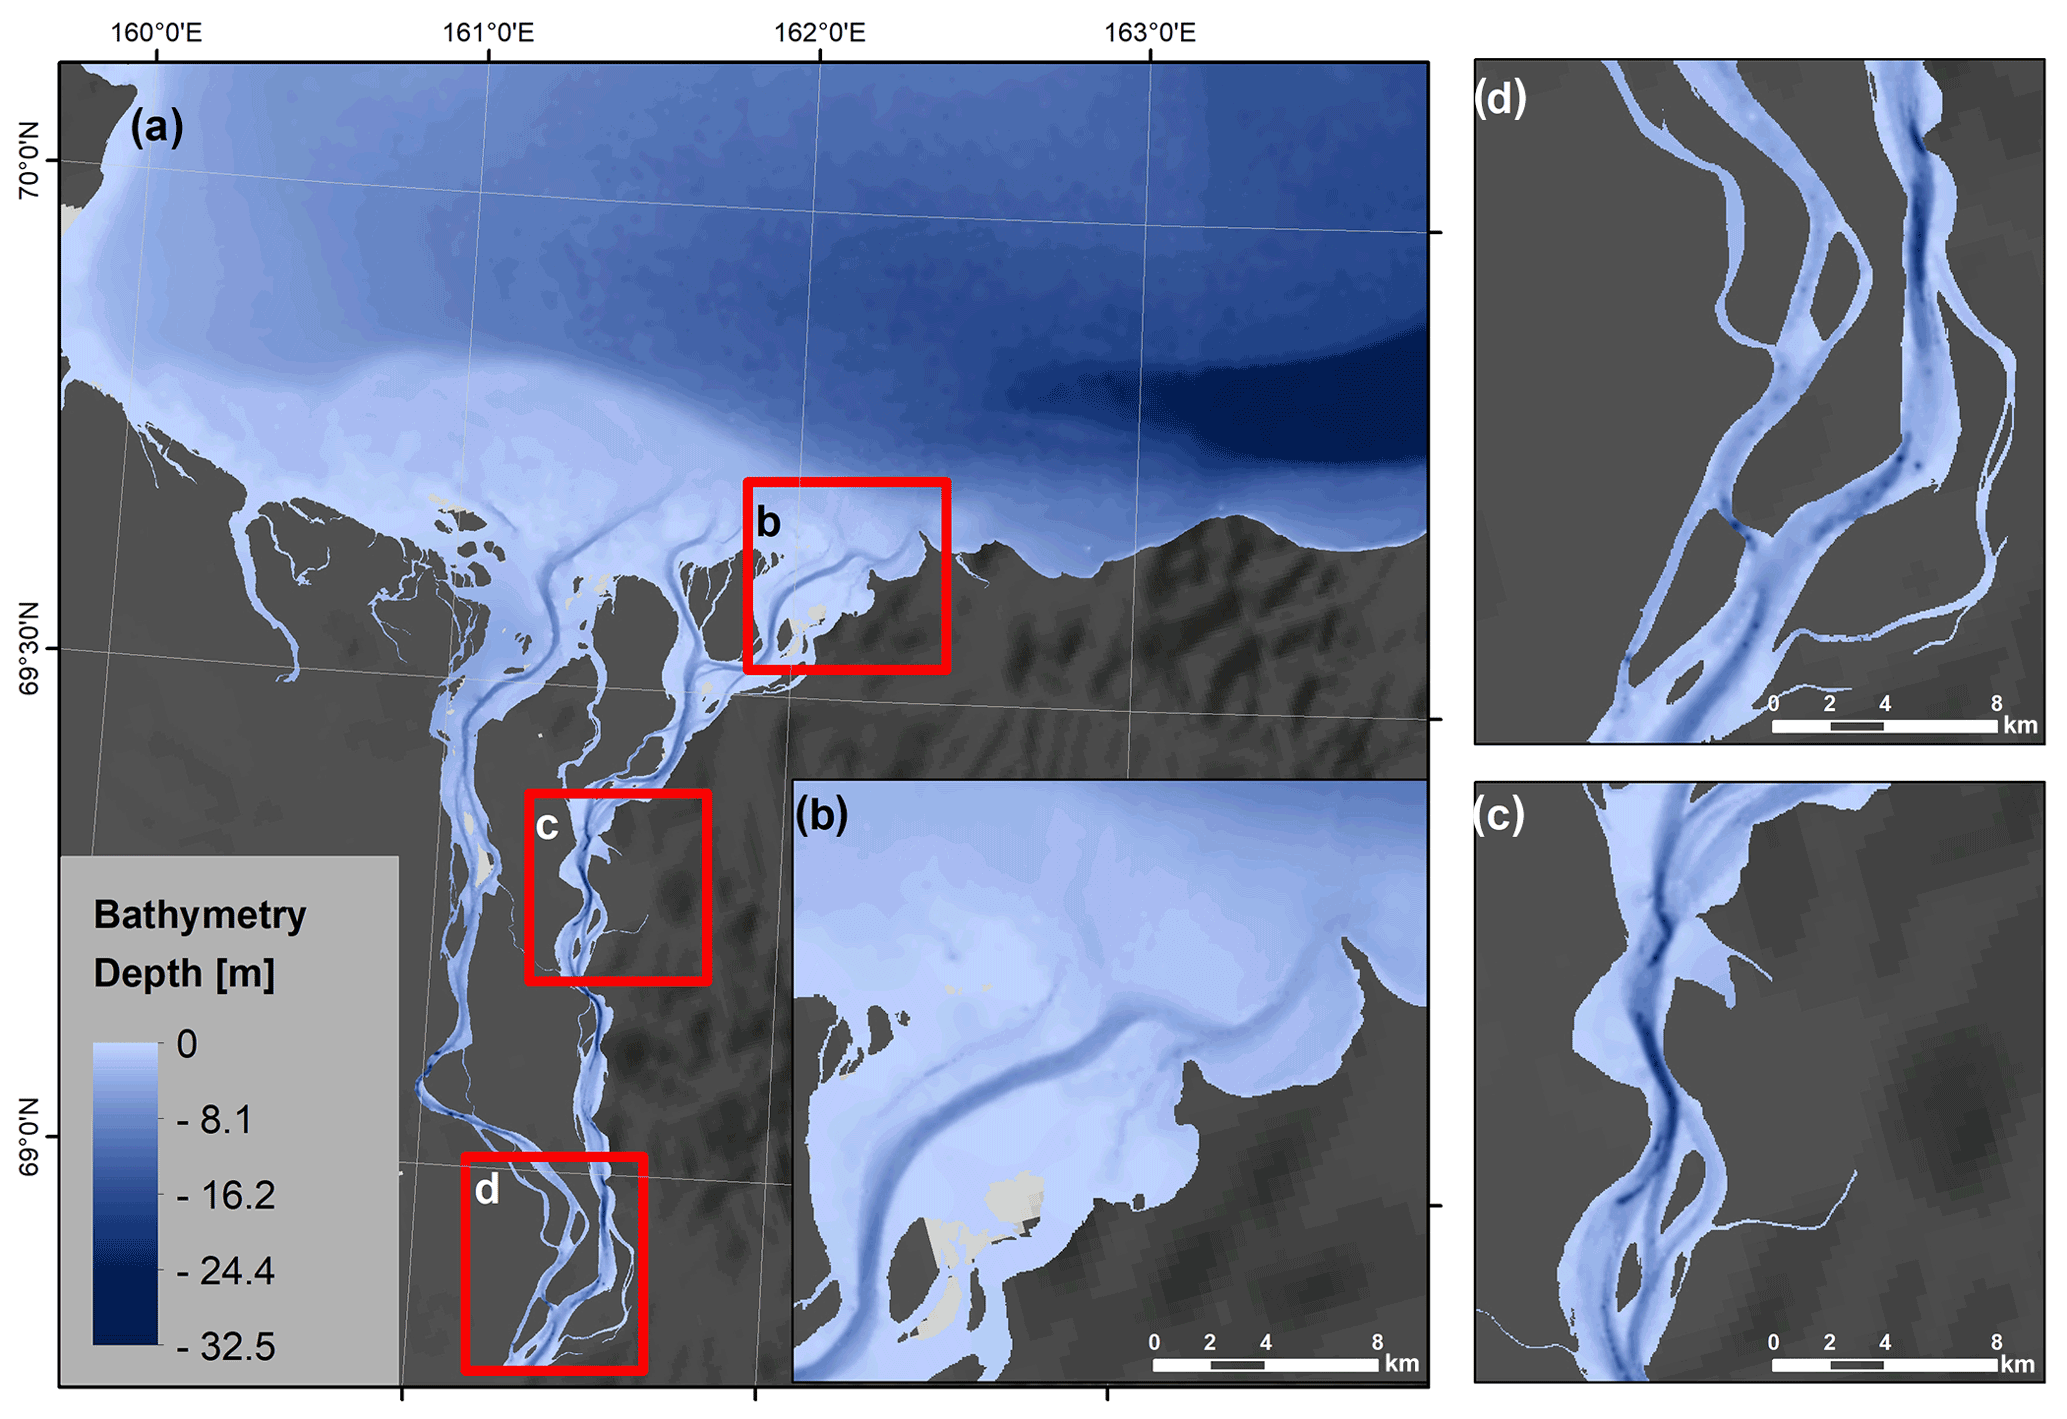
Figure 5(a) Topo-to-Raster-modeled bathymetry (TTR50) of the Kolyma Gulf region with three zoomed-in subsets of the Kolyma River mouth (b) in the central Kolyma Gulf showing one of the deepest parts of the main river channel (c) and at the apex point of the Kolyma Gulf region (d), where the two main channels split.
The Lena Delta and Kolyma Gulf region bathymetry was validated using our own depth field data (see Sect. 2.3.1) and synthesized depth data (including Transdrift CTD data; see Sect. 2.3.2), which were not included in the TTR50 model calculations. In addition, we compared our TTR200 models with the IBCAO v4 200 m (Jakobsson et al., 2020) bathymetry to detect differences between these two data sets.
4.1 Validation of the Lena Delta region bathymetry based on CTD data
The validation of the Lena Delta region bathymetry (TTR50) with the 671 CTD points for validation (Fig. 3) showed a good agreement (Fig. 6). The Pearson's correlation coefficient between all the CTD points and the Lena bathymetry is 0.98 (p<0.001), and while the Transdrift data mostly cover the deeper parts of the bathymetrical model, the depth data from smaller campaigns (e.g., Bussmann, 2013; Dubinenkov et al., 2015; Fuchs et al., 2021c; Strauss et al., 2021) cover the shallower parts (<20 m depth) of the Lena bathymetry. The aim of the TTR50 bathymetry model was specifically to target the shallow near-shore area; therefore our own collected depth data in this area help to validate the models. In addition, the synthesized data sets included the largest number of validation points in water depths less than 30 m (Fig. 6a), which show a good agreement with the modeled data for these locations (Fig. 6b). A few validation points show a larger deviation from the model (>5 m). These points may indicate real bathymetric features such as small-scale variabilities in the sea floor, which are not captured by TTR50 bathymetry. The locations of these points, including the deviation from the TTR50 bathymetry, are presented in the Appendix E (Fig. E1).
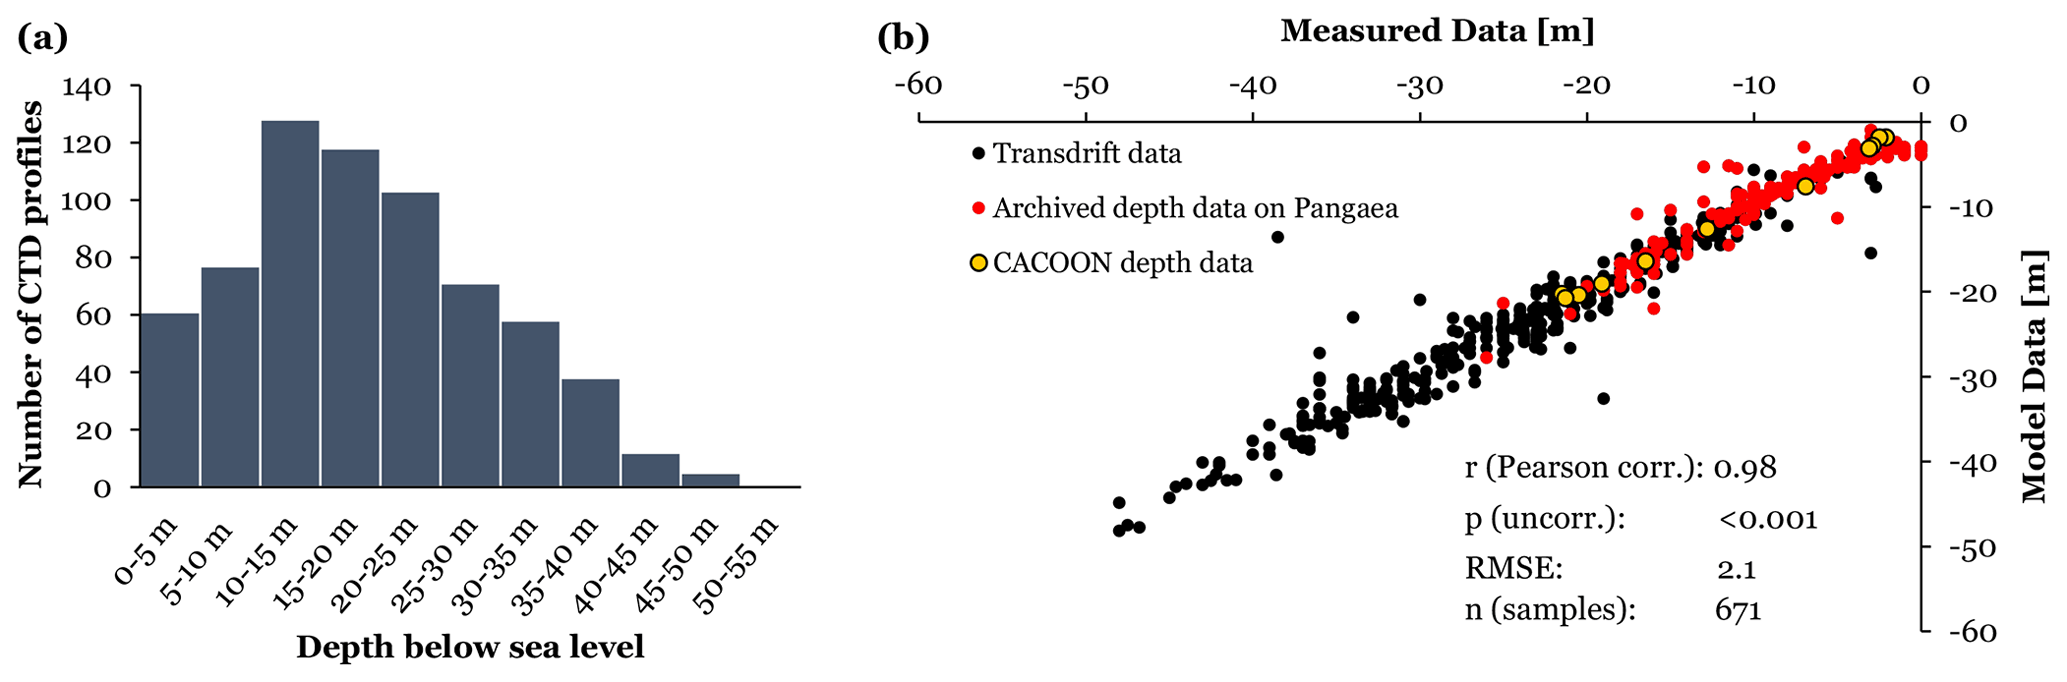
Figure 6Validation data for the Topo to Raster model (50 m) of the Lena Delta region. (a) Histogram showing the depth distribution (5 m depth intervals) of the CTD data in the Lena Delta region. (b) Correlation between the CTD data (671 points) and the modeled values (TTR50).
4.2 Validation of the Kolyma Gulf region bathymetry
The validation of the Kolyma Gulf region bathymetry (TTR50) with our own depth data (62 measured points; Palmtag and Mann, 2021) showed a very good agreement (Pearson's correlation is 0.90, p<0.001) (Fig. 7). The cross-validation with 1030 randomly chosen points showed an excellent agreement as well with a Pearson's correlation of 0.98, p<0.001. Therefore, the Kolyma bathymetry model shows good results. Only the deepest points (deeper than 32 m) are not well represented in the final model output since they are randomly distributed in the Kolyma channel or along the border of the modeled extent
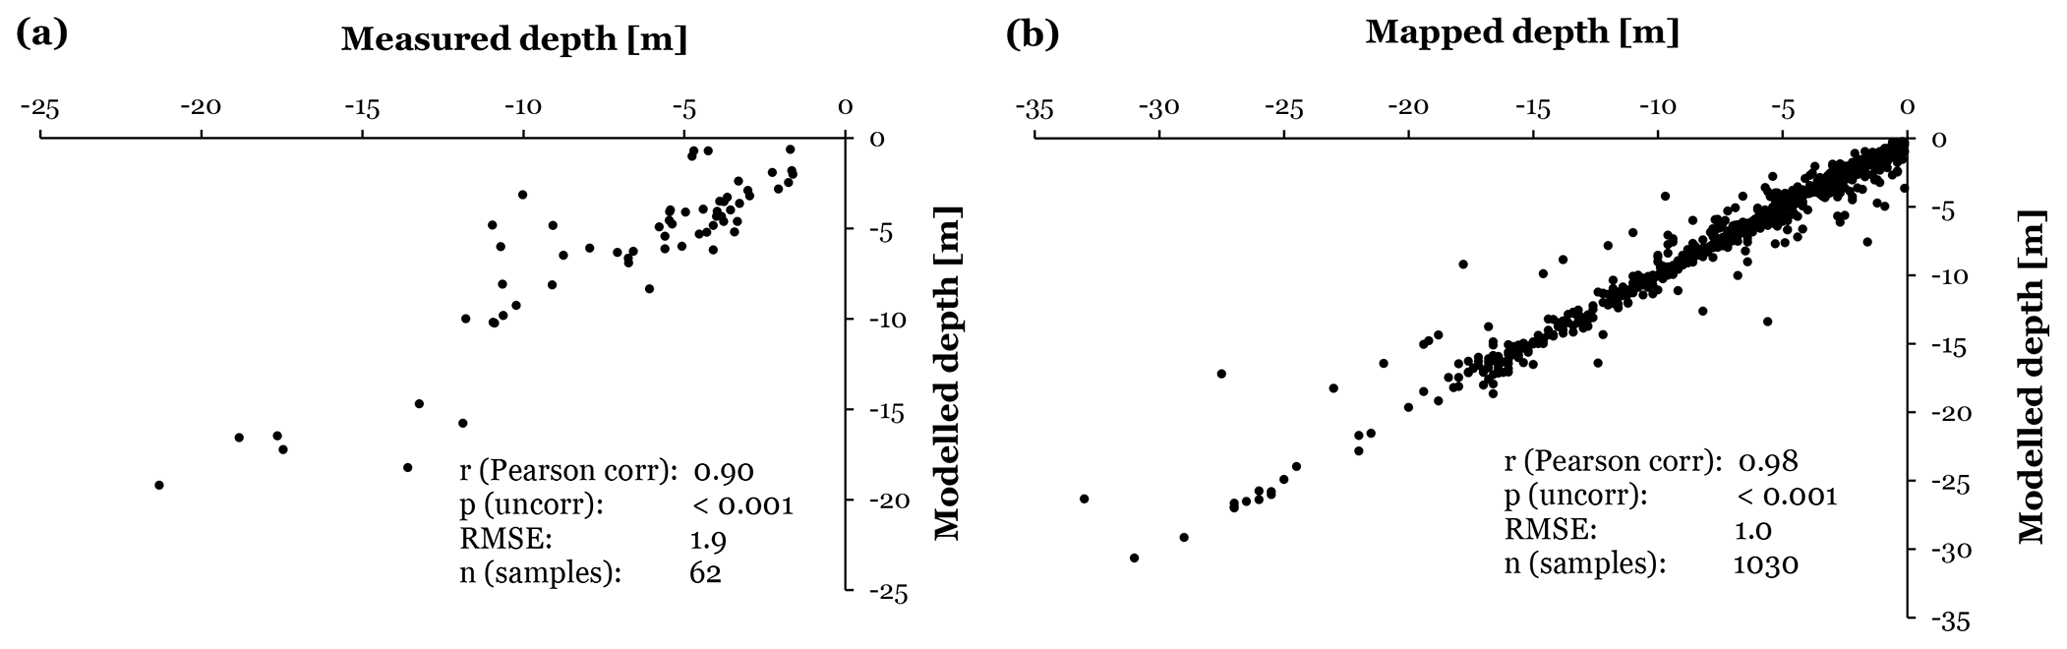
Figure 7(a) Correlation of the CTD data with the modeled bathymetrical values (TTR50) from the Kolyma Gulf region (62 points). (b) Cross-validation of the modeled bathymetrical values by a subset of samples (1030) which were excluded from the model run.
4.3 Improved representation of near-shore zones compared to the IBCAO
For the comparison of the TTR200 with the IBCAO v4 bathymetry (Jakobsson et al., 2020), only those areas where both data sets had values below sea level were included since the IBCAO v4 does not have depth indications for some near-shore and river channel areas. The comparison for both the Lena Delta region bathymetry (Fig. 8) and the Kolyma Gulf region bathymetry (Fig. 9) showed a good agreement. Overall, the mean difference between TTR200 and IBCAO is m for the Lena Delta region and m for the Kolyma Gulf region, indicating that the TTR200 bathymetry slightly overestimates the depths compared to the IBCAO v4 bathymetry. However, the small mean difference value close to zero covers up the major differences between the two data sets. In particular, in close proximity to the coast the spread between the two data sets is bigger (maximum difference of −33.7 and −18.5 m for the Lena and Kolyma region, respectively). This difference then becomes smaller with larger distance from the shorelines (see Fig. F1 in the Appendix). This demonstrates that the new high-resolution TTR bathymetry data sets are able to capture small-scale variability close to shore. In addition, with the TTR bathymetry, we are able to identify the deeper parts of the Kolyma River channels and the continuation of the larger channels in the transition from the river mouth to offshore areas for both regions, the Lena Delta (Fig. 8a and b) and Kolyma Gulf (Fig. 9a and b). These areas are important for the estimation and the modeling of the river outflow or the nutrient flux output into the coastal zone but are largely missed or underrepresented by the IBCAO v4 (Figs. 8c, d, 9e). This is a major improvement provided by our new high-resolution bathymetry and highlights the benefit of our TTR bathymetry data sets. In addition, the TTR bathymetry data sets give a more precise depth and water extent estimation for the Kolyma River channels (Fig. 9c and d) and can depict smaller-scale variations in the topography (Fig. 9e and f).

Figure 8Depth difference map for the TTR200 bathymetrical model and the IBCAO v4 200 m bathymetrical data set in the Lena Delta region (TTR200 minus IBCAO v4). Purple zones show areas where the IBCAO v4 incorrectly provides values above sea level. Reddish areas depict zones where the IBCAO v4 overestimates the depth in comparison to the TTR200. Blueish areas show zones where the IBCAO v4 has lower water depths than the TTR200. The highest positive value (10.2 m, red) means that the IBCAO v4 indicates a depth which is 10.2 m deeper than in the TTR200. Panels (c) and (d) show cross-sections deriving depth data from both data sets (TTR200 in red and IBCAO v4 in black) in the near-shore zone, indicating the higher spatial variability and detection of deep river channels in the TTR200.
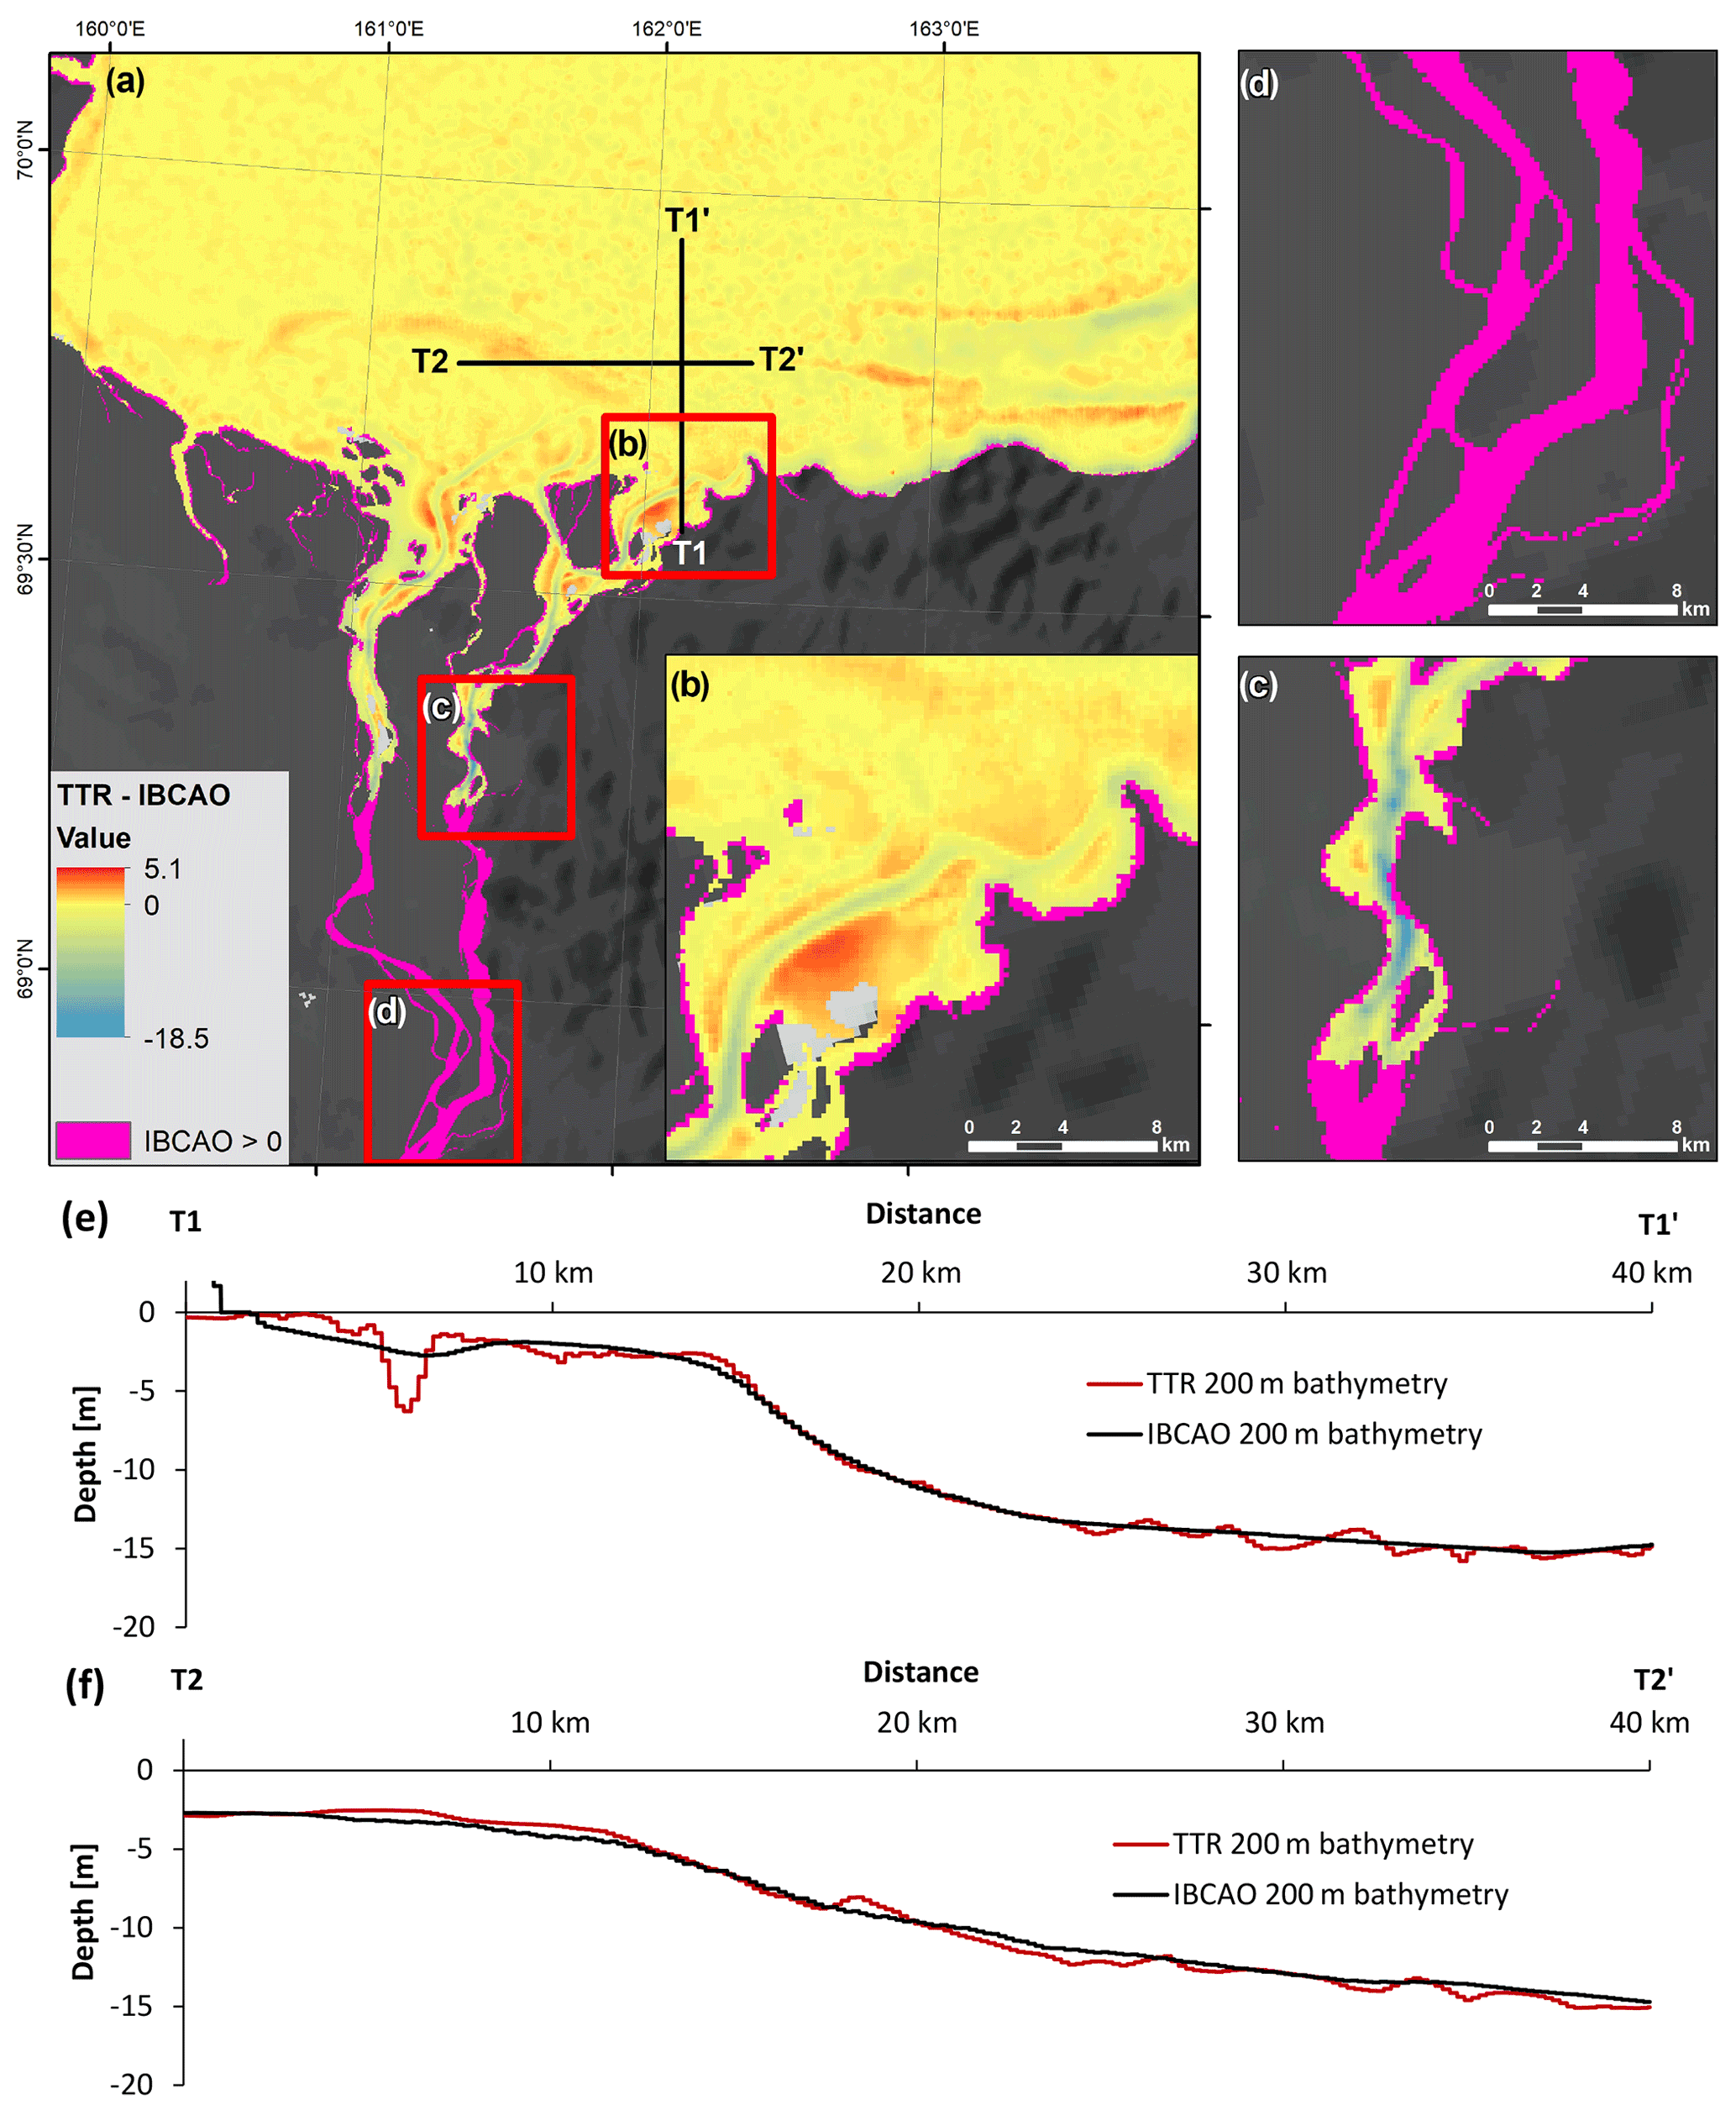
Figure 9Depth difference map for the TTR200 bathymetrical model and the IBCAO v4 200 m bathymetrical data set in the Kolyma Gulf region (TTR200 minus IBCAO v4). Purple zones show areas where the IBCAO v4 incorrectly provides values above sea level. Reddish areas depict zones where the IBCAO v4 overestimates the depth in comparison to the TTR200. Blueish areas show zones where the IBCAO v4 has lower water depths than the TTR200. The highest positive value (5.1 m, red) means that the IBCAO v4 indicates a depth which is 5.1 m deeper than in the TTR200. Panels (e) and (f) show cross-sections deriving depth data from both data sets (TTR200 in red and IBCAO v4 in black) in the near-shore zone, directly comparing the TTR200 and the IBCAO v4 bathymetrical model, indicating a generally good agreement between the two data sets with the exception of deep main river channels (e).
4.4 Potential applications and usage of the data sets
The resulting TTR50 and TTR200 products improve the near-shore bathymetry for the Lena Delta and Kolyma Gulf region, correlate closely with available CTD data, and have a close match with the new 200 m resolution IBCAO v4 data set. The reason for this high agreement is certainly the large number of points and isobath lines included in the TTR200 models. However, for near-shore sub-regions the TTR200 deviates from the IBCAO v4 data, suggesting a partial lack of spatial detail and higher uncertainty, in particular in near-shore zones for the IBCAO v4. It is also important to keep in mind that the input data for the TTR data sets were collected over a time span from the 1940s to the early 2000s. As a result, some included point depth measurements do not represent the current state anymore. By including water surface layers, which are based on recent satellite data, these point depth measurements were automatically excluded from the model once their location fell outside of the current water area. In particular, in the shallow parts of the river channels, changes could have occurred since the first data collection campaigns. However, Lauzon et al. (2019) reported that Arctic deltas often have persistent river channels due to the stabilizing effects of ice and permafrost. Also, particularly in the river channels and close to the shore areas, the TTR50 and TTR200 models show an improvement compared to currently available data products (IBCAO v4) and might help to model river output flow and fluvial carbon exports. In particular, the new small-scale (local) bathymetry from the two regions is essential for modeling arctic river export in the near-shore in contrast to IBCAO v4, which lacked the spatial variability of the near-shore zone required for such local-scale modeling.
Our detailed coastal zone bathymetry can be used for additional applications such as determining the zone of stable landfast ice. For example, Nghiem et al. (2014) found, by analyzing the recurrence of sea ice fractures, that the landfast ice extent has been stable for decades off the coast of the Mackenzie River delta and is likely constrained by the near-shore bathymetry. Similar results were observed by Mahoney et al. (2007), who linked the stability of landfast ice to local bathymetry at the Beaufort Sea coast. The identification of zones of grounding ice in winter can be important since these zones can enable a direct heat exchange to the sediment. Our high-resolution bathymetry might also help to understand where seabed scouring by ice can occur, which can cause reworking of bottom sediments and of benthic communities. Reimnitz et al. (1977) found a complete reworking of the seabed to an average depth of 20 cm in 6 to 40 m water depths by ice scours, and Conlan et al. (1998) showed the change in benthic organisms caused by ice scouring, which they consider to be a large-scale sediment reworking process at Arctic coasts.
In addition, our product can serve as input or validation for other studies. For example, local bathymetry can be used for validating the mapping of landfast sea ice stability with interferometric synthetic aperture radar (Dammann et al., 2019). Further, coastal bathymetry and water level are important parameters for determining rates of coastal erosion (e.g., Barnhart et al., 2014; Pearson et al., 2016), and an improvement of local bathymetry will therefore help to improve model forecasts of coastal erosion in the Laptev Sea region (e.g., Rolph et al., 2021). In addition, for determining the extent of subsea permafrost, knowledge of water depth and sea surface morphology is essential. High-resolution bathymetry products may improve the delineation and depth estimation of subsea permafrost (Nicolsky et al., 2012; Overduin et al., 2019).
In summary, this is, to the best of our knowledge, the best available digital bathymetrical data set for the near-shore of the Lena Delta and Kolyma Gulf regions, despite the fact that it is partly based on historical data. The accuracy and resolution of the two data sets provide important spatial information about the depth distribution in the coastal zones of the Lena Delta and Kolyma Gulf regions and give an indication of the offshore continuation of the main river channels. In combination with detailed mapping of deep channels in Arctic river deltas (Juhls et al., 2021), our new data set will improve the modeling of freshwater pathways as it transitions from land to ocean.
Our main purpose for compiling this data set was to create a digital bathymetrical data set as a model input for a high-resolution implementation of the coupled FVCOM-Arctic European Regional Shelf Seas Ecosystem Model (Arctic-ERSEM). Additionally, this data set can improve estimates of water and particulate and dissolved matter loads and distribution from the Lena and Kolyma main channels as well as aid in understanding the dynamics of near-shore landfast ice, ice scouring, and bottom sediment disturbance probability as well as subsea permafrost presence.
4.5 Challenges and limitations of the bathymetry models
According to the nautical chart legends, depth measurements have previously been corrected to mean sea level to account for the tidal influence during measurements. Therefore, the influence of astronomical tides, which is small in these areas (less than 1.5 m) (Are and Reimnitz, 2000; Pivovarov et al., 2005), can be neglected for the bathymetrical calculations, and a correction based on tidal charts would likely introduce more errors, and the benefit would be small. This, however, has to be considered when analyzing the CTD data (see Sect. 2.3) in more detail since no correction has been applied to our own CTD data we collected here.
While tidal influence in these regions is rather small, the coastal zones are affected by highly variable near-shore and river water levels. Wind and particularly storm surges can lead to increased coastal water depths and flooding. In particular, surges can lead to a shift in flow direction in, for example, the Kolyma River mouth area. Water level can be up to 2.5 m higher and lead to a surge which extends more than 200 km into the Kolyma River (Nikanorov et al., 2011). Similarly, Are and Reimnitz (2000) report that storm surges can cause a water level increase by up to 3.5 m in the northwestern part of the Lena Delta. In addition, the variable river discharge itself can considerably change the water level in the river mouth area of the Kolyma River and can be up to 6 m higher during peak (freshet) runoff periods (Nikanorov et al., 2011). These events and dynamics are not captured in the TTR50 and TTR200 bathymetry data.
Moreover, the inland continuation of the bathymetry in the Lena River main channels would further improve estimations on river and sediment outflow into the Laptev Sea. However, available maps did not cover these areas, and as such no statement on water depths in the main Lena River channels can be made with our bathymetrical data set. Also, Juhls et al. (2021) found several smaller channel continuations offshore the Lena Delta which are undetected even with our high-resolution bathymetry.
When using the TTR50 and TTR200 bathymetry data sets, it is important to consider that these data sets are based on spatial interpolation. As many other spatial interpolation techniques, Topo to Raster assigns values to cells based on the surrounding data points. The advantage of Topo to Raster is that it also includes lines (isobaths) to model the surface accurately. The TTR50 and TTR200 are products of such an interpolation, where the point density varies (see Figs. D1 and D2 in the Appendix), and the median distance between points is 238 and 794 m for the Kolyma Gulf and Lena Delta region, respectively. The average point density in the TTR models is 0.2 points km−2 for the Lena Delta (Fig. D1) and 1.5 points km−2 (Fig. D2) for the Kolyma Gulf region. However, the Topo to Raster method does also include the isobaths, which are particularly important for the near-shore zone and helped to improve the accuracy in depicting the near-shore river channels. In addition, the point density is considerably higher in near-shore areas compared to further offshore zones, particularly for the Lena Delta region (see Fig. D1 in the Appendix).
The two bathymetrical data sets (TTR50+200) for both the Lena Delta and Kolyma Gulf region are available on the PANGAEA (https://www.pangaea.de/, last access: 10 April 2022) data set repository as GeoTIFFs in 50 m (TTR50) and 200 m (TTR200) spatial resolution (https://doi.org/10.1594/PANGAEA.934045; Fuchs et al., 2021a) for the Lena Delta (https://doi.org/10.1594/PANGAEA.934049; Fuchs et al., 2021b) and for the Kolyma Gulf region. In addition, the published data sets include the depth point input data, the isobath line input data, and the water area polygon input data for both the Lena Delta and the Kolyma Gulf region in shapefile format.
The CTD data from the CACOON expeditions are archived on PANGAEA for the Lena Delta region (https://doi.org/10.1594/PANGAEA.933187; Fuchs et al., 2021c) and on the BODC data set repository for the Kolyma Gulf region (https://doi.org/10.5285/c10a2798-40cc-7648-e053-6c86abc07c3c; Palmtag and Mann, 2021), respectively.
With our new data set we provide the first detailed and seamless digital models of coastal zone bathymetry for the Lena River delta and Kolyma Gulf region in northeastern Siberia. We provide GeoTIFF rasters in 50 and 200 m spatial resolution based on digitized depth points and isobath lines from nautical charts. The models were compared to measured coastal zone depth data, archived depth data available on PANGAEA, and the IBCAO bathymetry. While the new bathymetrical models showed a good agreement to the compared data, the new models particularly reveal the location and continuation of the larger, deeper river channels in the transition from the river mouth to offshore areas for both regions. Our data product can therefore serve as model input to quantify fluvial and coastal carbon fluxes as it transitions from land to ocean but also help to understand dynamics of near-shore landfast ice or subsea permafrost in coastal zones.
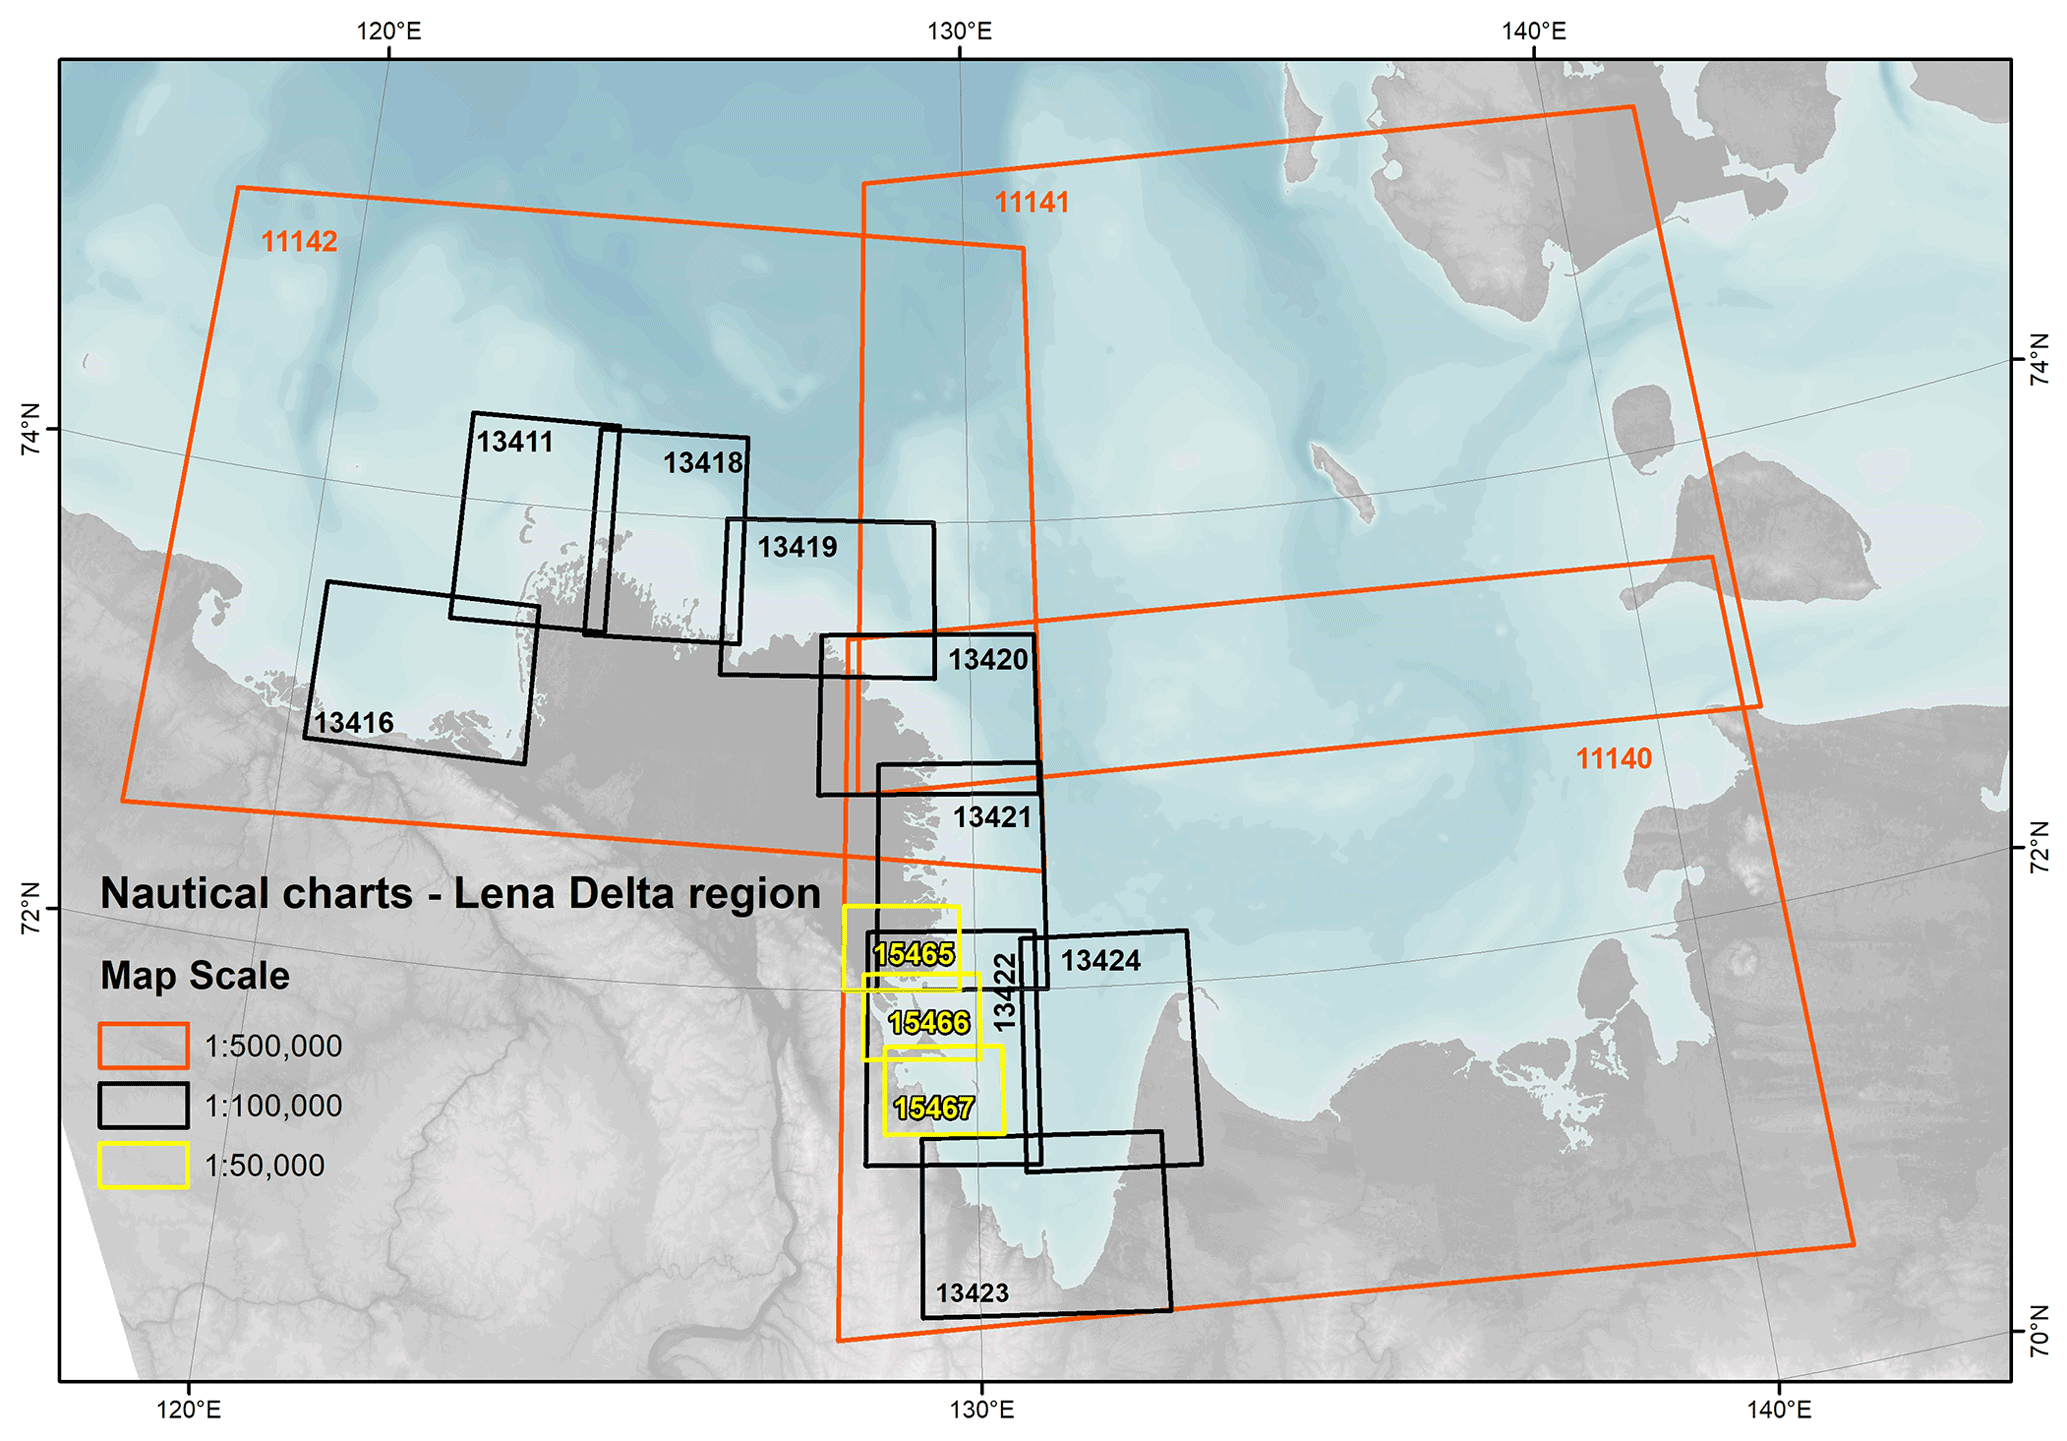
Figure A1Extent and scale of the nautical charts used for the bathymetrical models in the Lena Delta region. Chart numbers are indicated on the map. More details on the charts can be found in Table 1. The background map is the IBCAO v4 data from Jakobsson et al. (2020).
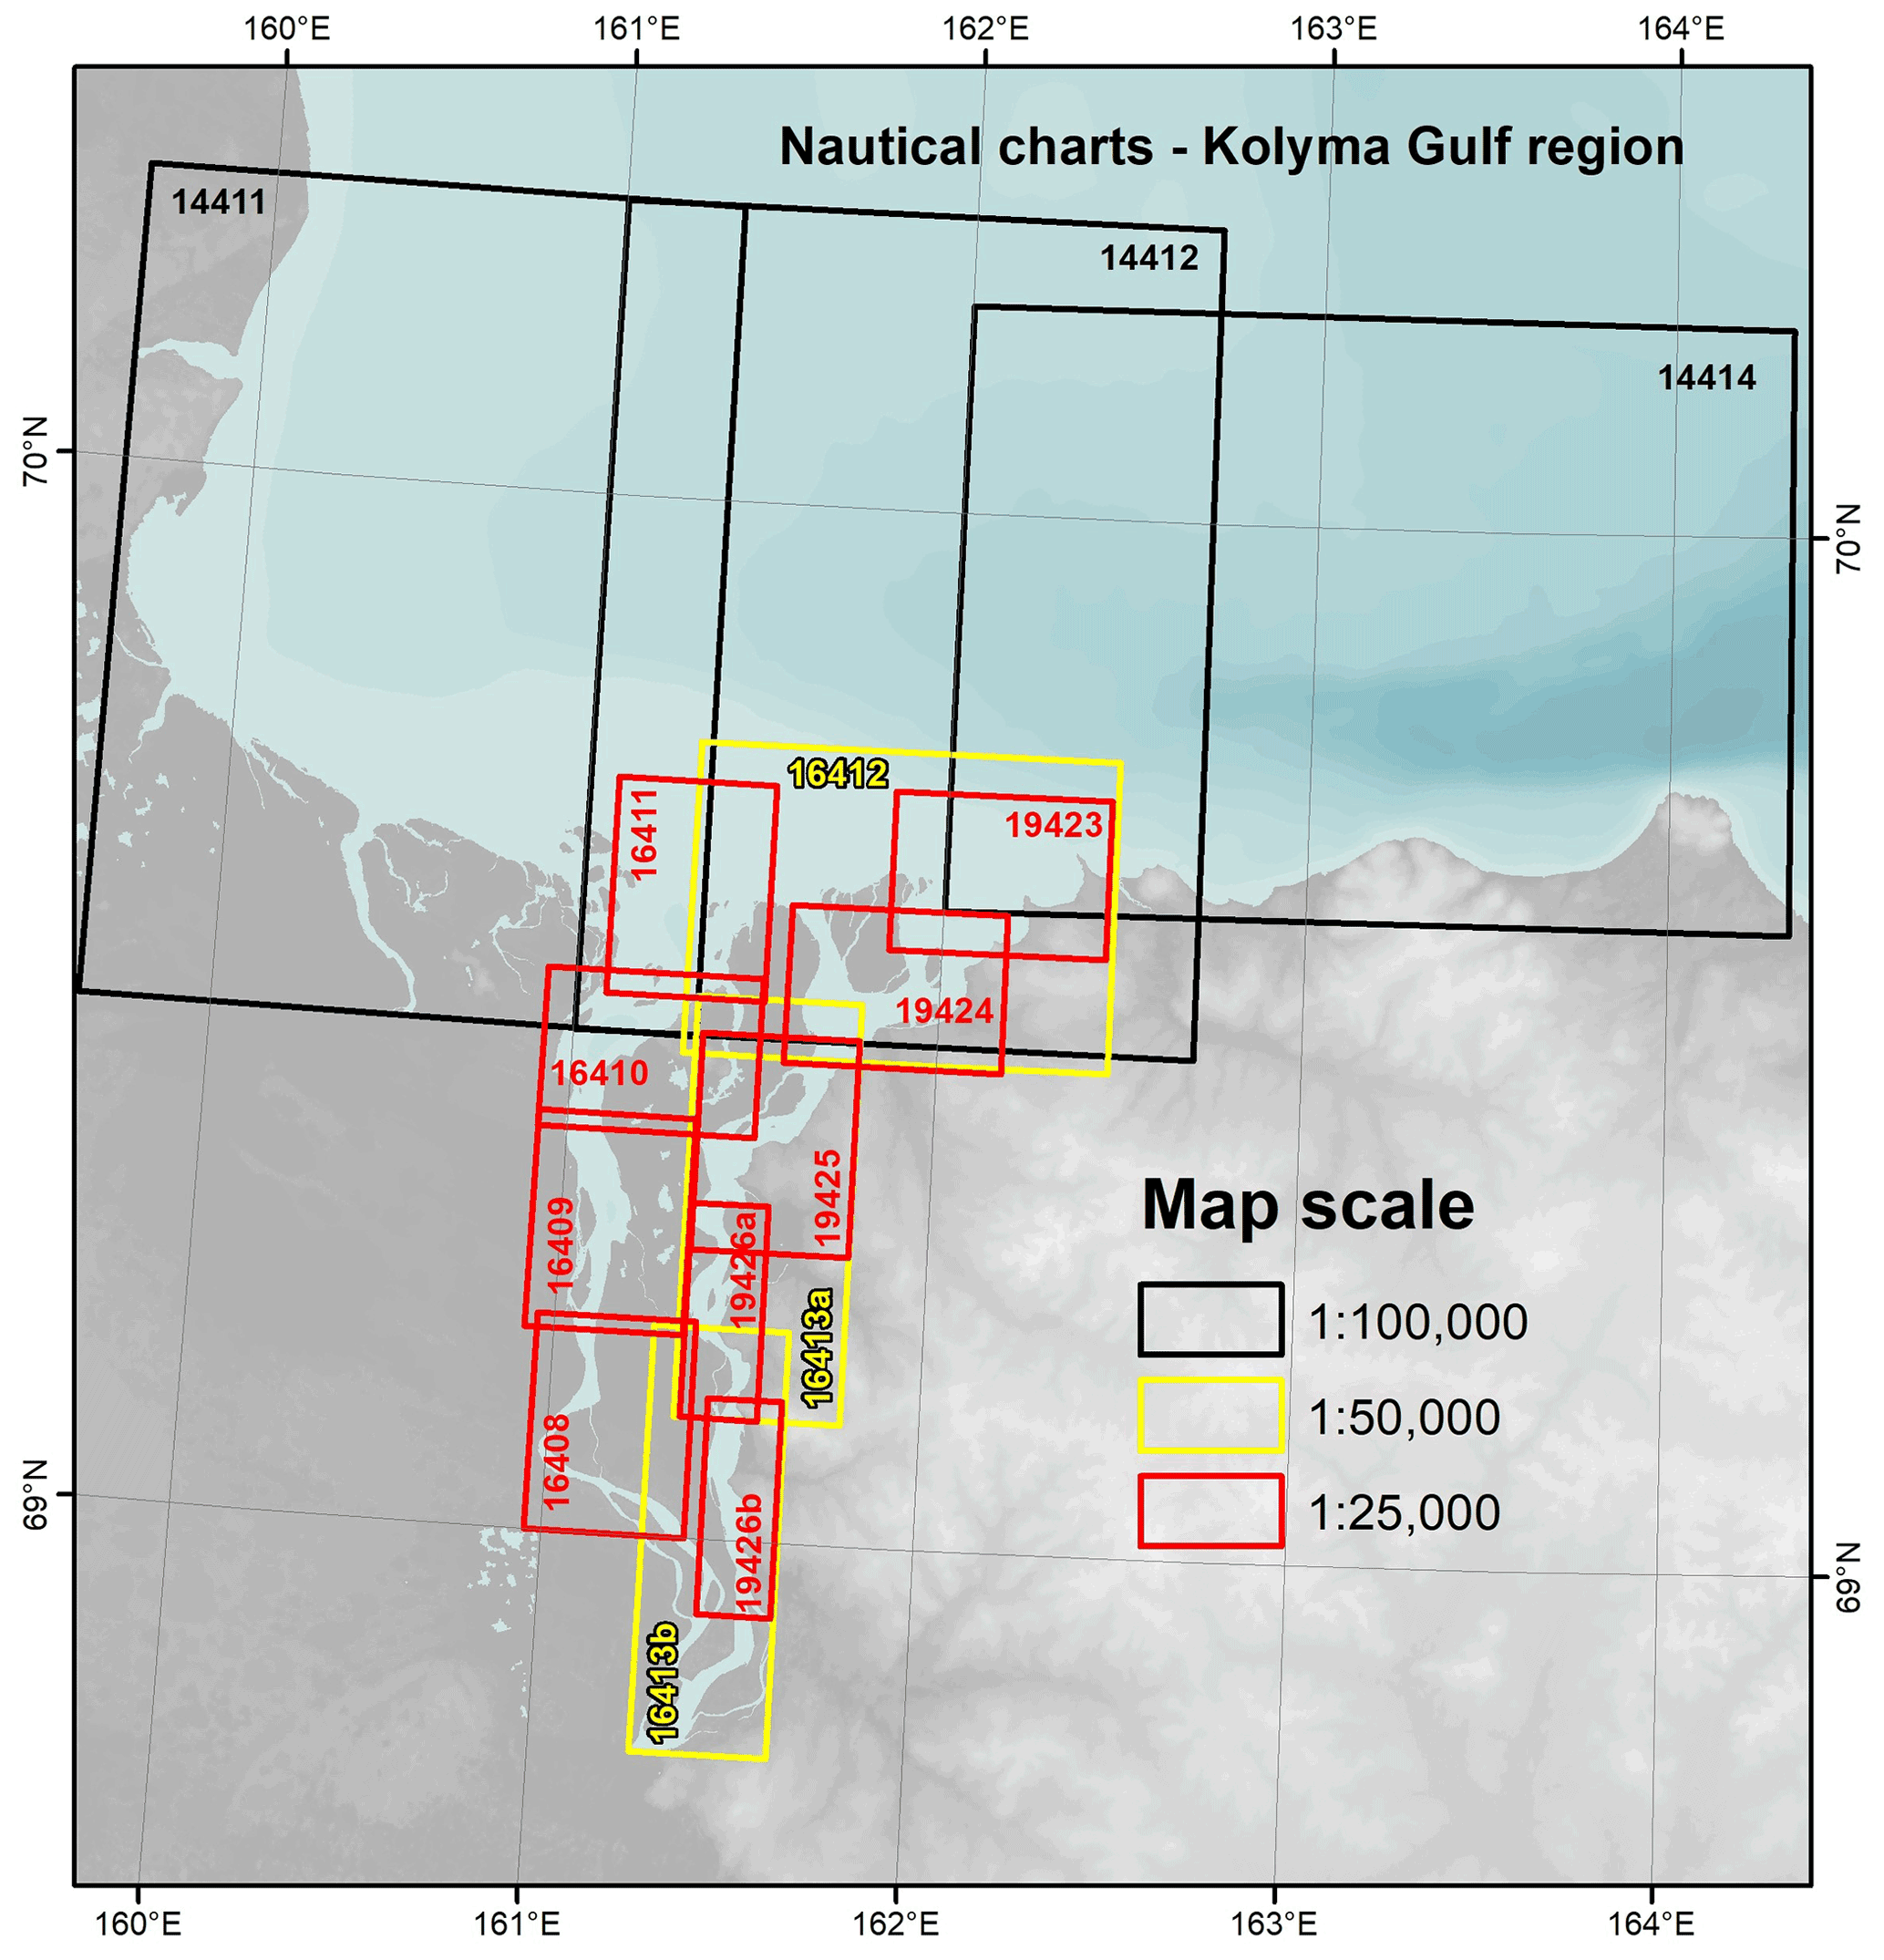
Figure A2Extent and scale of the nautical charts used for the bathymetrical models in the Kolyma Gulf region. Chart numbers are indicated on the map. More details on the charts can be found in Table 2. The background map is the IBCAO v4 data from Jakobsson et al. (2020).
We used the water area to set the boundary for the bathymetry models in the Topo to Raster tool. In order to get an accurate representation of the water area, a normalized difference water index (NDWI) (Gao, 1996) was applied to multispectral Landsat 8 imagery for the Lena Delta region. Band 6 and band 3 from 12 cloud-free Landsat 8 scenes (Table B1) were used to calculate the NDWI. The NDWI (band 6 − band 3÷ band 6 + band 3) resulted in values between −1 and 1. All values larger than 0.05 were identified as water as this allowed sand banks to be separated from water areas.
For the Kolyma Gulf region the global surface water layer by Pekel et al. (2016) was used to delineate the water boundary, with all areas covered by water >90 % of the time considered to be water bodies. We are aware of wind- and tide-driven water level fluctuations, particularly in the river mouth, but the water occurrence data set was only used for delineating the outer boundary (maximum normal water extent) of the Topo to Raster calculations to avoid interpolation outside of measured points or between points where land areas or islands are located.
During the CACOON 2019 expeditions (Fuchs et al., 2021d) in the Lena Delta region, CTD measurements were taken with a handheld SonTekTM CastAway sensor with an integrated GPS. The measured data include pressure (dbar; accuracy: 0.25 %), depth (m; ±0.25 %), temperature (∘C; ±0.05 ∘C), conductivity (mS cm−1; 0.25 % ±5 mS cm−1), specific conductance (mS cm−1; 0.25 % ±5 mS cm−1), salinity (practical salinity scale; ±0.1), sound velocity (m s−1; ±0.15 m s−1), and density (kg m−3; ±0.02 kg m−3). In total, 31 depth profiles were measured from the sea (or river) water surface to the sea (or river) bottom (Table C1).
In the Kolyma Gulf region, CTD measurements were taken using a HYDROLAB HL7 multiparameter probe from small motorboats (Palmtag and Mann, 2021). The following parameters were collected on each cast: specific conductivity (mS cm−1; ±0.5 % of reading +0.001 mS cm−1), turbidity (NTU; ±1 %), barometric pressure (mm Hg; ±1 mm Hg), dissolved oxygen (mg L−1; ±0.2 mg L−1), depth (m; ±0.05 m), water temperature (∘C; ±0.10 ∘C), density (kg m−3; ±0.02 kg m−3), salinity (psu; ±0.1), and chlorophyll-a (µg L−1; ±3 %).
Table C1Location and date of the CTD measurements in the Lena Delta region with the handheld SonTekTM CastAway sensor.
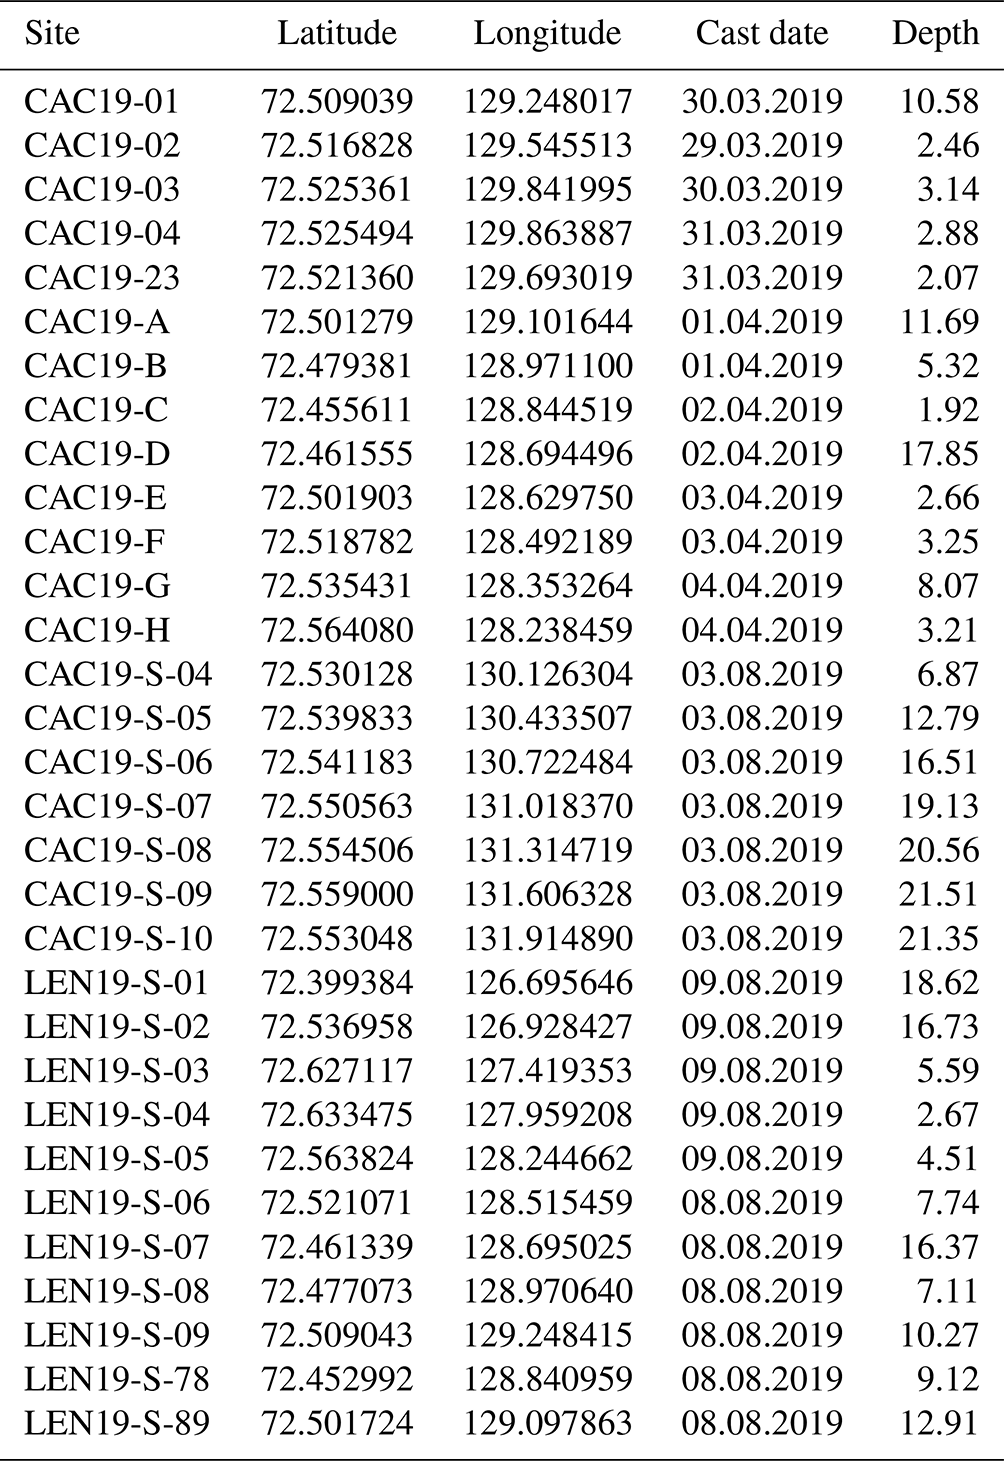
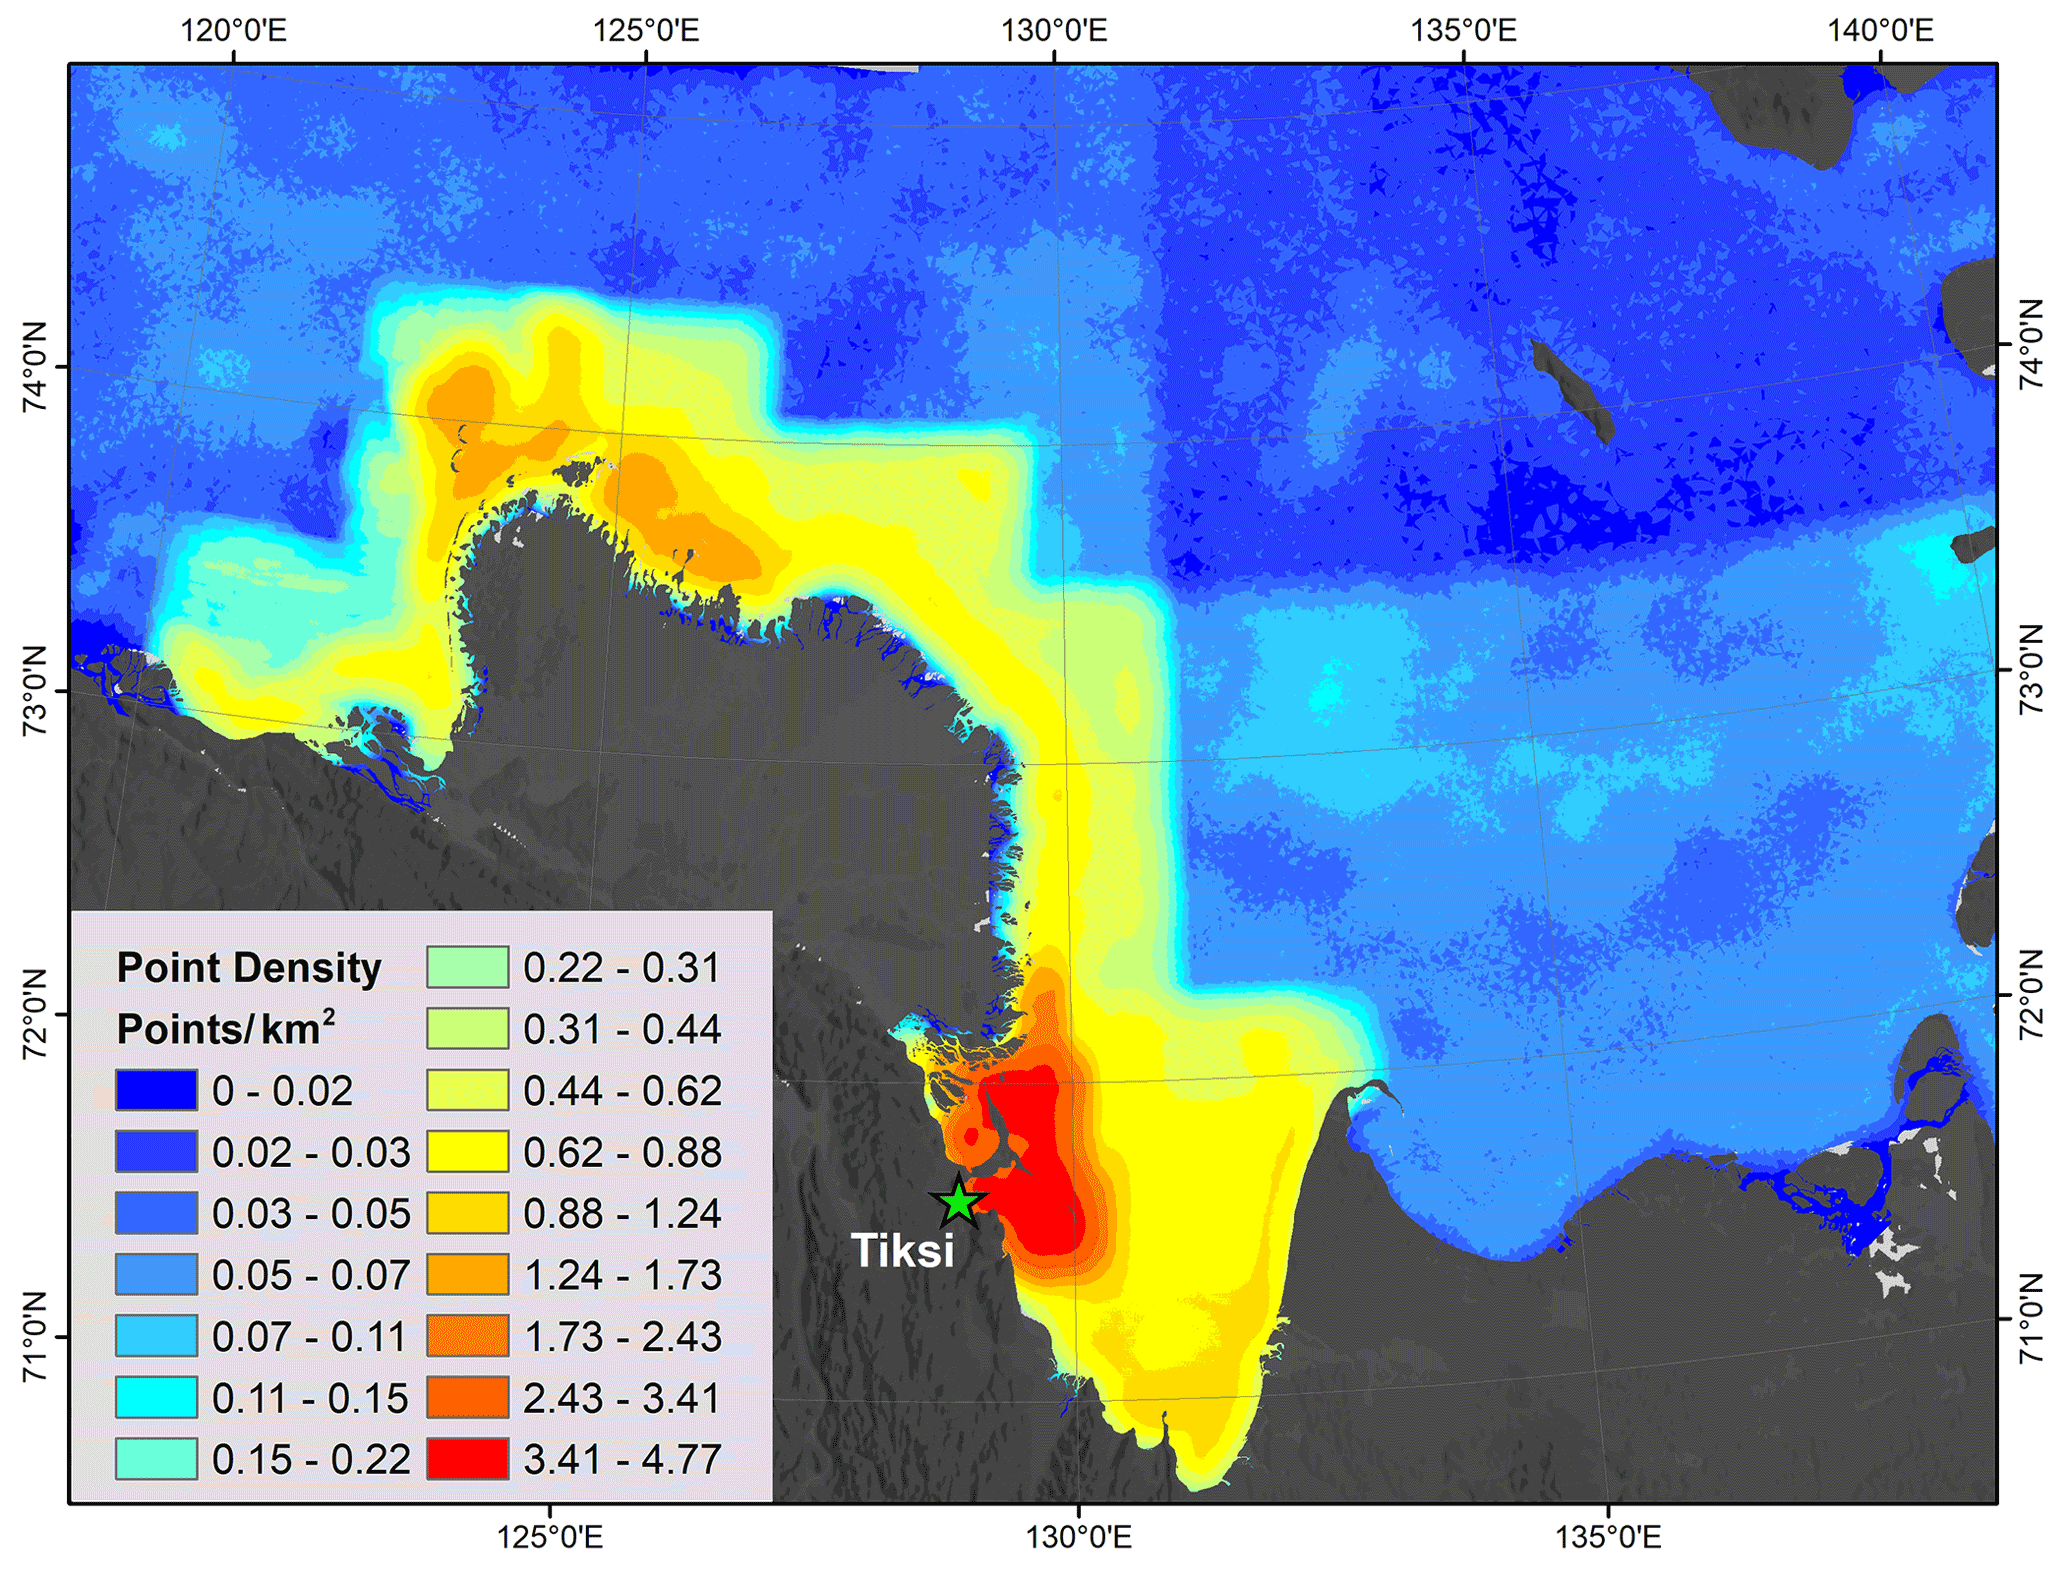
Figure D1Point density for the Lena Delta bathymetrical models (TTR50 + TTR200), indicating the highest point density in the coastal areas around Bykovsky Peninsula. The green star shows the location of the city and harbor of Tiksi.
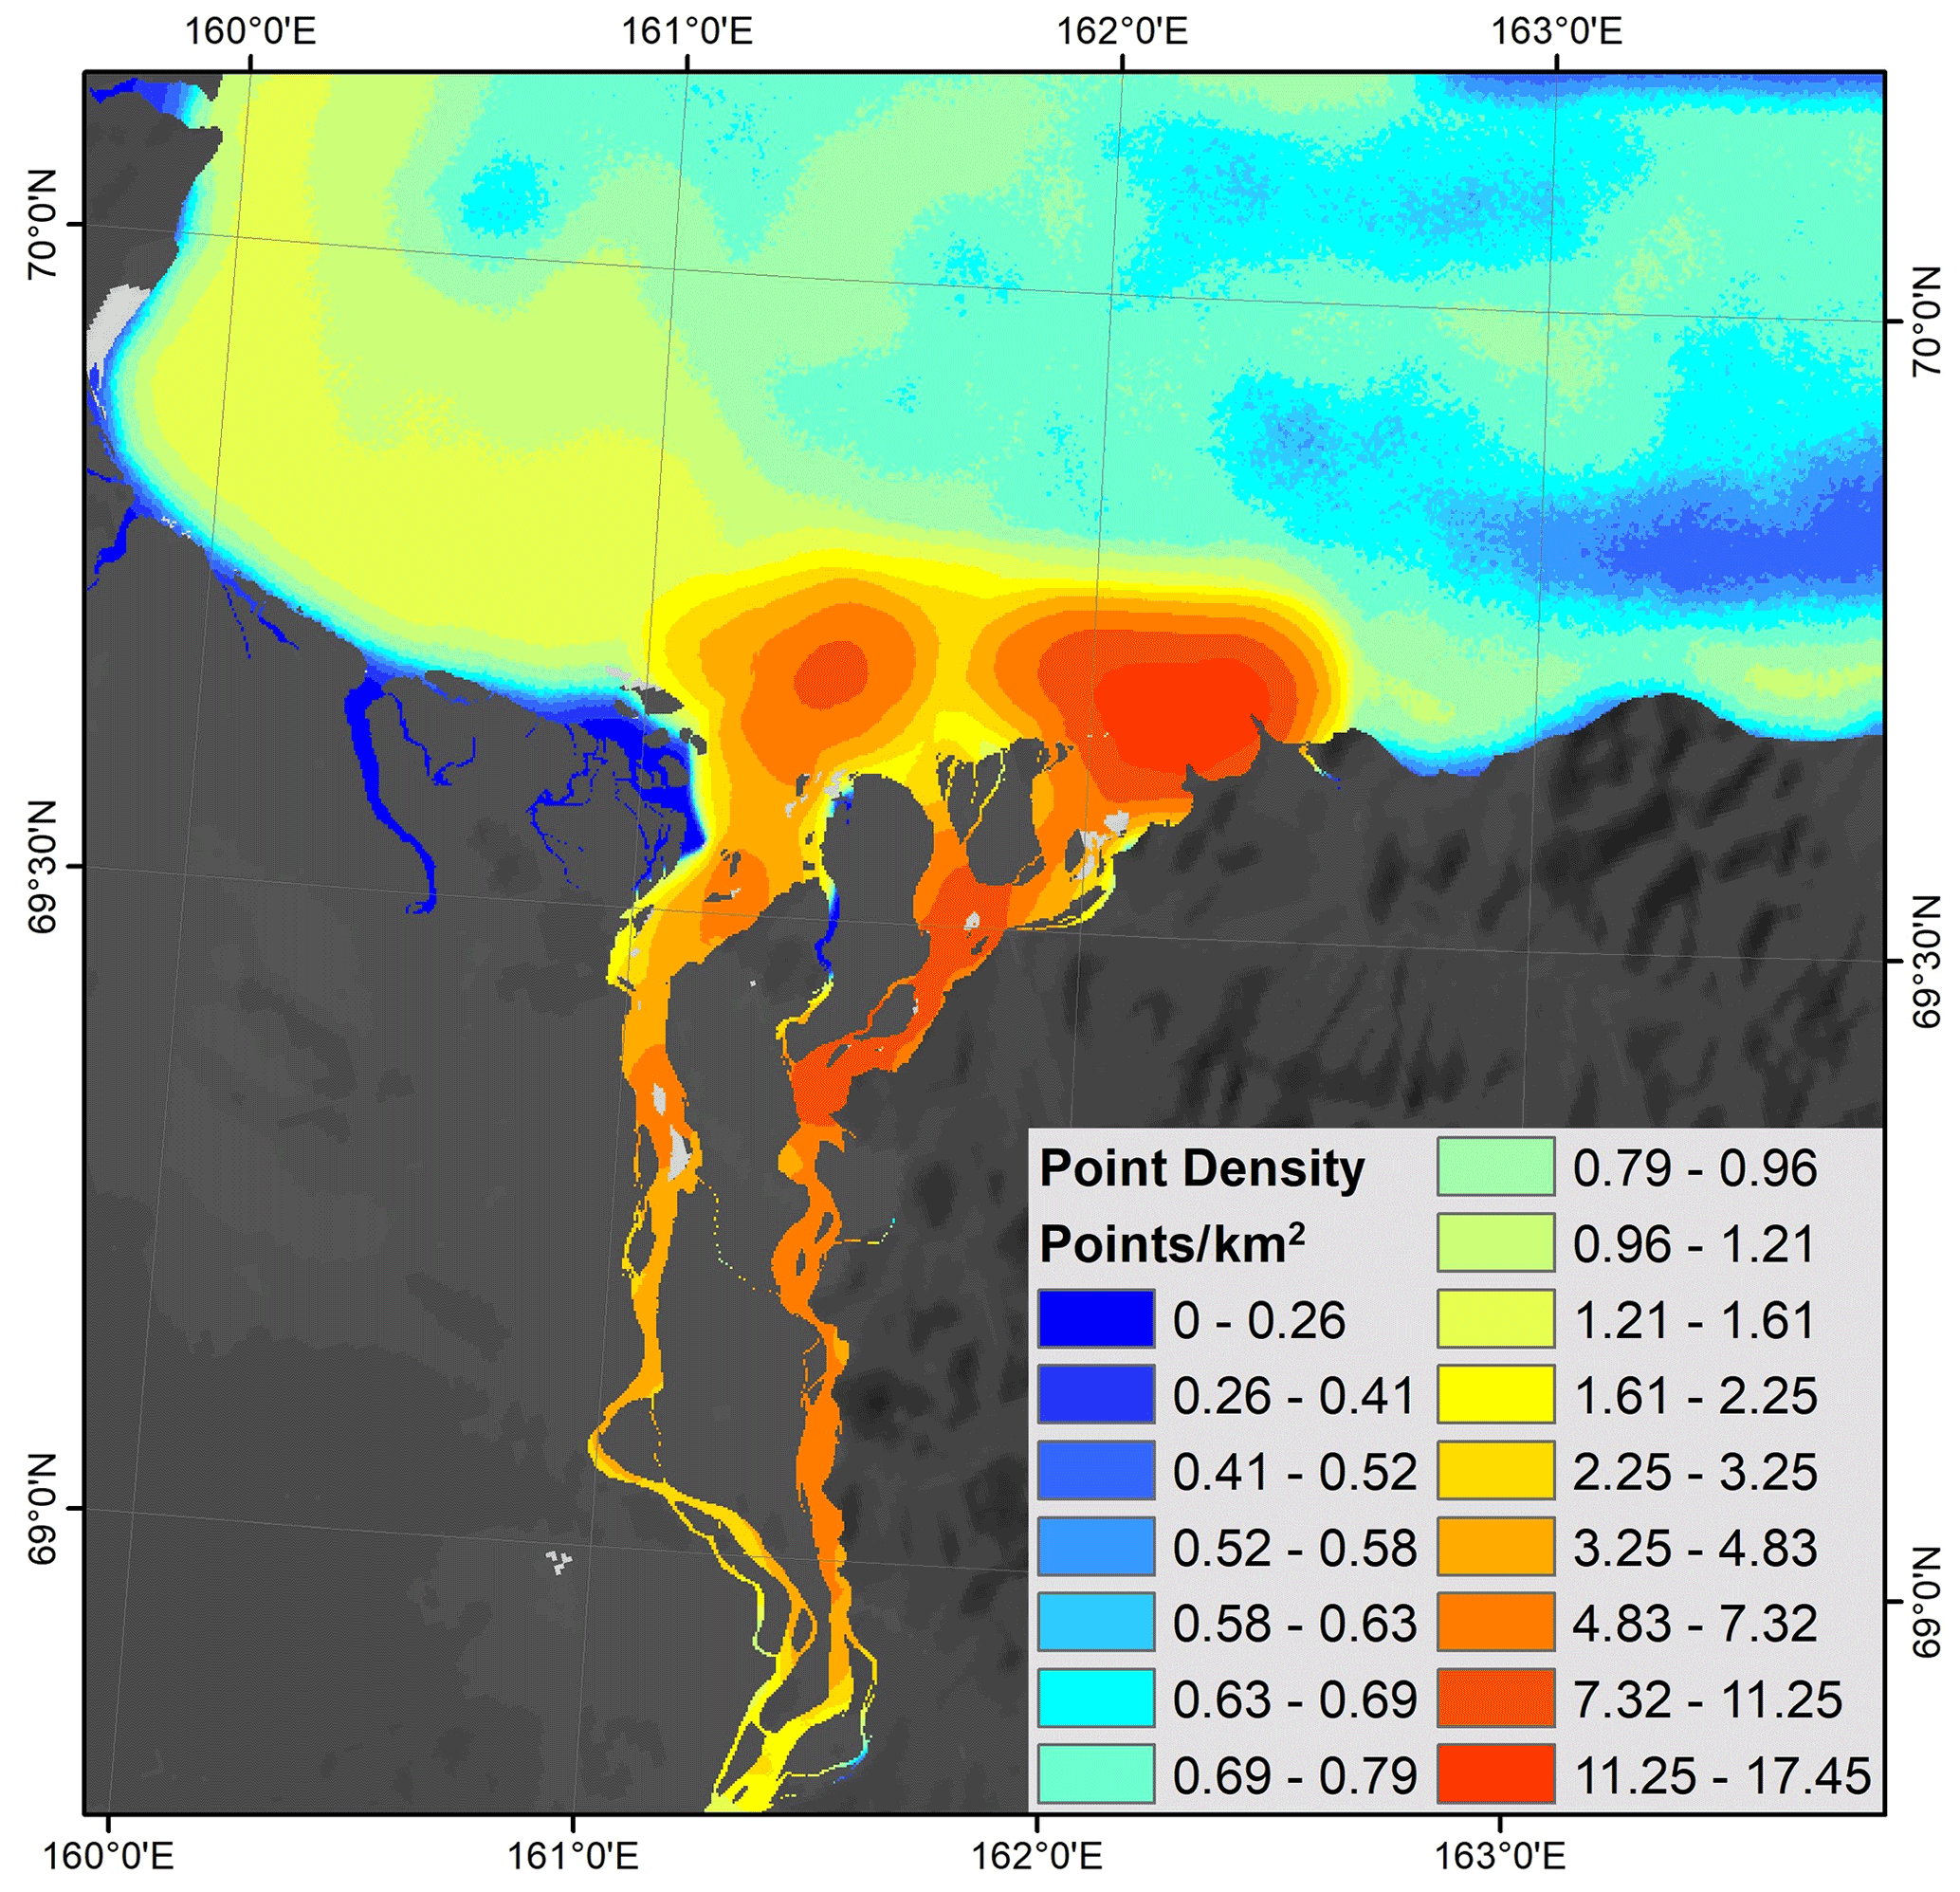
Figure D2Point density for Kolyma Gulf bathymetrical models (TTR50 + TTR200), indicating the higher point density in the Kolyma main channels.
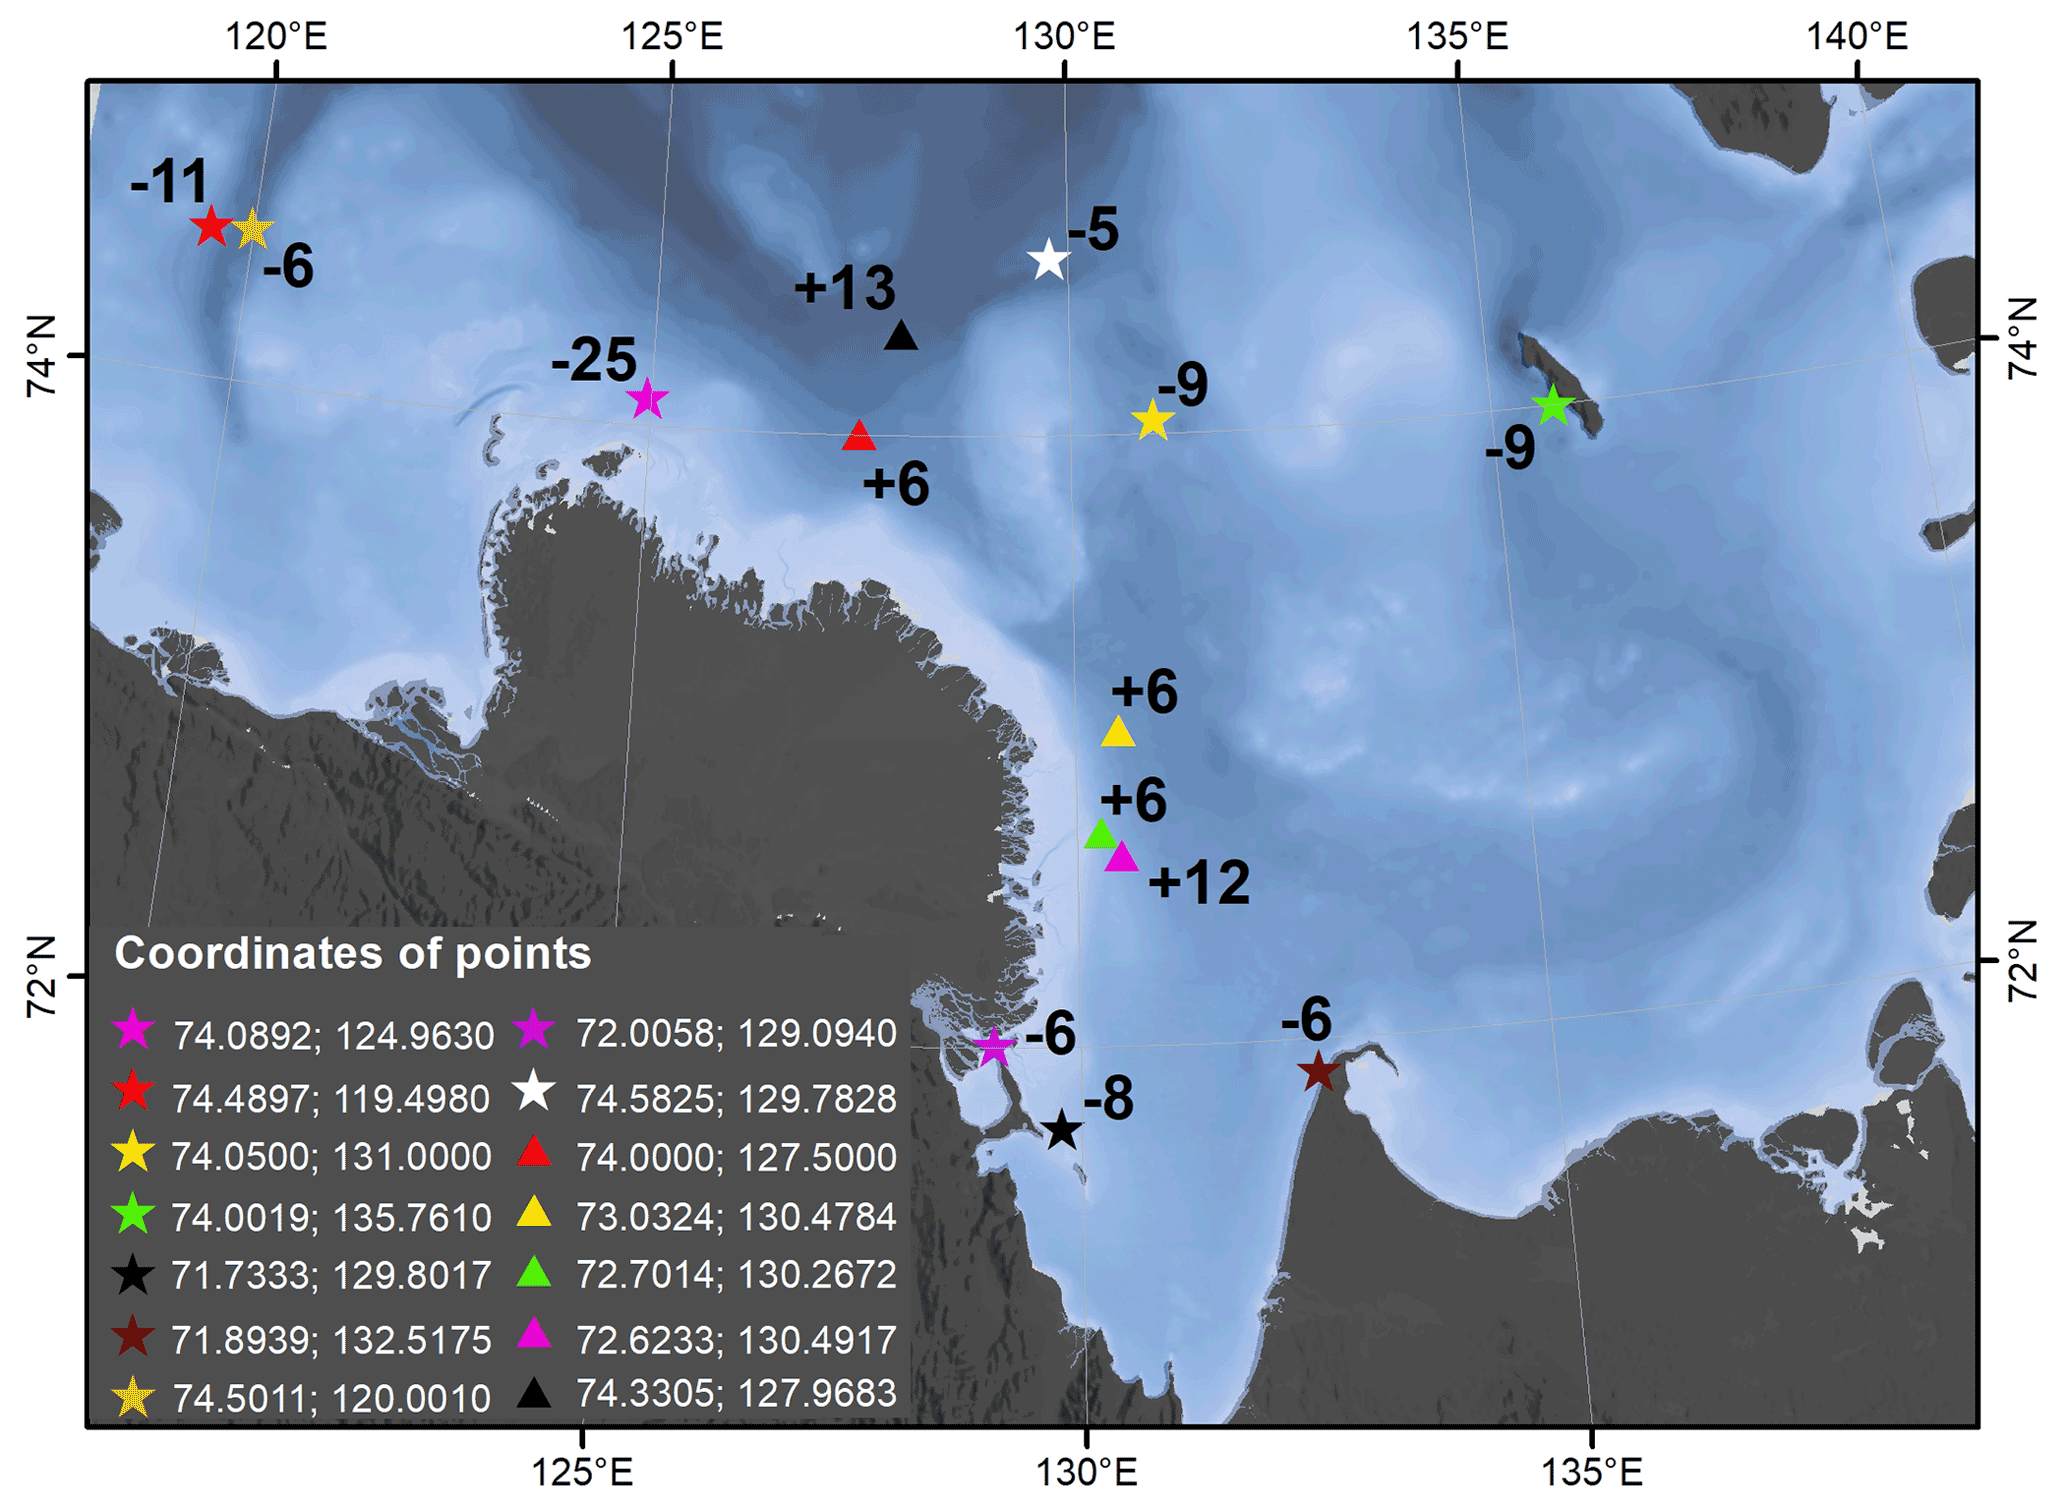
Figure E1Validation points in the Lena Delta region which deviate by more than 4.3 m (difference larger than 2 standard deviations from the mean distance) from the Topo to Raster (50 m) model. Negative values (stars) indicate that the validation point is x m deeper than the depth indicated by the TTR50. Positive values (triangles) indicate that the validation points report a shallower depth by x m compared to the TTR50 model. The coordinates of the points are given in the map legend.
The TTR200 bathymetrical models were compared to the IBCAO v 4 model (Jakobsson et al., 2020). The overall difference between the two data sets was small, with a mean difference of m for the Lena Delta region and m for the Kolyma Gulf region, indicating that the TTR200 bathymetry slightly overestimates the depths compared to the IBCAO v4 bathymetry. However, when splitting the maps into zones with a certain distance from the coast, distinct differences become visible (Fig. F1). In particular, the difference and the spread are large in near-shore zones (0–10 km from the shorelines), whereas the variance of the difference between the two products becomes smaller with larger distance from the coast for the Kolyma Gulf region. For the Lena Delta region, a similar picture can be observed; however, in the areas >30 km away from the coast, the differences between the two products increase again.

Figure F1The difference in the Topo to Raster (TTR200) and IBCAO v4 bathymetry (Jakobsson et al., 2020) shown in relation to distance from the shore in violin plots. The plots are based on the difference (TTR200−IBCAO v4) layers, where negative values indicate that the IBCAO v4 underestimates the depth compared to the TTR200, and positive values indicate an overestimation of the depth by the IBCAO v4 in comparison to the TTR200 bathymetry. The y axis shows the absolute difference between the two bathymetrical products. Black dots show the median value. Areas where the IBCAO v4 bathymetry shows values above mean sea level were excluded from this analysis (see purple areas in Figs. 8 and 9 in the main text). Panel (a) shows plots of the Lena Delta region. The first plot to the left includes the entire Lena Delta region, whereas the other four plots show areas at certain distances from the coast (0–10, 10–20, 20–30, and >30 km away from the shore). Panel (b) shows plots of the Kolyma Gulf region. The first plot to the left includes the entire Kolyma Gulf region, whereas the other plots represent areas with certain distances from the coast (0–10, 10–20, 20–30, and >30 km away from the shore). Please note the different scales of the y axes. The TTR200−IBCAO v4 difference shows that, particularly in the coastal zones and near-shore areas, the IBCAO underestimates the depth by not capturing the small-scale variability. In contrast, the TTR200 bathymetry detects the continuation of the Lena and Kolyma main channels from the river mouth into offshore regions.
MF, JS, GG, and PPO designed the concept of the study. AA, MF, and PPO digitized nautical maps. MF applied the raster calculations in ArcGIS 10.6. MF, JP, OO, TS, NSZ, and JS carried out fieldwork and collected CTD measurements. MB set the requirements for and tested the suitability of the data set. MF, BJ, PPO, GG, JS, PJM, IVF, and NSZ contributed data and ideas. MF wrote the initial draft of the paper. All authors contributed to the writing and editing of the manuscript.
The contact author has declared that neither they nor their co-authors have any competing interests.
It is important to note that this data set is based on historical data, and therefore deviations from the present state might occur. In particular, river channel depths may vary over seasonal timescales. Therefore, this product is an approximation and a best currently available attempt to map coastal zone, river delta, and gulf bathymetry in this understudied yet rapidly changing region. Additional products are needed in the future, particularly from upstream river channels, to determine and map the extent and stability of the shorelines as well as the area of dynamically changing zones (e.g., sandbanks).
Both digital products, the Lena Delta region bathymetry and the Kolyma Gulf region bathymetry, were not designed and tested for navigational purposes and should therefore not be used as navigational guidance. These data sets were established only for scientific purposes and lack the required actuality for navigation and shipping today.
Publisher’s note: Copernicus Publications remains neutral with regard to jurisdictional claims in published maps and institutional affiliations.
This article is part of the special issue “Extreme environment data sets for the three poles”. It is not associated with a conference.
We thank the Hydrobase Tiksi and the Lena Delta Reserve for the support with field logistics during the spring 2019 field campaign, and we are grateful for the support by the Samoylov Research Station for the fieldwork in summer 2019, which took place in the framework of the joint Russian–German expedition Lena 2019. We thank the Cherskiy Northeast Science Station staff for support of the Kolyma fieldwork in summer 2019, and we are grateful for the hospitality of the ship crews from the vessels Anatoliy Zhilinksiy and Merzlotoved. We thank Sofia Antonova for transliterating the maps.
This research has been supported by the Bundesministerium für Bildung und Forschung (grant no. 03F0806A) and the Natural Environment Research Council (grant no. NE/R012806/1) as part of the Changing Arctic Ocean (CAO) CACOON project.
This paper was edited by Min Feng and reviewed by two anonymous referees.
Anand, P. and Kumar, P.: Influence of Bathymetry on the Performance of Regional Scale Model, Defence Sci. J., 68, 104–110, 2018.
Are, F. and Reimnitz, E.: An overview of the Lena River Delta setting. Geology, tectonics, geomorphology, and hydrology, J. Coastal Res., 16, 1083–1093, http://www.jstor.org/stable/4300125 (last access: 17 April 2022), 2000.
Arndt, J. E., Schenke, H. W., Jakobsson, M., Nitsche, F. O., Buys, G., Goleby, B., Rebesco, M., Bohoyo, F., Hong, J., Black, J., Greku, R., Udintsev, G., Barrios, F., Reynoso-Peralta, W., Taisei, M., and Wigley, R.: The International Bathymetric Chart of the Southern Ocean (IBCSO) Version 1.0 – A new bathymetric compilation covering circum-Antarctic waters, Geophys. Res. Lett., 40, 3111–3117, https://doi.org/10.1002/grl.50413, 2013.
Barnhart, K. R., Anderson, R. S., Overeem, I., Wobus, C., Clow, G. D., and Urban, F. E.: Modeling erosion of ice-rich permafrost bluffs along the Alaskan Beaufort Sea coast, J. Geophys. Res.-Earth Surf., 119, 1155–1179, https://doi.org/10.1002/2013JF002845, 2014.
Bauch, D., Dmitrenko, I. A., Wegner, C., Hölemann, J., Kirillov, S. A., Timokhov, L. A., and Kassens, H.: Exchange of Laptev Sea and Arctic Ocean halocline waters in response to atmospheric forcing, J. Geophys. Res.-Oceans, 114, C05008, https://doi.org/10.1029/2008JC005062, 2009.
Bauch, D., Cherniavskaia, E., Novikhin, A., and Kassens, H.: Physical oceanography, nutrients, and δ18O measured on water bottle samples in the Laptev Sea, PANGAEA [data set], https://doi.org/10.1594/PANGAEA.885448, 2018.
Bedington, M., Torres, R., Polimene, L., Wallhead, P., Juhls, B., Palmtag, J., Strauss, J., and Mann, P. J.: Impacts of riverine terrestrial organic matter on the lower trophic levels of an Arctic shelf ecosystem, EGU General Assembly 2021, online, 19–30 Apr 2021, EGU21-12897, https://doi.org/10.5194/egusphere-egu21-12897, 2021.
Biskaborn, B. K., Smith, S. L., Noetzli, J., Matthes, H., Vieira, G., Streletskiy, D. A., Schoeneich, P., Romanovsky, V. E., Lewkowicz, A. G., Abramov, A., Allard, M., Boike, J., Cable, W. L., Christiansen, H. H., Delaloye, R., Diekmann, B., Drozdov, D., Etzelmüller, B., Grosse, G., Guglielmin, M., Thomas Ingeman-Nielsen, T., Ketil Isaksen, K., Ishikawa, M., Johansson, M., Johannsson, H., Joo, A., Kaverin, D., Kholodov, A., Konstantinov, P., Kröger, T., Lambiel, C., Lanckman, J.-P., Luo, D., Malkova, G., Meiklejohn, I., Moskalenko, N., Oliva, M., Phillips, M., Ramos, M., Sannel, A. B. K., Sergeev, D., Seybold, C., Skryabin, P., Vasiliev, A., Wu, Q.,Yoshikawa, K., Zheleznyak, M., and Lantuit, H.: Permafrost is warming at a global scale, Nat. Commun., 10, 264, https://doi.org/10.1038/s41467-018-08240-4, 2019.
Box, J. E., Colgan, W. T., Wouters, B., Burgess, D. O., O`Neel, S., Thomson, L. I., and Mernild, S. H.: Global sea-level contribution from Arctic land ice: 1971–2017, Environ. Res. Lett., 13, 125012, https://doi.org/10.1088/1748-9326/aaf2ed, 2018.
Brown, N. J., Nilsson, J., and Pemberton, P.: Arctic Ocean Freshwater Dynamics: Transient Response to Increasing River Runoff and Precipitation, J. Geophys. Res.-Oceans, 124, 5205–5219, https://doi.org/10.1029/2018JC014923, 2019.
Bussmann, I.: Physical oceanography measured in the Lena Estuary, Sibiria, Russia, in 2010, PANGAEA [data set], https://doi.org/10.1594/PANGAEA.770761, 2013.
Butenschön, M., Clark, J., Aldridge, J. N., Allen, J. I., Artioli, Y., Blackford, J., Bruggeman, J., Cazenave, P., Ciavatta, S., Kay, S., Lessin, G., van Leeuwen, S., van der Molen, J., de Mora, L., Polimene, L., Sailley, S., Stephens, N., and Torres, R.: ERSEM 15.06: a generic model for marine biogeochemistry and the ecosystem dynamics of the lower trophic levels, Geosci. Model Dev., 9, 1293–1339, https://doi.org/10.5194/gmd-9-1293-2016, 2016.
Conlan, K. E., Lenihan, H. S., Kvitek, R. G., and Oliver, J. S.: Ice scour disturbance to benthic communities in the Canadian High Arctic, Mar. Ecol. Prog. Ser., 166, 1–16, https://doi.org/10.3354/meps166001, 1998.
Connolly, C. T., Cardenas, M. B., Burkart, G. A., Spencer, R. G. M., and McClelland, J. W.: Groundwater as a major source of dissolved organic matter to Arctic coastal waters, Nat. Commun. 11, 1479, https://doi.org/10.1038/s41467-020-15250-8, 2020.
Dammann, D. O., Eriksson, L. E. B., Mahoney, A. R., Eicken, H., and Meyer, F. J.: Mapping pan-Arctic landfast sea ice stability using Sentinel-1 interferometry, The Cryosphere, 13, 557–577, https://doi.org/10.5194/tc-13-557-2019, 2019.
Dubinenkov, I., Flerus, R., Kattner, G., and Koch, B. P.: Dissolved organic matter in the Lena Delta and coastal Laptev Sea in 2010, PANGAEA, https://doi.org/10.1594/PANGAEA.842220, 2015.
Fofonova, V., Androsov, A., Danilov, S., Janout, M., Sofina, E. and Wiltshire, K. H., and Overduin, P.: Semidiurnal tides in the Laptev Sea Shelf zone in the summer season, Cont. Shelf Res., 73, 119–132, https://doi.org/10.1016/j.csr.2013.11.010, 2014.
Fofonova, V., Danilov, S., Androsov, A., Janout, M., Bauer, M., Overduin, P., Itkin, P., and Wiltshire, K. H.: Impact of wind and tides on the Lena River freshwater plume dynamics in the summer season, Ocean Dynam., 65, 951–968, https://doi.org/10.1007/s10236-015-0847-5, 2015.
Fuchs, M., Palmtag, P., Juhls, B., Overduin, P. P., Grosse, G., Abdelwahab, A., Bedington, M., Sanders, T., Ogneva, O., Fedorova, I. V., Zimov, N. S., Mann, P. J., and Strauss, J.: High-resolution bathymetry model for the Lena Delta region, PANGAEA [data set], https://doi.org/10.1594/PANGAEA.934045, 2021a.
Fuchs, M., Palmtag, P., Juhls, B., Overduin, P. P., Grosse, G., Abdelwahab, A., Bedington, M., Sanders, T., Ogneva, O., Fedorova, I. V., Zimov, N. S., Mann, P. J., and Strauss, J.: High-resolution bathymetry model for the Kolyma Gulf region, PANGAEA [data set], https://doi.org/10.1594/PANGAEA.934049, 2021b.
Fuchs, M., Palmtag, J., Ogneva, O., Sanders, T., Aksenov, A. O., Polyakov, V. I., and Strauss, J.: Conductivity, temperature and depth (CTD) measurements during the CACOON cruises in 2019, PANGAEA [data set], https://doi.org/10.1594/PANGAEA.933187, 2021c.
Fuchs, M., Ogneva, O., Sanders, T., Schneider, W., Polyakov, V., Becker, O. O., Bolshiyanov, D., Mollenhauer, G., and Strauss, J.: CACOON Sea – water sampling along the Sardakhskaya channel and near shore of the Laptev Sea, in: Reports on Polar and Marine Research, Russian-German Cooperation: Expeditions to Siberia in 2019, edited by: Fuchs, M., Bolshiyanov, D., Grigoriev, M. N., Morgenstern, A., and Dill, A., Bremerhaven, Alfred Wegener Institute, chap. 3.26, 141–149, ISBN 1866–3192, https://doi.org/10.48433/BzPM_0749_2021, 2021d.
Gao, B. C.: NDWI – a normalized difference water index for remote sensing of vegetation liquid water from space, Remote Sens. Environ., 58, 257–266, https://doi.org/10.1016/S0034-4257(96)00067-3, 1996.
Gonçalves-Araujo, R., Stedmon, C. A., Heim, B., Dubinenkov, I., Kraberg, A., Moiseev, D., and Bracher, A.: From fresh to marine waters: characterization and fate of dissolved organic matter in the Lena River Delta region, Siberia, Front. Mar. Sci., 2, 108, https://doi.org/10.3389/fmars.2015.00108, 2015.
Gordeev, V. V.: Fluvial sediment flux to the Arctic Ocean. Geomorphology, 80, 94–104, https://doi.org/10.1016/j.geomorph.2005.09.008, 2006.
Haine, T. W. N., Curry, B., Gerdes, R., Hansen, E., Karcher, M., Lee, C., Rudels, B., Spreen, G., de Steur, L., Stewart, K. D., and Woodgate, R.: Arctic freshwater export: Status, mechanisms, and prospects, Global Planet. Change, 125, 13–35, https://doi.org/10.1016/j.gloplacha.2014.11.013, 2015.
Hölemann, J., Juhls, B., and Timokhov L.: Colored dissolved organic matter (CDOM) measured during cruise TRANSDRIFT-XVII, Laptev Sea, PANGAEA [data set], https://doi.org/10.1594/PANGAEA.924206, 2020.
Holmes, R., Shiklomanov, A. I., Tank, S. E., McClelland, J. W., and Tretiakov, M.: River discharge, Arctic Report Card 2015, https://arctic.noaa.gov/Report-Card/Report-Card-2018/ArtMID/7878/ArticleID/786/River-Discharge (last access: 17 April 2022), 2015.
Hutchinson, M. F.: A new procedure for gridding elevation and stream line data with automatic removal of spurious pits, J. Hydrol., 106, 211–232, https://doi.org/10.1016/0022-1694(89)90073-5, 1989.
Jakobsson, M., Mayer, L. A., Bringensparr, C., Castro, C. F., Mohammad, R., Johnson, P., Ketter, T., Accettella, D., Amblas, D., An, L., Arndt, J. E., Canals, M., Casamor, J. L., Chauché, N., Coakley, B., Danielson, S., Demarte, M., Dickson, M.-L., Dorschel, B., Dowdeswell, J. A., Dreutter, S., Fremand, A. C., Gallant, D., Hall, J. K., Hehemann, L., Hodnesdal, H., Hong, J., Ivaldi, R., Kane, E., Klaucke, I., Krawczyk, D. W., Kristoffersen, Y., Kuipers, B. R., Millan, R., Masetti, G., Morlighem, M., Noormets, R., Prescott, M. M., Rebesco, M., Rignot, E., Semiletov, I., Tate, A. J., Travaglini, P., Velicogna, I., Weatherall, P., Weinrebe, W., Willis, J. K., Wood, M., Zarayskaya, Y., Zhang, T., Zimmermann, M., and Zinglersen, K. B.: The International Bathymetric Chart of the Arctic Ocean Version 4.0, Scientific Data, 7, 176, https://doi.org/10.1038/s41597-020-0520-9, 2020.
Janout, M. A., Hölemann, J. A., Timokhov, L., Gutjahr, O., and Heinemann, G.: Circulation in the northwest Laptev Sea in the eastern Arctic Ocean: Crossroads between Siberian River water, Atlantic water and polynya-formed dense water, J. Geophys. Res. Oceans, 122, 6630–6647, https://doi.org/10.1002/2017JC013159, 2017.
Janout, M. A., Hölemann, J. A., and Timokhov, L.: Physical oceanography from underway CTD measurements during the Transdrift 21-expedition to the Laptev Sea in 2013, PANGAEA [data set], https://doi.org/10.1594/PANGAEA.907934, 2019a.
Janout, M. A., Hölemann, J. A., and Timokhov, L.: Physical oceanography from underway CTD measurements during the Transdrift 22-expedition to the Laptev Sea in 2014, PANGAEA [data set], https://doi.org/10.1594/PANGAEA.907936, 2019b.
Jones, B. M., Irrgang, A. M., Farquharson, L. M., Lantuit, H., Whalen, D., Ogorodov, S., Grigoriev, M., Tweedie, C., Gibbs, A. E., Strzelecki, M. C., Baranskaya, A., Belova, N., Sinitsyn, A., Kroon, A., Maslakov, A., Vieira, G., Grosse, G., Overduin, P., Nitze, I., Maio, C., Overbeck, J., Bendixen, M., Zagórski, P., and Romanovsky, V. E.: Arctic Report Card 2020: Coastal Permafrost Erosion, Arctic Report Card, https://doi.org/10.25923/e47w-dw52, 2020.
Juhls, B., Antonova, S., Angelopoulos, M., Bobrov, N., Grigoriev, M., Langer, M., Maksimov, G., Miesner, F., and Overduin, P. P.: Serpentine (floating) ice channels and their interaction with riverbed permafrost in the Lena River Delta, Russia, Front. Earth Sci., 9, 689941, https://doi.org/10.3389/feart.2021.689941, 2021.
Lauzon, R., Piliouras, A., and Rowland, J. C.: Ice and permafrost effects on delta morphology and channel dynamics, Geophys. Res. Lett., 46, 6574–6582, https://doi.org/10.1029/2019GL082792, 2019.
Lee, J. and Valle-Levinson, A.: Influence of bathymetry on hydrography and circulation at the region between an estuary mouth and the adjacent continental shelf, Cont. Shelf Res., 41, 77–91, https://doi.org/10.1016/j.csr.2012.04.006, 2012.
Mahoney, A., Eicken H., Gaylord, A. G., and Shapiro, L.: Alaska landfast sea ice: Links with bathymetry and atmospheric circulation, J. Geophys. Res., 112, C02001, https://doi.org/10.1029/2006JC003559, 2007.
Mann, P. J, Strauss, J., Palmtag, J., Dowdy, K., Ogneva, O., Fuchs, M., Bedington, M., Torres, R., Polimene, L., Overduin, P., Mollenhauer, G., Grosse, G., Rachold, V., Sobczak, W. V., Spencer, R. G. M., and Juhls, B.: Degrading permafrost river catchments and their impact on Arctic Ocean nearshore processes, Ambio, 51, 439–455, https://doi.org/10.1007/s13280-021-01666-z, 2022.
McClelland, J. W., Déry, S. J., Peterson, B. J., Holmes, R. M., and Wood, E. F.: A pan-arctic evaluation of changes in river discharge during the latter half of the 20th century, Geophys. Res. Lett., 33, L06715, https://doi.org/10.1029/2006GL025753, 2006.
Nghiem, S. V., Hall, D. K., Rigor, I. G., Li, P., and Neumann, G.: Effects of Mackenzie River discharge and bathymetry on sea ice in the Beaufort Sea, Geophys. Res. Lett., 41, 873–879, https://doi.org/10.1002/2013GL058956, 2014.
Nicolsky, D. J., Romanovsky, V. E., Romanovskii, N. N., Kholodov, A. L., Shakhova, N. E., and Semiletov, I. P.: Modeling sub-sea permafrost in the East Siberian Arctic Shelf: The Laptev Sea region, J. Geophys. Res., 117, F03028, https://doi.org/10.1029/2012JF002358, 2012.
Nikanorov, A. M., Bryzgalo, V. A., Kosmenko, L. S., and Reshetnyak, O. S.: The Kolyma River Mouth Area under Present Conditions of Anthropogenic Impact, Russ. Meteorol. Hydrol., 36, 549–558, https://doi.org/10.3103/S1068373911080073, 2011.
Overduin, P. P., Schneider von Deimling, T., Miesner, F., Grigoriev, M. N., Ruppel, C. D., Vasiliev, A., Lantuit, H., Juhls, B., and Westermann, S.: Submarine permafrost map in the Arctic modeled using 1-D transient heat flux (SuPerMAP), J. Geophys. Res.-Oceans, 124, 3490–3507, https://doi.org/10.1029/2018JC014675, 2019.
Palmtag, J. and Mann, P. J.: Kolyma river and near shore CTD measurements throughout the open water season using a HYDROLAB HL7 multiparameter probe, summer 2019, British Oceanographic Data Centre, BODC [data set], National Oceanography Centre, NERC, UK, https://doi.org/10.5285/c10a2798-40cc-7648-e053-6c86abc07c3c, 2021.
Palmtag, J., Strauss, J., Ogneva, O., Aksenov, A., Fuchs, M., and Mann, P. J.: Lena river delta and near shore CTD short time logs under ice using a HYDROLAB HL7 multiparameter probe, spring 2019, British Oceanographic Data Centre BODC [data set], National Oceanography Centre, NERC, UK, https://doi.org/10.5285/c0f9eff8-0efa-1044-e053-6c86abc0ce9f, 2021.
Pearson, S., Lubbad, R., Le, T., and Nairn, R.: Thermomechanical erosion modelling of Baydaratskaya Bay, Russia with COSMOS, in: Scour and Erosion, Proceedings of the 8th International Conference on Scour and Erosion, edited by: Harris, J., Whitehouse, R., and Moxon, S., CRC Press/Balkema, EH Leiden, The Netherlands, p. 281, ISBN 9781138029798, 2016.
Pekel, J.-F., Cottam, A., Gorelick, N., and Belward, A. S.: High-resolution mapping of global surface water and its long-term changes, Nature, 540, 418–422, https://doi.org/10.1038/nature20584, 2016.
Peterson, B. J., Holmes, R. M., McClelland, J. W., Vörösmarty, C. J., Lammers, R. B., Shiklomanov, A. I., Shiklomanov, I. A., and Rahmstorf, S.: Increasing River Discharge to the Arctic Ocean, Science, 298, 2171–2173, https://doi.org/10.1126/science.1077445, 2002.
Pivovarov, S., Hölemann, J. A., Kassens, H., Piepenburg, D., and Schmid, M. K.: Laptev and East Siberian seas, in: The sea, edited by: Robinson, A. R. and Brink, K. H., Cambridge, MA, Harvard University Press, 15, 1111–1137, 2005.
Polimene, L., Torres, R., Powley, H. R., Bedington, M., Juhls, B., Palmtag, J., Strauss, J., and Mann, P. J.: Biological lability of terrigenous DOC increases CO2 outgassing across Arctic shelves, Geophys. Res. Lett., in review, 2022.
Rachold, V., Grigoriev, M. N., Are, F. E., Solomon, S., Reimnitz, E., Kassens, H., and Antonow, M.: Coastal erosion vs riverine sediment discharge in the Arctic Shelf seas, Int. J. Earth Sci., 89, 450–460, https://doi.org/10.1007/s005310000113, 2000.
Rasquin, C., Seiffert, R., Wachler, B., and Winkel, N.: The significance of coastal bathymetry representation for modelling the tidal response to mean sea level rise in the German Bight, Ocean Sci., 16, 31–44, https://doi.org/10.5194/os-16-31-2020, 2020.
Reimnitz, E., Barnes, P. W., Toimil, L. J., and Melchior, J.: Ice gouge recurrence and rates of sediment reworking, Beaufort Sea, Alaska, Geology, 5, 405–408, https://doi.org/10.1130/0091-7613(1977)5<405:IGRARO>2.0.CO;2, 1977.
Rolph, R., Overduin, P. P., Ravens, T., Lantuit, H., and Langer, M.: ArcticBeach v1.0: A physics-based parameterization of pan-Arctic coastline erosion, Geosci. Model Dev. Discuss. [preprint], https://doi.org/10.5194/gmd-2021-28, in review, 2021.
Sanders, T., Fiencke, C., Fuchs, M., Haugk, C., Juhls, B., Mollenhauer, G., Ogneva, O., Overduin, P., Palmtag, J., Povazhniy, V., Strauss, J., Tuerena, R., Zell, N., and Dähnke, K.: Seasonal nitrogen fluxes of the Lena River Delta, Ambio, 51, 423–438, https://doi.org/10.1007/s13280-021-01665-0, 2022.
Shulman, I., Ramp, S. R., Anderson, S., Metzger, E. J., and Sakalaukus, P.: Impact of remote forcing, model resolution and bathymetry on predictions of currents on the shelf, Dynam. Atmos. Oceans, 61–62, 35–45, https://doi.org/10.1016/j.dynatmoce.2013.03.001, 2013.
Sindhu, B., Suresh, I., Unnikrishnan, A. S., Bhatkar, N. V., Neetu, S., and Michael, G. S.: Improved bathymetric datasets for the shallow water regions in the Indian Ocean, J. Earth Sys. Sci., 116, 261–274, https://doi.org/10.1007/s12040-007-0025-3, 2007.
Strauss, J., Ogneva, O., Palmtag, J., and Fuchs, M.: CACOON ice: Spring campaign NERC-BMBF project, Changing Arctic carbon cycle in the coastal ocean near-shore (CACOON), in: Reports on Polar and Marine Research, edited by: Fuchs, M., Bolshiyanov, D., Grigoriev, M. N., Morgenstern, A., and Dill, A., Russian-German Cooperation: Expeditions to Siberia in 2019, Bremerhaven, Alfred Wegener Institute, chap. 2.1, 14–24, ISBN 1866–3192, https://doi.org/10.48433/BzPM_0749_2021, 2021.
Stroeve, J. and Notz, D.: Changing state of Arctic sea ice across all seasons, Environ. Res. Lett., 13, 103001, https://doi.org/10.1088/1748-9326/aade56, 2018.
Tank, S., Striegl, R. G., McClelland, J. M., and Kokelj, S. V.: Multi-decadal increases in dissolved organic carbon and alkalinity flux from the Mackenzie drainage basin to the Arctic Ocea, Environ. Res. Lett., 11, 054015, https://doi.org/10.1088/1748-9326/11/5/054015, 2016.
Timmermanns, M.-L., and Labe, Z.: Arctic Report Card 2020: Sea Surface Temperature, Arctic Report Card 2020, https://doi.org/10.25923/v0fs-m920, 2020.
Transdrift Community Members: Hydrochemistry measured on water bottle samples during POLARSTERN cruise ARK-XIV/1b (Transdrift-V) to the Laptev Sea, Arctic Ocean, PANGAEA, https://doi.org/10.1594/PANGAEA.761724, 2009a.
Transdrift Community Members: Physical oceanography during IVAN KIREYEV cruise Transdrift-I to the Laptev Sea, Arctic Ocean, PANGAEA, https://doi.org/10.1594/PANGAEA.761742, 2009b.
Transdrift Community Members: Physical oceanography during IVAN KIREYEV cruise Transdrift-IX to the Laptev Sea, Arctic Ocean, PANGAEA, https://doi.org/10.1594/PANGAEA.761763, 2009c.
Transdrift Community Members: Physical oceanography during KAPITAN DRANITSYN cruise Transdrift-III to the Laptev Sea, Arctic Ocean, PANGAEA, https://doi.org/10.1594/PANGAEA.761750, 2009d.
Transdrift Community Members: Physical oceanography during PROFESSOR MULTANOVSIY cruise Transdrift-II to the Laptev Sea, Arctic Ocean, PANGAEA, https://doi.org/10.1594/PANGAEA.761745, 2009e.
Transdrift Community Members: Physical oceanography during Transdrift-VI to the Laptev Sea, Arctic Ocean, PANGAEA, https://doi.org/10.1594/PANGAEA.761754, 2009f.
Transdrift Community Members: Physical oceanography during YAKOV SMIRNITSKIY cruise Transdrift-VII to the Laptev Sea, Arctic Ocean, PANGAEA, https://doi.org/10.1594/PANGAEA.761756, 2009g.
Transdrift Community Members: Physical oceanography during YAKOV SMIRNITSKIY cruise Transdrift-VIII to the Laptev Sea, Arctic Ocean, PANGAEA, https://doi.org/10.1594/PANGAEA.761760, 2009h.
Transdrift Community Members: Physical oceanography near the Lena Nordenskøld station in the Laptev Sea, Arctic Ocean, PANGAEA, https://doi.org/10.1594/PANGAEA.761752, 2009i.
Vermaire, J. C., Pisaric, M. F. J., Thienpont, J. R., Courtney Mustaphi, C. J., Kokelj, S. V., and Smol, J. P.: Arctic climate warming and sea ice declines lead to increased storm surge activity, Geophys. Res. Lett., 40, 1386–1390, https://doi.org/10.1002/grl.50191, 2013.
Wagner, D., Overduin, P. P., Grigoriev, M. N., Knoblauch, C., and Bolshiyanov, D. Y.: Russian-German cooperation System Laptev Sea: The expedition LENA 2008, Reports on Polar and Marine Research, Alfred Wegener Institute for Polar and Marine Research, Bremerhaven, 642, ISSN 1866–3192, 2012.
Wetterich, S., Overduin, P. P., and Grigoriev, M. (eds.): Russian-German Cooperation SYSTEM LAPTEV SEA: The expedition Eastern Laptev Sea – Buor Khaya Peninsula 2010, Rep. Polar Mar. Res., Alfred Wegener Institute for Polar and Marine Research, Bremerhaven, 629, ISSN 1866–3192, 2011.
Wild, B., Andersson, A., Bröder, L., Vonk, J., Hugelius, G., McClelland, J. W., Song, W., Raymond, P. A., and Gustafsson, Ö.: Rivers across the Siberian Arctic unearth the patterns of carbon release from thawing permafrost, Proc. Natl. Acad. Sci. USA, 116, 10280, https://doi.org/10.1073/pnas.1811797116, 2019.
Ye, F., Zhang, Y. J., Wang, H. V., Friedrichs, M. A. M., Irby, I. D., Alteljevich, E., Valle-Levinson, A., Wang, Z., Huang, H., Shen, J., and Du, J.: A 3D unstructured-grid model for Chesapeake Bay: Importance of bathymetry, Ocean Model., 127, 16–39, https://doi.org/10.1016/j.ocemod.2018.05.002, 2018.
- Abstract
- Introduction
- Material and methods
- Bathymetrical models of the Lena and Kolyma near-shore zone
- Validation, comparison, and limitations
- Data availability
- Conclusions
- Appendix A: Extent of nautical charts
- Appendix B: Water area delineation
- Appendix C: CTD specifications
- Appendix D: Point cloud density maps
- Appendix E: Validation points deviating from the Topo to Raster model
- Appendix F: Topo to Raster and IBCAO v4 comparisons
- Author contributions
- Competing interests
- Disclaimer
- Special issue statement
- Acknowledgements
- Financial support
- Review statement
- References