the Creative Commons Attribution 4.0 License.
the Creative Commons Attribution 4.0 License.
 | 06 May 2022
HomogWS-se: a century-long homogenized dataset of near-surface wind speed observations since 1925 rescued in Sweden
Cesar Azorin-Molina
Erik Engström
Lorenzo Minola
Lennart Wern
Sverker Hellström
Jessika Lönn
Creating a century-long homogenized near-surface wind speed observation dataset is essential to improve our current knowledge about the uncertainty and causes of wind speed stilling and recovery. Here, we rescued paper-based records of wind speed measurements dating back to the 1920s at 13 stations in Sweden and established a four-step homogenization procedure to generate the first 10-member centennial homogenized wind speed dataset (HomogWS-se) for community use. Results show that about 38 % of the detected change points were confirmed by the known metadata events, and the average segment length split by the change points is ∼11.3 years. Compared with the raw wind speed series, the homogenized series is more continuous and lacks significant non-climatic jumps. The homogenized series presents an initial wind speed stilling and subsequent recovery until the 1990s, whereas the raw series fluctuates with no clear trend before the 1970s. The homogenized series shows a 25 % reduction in the wind speed stilling during 1990–2005 than the raw series, and this reduction is significant when considering the homogenization uncertainty. The homogenized wind speed series exhibits a significantly stronger correlation with the North Atlantic oscillation index than that of the raw series (0.54 vs. 0.29). These results highlight the importance of the century-long homogenized series in increasing our ability to detect and attribute multidecadal variability and changes in wind speed. The proposed homogenization procedure enables other countries or regions to rescue their early climate data and jointly build global long-term high-quality datasets. HomogWS-se is publicly available from the Zenodo repository at https://doi.org/10.5281/zenodo.5850264 (Zhou et al., 2022).
- Article
(9545 KB) - Full-text XML
- BibTeX
- EndNote


Near-surface wind speed (WS) change and variability have significant impacts on climate, environment, and human society. For example, WS alters the hydrological cycle by its effects on evaporation and precipitation (Roderick et al., 2007; McVicar et al., 2012), WS erodes soil by removing topsoil (Zhang et al., 2019), WS impacts local air quality by affecting atmospheric aerosol dispersion (Wang et al., 2018), WS regulates winter cold outbreaks by affecting horizontal air mass advection (Zhou et al., 2021a), and WS affects ecosystems by its influence on plant phenology (Wu et al., 2021). Meanwhile, an increasing threat from global warming has made our society more concerned with the usage of clean and renewable energy, such as wind energy, as a means of mitigating global changes (Saidur et al., 2010). As a result, studies on the detection, attribution, and impact of WS changes and variability have proliferated in recent decades.
As revealed by many previous studies (Roderick et al., 2007; Vautard et al., 2010; McVicar et al., 2012; Minola et al., 2016; Laapas and Venäläinen, 2017; Azorin-Molina et al., 2018; Zeng et al., 2019; Zhang and Wang, 2020), WS decreased from the 1970s to 2010s and subsequently recovered over many terrestrial regions of the Northern Hemisphere – this is known as the WS stilling and recovery. Possible causes of the WS stilling and recovery have been widely discussed and include changes in surface roughness induced by greenness and land use/cover change (Vautard et al., 2010; Wu et al., 2018b; Zhang and Wang, 2021) and large-scale atmospheric circulation changes (Azorin-Molina et al., 2018; Wu et al., 2018a; Zeng et al., 2019), such as the North Atlantic Oscillation (NAO) as revealed in Sweden by Minola et al. (2016, 2022). However, all of the studies relied on available WS series starting in the 1950s or 1960s when the World Meteorological Organization (WMO) began to guide automatic weather monitoring in 1950 (WMO, 2018).
The short duration of the available WS series typically does not cover a full cycle of multidecadal atmospheric modes with a periodicity of 60–80 years, such as NAO (Hurrell et al., 2003; Zhou and Wang, 2016). Consequently, the detection and attribution of the WS change remain subject to significant uncertainty and controversy, especially in the presence of strong internal climate variability. The Sixth Assessment Report released recently by the Intergovernmental Panel on Climate Change (IPCC AR6) clearly stated that the “low to medium” confidence in historical WS change and its causes is primarily due to the short duration and inhomogeneity of the observed WS series (IPCC, 2021).
Improving our knowledge of historical WS change and variability requires us to rescue early (pre-1960s) WS measurements recorded in meteorological notebooks. Since the 19th century, direct WS measurements have been taken at some stations in Sweden, and the mechanical cup anemometer became popular at airports and coastal stations during the 1950s. After 1996, a network of 130 automatic stations was established with the ultrasonic 2D anemometer (Wern and Bärring, 2009; Minola et al., 2016). The anemometers have shown marked technical changes over time; moreover, many observatories have been relocated, or their surrounding environment has significantly evolved or changed (Engström et al., 2022). These changes could cause artificial discontinuities in the observed WS series, which must be removed prior to the use of WS series in climate studies.
Early measurement records of meteorological variables are usually managed by the climate department of the National Meteorological Services. The main reasons for the lack of data rescue are insufficient manpower and lack of funding. Funding from the Swedish Research Council for Sustainable Development (FORMAS) for a joint project “Assessing centennial wind speed variability from a historical weather data rescue project in Sweden” (WINDGUST) among the Swedish Meteorological and Hydrological Institute (SMHI), the University of Gothenburg, and the Spanish National Research Council presents a great opportunity to rescue and homogenize the early paper-based WS data in Sweden held by SMHI according to the WMO guidelines (WMO, 2016).
To create a century-long homogenized WS dataset (HomogWS-se) using observations rescued from 13 stations in Sweden, we first compile all the raw WS series and assess potential reference series for the subsequent homogenization, as described in Sect. 2.1–2.2. The 10-member reanalysis ensembles of the reference series were then used for the first time to investigate the impact of reference series uncertainty in the homogenized WS series. In Sect. 2.3, we describe a four-step homogenization procedure to detect and adjust series discontinuities with the help of the reference series. In Sect. 3.1–3.2, the detected change points are analyzed and validated with available metadata, and the discontinuity adjustments are described with two examples. The impact of the homogenization on the multidecadal trend and its uncertainty is analyzed in Sect. 3.3. The publicly available 10-member HomogWS-se dataset is introduced in Sect. 4, and the study is summarized in Section 5. The derived HomogSW-se dataset provides a 10-member centennial homogenized WS series since the 1920s across Sweden, which will advance our understanding of the WS stilling and recovery pattern (and its uncertainty) that has previously been restricted to the second half of the 20th century. The new dataset will additionally help to attribute the multidecadal WS variations to internal climate variabilities. Finally, it will also allow us to assess climate reanalysis and to better constrain climate model projections of WS and wind energy potential in the future.
2.1 Rescued wind speed series
Sweden shows an overall topographic feature of being low in the southeast with hills and coastlines and high in the northwest with Scandinavian mountains (Fig. 1). Sweden consists of three main climatic zones: a mild oceanic climate in the south, a humid continental climate in the middle, and a cold sub-Arctic climate in the north (Chen and Chen, 2013). Early measurements of wind speed and direction in Sweden prior to the 1950–1960s were previously recorded only in paper journals held by SMHI, which are not accessible for researchers and stakeholders but hold information about early WS change and variability. Since that period, the popularization and use of automatic observation instruments heralded a change to digital storage of WS and other meteorological variables. To allow the community to easily access these century-long series, following the WMO guidelines, the first work package of the WINDGUST project utilized a dedicated scanner and digitization method to rescue the early paper-based measurements of wind speed and direction at the 13 stations in Sweden (Fig. 1). Initial quality controls including the identification of outliers and erroneous data points have been conducted by SMHI (Engström et al., 2022).

Figure 1Map of the 13 stations (red points), with century-long rescued wind speed series and nine pressure triangles (blue lines) used to calculate the geowind data since 1925. Other weather stations in Sweden, installed to measure routine meteorological variables since 1956–1978s, are shown as grey points. Shading is the topography (in meters) from the global 30 arcsec elevation dataset (GTOPO30).
The rescued raw hourly WS series were averaged into daily values and then monthly values. To reduce sampling artifacts and include as much data as possible, months having fewer than 10 daily observations per month were excluded in the study, and this applied to 0.3 % of the months. Note that if this threshold increases to 25 d per month, it will remove only 1 % of the months. Finally, a total of more than 10 000 months from 1925 to the present (i.e., 2021) at the 13 stations were used. Different stations own different durations of available data. The monthly values were converted into monthly anomalies relative to the mean of the entire data period.
2.2 Reference series assessment
It is crucial to find a reliable reference series for detecting and adjusting discontinuities in the long-term time series of climate variables. The main reason for this is that a good reference series can effectively remove most of the background climate variations from the raw time series, before subsequent homogenization. This enhances the non-climatic signal, enabling statistical detection and reasonable removal of artificial change points contained in the raw time series. A good reference series should be homogeneous and able to describe the real background climate variations in the time series. Therefore, we aimed to find the best possible reference series for WS in this study by examining and comparing the homogeneity and correlation (with the candidate series) of various potential reference datasets. Based on the previous related experience in monthly series homogenization (Minola et al., 2016; Azorin-Molina et al., 2019; Gillespie et al., 2021; Zhou et al., 2021b), the geostrophic wind speed data (geowind) and three current climate reanalyses were selected into the potential pool of reference series for the century-long series homogenization. Nearby station series were not chosen as reference series in this study because of the sparse distribution of weather stations prior to the 1960s (Fig. 1).
Geowind was calculated based on surface air pressure, air temperature, and latitude information triangles formed by three weather stations (Fig. 1). Geowind data are available from 1900 on triangles 1–2 and from 1940 on triangles 3–9. Geowind was considered homogenous (Wern and Bärring, 2011) and has been used as a reference series to homogenize the WS series from automatic measurements since the 1960s in Sweden (Minola et al., 2016).
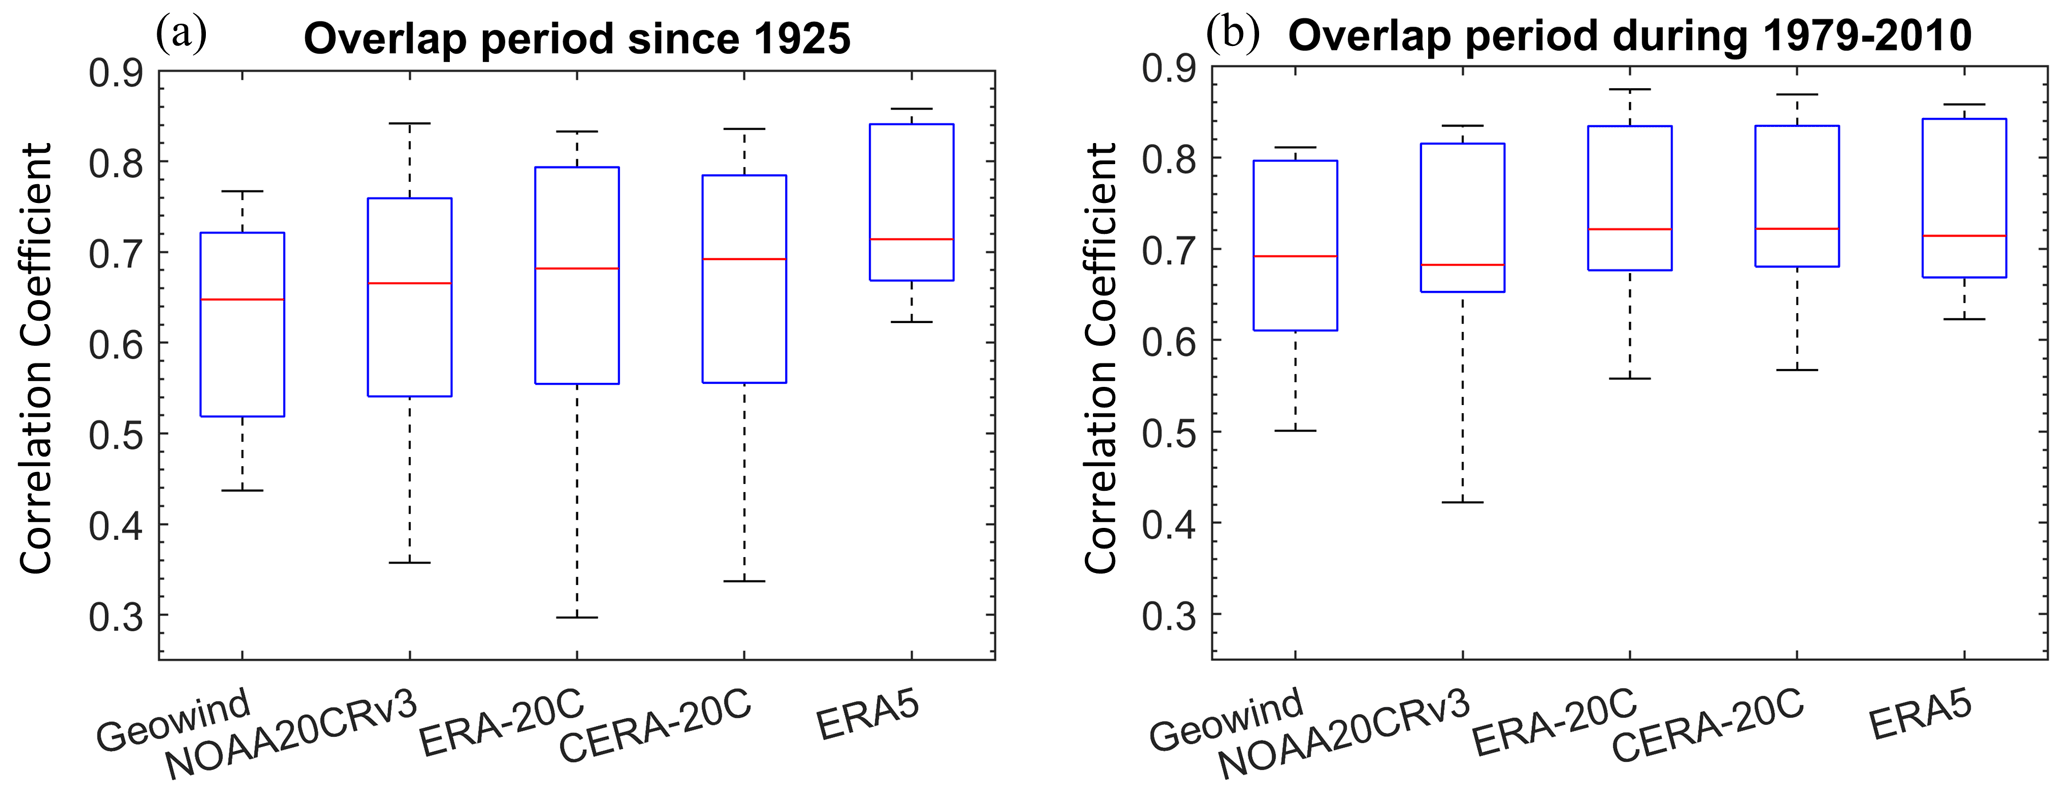
Figure 2Box plot for correlation coefficients of monthly wind speed anomaly series between the rescued data at the 13 stations and the geowind or reanalysis data at the collocated grids (a) during the paired overlap periods since 1925 and (b) during the all-datasets overlap period, 1979–2010.
Three climate reanalysis products were considered as potential reference series: NOAA-20CRv3 (the Twentieth Century Reanalysis version 3 from National Oceanic and Atmospheric Administration) (Slivinski et al., 2019), ERA-20C (the 20th Century Reanalysis from the European Centre for Medium-Range Weather Forecasts, ECMWF) (Poli et al., 2016), and CERA-20C (ECMWF Coupled Ocean-Atmosphere Reanalysis of the 20th Century) (Laloyaux et al., 2018). This choice is based on their performance documented by prior studies (Zhou et al., 2018; Gillespie et al., 2021) and their characteristics of long-term data availability, potential physical homogeneity, statistical homogeneity, and ability to capture the background climate variations (see below). NOAA-20CRv3, ERA-20C, and CERA-20C are available for the periods of 1836–2015, 1900–2010, and 1901–2010, respectively. The three reanalysis products focus on the representation of low-frequency climate variability and assimilate only surface pressure from ISPD (the International Surface Pressure Databank) and ICOADS (International Comprehensive Ocean-Atmosphere Data Set) datasets and surface marine winds from ICOADS (Zhou et al., 2018). Thus, the WS series from the three reanalysis products should be homogeneous (in theory) since they did not assimilate the WS measurements over land.
The reanalysis data of 3-hourly zonal and meridional wind components were downloaded to calculate 3-hourly WS values and then integrate into monthly anomalies. Following Zhou et al. (2021b), we also assessed homogeneities of the reference series by applying the penalized maximal F (PMF) test (Wang, 2008) at a significance level of 0.05 to the WS series at each grid box collocated with the 13 stations in Sweden. This process revealed no detectable change points, further validating their homogeneities and suitability as reference series for WS at these Swedish stations. Furthermore, we examined the correlations of monthly WS anomalies between the rescued dataset and the four potential reference series datasets and found that CERA-20C best reflects the background climate variations (median correlation coefficient 0.72) (Fig. 2). The same procedure was applied to ERA5 from 1979 to 2021 (ECMWF's Reanalysis version 5) (Hersbach et al., 2020). Even though ERA5 assimilates most of the routine observations, it also does not assimilate the WS measurements over land (Hersbach et al., 2020). No change point was detected in the ERA5 WS series at those grids, and the median correlation is 0.71 (Fig. 2). Therefore, ERA5 can be used to extend the reference series to 2021, by using linear regression between the series during their mutual overlap period to eliminate their systematic biases. In summary, CERA-20C during 1925–2010 with an extension from ERA5 during 2011–2021 was chosen to construct the monthly difference series, which removes most of the background climate variations in the rescued WS series during the subsequent homogenization.
In contrast to ERA-20C, the successor CERA-20C adopts an Earth system approach to climate reanalysis, which leads to a more balanced system for better representations of atmosphere–ocean heat fluxes and of mean sea level pressure (Laloyaux et al., 2018). To account for key uncertainties in the assimilated observations (by adding pseudorandom errors) and simulated model errors (by using a stochastic physics scheme) for producing a long-term climate reanalysis, CERA-20C and ERA5 provide 10-member ensembles of climate reanalysis through a variant of the four-dimensional variational ensemble assimilation technique (Isaksen et al., 2010; Poli et al., 2013; Laloyaux et al., 2018; Zhou et al., 2018; Hersbach et al., 2020). Thus, the 10-member ensembles enable us, for the first time, to investigate the uncertainty associated with using reanalysis as a reference series in the homogenized WS data series.
2.3 Homogenization procedure
Several statistical homogenization methods with associated software, for example, the standard normal homogeneity test (SNHT) (Alexandersson and Moberg, 1997), multiple analysis of series for homogenization (MASH) (Szentimrey, 1999), penalized maximal T test (PMT) (Wang et al., 2007), and penalized maximal F test (PMF) (Wang, 2008), have been widely compared and employed for various climate variables including temperature, precipitation, humidity, and WS (Domonkos, 2011; Minola et al., 2016; Zhou et al., 2017, 2021b; Yosef et al., 2018; Azorin-Molina et al., 2019). Compared to the SNHT, the PMT and PMF tests are revealed to more reliably detect all the change points, by incorporating a penalized empirical correction that accounts for greater likelihood of detecting change points at the beginning and end of time series (Wang et al., 2007; Wang, 2008). Both tests consider the effect of series autocorrelation in the detection of change points (Wang et al., 2007; Wang, 2008; Zhou et al., 2021b). In addition, compared with the PMT, the PMF can preserve linear trends for most segments split by the detected change points through visual inspection, especially for long-term time series with apparent climate fluctuations (Wang et al., 2007; Wang, 2008; Zhou et al., 2021b). Thus, the PMF test was chosen to homogenize the century-long WS series in this study.
The homogenization procedure comprises four steps: construction of the difference series with a reference series, detection of change points, adjustment of the discontinuities, and the final creation of the homogenized series. Firstly, we constructed the monthly difference series (WSraw–WSrea) of the raw rescued wind speed (WSraw) minus the reanalysis wind speed (WSrea, from CERA-20C and ERA5) by linear regression. The linear regression can eliminate systematic errors in the reanalysis and the effect of the station-versus-grid difference. Secondly, we applied the PMF test at a significance level of 0.05 to the WSraw–WSrea series, for statistically detecting possible change-point dates. For comparison, the PMT test at a significance level of 0.01 was also applied and yielded the same results (details in Sect. 3.3). A significance level of 0.05 for the PMT test was also tried but unreasonably generated too many short (2–3-year) segments. Thirdly, after obtaining the change-point dates, the mean-matching algorithm was applied to the WSraw–WSrea series to adjust the detected spurious discontinuities. Up to 5 years of data from the segments before and after each change point were used to adjust the discontinuities, with the last segment as the baseline. Finally, the homogenized series was added back onto the WSrea series to obtain the final homogenized wind speed anomaly series (WSadj). The above procedure was also conducted on individual months and yielded similar results.
3.1 Detection of change points
The PMF test at a significance level of 0.05 was applied to the WSraw–WSrea series to detect spurious change points. Results identified 71 change points in total for all the 13 stations, with a mean segment length of approximately 11.3 years. A histogram of years with detected change points shows three peaks, i.e., 1935–1944, 1956–1964, and around 1985 (Fig. 3).
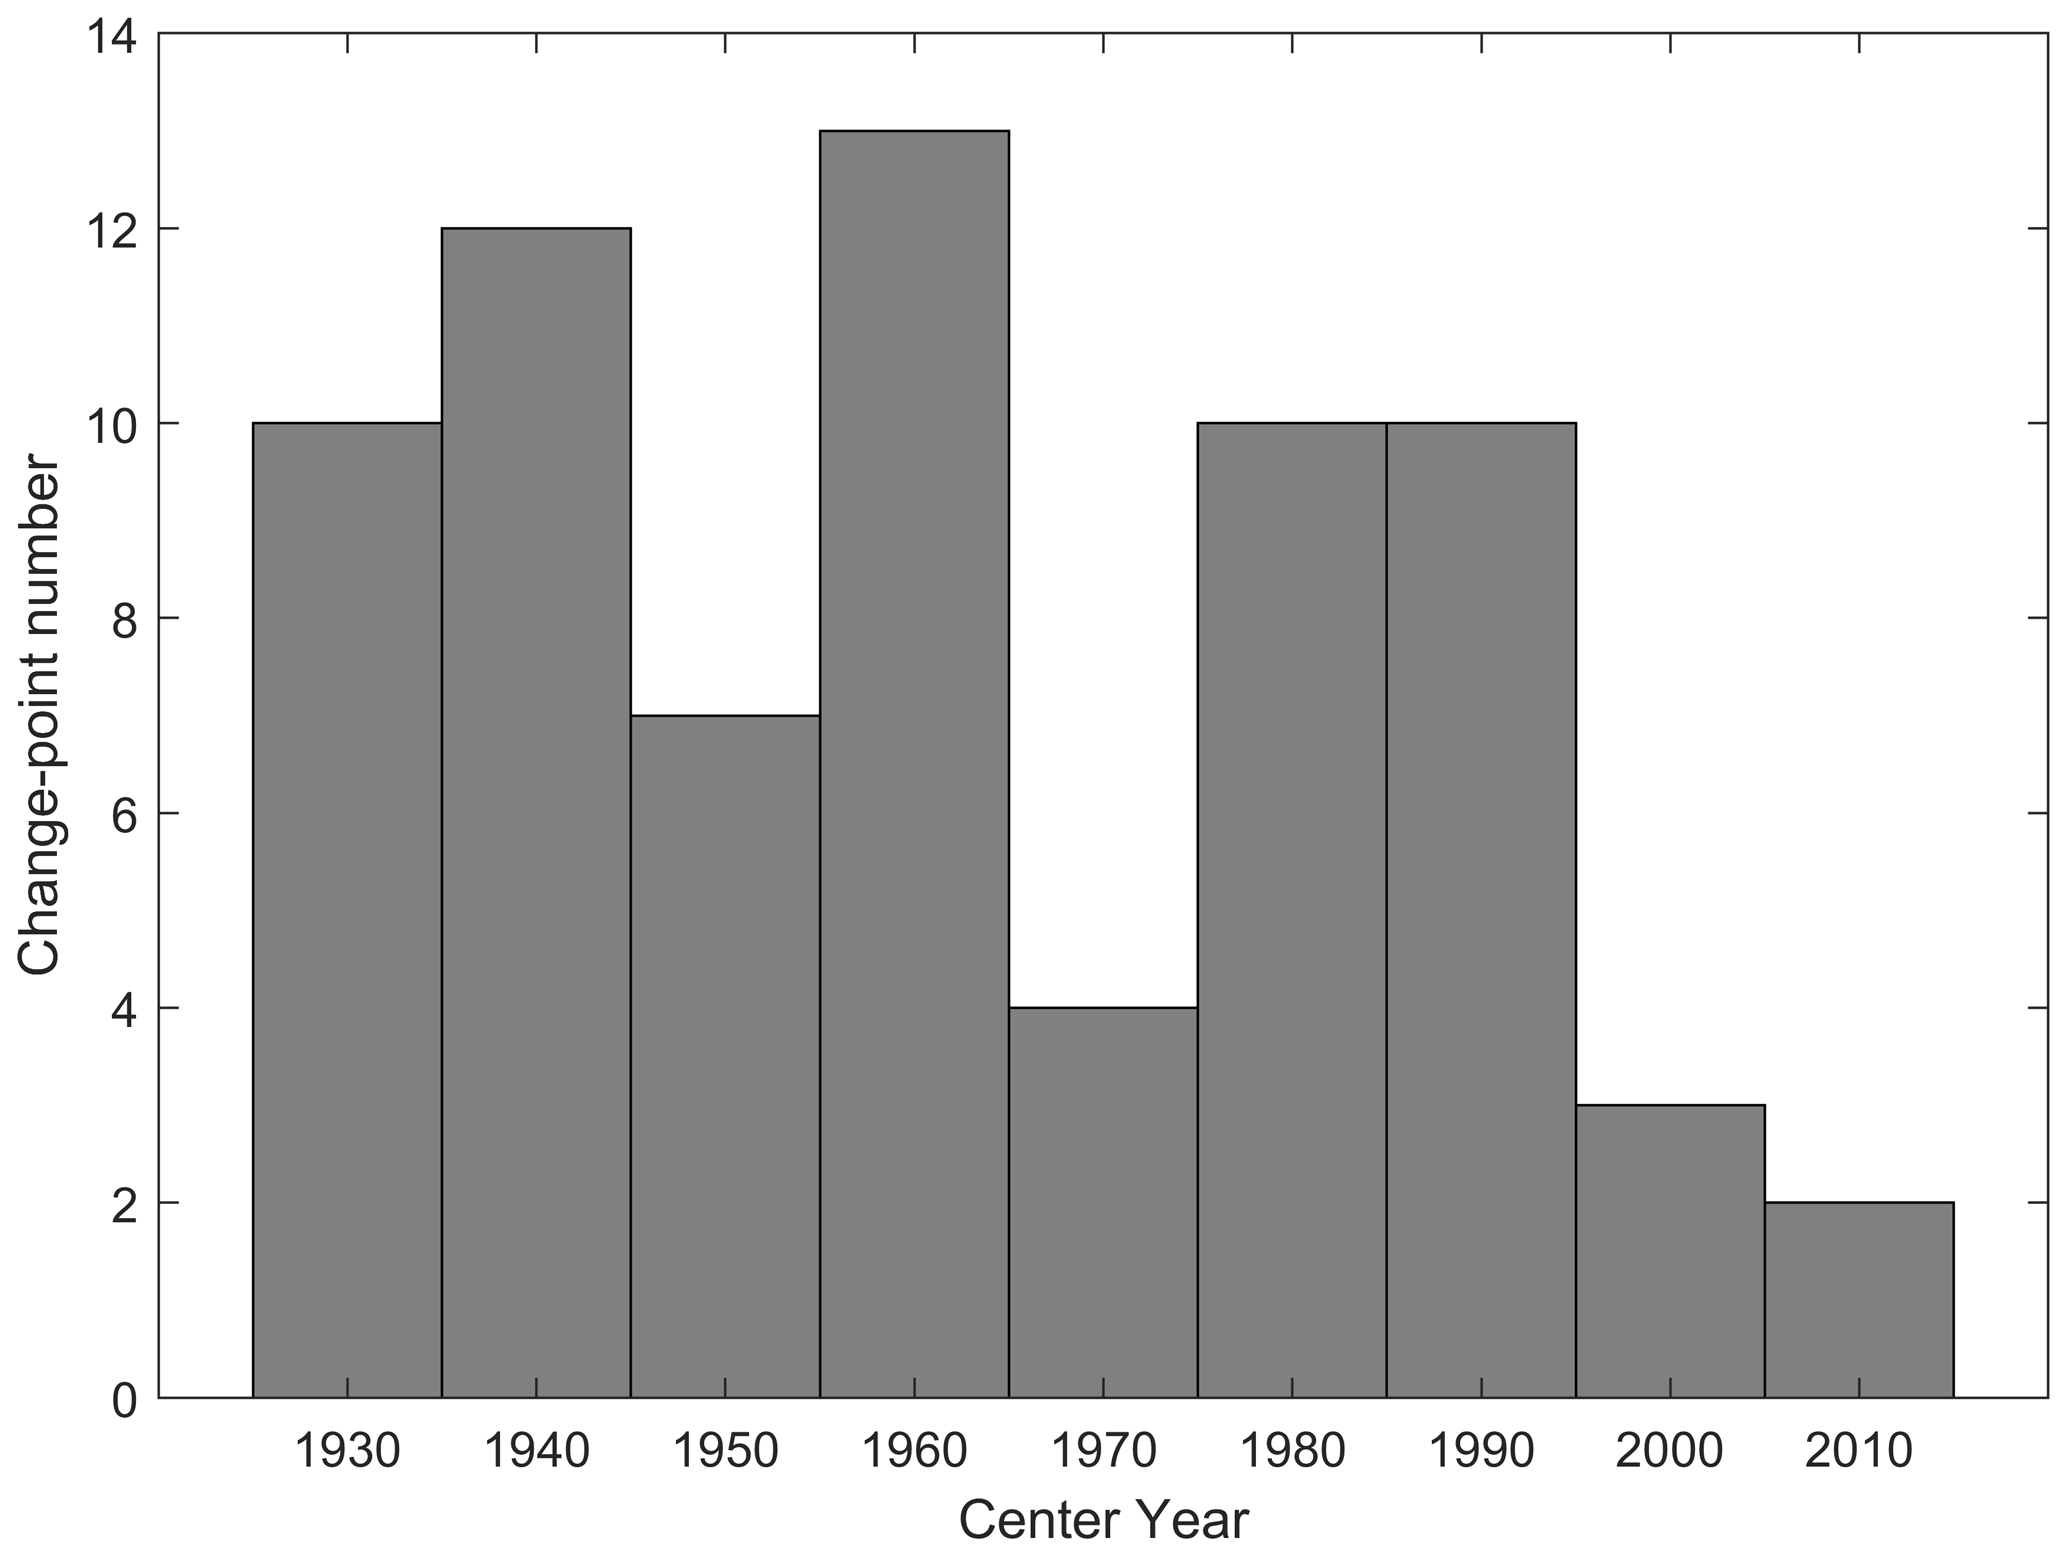
Figure 3Histogram of the years of the detected change points. Bars are grouped every 10 years.
We collected all available metadata from the SMHI archive and tried to validate the detected change points to the extent that these incomplete records permit. Approximately 38 % of our detected change points are confirmed by the known events recorded in the metadata. Because of the incompleteness of the metadata record, this value was calculated as the ratio of the number of change points with one or more metadata events recorded within 1 year of the change point to the number of change points within 5 years of the metadata event record. This calculation is to cover those periods with available metadata for different stations well, that is, to exclude those periods or stations without metadata records, such as Malmslätt station (Fig. 4). Events recorded by the metadata include changes in the observatory, measurement instrument, and surrounding environment. For example, at the Bjuröklubb stations, two change points detected in 1942 and 1949 are verified by changes in the observatory, whereas a change point in 1978 has no metadata record to verify it (Fig. 4a). Additionally, the changes in the observatory from 1965 to 1975 may not have caused any discontinuities, or the discontinuities were indistinguishable from the background climate variability by the statistical homogenization method. Note that ∼24 % of the detected change points based on the PMT test at a significance level of 0.01 are confirmed by the metadata event changes.
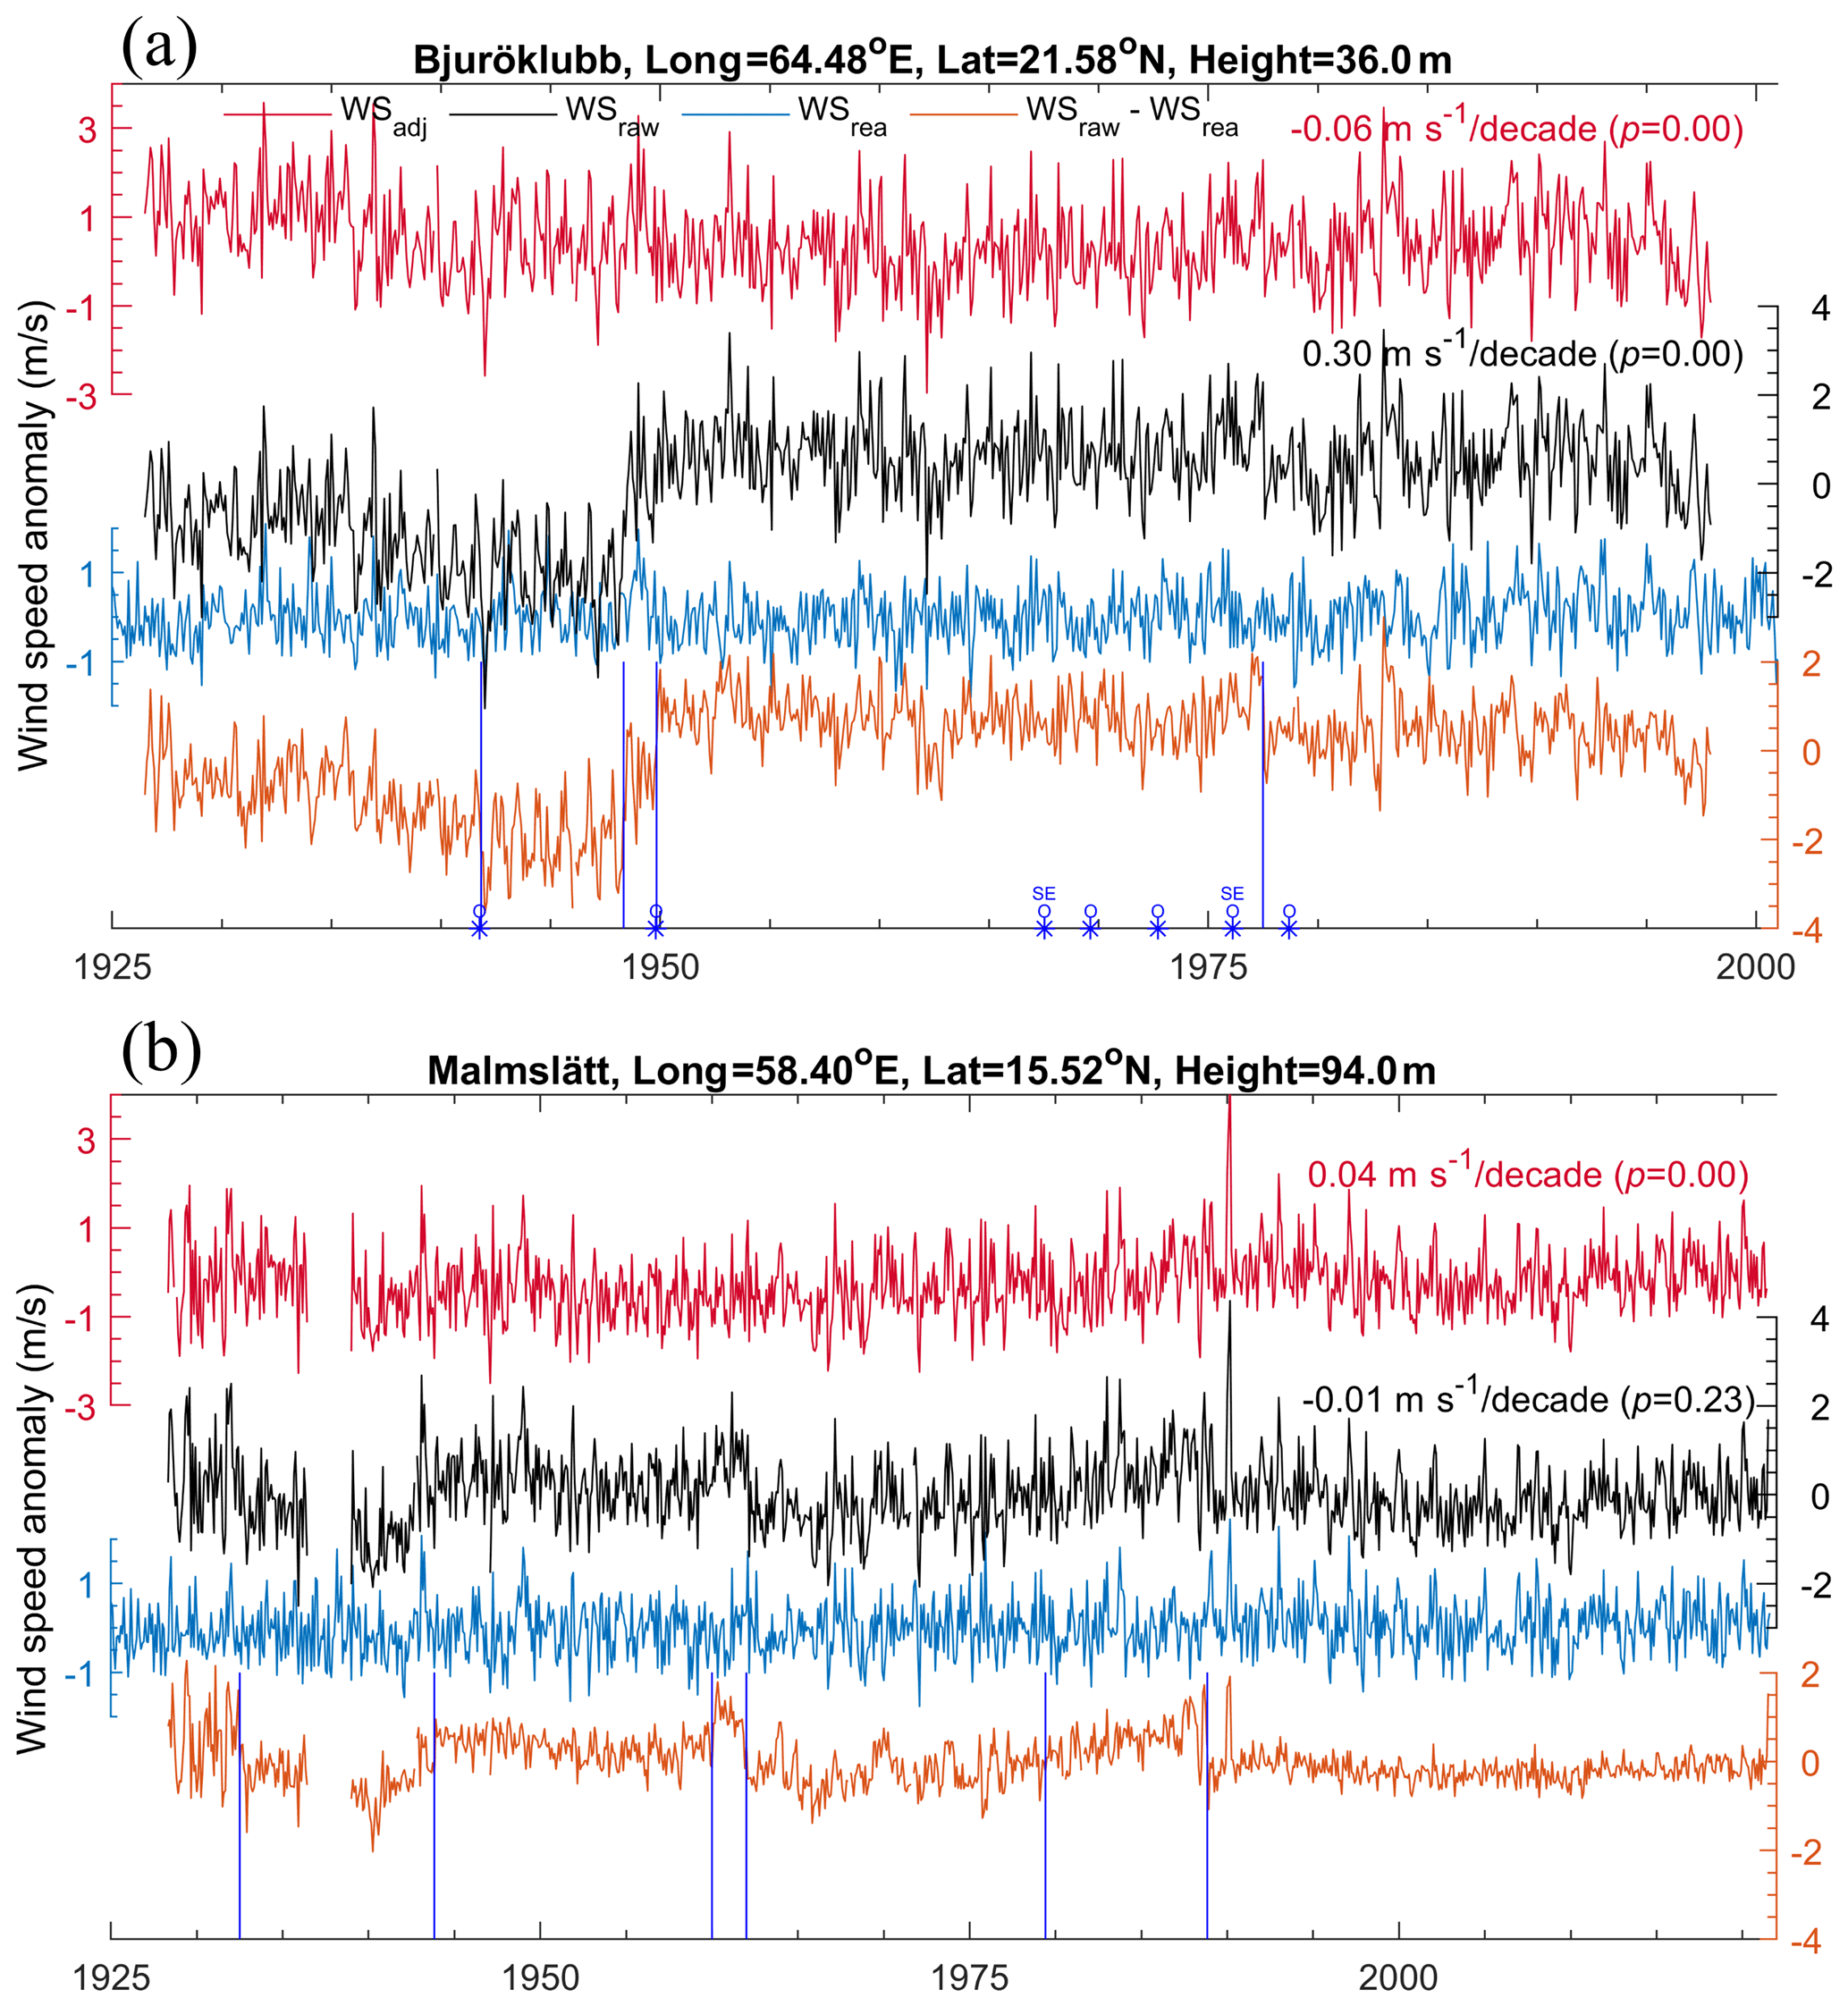
Figure 4Two examples to illustrate the homogenization process and result. Black, blue, and red lines are raw (WSraw), reanalysis (WSrea), and adjusted (WSadj) series of monthly wind speed anomaly, respectively. The brown line is the residual (raw series minus reanalysis series: WSraw–WSrea, calculated by linear regression) used for removing the natural climate variability from the raw series, which then amplifies spurious discontinuities during the homogenization. The reanalysis reference series was estimated from the climate reanalysis CERA-20C (1925–2010) and extended by the latest ERA5 (2011–2021). Blue vertical lines show the detected change-point dates, and blue asterisks show the changes in the events recorded in the collected metadata; for example, “O” represents a change in the observatory and “SE” shows changes in the surrounding environments. The long-term trends in wind speed are shown in the top right.
3.2 Adjustments of the detected discontinuities
To remove the detected discontinuities in the WSraw–WSrea series, we employed a mean-matching adjustment using up to 5 years of data before and after each detected change point, as widely done in previous studies (Minola et al., 2016; Zhou et al., 2018, 2021b; Ma et al., 2022). The most recent segment was chosen as the reference segment since it was usually measured by the most advanced instrument and thus probably most reliable. Starting from the last change point, the mean difference of the WSraw–WSrea segments over up to 5 years around the change point was estimated to adjust the entire segment before the change point, and this process repeated backward in time for the remaining change points. After the adjustments, the artificial discontinuities around the change points disappear (Fig. 4). Such a mean-matching adjustment implies that the mean shift estimated using the WSraw–WSrea segments over up to 5 years around a change point is due to non-climatic changes. This highlights the critical importance of minimizing the natural variations in the WSraw–WSrea series. The WSrea series preserves most of the natural variations so that the adjustment using the WSraw–WSrea series rather than the WSraw series is less affected by the natural variations.
Two examples of the mean adjustment are presented in Fig. 4, demonstrating the clear improvements in the long-term homogeneity of the series. Two apparent positive WS biases around the 1950s (due to the station relocations), and one apparent negative WS bias in 1978, at Bjuröklubb station are largely removed after the adjustment (Fig. 4a). The adjustments removed most of the apparent discontinuities and decreased the linear trend during 1926–1997 from 0.30 to −0.06 m s−1 per decade at Bjuröklubb station (Fig. 4a). Two apparent negative biases in the 1960s and 1990s were substantially adjusted, significantly turning the century-long trend from a negative trend (−0.01 m s−1 per decade) to positive (0.04 m s−1 per decade) at Malmslätt station (Fig. 4b). Overall, the adjustments make the WS series more homogeneous.
Figure 5 compares the raw and homogenized WS series at the 13 stations in Sweden. One can see that many apparent adjustments were made at Bjuröklubb, Härnösand, Landsort, Malmslätt, Ölands norra udde, Hoburg, and Kalmar stations (cf. left versus right panels in Fig. 5). These substantial adjustments are concentrated in the 1930s, 1950s, 1960s, 1980s, and 2000s and significantly alter the long-term trends in WS (Fig. 5). For example, wind stilling was enhanced from −0.08 to −0.20 m s−1 per decade at Landsort station but was weakened from −0.41 to −0.03 m s−1 per decade at Kalmar station. The sign of the WS trend changed from positive to negative at Bjuröklubb station but from negative to positive at Torslanda and Malmslätt stations (Fig. 5). Thus, reducing the discontinuities in the rescued WS series is important for increasing our confidence in the detection of WS changes.
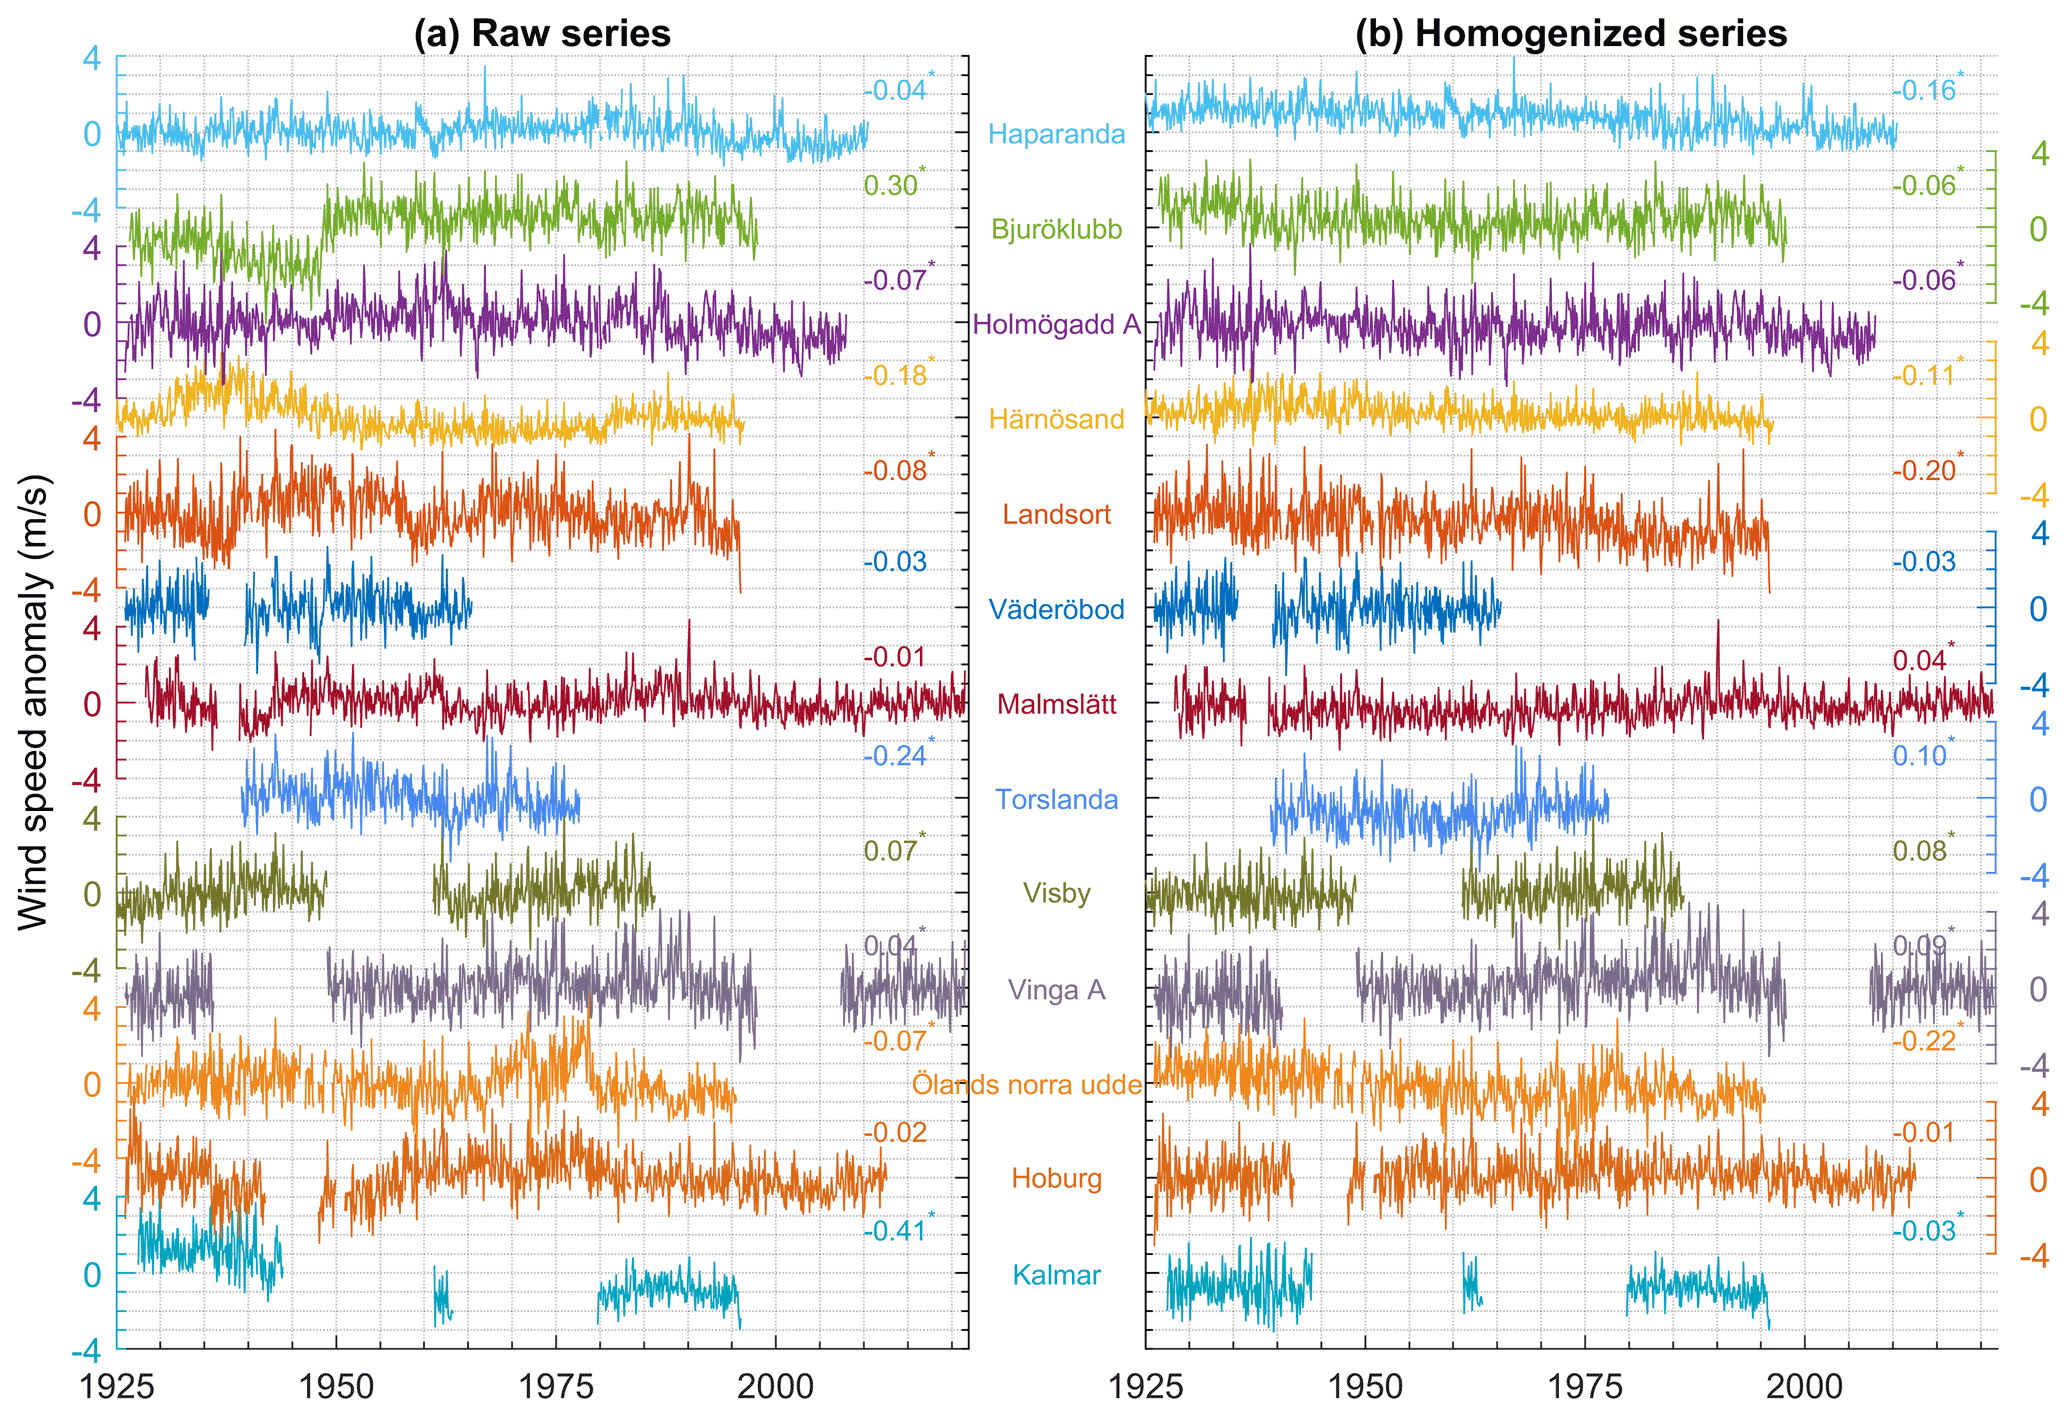
Figure 5Comparison of (a) raw and (b) homogenized wind speed anomaly series rescued at the 13 stations in Sweden. The long-term trends (in m s−1 per decade) are shown on the right, with * indicating a significance level of 0.05.
3.3 Impacts of homogenization
The mean adjustment to the monthly anomaly series can significantly alter the long-term trend. Figure 6 compares raw and homogenized WS anomaly series averaged at the 13 stations from 1925 to 2021. Note that the average of the nine stations excluding Väderöbod, Torslanda, Visby, and Kalmar stations due to short data availability also yields similar results as shown below. Despite there being no change in the century-long trends (−0.03 m s−1 per decade, p<0.05) before and after adjustment, the signs and amplitudes of the multidecadal trends changed significantly (Fig. 6). A 15-point Lanczos filter with a 10-year cutoff was applied to show the decadal changes in the raw and adjusted WS anomaly series (Fig. 6). The raw WS series fluctuated steadily before the 1970s, declined rapidly during the 1970s–2000s, and reversed swiftly thereafter, while the homogenized WS series exhibited clear periodic fluctuations after 1925 (Fig. 6). Decadal correlation between the North Atlantic Oscillation (NAO) and WS series increased from 0.29 to 0.54 (p<0.05) before and after adjustment (Fig. 6).
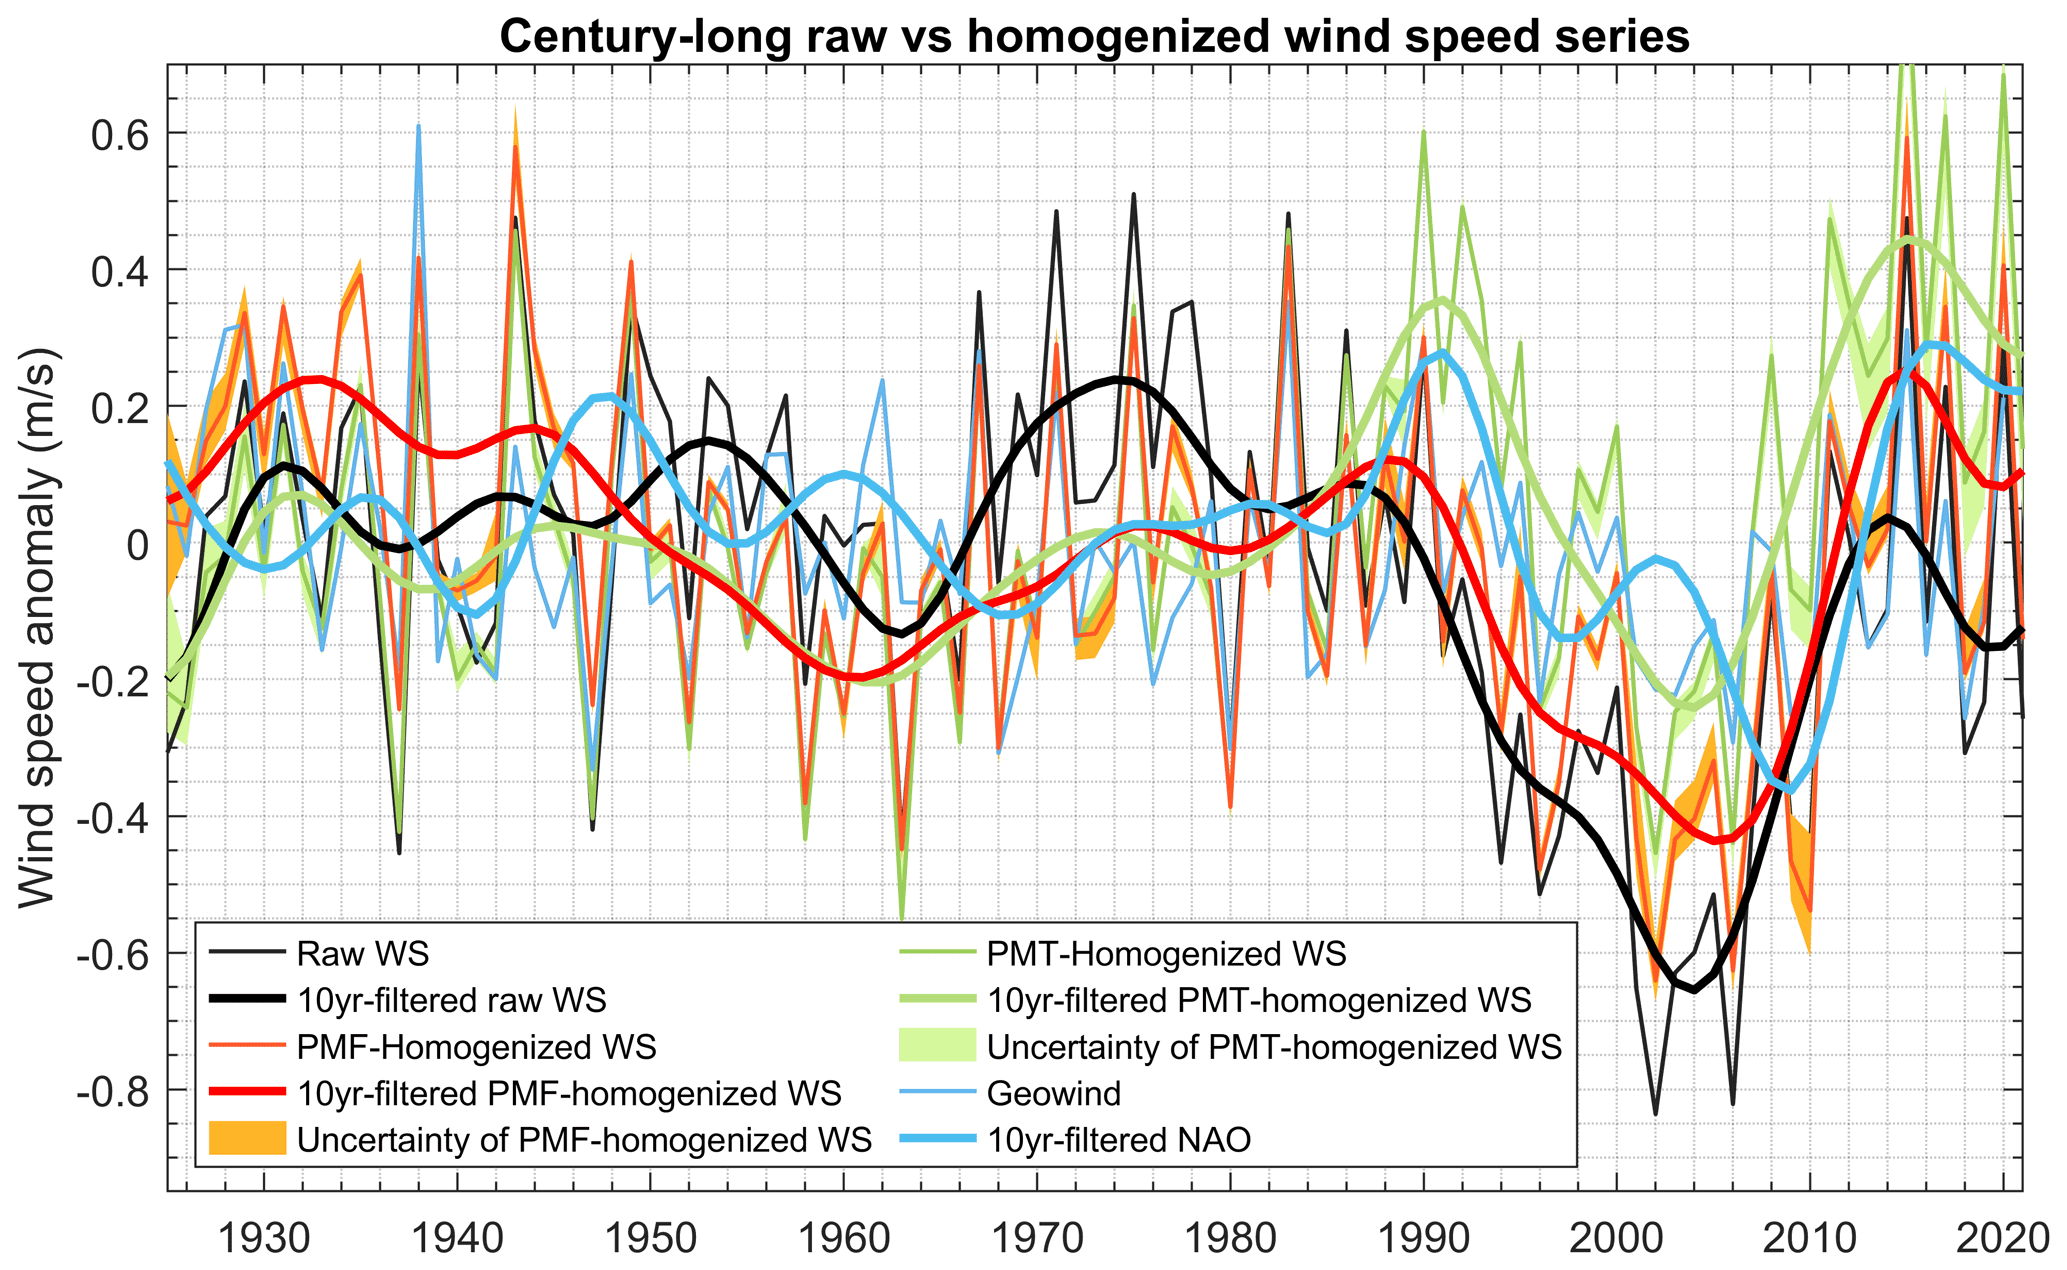
Figure 6The averaged wind speed anomaly series at the 13 stations from raw and homogenized data (in black, red or green lines). The uncertainty of the homogenized data with CERA-20C 10-member ensembles as the reference series is shown in brown or green shading. The 10-year low-pass-filtered series of raw data, homogenized data, and scaled North Atlantic Oscillation (NAO) are shown by thick lines. Geowind series is also shown to depict the signal of internal climate variability (in blue line). For comparison, the PMF and PMT tests were applied to detect change points during the homogenization.
It is useful to analyze the trend differences for subperiods. In particular, during the 1960s to the 1990s, the homogenized WS shows an increasing trend of 0.09 m s−1 per decade (p<0.05), whereas the raw WS presents a non-significant trend (p>0.05, Fig. 6). This change mainly results from adjustments during the 1850s–1980s as mentioned in Sect. 3.2. The raw WS anomaly series peaks around 1975, where the homogenized WS has a local maximum around 1990, which matches that of the NAO (Fig. 6). During the period from 1990 to 2005, the magnitude of the wind stilling trend decreased by 25 %, to −0.35 m s−1 per decade (p<0.05), after adjustments (Fig. 6). Considering the uncertainty of the homogenized data, this decrease after adjustments is significant during this period. An early stilling was observed during the 1930s–1960s. Uncertainty in the homogenized WS series is evident for the periods before 1945 and after 1990 (see the shading in Fig. 6), and stems from the uncertainty associated with using the century-long reference reanalysis series. It is worth noting that the homogenized data based on the PMT test are consistent with the above results based on the PMF test (Fig. 6). Overall, we find that adjustments of the discontinuities with consideration of the homogenization uncertainty for the century-long WS series are vital in studies of the detection and attribution of recent global stilling and recovery.
The first century-long homogenized WS dataset in Sweden generated in this study provides an excellent basis for the detection and attribution of WS variability and change and will be useful for model evaluation and constraint, and even for applications in the energy industry, ecology, and hydrology. HomogWS-se contains 13 individual text files with 10-member century-long homogenized WS series, as well as the member-mean series. HomogWS-se is freely accessible at the Zenodo repository via the following link: https://doi.org/10.5281/zenodo.5850264 (Zhou et al., 2022), following the findability–accessibility–interoperability–reusability (FAIR) principle.
The growing interest in interpreting the current WS stilling and recovery in terms of past climate development has stimulated increasing urgency for extending the WS series as far back in time as possible. Funded by the WINDGUST project, we rescued early WS measurements recorded on paper since the 1920s, at 13 stations across Sweden. We then adopted a four-step homogenization procedure to produce the first 10-member century-long homogenized WS dataset, with the help of CERA-20C and ERA5 as the reference series. HomogWS-se is publicly available for community uses, including studying the WS variability and change, assessing reanalysis products, and constraining climate simulations for better future projection of changes in the WS and wind energy potential.
By examining the correlations (with the raw series) and homogeneities of the potential reference series, we found that CERA-20C during 1925–2010 with an extension from ERA5 during 2011–2021 was the best reference series for WS rescued at the 13 stations in Sweden. We applied the PMF test at a significance level of 0.05 to the WSraw–WSrea series, to detect spurious change points. Then, we adopted the mean-matching algorithm to adjust the detected discontinuities, using the last segment as the reference, which makes the homogenized WS series significantly more continuous than the raw WS series. Finally, the homogenized WSraw–WSrea series was added back to the WSrea series, yielding the homogenized WS dataset. The same homogenization procedure was repeated using 10-member ensembles instead of their mean, as a reference series to quantify the uncertainty associated with using reanalysis as reference series in the homogenized WS data series.
The mean segment length between the detected change points was ∼11.3 years. Approximately 38 % of the detected change points were confirmed by known metadata events including changes in the observatory, measurement instrument, and surrounding environment. Due to incomplete metadata and lack of parallel measurements, it is difficult to directly compare these artificial biases. Brázdil et al. (2017) compiled parallel WS measurements between universal anemographs and the Vaisala WAA251 sensor (cup anemometer) or the WS425 sensor (ultrasonic anemometer) during 2000–2016 at two Czech stations and found the universal anemographs on average underestimated WS. Azorin-Molina et al. (2018) designed a 3-year field experiment with paired WS measurements by old and new cup anemometers and found that the old anemometer significantly underestimated WS. These parallel comparisons revealed that the instrument change and aging could generate change points in the WS series, and our homogenization can remove these discontinuities to produce the homogenized WS series.
The raw and homogenized WS series averaged across the 13 stations showed different multidecadal trends. The raw WS series fluctuated with no clear trend before the 1970s, whereas the homogenized WS series presented an early WS stilling and recovery until the 1990s. After the adjustments, the magnitude of the WS stilling trend decreased by 25 % during 1990–2005 and subsequently showed a strong reversal. This decline was significant when considering the uncertainty of the homogenized data. Overall, the homogenized WS series during 1925–2021 presented a stronger correlation with the North Atlantic Oscillation (NAO) than that of the raw WS series (0.54 vs. 0.29). The geowind series mainly reflect the signal of internal climate variability and their average at these 13 stations presented decadal variations basically consistent with the NAO index (Fig. 6), implying that wind speed of these stations may be mainly affected by NAO on the decadal timescale. This improved relationship with NAO confirms and extends the result of Minola et al. (2016, 2022) using the data after 1956 in Sweden. These results stress the importance of the century-long homogenized WS series in increasing our understanding of the recent WS stilling and recovery.
These century-long, high-quality climate records created through data rescue and homogenization provide an essential baseline for the past climate (Yan et al., 2014; Capozzi et al., 2020; Si et al., 2021). These not only preserve the rich heritage of observers' diligent work in the past but also yield more robust assessments of climate variability and change, helping to make our societies more climatically resilient in the future. The homogenization procedure presented in this study demonstrates a successful approach, including the selection of reference series and the detection and adjustment of discontinuities. Therefore, it could be valuable for those countries or organizations seeking to rescue and homogenize their records, and for building global century-long homogeneous datasets for community use.
CZ, CAM, and DC designed the research. CZ performed the analysis and wrote the draft. All the authors jointly contributed to interpreting the results and writing the final paper.
The contact author has declared that neither they nor their co-authors have any competing interests.
Publisher's note: Copernicus Publications remains neutral with regard to jurisdictional claims in published maps and institutional affiliations.
This study was funded by Swedish FORMAS (2019-00509) and VR (2017-03780, 2019-03954), as well as the Swedish National Strategical Research Programs BECC and MERGE. Cesar Azorin-Molina was supported by the IBER-STILLING project RTI2018-095749-A-100 (MCIU/AEI/FEDER,UE), the VENTS project AICO/2021/023 (GVA) and the CSIC Interdisciplinary Thematic Platform PTI-CLIMA. Lorenzo Minola was funded by the International Postdoc grant from the Swedish Research Council (2021-00444). Gangfeng Zhang's comments on an earlier draft are acknowledged. The rescued wind speed and geowind datasets are available on the SMHI data website (https://www.smhi.se/data/meteorologi/vind, last access: 22 September 2021). We thank the ERA-20C, NOAA 20CRv3, CERA-20C, and ERA5 working groups for providing long-term reanalysis products; their datasets are respectively available at https://apps.ecmwf.int/datasets/data/era20c-moda/levtype=sfc/type=an/ (last access: 22 September 2021), https://psl.noaa.gov/data/gridded/data.20thC_ReanV3.hgtabovesfc.html#caveat (last access: 22 September 2021), https://apps.ecmwf.int/datasets/data/cera20c-edmo/levtype=sfc/type=an/ (last access: 22 September 2021), and https://cds.climate.copernicus.eu/cdsapp#!/dataset/reanalysis-era5-single-levels-monthly-means (last access: 22 September 2021). GTOPO30 is available at https://lta.cr.usgs.gov/GTOPO30 (last access: 10 March 2016).
This research has been supported by the Svenska Forskningsrådet Formas (grant no. 2019-00509) and the Vetenskapsrådet (grant nos. 2017-03780 and 2019-03954).
This paper was edited by Qingxiang Li and reviewed by two anonymous referees.
Alexandersson, H. and Moberg, A.: Homogenization of Swedish temperature data. Part I: Homogeneity test for linear trends, Int. J. Climatol., 17, 25–34, 1997.
Azorin-Molina, C., Rehman, S., Guijarro, J. A., McVicar, T. R., Minola, L., Chen, D., and Vicente-Serrano, S. M.: Recent trends in wind speed across Saudi Arabia, 1978–2013: A break in the stilling, Int. J. Climatol., 38, e966–e984, 2018.
Azorin-Molina, C., Guijarro, J. A., McVicar, T. R., Trewin, B. C., Frost, A. J., and Chen, D.: An approach to homogenize daily peak wind gusts: An application to the Australian series, Int. J. Climatol., 39, 2260–2277, 2019.
Brázdil, R., Valík, A., Zahradníček, P., Řezníčková, L., and Tolasz, R.: Wind-stilling in the light of wind speed measurements: the Czech experience, Clima. Res., 74, 131–143, 2017.
Capozzi, V., Cotroneo, Y., Castagno, P., De Vivo, C., and Budillon, G.: Rescue and quality control of sub-daily meteorological data collected at Montevergine Observatory (Southern Apennines), 1884–1963, Earth Syst. Sci. Data, 12, 1467–1487, https://doi.org/10.5194/essd-12-1467-2020, 2020.
Chen, D. and Chen, H. W.: Using the Köppen classification to quantify climate variation and change: An example for 1901–2010, Environ. Dev., 6, 69–79, https://doi.org/10.1016/j.envdev.2013.03.007, 2013.
Domonkos, P.: Efficiency evaluation for detecting inhomogeneities by objective homogenisation methods, Theor. Appl. Climatol., 105, 455–467, 2011.
Engström, E., Azorin-Molina, C., Wern, L., Hellström, S., Zhou, C., and Chen, D.: Data rescue of historical wind observations in Sweden since the 1920s, in preparation, 2022.
Gillespie, I. M., Haimberger, L., Compo, G. P., and Thorne, P. W.: Assessing potential of sparse-input reanalyses for centennial-scale land surface air temperature homogenisation, Int. J. Climatol., 41, E3000–E3020, 2021.
Hersbach, H., Bell, B., Berrisford, P., Hirahara, S., Horányi, A., Muñoz-Sabater, J., Nicolas, J., Peubey, C., Radu, R., and Schepers, D.: The ERA5 global reanalysis, Q. J. Roy. Meteorol. Soc., 146, 1999–2049, 2020.
Hurrell, J. W., Kushnir, Y., Ottersen, G., and Visbeck, M.: An overview of the North Atlantic oscillation, Geophys. Monogr., 134, 1–36, 2003.
IPCC: Climate Change 2021: The Physical Science Basis, in: Contribution of Working Group I to the Sixth Assessment Report of the Intergovernmental Panel on Climate Change, edited by: Masson-Delmotte, V., Zhai, P., Pirani, A., Connors, S. L., Péan, C., Berger, S., Caud, N., Chen, Y., Goldfarb, L., Gomis, M. I., Huang, M., Leitzell, K., Lonnoy, E., Matthews, J. B. R., Maycock, T. K., Waterfield, T., Yelekçi, O., Yu, R., and Zhou, B., Cambridge University Press, 2021.
Isaksen, L., Bonavita, M., Buizza, R., Fisher, M., Haseler, J., Leutbecher, M., and Raynaud, L.: Ensemble of data assimilations at ECMWF, Technical Memorandum No. 636, ECMWF, 1–48, https://www.ecmwf.int/node/10125 (last access: 25 December 2021), 2010.
Laapas, M. and Venäläinen, A.: Homogenization and trend analysis of monthly mean and maximum wind speed time series in Finland, 1959–2015, Int. J. Climatol., 37, 4803–4813, 2017.
Laloyaux, P., de Boisseson, E., Balmaseda, M., Bidlot, J.-R., Broennimann, S., Buizza, R., Dalhgren, P., Dee, D., Haimberger, L., and Hersbach, H.: CERA-20C: A coupled reanalysis of the twentieth century, J. Adv. Model. Earth Syst., 10, 1172–1195, 2018.
Ma, Q., Wang, K., He, Y., Su, L., Wu, Q., Liu, H., and Zhang, Y.: Homogenized century-long surface incident solar radiation over Japan, Earth Syst. Sci. Data, 14, 463–477, https://doi.org/10.5194/essd-14-463-2022, 2022.
McVicar, T. R., Roderick, M. L., Donohue, R. J., Li, L. T., Van Niel, T. G., Thomas, A., Grieser, J., Jhajharia, D., Himri, Y., and Mahowald, N. M.: Global review and synthesis of trends in observed terrestrial near-surface wind speeds: Implications for evaporation, J. Hydrol., 416, 182–205, 2012.
Minola, L., Azorin-Molina, C., and Chen, D.: Homogenization and assessment of observed near-surface wind speed trends across Sweden, 1956–2013, J. Climate, 29, 7397–7415, https://doi.org/10.1175/JCLI-D-15-0636.1, 2016.
Minola, L., Reese, H., Lai, H.-W., Azorin-Molina, C., Guijarro, J. A., Son, S.-W., and Chen, D.: Wind stilling-reversal across Sweden: The impact of land-use and large-scale atmospheric circulation changes, Int. J. Climatol., 42, 1049–1071, https://doi.org/10.1002/joc.7289, 2022.
Poli, P., Hersbach, H., Tan, D., Dee, D., Thepaut, J.-N., Simmons, A., Peubey, C., Laloyaux, P., Komori, T., and Berrisford, P.: The data assimilation system and initial performance evaluation of the ECMWF pilot reanalysis of the 20th-century assimilating surface observations only (ERA-20C), European Centre for Medium Range Weather Forecasts, ECMWF, https://www.ecmwf.int/file/23559/download?token=k30sX6ii (last access: 25 December 2021), 2013.
Poli, P., Hersbach, H., Dee, D. P., Berrisford, P., Simmons, A. J., Vitart, F., Laloyaux, P., Tan, D. G. H., Peubey, C., Thépaut, J.-N., Trémolet, Y., Hólm, E. V., Bonavita, M., Isaksen, L., and Fisher, M.: ERA-20C: An atmospheric reanalysis of the twentieth century, J. Climate, 29, 4083–4097, https://doi.org/10.1175/JCLI-D-15-0556.1, 2016.
Roderick, M. L., Rotstayn, L. D., Farquhar, G. D., and Hobbins, M. T.: On the attribution of changing pan evaporation, Geophys. Res. Lett., 34, L17403, https://doi.org/10.1029/2007GL031166, 2007.
Saidur, R., Islam, M., Rahim, N., and Solangi, K.: A review on global wind energy policy, Renew. Sust. Energ. Rev., 14, 1744–1762, 2010.
Si, P., Li, Q., and Jones, P.: Construction of homogenized daily surface air temperature for the city of Tianjin during 1887–2019, Earth Syst. Sci. Data, 13, 2211–2226, https://doi.org/10.5194/essd-13-2211-2021, 2021.
Slivinski, L. C., Compo, G. P., Whitaker, J. S., Sardeshmukh, P. D., Giese, B. S., McColl, C., Allan, R., Yin, X., Vose, R., and Titchner, H.: Towards a more reliable historical reanalysis: Improvements for version 3 of the twentieth century reanalysis system, Q. J. Roy. Meteorol. Soc., 145, 2876–2908, 2019.
Szentimrey, T.: Multiple analysis of series for homogenization (MASH), in: Proceedings of the second seminar for homogenization of surface climatological data, http://www.dmcsee.org/uploads/file/331_2_mashmanual.pdf (last access: 25 December 2021), 1999.
Vautard, R., Cattiaux, J., Yiou, P., Thepaut, J. N., and Ciais, P.: Northern Hemisphere atmospheric stilling partly attributed to an increase in surface roughness, Nat. Geosci., 3, 756–761, https://doi.org/10.1038/Ngeo979, 2010.
Wang, X., Dickinson, R. E., Su, L., Zhou, C., and Wang, K.: PM2.5 pollution in China and how it has been exacerbated by terrain and meteorological conditions, B. Am. Meteorol. Soc., 99, 105–119, https://doi.org/10.1175/bams-d-16-0301.1, 2018.
Wang, X. L.: Penalized maximal F test for detecting undocumented mean shift without trend change, J. Atmos. Ocean. Tech., 25, 368–384, https://doi.org/10.1175/2007JTECHA982.1, 2008.
Wang, X. L., Wen, Q. H., and Wu, Y.: Penalized maximal t test for detecting undocumented mean change in climate data series, J. Appl. Meteorol. Clim., 46, 916–931, https://doi.org/10.1175/JAM2504.1, 2007.
Wern, L. and Bärring, L.: Sveriges vindklimat 1901–2008: Analys av trend i geostrofisk vind, SMHI, https://www.diva-portal.org/smash/get/diva2:948087/FULLTEXT01.pdf (last access: 25 December 2021), 2009.
Wern, L. and Bärring, L.: Vind och storm i Sverige 1901–2011, Rep. Faktablad 51, Swedish Meteorological and Hydrological Institute, 1–4, https://www.smhi.se/polopoly_fs/1.16896!/webbFaktablad_51.pdf (last access: 25 December 2021), 2011.
WMO: Guidelines on best practices for climate data rescue, WMO-No. 1182, https://library.wmo.int/doc_num.php?explnum_id=3318 (last access: 25 December 2021), 2016.
WMO: Guide to Instruments and Methods of Observation Volume 1 – Measurement of Meteorological Variables, WMO-No. 8, https://library.wmo.int/doc_num.php?explnum_id=10616 (last access: 25 December 2021), 2018.
Wu, C., Wang, J., Ciais, P., Peñuelas, J., Zhang, X., Sonnentag, O., Tian, F., Wang, X., Wang, H., and Liu, R.: Widespread decline in winds delayed autumn foliar senescence over high latitudes, P. Natl. Acad. Sci. USA, 118, e2015821118, https://doi.org/10.1073/pnas.2015821118, 2021.
Wu, J., Zha, J., Zhao, D., and Yang, Q.: Changes in terrestrial near-surface wind speed and their possible causes: an overview, Clim. Dynam., 51, 2039–2078, 2018a.
Wu, J., Zha, J., Zhao, D., and Yang, Q.: Effects of surface friction and turbulent mixing on long-term changes in the near-surface wind speed over the Eastern China Plain from 1981 to 2010, Clim. Dynam., 51, 2285–2299, 2018b.
Yan, Z., Li, Z., and Xia, J.: Homogenization of climate series: The basis for assessing climate changes, Sci. China Earth Sci., 57, 2891–2900, 2014.
Yosef, Y., Aguilar, E., and Alpert, P.: Detecting and adjusting artificial biases of long-term temperature records in Israel, Int. J. Climatol., 38, 3273–3289, 2018.
Zeng, Z., Ziegler, A. D., Searchinger, T., Yang, L., Chen, A., Ju, K., Piao, S., Li, L. Z., Ciais, P., and Chen, D.: A reversal in global terrestrial stilling and its implications for wind energy production, Nat. Clim. Change, 9, 979–985, 2019.
Zhang, G., Azorin-Molina, C., Shi, P., Lin, D., Guijarro, J. A., Kong, F., and Chen, D.: Impact of near-surface wind speed variability on wind erosion in the eastern agro-pastoral transitional zone of Northern China, 1982–2016, Agr. Forest Meteorol., 271, 102–115, 2019.
Zhang, Z. and Wang, K.: Stilling and recovery of the surface wind speed based on observation, reanalysis, and geostrophic wind theory over China from 1960 to 2017, J. Climate, 33, 3989–4008, 2020.
Zhang, Z. and Wang, K.: Quantifying and adjusting the impact of urbanization on the observed surface wind speed over China from 1985 to 2017, Fundam. Res., 1, 785–791, 2021.
Zhou, C. and Wang, K.: Coldest temperature extreme monotonically increased and hottest extreme oscillated over northern hemisphere land during last 114 years, Sci. Rep., 6, 25721, https://doi.org/10.1038/srep25721, 2016.
Zhou, C., Wang, K., and Ma, Q.: Evaluation of eight current reanalyses in simulating land surface temperature from 1979 to 2003 in China, J. Climate, 30, 7379–7398, https://doi.org/10.1175/jcli-d-16-0903.1, 2017.
Zhou, C., He, Y., and Wang, K.: On the suitability of current atmospheric reanalyses for regional warming studies over China, Atmos. Chem. Phys., 18, 8113–8136, https://doi.org/10.5194/acp-18-8113-2018, 2018.
Zhou, C., Dai, A., Wang, J., and Chen, D.: Quantifying human-induced dynamic and thermodynamic contributions to severe cold outbreaks like November 2019 in the eastern United States, B. Am. Meteorol. Soc., 102, 17–23, https://doi.org/10.1175/BAMS-D-20-0171.1, 2021a.
Zhou, C., Wang, J., Dai, A., and Thorne, P. W.: A new approach to homogenize global sub-daily radiosonde temperature data from 1958 to 2018, J. Climate, 34, 1163–1183, 2021b.
Zhou, C., Azorin-Molina, C., Engström, E., Minola, L., Wern, L., Hellström, S., Lönn, J., and Chen, D.: HomogWS-se: A century-long homogenized dataset of near-surface wind speed observations since 1925 rescued in Sweden (v1.0), Zenodo [data set], https://doi.org/10.5281/zenodo.5850264, 2022.