the Creative Commons Attribution 4.0 License.
the Creative Commons Attribution 4.0 License.
 | 14 Apr 2022
Pre- and post-production processes increasingly dominate greenhouse gas emissions from agri-food systems
Francesco N. Tubiello
Kevin Karl
Alessandro Flammini
Johannes Gütschow
Griffiths Obli-Laryea
Giulia Conchedda
Xueyao Pan
Sally Yue Qi
Hörn Halldórudóttir Heiðarsdóttir
Nathan Wanner
Roberta Quadrelli
Leonardo Rocha Souza
Philippe Benoit
Matthew Hayek
David Sandalow
Erik Mencos Contreras
Cynthia Rosenzweig
Jose Rosero Moncayo
Piero Conforti
Maximo Torero
We present results from the FAOSTAT emissions shares database, covering emissions from agri-food systems and their shares to total anthropogenic emissions for 196 countries and 40 territories for the period 1990–2019. We find that in 2019, global agri-food system emissions were 16.5 (95 %; CI range: 11–22) billion metric tonnes (Gt CO2 eq. yr−1), corresponding to 31 % (range: 19 %–43 %) of total anthropogenic emissions. Of the agri-food system total, global emissions within the farm gate – from crop and livestock production processes including on-farm energy use – were 7.2 Gt CO2 eq. yr−1; emissions from land use change, due to deforestation and peatland degradation, were 3.5 Gt CO2 eq. yr−1; and emissions from pre- and post-production processes – manufacturing of fertilizers, food processing, packaging, transport, retail, household consumption and food waste disposal – were 5.8 Gt CO2 eq. yr−1. Over the study period 1990–2019, agri-food system emissions increased in total by 17 %, largely driven by a doubling of emissions from pre- and post-production processes. Conversely, the FAOSTAT data show that since 1990 land use emissions decreased by 25 %, while emissions within the farm gate increased 9 %. In 2019, in terms of individual greenhouse gases (GHGs), pre- and post-production processes emitted the most CO2 (3.9 Gt CO2 yr−1), preceding land use change (3.3 Gt CO2 yr−1) and farm gate (1.2 Gt CO2 yr−1) emissions. Conversely, farm gate activities were by far the major emitter of methane (140 Mt CH4 yr−1) and of nitrous oxide (7.8 Mt N2O yr−1). Pre- and post-production processes were also significant emitters of methane (49 Mt CH4 yr−1), mostly generated from the decay of solid food waste in landfills and open dumps. One key trend over the 30-year period since 1990 highlighted by our analysis is the increasingly important role of food-related emissions generated outside of agricultural land, in pre- and post-production processes along the agri-food system, at global, regional and national scales. In fact, our data show that by 2019, pre- and post-production processes had overtaken farm gate processes to become the largest GHG component of agri-food system emissions in Annex I parties (2.2 Gt CO2 eq. yr−1). They also more than doubled in non-Annex I parties (to 3.5 Gt CO2 eq. yr−1), becoming larger than emissions from land use change. By 2019 food supply chains had become the largest agri-food system component in China (1100 Mt CO2 eq. yr−1), the USA (700 Mt CO2 eq. yr−1) and the EU-27 (600 Mt CO2 eq. yr−1). This has important repercussions for food-relevant national mitigation strategies, considering that until recently these have focused mainly on reductions of non-CO2 gases within the farm gate and on CO2 mitigation from land use change. The information used in this work is available as open data with DOI https://doi.org/10.5281/zenodo.5615082 (Tubiello et al., 2021d). It is also available to users via the FAOSTAT database (https://www.fao.org/faostat/en/#data/EM; FAO, 2021a), with annual updates.
- Article
(3133 KB) - Full-text XML
-
Supplement
(639 KB) - BibTeX
- EndNote


Agriculture is a significant contributor to climate change as well as one of the economic sectors most at risk from it. Greenhouse gas (GHG) emissions generated within the farm gate by crop and livestock production and related land use change contribute about one-fifth to one-quarter of total emissions from all human activities, when measured in CO2 equivalents (Mbow et al., 2019; Smith et al., 2014; Vermeulen et al., 2012). The impacts are even starker in terms of individual GHG emissions. Agriculture contributes nearly 50 % of global anthropogenic methane (CH4) and 75 % of the total nitrous oxide (N2O) emissions (FAO, 2021b; Gütschow et al., 2021; Saunois et al., 2020). Once pre- and post-production activities along agri-food systems supply chains are included, food and agriculture activities generate up to one-third of all anthropogenic emissions globally (Crippa et al., 2021a, b; Rosenzweig et al., 2020; Tubiello et al., 2021a). This larger food system perspective expands the potential for designing GHG mitigation strategies across the entire food system, i.e., over and above the more traditional focus on agricultural production and land use management that is currently found within countries' nationally determined contributions (Crumpler et al., 2021).
Significant progress has recently resulted in the development of novel databases with global coverage of country-level data on agri-food system emissions (Crippa et al., 2021a, b; Tubiello et al., 2021a). Tubiello et al. (2021a), in particular, provided a mapping of emission categories of the Intergovernmental Panel on Climate Change (IPCC) – used by countries for reporting their national GHG inventories (NGHGI) to the United Nations Framework Convention on Climate Change (UNFCCC) – unto internationally accepted food and agriculture concepts that are more easily understood by farmers and planners in countries, including in ministries of agriculture. By providing a correspondence between IPCC and FAO terminology, we seek to help countries to more adequately capture important aspects of food and agriculture activities within existing climate reporting, so that they can better identify effective climate actions across their agri-food systems (Fig. 1, adapted from Tubiello et al., 2021a). Firstly, the correspondence mapping expands the IPCC “agriculture” definition to include, in addition to non-CO2 emissions from the farm, also the CO2 generated in drained peatlands on agricultural land (Conchedda and Tubiello, 2020; IPCC, 2014b) and by energy use in farm operations (FAO, 2011, 2014, 2020b; Flammini et al., 2022, Sims and Flammini, 2014). Secondly, it usefully disaggregates the land use, land use change and forestry (LULUCF) of IPCC (2003) by separating out the emissions directly linked to food and agriculture activities, such as those generated by deforestation (Curtis et al., 2018; Tubiello et al., 2021c) and peat fires (Prosperi et al., 2020), from carbon removals, which are largely associated with processes in managed forests rather than on agricultural land (Grassi et al., 2021).
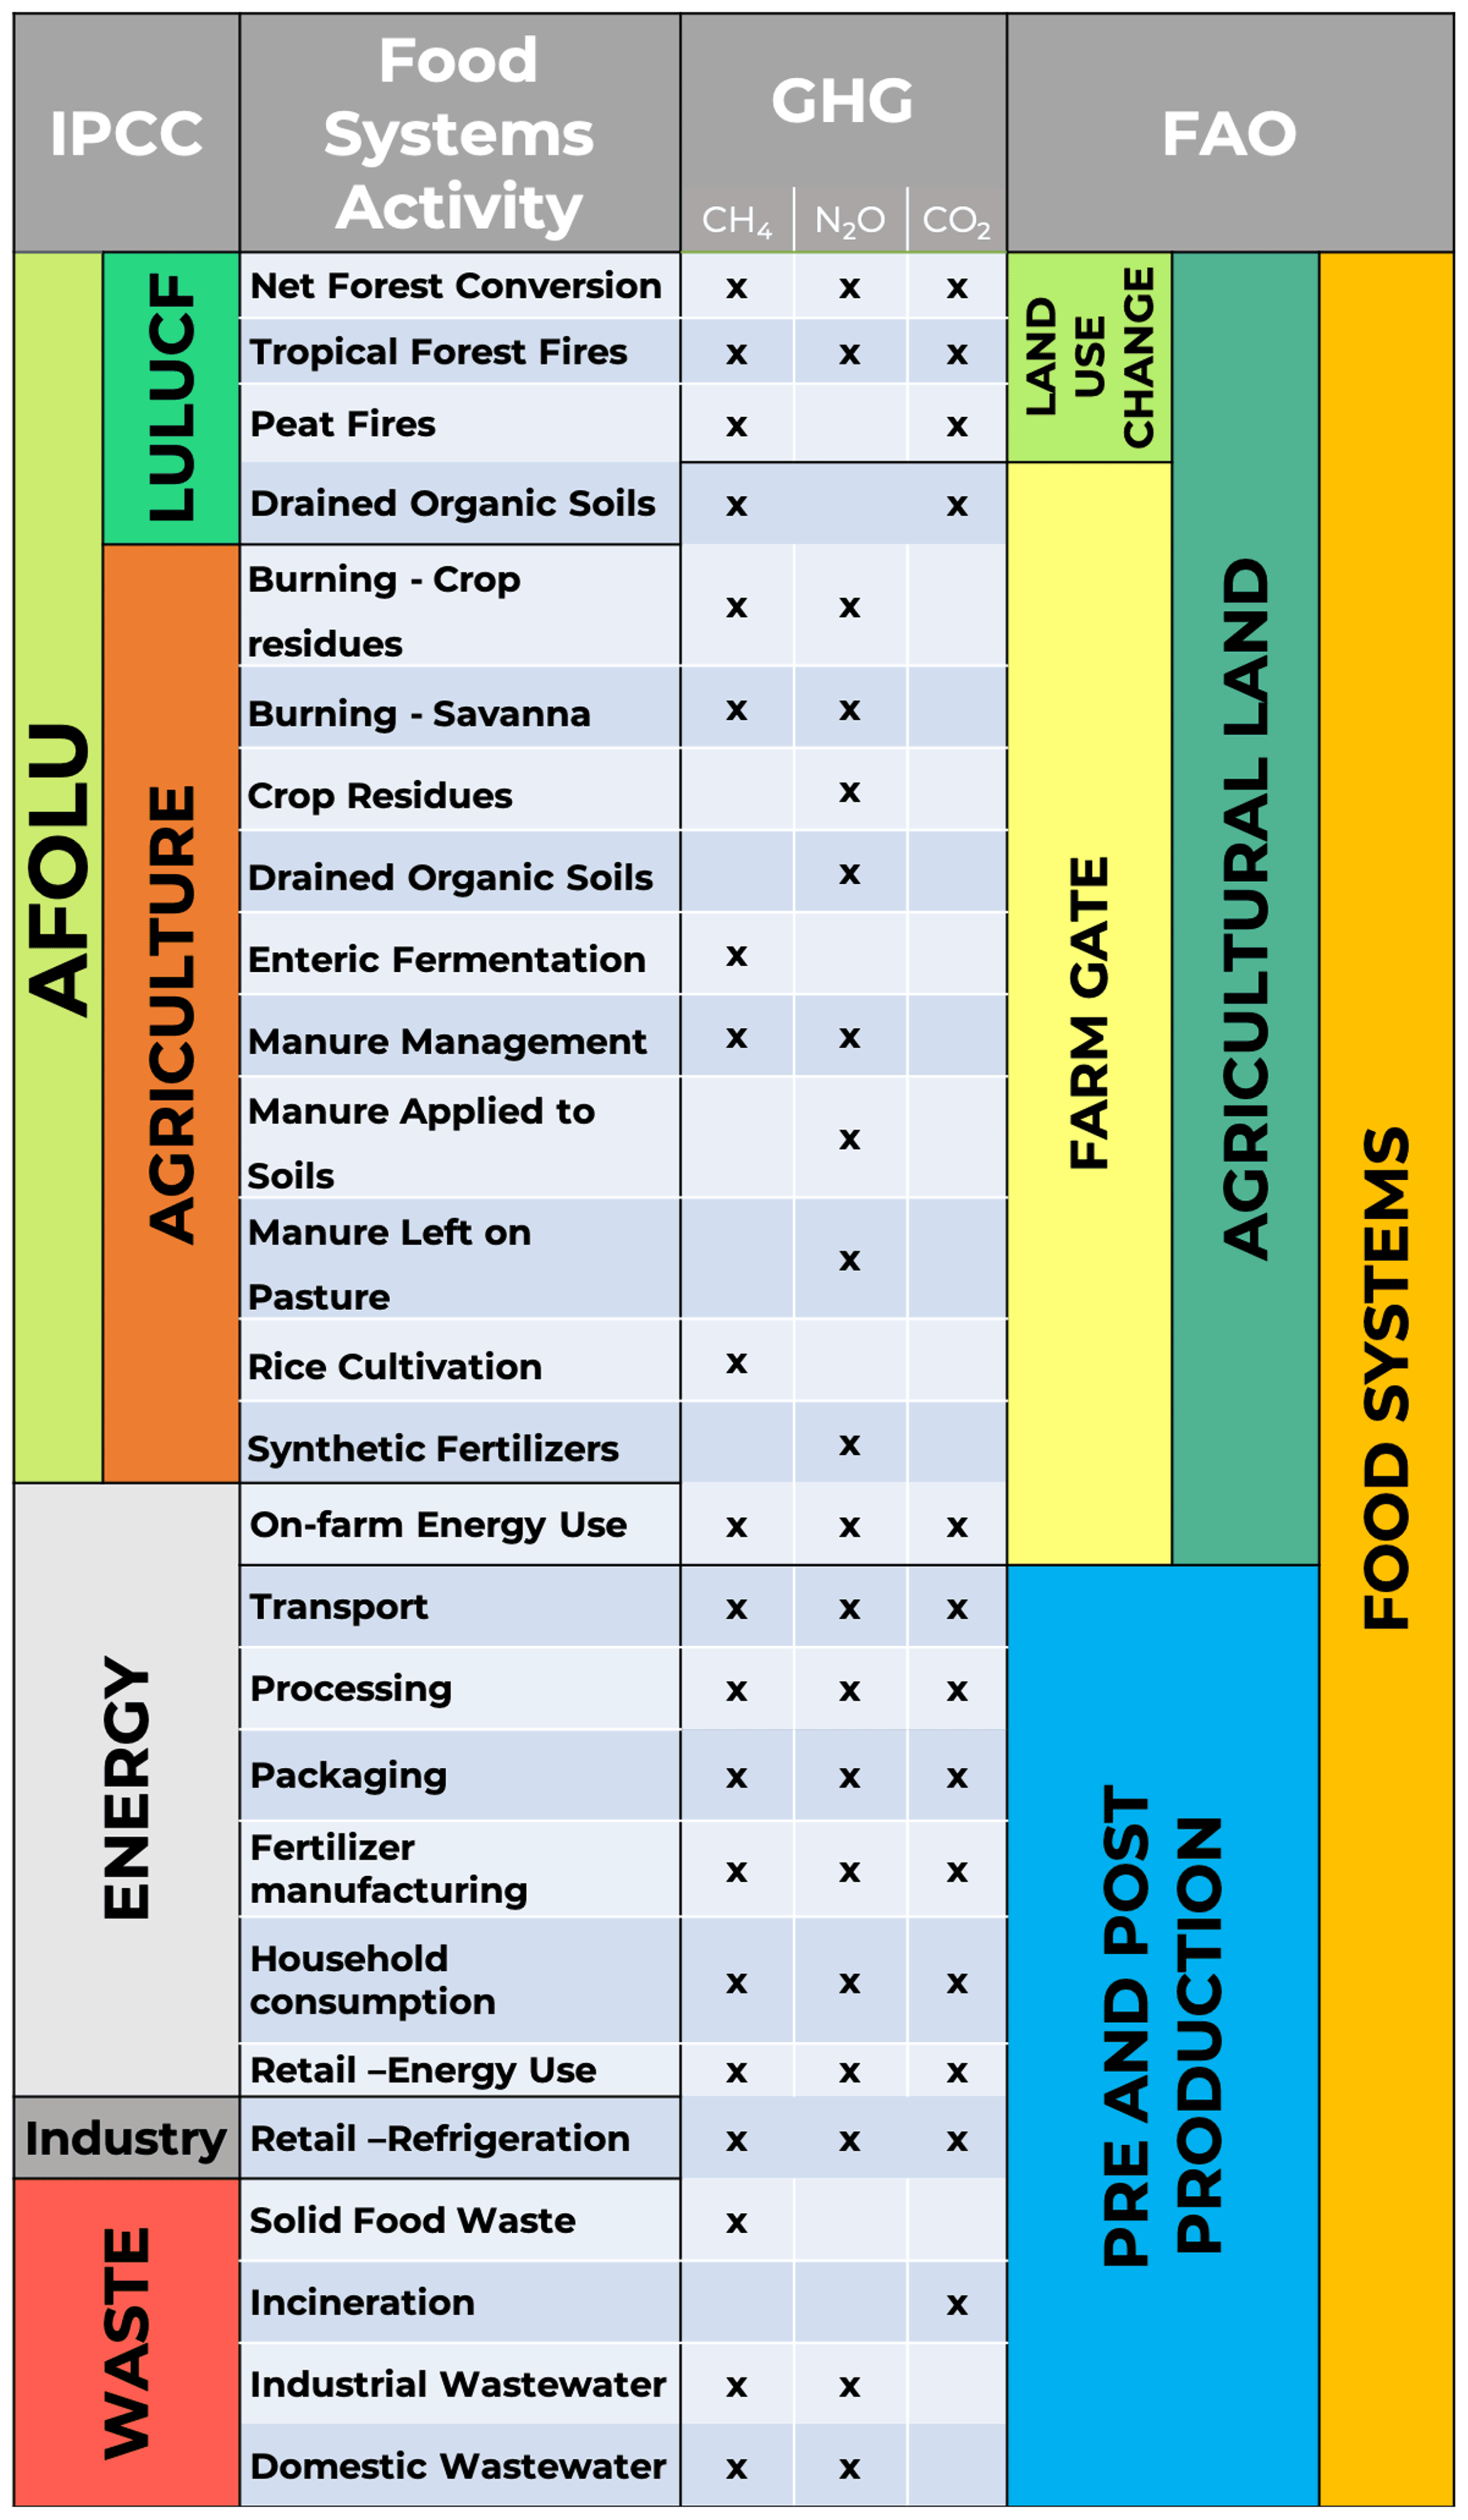
Figure 1Mapping of emissions across agri-food systems. Left: IPCC sectors and processes used in national GHG emissions inventories. Right: food and agriculture sectors and categories aligned to FAO's definitions.
We present herein and discuss results from the first agri-food system emissions database in FAOSTAT. The new database covers, as in previous versions (Tubiello et al., 2013), agriculture production activities within the farm gate and associated land use and land use change emissions on agricultural land. Importantly, it also includes estimates of emissions from pre- and post-production processes along food supply chains, including fertilizer manufacturing, energy use within the farm gate, food processing, domestic and international food transport, retail, packaging, household consumption, and food system waste disposal. The database provides emissions data for four main GHG gases/categories (CO2, CH4, N2O and fluorinated gases) and their combined CO2 equivalent (CO2 eq.) levels. Data are available by country, over the period 1990–2019, as well as by regional and other relevant aggregations. Importantly, data are provided in both IPCC and FAO classifications, facilitating the identification of national mitigation strategies across agri-food systems in countries, regionally and globally.
Recent work (Rosenzweig et al., 2021; Tubiello et al., 2021a) helped to characterize agri-food system emissions into three components: (1) farm gate, (2) land use change and (3) pre- and post-production. Emissions estimates from the first two – generated by crop and livestock production activities within the farm gate and by the conversion of natural ecosystems to agriculture, such as deforestation and peatland degradation – are well established (IPCC, 2019). In particular, FAO disseminates annual updates in FAOSTAT (FAO, 2021a, b; Tubiello, 2019). This paper expands the available FAOSTAT data to include estimates of emissions from pre- and post-production processes, including energy use in fertilizer manufacturing, food processing, packaging, transport, retail, household consumption, and waste disposal.
2.1 Mapping agri-food system components
The new FAOSTAT data are provided, for each country, in both IPCC and FAO classifications. Specifically, on the one hand, data can be downloaded using the following IPCC emissions categories: energy; industrial processes and product use (IPPU, henceforth referred to as industry); waste; agriculture; land use, land use change and forestry (LULUCF); and other. The total emissions from IPCC sectors are provided, as well as the portion directly related to agri-food systems. On the other hand, through the IPCC to FAO mapping discussed above and extending previous work (Tubiello et al., 2021a), data can also be downloaded in relevant FAO categories, covering emissions from farm gate, land use change, and pre- and post-production processes (Fig. 1).
The FAOSTAT emissions estimates follow the IPCC (2006) “territorial approach”; i.e., they are assigned to the countries where they occur, independently of production or consumption considerations. For example, CO2 emissions from energy use in fertilizer manufacturing are accounted for in the producing country, while the N2O emissions from fertilizer used on a country's agricultural land for crop production are accounted for in that country. Similarly, emissions from energy use in agri-food system activities are accounted for in countries where fuel combustion for that particular activity occurs, including electricity generation. The methods applied herein do not cover additional, upstream emissions associated with fuel supply chains, which are therefore not assigned to agri-food systems. More details on the scope of this work are found in Sect. 2.3.
2.2 Emissions estimates
FAO regularly disseminates emissions data for 15 sub-domains in relation to the farm gate and land use change components of agri-food system emissions, with published methodologies and results (i.e., Tubiello et al., 2021a). This paper relies in addition on new methods for computing emissions from pre- and post-production processes. Specifically, methods for emissions from energy use in fertilizer manufacturing, food processing, retail, and household consumption as well as refrigeration in retail are presented in Tubiello et al. (2021b), while Karl and Tubiello (2021a, b) presented methods for estimating agri-food system emissions in transport and waste disposal. Finally, emissions from on-farm energy use were developed by Flammini et al. (2022). We refer the interested reader to those original publications for full details, while for completeness we also provide a sufficiently detailed summary of methods and coefficients as the Supplement of this paper.
More generally, a step-wise approach was followed for the estimation of agri-food system emissions, as follows.
-
Step 1. Identify, for each food system component the relevant international statistics needed to characterize country-level activity data (AD).
-
Step 2. Determine the food-related shares of the activity data (ADfood) and assign relevant GHG emission factors (EFs) to each activity.
-
Step 3. Implement the generic IPCC method for estimating GHG emissions (Efood), using inputs of activity data and emission factors from the first two steps, as follows:
-
Step 4. Impute missing agri-food systems GHG emissions data by component. This step was limited to pre- and post-production processes and applied where country-specific activity data were lacking. The imputation method used PRIMAP, a complete dataset of emissions estimates for all IPCC sectors, by country, covering the period 1990–2019 (Gütschow et al., 2021). The PRIMAP dataset is already available in FAOSTAT for the computation of emissions shares of agriculture to the total anthropogenic total (FAO, 2021c; Tubiello et al., 2021a). It compiles all available information on GHG emissions by country, including from official reporting. It was used internationally as the basis for an early, first-order estimate of agri-food system shares in total GHG emissions (IPCC, 2019). Additionally, it was recently used in a UNFCCC synthesis report (UNFCCC, 2021) to assess world GHG emissions from all sectors in preparation of a stock take exercise that will be undertaken in 2022–2023 to assess countries' performance against their mitigation commitments under the Paris Agreement. The imputations in equation (1) were performed by applying to the PRIMAP sectoral emissions country-specific food system emissions shares (Tubiello et al., 2021b, for more details).
2.3 Global warming potentials used
The estimated emissions data expressed in CH4 and N2O gases were converted to CO2 equivalents by using the 100-year global warming potentials (GWPs) of the IPCC (2014) Fifth Assessment Report and specifically GWP-CH4=28; GWP-N2O =265; GWP-F-gases = 5195. The value for fluorinated gases (F-gases) was obtained as an average of several distinct products (Tubiello et al., 2021b).
2.4 Data uncertainty and limitations
2.4.1 Boundaries
The processes covered herein do not span all processes attributable to agri-food systems. In particular, the scope of this work does not include, by design, upstream GHG emissions in the fuel chain, such as petroleum refining, as well as methane leaks during extraction processes and piping. These are expected to be not negligible if considered. While emissions from such sources can be estimated using a fixed fuel chain coefficient for certain fuel supply chains (see Crippa et al., 2021a), the authors do not consider such sources to be within scope of this work. GHG emissions attributable to electricity generation are included in the scope of this work, which itself excludes upstream GHG emissions in the fuel chain used to generate electricity (Flammini et al., 2022; Tubiello et al., 2021b).
Conversely, emissions of fluorinated gases (F-gases) from household refrigeration and from climate-controlled transportation were not included for lack of available country-level data for disaggregated cold chain elements. However, one estimate suggests that the majority (over 60 %) of global food-related F-gas emissions occur in the retail stage, which is accounted for here in this work (International Institute of Refrigeration, 2021). Emissions from pesticide manufacturing were also not included due to the paucity of information and methodologies for their estimation at the country level, in contrast to advanced work in fertilizer manufacturing (Brentrup et al., 2016, 2018; IFS, 2019). Bellarby et al. (2008) estimated global emissions from pesticides manufacturing to be roughly 72 (range: 3–140) Mt CO2eq yr−1, roughly 1 %–2 % of the pre- and post-production total estimated in this work.
2.4.2 Uncertainty
Uncertainties in FAOSTAT farm gate and land use change emissions estimates have been characterized elsewhere and computed in line with IPCC (2000, 2006) guidelines as ranging 30 %–70 % across component processes. For the purpose of this analysis, we assigned uncertainties of 30 % and 50 % respectively to the farm gate and land use change components of the FAOSTAT agri-food system emissions, in line with previous work (i.e., Tubiello et al., 2013, 2021b). The uncertainties in the estimates of pre- and post-production activities described herein are by contrast less documented. On the one hand, uncertainties in underlying energy activity data and emissions factors are typically lower than for the other two components, ranging 5 %–20 % (Flammini et al., 2022). On the other hand, the relative novelty in estimating food system shares for a range of activity data across many processes makes our estimates more uncertain, with heavy reliance on literature results from a subset of countries and regions that are necessarily extended to the rest of the world (Karl and Tubiello, 2021a). For this reason, we assigned an overall uncertainty of 30 % to the pre- and post-production component. This is higher than the uncertainty of the underlying energy processes but more in line with values used in recent work (Crippa et al., 2021a). As shown below, considering a roughly equal, one-third contribution of the three components and their assigned uncertainties, an overall uncertainty of 40 % was estimated for the agri-food system emissions totals, applicable to countries and regional aggregates.
The above uncertainties are meant only as first rough estimates, useful to determine tentative 95 % confidence intervals for the overall agri-food system component of FAOSTAT emissions. Significantly more research is needed for further refinements in future studies, in particular on better characterizing sub-regional and regional activity data and emissions coefficients, given the diversity in agri-food system typology and their dependence on physical geography and national socio-economic drivers. These limitations nonetheless reflect the paucity of activity data available to describe agri-food system components and their trends, globally and regionally. While knowledge and data exist for regions and countries such as the EU, USA China and India, much remains to be done in terms of regional and country-specific coverage.
2.4.3 Areas for advancement
Work towards estimating agri-food system emissions at the country level can be advanced in several ways. The present approach could be expanded on by including other country- and region-specific studies that estimate trends in energy consumption across a range of similar activities as proxies – regardless of whether or not they are distinctly related to food. Furthermore, other data sources could help explain and estimate variations in agri-food systems between countries, such as GDP per capita, urbanization levels, proxies for infrastructure and industrial development, and geographic and climate considerations. The development of a methodology to estimate emissions from pesticides could be explored, as it would help complement the understanding of emissions associated with chemical use in agriculture, in addition to fertilizers. Emissions from machinery manufacturing and from upstream GHG emissions in the fuel chain could also be added to further refine the analysis. This work could be further expanded by focusing on specific food commodities – requiring an additional focus on international trade and on supply and demand patterns (Dalin and Rodríguez-Iturbe, 2016). Such analysis would ultimately enable consumers to understand the full carbon footprint of particular commodities across global supply chains, which can facilitate GHG mitigation actions taken at the consumer level (Poore and Nemecek, 2018). Furthermore, it would be also useful to further investigate the increasing role of bioenergy and renewables as important mitigation opportunities in the food sector (Clark et al., 2020, Monforti et al., 2015; Pablo-Romero et al., 2017; Wang, 2014).
3.1 Global trends
The FAOSTAT dataset considered in this study estimates in 2019 total anthropogenic emissions at 52 Gt CO2 eq. yr−1 without land use, land use change and forestry emissions (LULUCF), as well as 54 Gt CO2 eq. yr−1 with LULUCF – consistently with recent estimates (IPCC, 2019). We use the latter figure to compute emissions shares. In 2019 world total agri-food system emissions, expressed in terms of 95 % confidence intervals (CI) determined using an overall uncertainty of 40 %, were 16.5 (CI range: 10–23) billion metric tonnes (Gt CO2 eq. yr−1), corresponding to 31 % (range: 19 %–42 %) of total anthropogenic emissions (Table 1). Of the food system total, global emissions within the farm gate – from crop and livestock production processes including on-farm energy use – were 7.2 (range: 5–9) Gt CO2 eq. yr−1; emissions from land use change, due to deforestation and peatland degradation, were 3.5 (range: 2–5) Gt CO2 eq. yr−1; and emissions from pre- and post-production processes – manufacturing of fertilizers, food processing, packaging, transport, retail, household consumption and food waste disposal – were 5.8 (range: 4–8) Gt CO2 eq. yr−1. Over the study period 1990–2019, agri-food system emissions increased in total by 17 %, though they have remained rather constant since about 2006 (Fig. 2). These trends were largely driven by a doubling of emissions from pre- and post-production processes, while land use emissions decreased by 25 % and farm gate increased only 9 %. In terms of single GHG, pre- and post-production processes emitted the most CO2 (3.9 Gt CO2 yr−1) in 2019, preceding land use change (3.3 Gt CO2 yr−1) and farm gate (1.2 Gt CO2 yr−1) emissions. Conversely, farm gate activities were by far the major emitter of methane (140 Mt CH4 yr−1) and of nitrous oxide (7.8 Mt N2O yr−1). Pre- and post-processes were also significant emitters of methane (49 Mt CH4 yr−1), mostly generated from the decay of solid food waste in landfills and open dumps.
Table 1GHG emissions (Mt CO2 eq.) by agri-food system component for all processes considered in this work. Data on forestland removals are provided for completeness of land-based emissions available in FAOSTAT. Uncertainties (not shown) are estimated at 30 % for farm gate and pre- and post-production components and at 50 % for land use change processes.
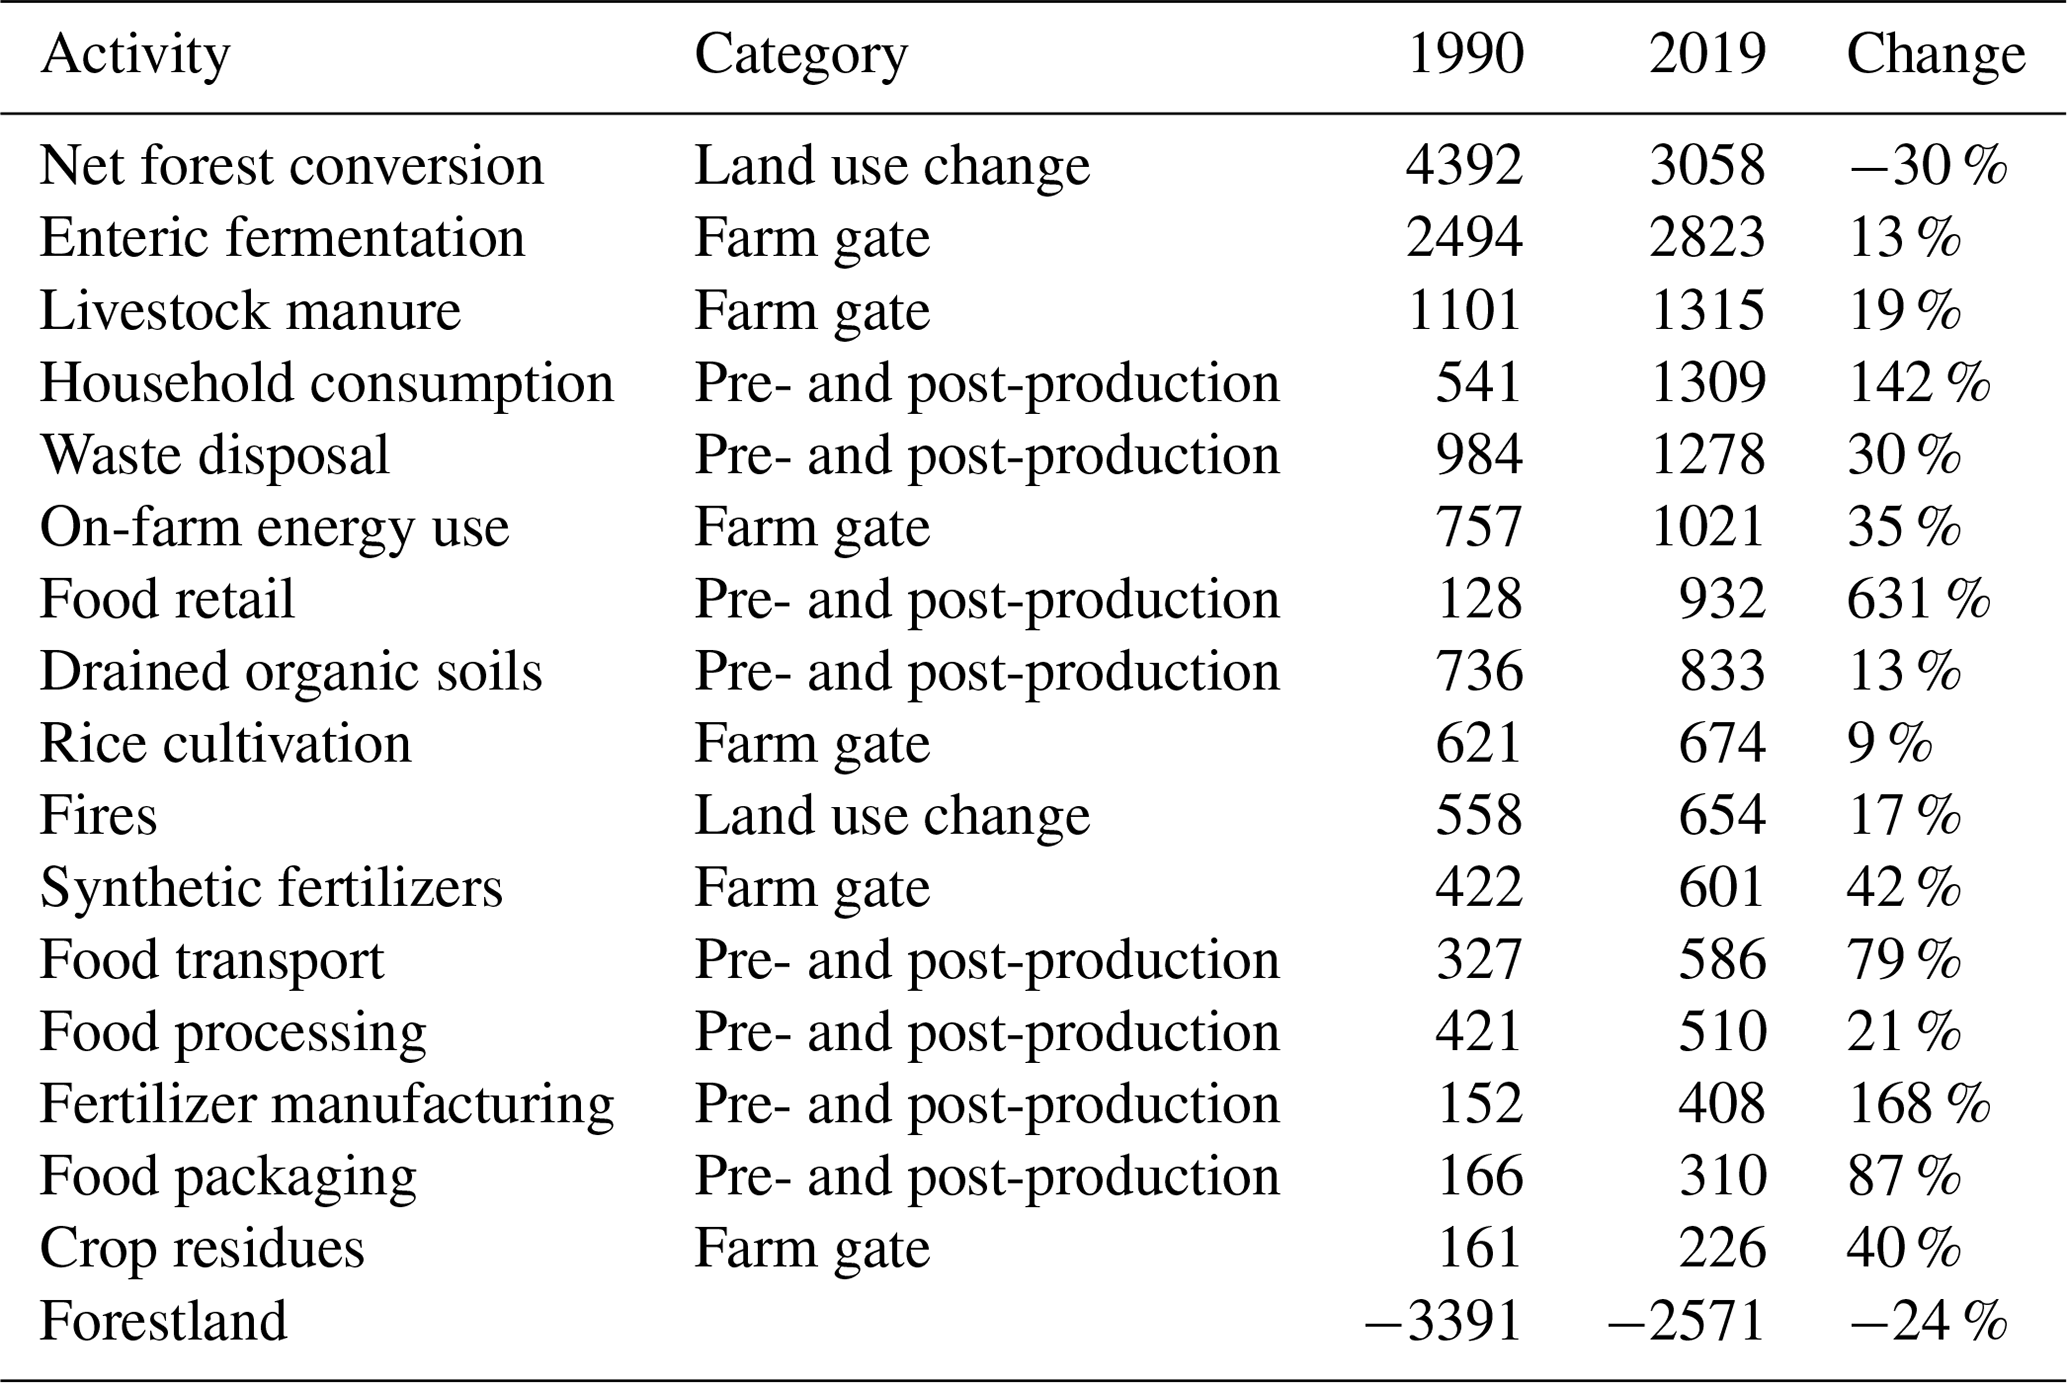
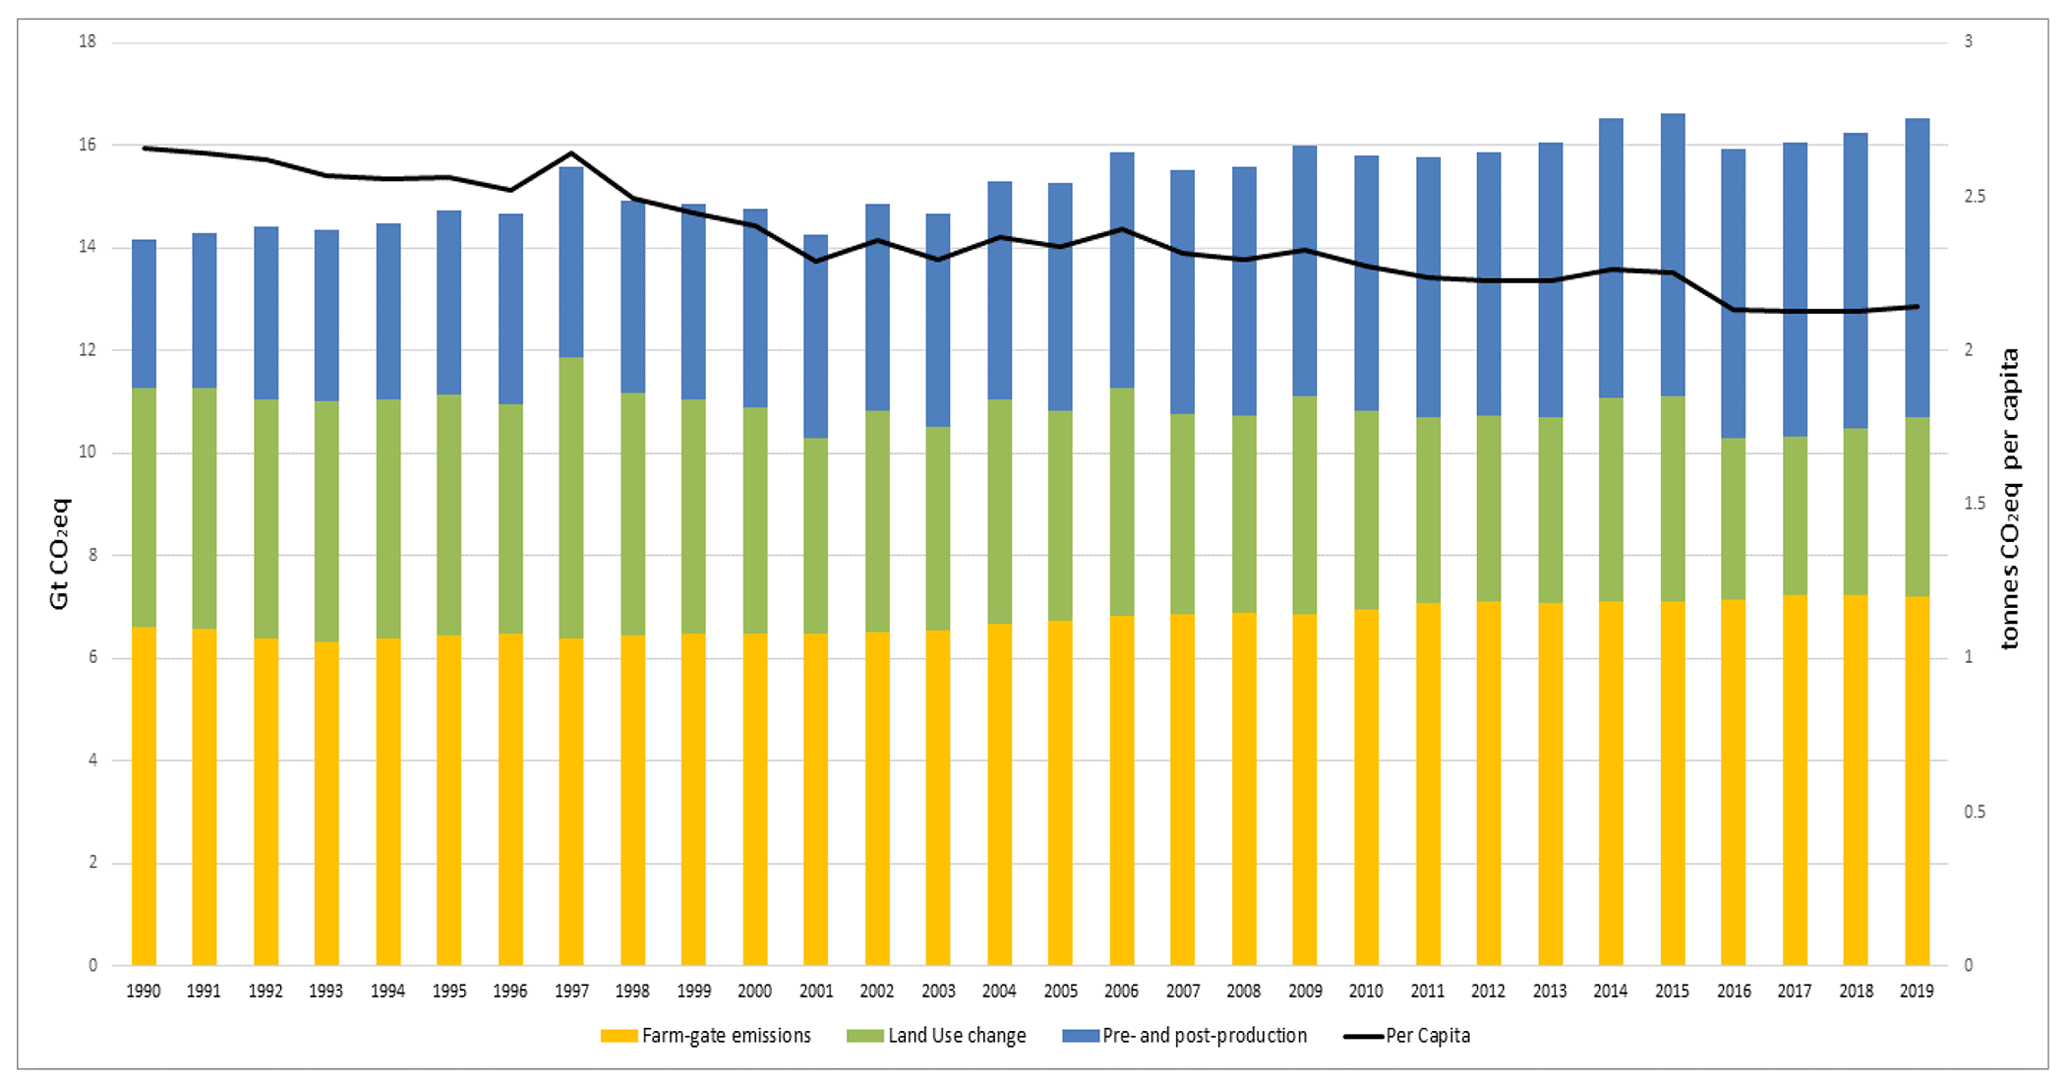
Figure 2World total GHG emissions from agri-food systems, 1990–2019. Color bars show contributions by emissions within the farm gate (yellow); land use change (green) and pre- and post-production along food supply chains (blue). Source: FAOSTAT (FAO, 2021a). Also shown are emissions per capita (authors' own calculations).
Emissions from within the farm gate and those due to related land use processes, including details of their sub-components, have been discussed in Tubiello et al. (2021a) and are regularly presented within FAOSTAT statistical briefs (e.g., FAO, 2020a, 2021b). Here we provide a detailed discussion of the components of agri-food system emissions from pre- and post-production activities along supply chains and their relative contribution to the food system totals (Fig. 3). Considering that the uncertainties used above are rough estimates, we will not report uncertainties in the following analysis. Our data show that in 2019 emissions from deforestation were the single largest emission component of agri-food systems, at 3.1 Gt CO2 yr−1, having decreased 30 % since 1990. The second most important components were non-CO2 emissions from enteric fermentation (2.8 Gt CO2 eq. yr−1), with increases of 13 %. These were followed by emissions from livestock manure (1.3 Gt CO2 eq. yr−1) and several pre- and post-production emissions, including CO2 from household consumption (1.3 Gt CO2 eq. yr−1), CH4 from food waste disposal (1.3 Gt CO2 eq. yr−1), mostly CO2 from fossil-fuel combustion for on-farm energy use (1.0 Gt CO2 eq. yr−1), and CO2 and F-gases emissions from food retail (0.9 Gt CO2 eq. yr−1). Importantly, our data show that growth in pre- and post-production components was particularly strong, with emissions from retail increasing from 1990 to 2019 by more than 7-fold, while emissions from household consumption more than doubled over the same period.
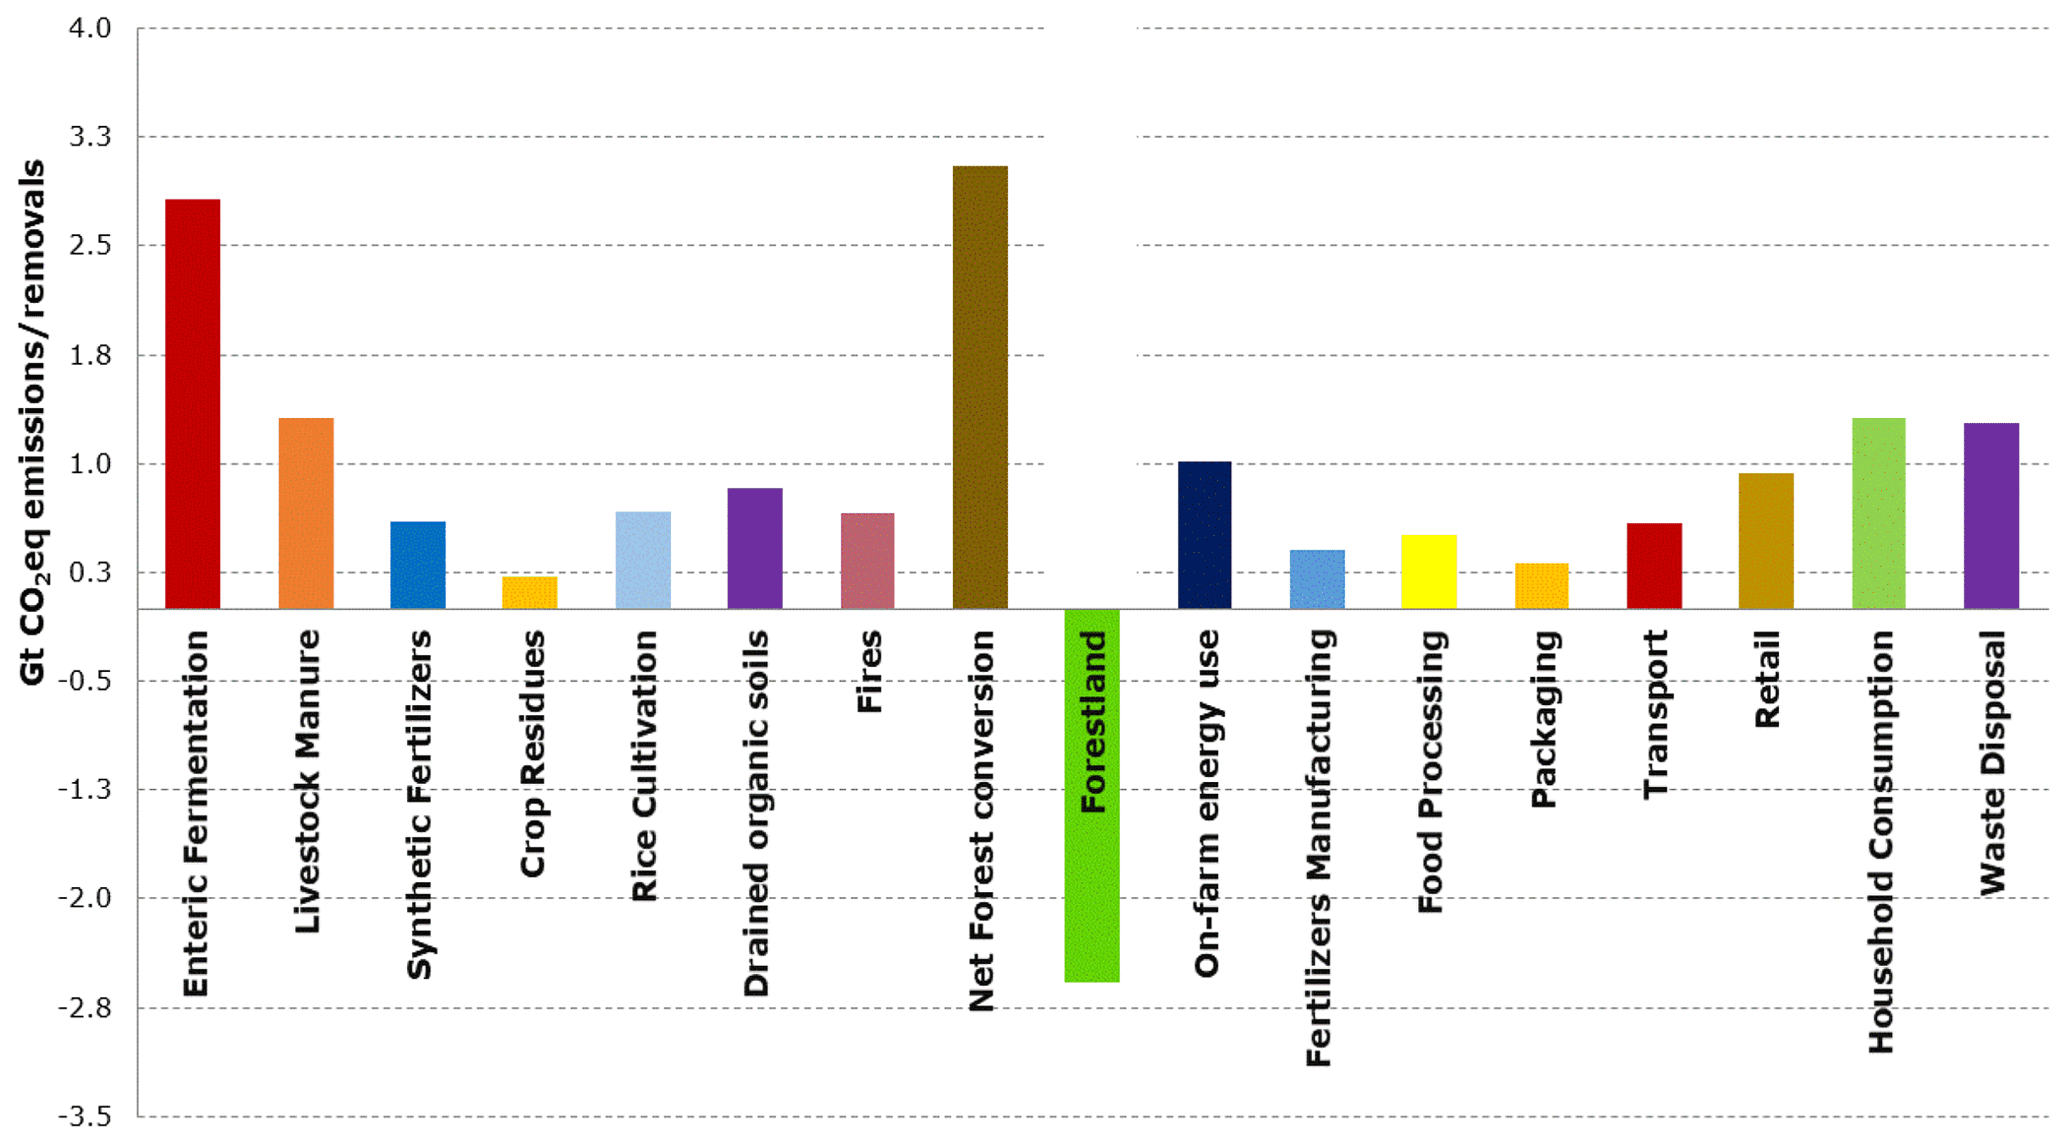
Figure 3World total 2019 GHG emission from agri-food systems, showing contributions on agricultural land (left panel) and from pre- and post-production along food supply chains (right panel). Net removals on forest land are also shown, for completeness. The sum of emissions from agricultural land and forest land correspond to the IPCC AFOLU category. Source: FAOSTAT (FAO, 2021a).
Finally, while emissions from agri-food systems increased globally by 16 % between 1990 and 2019, their share in total emissions decreased, from 40 % to 31 %, as did the per capita emissions, from 2.7 to 2.1 t CO2 eq. per capita (Fig. 2).
3.2 Regional trends
Our results indicate significant regional variation in terms of the composition of agri-food system emissions by component (Fig. 4). Specifically, in terms of total agri-food system emissions in 2019, Asia had the largest contribution, at 7 Gt CO2 eq. yr−1, followed by Africa (2.7 Gt CO2 eq. yr−1), South America (2.4 Gt CO2 eq. yr−1) and Europe (2.1 Gt CO2eq yr−1). North America (1.5 Gt CO2eq yr−1) and Oceania (0.3 Gt CO2eq yr−1) were the smallest emitters among regions (Fig. 4). Focusing on GHG emissions beyond agricultural land, pre- and post-production emissions in 2019 were largest in Asia (2.9 Gt CO2 eq. yr−1), followed by Europe and North America (0.8–1.1 Gt CO2 eq. yr−1). Regions also varied in terms of how agri-food system components contributed to the total (Table 2). In 2019, pre- and post-production emissions were the largest food system contributor in Europe (55 %), North America (52 %) and Asia (42 %). Conversely, they were smallest in Oceania (23 %), Africa (14 %) and South America (12 %). Additionally, the contribution of pre- and post-production processes along food supply chains significantly increased since 1990, when in no region were they the dominant emissions component. Since then, they doubled in all regions except in Africa – where it remained below 15 %.
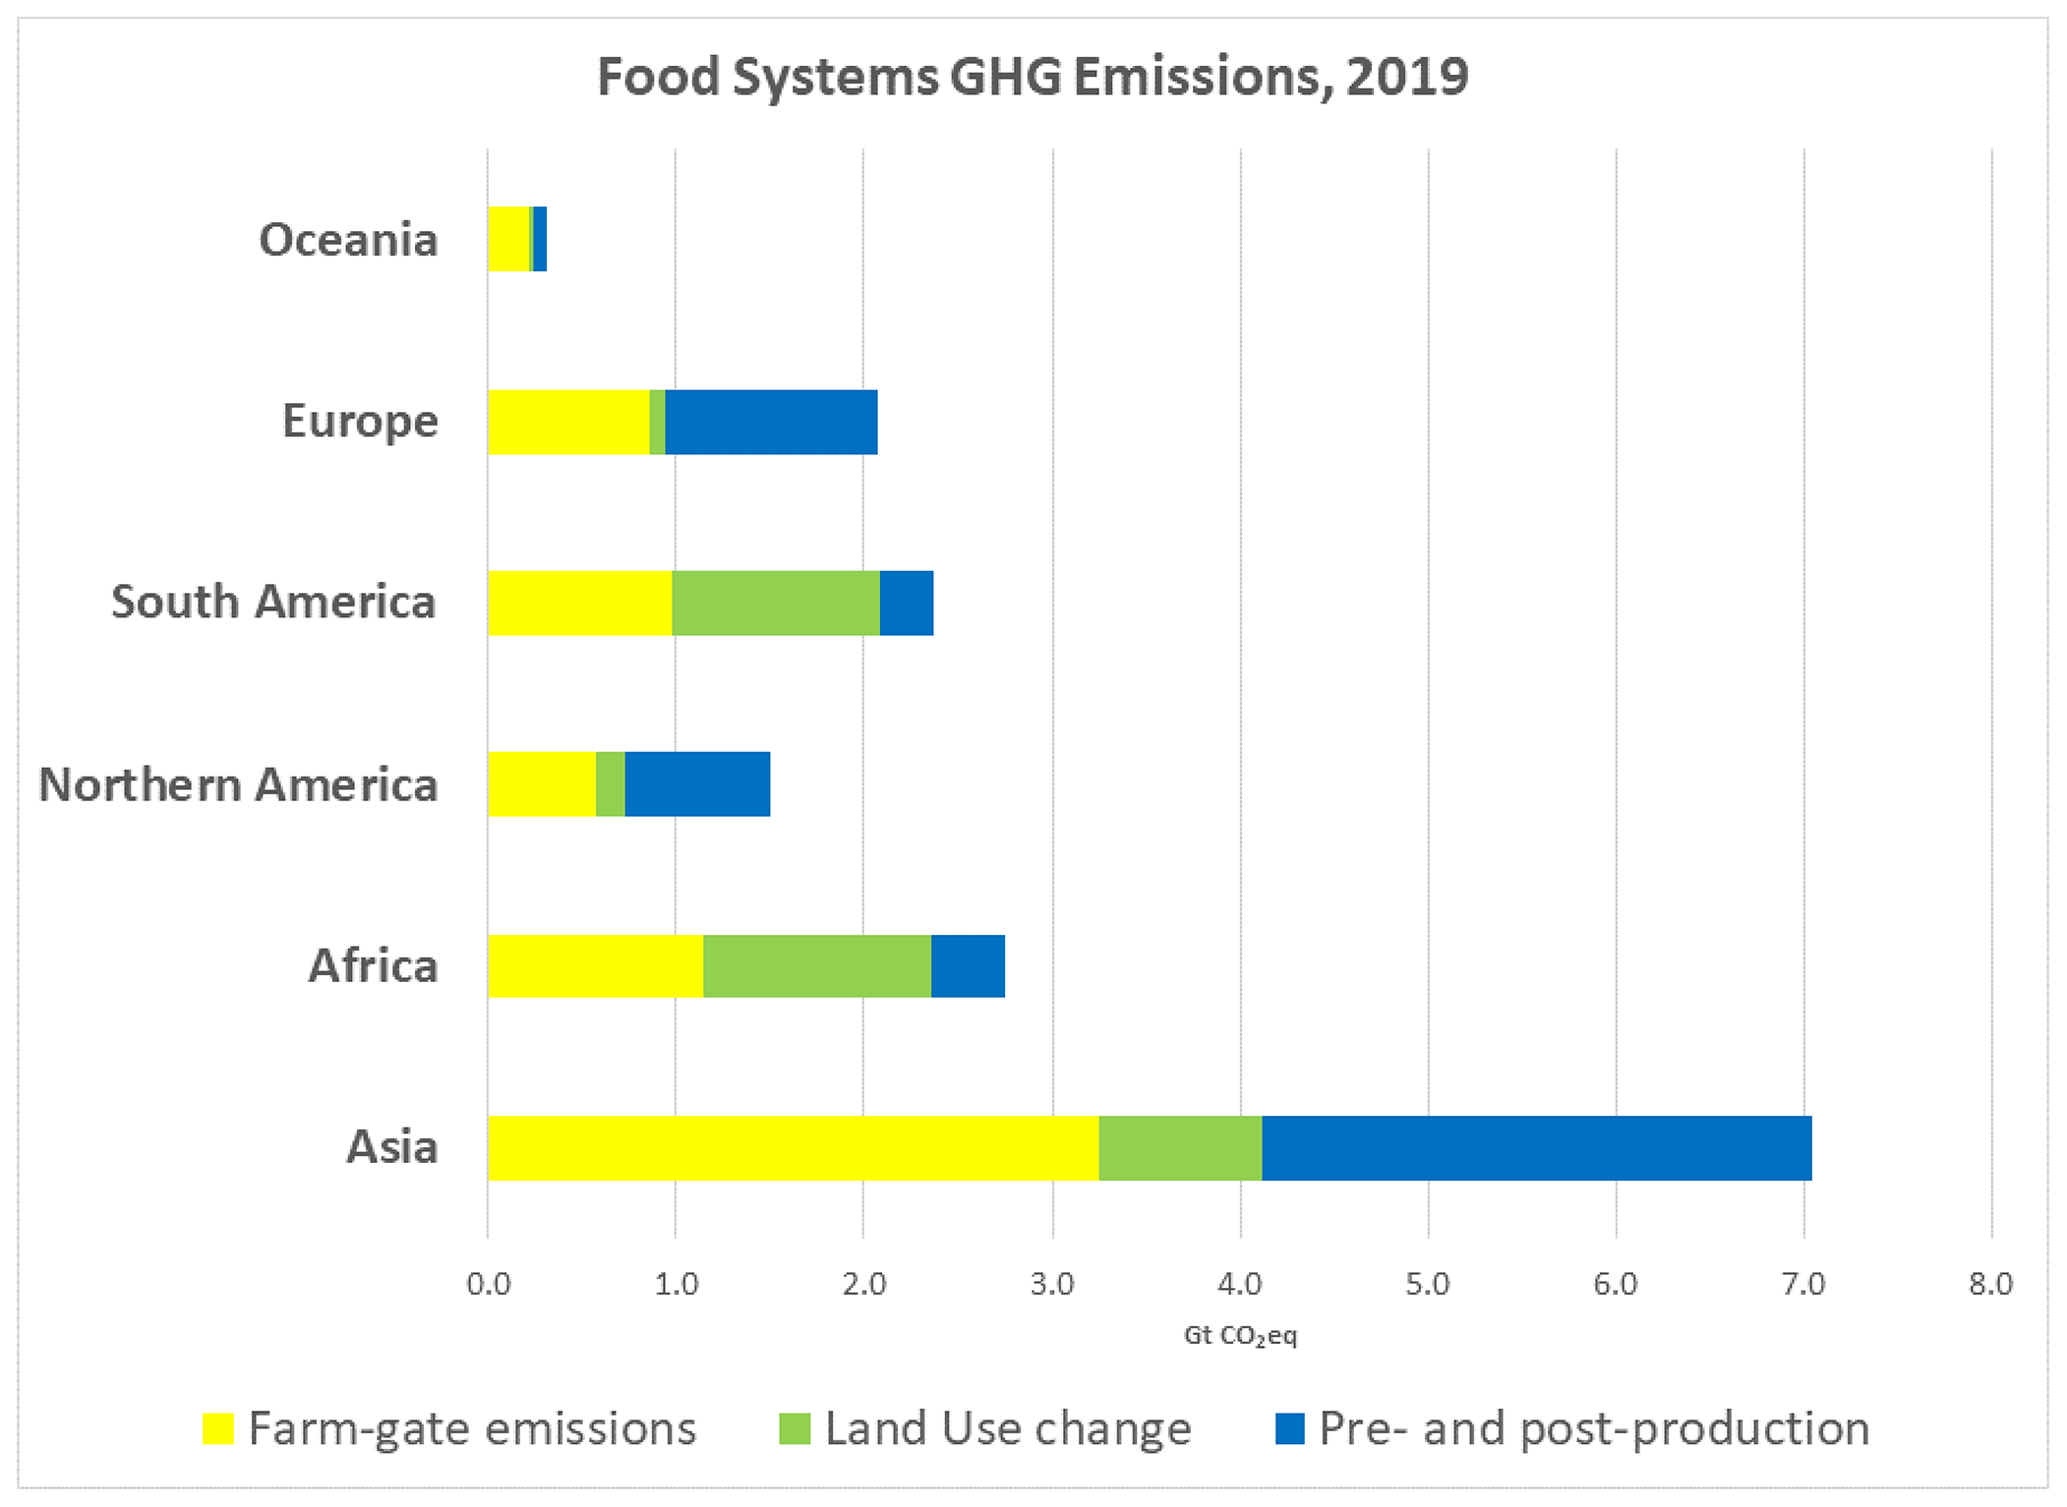
Figure 4Total GHG emission from agri-food systems by FAO regions, 2019. Color bars show contributions by emissions within the farm gate (yellow), land use change (green), and pre- and post-production along food supply chains (blue). Source: FAOSTAT (FAO, 2021a).
Table 2Regional GHG emissions (Gt CO2 eq.) by agri-food system component, showing farm gate, land use change (LUC), pre- and post-production processes (PPPs), and total emissions percentage contribution of PPPs shown for the year 1990 and 2019. The last two columns show the largest estimated contributing PPP activity by region. Uncertainties are estimated to be 30 % for farm gate and PPP activities and 50 % for land use change.
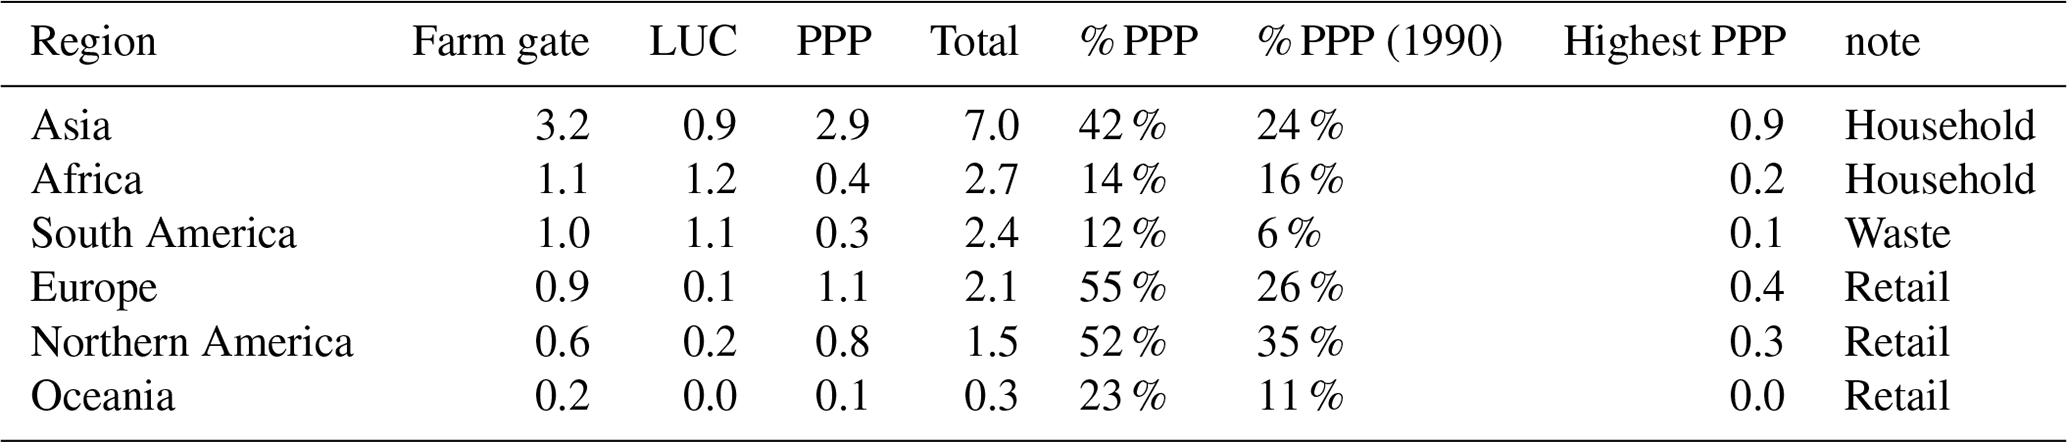
The data show which pre- and post-production process was most important by region (Table 2). In 2019, food household consumption was the dominant process outside of agricultural land emissions in Asia (0.9 Gt CO2 eq. yr−1) and Africa (0.2 Gt CO2 eq. yr−1). Conversely, Europe, Oceania and North America pre- and post-production processes were led by emissions from food retail (0.3–0.4 Gt CO2 eq. yr−1), while South America was dominated by emissions from food waste disposal (0.2 Gt CO2 eq. yr−1).
3.3 Country trends
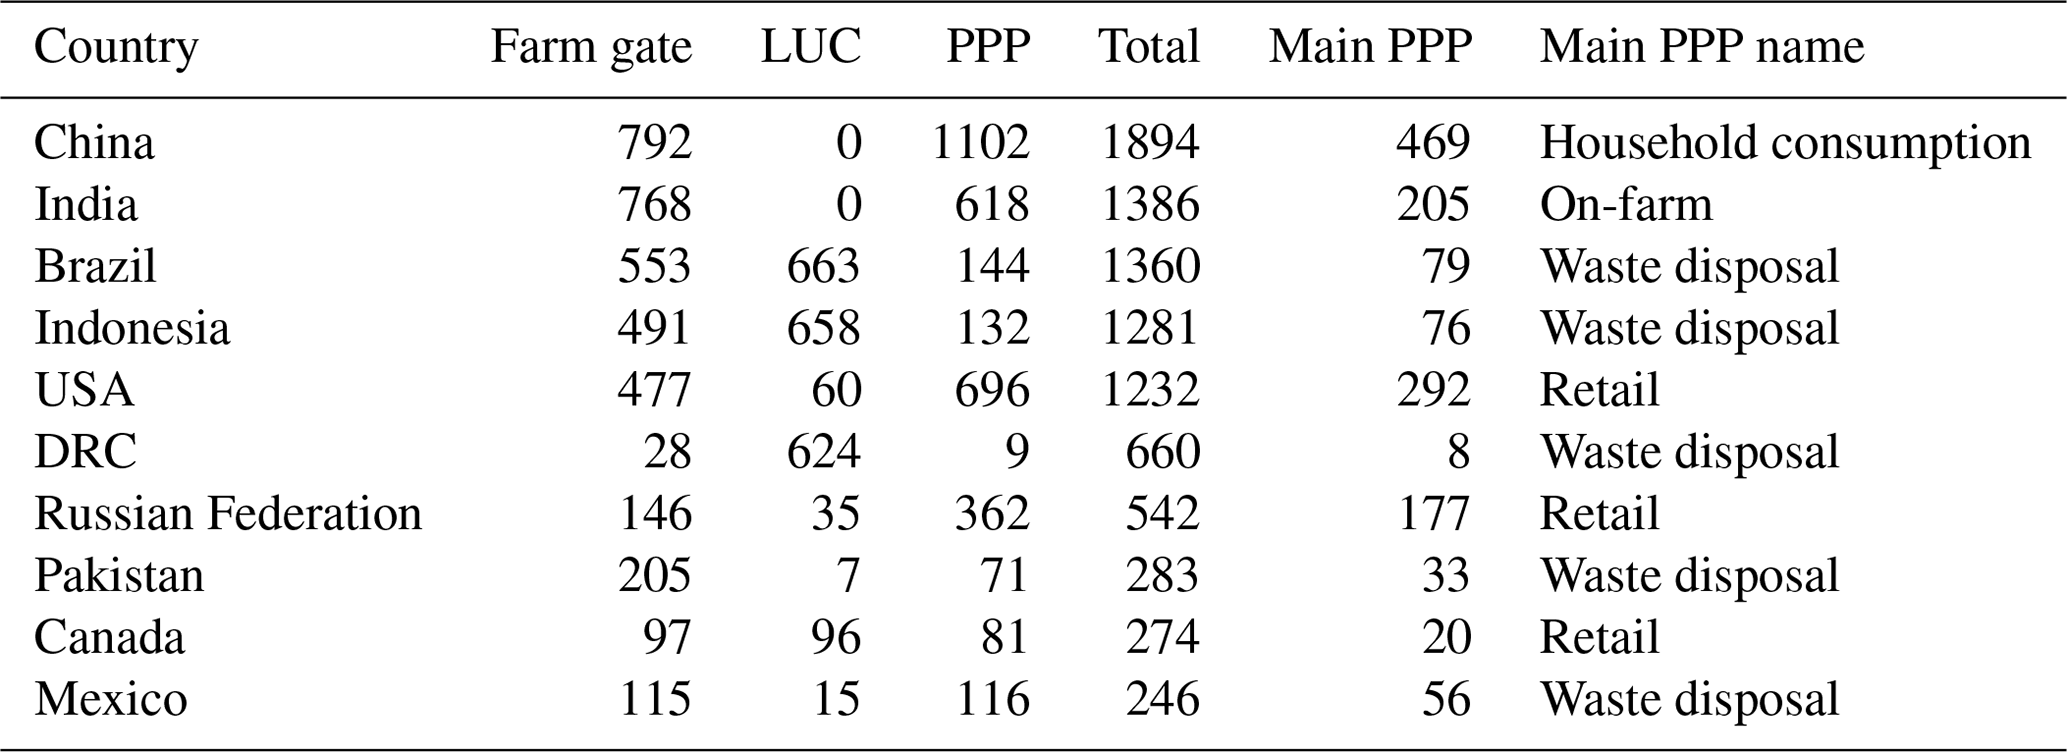
Our estimates show a marked variation among countries in terms of total emissions as well as the composition of contributions across farm gate, land use change, and pre- and post-processing components (Fig. 5). China had the most emissions (1.9 Gt CO2 eq. yr−1), followed by India, Brazil, Indonesia and the USA (1.2–1.3 Gt CO2 eq. yr−1). The Democratic Republic of the Congo (DRC) and the Russian Federation followed with 0.5–0.6 Gt CO2 eq. yr−1, followed by Pakistan, Canada and Mexico with 0.2–0.3 Gt CO2eq yr−1. The contribution of the three main agri-food system components to the national total differed among countries significantly (Fig. 5). For instance, China and India had virtually no contribution from land use change to agri-food system emissions. The land use contribution was also minor in the USA, the Russian Federation and Pakistan. Conversely, the latter was the dominant emissions component in Brazil, Indonesia and the DRC. Additionally, the new database allowed for an in-depth analysis by country of pre- and post-production emissions along the agri-food chain, highlighting a significant variety in most relevant sub-process contribution (Table 3). For the year 2019, pre- and post-production emissions were dominated in China by food household consumption processes (463 Mt CO2 eq. yr−1), whereas food waste disposal was the dominant pathway in Brazil, Indonesia (77 Mt CO2 eq. yr−1), DRC (8 Mt CO2 eq. yr−1), Pakistan (33 Mt CO2 eq. yr−1) and Mexico, (56 Mt CO2eq yr−1). Emissions from food retail dominated the pre- and post-production component in the USA (292 Mt CO2 eq. yr−1), the Russian Federation (177 Mt CO2 eq. yr−1) and Canada (20 Mt CO2 eq. yr−1). Finally, on-farm energy use was the largest pre- and post-production component in India (205 Mt CO2 eq. yr−1).
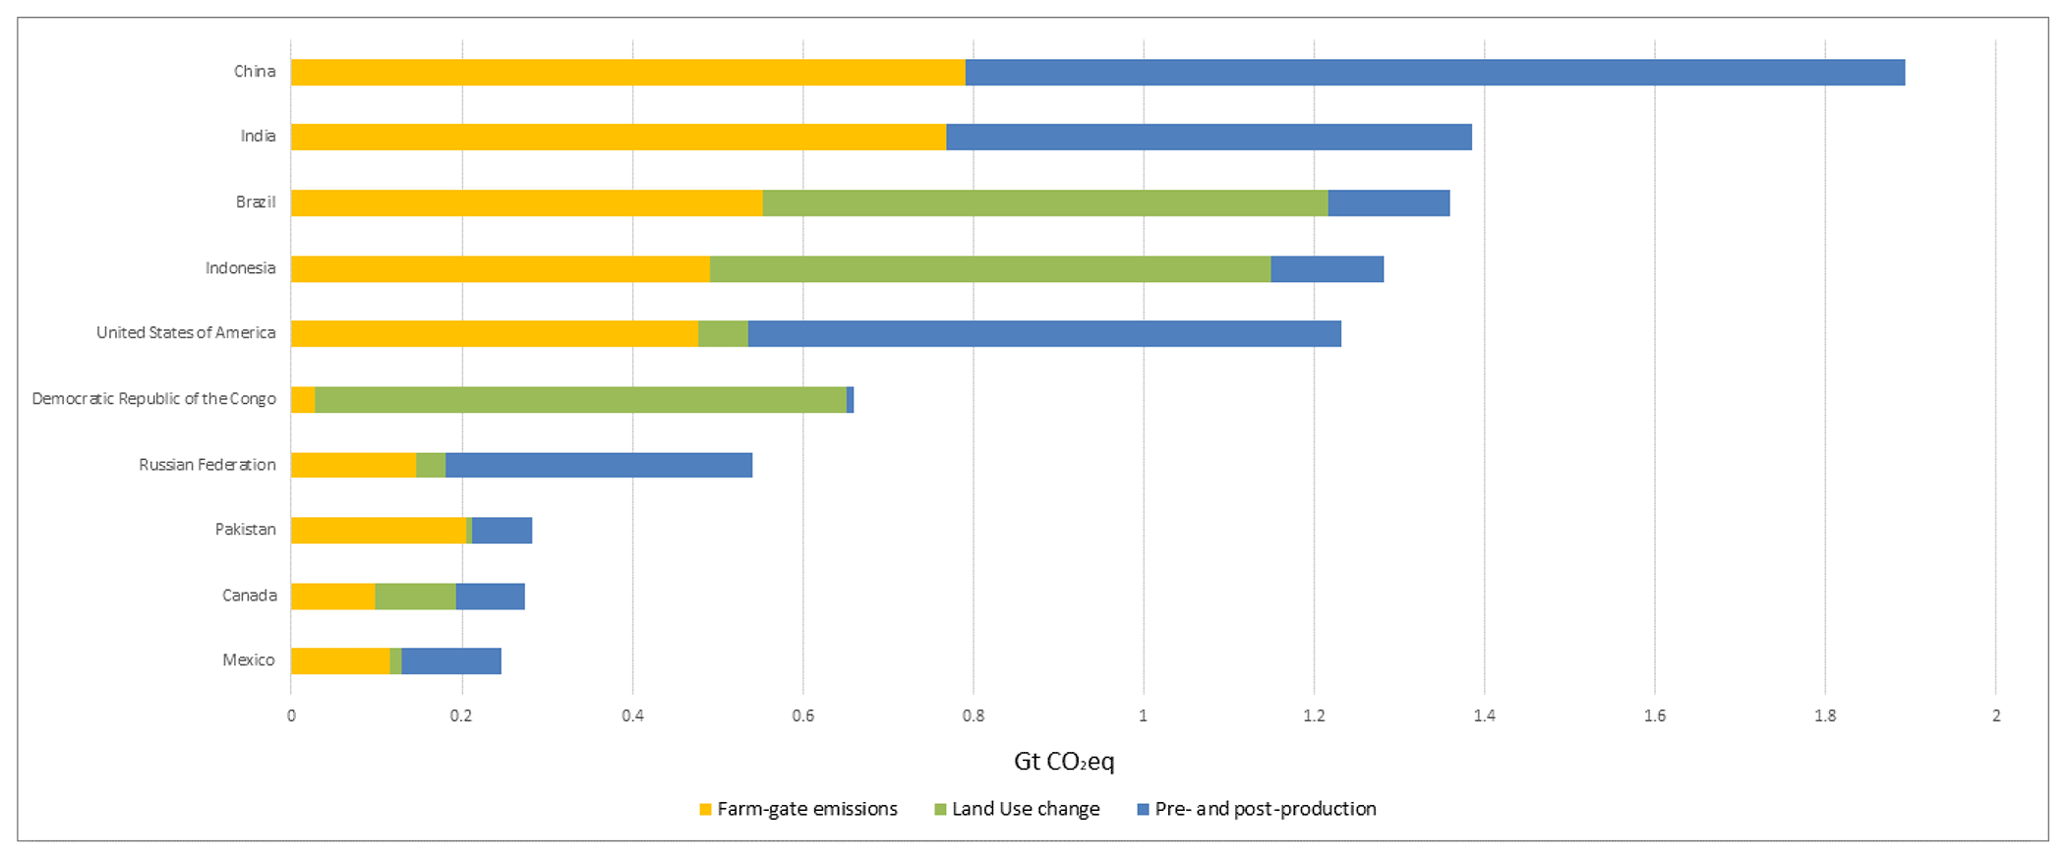
Figure 5Total GHG emission from agri-food systems by country, top 10 emitters, 2019. Color bars show contributions by emissions within the farm gate (yellow), land use change (green), and pre- and post-production along food supply chains (blue). Source: FAOSTAT (FAO, 2021a).
Table 3Top 10 country GHG emissions (Mt CO2 eq.) by agri-food system component and total food system emissions, 2019. The last two columns show the dominant sub-component of pre- and post-production processes. Agri-food system GHG emissions from the top 10 countries represent 55 % of global agri-food system emissions. Country-level uncertainties are those used for global and regional estimates.
4.1 Comparisons with previous work
The overall assessment of total agri-food system emissions found in this work confirms recent previous findings by the IPCC (2019) and Crippa et al. (2021a, b). With regards to pre- and post-production, the FAOSTAT estimates were consistent (Table 4) with previous findings (i.e., Crippa et al., 2021a, b; Vermuelen et al., 2012; Poore and Nemecek, 2018). In particular, emissions estimates for food transport, processing, waste and retail were consistent with EDGAR-FOOD (Karl and Tubiello, 2021b), and estimates for fertilizer manufacturing were in line with previous work by Vermeulen et al. (2012). Conversely, FAOSTAT estimates were higher than EDGAR-FOOD for household consumption and lower for food packaging, with the latter possibly linked to FAOSTAT estimates excluding indirect emissions from fuel supply chains, which were instead included in previously published estimates. Finally, our estimates of F-gas emissions from retail agreed well with those published in EDGAR-FOOD.
Table 4Overview of pre- and post-food production GHG emission estimates from selected studies, Gt CO2eq. Adapted from Tubiello et al. (2021b).
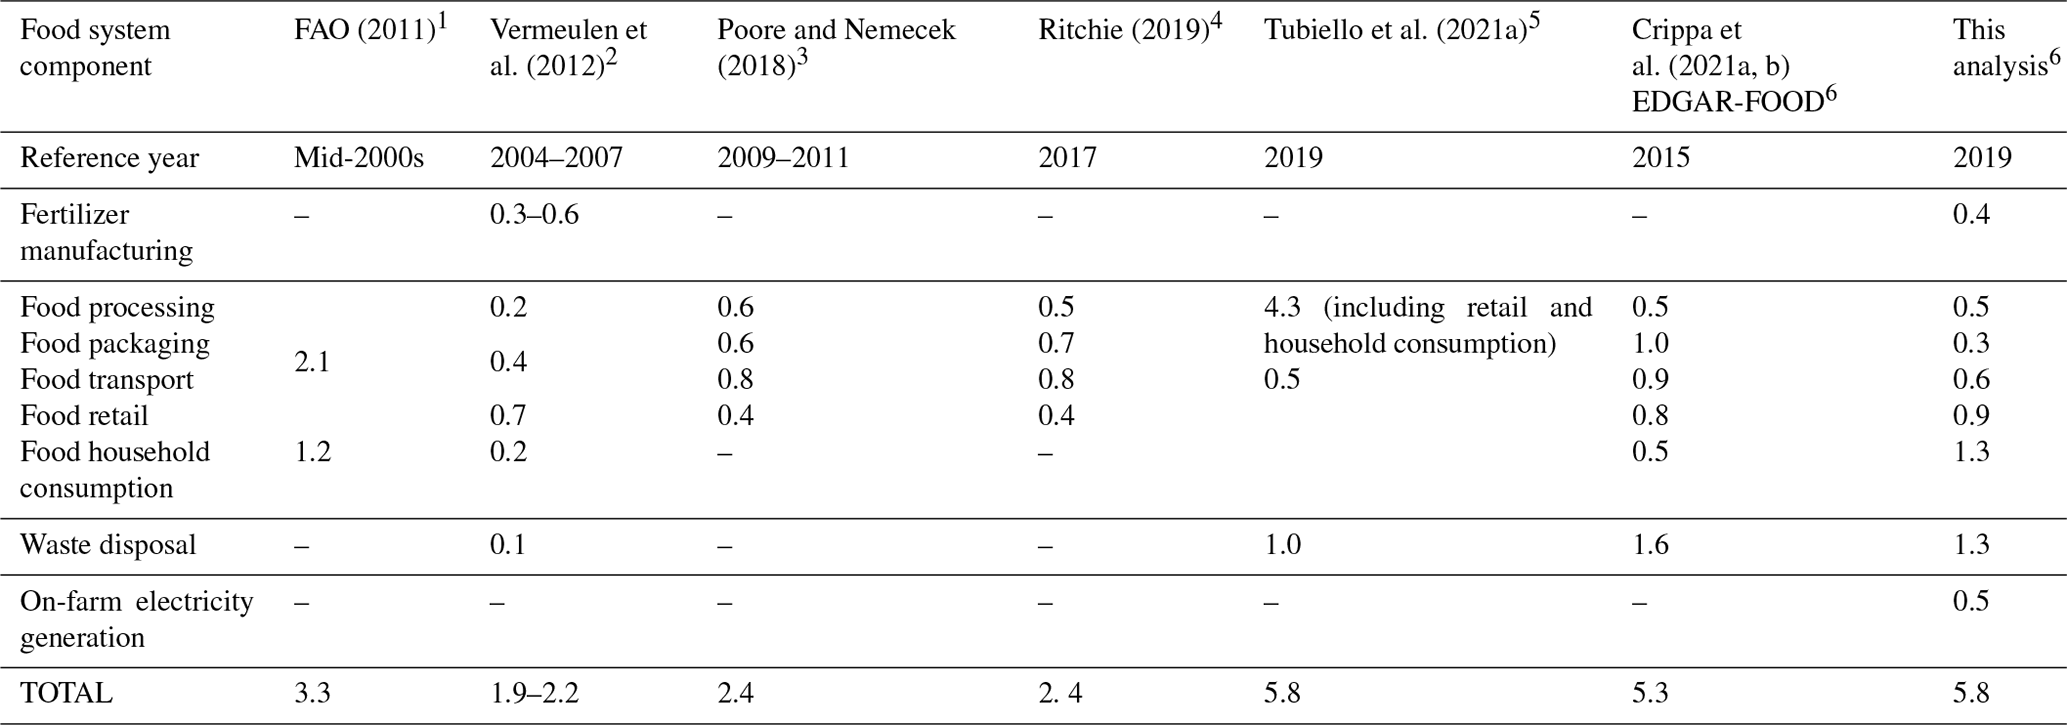
1 Includes emissions from indirect energy inputs (e.g., manufacturing of machinery). Global estimate based on literature. 2 Global estimate based on Chinese and British emission patterns and literature. 3 Meta-analysis of life-cycle assessments. 4 Global estimate based on literature. 5 Global estimate largely based on country-level (bottom-up) analysis (relying on FAOSTAT and EDGAR-FOOD). 6 Global estimate largely based on country-level (bottom-up) analysis.
The most important disagreement with previous work was observed in relation to household consumption emissions. FAOSTAT estimates in this work, 1.2 Gt CO2 eq., were nearly 3 times those of EDGAR-FOOD (with reference to 2015, the last year for which EDGAR data were available). While much more research is needed to refine estimates in this important agri-food system component, our estimates were in fact well aligned with earlier FAO (2011) work (Fig. 4), as well as more consistent with observed population growth, an important determinant of household consumption trends (Tao et al., 2018).
4.2 Trends
One notable trend over the 30-year period since 1990 is the increasingly important role of food-related emissions generated outside of agricultural land, in pre- and post-production processes along food supply chains, at all global, regional and national scales. Our data show that by 2019, pre- and post-production processes had overtaken farm gate processes to become the largest GHG component of agri-food system emissions in Annex I parties (2.2 Gt CO2 eq. yr−1). While farm gate emissions still dominated food system processes in non-Annex I parties, emissions from pre- and post-production were closing the gap in 2019, surpassing land use change and having doubled since 1990 to 3.5 Gt CO2 eq. yr−1. By 2019, pre- and post-production processes had become the largest agri-food system component in China (1.1 Gt CO2 eq. yr−1), the USA (0.7 Gt CO2 eq. yr−1) and the EU-27 (0.6 Gt CO2 eq. yr−1). This has important repercussions for food-relevant national mitigation strategies, such as those included in countries' nationally determined contributions, considering that until recently these have focused mainly on reductions of non-CO2 gases within the farm gate and on CO2 mitigation from land use change (Hönle et al., 2019).
Importantly, the FAOSTAT database presented here allows for an estimation of the percentage share contribution of food system emissions in total anthropogenic emissions, by country as well as at regional and global levels, over the period 1990–2019. A number of important issues can be highlighted to this end (Table 5 and Fig. 6). First, in terms of CO2 eq., the share of world total agri-food system emissions decreased from 40 % in 1990 to 31 % in 2019. Thus, while it is important to note that one-third of all GHG emissions today are generated by agri-food systems, their shares in total emissions may continue to decrease in the near future. This decreasing trend was driven by trends in large regions, consistently with transformations in their agri-food systems and land use change patterns. For instance, in South America, the region with the highest food system share over the entire study period (Fig. 6), food shares decreased from 96 % in 1990 to 72 % in 2019, in Africa from 67 % to 57 %, in Asia from 49 % to 24 %, and in Oceania from 57 % to 39 %. In contrast to these trends, our data suggested that in regions dominated by modern agri-food systems, such as Europe and North America, the overall share of agri-food system emissions in fact increased from 1990 to 2019, specifically from 24 % to 31 % in Europe and from 17 % to 21 % in North America. Such increases could be explained by increases in absolute emissions from pre- and post-production activities (Table 5), re-enforced by concomitant emissions decreases in the non-food sector, especially energy systems (Lamb et al., 2022). The noted increase in absolute emissions from pre- and post-production activities was in fact present in all regions, leading to increases in the relative contributions to agri-food systems of this component, except for Africa.
Table 5Regional GHG emissions (Mt CO2 eq.) by agri-food system component and total food system emissions, 2019. The last two columns show the dominant sub-component of pre- and post-production processes. Uncertainties (not shown) are estimated at 30 % for farm gate and pre- and post-production components and at 50 % for land use change processes.
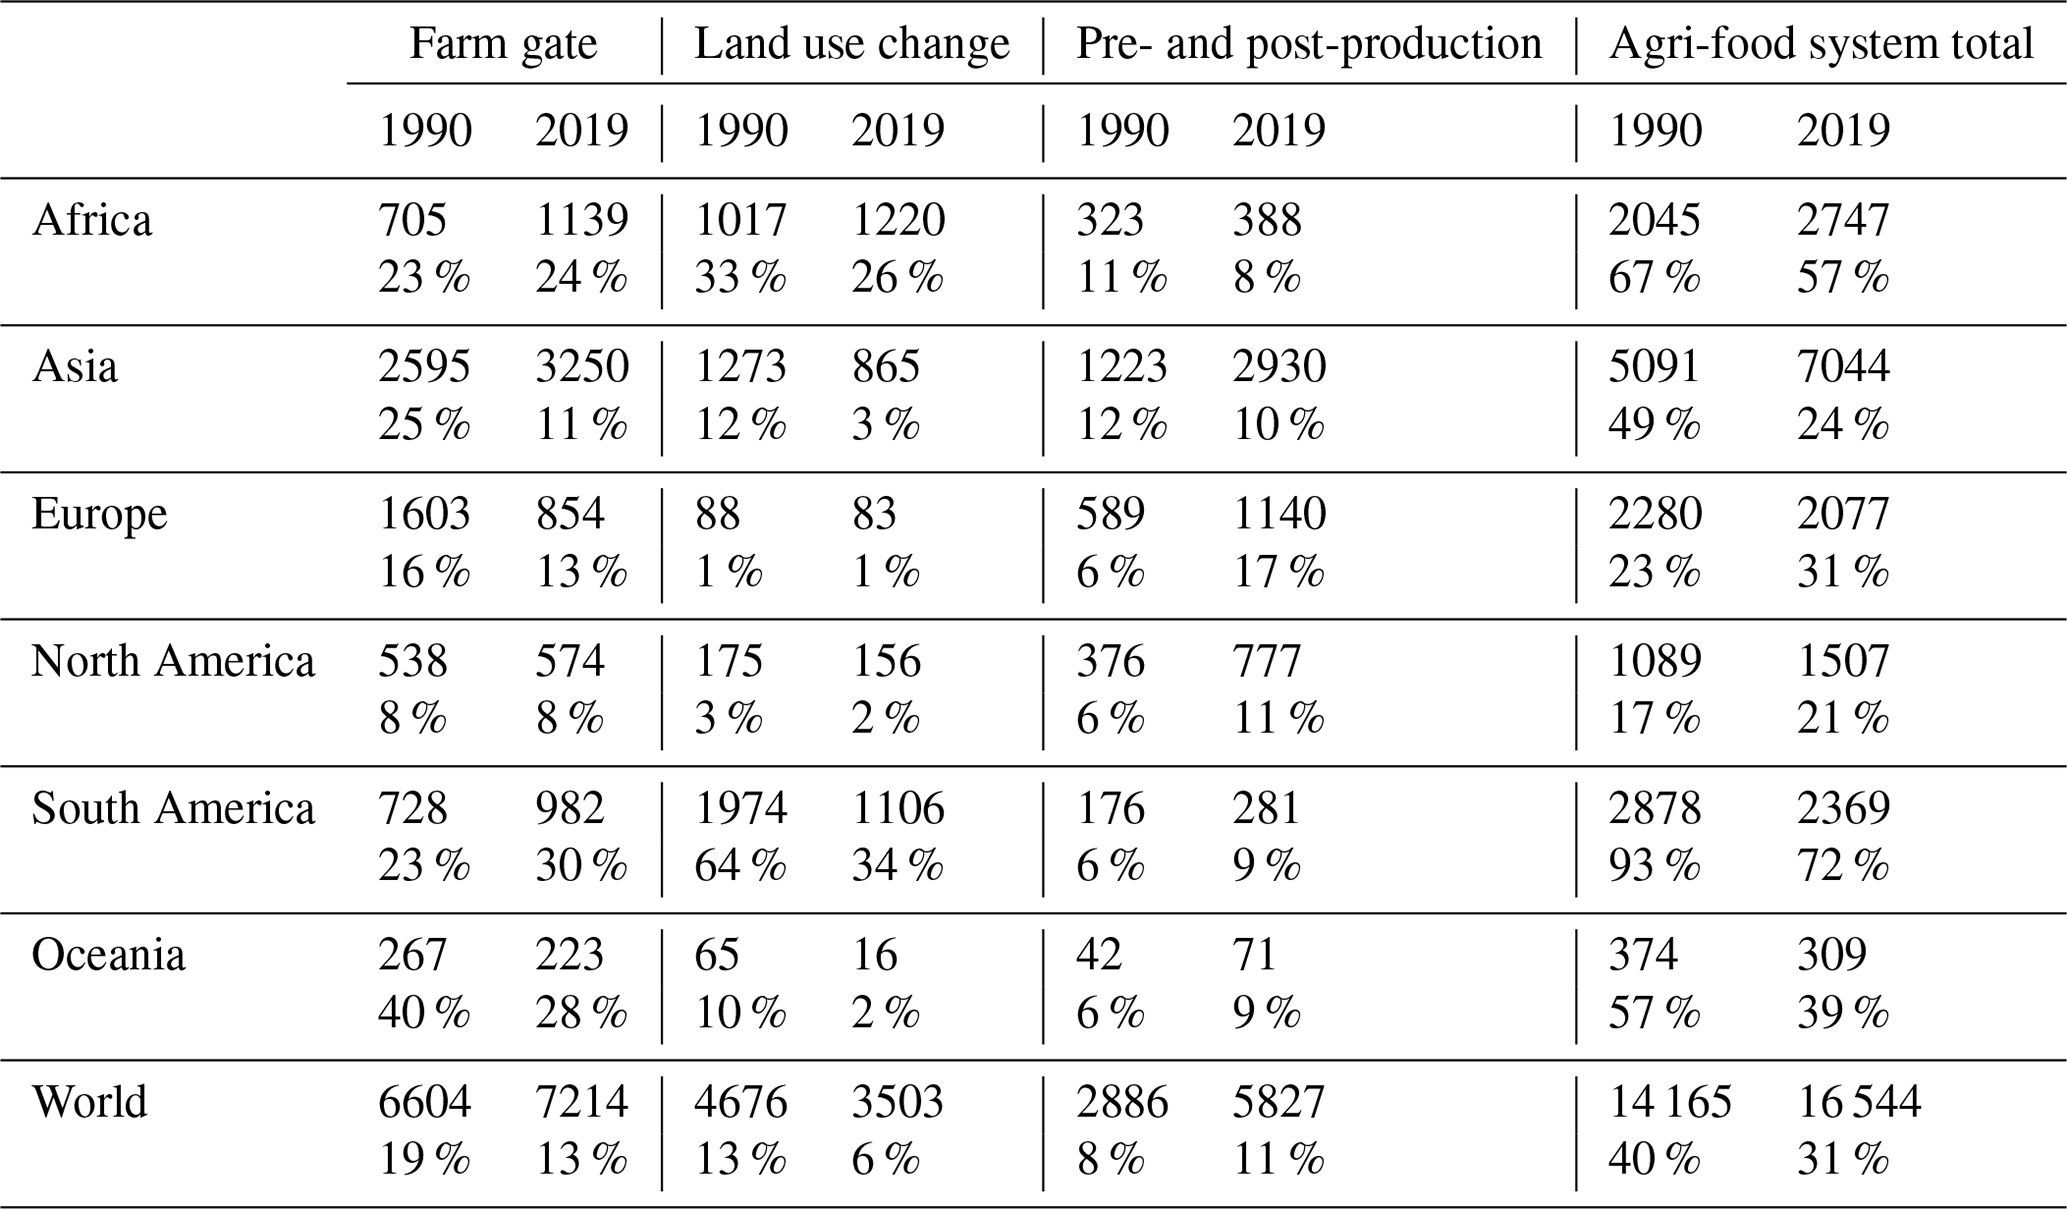
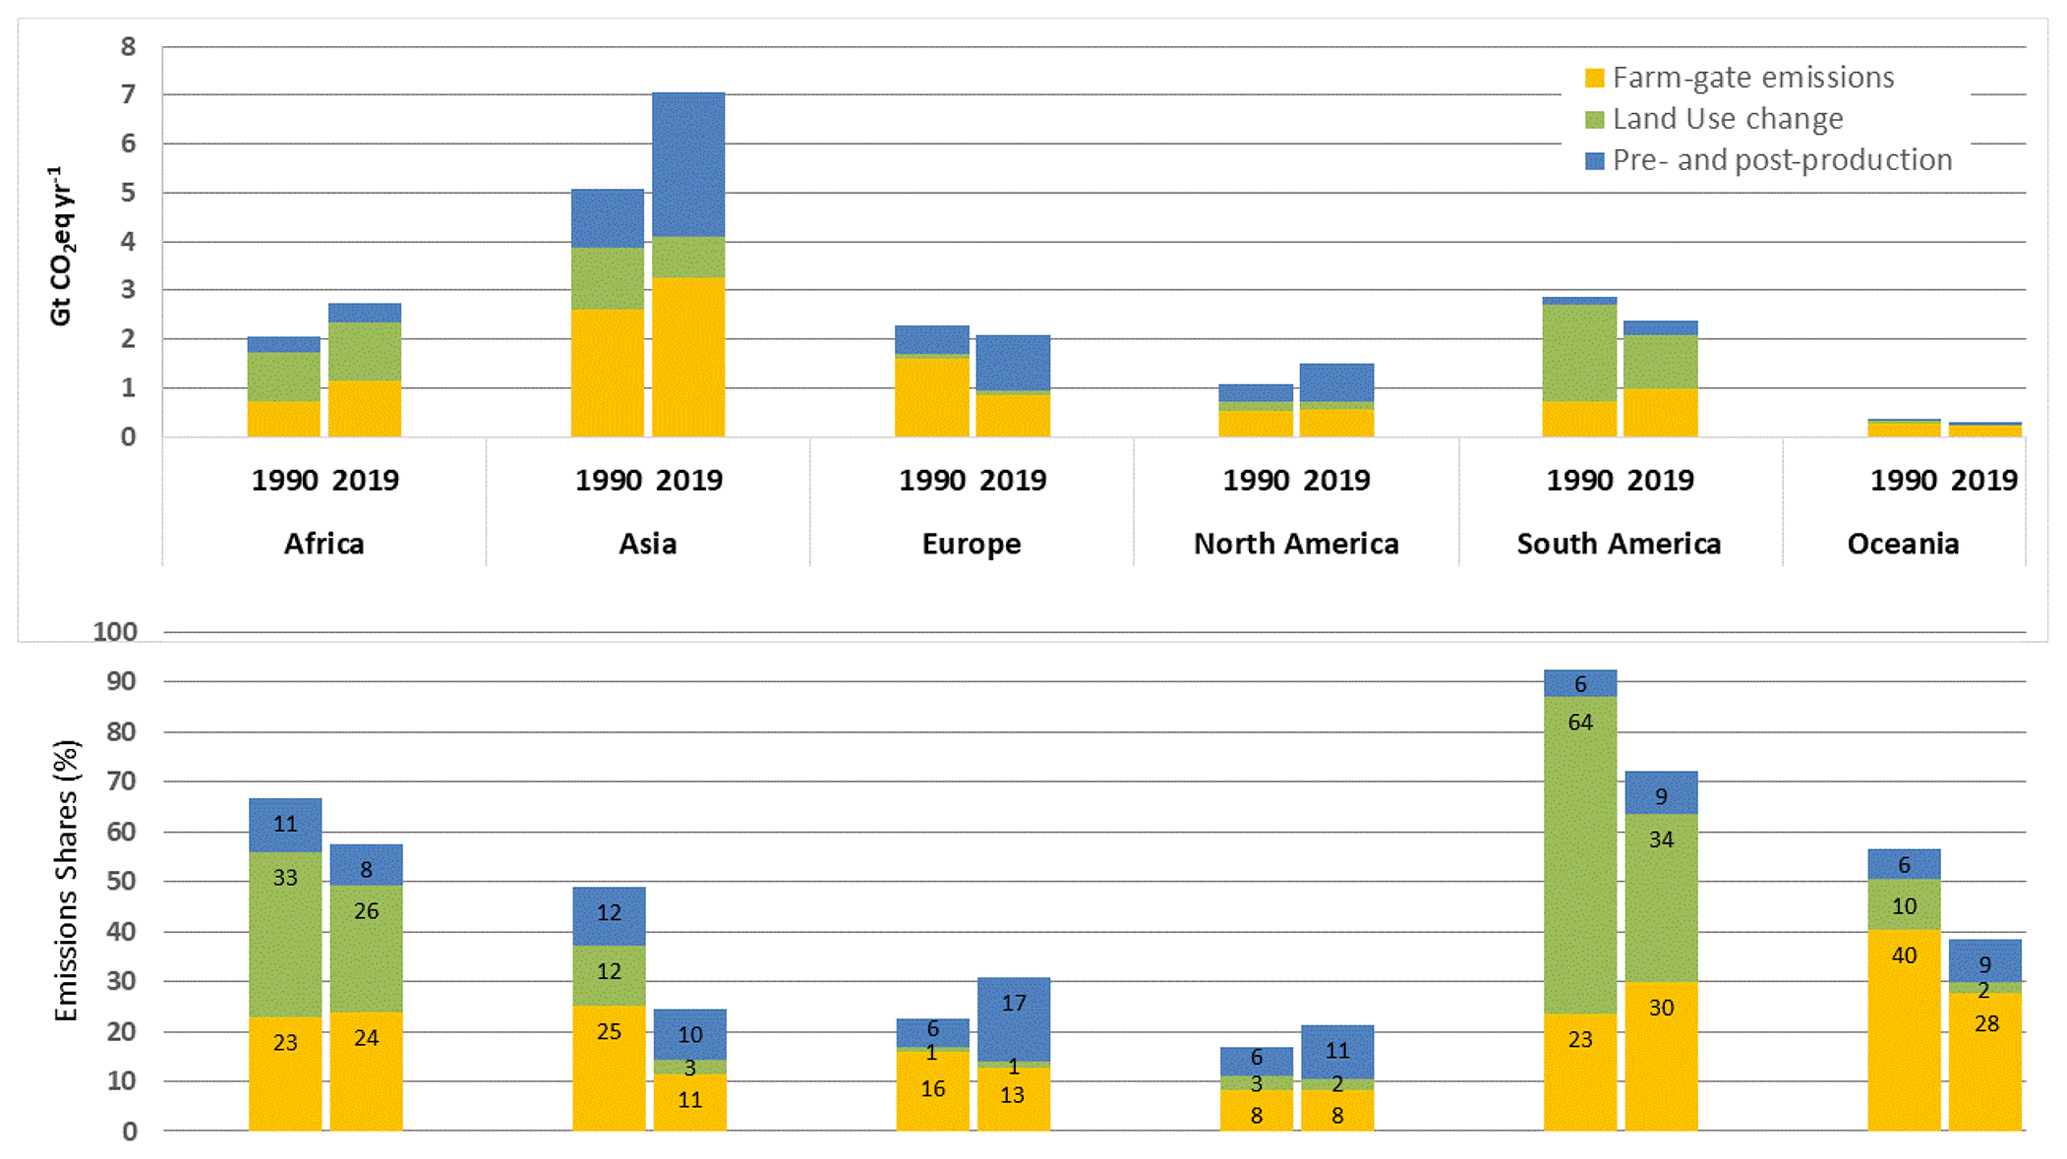
Figure 6Top panel: agri-food system emissions (Gt CO2 eq. yr−1). Bottom panel: shares of agri-food systems in total anthropogenic emissions (%). Data shown by region, 1990–2019. Color bars show contribution components: farm gate (yellow), land use change (green), and pre- and post-production along food supply chains (blue). Source: FAOSTAT (FAO, 2021a).
An analysis on agri-food system impacts on total GHG emissions would not be complete without a focus on component gases in addition to quantities expressed in CO2 eq.. The FAOSTAT data confirm the trends form 1990 to 2019 seen for total CO2 eq. emissions, with important features (Table 6). First, the impact of agri-food systems on world total CO2 emissions was 21 % in 2019 (down from 31 % in 1990), a respectable share considering the importance of carbon dioxide in any effective long-term mitigation strategy. While most regions had contributions around this value, ranging 13 %–23 % for North America, Oceania, Europe and Asia, the CO2 contribution of agri-food systems was highest in Africa (52 %) and South America (70 %), largely in relation to land use change emissions, still significant therein. Europe and North America were the only regions where the CO2 share of agri-food systems actually increased from 1990 to 2019, confirming the growing weight of pre- and post-production processes, which typically involve fossil-fuel energy use and thus emissions of CO2 gas through combustion. Second, the data highlight the significant contribution of agri-food systems to 2019 world total emissions of CH4 (53 %) and N2O (78 %), also confirmed at regional levels (Table 6), linked to farm gate production processes (Tubiello, 2019).
Table 6World total and regional GHG agri-food system emissions shares (%), 1990–2019, by single gas and CO2 eq.. Uncertainties in shares (not shown) are the same as those estimated for absolute emissions. See Crippa et al. (2021a) for a specific list of hydrofluorocarbons (HFCs) used in agri-food systems, which form the basis of the F-gas emissions data estimated in this work.
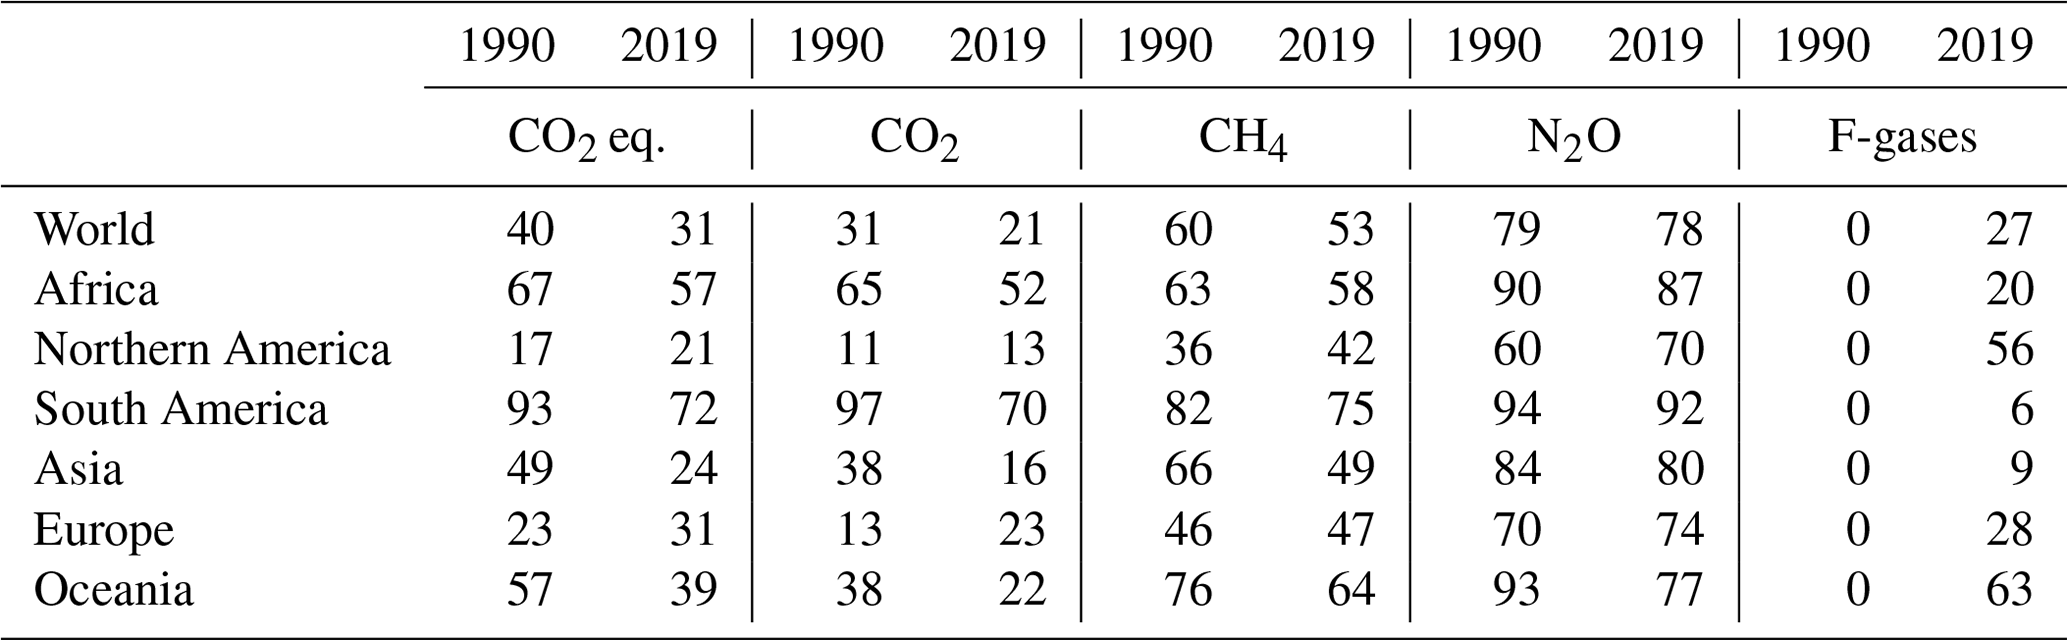
Finally, the data highlight a very large increase in agri-food system contributions of F-gas emissions, which went from near zero in 1990 to more than one-quarter of the world total in 2019 – with larger contributions in many regions. Such a marked increase is consistent with the growth in use of hydrofluorocarbons (HFCs) as refrigerants in the food retail and other sectors, following the banning of chlorofluorocarbons (CFCs) in 1990 (Fang et al., 2018; Hart et al., 2020; International Institute of Refrigeration, 2021; Tubiello et al., 2021b)). Our findings are furthermore consistent with the strong growth in F-gas emissions reported in recent studies (Minx et al., 2021; Park et al., 2021).
An important aspect of the dataset presented in this study is its provision of information mapped across IPCC and FAO categories alike. Specific IPCC sectors include agriculture and land use, land use change and forestry (LULUCF). The IPCC further considers the agriculture, forestry and other land use (AFOLU). While countries report their agriculture and food emissions to the UNFCCC within national GHG inventories, our findings highlight the importance of expanding that reporting to a fuller agri-food systems view, one that properly weights the contribution of food to the global economy. Indeed, our results show that agri-food system emissions in 2019 were one-third of total anthropogenic emissions. This important picture does not emerge from NGHGI reporting aligned to IPCC categories, according to which, for instance, LULUCF and AFOLU emissions contributed respectively 4 % and 15 % of the total.
The GHG emission data presented herein cover the period 1990–2019 at the country level, with regional and global aggregates. They are available as open data, with DOI https://doi.org/10.5281/zenodo.5615082 (Tubiello et al., 2021d), and via the FAOSTAT emissions shares database (https://www.fao.org/faostat/en/#data/EM, FAO, 2021a).
This paper provided details of a new FAOSTAT database on GHG emissions along the entire agri-food systems chain, including crop and livestock production processes on the farm, land use change activities from the conversion of natural ecosystems to agricultural land, and processes along food supply chains, from input manufacturing to food processing, transport and retail, including household consumption and waste disposal.
The data are provided in open-access mode to users worldwide and are available by country over the time period 1990–2019, with plans for annual updates. The major trends identified in this work help locate GHG emissions hotspots in agri-food systems at the country, regional and global level. This can inform the process of designing effective mitigation actions in food and agriculture. This work adds to knowledge on GHG emissions from agriculture and land use – generally well established in the literature – by adding critical information on emissions from a range of pre- and post-production processes. The new data highlight the increasingly important role that pre- and post-production processes along supply chains play in the overall GHG footprint of agri-food systems, globally and in most countries, providing new insights into food and agriculture development trends and future mitigation options.
The granularity of the dataset allows us, for the first time, to highlight specific processes of importance in specific countries or groups of countries with similar characteristics. The relevance of the information being provided cuts across several national and international priorities, specifically those aiming at achieving more productive and sustainable food systems, including in relation to climate change. To this end, the work presented herein completes a mapping of IPCC categories, used by countries for reporting to the climate convention, to food and agriculture categories that are more readily understandable by farmers and ministries of agriculture in countries. This helps better identify agri-food system entry points within existing and future national determined contributions. Finally, the methodological work underlying these efforts complements and extends recent pioneering efforts by FAO and other groups in characterizing technical coefficients to enable quantifying the weight of agri-food systems within countries' emissions profiles. The next steps in such efforts would need the involvement of interested national and international experts in compiling a first set of coefficients for agri-food systems as a practical agri-food systems annex to the existing guidelines of the Intergovernmental Panel on Climate Change, providing guidance to countries on how to better characterize food and agriculture emissions within their national GHG inventories.
The supplement related to this article is available online at: https://doi.org/10.5194/essd-14-1795-2022-supplement.
FNT and CR conceived the ideas and together with GC and KK designed the methodology. LRS, AF and RQ provided pre- and post-production data. NW provided forest data. GOL, KK, XP, SYQ, HHH, RQ, LRS, AF and JG compiled and analyzed data. FNT led the writing of the manuscript with input from GC, KK, EMC and CR. PB commented on an earlier version of the manuscript. All authors contributed critically to the drafts and gave final approval for the publication. The views expressed in this paper are the authors' only and do not necessarily reflect those of FAO, UNSD and IEA.
At least one of the (co-)authors is a member of the editorial board of Earth System Science Data. The peer-review process was guided by an independent editor, and the authors also have no other competing interests to declare.
The views expressed in this paper are the authors' only and do not
necessarily reflect those of FAO, UNSD, UNIDO and IEA.
Publisher’s note: Copernicus Publications remains neutral with regard to jurisdictional claims in published maps and institutional affiliations.
FAOSTAT is supported by FAO's member countries. We acknowledge the efforts of national experts who provide the statistics on food and agriculture, as well as statistics on energy use, that are the basis of this effort. All authors contributed critically to the drafts and gave final approval for the publication. We are grateful for overall support by the Food Climate Partnership at Columbia University.
This paper was edited by David Carlson and reviewed by two anonymous referees.
Bellarby, J., Foereid, B., and Hastings, A.: Cool Farming: Climate Impacts of Agriculture and Mitigation Potential, https://abdn.pure.elsevier.com/en/publications/cool-farming-climate-impacts-of-agriculture-and-mitigation-potent (last access: 15 March 2022), 2008.
Brentrup, F., Hoxha, A., and Christensen, B.: Carbon footprint analysis of mineral fertilizer production in Europe and other world regions, in: 10th International Conference on Life Cycle Assessment of Food, University College Dublin, 19–21 October 2016, https://www.researchgate.net/profile/Frank-Brentrup-2/publication/312553933_Carbon_footprint_analysis_of_mineral_fertilizer_production_in_Europe_and_other_world_regions/links/5881ec8d4585150dde4012fe/Carbon-footprint-analysis-of-mineral-fertilizer-product (last access: 15 March 2022), 2016.
Brentrup, F., Lammel, J., Stephani, T., and Christensen, B.: Updated carbon footprint values for mineral fertilizer from different world regions, in: 11th International Conference on Life Cycle Assessment of Food, Kasetsart University, 17–19 October 2018, https://www.researchgate.net/publication/329774170_Updated_carbon_footprint_values_for_mineral_fertilizer_from_different_world_regions (last access: 1 January 2022), 2018.
Clark, M. A., Domingo, N. G. G., Colgan, K., Thakrar, S. K., Tilman, D., Lynch, J., Azevedo, I. L., and Hill, J. D.: Global food system emissions could preclude achieving the 1.5∘ and 2 ∘C climate change targets, Science, 370, 705–708, https://doi.org/10.1126/science.aba7357, 2020.
Conchedda, G. and Tubiello, F. N.: Drainage of organic soils and GHG emissions: validation with country data, Earth Syst. Sci. Data, 12, 3113–3137, https://doi.org/10.5194/essd-12-3113-2020, 2020.
Crippa, M., Solazzo, E., Guizzardi, D., Monforti-Ferrario, F., Tubiello, F. N., and Leip, A.: Food systems are responsible for a third of global anthropogenic GHG emissions, Nature Food, 2, 198–209, https://doi.org/10.1038/s43016-021-00225-9, 2021a.
Crippa, M., Guizzardi, D., Solazzo, E., Ferrario-Monforti, F., Tubiello, F. N., and Leip, A.: EDGAR-FOOD emission data, figshare, https://doi.org/10.6084/m9.figshare.13476666, 2021b.
Crumpler, K., Federici, S., Meybeck, A., Salvatore, M., Damen, B., Gagliardi, G., Bloise, M., Wolf, J., and Bernoux, M.: Assessing policy gaps and opportunities in the nationally determined contributions – A sectoral methodology for agriculture and land use, Environment and Natural Resources Management Working Papers No. 86, Rome, FAO, https://doi.org/10.4060/cb1579en, 2021.
Curtis, P. G., Slay, C. M., Harris, N. L., Tyukavina, A., and Hansen, M. C.: Classifying drivers of global forest loss, Science, 361, 1108–1111, https://doi.org/10.1126/science.aau3445, 2018.
Dalin, C. and Rodríguez-Iturbe, I.: Environmental impacts of food trade via resource use and greenhouse gas emissions, Environ. Res. Lett., 11, 035012, https://doi.org/10.1088/1748-9326/11/3/035012, 2016.
Fang, X., Ravishankara, A. R., Velders, G. J. M., Molina, M. J., Su, S., Zhang, J., Hu, J., and Prinn, R. G.: Changes in Emissions of Ozone-Depleting Substances from China Due to Implementation of the Montreal Protocol, Environ. Sci. Technol., 52, 11359–11366, https://doi.org/10.1021/acs.est.8b01280, 2018.
FAO: Energy-smart food for people and climate, FAO, Rome, http://www.fao.org/3/i2454e/i2454e00.pdf (last access: 25 October 2021), 2011.
FAO: Opportunities for Agri-Food Chains to become Energy-Smart, FAO, Rome, http://www.fao.org/3/a-i5125e.pdf (last access: 25 October 2021), 2014.
FAO: Emissions due to agriculture. Global, regional and country trends 2000–2018, FAOSTAT Analytical Brief Series No 18, FAO, Rome, https://www.fao.org/3/cb3808en/cb3808en.pdf (last access: 25 October 2021), 2020a.
FAO: FAOSTAT Energy Use, FAO, https://www.fao.org/faostat/en/#data/GN (last access: 25 October 2021), 2020b.
FAO: FAOSTAT Emissions Shares, FAO, https://www.fao.org/faostat/en/#data/EM (last access: 25 October 2021), 2021a.
FAO: FAOSTAT Emissions Totals, FAO, https://www.fao.org/faostat/en/#data/GT (last access: 25 October 2021), 2021b.
FAO: The share of food systems in total greenhouse gas emissions. Global, regional and country trends 1990–2019, FAOSTAT Analytical Brief Series No. 31, FAO, Rome, https://www.fao.org/3/cb7514en/cb7514en.pdf (last access: 15 March 2022), ISSN 2709-0078, 2021c.
Flammini, A., Pan, X., Tubiello, F. N., Qiu, S. Y., Rocha Souza, L., Quadrelli, R., Bracco, S., Benoit, P., and Sims, R.: Emissions of greenhouse gases from energy use in agriculture, forestry and fisheries: 1970–2019, Earth Syst. Sci. Data, 14, 811–821, https://doi.org/10.5194/essd-14-811-2022, 2022.
Grassi, G., Stehfest, E., Rogelj, J., van Vuuren, D., Cescatti, A., House, J., Nabuurs, G.-J., Rossi, S., Alkama, R., Viñas, R. A., Calvin, K., Ceccherini, G., Federici, S., Fujimori, S., Gusti, M., Hasegawa, T., Havlik, P., Humpenöder, F., Korosuo, A., Perugini, L., Tubiello, F. N., and Popp, A.: Critical adjustment of land mitigation pathways for assessing countries' climate progress, Nat. Clim. Change, 11, 425–434, https://doi.org/10.1038/s41558-021-01033-6, 2021.
Gütschow J., Jeffery L., and R. Gieseke: The PRIMAP-hist national historical emissions time series v2.3 (1850–2017), GFZ Data Services [data set], https://doi.org/10.5880/pik.2019.001, 2021.
Hart, M., Austin, W., Acha, S., Le Brun, N., Markides, C. N., and Shah, N.: A roadmap investment strategy to reduce carbon intensive refrigerants in the food retail industry, J. Clean. Prod., 275, 123039, https://doi.org/10.1016/j.jclepro.2020.123039, 2020.
Hönle, S. E., Heidecke, C., and Osterburg, B.: Climate change mitigation strategies for agriculture: An analysis of nationally determined contributions, biennial reports and biennial update reports, Clim. Policy, 19, 688–702, https://doi.org/10.1080/14693062.2018.1559793, 2019.
International Fertiliser Society (IFS): The carbon footprint of fertiliser production: regional reference values, https://www.fertilizerseurope.com/wp-content/uploads/2020/01/The-carbon-footprint-of-fertilizer-production_Regional-reference-values.pdf (last access: 25 October 2021), 2019.
International Institute of Refrigeration: The Carbon Footprint of the Cold Chain, 7th Informatory Note on Refrigeration and Food, https://iifiir.org/en/fridoc/the-carbon-footprint-of-the-cold-chain-7-lt-sup-gt-th-lt-sup-gt-informatory-143457 (last access: 25 October 2021), 2021.
IPCC: Good practice guidance and uncertainty management in national greenhouse gas inventories, in: IPCC National Greenhouse Gas Inventories Programme, Technical Support Unit, Hayama, Japan, edited by: Penman, J., Kruger, G., Hiraishi, T., Nyenzi, B., Emmanul, S., Buendia, L., Hoppaus, R., Martinsen, T., Meijer, J., Miwa, K., and Tanabe, K., http://www.ipcc-nggip.iges.or.jp/public/gp/english/gpgaum_en.html (last access: 25 October 2021), 2000.
IPCC: Good practice guidance for land use, land-use change and forestr, https://www.ipcc.ch/publication/good-practice-guidance-for-land-use-land-use-change-and-forestry/ (last access: 25 October 2021), ISBN 4-88788-003-0, 2003.
IPCC: 2006 IPCC Guidelines for National Greenhouse Gas Inventories, Prepared by the National Greenhouse Gas Inventories Programme, edited by: Eggleston, H. S., Buendia, L., Miwa, K., Ngara, T., and Tanabe, K., IGES, Japan, https://www.ipcc-nggip.iges.or.jp/public/2006gl/vol5.html (last access: 25 October 2021), 2006.
IPCC: Climate Change 2014: Synthesis Report. Contribution of Working Groups I, II and III to the Fifth Assessment Report of the Intergovernmental Panel on Climate Change, https://www.ipcc.ch/site/assets/uploads/2018/02/SYR_AR5_FINAL_full.pdf (last access: 25 October 2021), 2014a.
IPCC: 2013 Supplement to the 2006 IPCC Guidelines for National Greenhouse Gas Inventories, edited by: Wetlands, Hiraishi, T., Krug, T., Tanabe, K., Srivastava, N., Baasansuren, J., Fukuda, M., and Troxler, T. G., IPCC, Switzerland, 2014b.
IPCC: 2019 Refinement to the 2006 IPCC Guidelines for National Greenhouse Gas Inventories, edited by: Calvo Buendia, E., Tanabe, K., Kranjc, A., Baasansuren, J., Fukuda, M., Ngarize S., Osako, A., Pyrozhenko, Y., Shermanau, P., and Federici, S., IPCC, Switzerland, ISBN 978-4-88788-232-4, 2019.
Karl, K. and Tubiello, F. N.: Methods for Estimating Greenhouse Gas Emissions from Food Systems: Domestic Food Transport, Rome, https://doi.org/10.4060/cb6754en, 2021a.
Karl, K. and Tubiello, F. N.: Methods for Estimating Greenhouse Gas Emissions from Food Systems: Food Systems Waste Disposal, Rome, https://doi.org/10.4060/cb7028en, 2021b.
Lamb, W. F., Grubb, M., Diluiso, F., and Minx, J. C.: Countries with sustained greenhouse gas emissions reductions: An analysis of trends and progress by sector, Clim. Policy, 22, 1–17, https://doi.org/10.1080/14693062.2021.1990831, 2022.
Mbow, C., Rosenzweig, C., Barioni, L.G., Benton, T.G., Herrero, M., Krishnapillai, M., Liwenga, E., Pradhan, P., Rivera-Ferre, M.G., Sapkota, T., Tubiello, F. N., and Xu, Y.: Food Security, in: Climate Change and Land: an IPCC special report on climate change, desertification, land degradation, sustainable land management, food security, and greenhouse gas fluxes in terrestrial ecosystems, edited by: Shukla, P. R., Skea, J., Calvo Buendia, E., Masson-Delmotte, V., Pörtner, H.-O., Roberts, D. C., Zhai, P., Slade, R., Connors, S., van Diemen, R., Ferrat, M., Haughey, E., Luz, S., Neogi, S., Pathak, M., Petzold, J., Portugal Pereira, J., Vyas, P., Huntley, E., Kissick, K., Belkacemi, M., and Malley, J., https://www.ipcc.ch/srccl/chapter/chapter-5/ (last access: 15 March 2022), IPCC, 2019.
Minx, J. C., Lamb, W. F., Andrew, R. M., Canadell, J. G., Crippa, M., Döbbeling, N., Forster, P. M., Guizzardi, D., Olivier, J., Peters, G. P., Pongratz, J., Reisinger, A., Rigby, M., Saunois, M., Smith, S. J., Solazzo, E., and Tian, H.: A comprehensive and synthetic dataset for global, regional, and national greenhouse gas emissions by sector 1970–2018 with an extension to 2019, Earth Syst. Sci. Data, 13, 5213–5252, https://doi.org/10.5194/essd-13-5213-2021, 2021.
Monforti, F., Dallemand, J., Pascua, I., Motola, V., Banja, M., Scarlat, N., Medarac, H., Castellazzi, L., Labanca, N., Bertoldi, P., Pennington, D., Goralczyk, M., Schau, E., Saouter, E., Sala, S., Notarnicola, B., Tassielli, G., and Renzulli, P.: Energy use in the EU food sector: State of play and opportunities for improvement, https://publications.jrc.ec.europa.eu/repository/handle/JRC96121 (last access: 15 March 2022), 2015.
Pablo-Romero, M. del P., Pozo-Barajas, R., and Yñiguez, R.: Global Changes in Residential Energy Consumption, Energ. Policy, 101, 342–352, https://doi.org/10.1016/j.enpol.2016.10.032, 2017.
Park, W. Y., Shah, N., Vine, E., Blake, P., Holuj, B., Kim, J. H., and Kim, D. H.: Ensuring the climate benefits of the Montreal Protocol: Global governance architecture for cooling efficiency and alternative refrigerants, Energy Research & Social Science, 76, 102068, https://doi.org/10.1016/j.erss.2021.102068, 2021.
Poore, J. and Nemecek, T.: Reducing Food's Environmental Impacts through Producers and Consumers, Science, 360, 987–992, https://doi.org/10.1126/science.aaq0216, 2018.
Prosperi, P., Bloise, M., Tubiello, F. N., Conchedda, G., Rossi, S., Boschetti, L., Salvatore, M., and Bernoux, M.: New estimates of greenhouse gas emissions from biomass burning and peat fires using MODIS Collection 6 burned areas, Clim. Change, 161, 415–432, https://doi.org/10.1007/s10584-020-02654-0, 2020.
Ritchie, H.: Food production is responsible for one-quarter of the world's greenhouse gas emissions, https://ourworldindata.org/food-ghg-emissions (last access: 25 October 2021), 2019.
Rosenzweig, C., Mbow, C., Barioni, L. G., Benton, T. G., Herrero, M., Krishnapillai, M., Liwenga, E. T., Pradhan, P., Rivera-Ferre, M. G., Sapkota, T., Tubiello, F. N., Xu, Y., Mencos Contreras, E., and Portugal-Pereira, J.: Climate change responses benefit from a global food system approach, Nature Food, 1, 94–97, https://doi.org/10.1038/s43016-020-0031-z, 2020.
Rosenzweig, C., Tubiello, F. N., Sandalow, D., Benoit, P., and Hayek, M. N.: Finding and fixing food system emissions: the double helix of science and policy, Environ. Res. Lett., 16, 061002, https://doi.org/10.1088/1748-9326/ac0134, 2021.
Saunois, M., Stavert, A. R., Poulter, B., Bousquet, P., Canadell, J. G., Jackson, R. B., Raymond, P. A., Dlugokencky, E. J., Houweling, S., Patra, P. K., Ciais, P., Arora, V. K., Bastviken, D., Bergamaschi, P., Blake, D. R., Brailsford, G., Bruhwiler, L., Carlson, K. M., Carrol, M., Castaldi, S., Chandra, N., Crevoisier, C., Crill, P. M., Covey, K., Curry, C. L., Etiope, G., Frankenberg, C., Gedney, N., Hegglin, M. I., Höglund-Isaksson, L., Hugelius, G., Ishizawa, M., Ito, A., Janssens-Maenhout, G., Jensen, K. M., Joos, F., Kleinen, T., Krummel, P. B., Langenfelds, R. L., Laruelle, G. G., Liu, L., Machida, T., Maksyutov, S., McDonald, K. C., McNorton, J., Miller, P. A., Melton, J. R., Morino, I., Müller, J., Murguia-Flores, F., Naik, V., Niwa, Y., Noce, S., O'Doherty, S., Parker, R. J., Peng, C., Peng, S., Peters, G. P., Prigent, C., Prinn, R., Ramonet, M., Regnier, P., Riley, W. J., Rosentreter, J. A., Segers, A., Simpson, I. J., Shi, H., Smith, S. J., Steele, L. P., Thornton, B. F., Tian, H., Tohjima, Y., Tubiello, F. N., Tsuruta, A., Viovy, N., Voulgarakis, A., Weber, T. S., van Weele, M., van der Werf, G. R., Weiss, R. F., Worthy, D., Wunch, D., Yin, Y., Yoshida, Y., Zhang, W., Zhang, Z., Zhao, Y., Zheng, B., Zhu, Q., Zhu, Q., and Zhuang, Q.: The Global Methane Budget 2000–2017, Earth Syst. Sci. Data, 12, 1561–1623, https://doi.org/10.5194/essd-12-1561-2020, 2020.
Sims, R. E. H. and Flammini, A.: Energy-smart food – technologies, practices and policies, chap. 6, Sustainable Energy Solutions in Agriculture, Taylor & Francis Group, London, UK, https://doi.org/10.1201/b16643, 2014.
Smith, P., Bustamante, M., Ahammad, H., Clark, H., Dong, H., Elsiddig, E .A., Haberl, H., Harper, R., House, J., Jafari, M., Masera, O., Mbow, C., Ravindranath, N. J., Rice, C. W., Robledo Abad, C., Romanovskaya, A., Sperling, F., and Tubiello, F. N.: Agriculture, Forestry and Other Land Use (AFOLU), in Working Group III contribution to the IPCC 5th Assessment Report, Climate Change 2014: Mitigation of Climate Change, edited by: Edenhofer, O., Pichs-Madruga, R., Sokona, Y., Farahani, E., Kadner, S., Seyboth, K., Adler, A., Baum, I., Brunner, S., Eickemeier, P., Kriemann, B., Savolainen, J., Schlömer, S., von Stechow, C., Zwickel, T., and Minx, J. C., Cambridge University Press, Cambridge, UK, New York, NY, USA, ISBN 978-1-107-65481-5, 2014.
Tao, S., Ru, M. Y., Du, W., Zhu, X., Zhong, Q. R., Li, B. G., Shen, G. F., Pan, X. L., Meng, W. J., Chen, Y. L., Shen, H. Z., Lin, N., Su, S., Zhuo, S. J., Huang, T. B., Xu, Y., Yun, X., Liu, J. F., Wang, X. L., Liu, W. X., Cheng, H. F., and Zhu, D. Q.: Quantifying the Rural Residential Energy Transition in China from 1992 to 2012 through a Representative National Survey, Nature Energy, 3, 567–73, https://doi.org/10.1038/s41560-018-0158-4, 2018.
Tubiello, F. N.: Greenhouse Gas Emissions Due to Agriculture, in: Encyclopedia of Food Security and Sustainability, edited by: Ferranti, P., Berry, E. M., and Anderson, J. R., Elsevier, 196–205, https://doi.org/10.1016/B978-0-08-100596-5.21996-3, 2019.
Tubiello, F. N., Salvatore, M., Rossi, S., Ferrara, A., Fitton, N., and Smith, P.: The FAOSTAT database of greenhouse gas emissions from agriculture, Environ. Res. Lett., 8, 015009, https://doi.org/10.1088/1748-9326/8/1/015009, 2013.
Tubiello, F. N., Rosenzweig, C., Conchedda, G., Karl, K., Gütschow, J., Xueyao, P., Obli-Laryea, G., Wanner, N., Qiu, S. Y., De Barros, J., and Flammini, A.: Greenhouse gas emissions from food systems: building the evidence base, Environ. Res. Lett., 16, 065007, https://doi.org/10.1088/1748-9326/ac018e, 2021a.
Tubiello, F. N., Flammini, A., Karl, K., Obli-Laryea, G., Qiu, S. Y., Heiðarsdóttir, H., Pan, X., and Conchedda, G.: Methods for estimating greenhouse gas emissions from food systems. Part III: energy use in fertilizer manufacturing, food processing, packaging, retail and household consumption, FAO Statistics Working Paper 21–29, Rome, https://doi.org/10.4060/cb7473en, 2021b.
Tubiello, F. N., Conchedda, G., Wanner, N., Federici, S., Rossi, S., and Grassi, G.: Carbon emissions and removals from forests: new estimates, 1990–2020, Earth Syst. Sci. Data, 13, 1681–1691, https://doi.org/10.5194/essd-13-1681-2021, 2021c.
Tubiello, F. N., Karl, K., Flammini, A., Conchedda, G., and Obli-Laryea, G.: Food Systems Emissions Shares, 1990–2019, Zenodo [data set], doi10.5281/zenodo.5615082, 2021d.
UNFCCC: Nationally determined contributions under the Paris Agreement. Synthesis report by the secretariat, https://unfccc.int/documents/306848 (last access: 25 October 2021), 2021.
Wang, L.: Energy Efficiency Technologies for Sustainable Food Processing, Energ. Effic., 7, 791–810, https://doi.org/10.1007/s12053-014-9256-8, 2014.
Vermeulen, S. J., Campbell, B. M., and Ingram, J. S. I.: Climate Change and Food Systems, Annu. Rev. Environ. Resour., 37, 195–222, https://doi.org/10.1146/annurev-environ-020411-130608, 2012.