the Creative Commons Attribution 4.0 License.
the Creative Commons Attribution 4.0 License.
 | 07 Apr 2022
Water vapor in cold and clean atmosphere: a 3-year data set in the boundary layer of Dome C, East Antarctic Plateau
Christophe Genthon
Dana E. Veron
Etienne Vignon
Jean-Baptiste Madeleine
Luc Piard
The air at the surface of the high Antarctic Plateau is very cold, dry and clean. Under such conditions, the atmospheric moisture can significantly deviate from thermodynamic equilibrium, and supersaturation with respect to ice can occur. Most conventional humidity sensors for meteorological applications cannot report supersaturation in this environment. A simple approach for measuring supersaturation using conventional instruments, with one being operated in a heated airflow, is presented. Since 2018, this instrumental setup has been deployed at three levels in the lower ∼40 m above the surface at Dome C on the high Antarctic Plateau. A resulting 3-year (2018–2020) record (Genthon et al., 2021a) is presented and analyzed for features such as the frequency of supersaturation with respect to ice, diurnal and seasonal variability, and vertical distribution. As supercooled liquid water droplets are frequently observed in clouds at the temperatures experienced on the high Antarctic Plateau, the distribution of relative humidity with respect to liquid water at Dome C is also discussed. It is suggested that, while not strictly mimicking the conditions of the high troposphere, the surface atmosphere on the Antarctic Plateau is a convenient natural laboratory to test parametrizations of cold microphysics predominantly developed to handle the genesis of high tropospheric clouds. Data are available from the PANGAEA data repository at https://doi.org/10.1594/PANGAEA.939425 (Genthon et al., 2021a).
- Article
(2262 KB) - Full-text XML
- BibTeX
- EndNote


The surface atmosphere of the high Antarctic Plateau is very cold. At Dome C (Sect. 2), the annual average daily mean 3 m air temperature is −52 ∘C, ranging from −64 ∘C in June to −31 ∘C in January (Genthon et al., 2021b). It is cold even in the summer because the permanent snow cover has a high albedo and reflects much of the incoming solar radiation. The atmosphere is particularly cold in winter because the sun is low on or below the horizon, while the snow surface efficiently radiates thermal energy through the dry atmosphere above. In fact, the only external source of heat for the surface and the overlying atmospheric column during the polar night is that transported by the atmospheric circulation. Concerning moisture, it is advected inland from the surrounding oceans; this includes the part of the atmospheric moisture that feeds the ice sheet as snowfall at the surface. Considering the distance from the coast and the large temperature gradient from the sources of moisture around the ice sheet to the deep interior, it is no wonder that much of the atmospheric moisture is deposited during transport and that little is left in the atmosphere upon arrival at the high plateau: the atmosphere above the plateau is not only very cold but also very dry. In addition, because the aerosol sources are remote, the atmosphere is also very clean, containing few impurities that could act as condensation nuclei (Herenz et al., 2019) and even fewer that could act as freezing nuclei (Belosi et al., 2014).
It may be expected that the moisture conditions in such a cold and clean atmosphere are unusual when compared with a more conventional, warmer and less clean atmosphere. Meteorological and climate models struggle to simulate cirrus clouds in a similar environment at high altitudes in the troposphere when employing a basic parameterization that uses a relative humidity threshold where clouds form when the atmosphere becomes supersaturated with respect to liquid water (wrl) for warm clouds or with respect to ice (wri) for cold clouds (Kärcher and Lohmann, 2002). This has led to improved formulations that account for the fact that supersaturation is possible in a cold and clean atmosphere (Gettelman et al., 2006; Tompkins et al., 2007). Although this improvement has sometimes been ignored, leading to erroneous recommendations for the required qualities of IPCC (Intergovernmental Panel on Climate Change) models (Genthon et al., 2018), one may expect a similar need for an advanced parameterization to reproduce observations of atmospheric moisture at the surface of the high Antarctic Plateau. However, the traditional sensors used to measure atmospheric moisture are inherently unable to report supersaturation because the instrument itself as well as any solid surfaces nearby act as condensation sites; thus, when supersaturation occurs in the free atmosphere, the “excess” moisture (moisture exceeding saturation) is deposited on nearby surfaces before reaching the moisture sensing device itself. This phenomenon has been reported by King and Anderson (1999) for Antarctica and has been further described in Genthon et al. (2017), who also present a simple solution to this measurement challenge, employing an arrangement of commercially available thermohygrometers able to measure and report supersaturation wri (their Fig. 1). Measurements taken with this experimental setup over 1 year at Dome C on the high Antarctic Plateau revealed that supersaturation wri can reach well above 100 % in the surface atmosphere. This is frequent and, in fact, the norm rather than an exception (Genthon et al., 2017).
In Genthon et al. (2017), moisture observations were made at only one level, ∼3 m above the surface, with this new observational setup that observed supersaturation wri. The setup design was later improved (Fig. 1) for better air circulation and enhanced protection against possible radiation biases, and three new thermohygrometer instrument packages were then deployed at ∼3, ∼18 and ∼42 m above the surface along the ∼42 m tower at Dome C (Genthon et al., 2021b). From then on, the observing system remained unchanged and operated almost continuously, albeit with some operational challenges, providing a quasi-continuous 3-year time series of the atmospheric humidity profile in the near-surface layers of the high Antarctic Plateau. The observation of the vertical humidity gradient is particularly important because the gradient is the origin of the fact that turbulence can transport moisture vertically and exchange with the snow surface. Meteorological and climate models cannot explicitly calculate turbulent fluctuations, turbulent correlations or the resulting turbulent flux; instead, these models employ bulk formulations to calculate the surface stress and surface turbulent heat and moisture fluxes, with correction functions to account for the fact that the Monin–Obukhov (MO) theory does not generally apply well in the strongly stable surface layers found on the high Antarctic Plateau (Vignon et al., 2017).
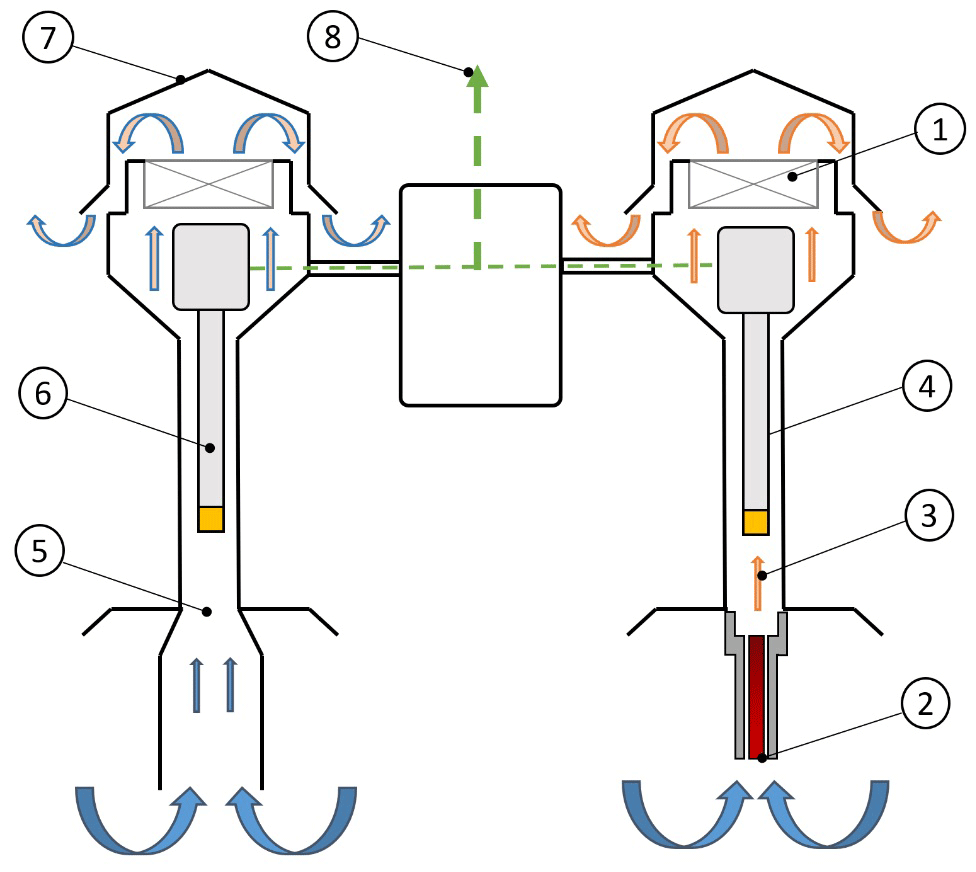
Figure 1Schematic of the improved design of Genthon et al. (2017) for measuring atmospheric moisture, even when it is above saturation. Air is aspirated in a ventilated radiation shield (1) through a heated inlet (2). Its relative humidity and temperature (3) are measured with a HMP155 thermohygrometer (4). At the same time, the air is also aspirated through an unheated inlet (5), and the ambient temperature is measured by a second HMP155 instrument (6) set in a separate shield (7). Data from both HMP155 instruments are collected by a common data logger (8).
To test the limits of MO theory and its application for moisture fluxes in meteorological and climate models, direct measurements of turbulent moisture flux are needed. However, the instrumental technology for this in situ measurement is complex and not quite ready for long-duration campaigns in the extreme conditions of the high Antarctic Plateau. Thus, the data reported here can be used to evaluate the ability of meteorological and climate models to reproduce the vertical moisture gradients, which enter the parametrization of mixing of moisture in the boundary layer, but not the fluxes themselves. The data reported here can also be used to verify the performance of parameterizations of cold microphysics implemented in models for the conditions of the surface at Dome C.
In this paper, we present data and provide limited analyses of 3 years of atmospheric moisture measurements at three levels along the lower ∼40 m of the atmosphere above the surface, including characterization of supersaturation when it occurs. Analyses of aspects related to condensation at very cold temperature resulting from supersaturation are left for forthcoming papers. At this time, we consider the humidity data sufficiently new and useful (for evaluating current models and paradigms) to pass them on to the scientific community. The data are hosted by the PANGAEA archiving and distribution facility, where they can be accessed (Genthon et al., 2021a). After the present introduction (Sect. 1), Sect. 2 describes the general measurement setting and technical methods for the observations. Section 3 presents the main features of the new humidity data, such as variability, extremes, and vertical gradients of moisture content and relative humidity with respect to ice. As liquid water clouds are known to occur well below 0 ∘C in the high troposphere and have been observed at temperatures below −20 ∘C above Dome C (Ricaud et al., 2020a), Sect. 4 provides a quick overview and discussion of saturation with respect to liquid water as calculated from our observations for the surface atmosphere of the Antarctic Plateau. Section 6 provides general conclusions.
Genthon et al. (2021b) presented 10 years of observations of wind and temperature at six levels along a 42 m tower at Dome C (123∘21′ E, 75∘06′ S; 3233 m above sea level). The Dome C environment is cold, dry and spatially very homogeneous. Genthon et al. (2021b) report temperatures ranging from −80 to −15 ∘C in the near-surface atmosphere. Figure 2 shows the variations in the equilibrium water vapor pressure over ice in this temperature range, according to the empirical analytic adjustment of Clausius–Clapeyron (CC) relations by Goff and Gratch (1946), hereafter referred to as “GG”. The GG formulations are not the most recent such approximation; however, this approximation has been widely used and reported in the general literature. According to Murphy and Koop (2005), all but one (which is not GG) of the commonly used expressions for the vapor pressure of ice are within 1 % of each other for temperatures between 180 and 273 K: differences are not large enough to affect the discussions and conclusions here. The case is different for the vapor pressure of supercooled liquid at temperatures below freezing. This will be discussed further in the following. The observational time series are made available in native sensor units, which is relative humidity with respect to liquid for the Vaisala HMP155 thermohygrometer used here, even for temperatures below 0 ∘C. The users of this new data set can recalculate relative humidity with respect to ice (RHi) and other characteristics of atmospheric moisture using their preferred parametrization and method.
The water vapor partial pressure (PPW) in equilibrium wri extends over more than 3 orders of magnitude (Fig. 2), as the relation between PPW and temperature is near-exponential, and the range of observed temperature is large due to large vertical gradients in the inversion layer and large diurnal and seasonal variability. Correspondingly large saturation vapor pressure ranges result. Therefore, instruments observing atmospheric moisture in such an environment must not only perform at very cold temperatures but must also perform at very low moisture contents and across a large range of humidities. A reference instrument, such as the frost-point hygrometer used by King and Anderson (1999) and Genthon et al. (2017), can generally not measure under the coldest conditions at Dome C. Genthon et al. (2017) reported using a frost-point hygrometer that, although designed specifically for cold environments, could not perform below −55 ∘C, due to the limitations of the Peltier mirror cooling device that could not operate correctly below this temperature. This issue was not reported by King and Anderson (1999), but temperatures at their site (Halley Station) were much less extreme than at Dome C. Versions of Vaisala HUMICAP ® thin-film capacitive sensors used in the HMP155 thermohygrometer are factory calibrated and validated down to −60 ∘C. Although operating outside the factory calibration range, these sensors provide data well below this lower limit, down to −80 ∘C. According to the manufacturer, the issue at the coldest temperatures is related to a long time response rather than accuracy (Vaisala technical service, personal communication). As the moisture content is unlikely to change rapidly at a fixed location and height under the conditions at Dome C, this is not considered a major issue here, yet results reported for the coldest temperatures should be considered with some caution. With the HUMICAP ®, relative humidity with respect to liquid water (even below 0 ∘C) is an empirically calibrated function of measured thin-film capacity. According to manufacturer, in the range from −40 to −60 ∘C, the accuracy is a function of relative humidity: reading) in percent relative humidity with respect to liquid.
The temperatures presented by Genthon et al. (2021b) are obtained from several HMP155 instruments (which also report relative humidity with respect to liquid water as mentioned above) set in ventilated radiation shields deployed at six levels along the tower. Sensors, counting the three adapted to measure humidity including supersaturation wri, on the tower are sampled at 30 s intervals. Averages, minima, maxima and variances were calculated over 30 min periods and stored using a Campbell CR3000 data logger. In Genthon et al. (2021b), the focus is on temperatures from the HMP155 (and wind from other sensors) at six levels but not yet moisture because some of the sensors are limited to measuring up to 100 % relative humidity wri, while it is known that the atmosphere can reach well above saturation at Dome C (Genthon et al., 2017).
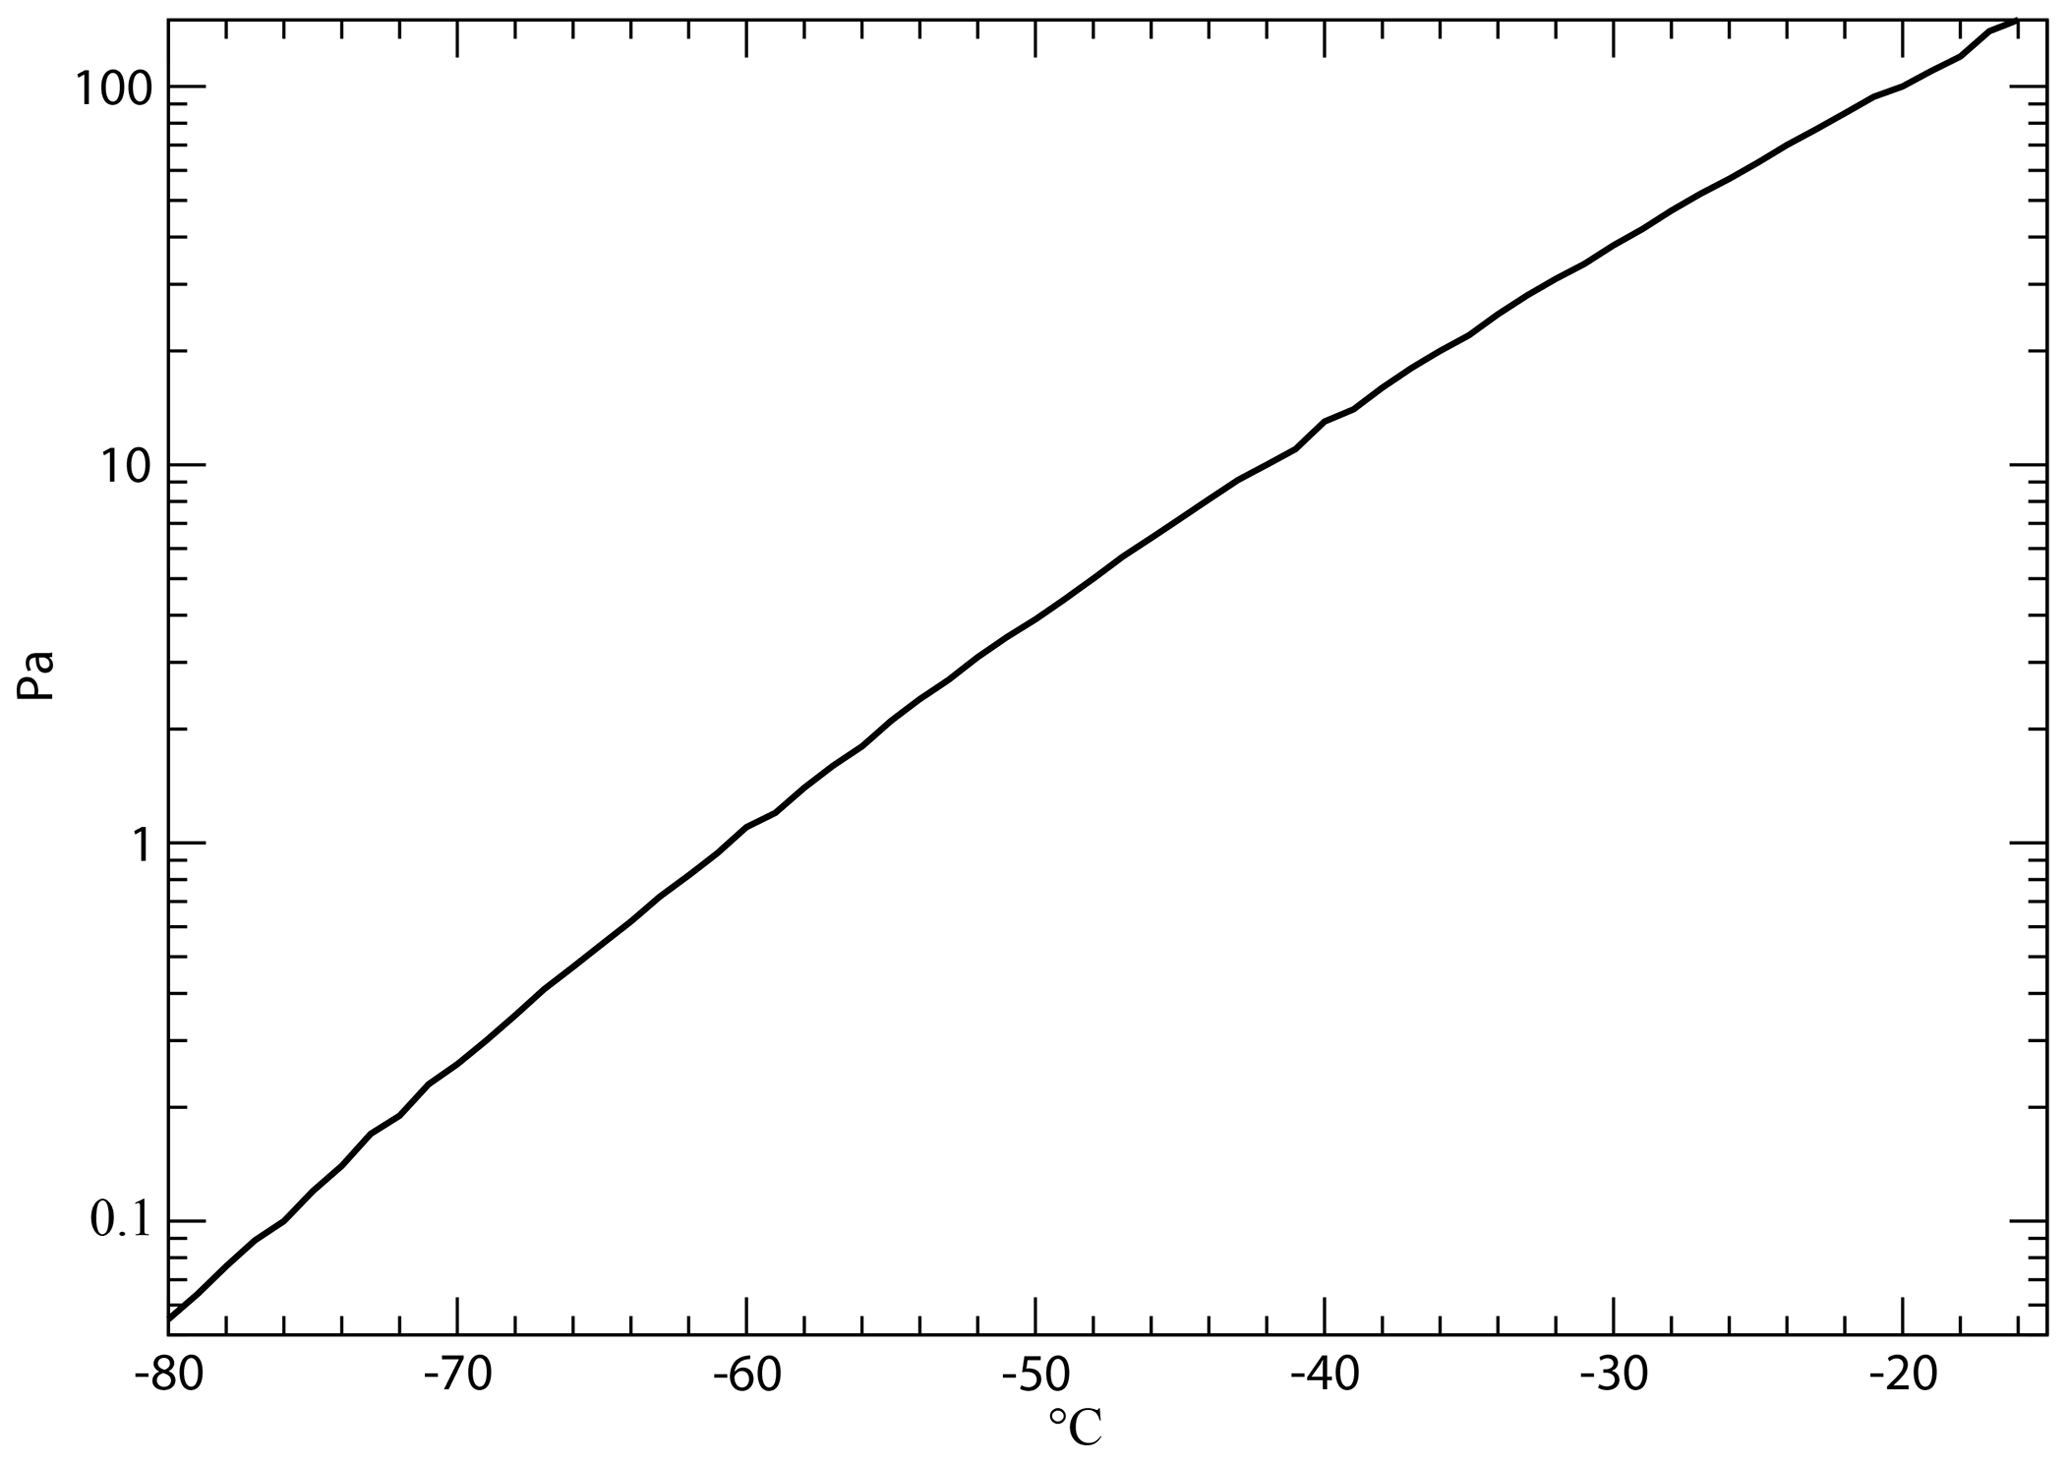
Figure 2Calculated saturation pressure vapor (in Pa) with respect to ice as a function of temperature in the range occurring in the surface atmosphere at Dome C, using the Goff and Gratch (1946) approximation of the Clausius–Clapeyron equilibrium. Note the logarithmic y axis.
3.1 Water–temperature correlation and evidence of supersaturation wri
Figure 3 shows the correlations between PPW and temperature as reported in the Dome C surface atmosphere by the conventional instruments (HMP155; Fig. 3a) and by the sets of instruments adapted to measure supersaturation if and when it occurred (Fig. 3b). The old-time view that the water vapor pressure in the atmosphere cannot reach above saturation would lead to a distribution of water vapor with respect to temperature capped by the CC curve (Fig. 2). As shown in Fig. 3a, the standard HMP155 would support such a view and is, thus, misleading. The main difference between Fig. 3a and b is that the standard instrument hardly reports any cases of a water content significantly above that of the CC thermodynamic equilibrium, whereas the water content is frequently largely above this equilibrium with the adapted instruments. The frequency of supersaturation cases (cases above the CC line) varies as a function of temperature. In the region “below” CC equilibrium, the two instruments report similar humidities and dependence on temperature. Figure 3b also shows the saturation vapor pressure with respect to liquid water (blue curve) calculated from Murphy and Koop (2005). This will be discussed later in the paper (Sect. 4).
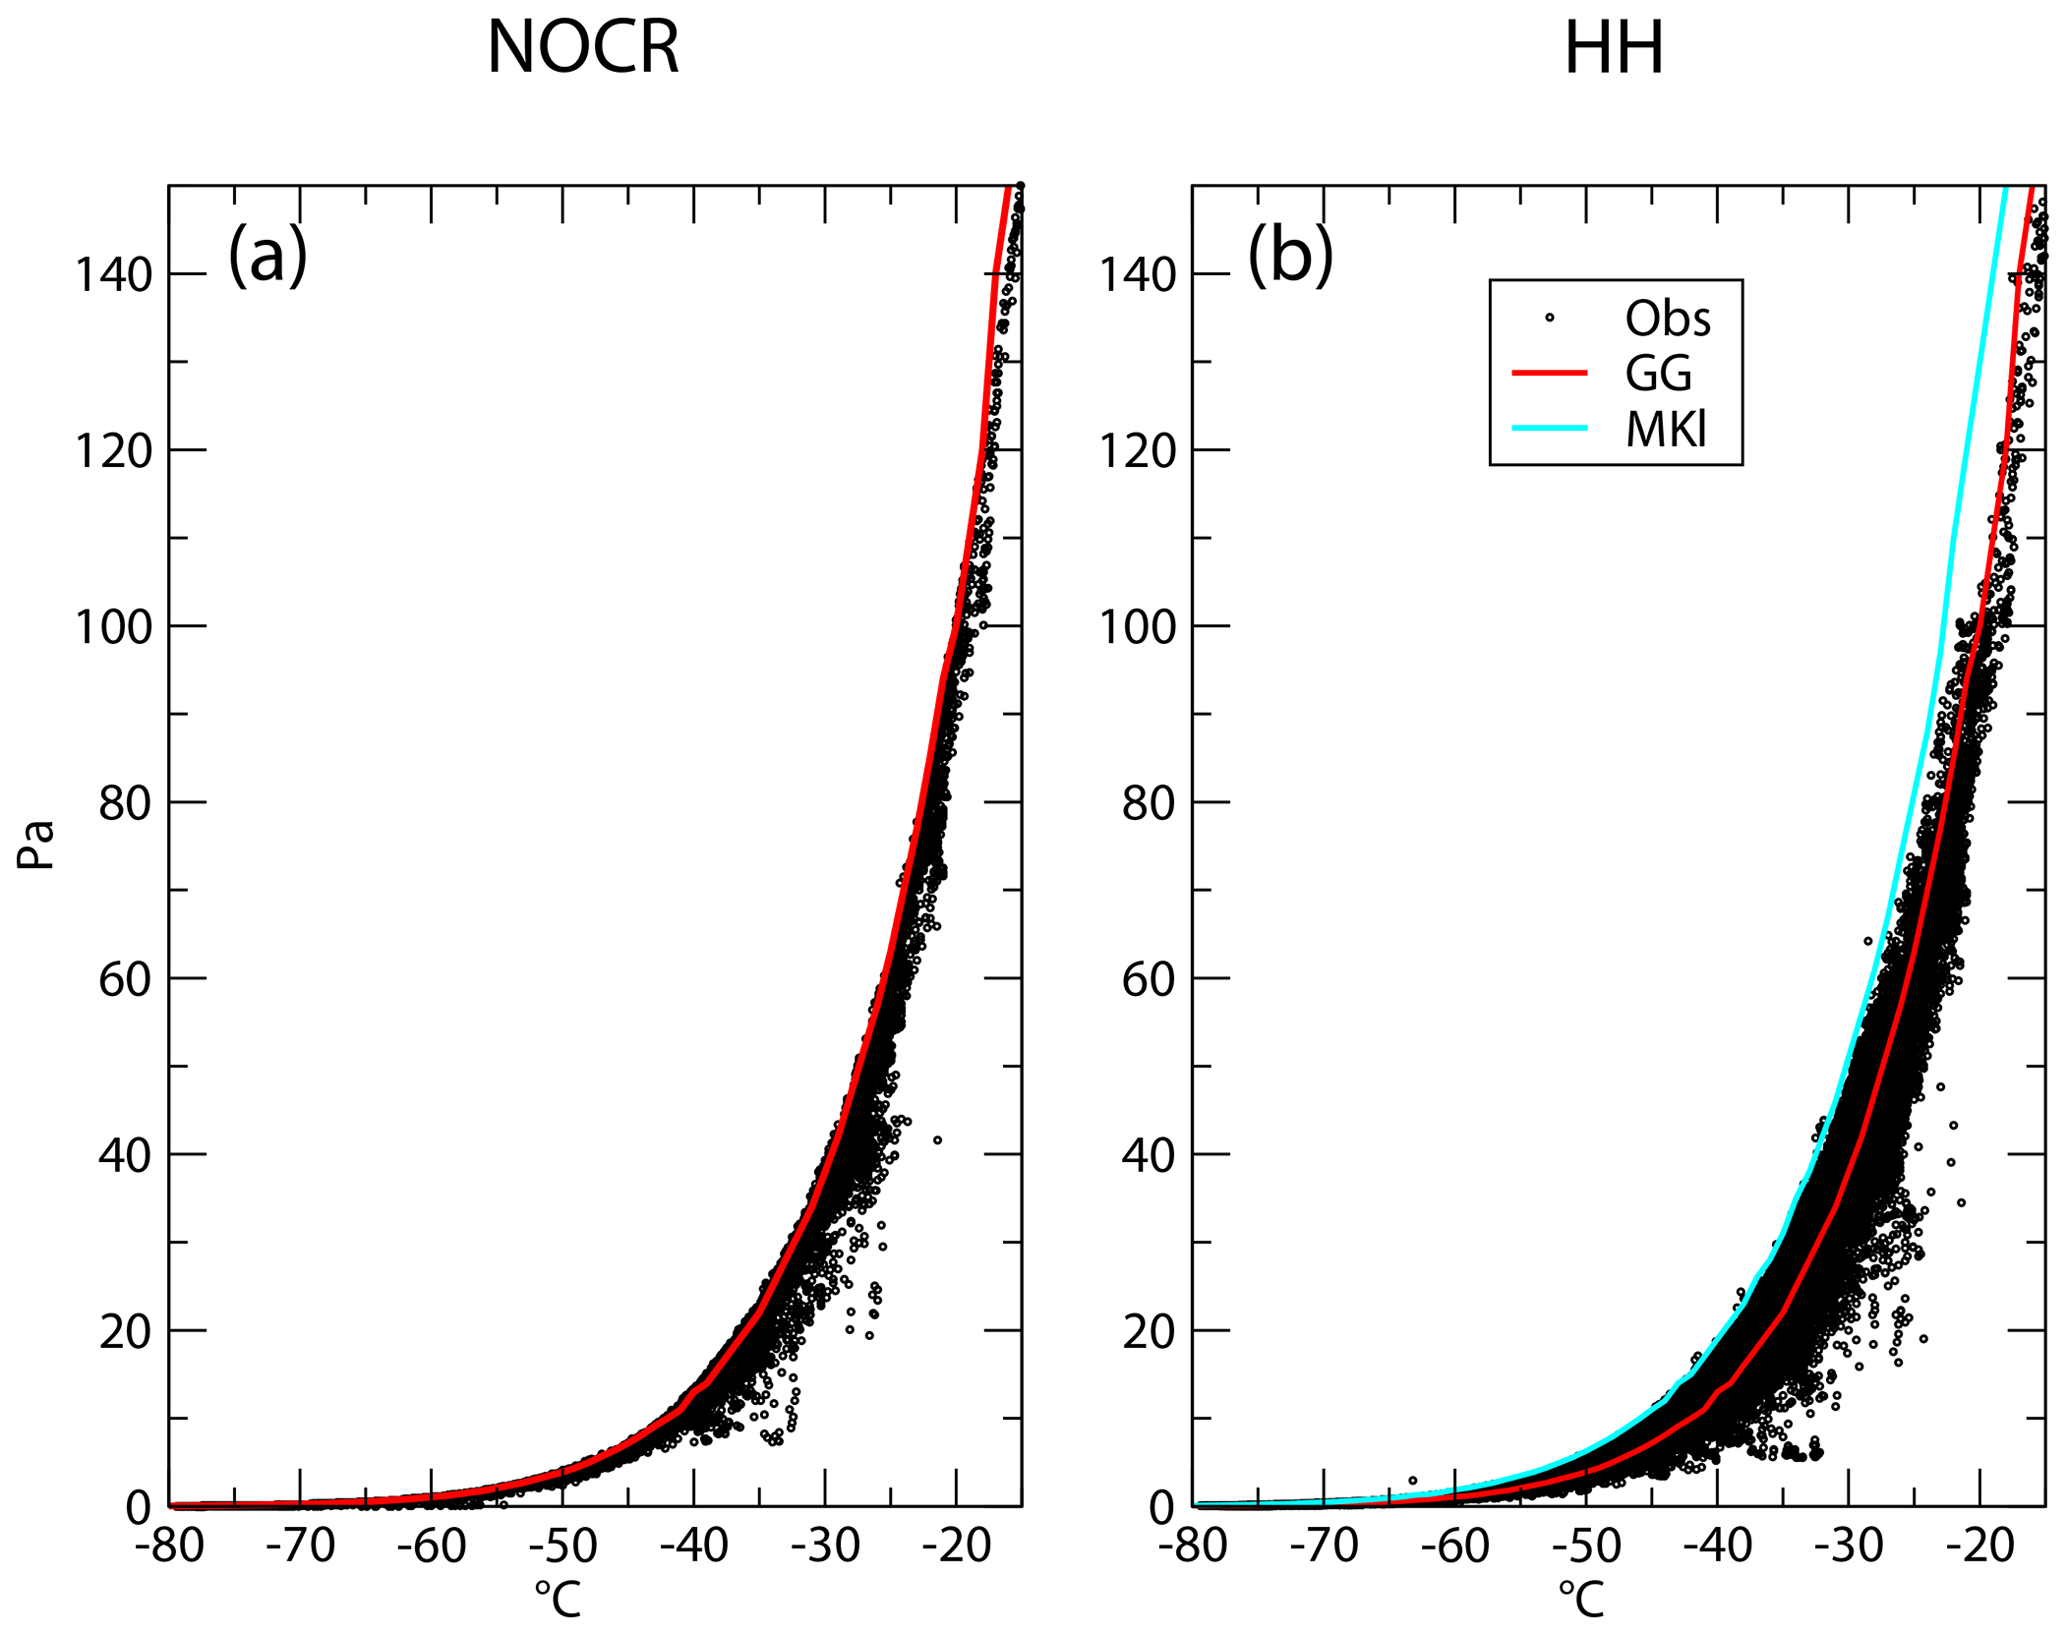
Figure 3Observed distribution of water vapor versus temperature for 2018–2020, as reported by standard instruments such as the HMP155 (a) and systems adapted to report supersaturation (b). The red line (GG) shows the Clausius–Clapeyron relation for the saturation partial pressure wri as calculated using the Goff and Gratch (1946) formulation, similar to Fig. 2 but shown here with a linear y axis. The blue curve shows the equilibrium partial pressure over liquid water according to Murphy and Koop (2005) (MKl).
Observations made with standard instruments are misleading each time the atmospheric water content is significantly above saturation. Figure 4 displays the percentage of cases in the time series with supersaturation wri above 105 % within given temperature ranges using 5 ∘C intervals; supersaturation can occur over the full range of temperatures at Dome C and, thus, in all seasons and at all levels, with frequency varying with temperature, but it is more frequent in the intermediate temperature range. The coldest temperatures in the surface atmosphere at Dome C are associated with calm conditions. This may be due to stagnant air slowly cooling radiatively, which should result in supersaturation, or air subsiding from above in association with the general convergence and subsidence on the Antarctic Plateau (Baas et al., 2019; Vignon et al., 2018). In the latter case, adiabatic warming through subsidence and compression reduces relative humidity at a fixed moisture content, thereby contributing to less frequent supersaturation cases at very cold temperatures. At the warmer end of the distribution are the summer days associated with the advection of comparatively warm and aerosol-laden air masses from the lower latitudes. For air masses in the middle of the temperature range, adiabatic and radiative cooling combine to increase the relative humidity of relatively clean air masses contributing to the frequent occurrence of supersaturation wri.
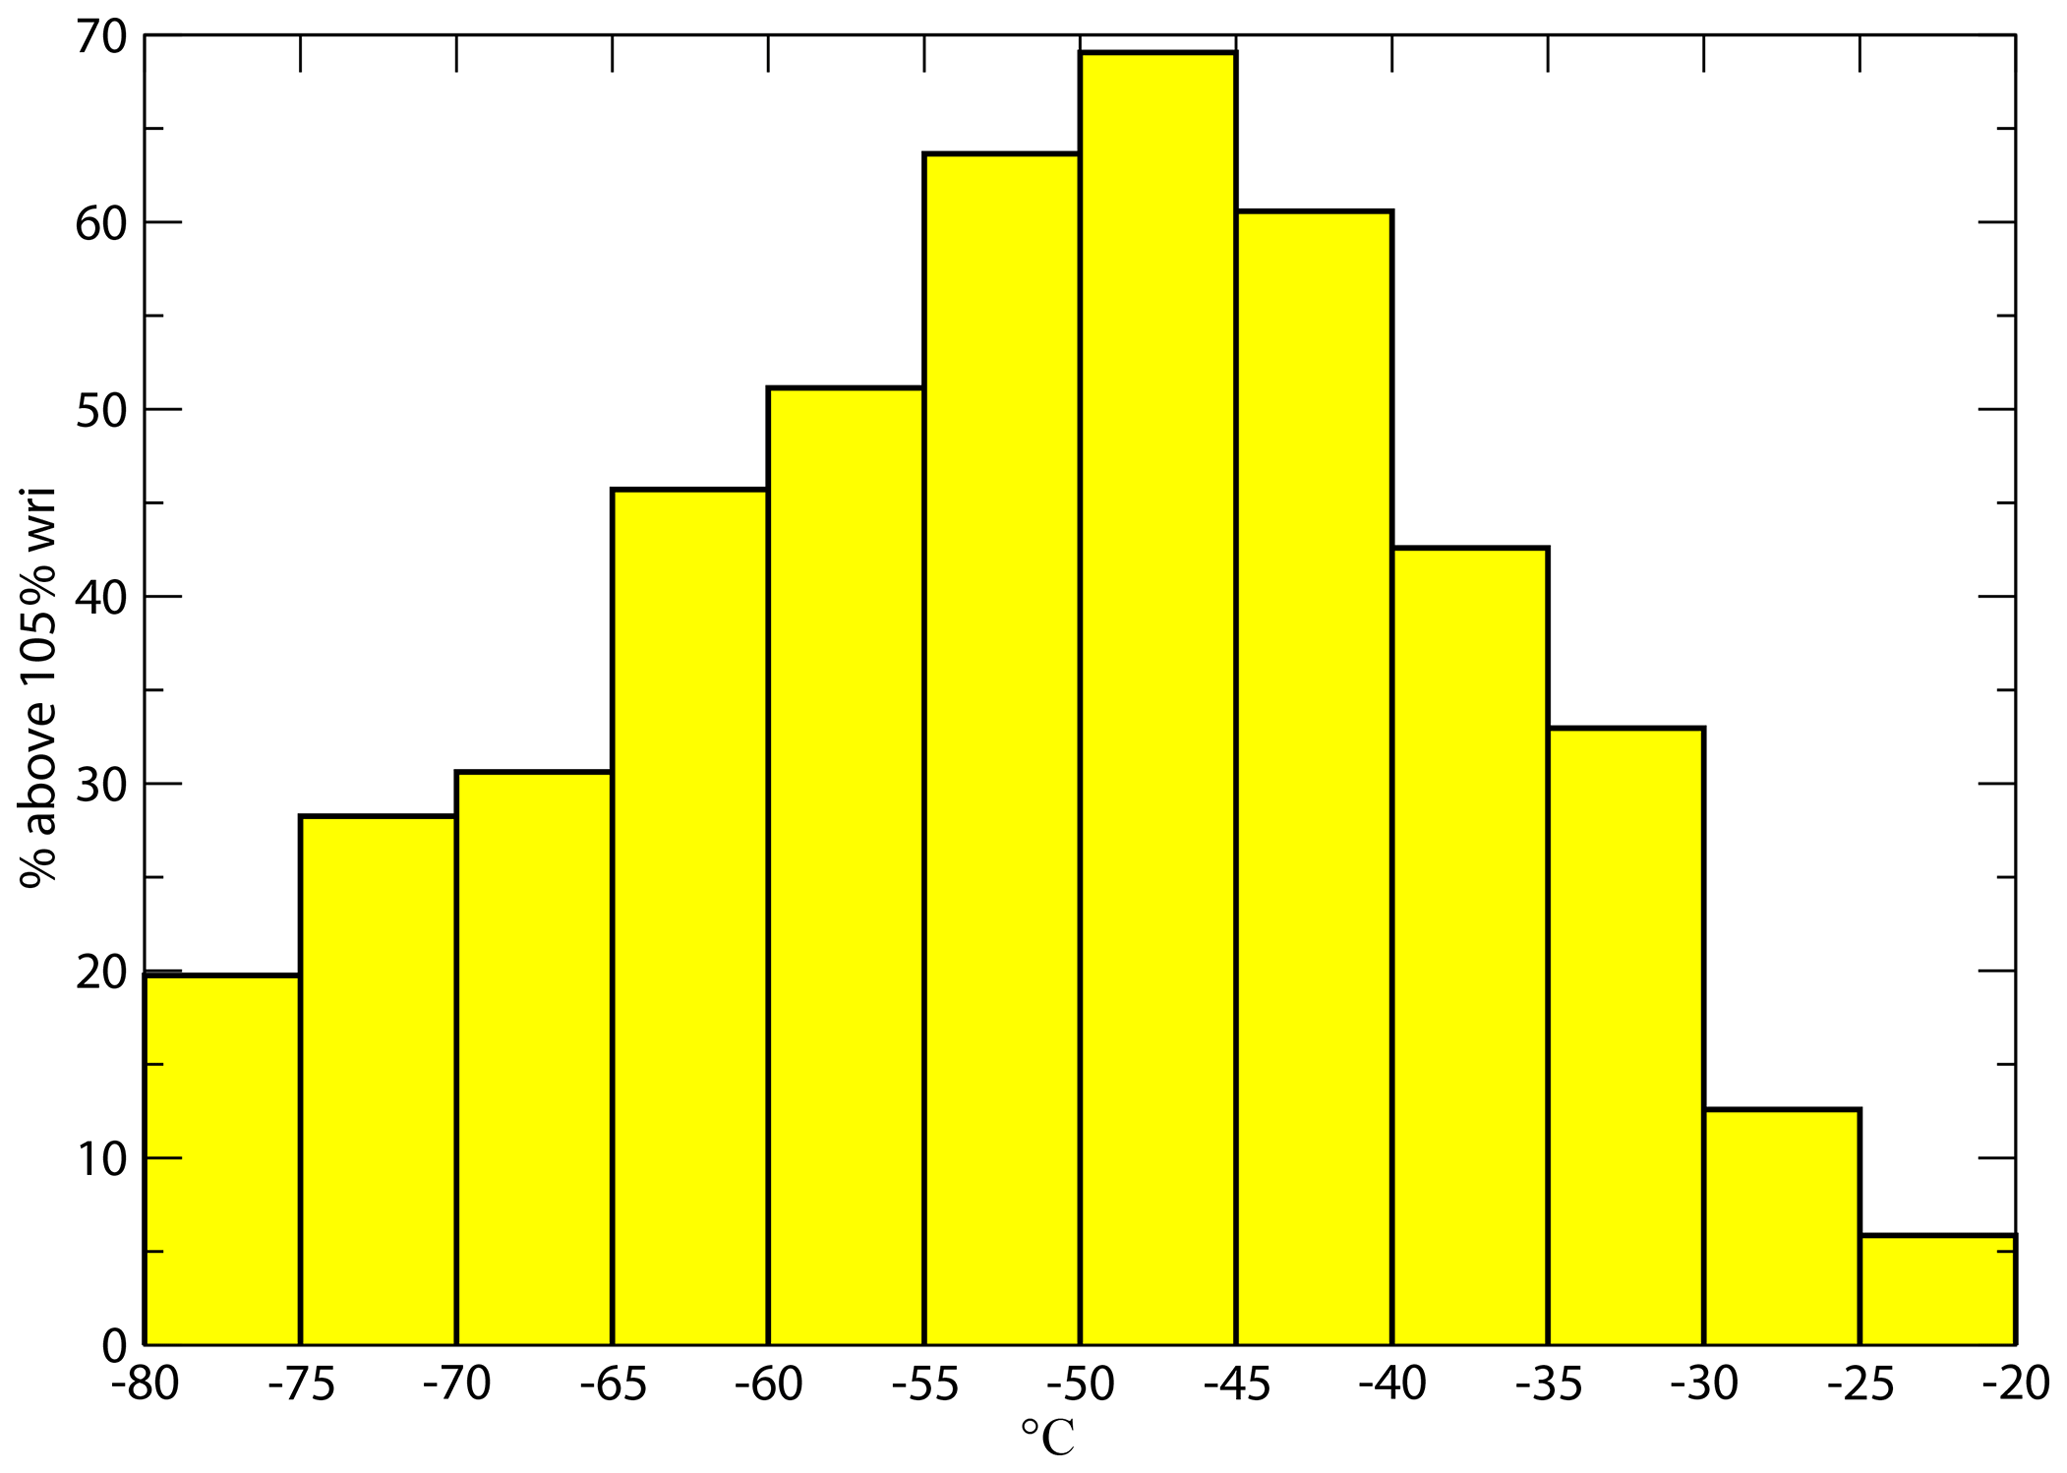
Figure 4Percentage of cases with supersaturation wri above 105 % from 2018 to 2020 binned in 5 ∘C bins from −80 to −20 ∘C.
Figure 5 presents the frequency distribution of occurrences of relative humidity wri in 10 % bins, from 75 %–85 % (centered on 80 % on the x axis) to 135 %–145 % (140 %) for the three levels on the tower instrumented with the paired hygrometers. Below the 100 % threshold, the relative humidity is largest near the surface, and it then decreases with height. This is consistent with temperature inversion that would result in higher relative humidity in the colder layers near the surface, even if the absolute moisture content was the same for all levels. This does not hold for higher RHi values, particularly for the largest RHi values at the intermediate levels rather than at one of the extremes: the profile of RHi with elevation is not monotonic – a fact which is further discussed in Sect. 3.3.
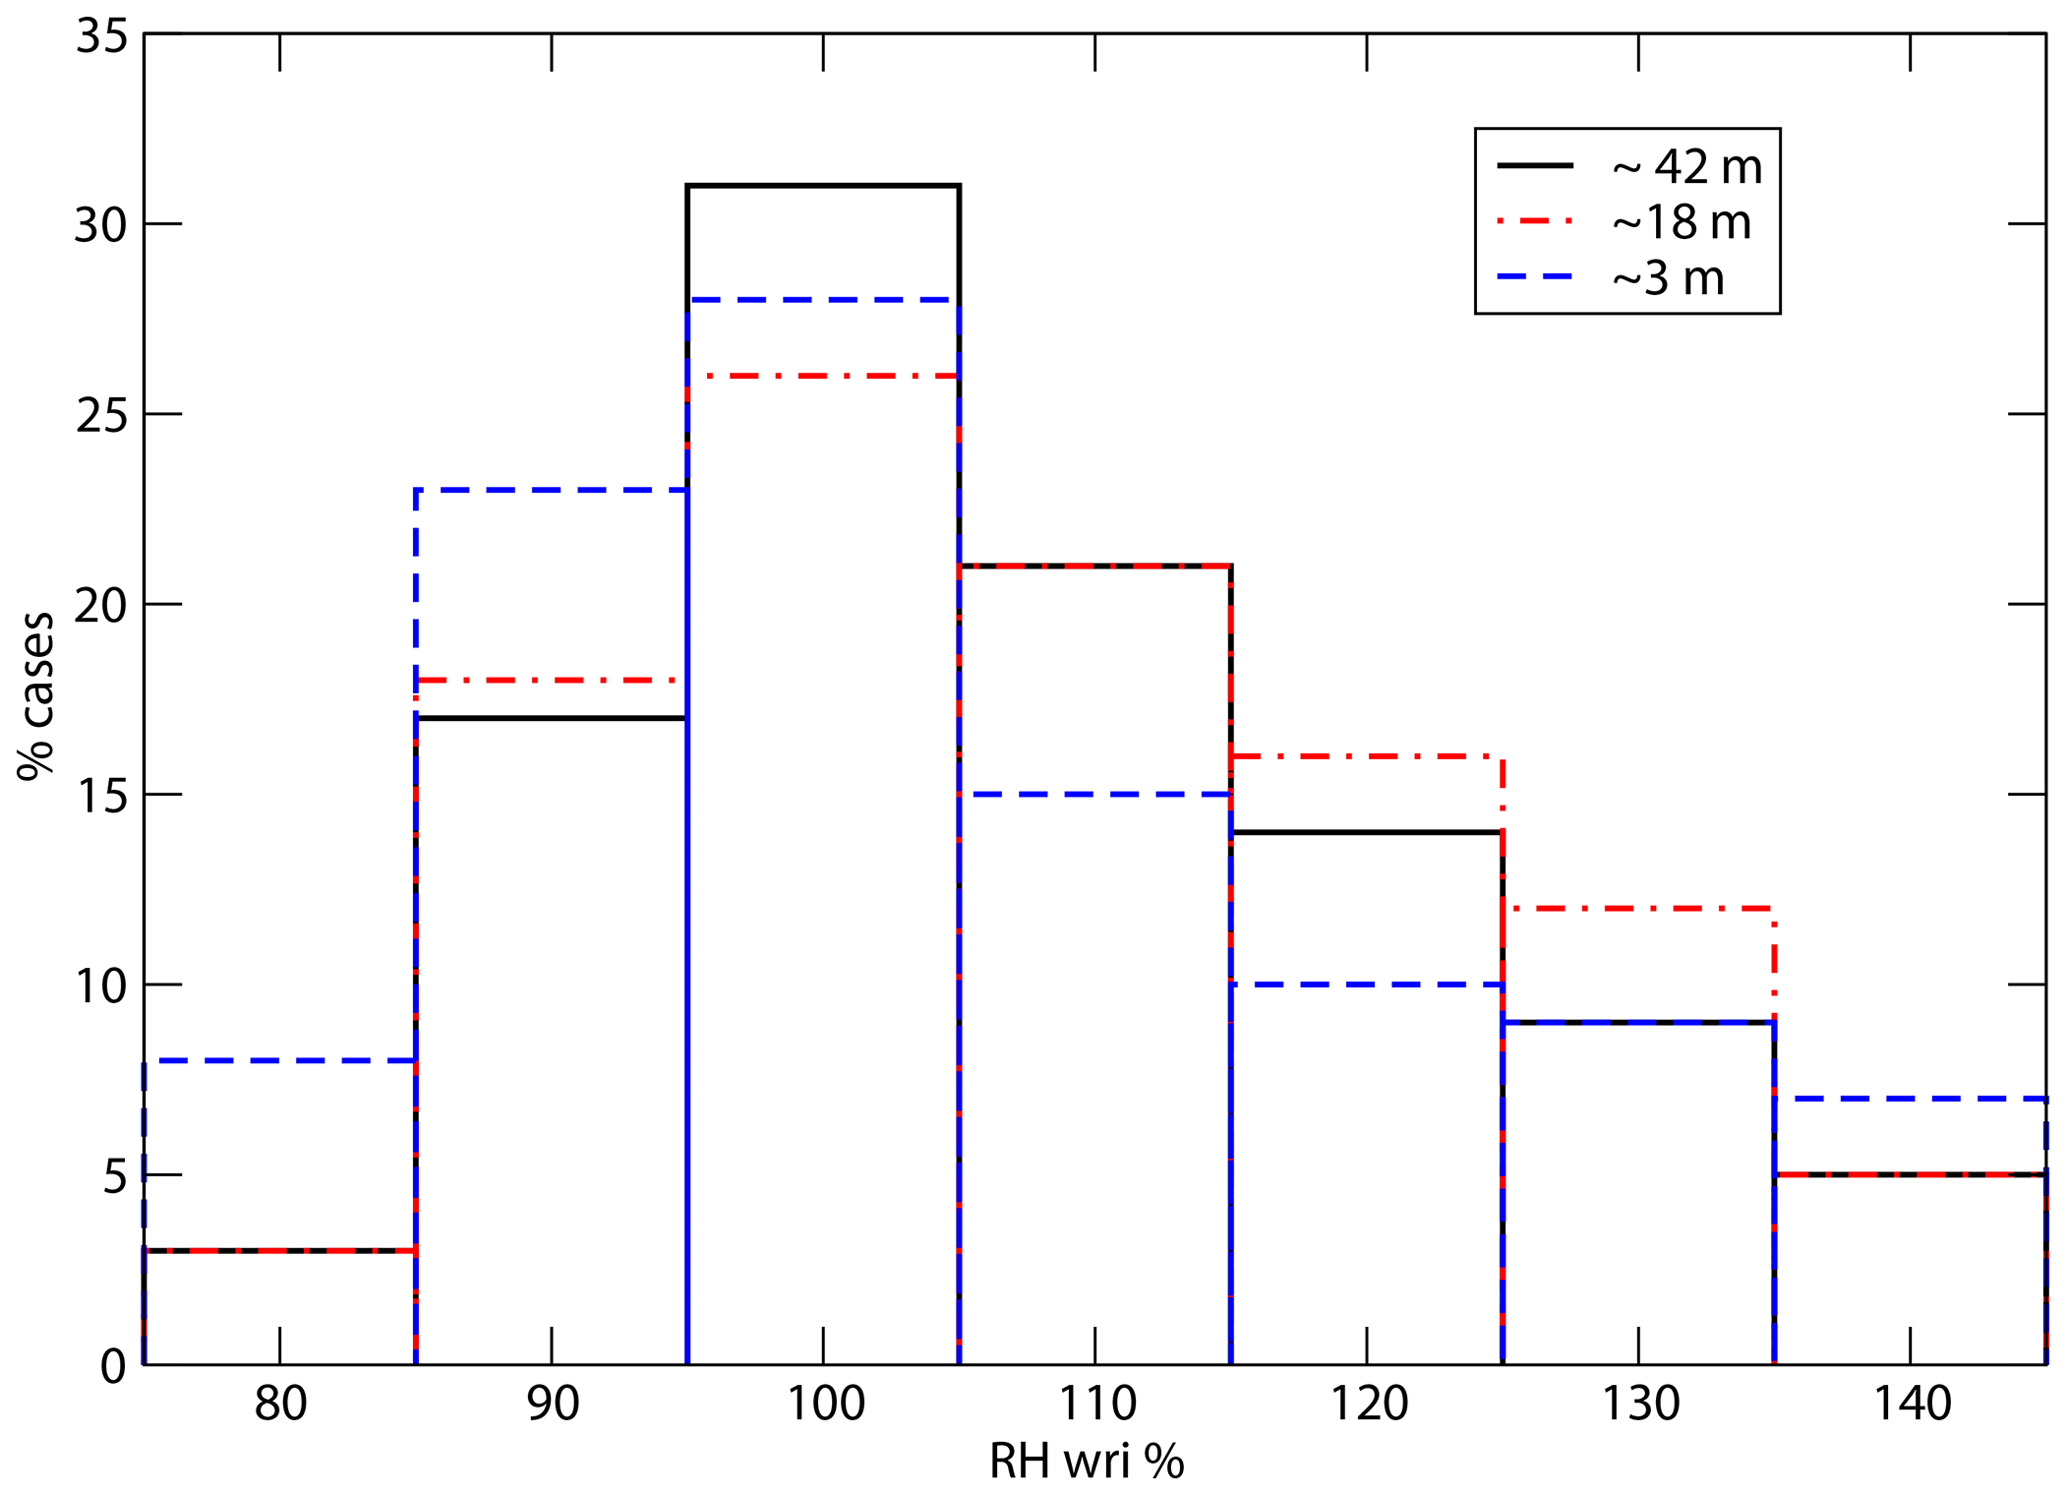
Figure 5Frequency distribution of RHi observed at the three levels on the tower from 2018 to 2020.
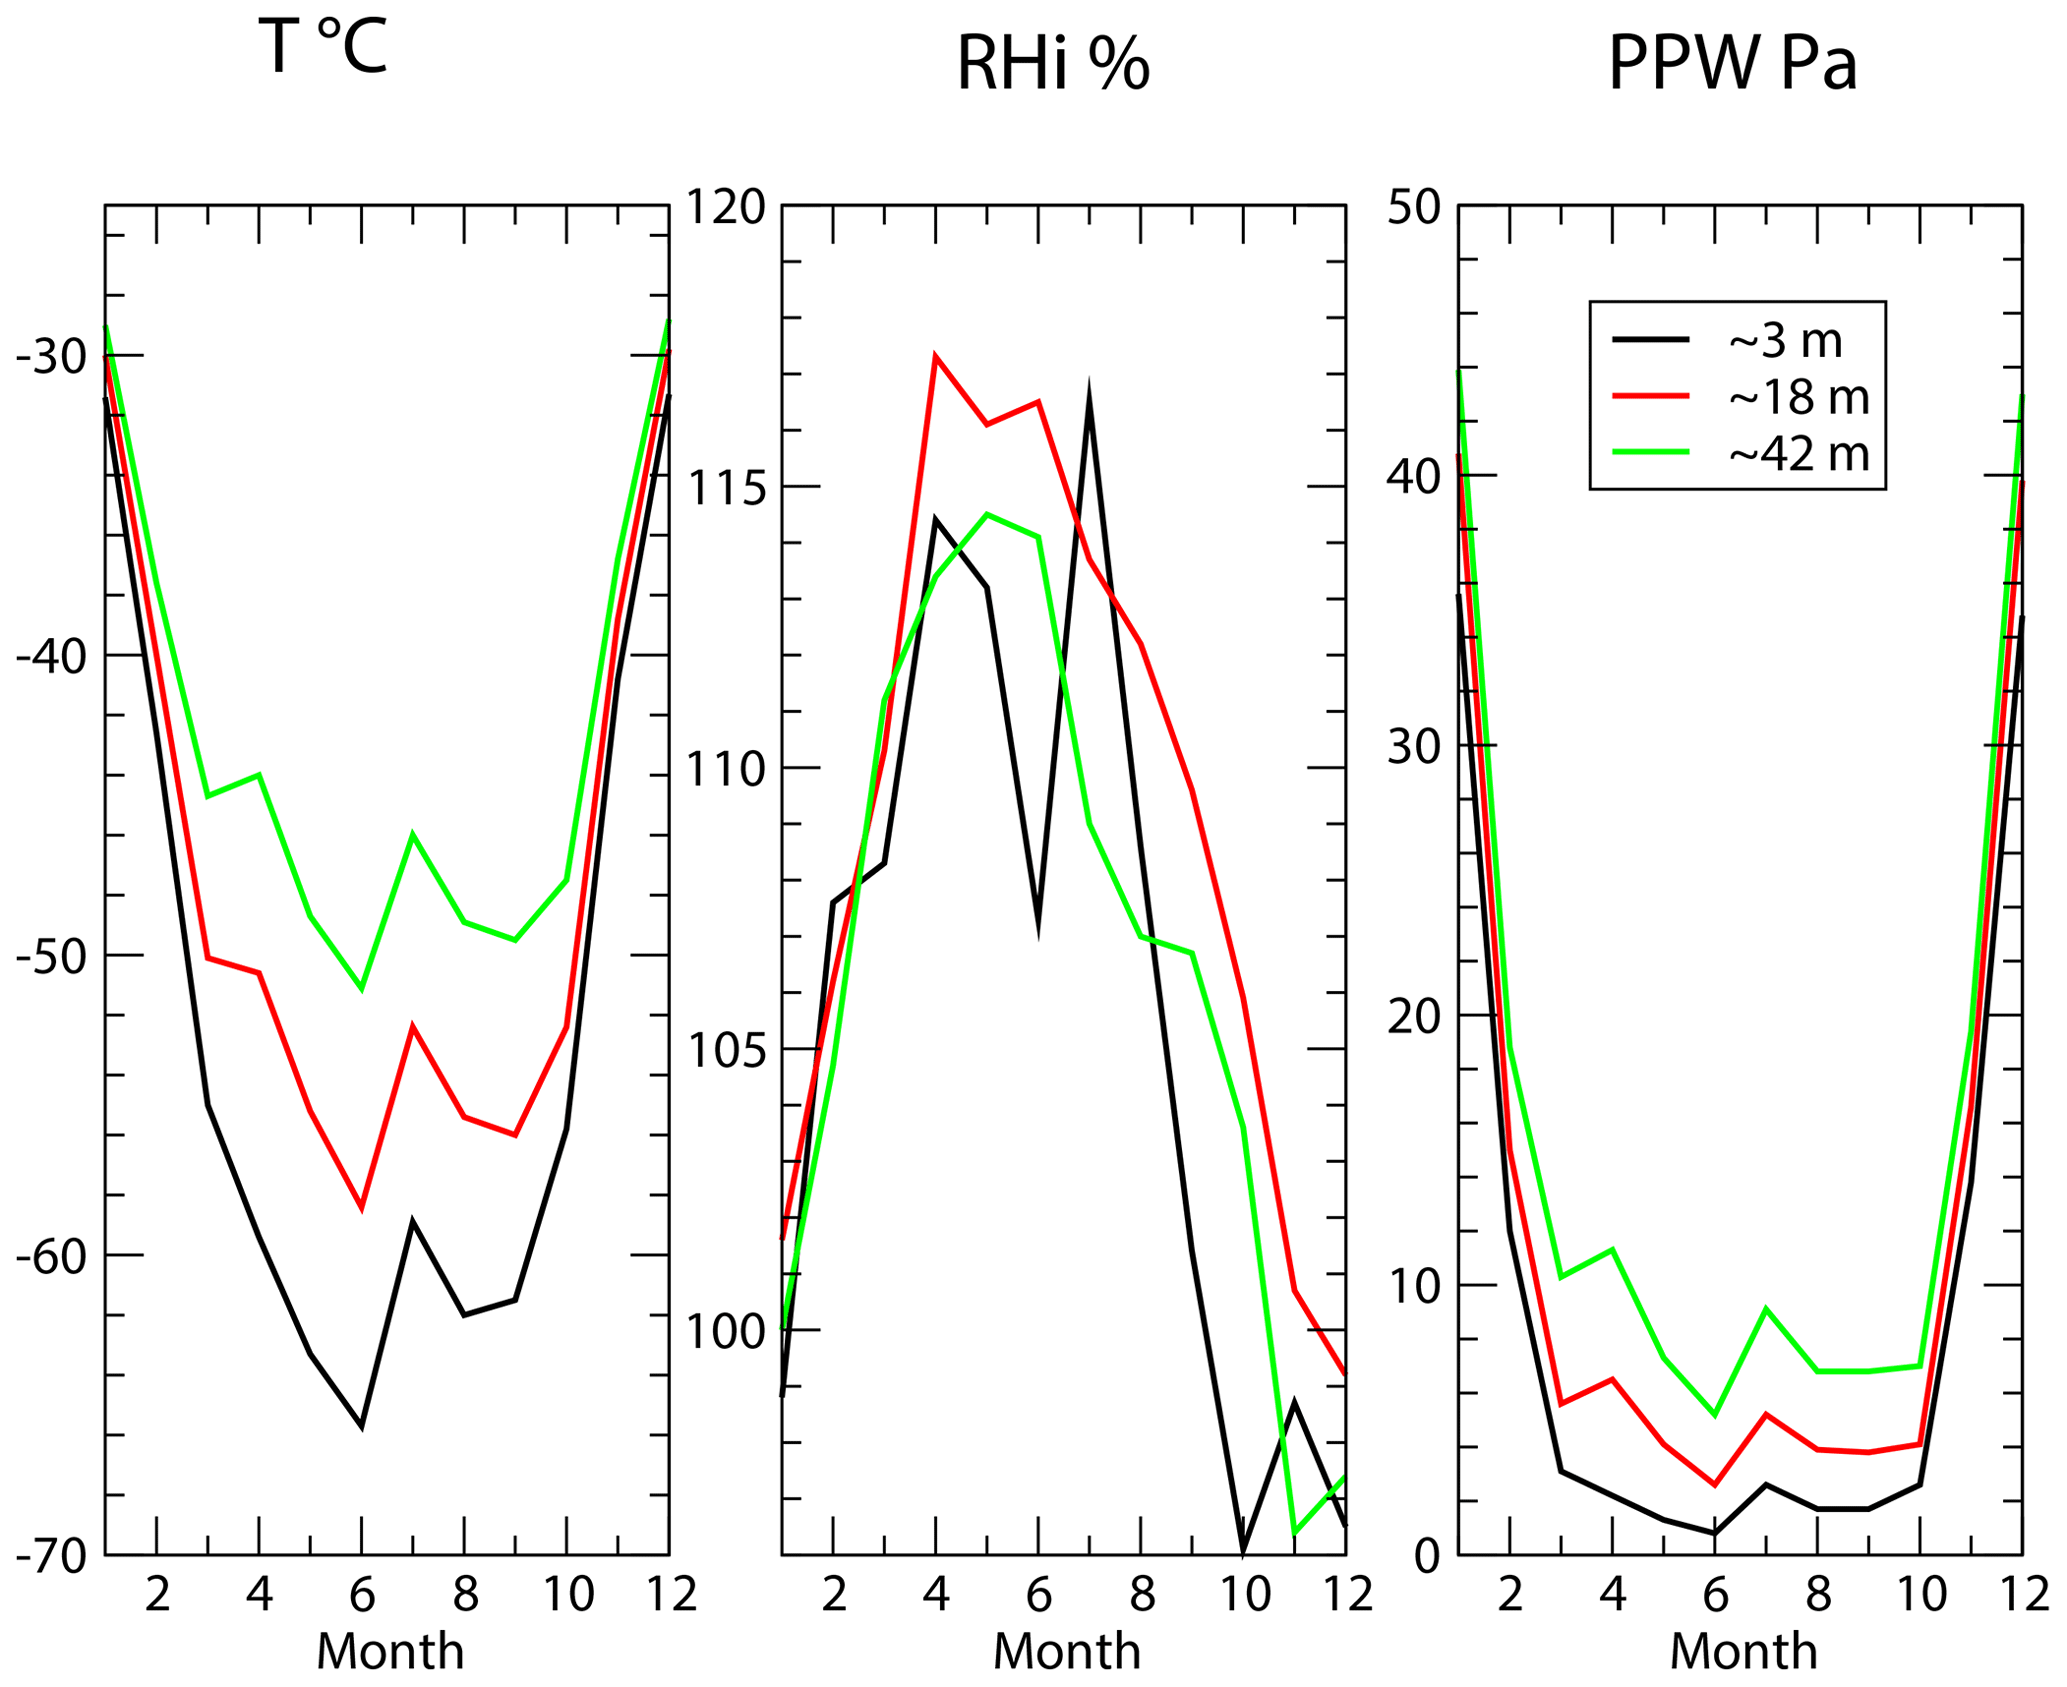
Figure 6Mean seasonal cycle of temperature, RHi and PPW at the three levels over the period from 2018 to 2020.
3.2 Seasonal and diurnal cycles and variability
Beyond the fact that the atmosphere can be super- or undersaturated at Dome C, Fig. 3 indicates that temperature is a major controller of the water vapor content. As a consequence, one expects a strong diurnal and seasonal variability of PPW in response to the strong variations in temperature. The strong seasonal cycle is shown in Fig. 6, which also indicates that RHi variation is the inverse of and somewhat more confused than that for temperature and PPW. This is not unexpected, as RHi is not a simple linear function of the two other variables. Both temperature and PPW show a relatively short maximum in summer and minimal values during much of the rest of the year. A local maximum of temperature and PPW is seen in July during the winter period, which might account for a sharp peak in RHi at the lowest level observed. However, for temperature, this does not appear when a 10-year average is used (not shown), and Fig. 7 confirms that this local winter maximum is within the natural interannual variability for this site and is not climatologically significant.
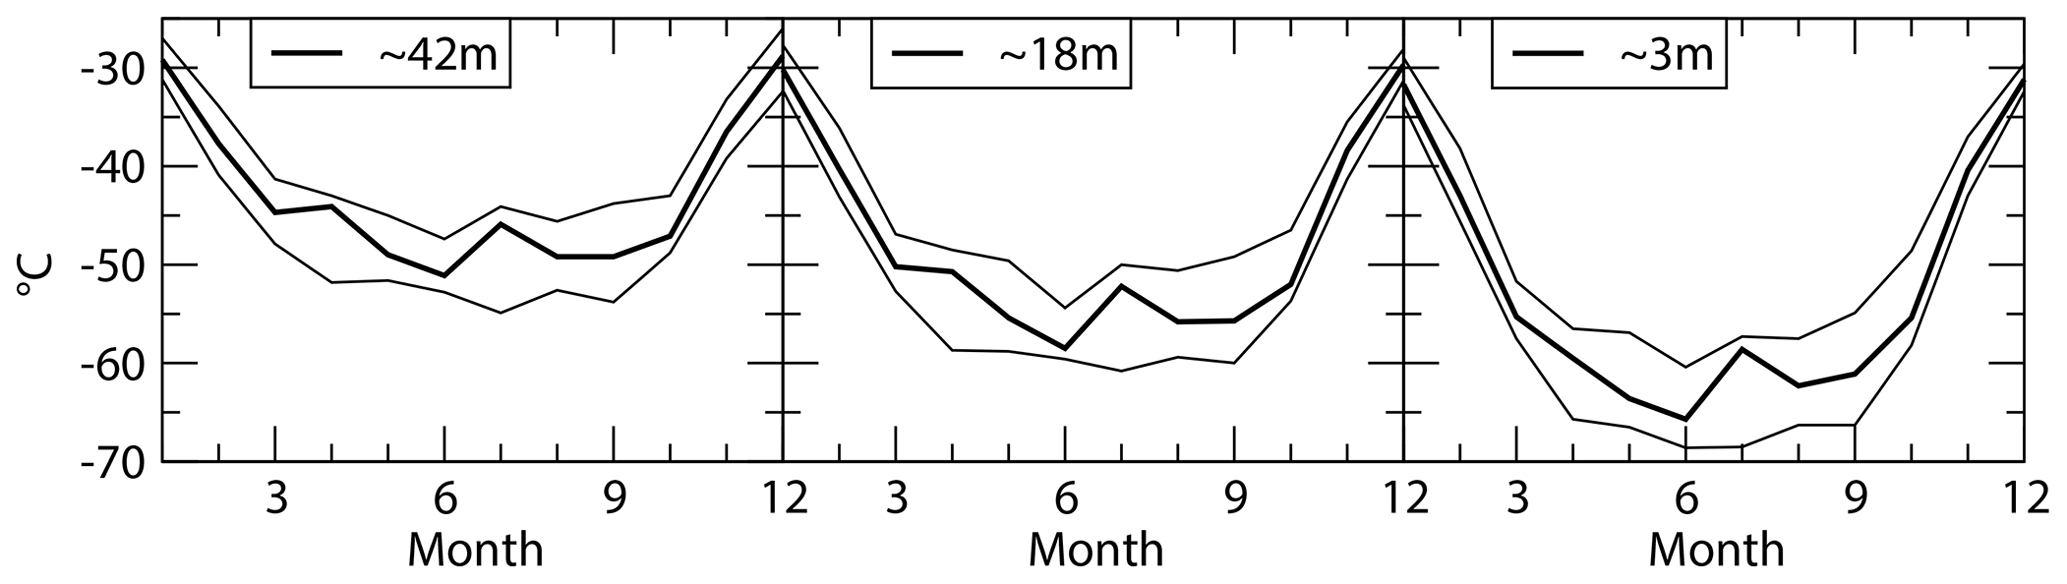
Figure 7Seasonal cycle of temperature averaged over 3 years (2018–2020) at the three levels with paired, modified thermohygrometers (bold line). The thin lines show the envelope of the ±2 standard deviation of the interannual variability from the 10-year (2010–2019) seasonal cycle published in Genthon et al. (2021b).
Figure 8 shows the mean 24 h cycle of temperature, RHi and PPW in December (full summer, panels a, c and e) and June (full winter, panels b, d and f). Here, “24 h cycle” does not necessarily refer to a diurnal solar cycle, as there is no forcing of a diurnal cycle during the winter night. This is well illustrated by the plots in Fig. 8b, d and f, which show little variation over 24 h. On the other hand, winter is when vertical gradients are largest: while temperature increases by more than 15 ∘C across 40 m height, PPW increases by a factor of 5. The increase with height is smooth for temperature and PPW but not for RHi; for the latter, much of the increase with height is between the two lower levels. Between the two upper levels RHi decreases in winter, while both mean temperature and mean PPW continue to increase. Therefore, the combined vertical structure of temperature and moisture deserves special attention.
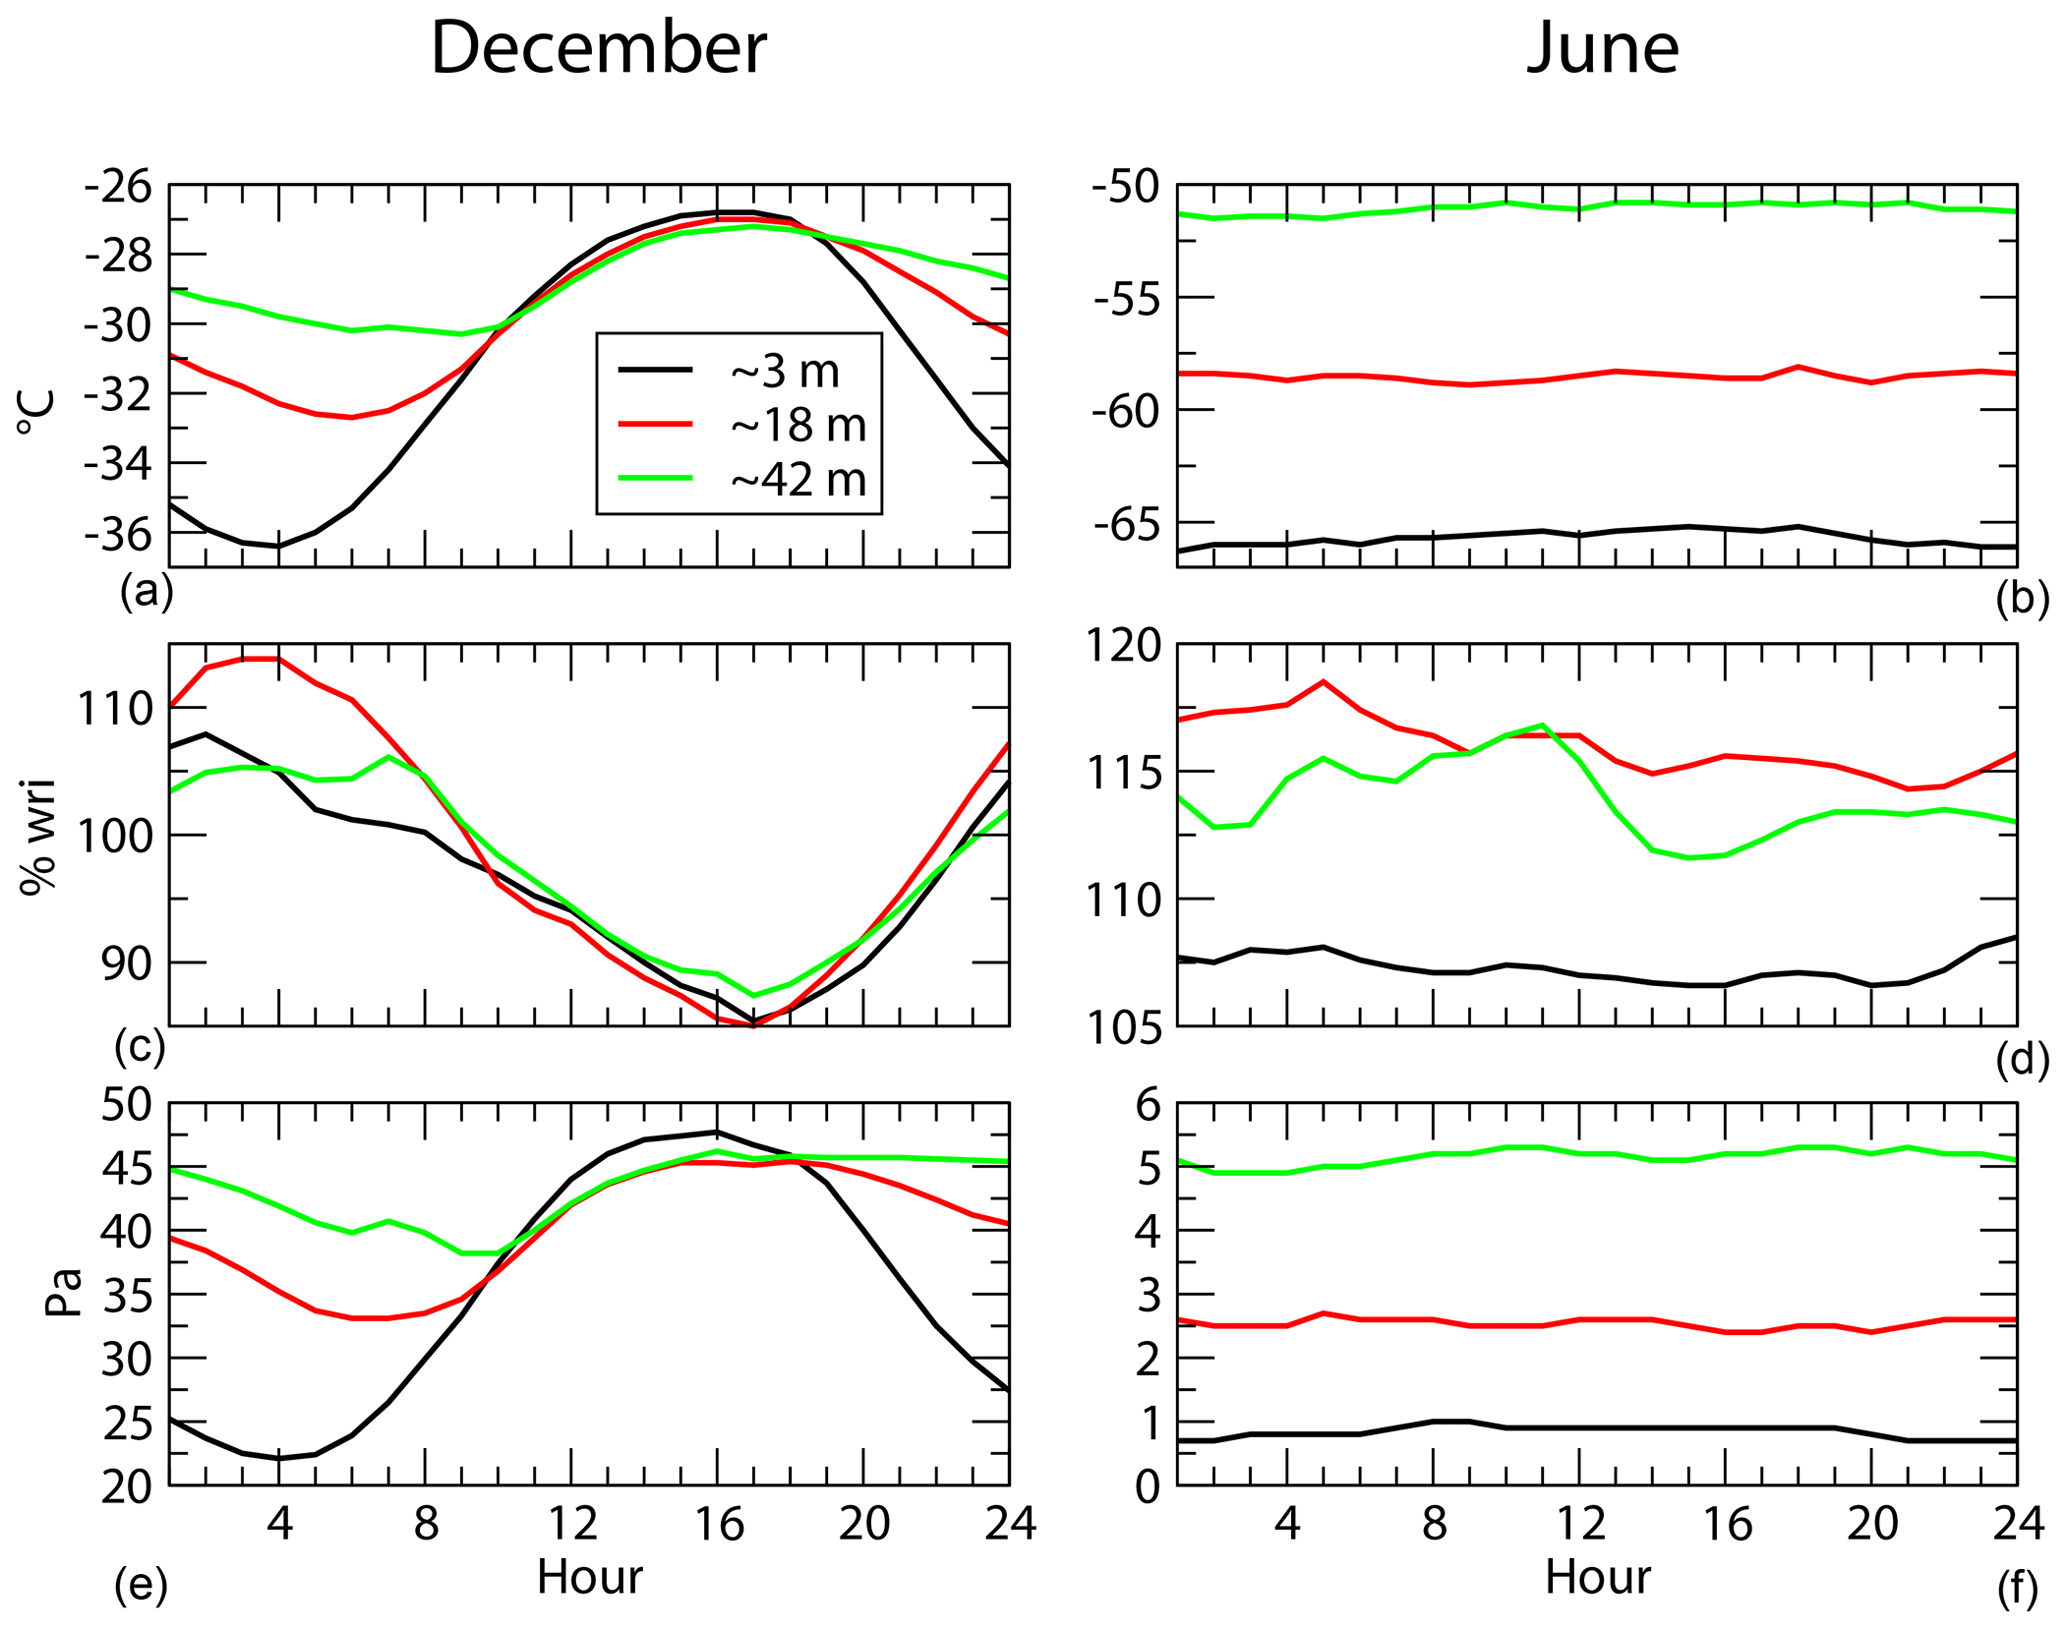
Figure 8Mean 24 h cycle of temperature (a, b), RHi (c, d) and PPW (e, f) in December (a, c, e) and June (b, d, f) averaged over 2018–2020. Time is local time (UTC+8 h).
3.3 Vertical profiles and gradients
Figure 9 presents the annual average vertical profiles of annual temperature, RHi and PPW averaged for the 3-year data set. Unsurprisingly, lower PPW is associated with a colder temperature near the surface. Both temperature and PPW show monotonically increasing values with height. This is not the case for RHi, which is consistently above 100 % but for which the maximum is at the mid-level, with similarly lower values at the top and bottom of the observed atmospheric layer. The nonlinear dependence of relative humidity on temperature and atmospheric water content is responsible for this. Nonlinearity also affects temporal averaging, but we looked at individual times to confirm that the maximum at the intermediate level is not a result of this averaging. HUMICAP ®-based sensors, such as the HMP155, report the relative humidity rather than the atmospheric moisture content. Thus, at first sight, the source data at a site like Dome C may appear peculiar because of the non-monotonic profile, but this feature is correct. The vertical profile of moisture content, here characterized by PPW (which directly relates to concentration because the total pressure varies negligibly over 40 m), determines the turbulent fluxes. On average, the PPW gradient is positive throughout the sampled air layer, but it varies in time and can switch direction.
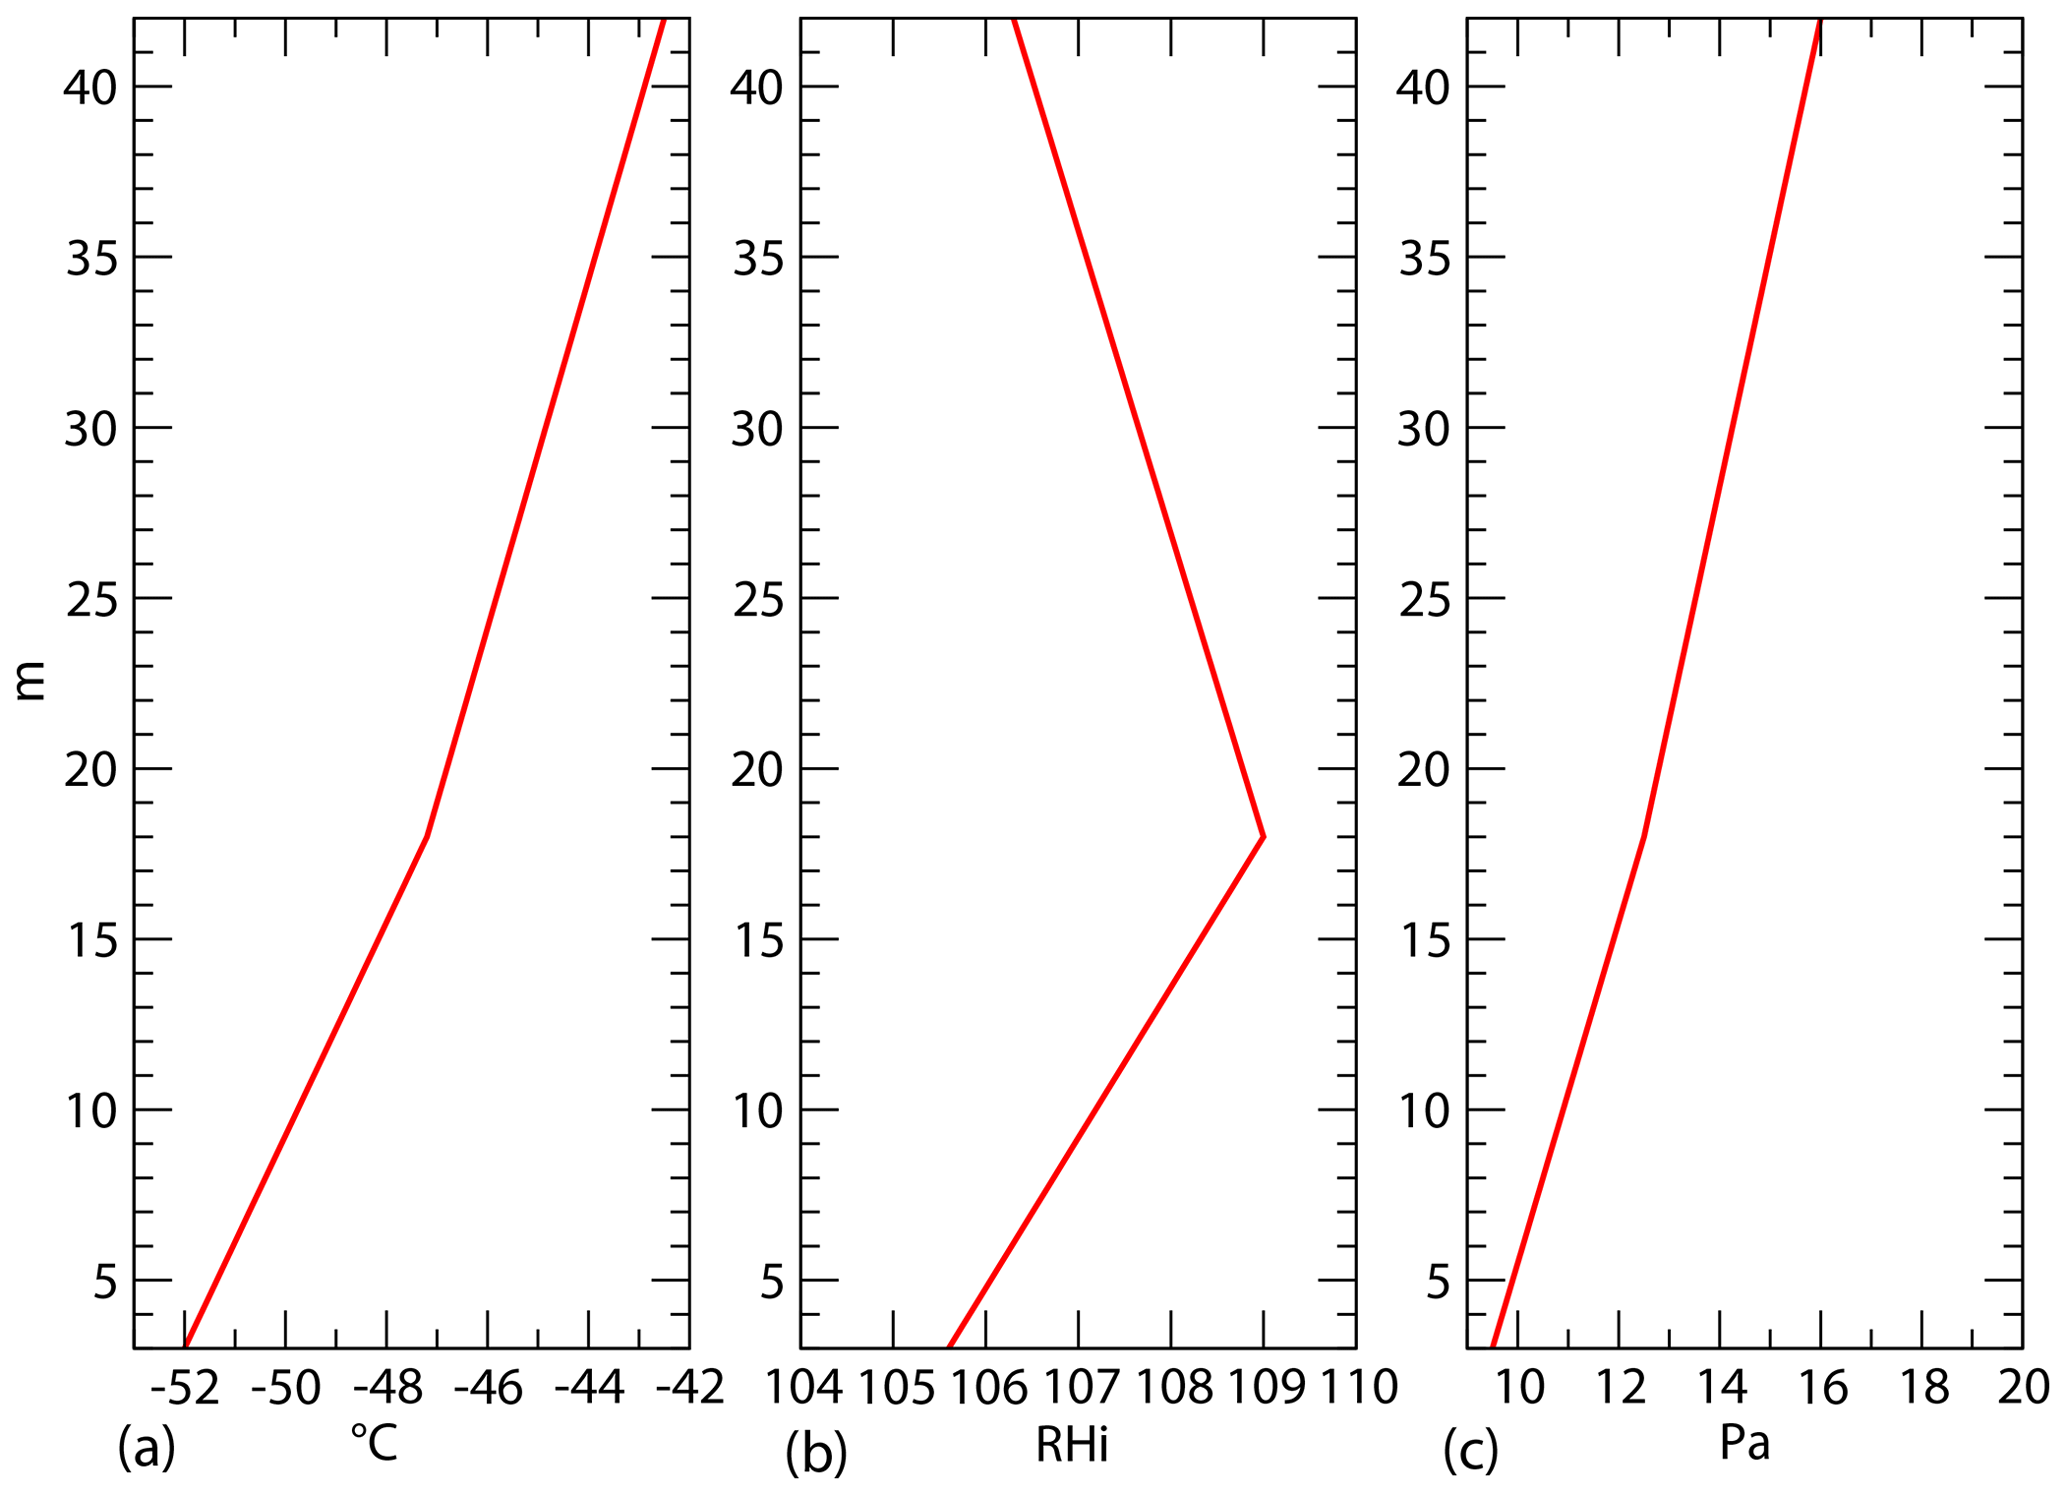
Figure 9Annual mean vertical profile of temperature (a), RHi (b) and PPW (c) for observations made from 2018 to 2020.
Correlations of high-frequency vertical wind speed and moisture fluctuations are necessary to calculate the amplitude of the vertical moisture flux in the boundary layer, but models parameterize the fluxes as a function of vertical gradients. Estimating the fluxes themselves is beyond the scope of the present data paper. On the other hand, the gradients are further described here because they provide a preliminary source for evaluating the ability of models to parameterize fluxes: if the gradients are wrong in the models, the fluxes are unlikely to be correct (and vice versa). In 89.6 % of the time samples from the observation period from 2018 to 2020, the gradient of PPW over the observed range of heights has the same sign as the mean gradient shown in Fig. 9: positive upward, which results in a positive downward turbulent moisture flux (i.e., the atmosphere “feeds” the surface snowpack). Figure 10 shows that, although it is less frequent in summer than in winter, a positive gradient upward is most frequent in all seasons, even in summer when warmer temperature may favor the sublimation of surface snow. However, the gradient is inverted more than one-third of the time in December and January. When this occurs, the water vapor flux is upward, exporting surface sublimated moisture. Over the rest of the year, this occurs a small fraction of the time, but because this is when PPW is largest (Fig. 6), the accumulated net impact on the moisture budget in the surface atmosphere may be large.
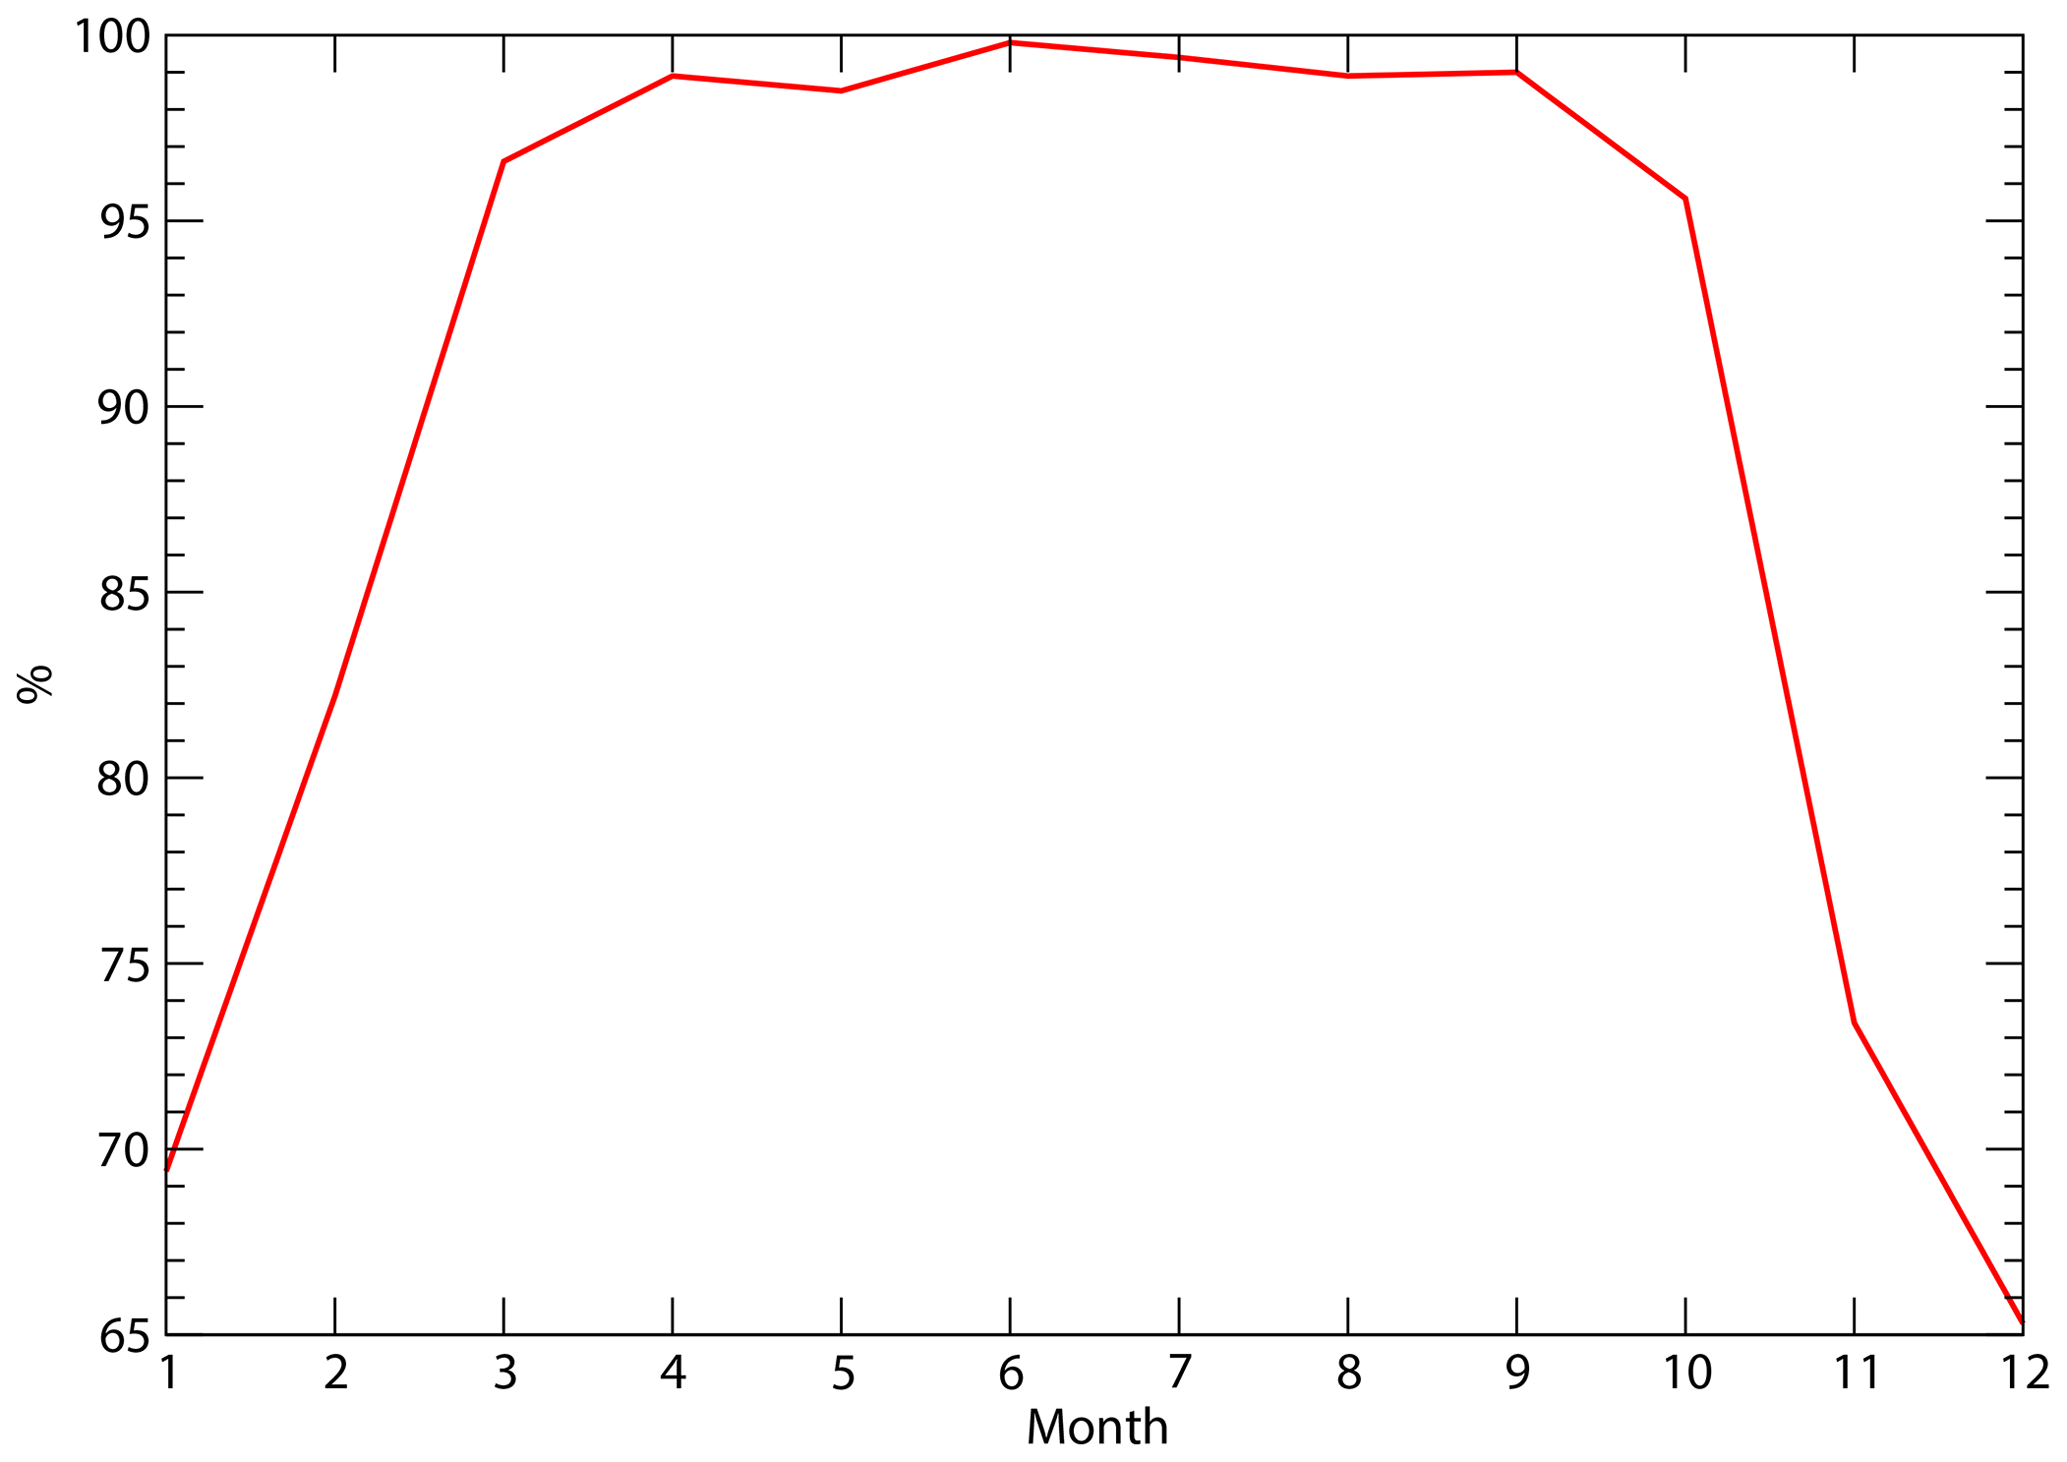
Figure 10Monthly frequency of cases of an upward vertical gradient of PPW, implying downward turbulent moisture flux.
For the same reason, one expects that a strong diurnal cycle of temperature is associated with a strongly varying vertical gradient of atmospheric moisture in summer (Fig. 8). On average, the gradient is positive upward more than 67 % of the time in December and January. Figure 11 shows that this is very frequent during the coldest “nighttime” hours in December and January (although there is no real solar night at this time of year). Cases of a downward positive gradient (upward turbulent flux) only occur significantly during the peak of the local day, yet even then the gradient is positive downward (upward moisture flux) more than 60 % of the time. Again, this is when the atmospheric moisture content may be largest, fed by surface evaporation and vertical mixing by thermal convection (Genthon et al., 2021b). In fact, Fig. 8 shows that PPW differs marginally at the three levels in the local afternoon in December: the vertical gradient is very small because mixing and thermal convection occur. Turbulent mixing and shallow convection are often treated separately in meteorological and climate models, with distinct parameterizations. However, the observed profiles of temperature can be used to characterize shallow convection (when temperature is vertically homogeneous) and test models; on the other hand, observations of atmospheric moisture provide limited added value for thermal convection.
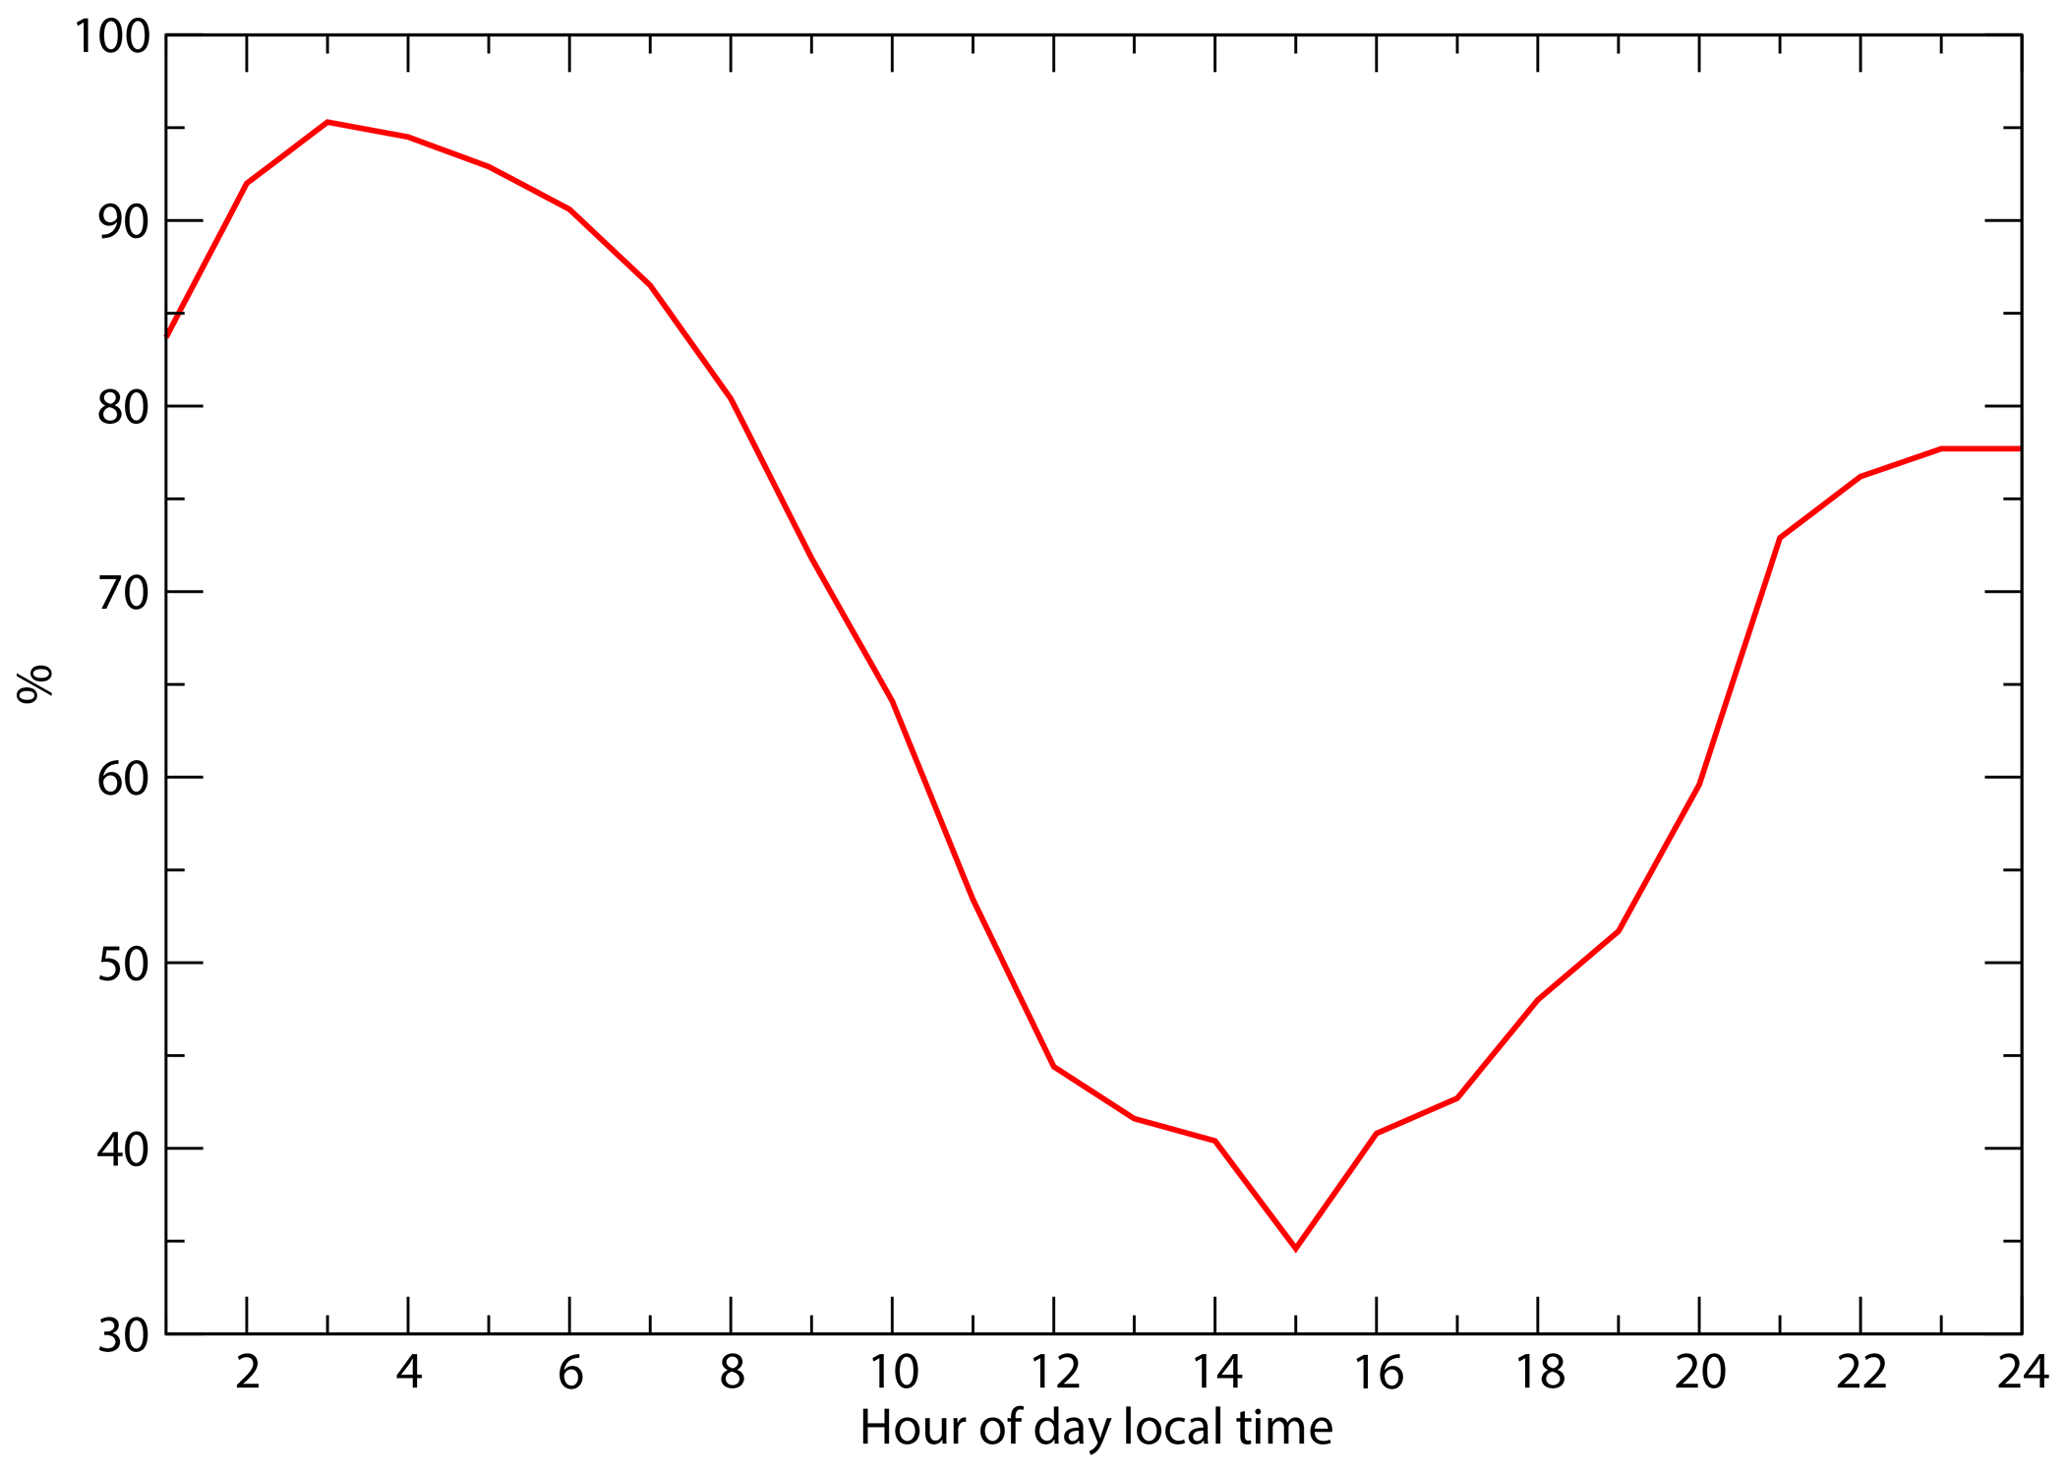
Figure 11Hourly frequency of cases with an upward vertical gradient of PPW, implying downward turbulent moisture flux in December and January (austral summer) for the period from 2018 to 2020.
HMP155 sensors report relative humidity with respect to liquid water (Sect. 2), but this is subject to the limitations related to supersaturation wri, as discussed above. In practice, unless heated, such a sensor cannot report relative humidity wrl above that corresponding to saturation with respect to ice. The heated HMP155 in the sensor pair shown in Fig. 1 is not affected by this, but it is at a temperature higher than the environment. Just as for RHi, relative humidity with respect to liquid water (RHl) at ambient temperature, even below freezing, can be calculated by combining the temperature and moisture from the heated HMP155 and the temperature reported by the unheated HMP155 (Fig. 1) using the GG formulae. Just as supersaturation wri is possible, even if, in principle, thermodynamically unstable, supercooled water and liquid water clouds can exist at temperatures well below 0 ∘C (Sassen et al., 1985; Listowski et al., 2019; Ricaud et al., 2020a). Using a heated hygrometer, King and Anderson (1999) observed frequent ice supersaturation at Halley Station but no saturation wrl. They suggested that this indicated that, even in the clean polar air, cloud condensation nuclei (CCN), which will initiate droplet formation at very low supersaturations wrl, are relatively abundant, whereas ice nucleating particles (INPs) are rare. In even colder and cleaner polar atmosphere, such as the surface atmosphere at Dome C, one might expect supercooled water to occur. This was reported at higher levels in the boundary layer using remote sensing techniques (Ricaud et al., 2017). In fact, as RHl < RHi, the occurrence of supercooled liquid water implies that RHl ∼100 % and, thus, that the air is supersaturated with respect to ice.
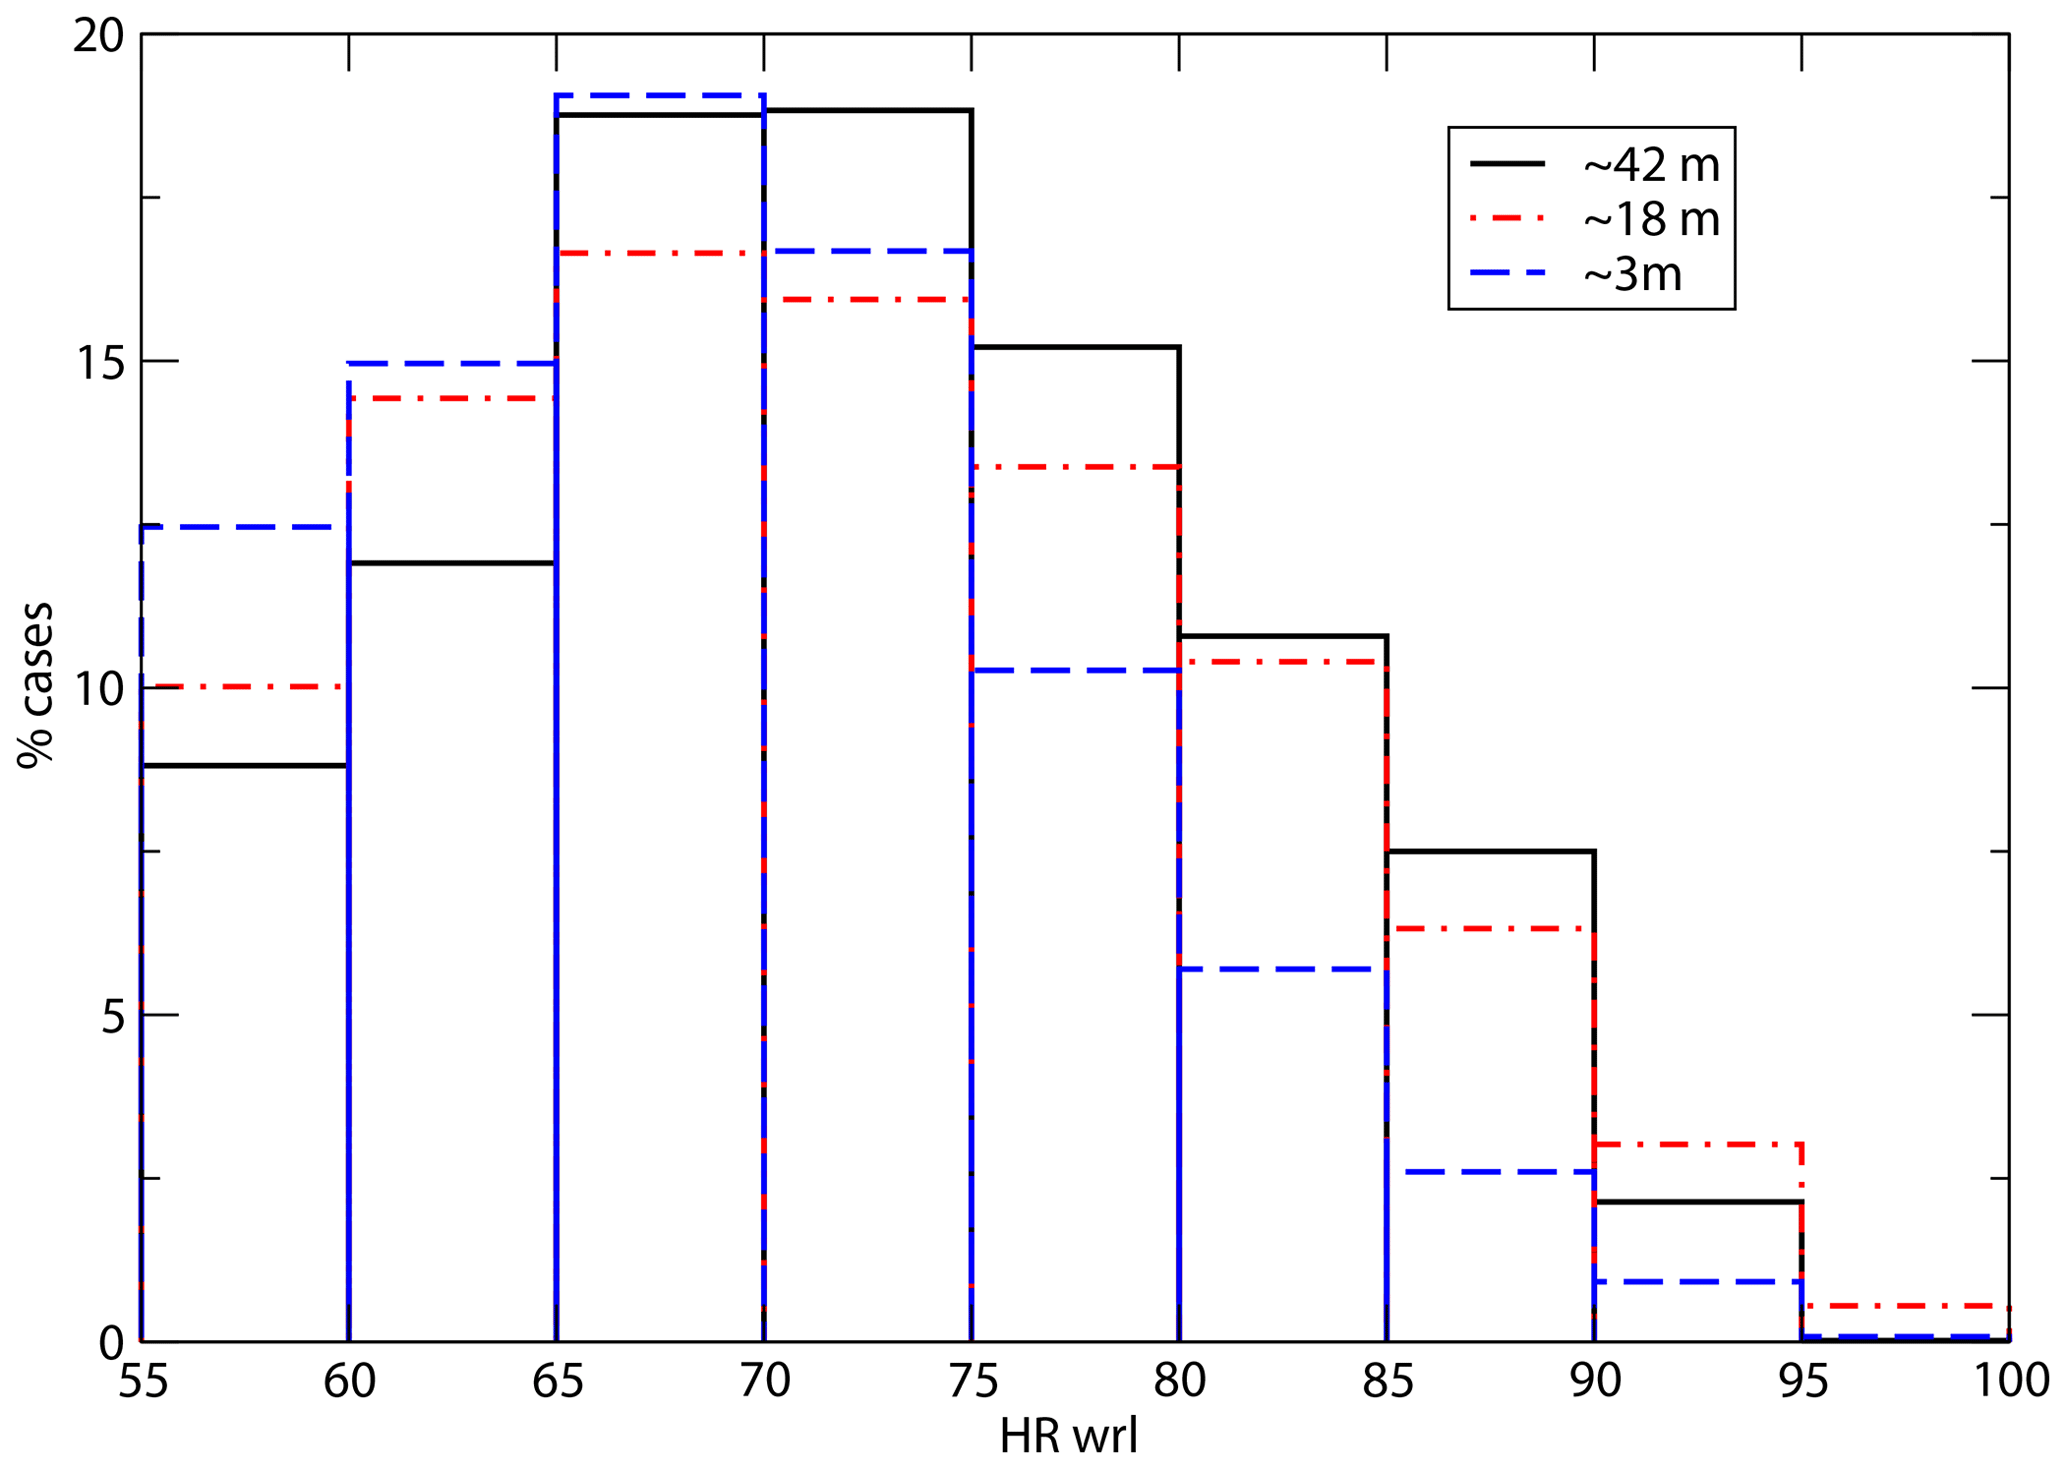
Figure 12Frequency distribution of occurrences of RHl at the three levels on the tower for the period from 2018 to 2020.
Figure 12 displays the frequency distribution of RHl calculated using the observations reported here and the Murphy and Koop (2005) parameterization. RHl rarely reaches close to 100 % (above 95 % less than 0.55 % of the time; see also Fig. 3b, blue curve). The vertical gradient of RHl inverts as RHl increases, from a downward to an upward gradient. The largest RHl occurs at the mid-level, possibly due to the nonlinearity of the relation between saturation RHl and air temperature and moisture content, just as for RHi (Fig. 10). Saturation or even slight supersaturation wrl can occur due to the surface tension of liquid droplets if water is present in the liquid phase. Figure 12 shows that this rarely occurs. Instead, one may expect that as RHl nears 100 %, the water condenses and forms a cloud. While in the field deploying and attending to the instruments during the austral summer, co-authors Christophe Genthon and Dana E. Veron observed regular occurrences of surface haze in the early morning that then progressively vanished after ∼ 06:00 LT as the temperature rose from the nighttime minimum. This is quite coherent with the few days in January 2020 shown in Fig. 13, during which RHl regularly increased in the evening as the temperature cooled and then reached a maximum (that was slightly lower than 100 %) in the following early morning. The fact that RHl does not quite reach 100 % before condensation may be due to instrumental and conversion inaccuracies. It may also reflect that moisture is not homogeneously distributed on small scales and that it may locally reach 100 %, even if not at the site where the measurement is made, triggering condensation at the larger scale.
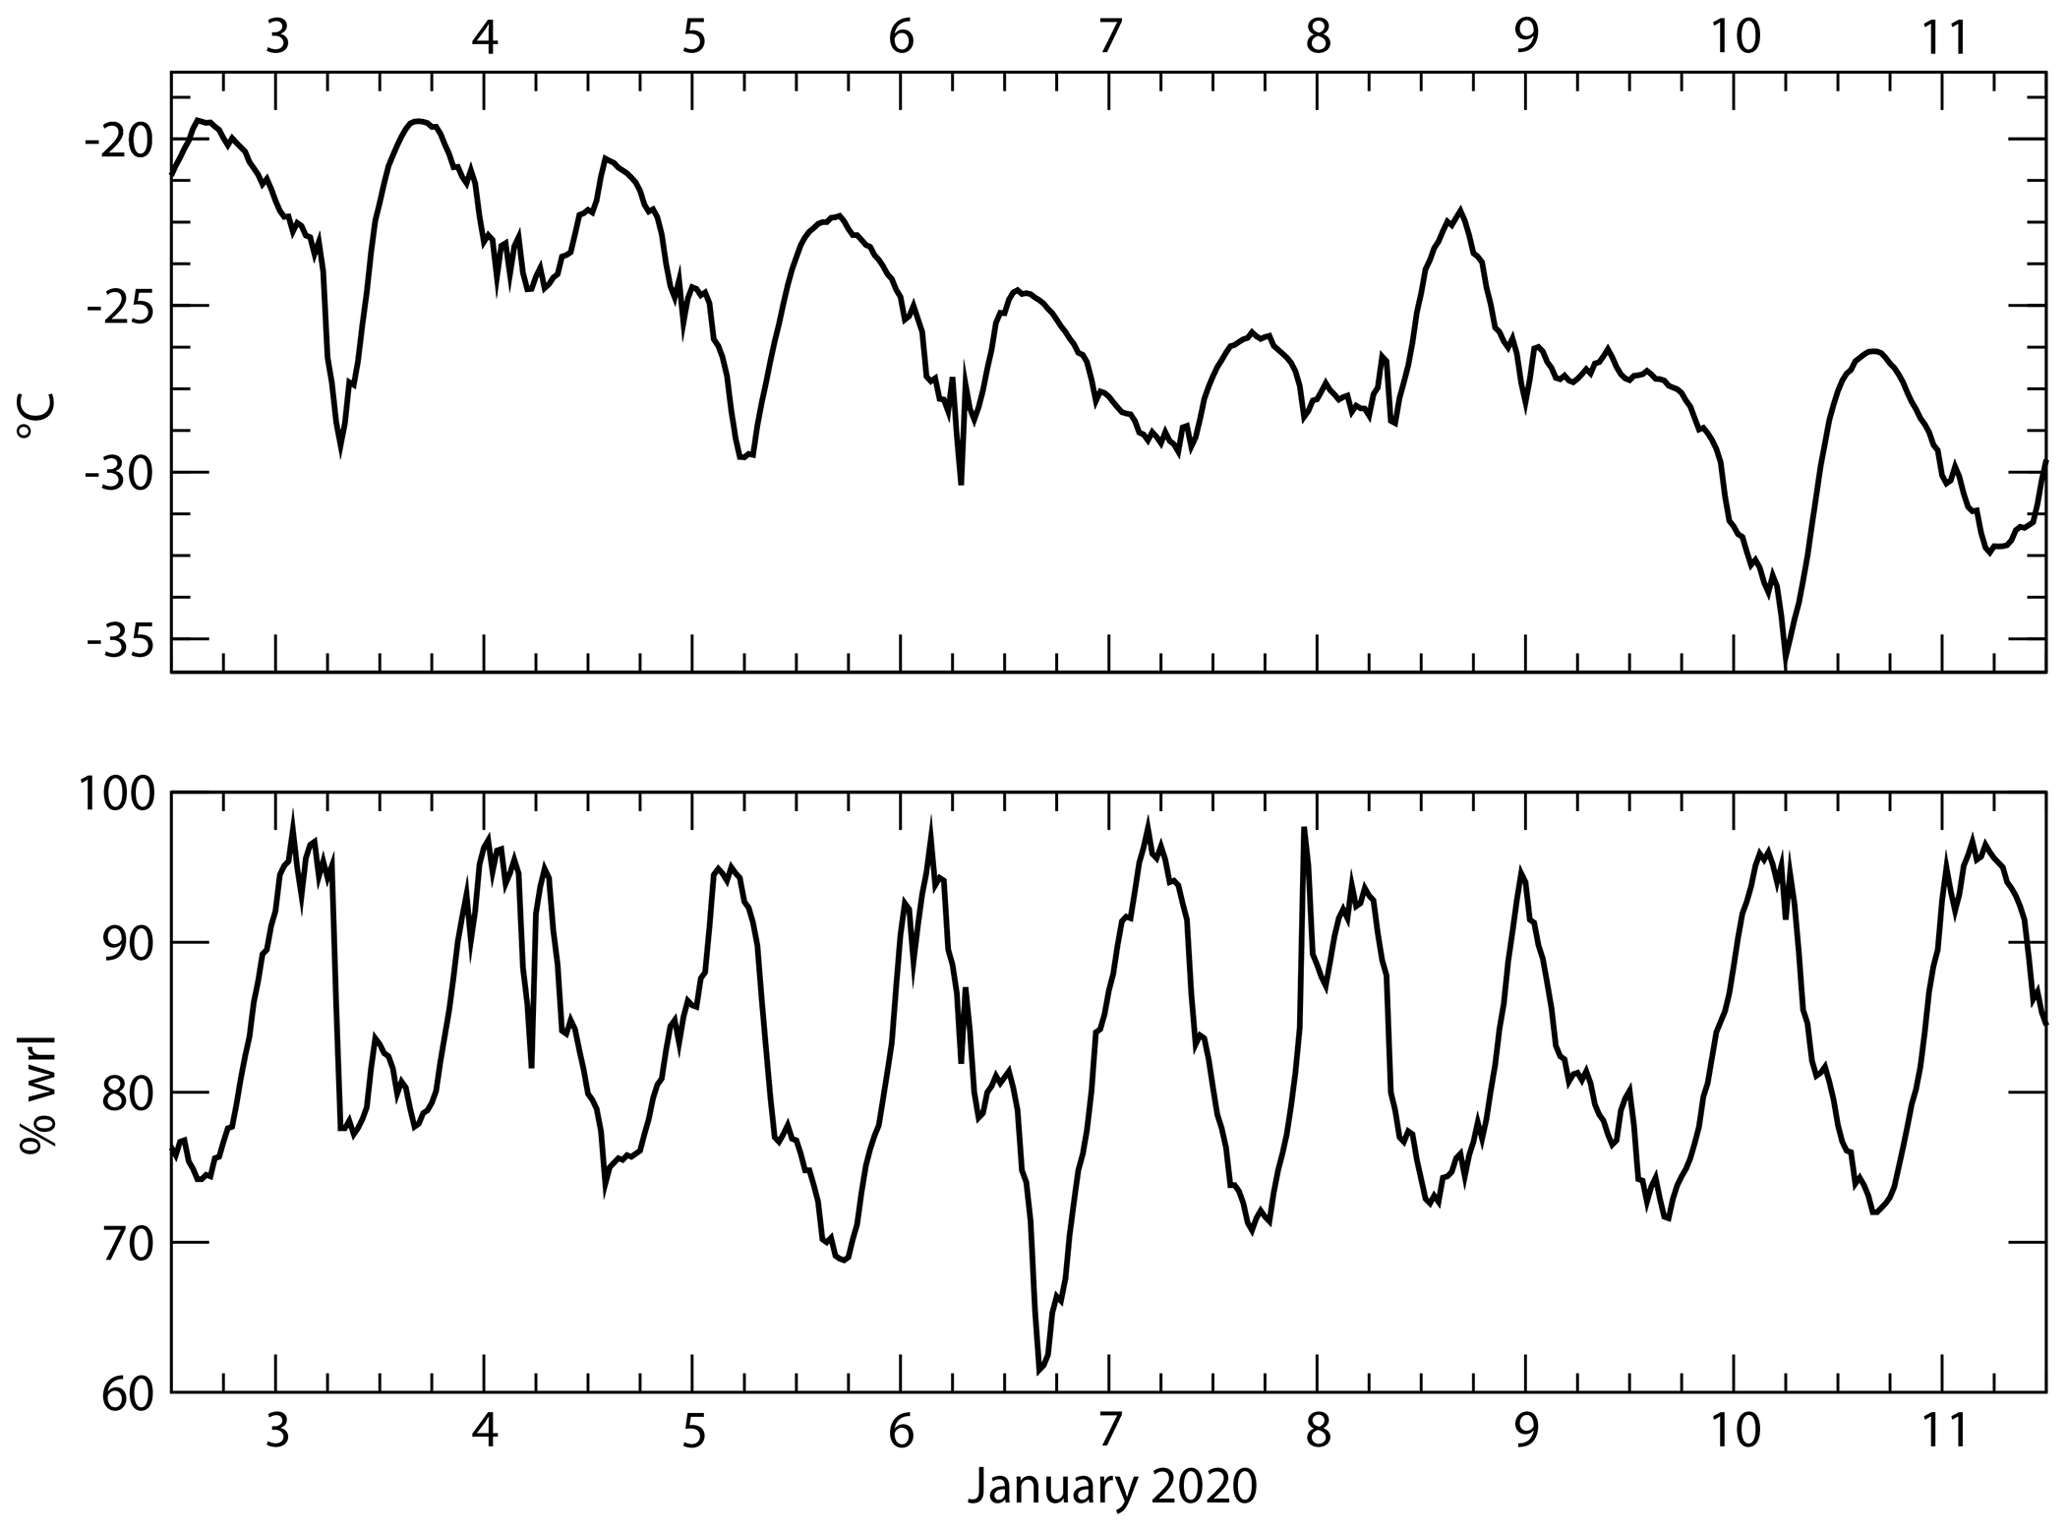
Figure 13A 10 d record of temperature and RHl at the mid-level on the tower in January 2020.
The data presented are available from the PANGAEA open-access data repository at https://doi.org/10.1594/PANGAEA.939425 (Genthon et al., 2021a).
For the first time, a quasi-continuous multiyear record of atmospheric moisture in the surface atmosphere of the high Antarctic Plateau has been obtained using instrumentation that can sample supersaturation under extreme cold conditions. This data set not only documents the temporal (seasonal, diurnal and synoptic) variability but also the vertical distribution of moisture in the atmospheric layer from ∼3 to ∼42 m above the surface. One major signature of the high Antarctic Plateau atmosphere is that the near-surface atmosphere, more often than not, is supersaturated with respect to ice. Most standard hygrometers cannot measure supersaturation; rather, the observations are capped at 100 % when, in reality, RHi can reach well above. Therefore, it is likely that most observations of atmospheric moisture in the surface atmosphere of the high East Antarctic Plateau are biased dry. The vertical profiles of temperature and moisture partial pressure are generally monotonic, albeit of variable sign. However, the vertical profile of RHi is generally non-monotonic and often has a maximum at the mid-level, around 18 m in the observation period. This may be related to the nonlinearity of the relationship between temperature and saturation humidity (and, thus, relative humidity). The vertical gradient of moisture is generally upward in winter (implying turbulent transport toward the surface, if any). The turbulent transport fluctuates with the diurnal cycle of the moisture gradient in summer, upward (implying downward turbulent flux) during the “night” (coldest part of the permanently sun lighted day) and weakly downward during the “day”.
Most modern meteorological and climate models now implement cold microphysics parametrizations that allow supersaturation wri, as this is needed to correctly simulate high tropospheric clouds such as cirrus. In terms of cold temperature and high cleanliness (low levels of aerosols that can serve as CCN or INPs), there are similarities between the high troposphere and the elevated, near-surface atmosphere over the East Antarctic glacial plateau. Thus, it is no wonder that the parametrizations also produce supersaturation wri in the surface atmosphere at Dome C (Genthon et al., 2017). Taking advantage of a permanently staffed Antarctic station and carrying out observations in this region may not be completely straightforward, but it is obviously much easier than making continuous moisture measurements in the high troposphere. The observational setup described in this paper and the comparatively long time series of atmospheric moisture including supersaturation wri may be used to evaluate and improve parametrizations of cold microphysics.
In summer, visual observations and METARs (METeorological Aerodrome Reports) indicate that haze/fog occasionally develops near the surface and then vanishes as the temperature warms. A dedicated visibility sensor at the mid-level on the tower (where RHi is largest on average; Fig. 9) would be useful to study the processes of how condensation finally occurs in the early morning after RHi has progressively increased well above 100 % with nighttime cooling (Fig. 8). Beyond visibility, in situ observations of hydrometeor phase and size would add much value and should be considered; however, they are very challenging to acquire, and it is difficult to ensure good quality in the extreme environment of the high Antarctic Plateau.
Finally, variability and trends in temperature and atmospheric moisture have recently been reported at Dome C using radiosondes, reanalyses and surface remote sensing instruments (Ricaud et al., 2020b). This is crucial information to better understand the links between Antarctica and the rest of the world in a changing climate. However, radiosondes are launched once a day, at 20:00 LT, at Dome C. In summer, this corresponds with the development of the nocturnal inversion (Genthon et al., 2021b) and, thus, a rapidly changing meteorological environment. In addition, while traveling across the first tens of meters above the surface, radiosondes may not be consistently well equilibrated with their atmospheric environment (Genthon et al., 2010); this is particularly true for moisture, as the time response of the HUMICAP ® increases with colder temperature. Microwave remote sensing from the surface (Ricaud et al., 2010) is calibrated using radiosondes, which only cover a small sample of the time and are subject to possible radiosonde deficiencies as described above. Meteorological analyses and reanalyses are often questionable very near the surface because the observations available for assimilation are sparse and the parameterization of the very stable boundary layer in the models is often questionable (Bazile et al., 2014). In situ continuous measurements would provide an important source of comparison for these less-direct sources of information over a common time period. Thus, it is crucial to extend the time series of continuous in situ meteorological observations as much as possible to best characterize common weather events, variability and trends over all timescales of interest and compare among data sources. It is hoped that the observation system described here will be supported to provide insight into the processes occurring in this extreme environment and provide a source of comparison for models and remotely sensed data, which contribute significantly to the science of meteorology, climate, climate variability and climate change in Antarctica.
CG leads the CALVA project, collected and processed the data used here, organized scientific discussions, and wrote the bulk of the paper. DV participated in several field campaigns, led one campaign (to obtain the data presented here), participated in discussions on data interpretation, and contributed to writing the paper. EV and JBM participated in field work, provided expertise on cold microphysics, participated in discussions on data interpretation, and contributed to writing the paper. LP designed and assembled the three improved systems (Fig. 1) that made it possible to measure atmospheric moisture at Dome C, including supersaturation, thereby making the collection of the data set presented here possible.
The contact author has declared that neither they nor their co-authors have any competing interests.
Publisher's note: Copernicus Publications remains neutral with regard to jurisdictional claims in published maps and institutional affiliations.
Logistical support and some financial support for the instruments and the field work (to deploy and service the observing system) described here have been provided by the French Polar Institute Paul-Émile Victor (IPEV) as part of the CALVA project (grant no. 1013). IPEV and the Italian Antarctic program (PNRA) jointly operate Concordia Station at Dome C. INSU (Institut National des Sciences de l'Univers) and OSUG (Observatoire des Sciences de l'Univers de Grenoble) also provide financial support for the CALVA project as a contribution to the GLACIOCLIM/CRYOBSCLIM observatory.
This research has been supported by the Institut Polaire Français Paul-Émile Victor (grant no. 1013) and the Institut national des sciences de l'Univers (CALVA).
This paper was edited by Alexander Kokhanovsky and reviewed by John King and two anonymous referees.
Baas, P., van de Wiel, B. J. H., van Meijgaard, E., Vignon, E., Genthon, C., van der Linden, S., and de Roode, S.: Transitions in the wintertime near-surface temperature inversion at Dome C, Antarctica, Q. J. Roy. Meteor. Soc., 145, 930–946, https://doi.org/10.1002/qj.3450, 2019.
Bazile, E., Couvreux, F., Le Moigne, P., Genthon, C., Holtslag, A. A. M., and Svensson, G.: GABLS4: An intercomparison case to study the stable boundary layer over the Antarctic Plateau, Global Energ. Water Exchanges News, 24, 4, 2014.
Belosi, F., Santachiara, G., and Prodi, F.: Ice-forming nuclei in Antarctica: New and past measurements, Atmos. Res. 145–146, 105–111, https://doi.org/10.1016/j.atmosres.2014.03.030, 2014.
Genthon, C., Town, M. S., Six, D., Favier, V., Argentini, S., and Pellegrini, A.: Meteorological atmospheric boundary layer measurements and ECMWF analyses during summer at Dome C, Antarctica, J. Geophys. Res., 115, D05104, https://doi.org/10.1029/2009JD012741, 2010.
Genthon, C., Piard, L., Vignon, E., Madeleine, J.-B., Casado, M., and Gallée, H.: Atmospheric moisture supersaturation in the near-surface atmosphere at Dome C, Antarctic Plateau, Atmos. Chem. Phys., 17, 691–704, https://doi.org/10.5194/acp-17-691-2017, 2017.
Genthon, C., Forbes, R., Vignon, E., Gettelman, A., and Madeleine, J.-B.: Comment on “Surface air relative humidities spuriously exceeding 100 % in CMIP5 model output and their impact on future projections” by Ruosteenoja, Jylhä, Rälsänen and Mäkelä (2017), J. Geophys. Res.-Atmos., 123, 8724–8727, https://doi.org/10.1029/2017JD028111, 2018.
Genthon, C., Veron, D. E., Vignon, E., Madeleine, J.-B., and Piard, L.: Water vapor observation in the lower atmospheric boundary layer at Dome C, East Antarctic plateau, PANGAEA [data set], https://doi.org/10.1594/PANGAEA.939425, 2021a.
Genthon, C., Veron, D., Vignon, E., Six, D., Dufresne, J.-L., Madeleine, J.-B., Sultan, E., and Forget, F.: 10 years of temperature and wind observation on a 45 m tower at Dome C, East Antarctic plateau, Earth Syst. Sci. Data, 13, 5731–5746, https://doi.org/10.5194/essd-13-5731-2021, 2021b.
Gettelman, A., Walden, V. P., Miloshevich, L. M., Roth, W. L., and Halter, B.: Relative humidity over Antarctica from radiosondes, satellites, and a general circulation model, J. Geophys. Res., 111, D09S13, https://doi.org/10.1029/2005JD006636, 2006.
Goff, J. A. and Gratch, S.: Low-pressure properties of water from −160 to 212 ∘F, in Transactions of the American Society of Heating and Ventilating Engineers, presented at the 52nd annual meeting of the American Society of Heating and Ventilating Engineers, New York, 95–122, 1946.
Herenz, P., Wex, H., Mangold, A., Laffineur, Q., Gorodetskaya, I. V., Fleming, Z. L., Panagi, M., and Stratmann, F.: CCN measurements at the Princess Elisabeth Antarctica research station during three austral summers, Atmos. Chem. Phys., 19, 275–294, https://doi.org/10.5194/acp-19-275-2019, 2019.
Kärcher, B. and Lohmann, U.: A parameterization of cirrus cloud formation: Homogeneous freezing of supercooled aerosols, J. Geophys. Res., 107, 4010, https://doi.org/10.1029/2001JD000470, 2002.
King, J. C. and Anderson, P. S.: A humidity climatology for Halley, Antarctica, based on frost-point hygrometer measurements, Antarct. Sci., 11, 100–104, https://doi.org/10.1017/S0954102099000139, 1999.
Listowski, C., Delanoë, J., Kirchgaessner, A., Lachlan-Cope, T., and King, J.: Antarctic clouds, supercooled liquid water and mixed phase, investigated with DARDAR: geographical and seasonal variations, Atmos. Chem. Phys., 19, 6771–6808, https://doi.org/10.5194/acp-19-6771-2019, 2019.
Murphy, D. and Koop, T.: Review of the vapour pressures of ice and supercooled water for atmospheric applications, Q. J. Roy. Meteor. Soc., 131, 1539–1565, https://doi.org/10.1256/qj.04.94, 2005.
Ricaud, P., Gabard, B., Derrien, S., Chaboureau, J.-P., Rose, T., Mombauer, A., and Czekala, H.: HAMSTRAD-Tropo, A 183-GHz Radiometer Dedicated to Sound Tropospheric Water Vapour Over Concordia Station, Antarctica, IEEE T. Geosci. Remote, 48, 1365–1380, https://doi.org/10.1109/TGRS.2009.2029345, 2010.
Ricaud, P., Bazile, E., del Guasta, M., Lanconelli, C., Grigioni, P., and Mahjoub, A.: Genesis of diamond dust, ice fog and thick cloud episodes observed and modelled above Dome C, Antarctica, Atmos. Chem. Phys., 17, 5221–5237, https://doi.org/10.5194/acp-17-5221-2017, 2017.
Ricaud, P., Del Guasta, M., Bazile, E., Azouz, N., Lupi, A., Durand, P., Attié, J.-L., Veron, D., Guidard, V., and Grigioni, P.: Supercooled liquid water cloud observed, analysed, and modelled at the top of the planetary boundary layer above Dome C, Antarctica, Atmos. Chem. Phys., 20, 4167–4191, https://doi.org/10.5194/acp-20-4167-2020, 2020a.
Ricaud, P, Grigioni, P., Roehrig, R., Durand, P., and Veron, D. E.: Trends in Atmospheric Humidity and Temperature above Dome C, Antarctica Evaluated from Observations and Reanalyses, Atmosphere, 11, 836, https://doi.org/10.3390/atmos11080836, 2020b.
Sassen, K., Liou, K. N., Kinne, S., and Griffin, M.: Highly Supercooled Cirrus Cloud Water: Confirmation and Climatic Implications, Science, 227, 4685, https://doi.org/10.1126/science.227.4685.411, 1985.
Tompkins, A. M., Gierens, K., and Rädel, G.: Ice supersaturation in the ECMWF integrated forecast system, Q. J. Roy. Meteor. Soc., 133, 53–63, https://doi.org/10.1002/qj.14, 2007.
Vignon, E., van de Wiel, B. J. H., van Hooijdonk, I. G. S., Genthon, C., van der Linden, S., J. A., van Hooft, A., Baas, P., Maurel, W., Traullé, O., and Casasanta, G.: Stable boundary-layer regimes at Dome C, Antarctica: observation and analysis, Q. J. Roy. Meteor. Soc., 143, 1241–1253, https://doi.org/10.1002/qj.2998, 2017.
Vignon, E., Hourdin, F., Genthon, C., Van de Wiel, B. J. H., Gallée, H., Madeleine, J.-B., and Beaume, J.: Modeling the Dynamics of the Atmospheric Boundary Layer Over the Antarctic Plateau with a General Circulation Model, J. Adv. Model. Earth Sy., 10, 98–125, https://doi.org/10.1002/2017MS001184, 2018.