the Creative Commons Attribution 4.0 License.
the Creative Commons Attribution 4.0 License.
 | 07 Apr 2022
Long-term energy balance measurements at three different mountain permafrost sites in the Swiss Alps
Christian Hauck
Tamara Mathys
Jeannette Noetzli
Cécile Pellet
Martin Scherler
The surface energy balance is a key factor influencing the ground thermal regime. With ongoing climate change, it is crucial to understand the interactions of the individual heat fluxes at the surface and within the subsurface layers, as well as their relative impacts on the permafrost thermal regime. A unique set of high-altitude meteorological measurements was analysed to determine the energy balance at three mountain permafrost sites in the Swiss Alps (Murtèl–Corvatsch, Schilthorn and Stockhorn), where data have been collected since the late 1990s in the framework of the Swiss Permafrost Monitoring Network (PERMOS). All stations are equipped with sensors for four-component radiation, air temperature, humidity, and wind speed and direction, as well as ground temperatures and snow height. The three sites differ considerably in their surface and ground material composition, as well as their ground ice contents. The energy fluxes were calculated based on two decades of field measurements. While the determination of the radiation budget and the ground heat flux is comparatively straightforward (by the four-component radiation sensor and thermistor measurements within the boreholes), larger uncertainties exist for the determination of turbulent sensible and latent heat fluxes.
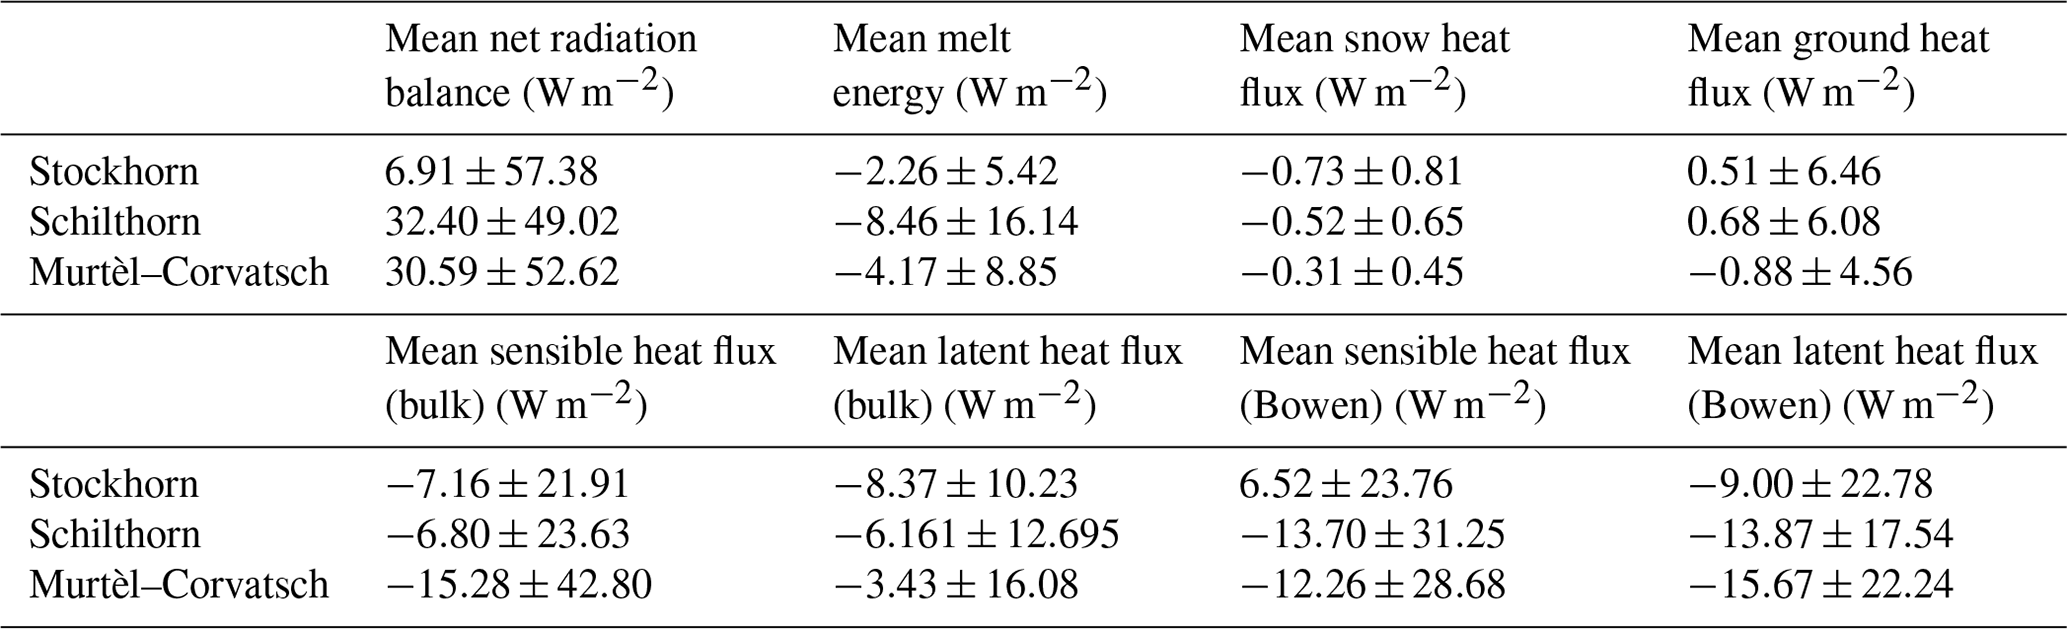
Our results show that mean air temperature at Murtèl–Corvatsch (1997–2018, 2600 m a.s.l.) is −1.66 ∘C and has increased by about 0.8 ∘C during the measurement period. At the Schilthorn site (1999–2018, 2900 m a.s.l.) a mean air temperature of −2.60 ∘C with a mean increase of 1.0 ∘C was measured. The Stockhorn site (2003–2018, 3400 m a.s.l.) recorded lower air temperatures with a mean of −6.18 ∘C and an increase of 0.5 ∘C. Measured net radiation, as the most important energy input at the surface, shows substantial differences with mean values of 30.59 W m−2 for Murtèl–Corvatsch, 32.40 W m−2 for Schilthorn and 6.91 W m−2 for Stockhorn. The calculated turbulent fluxes show values of around 7 to 13 W m−2 using the Bowen ratio method and 3 to 15 W m−2 using the bulk method at all sites. Large differences are observed regarding the energy used for the melting of the snow cover: at Schilthorn a value of 8.46 W m−2, at Murtèl–Corvatsch 4.17 W m−2 and at Stockhorn 2.26 W m−2 are calculated, reflecting the differences in snow height at the three sites.
In general, we found considerable differences in the energy fluxes at the different sites. These differences help to explain and interpret the causes of a warming atmosphere. We recognise a strong relation between the net radiation and the ground heat flux. Our results further demonstrate the importance of long-term monitoring to better understand the impacts of changes in the surface energy balance components on the permafrost thermal regime. The dataset presented can be used to improve permafrost modelling studies aiming at, for example, advancing knowledge about permafrost thaw processes. The data presented and described here are available for download at the following site: https://doi.org/10.13093/permos-meteo-2021-01 (Hoelzle et al., 2021).
- Article
(5891 KB) - Full-text XML
- BibTeX
- EndNote


High-mountain regions are particularly vulnerable to climate change (Haeberli and Beniston, 1998; Huggel et al., 2010, 2015; Pepin et al., 2022). Especially the alpine cryosphere, including the components of snow, glaciers and permafrost, is reacting strongly to the ongoing atmospheric warming (IPCC, 2013; Hock et al., 2019). Significant changes in permafrost have already been documented by many observation networks world-wide (GCOS, 2010; Biskaborn et al., 2019; Noetzli et al., 2020; Smith et al., 2022). Operational mountain permafrost monitoring is particularly well established in Switzerland and includes the longest mountain permafrost time series world-wide (Hoelzle et al., 2002), coordinated by the Swiss Permafrost Monitoring Network (PERMOS) (e.g. PERMOS, 2019). As permafrost is not easily detectable from the surface (or space), it is investigated using temperature measurements in boreholes (Noetzli et al., 2021) or non-invasive methods such as near-surface geophysics, which enable the analysis of the subsurface composition, as well as the investigation of the ground ice content and its changes. Changes in ground ice content are important because they can be directly related to strong environmental impacts, such as the future development of natural hazard potential, as well as changes in run-off amount and patterns, which considerably affect dry mountain regions (e.g. Walvoord and Kurylyk, 2016).
To better understand the complex process chains leading to the above-mentioned impacts related to permafrost warming, we need to improve our knowledge about the thermal regime of permafrost, which is mainly determined by the energy balance at the surface and the geothermal heat flux at its lower boundary. The energy balance at the ground and snow surface is given by the net radiation, the turbulent heat fluxes, the melt energy of the snow cover, the heat flux through the snow cover and the ground heat flux. It has been the subject of many field-based observational and modelling studies (e.g. Hoelzle and Gruber, 2008; Gruber and Hoelzle, 2008; Westermann et al., 2009; Langer et al., 2011a, b; Scherler et al., 2014; Chadburn et al., 2015; Marmy et al., 2016; Pellet et al., 2016).
It has to be noted that the permafrost thermal regime can vary substantially as a function of the surface cover. In coarse blocky terrain particular attention has to be given to the ground heat flux as it can be very different from the mainly conductive heat flux in soil or bedrock substrates (e.g. Hanson and Hoelzle, 2004; Wicky and Hauck, 2017). Few studies have attempted to model heat transfer processes in such coarse blocky active layers by including, for example, turbulent heat fluxes within the active layer in their models (e.g. Scherler et al., 2014) or, more recently, air convection processes (e.g. Wicky and Hauck, 2017, 2020; Luethi et al., 2017; Pruessner et al., 2018).
However, in contrast to the above-cited studies, most permafrost models use simpler formulations for the ground heat flux and are based on estimations of the potential incoming radiation, modified by the effect of snow insulation (Etzelmüller, 2013; Riseborough et al., 2008). Other simplified approaches include thermal offsets which are calculated as the differences between air, surface and permafrost temperatures to characterise the influence of snow conditions and thermal conductivities of different ground materials (Burn and Smith, 1988; Wu et al., 2003; Hoelzle and Gruber, 2008). In more recent permafrost or land surface models (e.g. Fiddes et al., 2015; Ekici et al., 2015; Pellet et al., 2016), the energy balance at the surface is explicitly included.
Nevertheless, only a few observational datasets of the full energy balance at specific permafrost sites exist, especially in mountain regions. (Scherler et al., 2014; Boike et al., 2008; Boike et al., 2018; Wani et al., 2021). The energy balance constitutes one of the most important input parameters for the ground heat flux regime, and it is therefore crucial to better understand the influence of the individual fluxes. Thus, such full energy balance datasets are necessary to improve the understanding and the ability to correctly model the various processes for different surface and subsurface materials in permafrost regions.
In this study, we focus on 20-year time series from three permafrost stations in the Swiss Alps (Schilthorn, Stockhorn and Murtèl–Corvatsch), which were established in the scope of the European research project PACE (Permafrost and Climate in Europe; Harris et al., 2003; Etzelmüller et al., 2020) at the beginning of this century and are now part of the PERMOS network. All stations are equipped with standard meteorological sensors, such as a four-component radiation sensor, for air temperature, humidity, and wind speed and direction, as well as ground temperature and snow height probes (Hoelzle and Gruber, 2008). All three sites differ considerably in their ground material composition and permafrost conditions. The influence of the radiation components and the turbulent heat fluxes on the ground heat fluxes and the snowmelt energy is of particular importance for high mountain permafrost research as they determine the ground thermal regime in the first place and therefore also the geotechnical behaviour of the permafrost. The main aims of this paper are the following: (1) to present a long-term dataset of meteorological measurements at three different mountain permafrost sites and make this dataset available to national and international databases; (2) to quantify the energy fluxes at the surface of these permafrost sites using the long-term datasets; and (3) to record and explain patterns of variation in surface layer meteorology for the different surfaces and to compare them. These objectives are important for the development of physically based energy balance models for permafrost environments and to evaluate their sensitivity to climatic warming.
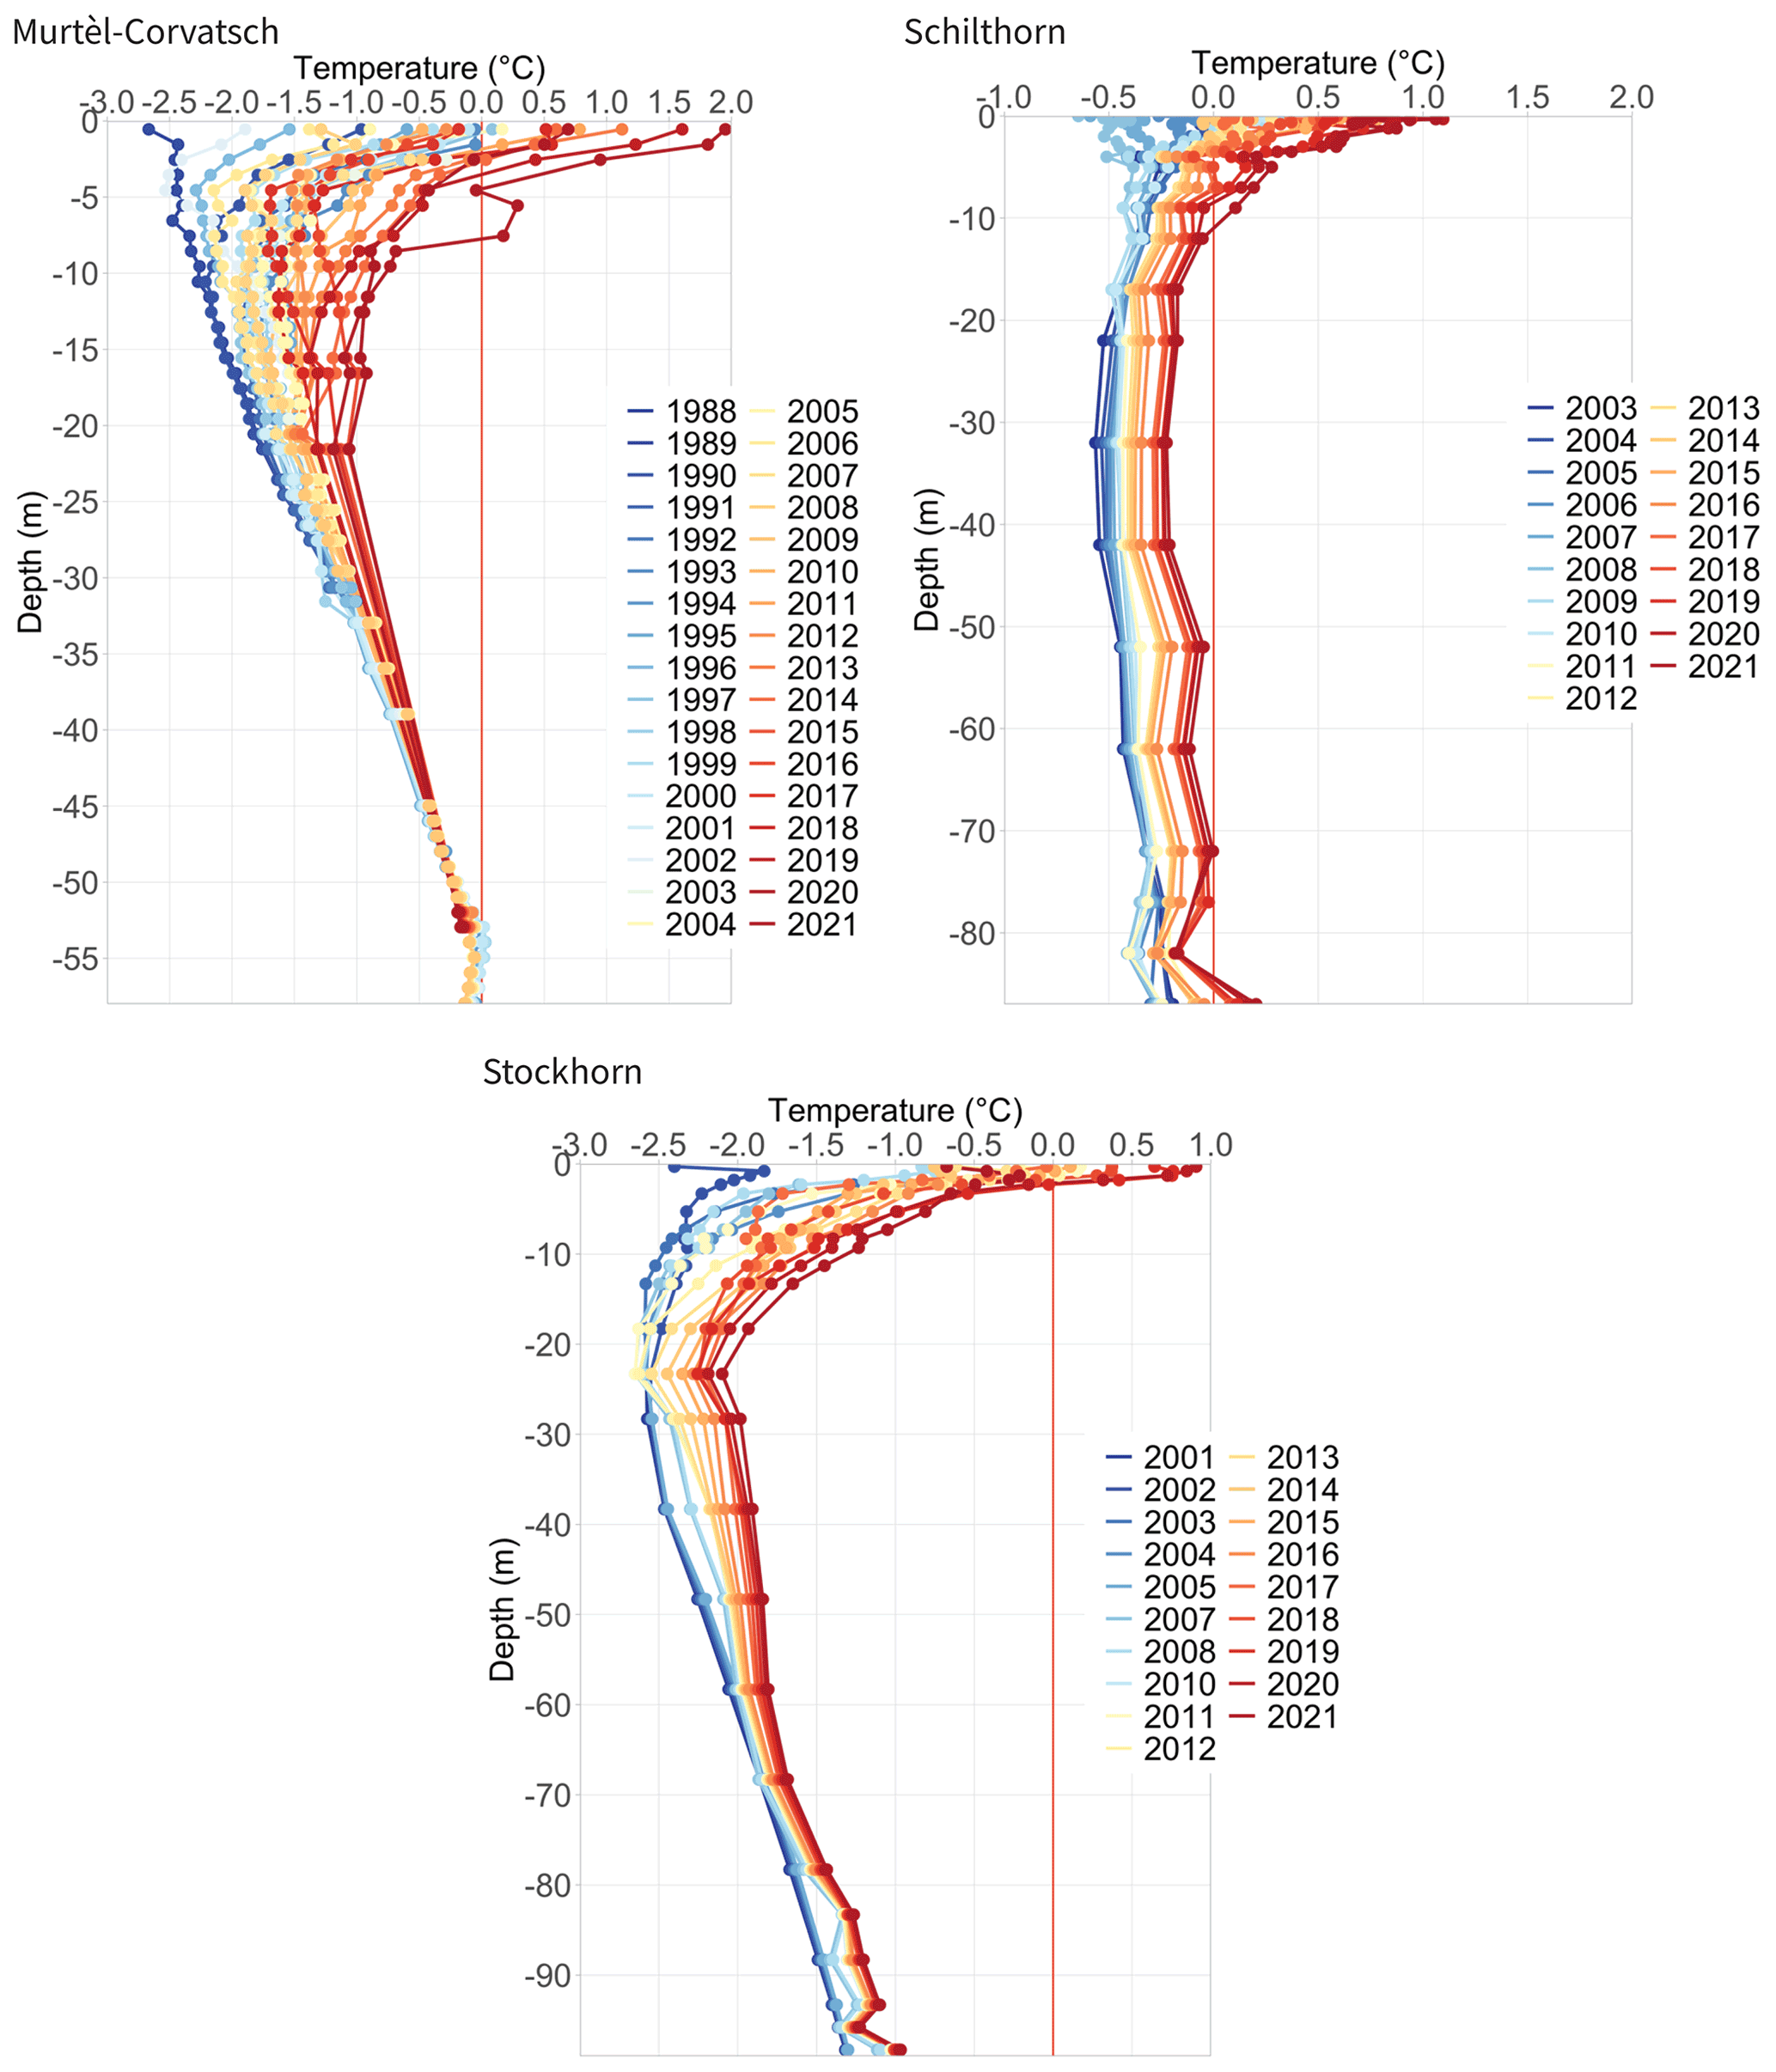
Figure 1Evolution of borehole temperature measurements over two decades at the three long-term mountain permafrost monitoring sites in the Swiss Alps.
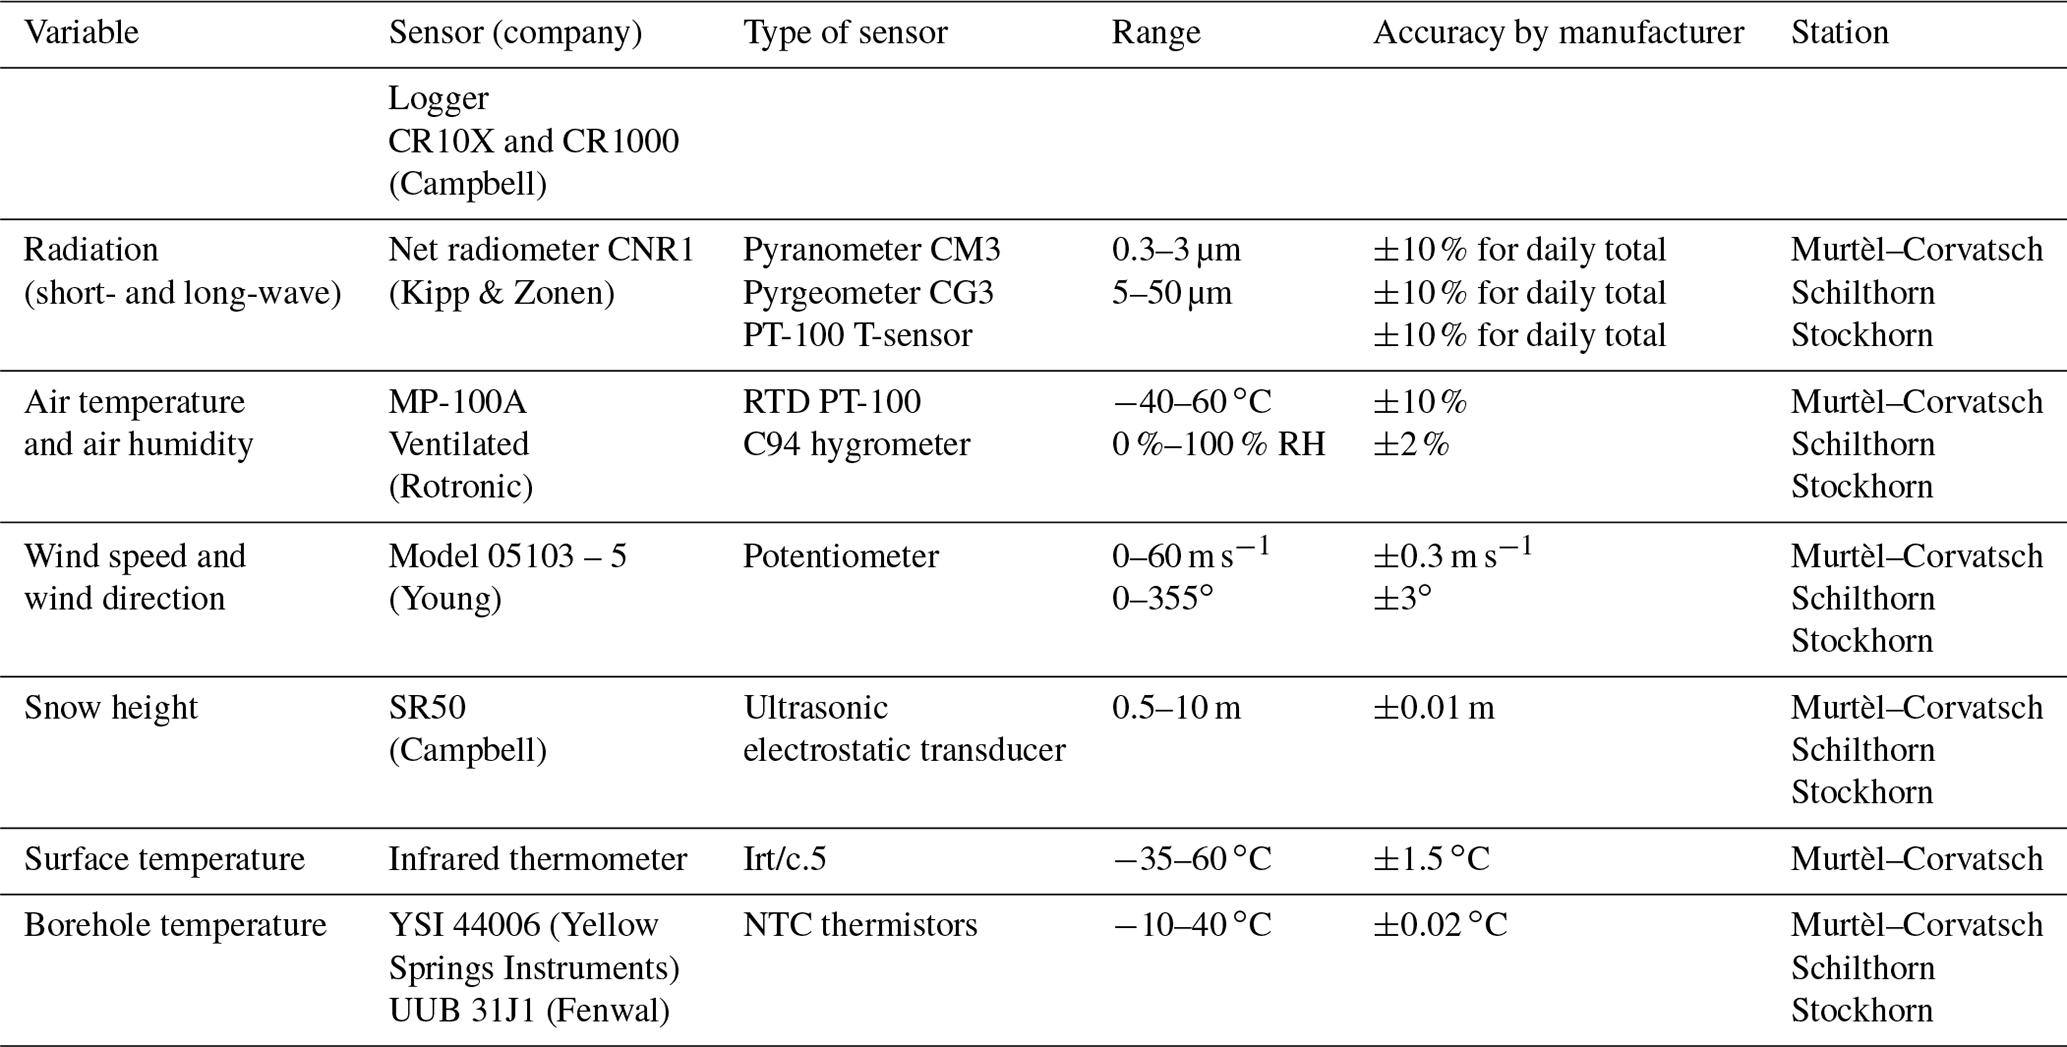
All three investigation sites, Schilthorn, Stockhorn and Murtèl–Corvatsch, are characterised by the occurrence of deep-seated permafrost, which is currently warming at a high rate. This is shown in Fig. 1, where the temporal evolution of the ground temperatures in the boreholes is plotted. The measurement sites were initially instrumented for research purposes and not as long-term monitoring stations; the data have some larger gaps which could only partly be filled. Details to the individual measurements at each location can be found in Hoelzle and Gruber (2008) and Table 1. Raw measurements mainly consist of 10 min values, which were averaged and stored as hourly means. The data are stored in Campbell loggers (CR10X or CR1000) and are directly transferred to the PERMOS database.
Table 1Sensors currently used and their characteristics at the three different sites.
2.1 Murtèl–Corvatsch
The Murtèl–Corvatsch area is situated in the Upper Engadine (eastern Swiss Alps). A steep northwest-facing rock wall surrounds the area, and the slopes below the rock walls are covered by several metres of loose debris. Several rock glaciers and protalus ramparts are situated at the foot of the rock wall. One of these rock glaciers is the Murtèl rock glacier, which has been investigated for more than 30 years (Hoelzle et al., 2002). It consists of a coarse blocky surface layer with a thickness of about 3–6 m above an ice supersaturated permafrost layer of about 25 m thickness, followed by a thick layer of undersaturated blocks. The rocks consist of deeply weathered micaceous shales. The mean annual precipitation sum (1981–2010) measured at the nearby station of MeteoSwiss at Sils Maria is 1011 mm, whereas about 1295 mm was recorded on the Piz Corvatsch summit station. A first borehole was drilled in 1987 and has continuously provided ground temperature data. This borehole was replaced by a new one in 2015 (PERMOS, 2019). In 1997, a first micrometeorological station was installed at this site (Mittaz et al., 2000). The station is at around 5 m distance from the boreholes. Air temperature, air humidity, radiation (all components), surface temperature, snow depth, wind speed and wind direction are measured at around 2 m above ground (Hoelzle and Gruber, 2008).
2.2 Schilthorn
The Schilthorn is situated at the transition between the Prealps in the north and the principle chain of the Bernese Alps (northern Swiss Alps), which exceed 4000 m a.s.l. Due to its geographic situation (exposed to moist western winds), the climate in the Schilthorn massif is of suboceanic alpine character, i.e. with fairly abundant precipitation and showing a distinct summer maximum. The mean annual sum in Lauterbrunnen (valley floor) is 1234 mm, whereas about 2700 mm was estimated on the highest summits, where about 90 % of the precipitation falls as snow. As a consequence, the surface is snow-covered for longer periods than in most regions with the same elevation in comparison to the central Alps. The northern slope of the Schilthorn summit, where the micrometeorological station was installed in 1998, is covered by a few metres of fine-grained debris of sandy and silty material with a low ice content (Imhof et al., 2000). The station was installed on a small plateau at 2900 m a.s.l. Air temperature, air humidity, radiation (all components), snow depth, wind speed and wind direction are measured at around 2 m above ground (Hoelzle and Gruber, 2008). In the same year, a 14 m deep borehole was drilled into bedrock a few metres to the northwest of the climate station and equipped with a thermistor chain. Two additional boreholes were drilled in 2000: a vertical one having a depth of 100 m and one perpendicular to the surface with a depth of 92 m. A 20 m deep replacement borehole was drilled in 2018 at a few metres distance to the boreholes drilled in 2000. In addition, soil moisture data are recorded nearby (Pellet and Hauck, 2017).
2.3 Stockhorn
This study site is located in the upper Mattertal and Walliser Alpen in the southern Swiss Alps. The station is located on a mountain ridge which extends from the Gornergrat to the Stockhorn mountain summit. The station is situated at an altitude of 3410 m a.s.l. on a small plateau which is gently inclined to the south (45∘59′ N, 7∘49′ E). Surface conditions are heterogeneous with medium-size debris, fine-grained material, and outcropping bedrock and intermediate ice contents. The bedrock belongs to the palaeozoic crystalline Monte Rosa nappe and consists on albite–muscovite schists. At some places the development of patterned ground is visible, especially where the station is located. The Stockhorn–Gornergrat crest is surrounded by mountain ranges that exceed altitudes of 4000 m a.s.l. This causes a local climate characterised by reduced cloud cover and high solar radiation. The annual precipitation in the Zermatt valley is relatively low with 639 mm according to MeteoSwiss for the period 1981–2010 and can be estimated to be around 1500 mm at Stockhorn based on King (1990). Two boreholes were drilled in 2000. One borehole is 100 m deep and is located on the plateau, whereas a second borehole is 31 m deep and situated around 25 m to the south close to the edge of the plateau. A meteorological station was installed in 2002 close to the deep borehole. Air temperature, air humidity, radiation (all components), surface temperature, snow depth, wind speed and wind direction are measured at around 2 m above ground (Hoelzle and Gruber, 2008). In addition, soil moisture data are recorded nearby (Pellet and Hauck, 2017).
3.1 Calculation of the surface energy balance
The energy balance at the surface can be formulated as follows (energy fluxes are in units of W m−2 and positive when directed towards the surface):
where QSW↓ and QSW↑ are the short-wave incoming and reflected radiation, QL↓ and QL↑ are the long-wave incoming and emitted radiation fluxes, QH is the turbulent sensible heat flux, QLE is the turbulent latent heat flux, QS is the heat flux through the snow cover, and QP is the sensible heat energy supplied or consumed by precipitation falling on the surface. It is ignored as it is in general negligibly small compared with the other fluxes (Brock et al., 2010). QG is the heat flux in the ground, and QM denotes snowmelt at the surface.
3.1.1 Short- and long-wave radiation fluxes
QSW↓, QSW↑, QL↓ and QL↑ were measured directly at the individual meteo-stations using a CNR1 device at each of the three sites (for further details see Table 1). The sensors were relatively reliable during the measurement period, and only a few longer gaps occurred. The sum of all radiation components is called the net radiation QR. It is a fundamental factor for all energy balance studies as it typically is the component with the highest energy gain or loss.
3.1.2 Turbulent sensible and latent heat flux
The turbulent fluxes were calculated using two methods: (a) the bulk aerodynamic method (e.g. Munro, 1989; Denby and Greuell, 2000; Arck and Scherrer, 2001; Oke, 1987) and (b) the Bowen ratio method (Bowen, 1926).
3.1.3 Bulk method
Knowing that turbulent sensible and latent heat fluxes over rock and debris surfaces cannot be estimated using neutral stability assumptions (Nakawo and Young, 1982; Mattson and Gardner, 1989; Takeuchi et al., 2000; Nicholson and Benn, 2006), it is necessary to apply corrections for non-neutral conditions due to the large variations in atmospheric stability. The stability of the atmospheric layer close to the surface can be described by the bulk Richardson number, Rib, relating the relative effects of buoyancy to mechanical forces (Brutsaert, 1982; Moore, 1983):
where g is the acceleration due to gravity (9.81 m s−2), T0 is the average of air temperature (Ta) and the surface temperature (Ts), z0 m is the surface roughness length for momentum taken from Brock et al. (2006, 2010) as 0.016 and 0.001 for snow-free and snow-covered conditions, respectively, Ta is the air temperature, Ts is the surface temperature, and u is the wind speed measured at the station. Stability corrections based on Rib have been applied successfully over rock glaciers (Mittaz et al., 2000). Assuming that the local gradients of mean u, mean T and mean specific humidity q are equal to the finite differences between the measurement level and the surface, the turbulent fluxes may be evaluated as follows (based on Brutsaert, 1982; Favier et al., 2004; Sicart et al., 2005):
where qa and qs are specific humidities (kg kg−1) at the 2 m and surface levels, respectively, ρa is the air density, cp is the specific heat capacity for air at constant pressure () with cpd=1005 J kg−1 K−1), k is von Karman's constant (k=0.4), and Lv is the latent heat of vaporisation ( J kg−1 at 283 K). The scalar lengths for heat z0t and humidity z0q were considered to be equal to z0 m. ϕm, ϕh and ϕv are the non-dimensional stability functions for momentum, heat and moisture, respectively, and they are unity in neutral cases. They are expressed as functions of Rib for stable and unstable cases:
stable case ():
unstable case (Rib<0):
3.1.4 Bowen ratio method
The Bowen ratio method estimates the sensible and latent heat fluxes QH and QLE according to the energy available (e.g. ). The energy partitioning between QH and QLE has direct relation to the boundary-layer climate and is called the Bowen ratio β (Bowen, 1926):
with
and
Using the Bowen ratio energy-balance method leads to some uncertainties, which have to be taken into account when interpreting the data. First, errors of net radiation and subsurface fluxes are accumulated in the evaluation of the turbulent fluxes. Secondly, the Bowen ratio method often produces non-physical sensible and latent heat fluxes: incorrect signs (directions) and extremely large magnitudes of the fluxes. Therefore, we follow a procedure proposed by Ohmura (1982) using two criteria for rejecting such undesirable data. The first criteria is defined by the condition that data are excluded if the conditions below are not met:
-
if , then ,
-
if , then .
The second criteria is defined by the necessary condition that the denominator in Eqs. (8) and (9) cannot be zero. This case occurs when . In order to consider the accuracy of temperature and specific humidity, this condition is formulated as follows:
-
,
-
,
where ET and Eq are the resolution limits of the thermometer or the hygrometer.
3.1.5 Snow heat flux
The snow heat flux is given by
where, according to Keller (1994) and Mellor (1977), the heat conductivity of snow (W m−1 K−1) is determined by . Snow density ρsnow was fixed to a value of 220 kg m−3. Typical values for ksnow lie between 0.2 and 0.5 (W m−1 K−1) (e.g. Sturm et al., 1997; Essery et al., 2013). Due to these low values, the transport of heat through the snow cover is generally small. Hence, snow insulates the ground from atmospheric influences.
3.1.6 Ground heat flux
While the ground surface temperature is a function of the varying energy-exchange processes at the atmosphere–lithosphere boundary, their downward propagation depends on the thermal properties of the ground (Williams and Smith, 1989). Heat conduction is the main process of heat transfer within the ground when considering the ground as a homogeneous medium. In addition, heat transport takes place by circulation of water and convective and advective circulation of air. However, these processes are not included in the calculations to keep the approach as simple as possible:
where QG is ground heat flux, and k is the thermal conductivity of the ground (in W m−1 K−1).
3.1.7 Snowmelt
The energy provided by snowmelt is
where LM is the latent heat of fusion for ice (336 kJ kg−1). The run-off rate RS can be obtained as a function of the change in the product of snow height h and snow density ρs, which was fixed to a value of 220 kg m−3:
3.2 Data processing
As the monitoring evolved slowly from individual research projects (e.g. PACE) into the long-term PERMOS monitoring, the data availability is relatively poor. At the beginning of the observation period at all three stations major data gaps up to several months exist for all measured variables. For air temperature and snow height, being the most important meteorological variables for many permafrost modelling studies, an almost complete time series was generated by gap-filling using complementary information from nearby meteorological stations (mainly based on Intercantonal Measurement and Information System (IMIS) or MeteoSwiss (MCH) stations). For the energy balance calculation, only shorter gaps were filled using correlations between the individual variables at the stations themselves to guarantee that the energy balance is based on in situ data gathered at the meteorological stations alone.
Table 2Information on the linear regression coefficients used for the gap-filling of level 2 data (MCH: MeteoSwiss; IMIS: Intercantonal Measurement and Information System).
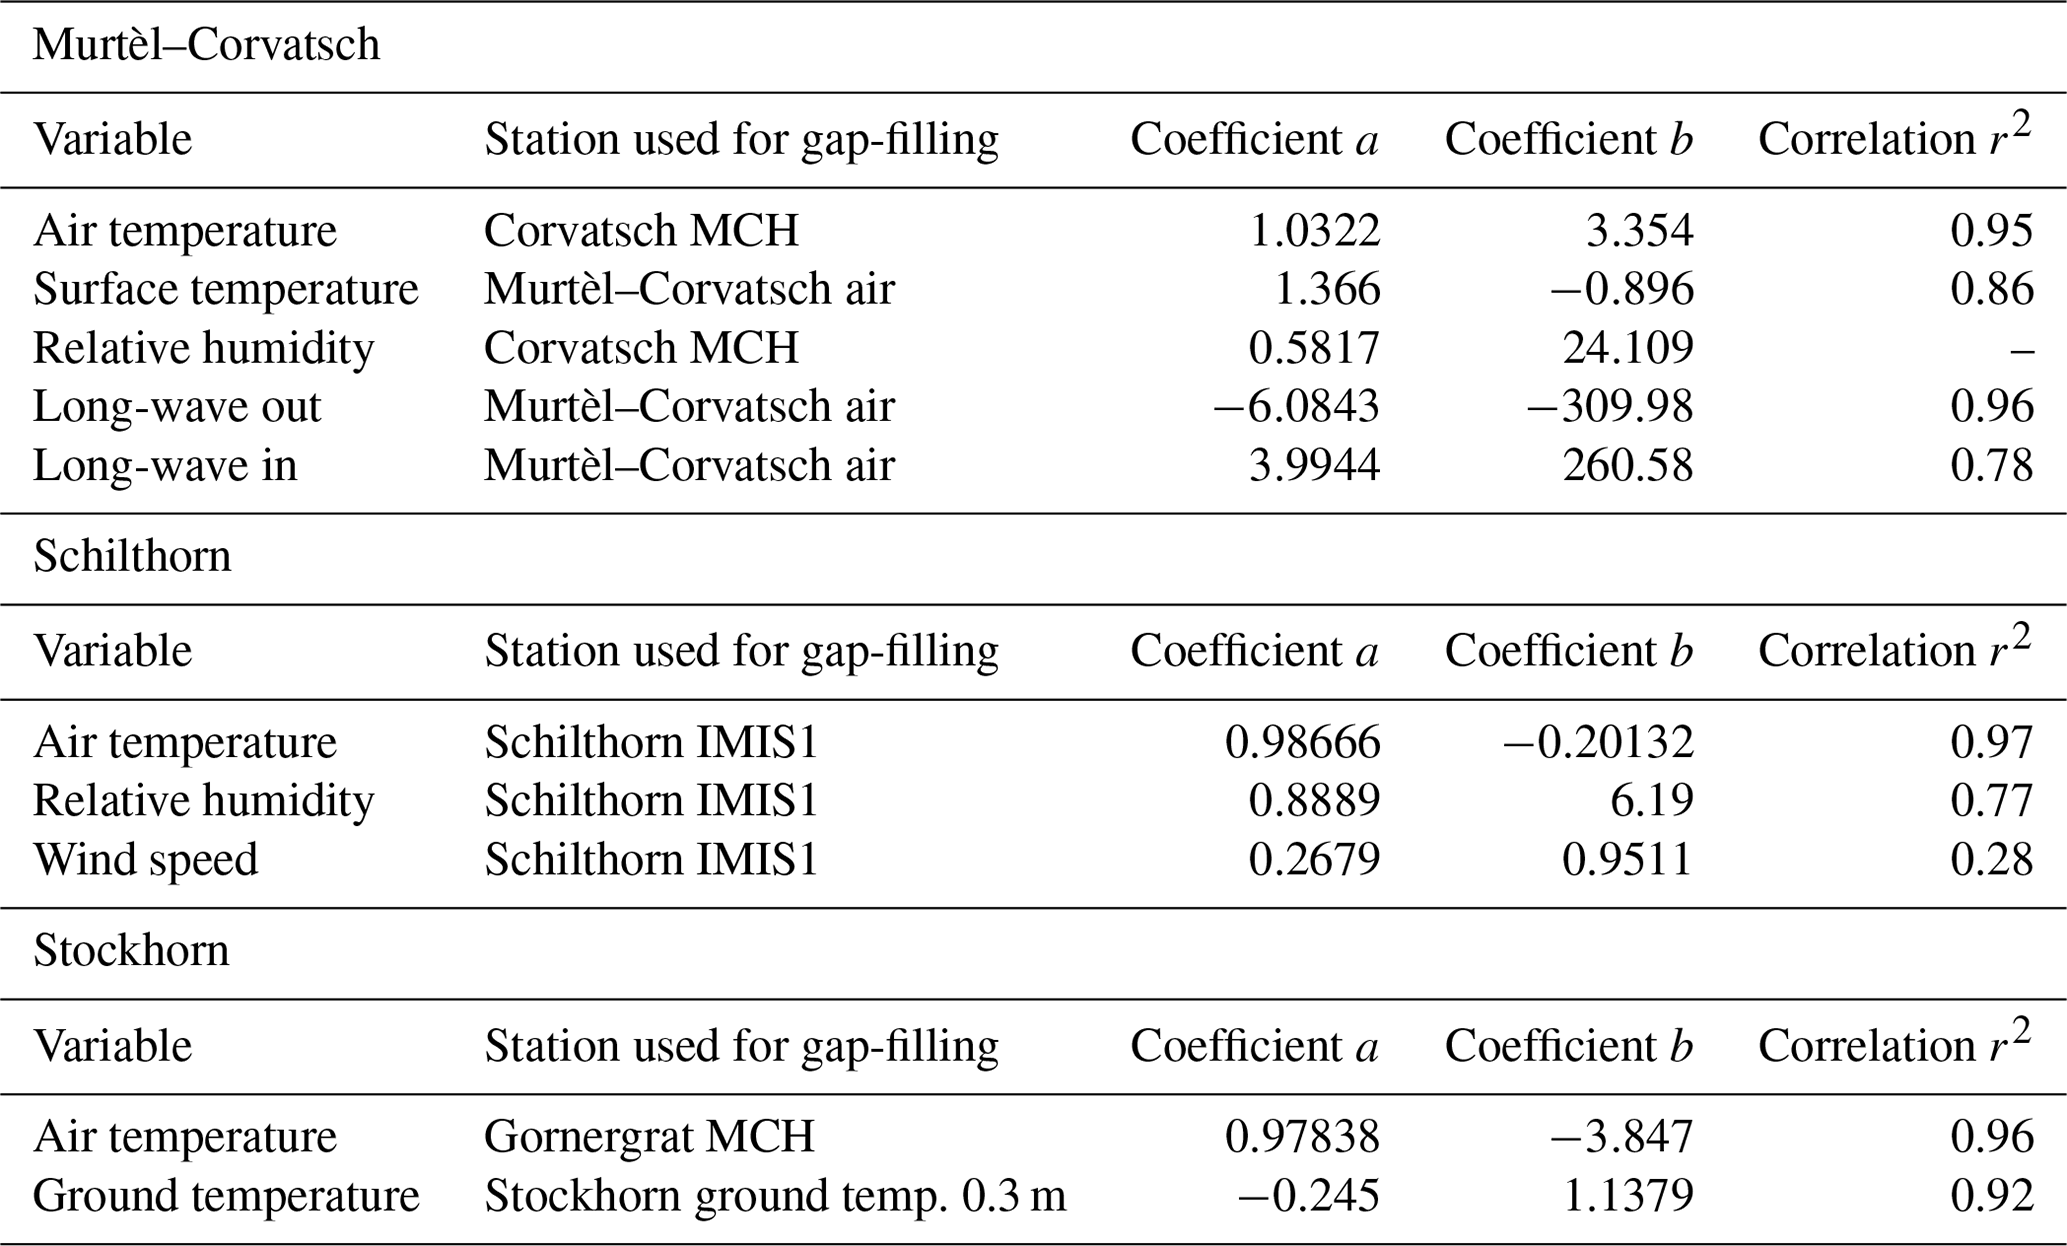
Several datasets are prepared for this study, which are classified into three levels. Level 0 is the collected set of raw data, mainly obtained directly from the loggers (wherever the data were still available). These data are not treated at all, and a large part of the dataset may contain errors. Level 1 data consist of corrected and partly gap-filled data. The gap-filling process is described below. Finally, level 2 data are the final dataset, including additional data processing steps such as correction of short-wave incoming radiation due to snow-covered sensors. For further studies, the use of the level 2 dataset is recommended. The raw data (level 0) were processed using the following processing steps.
-
Range check and small corrections (level 1). For all stations, the data of the variable air temperature outside the range of −40 to +30 ∘C and relative humidity data outside the range of 0 %–101 % were deleted. Data between 100 and 100.9 % were corrected to 100 %. Snow height data were corrected after comparison with neighbouring operational stations in the close surroundings of Murtèl–Corvatsch, Schilthorn and Stockhorn. Individual outliers were either deleted or corrected manually with the help of additional information from our station measurements such as albedo. Negative incoming and outgoing short-wave radiation during the night was set to 0. Unrealistically high values (> than top of atmosphere radiation, 1366 W m−2) were corrected to a value corresponding to its neighbouring values. For the level 1 data, no correction was made for snow coverage on the sensor.
-
Short gap-filling (level 1). In general, single missing values for up to 3 h were corrected by taking the preceding value to fill the unknown values. By this, air temperature and snow height data were almost completely gap-filled. All hourly data gaps for Schilthorn snow height were filled, and only 0.0039 % of data gaps for air temperatures remain. At Stockhorn 4.99 % of data gaps are still present after the gap-filling in both snow height and air temperature data, and for Murtél–Corvatsch 0.1 % for snow height and 2.31 % for air temperature remain.
In addition, site-specific processing steps were performed for the different variables.
-
Long gap-filling (level 1). For data gaps larger than 3 h, missing values were filled using linear regression between data from nearby stations or the station itself. The corresponding variables and coefficients of the linear regressions can be found in Table 2. Snow height data at the Murtél–Corvatsch station were corrected by taking the snow height data from the station Lagrev IMIS with a multiplication factor of 0.625. In the case of Schilthorn the station Türliboden IMIS with a multiplication factor of 0.58016 and for Stockhorn the station Gornergrat IMIS with a multiplier of 0.369425 were used.
-
Radiation corrections (level 2). Level 2 data were corrected using α (albedo) for fresh snow (α=0.87; Oke, 1987) and multiplying it by outgoing radiation. Long-wave incoming radiation was additionally corrected for the known influence of the short-wave incoming radiation by using the formula given by Sicart et al. (2005): ), where corr is equal to 2 %. We considered also that the radiation input perpendicular to a slope is decisive for the energy balance of a surface. The values obtained for the different radiation components have, therefore, to be adapted to the local slope. As a consequence, the values at Murtél–Corvatsch (local slope is 2∘) and at Schilthorn (local slope is 7∘) were corrected by dividing the obtained measurement values by the cosine of this angle.
-
Data aggregation. First, the data were corrected and stored as level 1 hourly data. Then the radiation corrections mentioned above were applied to produce level 2 data. From the level 2 data, the energy balance was calculated. Following a recommendation by the WMO (2017), mean daily values were then calculated from the hourly values if at least 19 h of data were available for a full day. From the daily values, we calculated monthly mean values using a threshold of 25 d, meaning that monthly means are only calculated when at least 25 d of a month were available.
A special case is the Stockhorn station, where meteorological data between 2002 and 2006 were only stored as 6-hourly mean values, with frequent data gaps. Therefore, energy balance was only calculated for the period 2006–2018 after the station was reprogrammed to record hourly values. Level 2 data could only be produced for this time period. Nevertheless, level 1 daily meteorological data for Stockhorn have been produced for the whole period since 2002, albeit with reduced data quality.
We will provide some of the long-term time series which are of relevance for permafrost monitoring such as the air temperatures, snow heights or also information about the dates of the first larger snow fall and snowmelt. We will mainly present monthly aggregated values of all meteorological variables, as well as of the individual energy balance components.
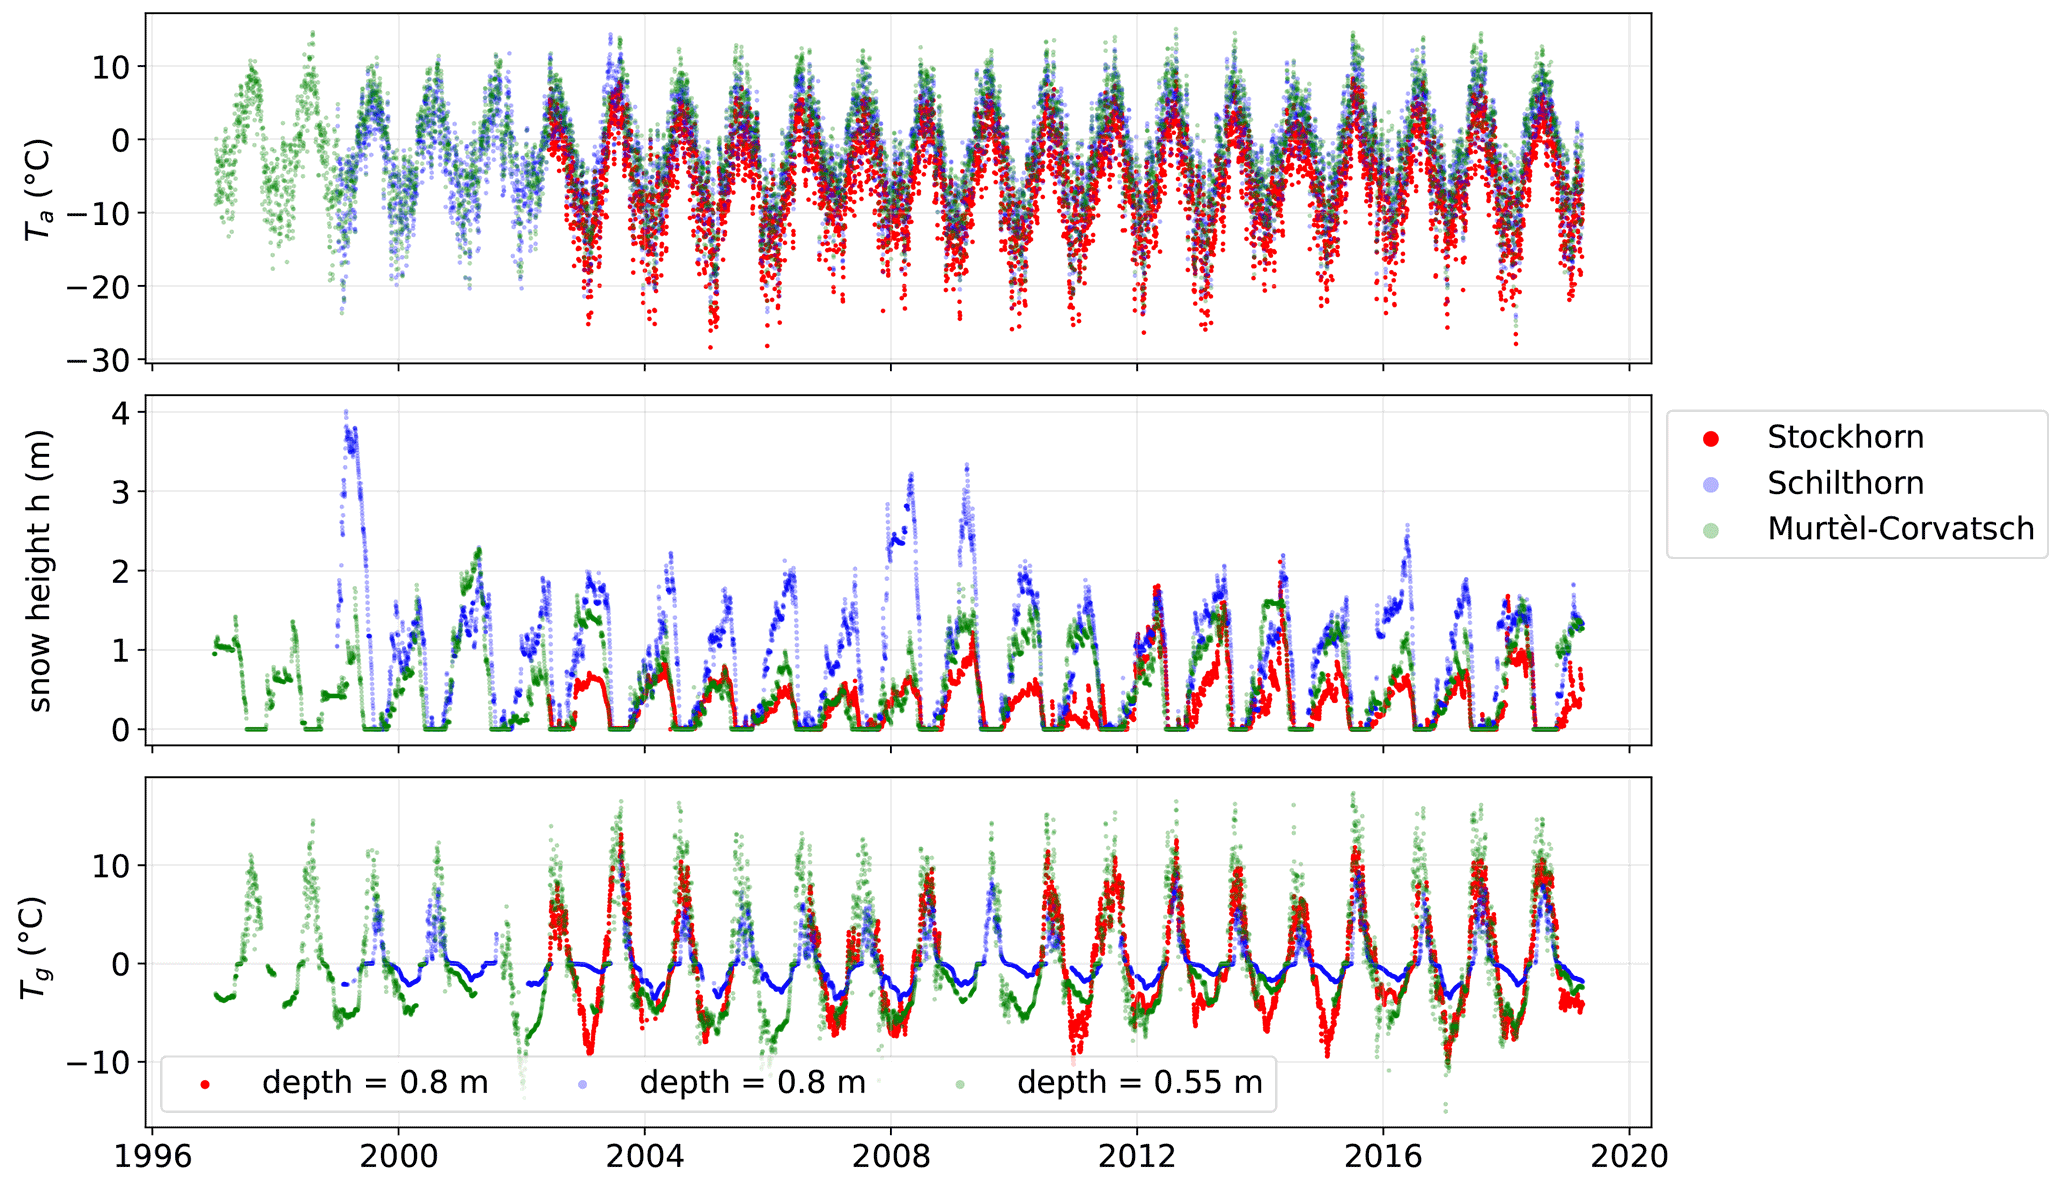
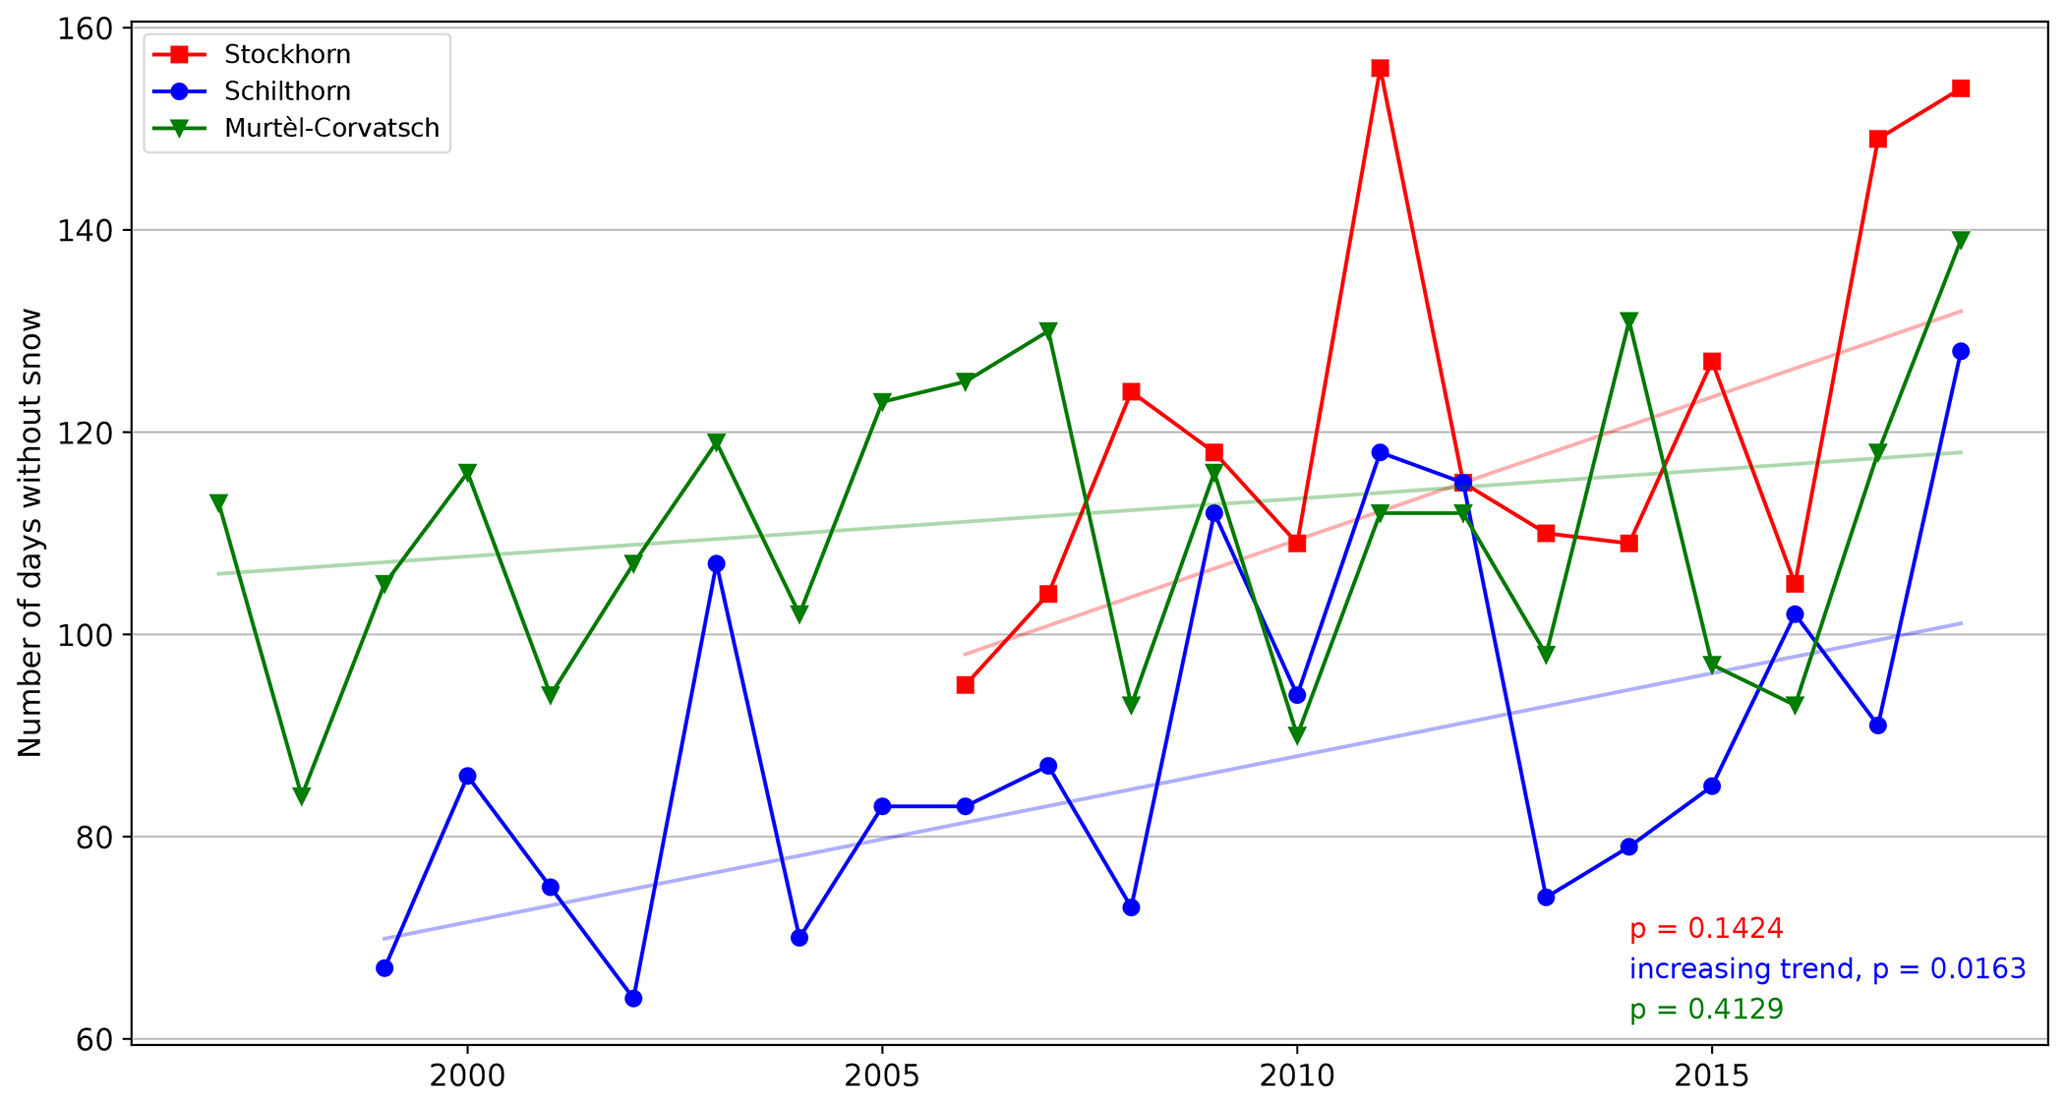
Figure 3Number of days without snow for the three stations. The tendency to have longer periods without snow is clearly visible. Calculated p values using the Mann–Kendall test show a significant increasing trend in days without snow only for the Schilthorn data (95 % confidence interval).
4.1 Measured meteorological components at the three sites
Figure 2 shows the evolution of the mean daily air temperature, snow depth and ground temperatures at all three sites. The observed mean air temperature for the individual observation periods are −1.66 ∘C at Murtèl–Corvatsch (1997–2018), at Schilthorn (1999–2018) −2.60 ∘C and at Stockhorn (2003–2018) −6.18 ∘C. During the observation periods the measured air temperatures show a warming of 0.8 ∘C at Murtèl–Corvatsch, 1.0 ∘C at Schilthorn and 0.5 ∘C at Stockhorn. Measured mean snow heights (Fig. 2) for the winter periods result in 0.50 m at Murtèl–Corvatsch, 0.87 m at Schilthorn and 0.32 m at Stockhorn. Snow height at Schilthorn is close to 3 times the value of Stockhorn. Absolute maximum snow height for Murtèl–Corvatsch is 2.27 m, for Schilthorn 4.01 m and for Stockhorn 2.11 m. The mean of annual maximum snow height for Murtèl–Corvatsch is 0.53 m, for Schilthorn 0.88 m and for Stockhorn 0.31 m. A slightly increasing trend of snow height during the observation periods is recorded at the Murtèl–Corvatsch and Stockhorn sites, and a decreasing trend is observed at the Schilthorn site (trends using Mann–Kendall and Sen slope are not significant). However, the trend would also be positive if the first winter in 1999 with a record snow height would be neglected. The dates when the snow cover starts to build up in autumn and when the snowmelt is completed in spring were determined from the snow height sensor resulting in the amount of snow-free days. Figure 3 illustrates that the number of snow-free days during the observation periods has an increasing tendency. However, using the Mann–Kendall test, only for Schilthorn was a statistically increasing trend calculated. The evolution of the near-surface ground temperatures measured in the boreholes is shown in Fig. 2. The mean ground temperatures are slightly negative for Stockhorn with −0.43 ∘C at a depth of 0.3 m and −0.32 ∘C at 0.8 m but positive for Schilthorn (0.03 ∘C at a depth of 0.2 m and 0.04 ∘C at 0.4 m) and Murtèl–Corvatsch (0.07 at a depth of 0.5 m and −0.28 ∘C at 1.5 m). This reveals either that the observed permafrost at lower depths at these sites is not in equilibrium or that other processes in the active layer produce a considerable offset, as is the case at the Murtèl–Corvatsch site with the coarse blocky surface (Hanson and Hoelzle, 2004; Scherler et al., 2014).
Table 3Mean values and standard deviation for the climate variables calculated based on the mean monthly values and the time period of measurements.
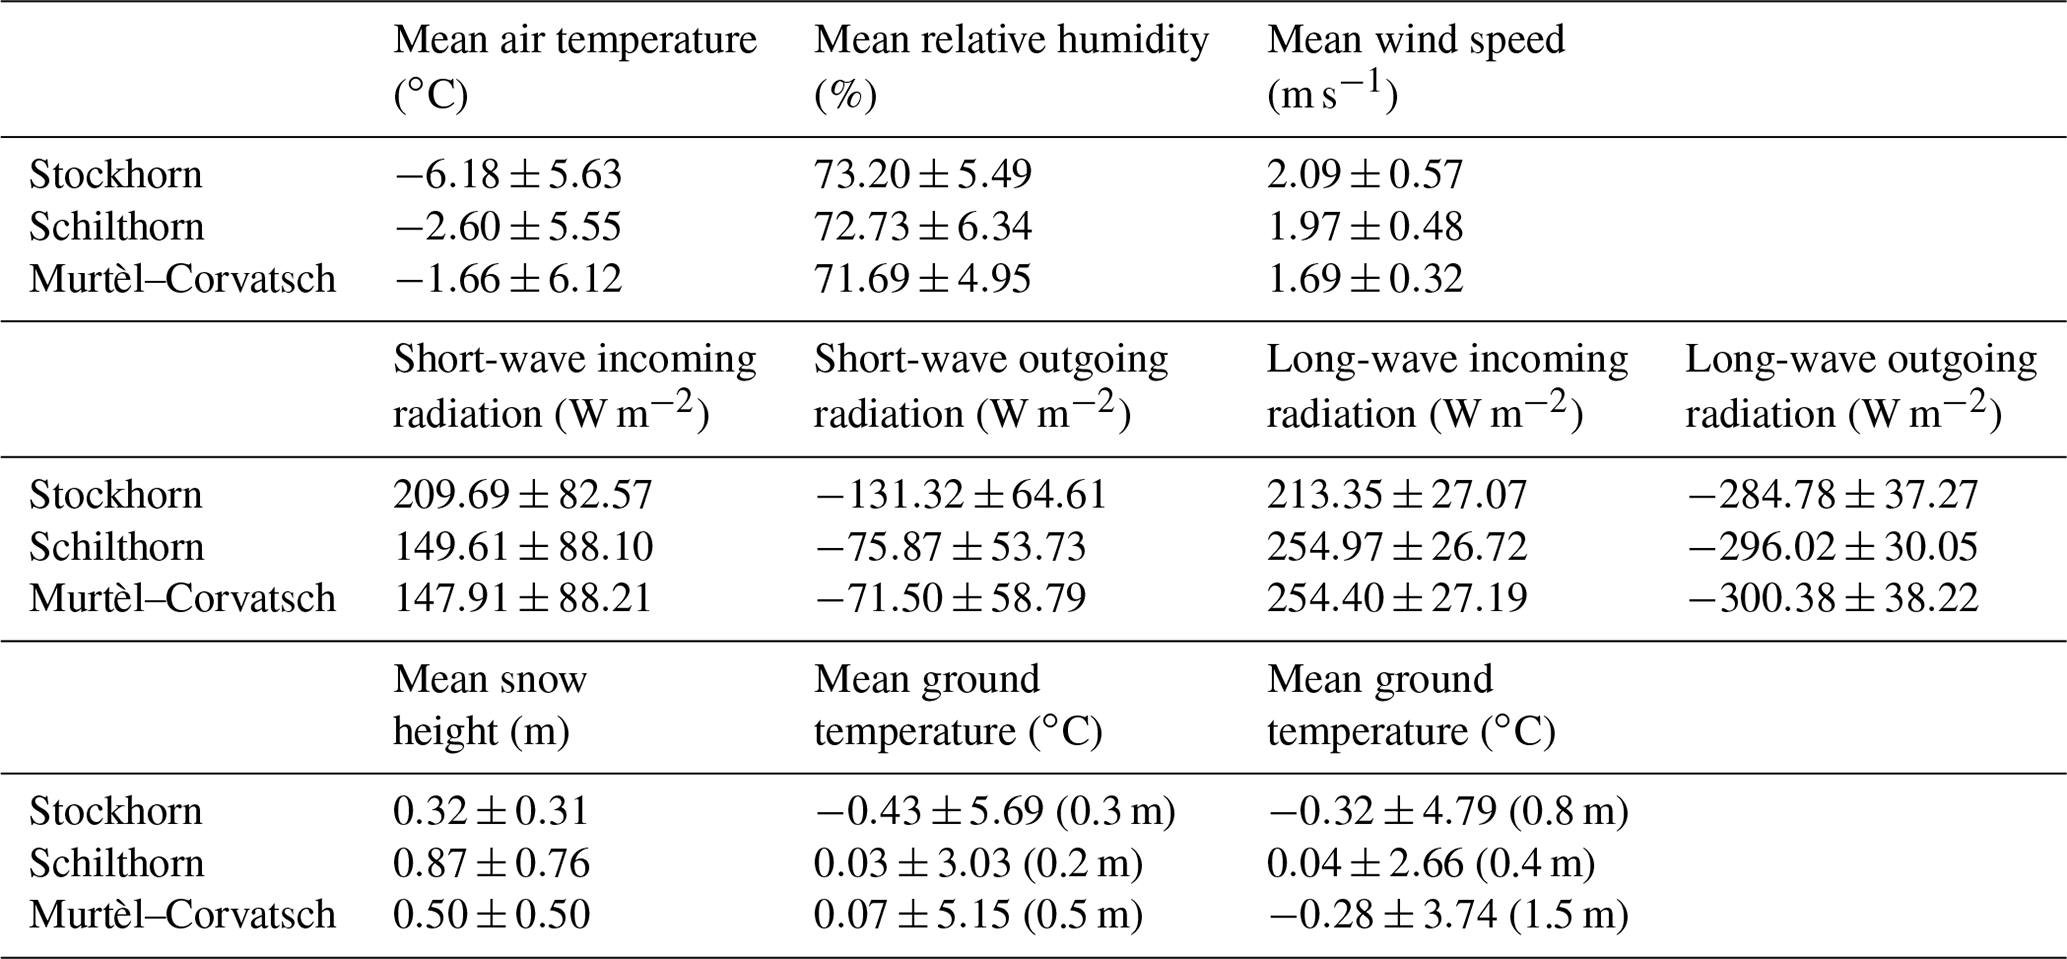

Figure 4Radiation components for all three stations averaged over the observation periods: Murtèl–Corvatsch (1997–2018), Schilthorn (1999–2018) and Stockhorn (2006–2018).
The short-wave incoming and outgoing radiation shows mean values of 147.91 and −71.50 W m−2 for Murtèl–Corvatsch, 149.61 and −75.87 W m−2 for Schilthorn, and 209.69 and −131.32 W m−2 for Stockhorn, respectively, resulting in mean albedo values of 0.48 for Murtèl–Corvatsch, 0.51 for Schilthorn and 0.63 for Stockhorn. For the long-wave incoming and outgoing radiation the following values were observed: 254.40 and −300.38 W m−2 for Murtèl–Corvatsch, 254.97 and −296.02 W m−2 for Schilthorn, and 213.35 and −284.78 W m−2 for Stockhorn, respectively (see Fig. 4 and Table 3). The corresponding net short-wave and long-wave radiation is 76.41 and −45.41 W m−2 for Murtèl–Corvatsch, 73.34 and −41.05 W m−2 for Schilthorn, and 78.37 and −71.43 W m−2 for Stockhorn (see Fig. 4 and Table 3). At Murtèl–Corvatsch and Stockhorn, the radiation components show a slight decreasing trend of incoming short-wave radiation and an increasing trend for incoming long-wave radiation – except for the Schilthorn site (Nyeki et al., 2019). At all sites the mean observed relative humidity is close to 70 % and shows a clear seasonal behaviour with monthly values close to 60 % during winter and around 80 % during summer. We observe that at Murtèl–Corvatsch the wind speed has a mean value of 1.69 m s−1, which is much lower than at Schilthorn with a mean wind speed of 1.97 m s−1 or Stockhorn with 2.09 m s−1 (see Table 3). Wind direction at Murtèl–Corvatsch and Schilthorn are particularly influenced by topography as both stations are located on a northern exposure and are influenced by mountain crests to the south. The Stockhorn station is situated on a mountain crest with dominant wind direction from east–southeast (Fig. 5).
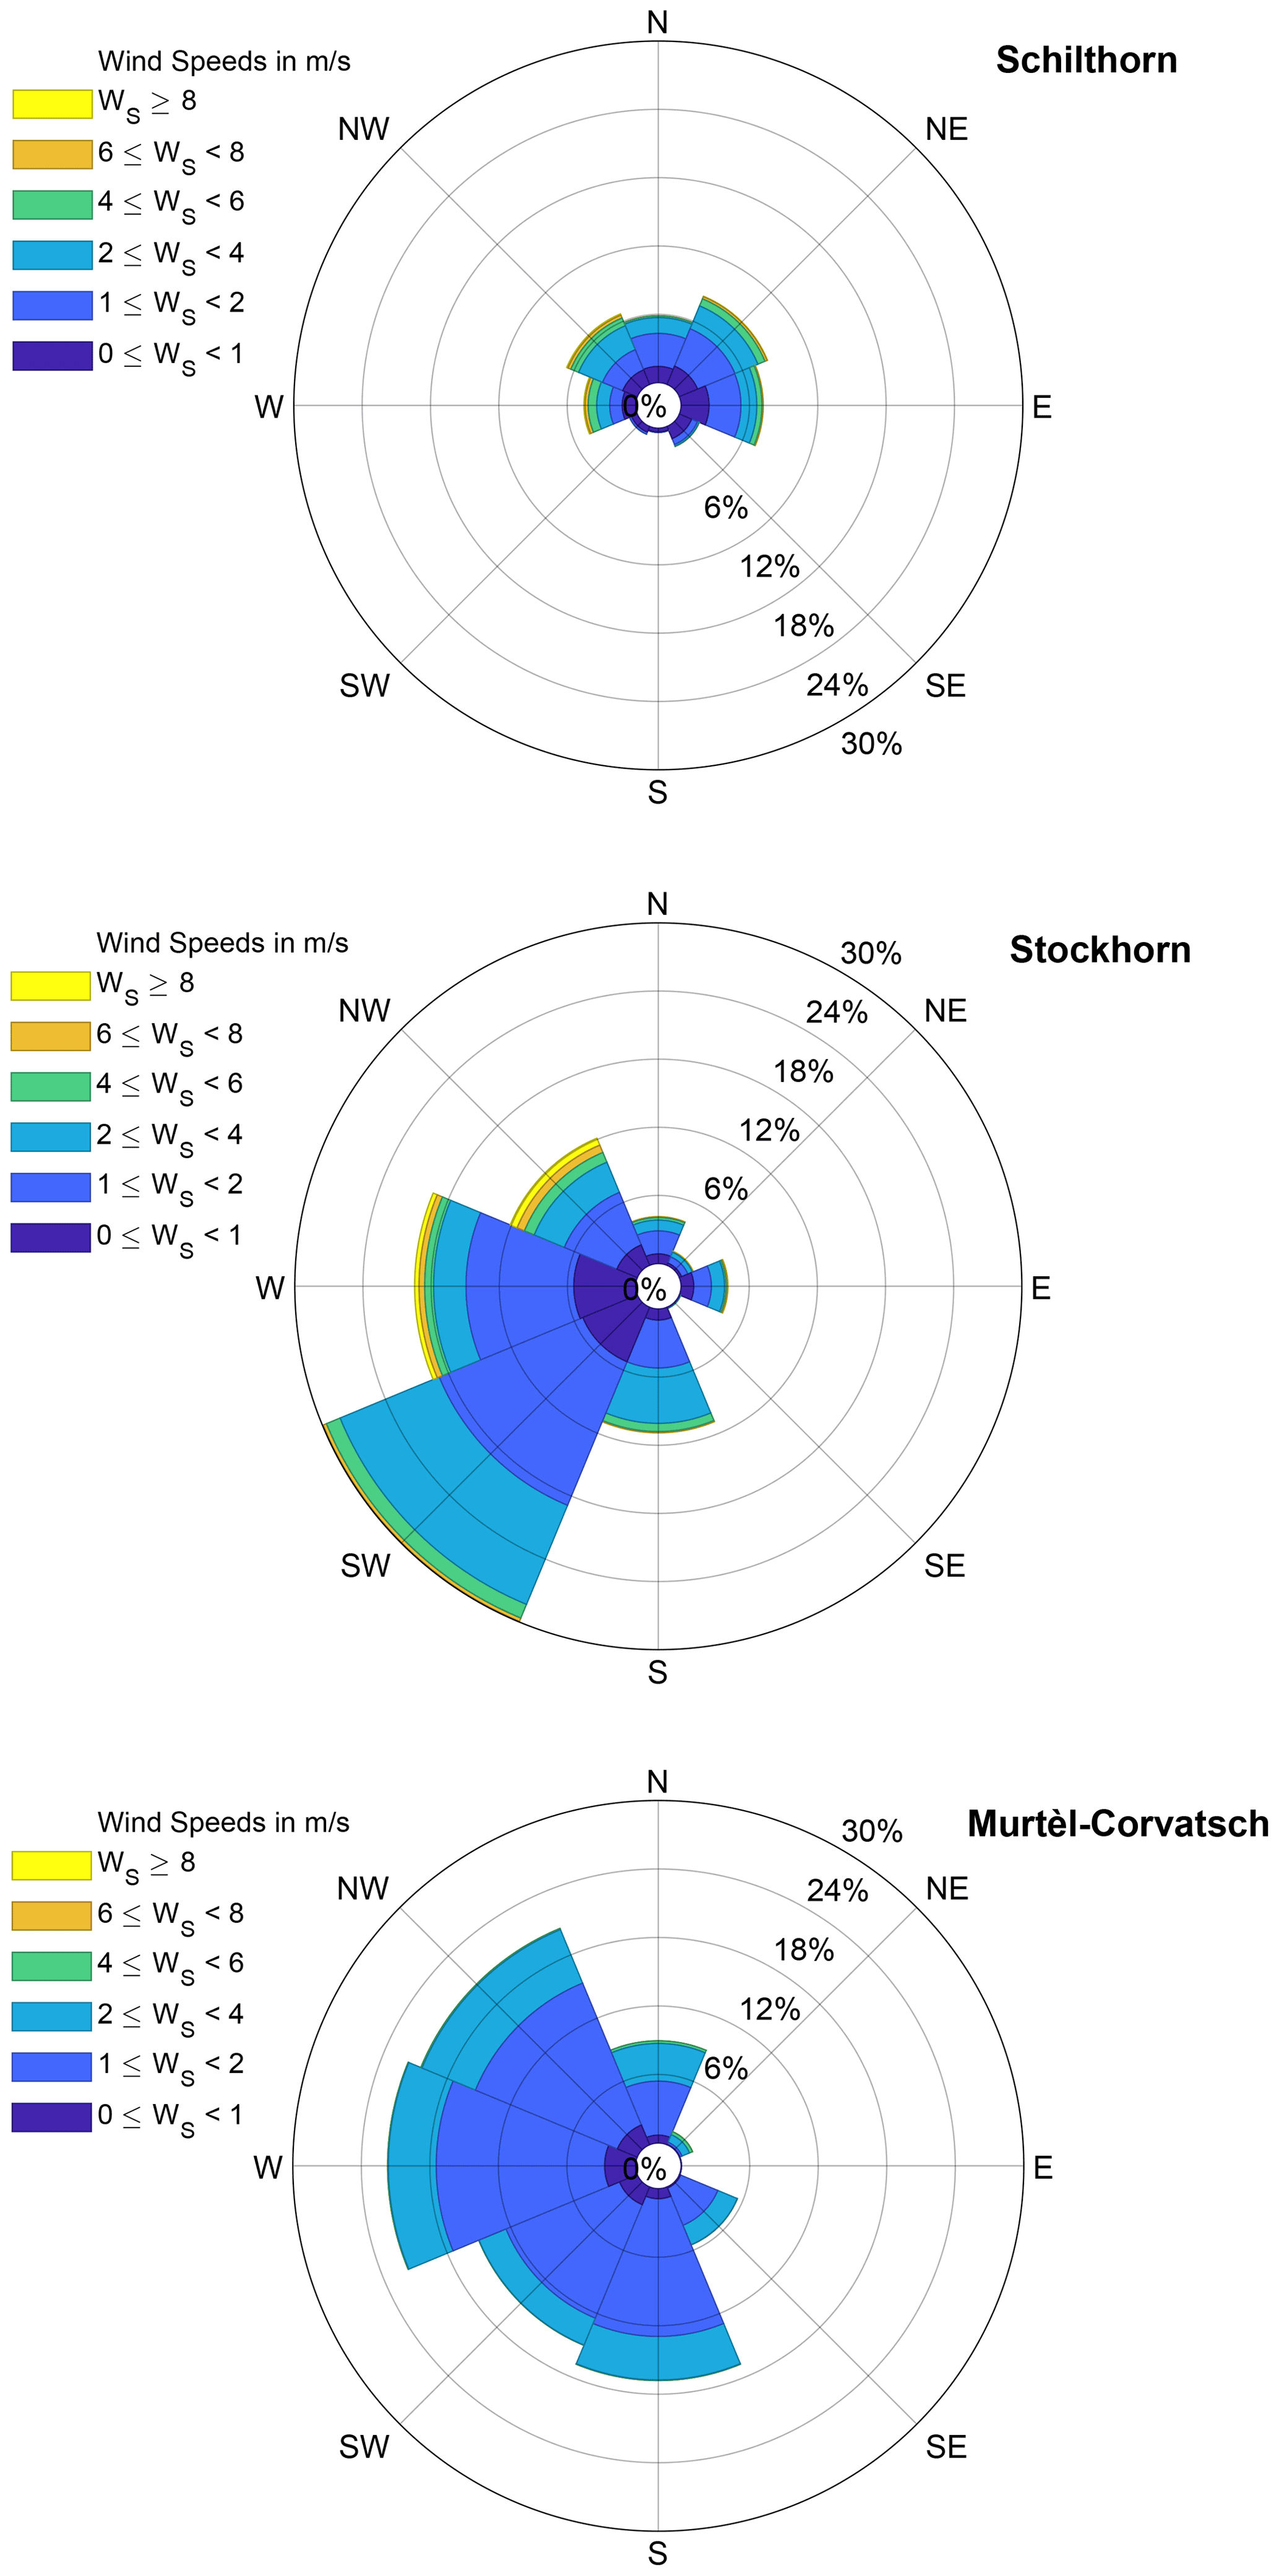
Figure 5Wind speed and direction at all three stations averaged over the observation periods: Murtèl–Corvatsch (1997–2018), Schilthorn (1999–2018) and Stockhorn (2006–2018). Note that scales of relative frequencies are different in the different subplots.
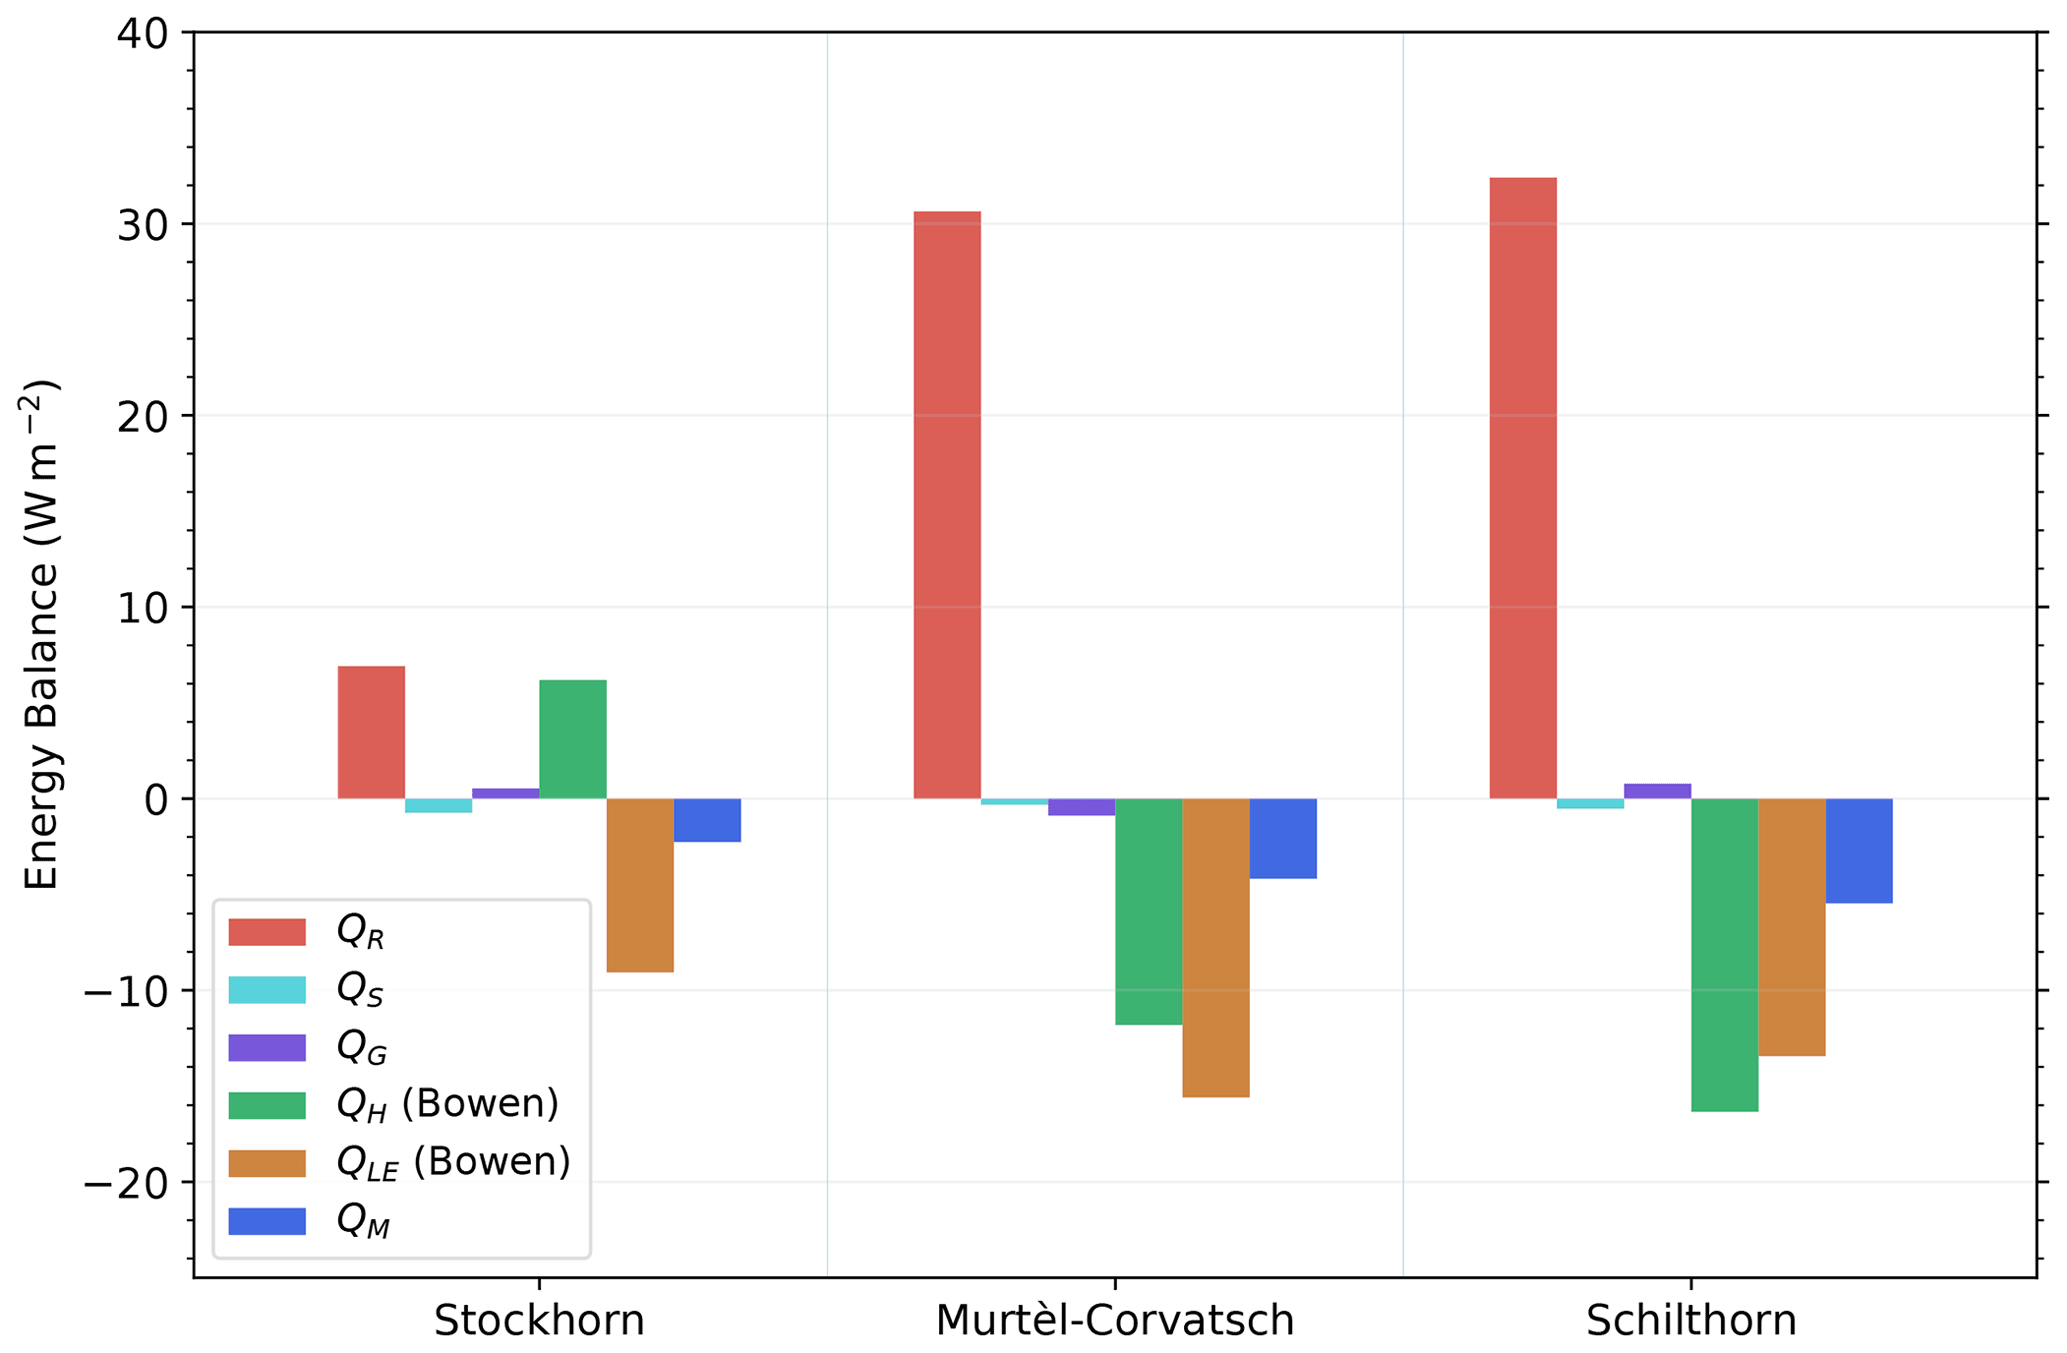
Figure 6Mean energy balance components for all three stations for the whole observation period: Murtèl–Corvatsch (1997–2018), Schilthorn (1999–2018) and Stockhorn (2006–2018).
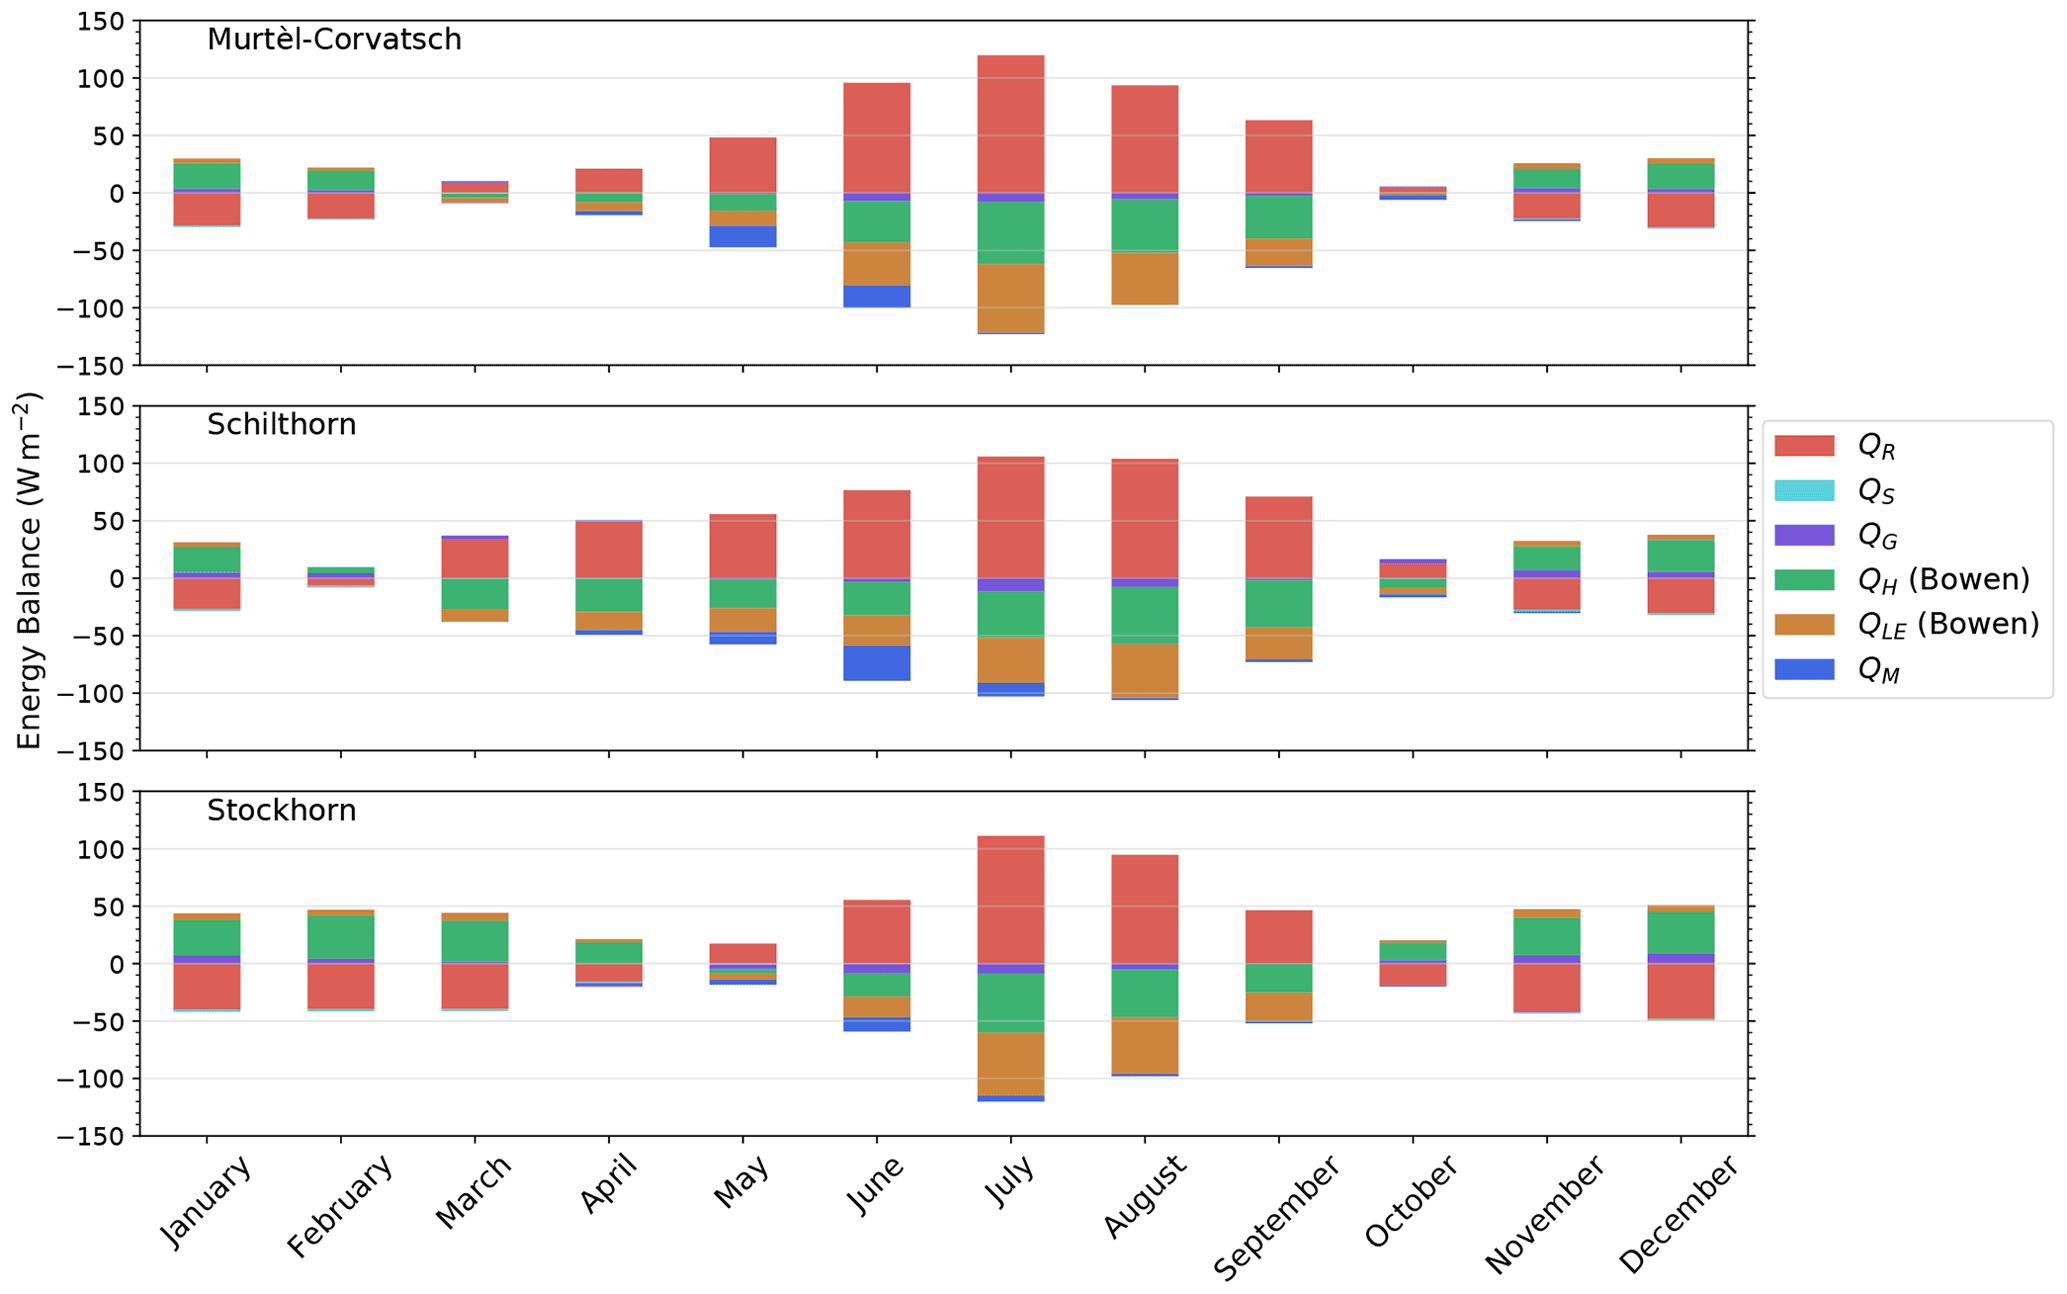
Figure 7Mean monthly energy balance components for all three stations for the whole observation period: Murtèl–Corvatsch (1997–2018), Schilthorn (1999–2018) and Stockhorn (2006–2018).
Table 4Mean values and standard deviation for the energy balance components calculated based on the mean monthly values and the time period of measurements.
4.2 Energy balance
The energy balance at the surface is particularly important as it defines the boundary conditions for the energy transfer between the atmosphere and the subsurface. It has major impacts on the ground heat flux and on the occurrence of permafrost. The components of the energy balance at Stockhorn are smaller than at the other two sites (Fig. 6). The partitioning of the energy balance components is of particular interest. At all three sites the most important energy balance component is the net radiation, which has a net positive value (see Fig. 6). Net radiation at the Stockhorn site is only about 20 % of the net radiation at Schilthorn and Murtèl–Corvatsch. The monthly values show strong seasonal fluctuations (Fig. 7). At Stockhorn, the net radiation is negative from October to April, whereas at Schilthorn and Murtèl–Corvatsch, it is only negative between November and February (Fig. 7). The influence of the snow cover on the energy fluxes is of very high importance. Particularly in spring, snow is using the whole energy of the incoming short-wave radiation to melt, and large differences are occurring for the energy transfer whether the ground is snow-covered or not. We can see a strong difference between the sites. Schilthorn generally has a thick snow cover, and in the months of April to July much of the available energy is used for its melting (mean value of 8.46 W m−2; Fig. 6, Table 4), which is much more than at the other two sites which show mean values of 2.26 W m−2 at Stockhorn and 4.17 W m−2 at Murtél–Corvatsch (Fig. 6, Table 4).
The results for the three sites show that the turbulent fluxes vary between 6 and 15 W m−2 using the Bowen ratio method and between 3 and 15 W m−2 using the bulk method (Table 4). The results of both methods correlate relatively well with coefficients of determination (r2) between 0.5 and 0.7. In comparison to the other fluxes, the heat fluxes in the snow and in the ground are very small with mean values lower than 1 W m−2 (Fig. 6, Table 4).
All three stations show a clear atmospheric warming trend. However, the warming is different at all stations. At Schilthorn (period 1999–2018), we see the strongest increase in air temperature of around 0.054 ∘C yr−1, whereas Murtèl–Corvatsch (period 1997–2018) and Stockhorn (period 2003–2018) experience a smaller air temperature increase of 0.038 and 0.036 ∘C yr−1. However, the temperature increase is different when only considering a period when data are available from all three stations. Taking into account only the observation period 2003–2018, the trend changes particularly at the Murtèl–Corvatsch site with an increase of 0.073 ∘C yr−1. For the same period, Schilthorn recorded a temperature increase of 0.057 ∘C yr−1. The temperature rise is slightly higher when compared to the observed decadal increases between 1991 and 2020 determined regionally by MeteoSwiss, but our observations are only covering the last two decades, when the atmospheric warming was most pronounced.
An interesting fact is a decrease in short-wave incoming radiation observed at all sites, which is most pronounced at Schilthorn. We cannot explicitly explain this observation, but it might well be related to an increase in cloudiness. The melt energy used during the spring season at all three sites seems to be of great importance. The large temporal variability in the snow cover at the individual sites and the large topographical differences between them are considerable. Schilthorn shows the thickest and longest-lasting snow cover during the observation period, and its isolating effect and its energy sink function during melt are probably key to keeping permafrost conditions active at this site. If the number of snow days in spring and early summer decreases (as projected under future climate scenarios; Scherler et al., 2013; Marmy et al., 2016), then the absorbed heat at the surface will increase with a corresponding increase in ground heat flux downward. We can estimate this potential increase if we compare the observed July (11.51 W m−2) or August (8.32 W m−2) ground heat flux with the ground heat flux of May (0.98 W m−2) and June (4.28 W m−2). These estimates are partly confirmed by the observed increase in QG downwards into the ground, particularly at Murtèl–Corvatsch and Schilthorn for June and at Stockhorn for May (Fig. 8). An increasing trend of snow-free days has already been observed and is pointing to a corresponding change in the heat fluxes within the last two decades (see Fig. 3).

Figure 8Mean ground heat fluxes for the months of May and June for all observation years and for all three stations: Murtèl–Corvatsch (1997–2018), Schilthorn (1999–2018) and Stockhorn (2006–2018). P values were calculated using the Mann–Kendall test with a 95 % confidence interval. The decreasing trends in the plots are statistically non-significant.
Furthermore, clear differences in the radiation components at the three sites can be seen. Stockhorn is situated at higher elevation, and the recorded observations show lower air temperatures, as well as correspondingly lower incoming long-wave radiation (Fig. 6). However, short-wave incoming radiation is much higher in contrast to the other two sites leading to a higher relative importance of the short-wave incoming radiation on the energy balance at Stockhorn (Fig. 6). At higher altitudes, in general higher amounts of solar radiation and higher insolation variability are observed than at lower altitudes. In addition, Stockhorn is a relatively dry location with lower humidity and correspondingly lower cloudiness. These observations are of particular interest for the question of elevation-dependent warming (EDW) (Wang et al., 2016; Pepin et al., 2015). As stated in Pepin et al. (2015), a combination of mechanisms are probably responsible for the more pronounced warming trends observed at high-altitude stations: (i) the albedo feedback due to retreating snow lines (e.g. Scherrer et al., 2012), (ii) the cloud feedback caused by increased latent heat release (Ohmura, 2012), and (iii) the water vapour–radiative feedbacks, which are impacting the relationships between long-wave radiation, moisture and thermal regimes and are particularly enhanced at low temperatures in which already small amounts of water vapour increase can lead to a substantial influence on the incoming long-wave radiation (Pepin et al., 2015). In addition to the feedback mechanisms mentioned above, the relationship between temperature and outgoing long-wave radiation is a consequence of the blackbody emission, which is proportional to the fourth power of temperature (Stefan–Boltzmann law). Therefore, if the outgoing long-wave radiation is increasing, a larger temperature change at lower temperatures will result.
The albedo feedback, observed at all three sites as the number of days without snow, is strongly increasing. Regarding the cloud feedback, we find evidence for this effect at all stations by the above-mentioned observation of reduced short-wave incoming radiation and increased temperatures. This may be the most important factor for the strong warming observed at the Schilthorn site. The water vapour–radiative feedbacks may also explain the observed difference between the comparatively dry Stockhorn and the other sites related to the stronger ground temperature increase. However, the overall resulting response at the individual sites is complex, and the above-mentioned effects will impact the different sites with different magnitude. For a better understanding, the presented data from the three stations should be combined with data from other stations in the Alps to gain a better understanding of the effects of EDW.
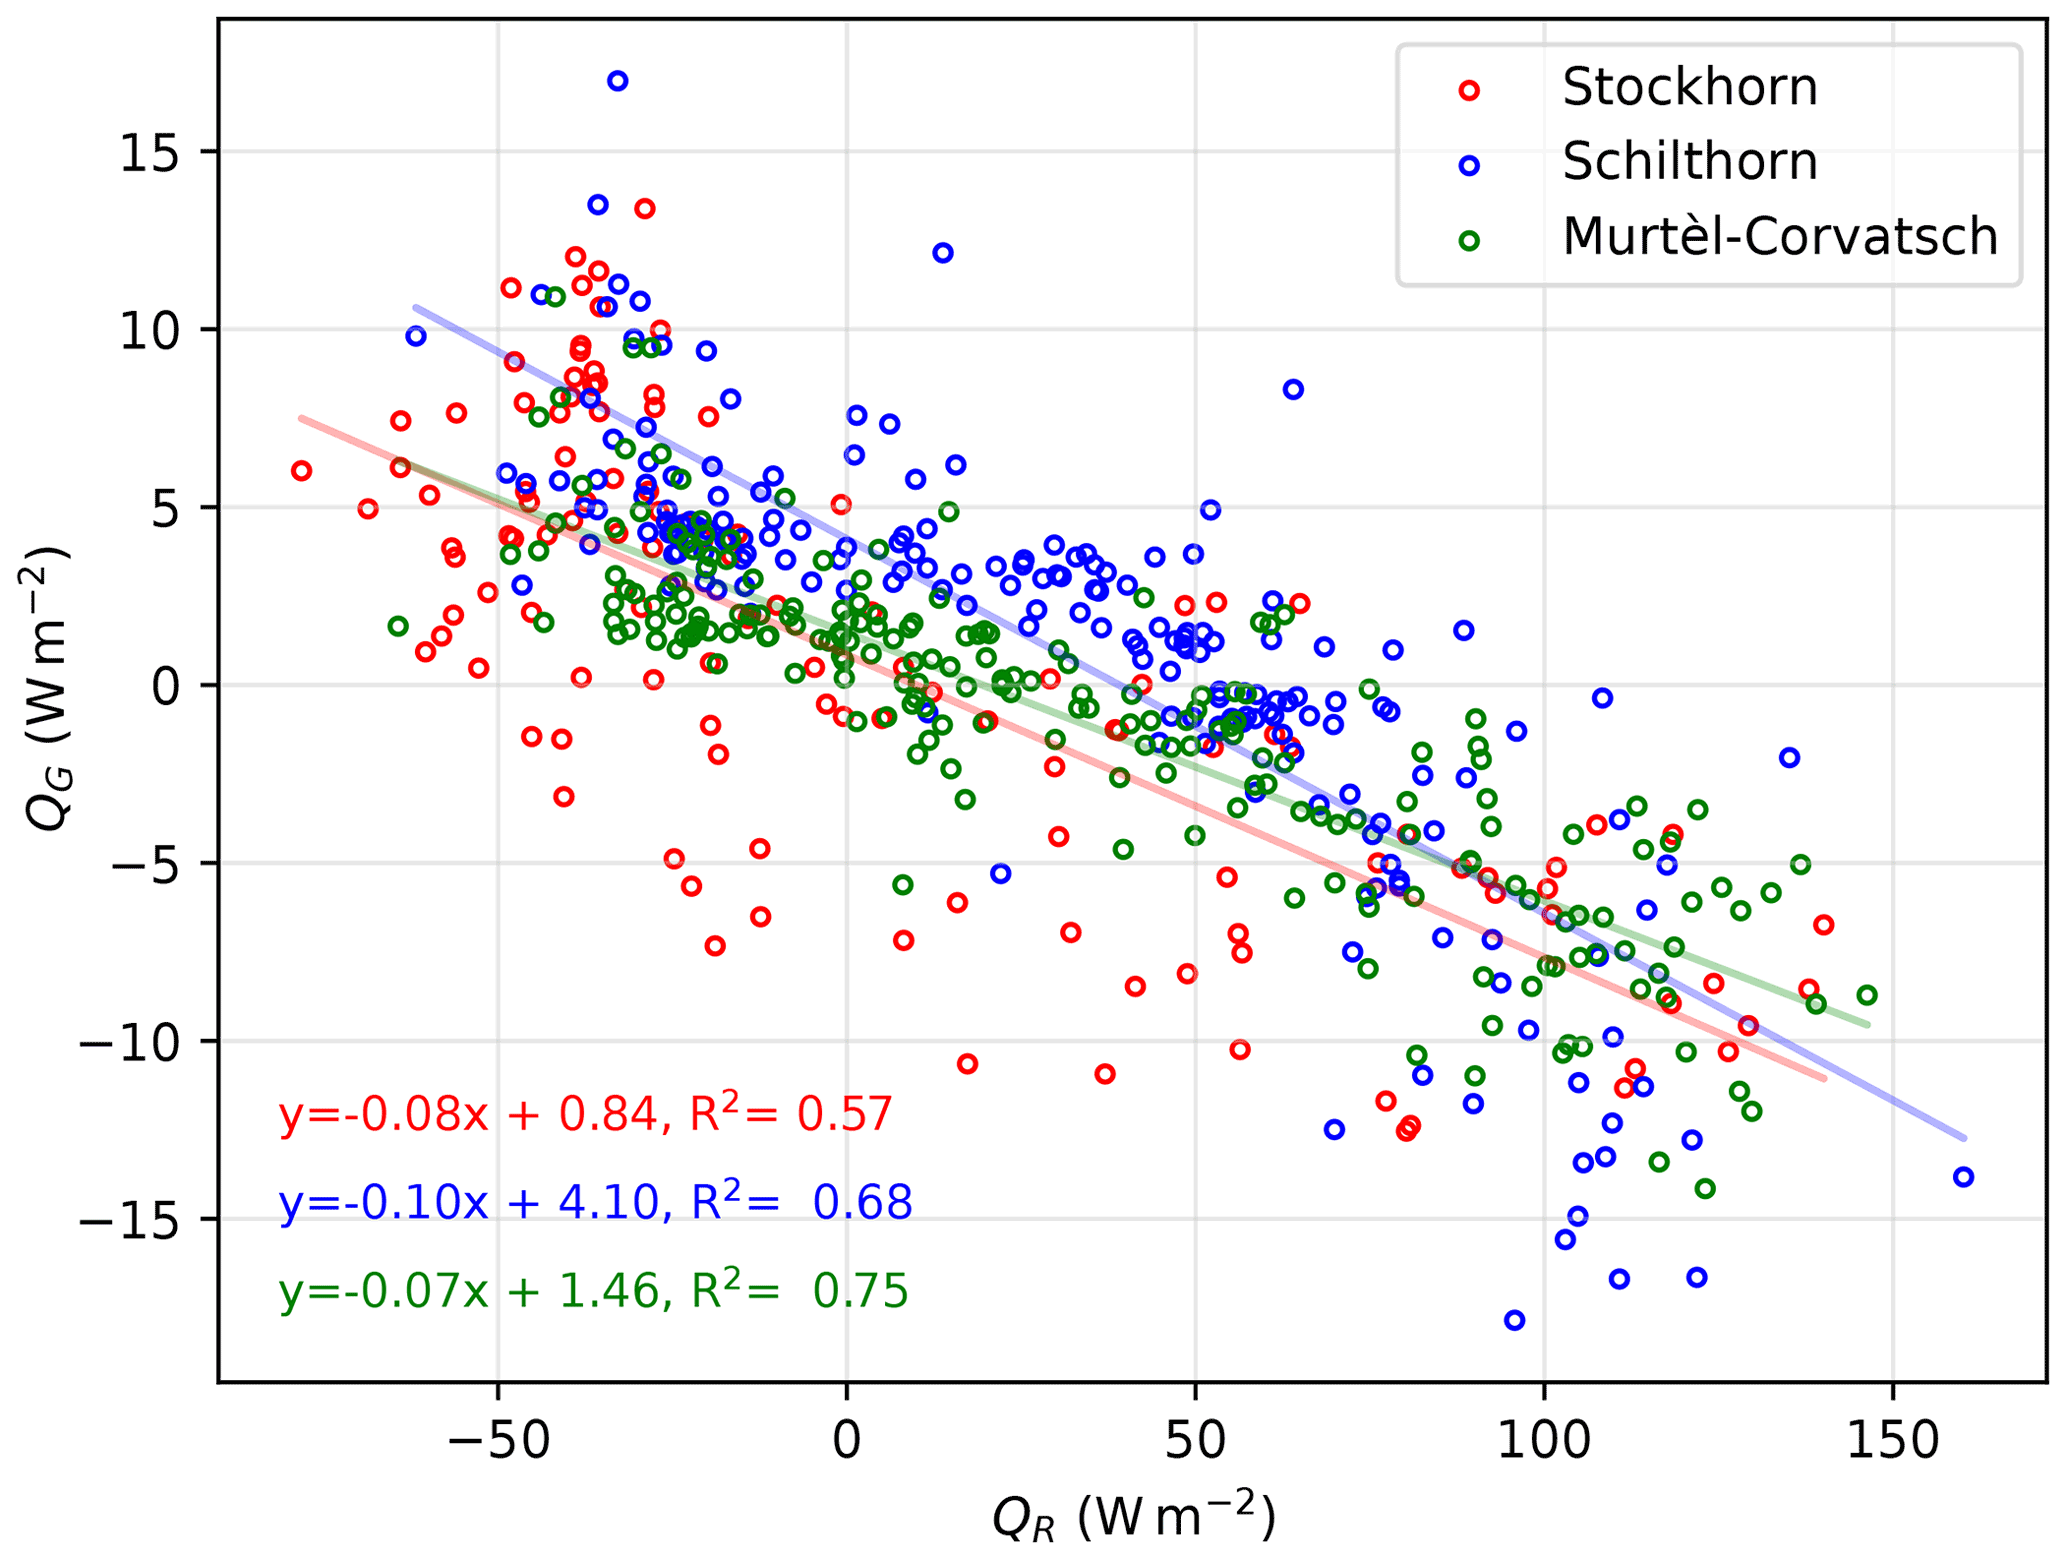
Figure 9Net radiation versus ground heat flux monthly values for the whole observation periods: Murtèl–Corvatsch (1997–2018), Schilthorn (1999–2018) and Stockhorn (2006–2018).
A significant result of this study is depicting the high dependency of the ground heat flux on the net radiation (see Fig. 9). It is especially interesting that a single linear relation from net radiation can be used to calculate the ground heat flux at all three stations with reasonable accuracy. We want to point to the fact that it could be of special interest for the development of simplified permafrost distribution models based on easy to calculate input parameters. In this case a rough land classification in combination with the calculated radiation fluxes would allow us to use the relation shown in Fig. 9. It could also be shown that the air temperature is another important factor for the ground heat flux, which is clearly visible in Fig. 10. However, it has to be noted that the linear relations show different slopes which do not allow for a universal application to a larger region as the individual relations at each station have to be taken into account.

Figure 10Air temperature versus ground heat flux monthly values for the whole observation periods: Murtèl–Corvatsch (1997–2018), Schilthorn (1999–2018) and Stockhorn (2006–2018).
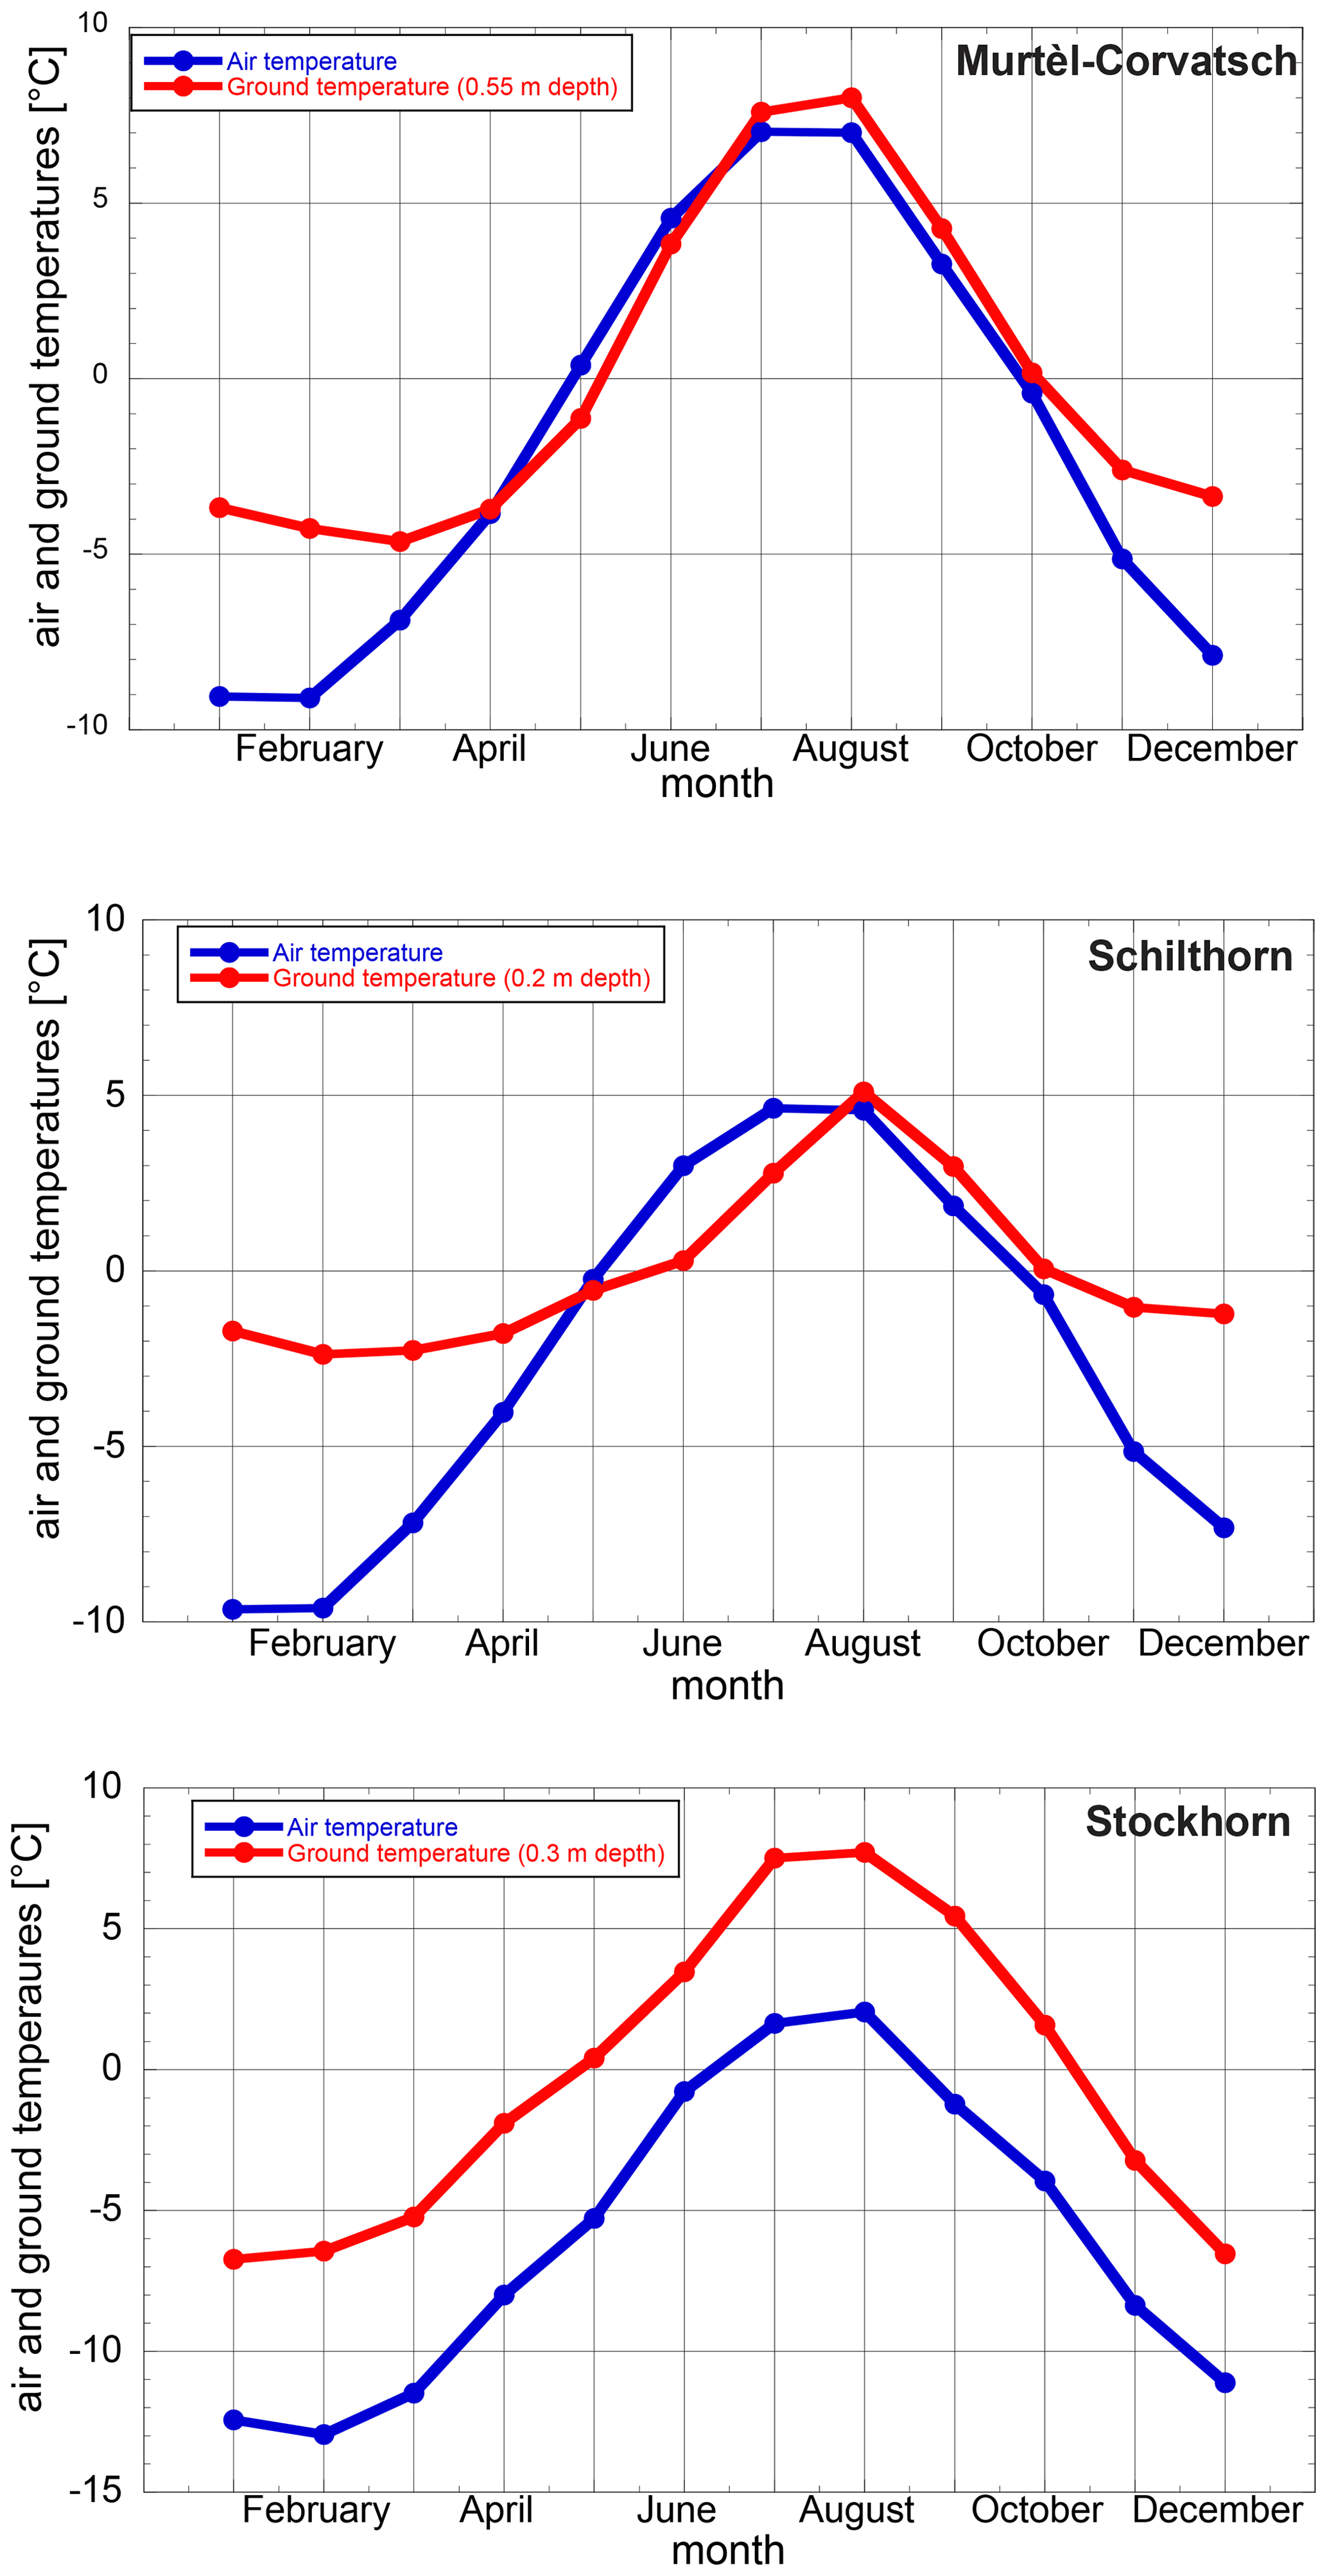
Figure 11Monthly thermal offsets for all three stations for the whole observation periods: Murtèl–Corvatsch (1997–2018), Schilthorn (1999–2018) and Stockhorn (2006–2018).
Finally, thermal offsets relate the air temperatures to the ground temperatures, which is of relevance in most atmosphere–permafrost investigations. In this study, we observe a very large offset at Stockhorn when compared to the other two sites (see Fig. 11). In general, the thermal offset is strongly influenced by the snow cover and by the amount of incoming short-wave and long-wave radiation. The meteorological observations at the three sites revealed that the Stockhorn site receives more incoming short-wave than long-wave radiation in comparison to Schilthorn and Murtél–Corvatsch. As short-wave radiation has a pronounced impact on the surface temperature and subsequently also on the ground temperatures while the ground is snow-free, the resulting thermal offset is larger at this site with higher short-wave radiation compared to sites where the air temperature and the corresponding incoming long-wave radiation are dominant in the energy balance. This type of observation related to the thermal offset of different sites could also be detected along a latitudinal transect from the Arctic to the Alps, showing a higher thermal offset in the Alps than in the Arctic (Etzelmüller et al., 2020), which seems to be influenced by the same conditions such as a thicker snow cover and stronger incoming short-wave radiation.
The data presented and described in this study are available for download at https://doi.org/10.13093/permos-meteo-2021-01 (Hoelzle et al., 2021). The data will also be integrated within different databases such as PERMOS or the Global Energy Balance Archive.
We compiled, processed and quality checked the long-term meteorological datasets from three high mountain permafrost stations in the Swiss Alps by means of basic criteria. All three sites are embedded in the Swiss Permafrost Monitoring Network. The meteorological measurements cover a period of about two decades. The collected data provide valuable information allowing an in-depth insight into the surface energy exchange processes at the different permafrost observation sites. This clearly shows the advantage of long-term monitoring stations in comparison to only short-term project-based observations in which certain long-term trends and changes cannot be detected. The data are freely available for all interested researchers on different data platforms and their corresponding databases. We have quantified different energy fluxes at the surface of the three measurement sites with permafrost occurrence. Our results show that there are considerable differences in the energy fluxes at the different sites. The energy balance data are particularly important and should be used when interpreting long-term climate-related changes of the past, as well as to reveal the drivers of past, present and future changes at the individual sites. This is important for modelling approaches as it shows that only one single variable such as air temperature alone should not be used. Future studies can use the existing data to explore how various permafrost sites will react to the atmospheric warming.
MH did the analysis and wrote most of the text. TM helped with the analysis and created most of the figures. CH, JN, CP and MS helped with creating some figures and writing and interpreting the data.
The contact author has declared that neither they nor their co-authors have any competing interests.
Publisher's note: Copernicus Publications remains neutral with regard to jurisdictional claims in published maps and institutional affiliations.
We want to particularly thank all PERMOS contributors and the project participants of the TEMPS project. The study was mainly financed by the University of Fribourg. A special thanks goes to Cathrine Stocker-Mittaz, who started these measurements at the Murtèl–Corvatsch and the Schilthorn sites during her PhD within the PACE project and to Lorenz King and Stephan Gruber who started the measurements at the Stockhorn site. A particular thank goes to Suryanarayanan Balasubramanian who helped with the programming.
This research has been supported by the Université de Fribourg (grant no. CE-7635).
This paper was edited by Kirsten Elger and reviewed by Edoardo Cremonese and one anonymous referee.
Arck, M. and Scherrer, D.: A physically based method for correcting temperature data measured by naturally ventilated sensors over snow, J. Glaciol., 47, 665–670, https://doi.org/10.3189/172756501781831774, 2001. a
Biskaborn, B., Smith, S., Noetzli, J., Matthes, H., Vieira, G., Streletskiy, D., Schoeneich, P., Romanovsky, V., Lewkowicz, T., Abramov, A., Allard, M., Boike, J., Cable, W., Christiansen, H., Delaloye, R., Diekmann, B., Drozdov, D., Etzelmuller, B., Grosse, G., Guglielmin, M., Ingeman-Nielsen, T., Isaksen, K., Ishikawa, M., Johansson, M., Johannsson, H., Joo, A., Kaverin, D., Kholodov, A., Konstantinov, P., Kroger, T., Lambiel, C., Lanckman, J.-P., Luo, D., Malkova, G., Meiklejohn, I., Moskalenko, N., Oliva, M., Phillips, M., Ramos, M., Sannel, A., Sergeev, D., Seybold, C., Skryabin, P., Vasiliev, A., Wu, Q., Yoshikawa, K., Zheleznyak, M., and Lantuit, H.: Permafrost is warming at a global scale, Nat. Commun., 10, 469–489, https://doi.org/10.1038/s41467-018-08240-4, 2019. a
Boike, J., Wille, C., and Abnizova, A.: Climatology and summer energy and water balance of polygonal tundra in the Lena River Delta, Siberia, J. Geophys. Res., 113, G03025, https://doi.org/10.1029/2007JG000540, 2008. a
Boike, J., Juszak, I., Lange, S., Chadburn, S., Burke, E., Overduin, P. P., Roth, K., Ippisch, O., Bornemann, N., Stern, L., Gouttevin, I., Hauber, E., and Westermann, S.: A 20-year record (1998–2017) of permafrost, active layer and meteorological conditions at a high Arctic permafrost research site (Bayelva, Spitsbergen), Earth Syst. Sci. Data, 10, 355–390, https://doi.org/10.5194/essd-10-355-2018, 2018. a
Bowen, I.: The ratio of heat losses by conduction and by evaporation from any water surface, Phys. Rev., 27, 779–787, 1926. a, b
Brock, B., Willis, I., and Sharp, M.: Measurement and parameterisation of surface roughness variations at Haut Glacier d'Arolla, J. Glaciol., 52, 281–297, https://doi.org/10.3189/172756506781828746, 2006. a
Brock, B., Mihalcea, C., Kirkbride, M., Diolaiuti, G., Cutler, M., and Smiraglia, C.: Meteorology and surface energy fluxes in the 2005–2007 ablation seasons at the Miage debris‐covered glacier, Mont Blanc Massif, Italian Alps, J. Geophys. Res., 115, D09106, https://doi.org/10.1029/2009JD013224, 2010. a, b
Brutsaert, W.: Evaporation Into the Atmosphere: Theory, History and Applications, Springer, New York, 1982. a, b
Burn, C. and Smith, C.: Observations of the 'thermal offset' in near-surface mean annual ground temperatures at several sites near Mayo, Yukon Territory Canada, Arctic, 41, 99–104, 1988. a
Chadburn, S. E., Burke, E. J., Essery, R. L. H., Boike, J., Langer, M., Heikenfeld, M., Cox, P. M., and Friedlingstein, P.: Impact of model developments on present and future simulations of permafrost in a global land-surface model, The Cryosphere, 9, 1505–1521, https://doi.org/10.5194/tc-9-1505-2015, 2015. a
Denby, B. and Greuell, W.: The use of bulk and profile methods for determining surface heat fluxes in the presence of glacier winds, J. Glaciol., 46, 445–452, https://doi.org/10.3189/172756500781833124, 2000. a
Ekici, A., Chadburn, S., Chaudhary, N., Hajdu, L. H., Marmy, A., Peng, S., Boike, J., Burke, E., Friend, A. D., Hauck, C., Krinner, G., Langer, M., Miller, P. A., and Beer, C.: Site-level model intercomparison of high latitude and high altitude soil thermal dynamics in tundra and barren landscapes, The Cryosphere, 9, 1343–1361, https://doi.org/10.5194/tc-9-1343-2015, 2015. a
Essery, R., Morin, S., Lejeune, Y., and Ménard, C.: A comparison of 1701 snow models using observations from an alpine site, Adv. Water Resour., 55, 131–148, https://doi.org/10.1016/j.advwatres.2012.07.013, 2013. a
Etzelmüller, B.: Recent advances in mountain permafrost research, Permafrost Periglac. Process., 24, 99–107, https://doi.org/10.1002/ppp.1772, 2013. a
Etzelmüller, B., Guglielmin, M., Hauck, C., Hilbich, C., Hoelzle, M., Isaksen, K., Noetzli, J., Oliva, M., and Ramos, M.: Twenty years of European Mountain Permafrost Dynamics – the PACE Legacy, Environ. Res. Lett., 15, 104070, https://doi.org/10.1088/1748-9326/abae9d, 2020. a, b
Favier, V., Wagnon, P., Chazarin, J.-P., Maisincho, L., and Coudrain, A.: One‐year measurements of surface heat budget on the ablation zone of Antizana Glacier 15, Ecuadorian Andes, J. Geophys. Res., 109, D18105, https://doi.org/10.1029/2003JD004359, 2004. a
Fiddes, J., Endrizzi, S., and Gruber, S.: Large-area land surface simulations in heterogeneous terrain driven by global data sets: application to mountain permafrost, The Cryosphere, 9, 411–426, https://doi.org/10.5194/tc-9-411-2015, 2015. a
GCOS: Implementation plan for the global observing system for climate in support of the UNFCCC (2010 update), Report, World Meteorological Organization, TD-No. 1523, 2010. a
Gruber, S. and Hoelzle, M.: The cooling effect of coarse blocks revisited: a modelling study of a purely conductive mechanism, in: 9th International Conference on Permafrost, Proceedings, edited by: Kane, D. and Hinkel, K., Institute of Northern Engineering, University of Alaska, 1, 557–561, 2008. a
Haeberli, W. and Beniston, M.: Climate change and its impacts on glaciers and permafrost in the Alps, The Royal Swedish Academy of Sciences, 27, 258–265, 1998. a
Hanson, S. and Hoelzle, M.: The thermal regime of the active layer at the Murtèl rock glacier based on data from 2002, Permafrost Periglac. Process., 15, 273–282, https://doi.org/10.1002/ppp.499, 2004. a, b
Harris, C., Vonder Mühll, D., Isaksen, K., Haeberli, W., Sollid, J., King, L., Holmlund, P., Dramis, F., Guglielmin, M., and Palacios, D.: Warming permafrost in European mountains, Global Planet. Change, 39, 215–225, https://doi.org/10.1016/j.gloplacha.2003.04.001, 2003. a
Hock, R., Rasul, G., Adler, C., Cáceres, B., Gruber, S., Hirabayashi, Y., Jackson, M., Kaeaeb, A., Kang, S., Kutuzov, S., Milner, A., Molau, U., Morin, S., Orlove, B., and Steltzer, H.: High Mountain Areas, IPCC, 2, 202, 2019. a
Hoelzle, M. and Gruber, S.: Borehole and ground surface temperatures and their relationship to meteorological conditions in the Swiss Alps, in: 9th International Conference on Permafrost. Proceedings, edited by: Kane, D. and Hinkel, K., Institute of Northern Engineering, University of Alaska, 1, 723–728, 2008. a, b, c, d, e, f, g
Hoelzle, M., Vonder Mühll, D., and Haeberli, W.: Thirty years of permafrost research in the Corvatsch-Furtschellas area, Eastern Swiss Alps: a review, Norwegian J. Geogr., 56, 137–145, https://doi.org/10.1080/002919502760056468, 2002. a, b
Hoelzle, M., Hauck, C., Mathys, T., Noetzli, J., Pellet, C., and Scherler, M.: Energy balance measurements at three PERMOS sites: Corvatsch, Schilthorn, Stockhorn, https://doi.org/10.13093/permos-meteo-2021-01, 2021. a, b
Huggel, C., Fischer, L., Schneider, D., and Haeberli, W.: Research advances on climate-induced slope instability in glacier and permafrost high-mountain environments, Geogr. Helv., 65, 146–156, https://doi.org/10.5194/gh-65-146-2010, 2010. a
Huggel, C., Carey, M., Clague, J., and Kääb, A.: The high-mountain cryosphere: Environmental changes and human risks, edited by: Huggel, C., Carey, M., Clague, J. J., and Kääb, A., Cambridge University Press, Cambridge, 363 pp., 2015. a
Imhof, M., Pierrhumbert, G., Haeberli, W., and Kienholz, H.: Permafrost investigation in the Schilthorn massif, Bernese Alps, Switzerland, Permafrost Periglac. Process., 11, 189–206, https://doi.org/10.1002/1099-1530(200007/09)11:3<189::AID-PPP348>3.0.CO;2-N, 2000. a
IPCC: Climate Change 2013: The Physical Basis. Contribution of working group I to the fifth assessment report of the intergovernmental panel of climate change, edited by: Stocker, T. F., Qin, D., Plattner, G.-K., Tignor, M., Allen, S. K., Boschung, J., Nauels, A., Xia, Y., Bex, V., and Midgley, P. M., Cambridge University Press, Cambridge, United Kingdom and New York, NY, USA, 1535 pp., Cambridge University Press, Cambridge, United Kingdom and New York, NY, USA, 2013. a
Keller, F.: Interaktionen zwischen Schnee und Permafrost – Eine Grundlagenstudie im Oberengadin. Versuchsanstalt für Wasserbau, Hydrologie und Glaziologie, PhD thesis, Mitteilungen 127, ETH Zürich, Zürich, 145 pp., 1994. a
King, L.: Soil and rock temperatures in discontinuous permafrost: Gornergrat and Unterrothorn, Wallis, Swiss Alps, Permafrost Periglac. Process., 1, 177–188, https://doi.org/10.1002/ppp.3430010208, 1990. a
Langer, M., Westermann, S., Muster, S., Piel, K., and Boike, J.: The surface energy balance of a polygonal tundra site in northern Siberia – Part 1: Spring to fall, The Cryosphere, 5, 151–171, https://doi.org/10.5194/tc-5-151-2011, 2011a. a
Langer, M., Westermann, S., Muster, S., Piel, K., and Boike, J.: The surface energy balance of a polygonal tundra site in northern Siberia – Part 2: Winter, The Cryosphere, 5, 509–524, https://doi.org/10.5194/tc-5-509-2011, 2011b. a
Luethi, R., Phillips, M., and Lehning, M.: Estimating Non-Conductive Heat Flow Leading to Intra-Permafrost Talik Formation at the Ritigraben Rock Glacier (Western Swiss Alps), Permafrost Periglac. Process., 28, 183–194, https://doi.org/10.1002/ppp.1911, 2017. a
Marmy, A., Rajczak, J., Delaloye, R., Hilbich, C., Hoelzle, M., Kotlarski, S., Lambiel, C., Noetzli, J., Phillips, M., Salzmann, N., Staub, B., and Hauck, C.: Semi-automated calibration method for modelling of mountain permafrost evolution in Switzerland, The Cryosphere, 10, 2693–2719, https://doi.org/10.5194/tc-10-2693-2016, 2016. a, b
Mattson, L. and Gardner, J.: Energy exchange and ablation rates on the debris‐covered Rakhiot Glacier, Pakistan, Zeitschrift für Gletscherkunde und Glazialgeologie, 25, 17–32, 1989. a
Mellor, M.: Engineering properties of snow, J. Glaciol., 19, 15–66, 1977. a
Mittaz, C., Hoelzle, M., and Haeberli, W.: First results and interpretation of energy-flux measurements of Alpine permafrost, Ann. Glaciol., 31, 275–280, https://doi.org/10.3189/172756400781820363, 2000. a, b
Moore, R.: On the use of bulk aerodynamic formulae over melting snow, Nordic Hydrology, 14, 193–206, 1983. a
Munro, D.: Surface roughness and bulk heat transfer on a glacier: Comparison with eddy correlation, J. Glaciol., 35, 343–348, 1989. a
Nakawo, M. and Young, G.: Estimate of glacier ablation under a debris layer from surface temperature and meteorological variables, J. Glaciol., 28, 29–34, 1982. a
Nicholson, L. and Benn, D.: Calculating ice melt beneath a debris layer using meteorological data, J. Glaciol., 52, 463–470, https://doi.org/10.3189/172756506781828584, 2006. a
Noetzli, J., Christiansen, H., Isaksen, K., Smith, S., Zhao, L., and Streletskiy, D.: Permafrost thermal state, B. Am. Meteorol. Soc., 101, 34–36, https://doi.org/10.1175/BAMS-D-20-0104.1, 2020. a
Noetzli, J., Arenson, L., Bast, A., Beutel, J., Delaloye, R., Farinott, D., Gruber, S., Gubler, H., Haeberli, W., Hasler, A., Hauck, C., Hiller, M., Hoelzle, M., Lambiel, C., Pellet, C., Springman, S., Vonder Muehll, D., and Phillips, M.: Best practice for measuring permafrost temperature in boreholes based on the experience in the Swiss Alps Front. Earth Sci., 1–20, https://doi.org/10.3389/feart.2021.607875, 2021. a
Nyeki, S., Wacker, S., Aebi, C., Gröbner, J., Martucci, G., and Vuilleumier, L.: Trends in surface radiation and cloud radiative effect at four Swiss sites for the 1996–2015 period, Atmos. Chem. Phys., 19, 13227–13241, https://doi.org/10.5194/acp-19-13227-2019, 2019. a
Ohmura, A.: Objective criteria for rejecting data for bowen ratio flux calculations, J. Appl. Meteorol., 21, 595–598, https://doi.org/10.1007/s00704-012-0687-x, 1982. a
Ohmura, A.: Enhanced temperature variability in high-altitude climate change, Theor. Appl. Climatol., 110, 499–508, 2012. a
Oke, T.: Boundary Layer Climates, Routledge, Nwee York, 2nd edition edn., 1987. a, b
Pellet, C. and Hauck, C.: Monitoring soil moisture from middle to high elevation in Switzerland: set-up and first results from the SOMOMOUNT network, Hydrol. Earth Syst. Sci., 21, 3199–3220, https://doi.org/10.5194/hess-21-3199-2017, 2017. a, b
Pellet, C., Hilbich, C., Marmy, A., and Hauck, C.: Soil moisture data for the validation of permafrost models using direct and indirect measurement approaches at thee alpine sites, Front. Earth Sci., 3, 91, https://doi.org/10.3389/feart.2015.00091, 2016. a, b
Pepin, N., Bradley, R., Diaz, H., Baraer, M., Caceres, E., Forsythe, N., Fowler, H., Greenwood, G., Hashmi, M., Liu, X., Miller, J., Ning, L., Ohmura, A., Palazzi, E., Rangwala, I., Schöner, W., Severskiy, I., Shahgedanova, M., Wang, M., Williamson, S., and Yang, D.: Elevation-dependent warming in mountain regions of the world, Nat. Clim. Change, 5, 424–430, https://doi.org/10.1038/nclimate2563, 2015. a, b, c
Pepin, N., Arnone, E., Gobiet, A., Haslinger, K., Kotlarski, S., Notarnicola, C., Palazzi, E., Seibert, P., Serafin, S., Schöner, W., Terzago, S., Thornton, J., Vuille, M., and Adler, C.: Climate changes and their elevational patterns in the mountains of the world, Rev. Geophys., 60, e2020RG000730, https://doi.org/10.1029/2020RG000730, 2022. a
PERMOS: Permafrost in Switzerland 2014/2015 to 2017/2018, edited by: Noetzli, J., Pellet, C., and Staub, B., Glaciological Report Permafrost No. 16–19 of the Cryospheric Commission of the Swiss Academy of Sciences, 104 pp., https://doi.org/10.13093/permos-rep-2019-16-19, 2019. a, b
Pruessner, L., Phillips, M., Farinott, D., Hoelzle, M., and Lehning, M.: Near-surface ventilation as a key for modelling the thermal regime of coarse blocky rock glaciers, Permafrost Periglac. Process., 29, 152–163, https://doi.org/10.1002/ppp.1978, 2018. a
Riseborough, D., Shiklomanov, N., Etzelmüller, B., Gruber, S., and Marchenko, S.: Recent advances in permafrost modelling, Permafrost Periglac. Process., 19, 137–156, https://doi.org/10.1002/ppp.591, 2008. a
Scherler, M., Hauck, C., Hoelzle, M., and Salzmann, N.: Modeled sensitivity of two alpine permafrost sites to RCM-based climate scenarios, J. Geophys. Res., 118, 780–794, https://doi.org/10.1002/jgrf.20069, 2013. a
Scherler, M., Schneider, S., Hoelzle, M., and Hauck, C.: A two-sided approach to estimate heat transfer processes within the active layer of the Murtèl–Corvatsch rock glacier, Earth Surf. Dynam., 2, 141–154, https://doi.org/10.5194/esurf-2-141-2014, 2014. a, b, c, d
Scherrer, S., Ceppi, P., Croci-Maspoli, M., and Appenzeller, C.: Snow-albedo feedback and Swiss spring temperature trends, Theor. Appl. Climatol., 110, 509–516, https://doi.org/10.1007/s00704-012-0712-0, 2012. a
Sicart, P., Wagnon, P., and Ribstein, P.: Atmospheric controls on the heat balance of Zongo Glacier (16∘ S, Bolivia), J. Geophys. Res., 110, D12106, https://doi.org/10.1029/2004JD005732, 2005. a, b
Smith, S., O'Neill, H., Isaksen, K., Noetzli, J., and Romanovsky, V.: The changing thermal state of permafrost, Nat. Rev. Earth Env., 3, 10–23, https://doi.org/10.1038/s43017-021-00240-1, 2022. a
Sturm, M., Holmgren, J., König, M., and Morris, E.: The thermal conductivity of seasonal snow, J. Glaciol., 43, 26–41, 1997. a
Takeuchi, Y., Kayastha, R., and Nakawo, M.: Characteristics of ablation and heat balance in debris‐free and debris‐covered areas on Khumbu Glacier, Nepal Himalayas, in the pre‐monsoon season, IAHS Publication, 264, 53–61, 2000. a
Walvoord, M. and Kurylyk, B.: Hydrologic impacts of thawing permafrost – A Review, Vadose Zone J., 15, 0–20, https://doi.org/10.2136/vzj2016.01.0010, 2016. a
Wang, Q., Fan, X., and Wang, M.: Evidence of high-elevation amplification versus Arctic amplification, Sci. Rep.-UK, 6, 19219, https://doi.org/10.1038/srep19219, 2016 a
Wani, J. M., Thayyen, R. J., Ojha, C. S. P., and Gruber, S.: The surface energy balance in a cold and arid permafrost environment, Ladakh, Himalayas, India, The Cryosphere, 15, 2273–2293, https://doi.org/10.5194/tc-15-2273-2021, 2021. a
Westermann, S., Lüers, J., Langer, M., Piel, K., and Boike, J.: The annual surface energy budget of a high-arctic permafrost site on Svalbard, Norway, The Cryosphere, 3, 245–263, https://doi.org/10.5194/tc-3-245-2009, 2009. a
Wicky, J. and Hauck, C.: Numerical modelling of convective heat transport by air flow in permafrost talus slopes, The Cryosphere, 11, 1311–1325, https://doi.org/10.5194/tc-11-1311-2017, 2017. a, b
Wicky, J. and Hauck, C.: Air Convection in the Active Layer of Rock Glaciers, Front. Earth Sci., 8, 335, https://doi.org/10.3389/feart.2020.00335, 2020. a
Williams, P. J. and Smith, M. W.: The Frozen Earth. Fundamentals of Geocryology. Studies in Polar Research Series. xvi + 306 pp., Cambridge University Press, Cambridge, New York, Port Chester, Melbourne, Sydney, SBN 0 521 36534 1, 1989. a
WMO: WMO Guidelines on the Calculation of Climate Normals, (2010 update, WMO-No. 1203, ISBN 978-92-63-11203-3, 2017. a
Wu, Q., Shi, B., and Liu, Y.: Application of models for calculating thermal offset and annual mean permafrost-surface temperature (AMPST) in permafrost research on the Qinghai-Tibet Plateau, in: 8th International Conference on Permafrost, Proceedings, edited by: Phillips, M., Springman, S., and Arenson, L., Swets & Zeitlinger, Lisse, Zurich, 2, 1247–1252, 2003. a