the Creative Commons Attribution 4.0 License.
the Creative Commons Attribution 4.0 License.
 | 01 Apr 2022
Resilient dataset of rain clusters with life cycle evolution during April to June 2016–2020 over eastern Asia based on observations from the GPM DPR and Himawari-8 AHI
Aoqi Zhang
Chen Chen
Yilun Chen
Weibiao Li
Shumin Chen
Yunfei Fu
Our knowledge of the properties of precipitation and clouds over their life cycles has progressed with the rapid development of satellite observations. However, previous studies have focused on the life cycle evolution of the macroscale features of precipitation and clouds, whereas the evolution of the microphysical properties of precipitation and clouds over their life cycles is yet to be determined. One of the reasons for this lack of knowledge is the fact that there is no single dataset providing both the three-dimensional structure of precipitation and the relevant life cycle properties. We identified initial rain clusters (RCs) from the Global Precipitation Measurement (GPM) 2ADPR dataset and mesoscale convective systems (MCSs) from the Himawari-8 Advanced Himawari Image (AHI) gridded product. Based on the contours of the initial RCs and MCSs, we then carried out a series of resilient processes, including filtration, segmentation, and consolidation, to obtain the final RCs. The final RCs had a one-to-one correspondence with the relevant MCS. We extracted the RC area, central location, average radar reflectivity profile, average droplet size distribution profile, and other precipitation information from the contours of the final RCs and GPM 2ADPR dataset. The life cycle evolution of the MCS area, location, and cloud-top brightness temperature were retrieved from the corresponding MCSs and their tracks from Himawari-8 observations. The final dataset provides both three-dimensional precipitation information and life cycle information of precipitating clouds during April to June 2016–2020 over eastern Asia. This dataset facilitates studies of the life cycle evolution of precipitation and provides a good foundation for convection parameterizations in precipitation simulations. The dataset used in this paper is freely available at https://doi.org/10.5281/zenodo.6198716 (Zhang et al., 2022).
- Article
(5265 KB) - Full-text XML
- BibTeX
- EndNote


The life cycle of clouds has a vital role in the atmospheric water cycle. The water resources of the Earth are constantly replenished, and a dynamic water balance is achieved through the formation, movement, precipitation, and dissipation processes of clouds (Oki and Kanae, 2006; Li et al., 2020). The scale and density of cloud particles are constantly changing during the life cycle of clouds as a result of the influence of environmental factors, such as the atmospheric temperature, water vapor content, aerosols, and atmospheric movements (Rosenfeld et al., 2008; Y. Chen et al., 2020a). If the scale and density of cloud particles increase to a certain level, then the cloud particles are likely to collide frequently with each other in random motion, forming larger precipitation droplets (Freud and Rosenfeld, 2012; Houze, 2014). Precipitation droplets fall to the ground through complex microphysical processes such as deposition growth, riming growth, rime splintering, aggregation growth, melting, and evaporation (Morrison and Milbrandt, 2015; Aggarwal et al., 2016). The accompanying release or absorption of latent heat is important for regulating regional and global energy budgets (Montagnani et al., 2011; Min et al., 2013; Nelson and L'Ecuyer, 2018). Parameterization schemes for precipitation and its life cycle evolution are still difficult questions in cloud models (Chawla et al., 2018; Freitas et al., 2018; Gentine et al., 2018). Revealing the relationships between three-dimensional precipitation microphysics and cloud life cycle evolution will improve our physical cognition of clouds and precipitation and provide a factual basis for the parameterization of precipitation.
The rapid development of satellite remote sensing in the 21st century has brought new opportunities for studies of the life cycle evolution of clouds and precipitation. Spaceborne active radar systems, such as the Tropical Rainfall Measuring Mission (TRMM) Precipitation Radar (PR) and the Global Precipitation Measurement (GPM) Dual-frequency Precipitation Radar (DPR) provide stereo observations of precipitation structure and microphysics (Miura et al., 2012; Iguchi et al., 2012). The high spatiotemporal resolution of visible and infrared observations from the new generation of geostationary satellites, such as the Himawari-8 and FY-4A satellites, provides a robust guarantee for identifying and tracking mesoscale convective systems (MCSs) or clouds (Vant-Hull et al., 2016; Min et al., 2017; Yang et al., 2017; Wall et al., 2018; Zhuge and Zou, 2018; Wang et al., 2019; Y. Chen et al., 2020a; Zhang et al., 2021). The coordinated application of observations from geostationary satellites and spaceborne active radar systems provides the conditions necessary to reveal the life cycle evolution of clouds and precipitation.
Based on coordinated applications, scientists have carried out many studies on the life cycle evolution of precipitating clouds. Fiolleau and Roca (2013b) combined TRMM PR and geostationary satellite data and showed that the precipitation intensity was strongest at about one-third of the cloud life cycle, whereas the proportion of convective pixels gradually decreased with the development of the clouds. Based on geostationary satellite observations and precipitation data from the Climate Prediction Center morphing technique (CMORPH), Ai et al. (2016) found that the lowest cloud-top temperature does not correspond to the heaviest precipitation during the life cycle of an MCS. The MCS tends to produce the heaviest precipitation first and then the minimum brightness temperature. By combining geostationary satellite observations and ground-based radar data, D. Chen et al. (2020) showed that the development and dissipation stage of MCSs is significantly longer than the mature stage and that the proportion of anvils in the cloud gradually increases during the life cycle, whereas the proportion of convex cores gradually decreases. Using Integrated Multi-satellitE Retrievals for GPM (IMERG) and geostationary satellite observations, Li et al. (2021) revealed the semi-diurnal cycle of deep convective systems over eastern China.
These studies have improved our understanding of the life cycle evolution of macroscale features of precipitating clouds. However, there is still a lack of statistical studies of the life cycle evolution of precipitation microphysics processes. Our previous study combined the droplet size distribution (DSD) from the GPM DPR and from the Himawari-8 geostationary satellite dataset for April–August 2016 and constructed a microphysical conceptual model of precipitating clouds at different life stages over eastern China (Zhang and Fu, 2018). Kumar et al. (2020) showed the vertical structure of the precipitating system at different cloud life stages in the mountains of the Andes. Research is limited by the large amount of satellite data and complex processing algorithms.
To facilitate precipitation studies, scientists have developed multiple datasets based on the orbital precipitation product TRMM PR 2A25 and the subsequent GPM 2ADPR. Liu et al. (2008) constructed an event-based precipitating system dataset by grouping the contiguous precipitating area detected by the TRMM PR; the dataset was later extended to the GPM 2ADPR (Liu and Zipser, 2015). This dataset has received widespread attention (Houze et al., 2015; Aggarwal et al., 2016; Nishant et al., 2019; Schumacher and Rasmussen, 2020) because it can effectively reduce the complexity of event-based precipitation research. More efforts have been made to merge datasets from different instruments on board the TRMM, including PR 2A25, the Visible Infrared Radiometer Scanner (VIRS) 1B01, the TRMM Microwave Image (TMI) 1B11 and environmental information (Wilheit et al., 2009; Fu et al., 2013; Chen and Fu, 2017; Sun and Fu, 2021).
However, there is still no single spaceborne dataset that can provide both event-based precipitation information and its corresponding life cycle evolution. The initial rain clusters (RCs) identified from precipitation radar and the MCSs from geostationary observations do not have a one-to-one correspondence, so we need to carry out a series of resilient reprocessing algorithms to aggregate redundant information (Yang, 2019). Based on observations from Himawari-8 and GPM DPR, the derived dataset covers eastern Asia from April to June 2016–2020. In the future work, the spatiotemporal coverage of the dataset will be further expanded to the full disk of Himawari-8 for all months from 2016.
The paper consists of four parts. Section 2 describes the basic information in the dataset. Section 3 demonstrates the processing algorithms, including the resilient reprocessing algorithms (Sect. 3.1 and 3.2) and the MCS tracking algorithm (Sect. 3.3). Section 4 summarizes our dataset.
2.1 GPM 2ADPR dataset
The GPM core observatory carrying the DPR and the GPM Microwave Imager was launched on 28 February 2014. The GPM DPR is the first spaceborne dual-frequency precipitation radar and covers the globe from 65∘ S to 65∘ N. The GPM DPR consists of a Ku-band (13.6 GHz) and a Ka-band (35.5 GHz) precipitation radar and operates on three different scan modes, including the Ku-band Normal Scan (NS), the Ka-band Matched Scan (MS) and the Ka-band High-sensitivity Scan (HS). The HS mode (24 beams) was changed on 21 May 2018 to match the outer swath of the NS mode, whereas the MS mode (25 beams) is matched with the inner swath of the NS mode (Iguchi et al., 2010). The difference between the matched beams is now about 30 m at nadir, whereas it was 300 m before 21 May 2018. The relevant minimum detectable reflectivity values for the NS, MS, and HS modes are 14.5, 16.7, and 10.2 dBZ, respectively (Hamada and Takayabu, 2016). Based on the three scan modes, the official GPM orbital dataset provides three single-frequency products and a dual-frequency product (2ADPR). We used the 2ADPR product, which provides the rain type, storm-top height, corrected reflectivity profile, DSD profile, rain rate profile, and other information at a horizontal resolution of 5 km and a vertical interval of 125 m.
2.2 Himawari-8 gridded product
The Himawari-8 satellite, equipped with the Advanced Himawari Image (AHI), was launched in 2016. The AHI operates at 16 visible and infrared wave bands from 0.46 to 13.3 µm. The spatial resolution of the Himawari-8 full-disk data varies with the wave band and includes 0.5, 1 and 2 km (Bessho et al., 2016). By performing a preliminary investigation of the infrared channel measurements from the AHI, Da (2015) showed that the sums of the observational and model error variance are about 1.5 K for the 6.2–7.3 µm channels and about 1 K for other infrared channels. We used the Himawari-8 full-disk product on 0.05∘ × 0.05∘ grids (http://ftp.ptree.jaxa.jp, last access: 22 February 2022) for consistency with the data resolution of the GPM 2ADPR. We used the 10.4 µm brightness temperature at a temporal interval of 1 h.
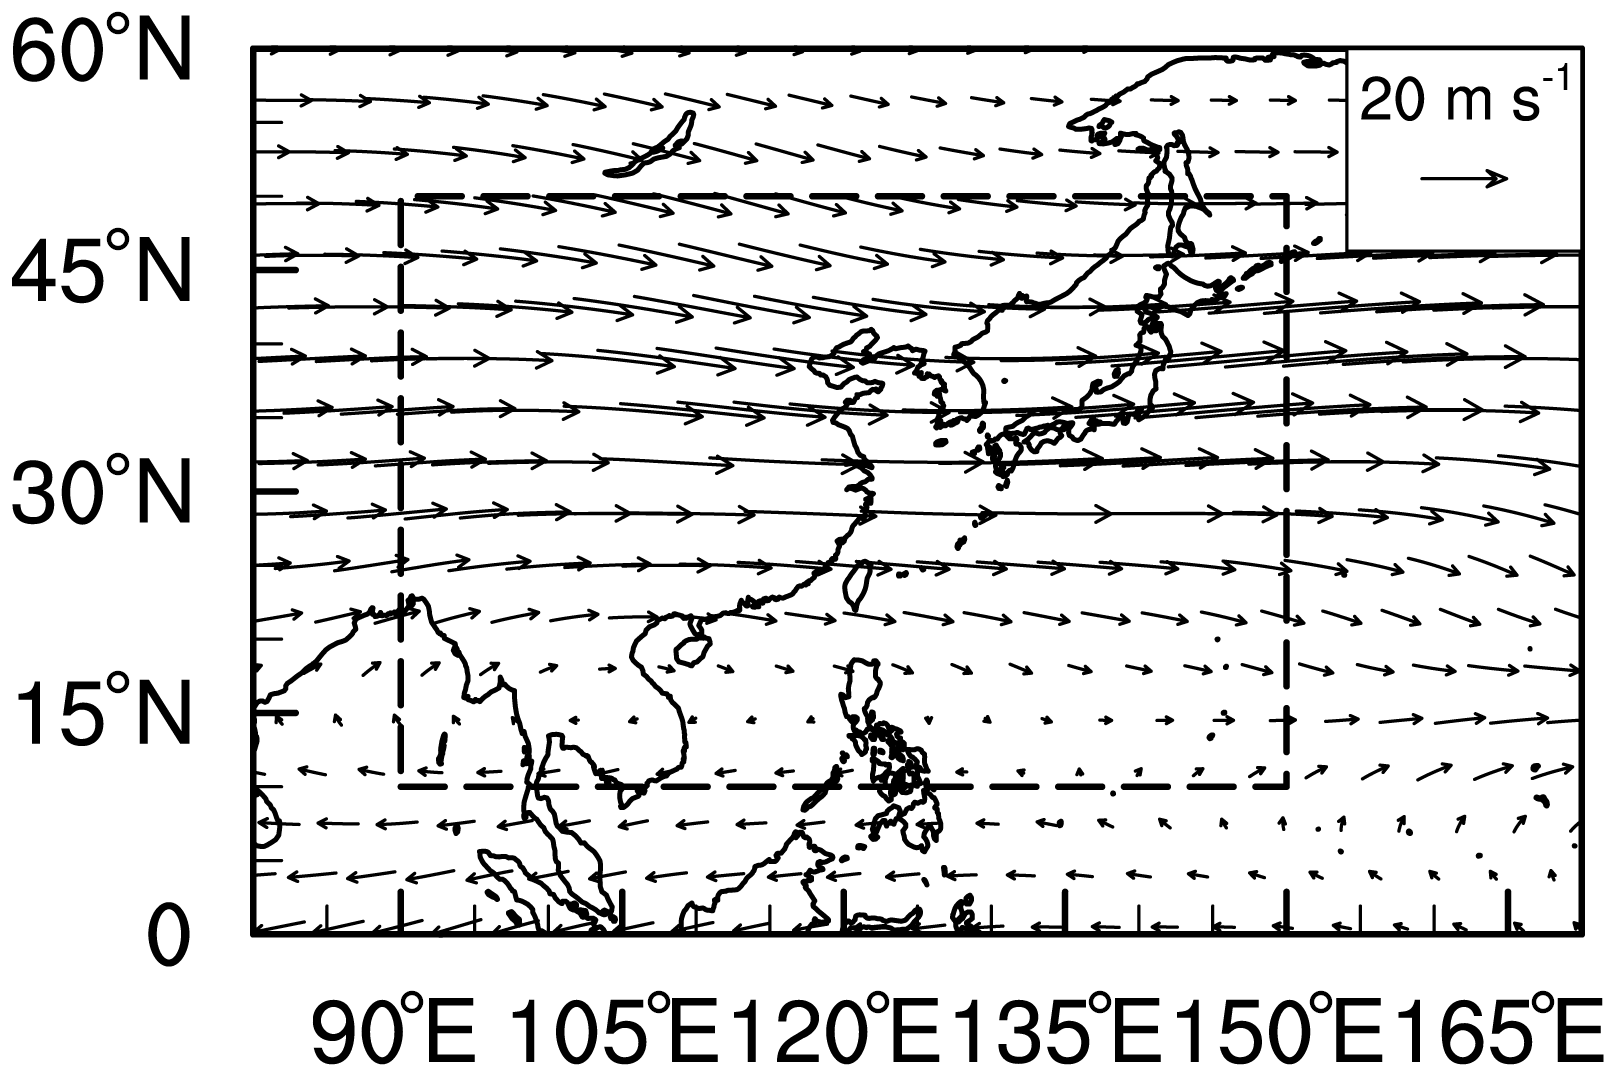
Figure 1Horizontal coverage of our dataset overlapped with average 500 hPa winds, derived from ERA5 for April to June 2016–2020. The black rectangle represents the coverage of the RC centers.
2.3 Basic information in the resilient dataset
The derived resilient dataset of RCs with life cycle evolution covers eastern Asia from April to June 2016–2020 (Fig. 1). The center of the initial RC derived from the 2ADPR product is restricted to the spatial range 90–150∘ E, 10–50∘ N. We tracked the corresponding MCS over a wider spatial range (80–170∘ E, 0–60∘ N) because the RCs are in the region of subpolar westerlies with strong high-level westerly winds (Fig. 1). The wind field was derived from ERA5, the latest reanalysis data provided by the European Centre for Medium-Range Weather Forecasts (Hersbach et al., 2020).
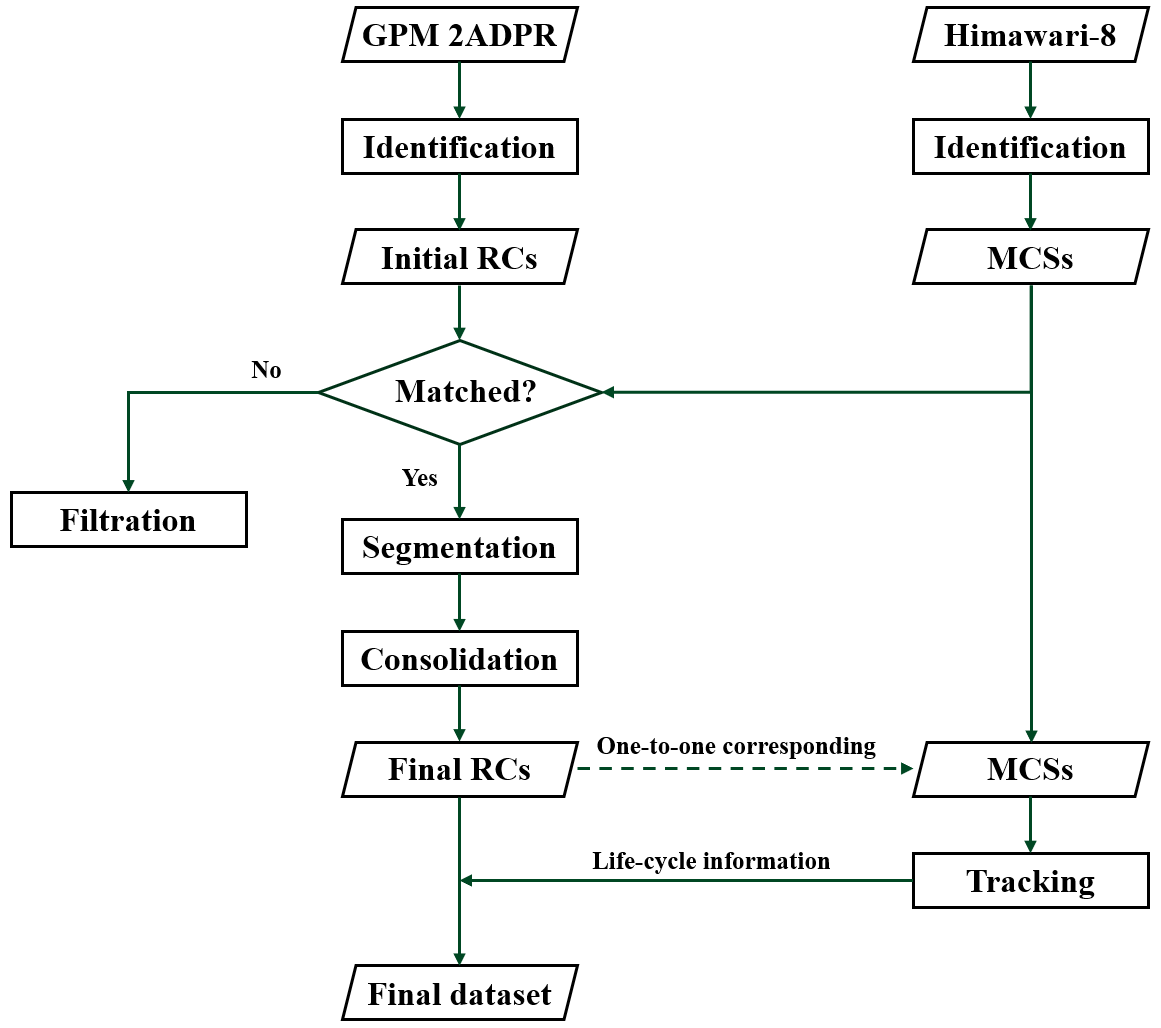
Figure 2 shows the processing flowchart for the resilient dataset. Following the RC identification method in Fu et al. (2020), we identified continuous precipitation pixels (>0 mm h−1) in the GPM 2ADPR orbital data as initial RC. All the initial RCs were temporarily retained, regardless of the area of the RC and whether the RC was affected by truncation of the DPR swath. This RC identification method has been widely used in event-based precipitation and cloud research (Feral et al., 2000; Nesbitt et al., 2006; Chen et al., 2017; Zhang et al., 2018). Using a similar method and a brightness temperature threshold of <235 K (following Mapes and Houze, 1993), we also identified MCSs from the Himawari-8 AHI 10.4 µm brightness temperature data.
The contours of the initial RCs were very different from those of the MCSs as a result of the randomness of precipitation, the mismatch between cold cloud top and near-surface precipitation, the temporal difference between the two datasets, the truncation of the DPR swath, and many other factors. We therefore applied a series of resilient reprocessing algorithms to give a better correspondence between the RCs and the MCSs.
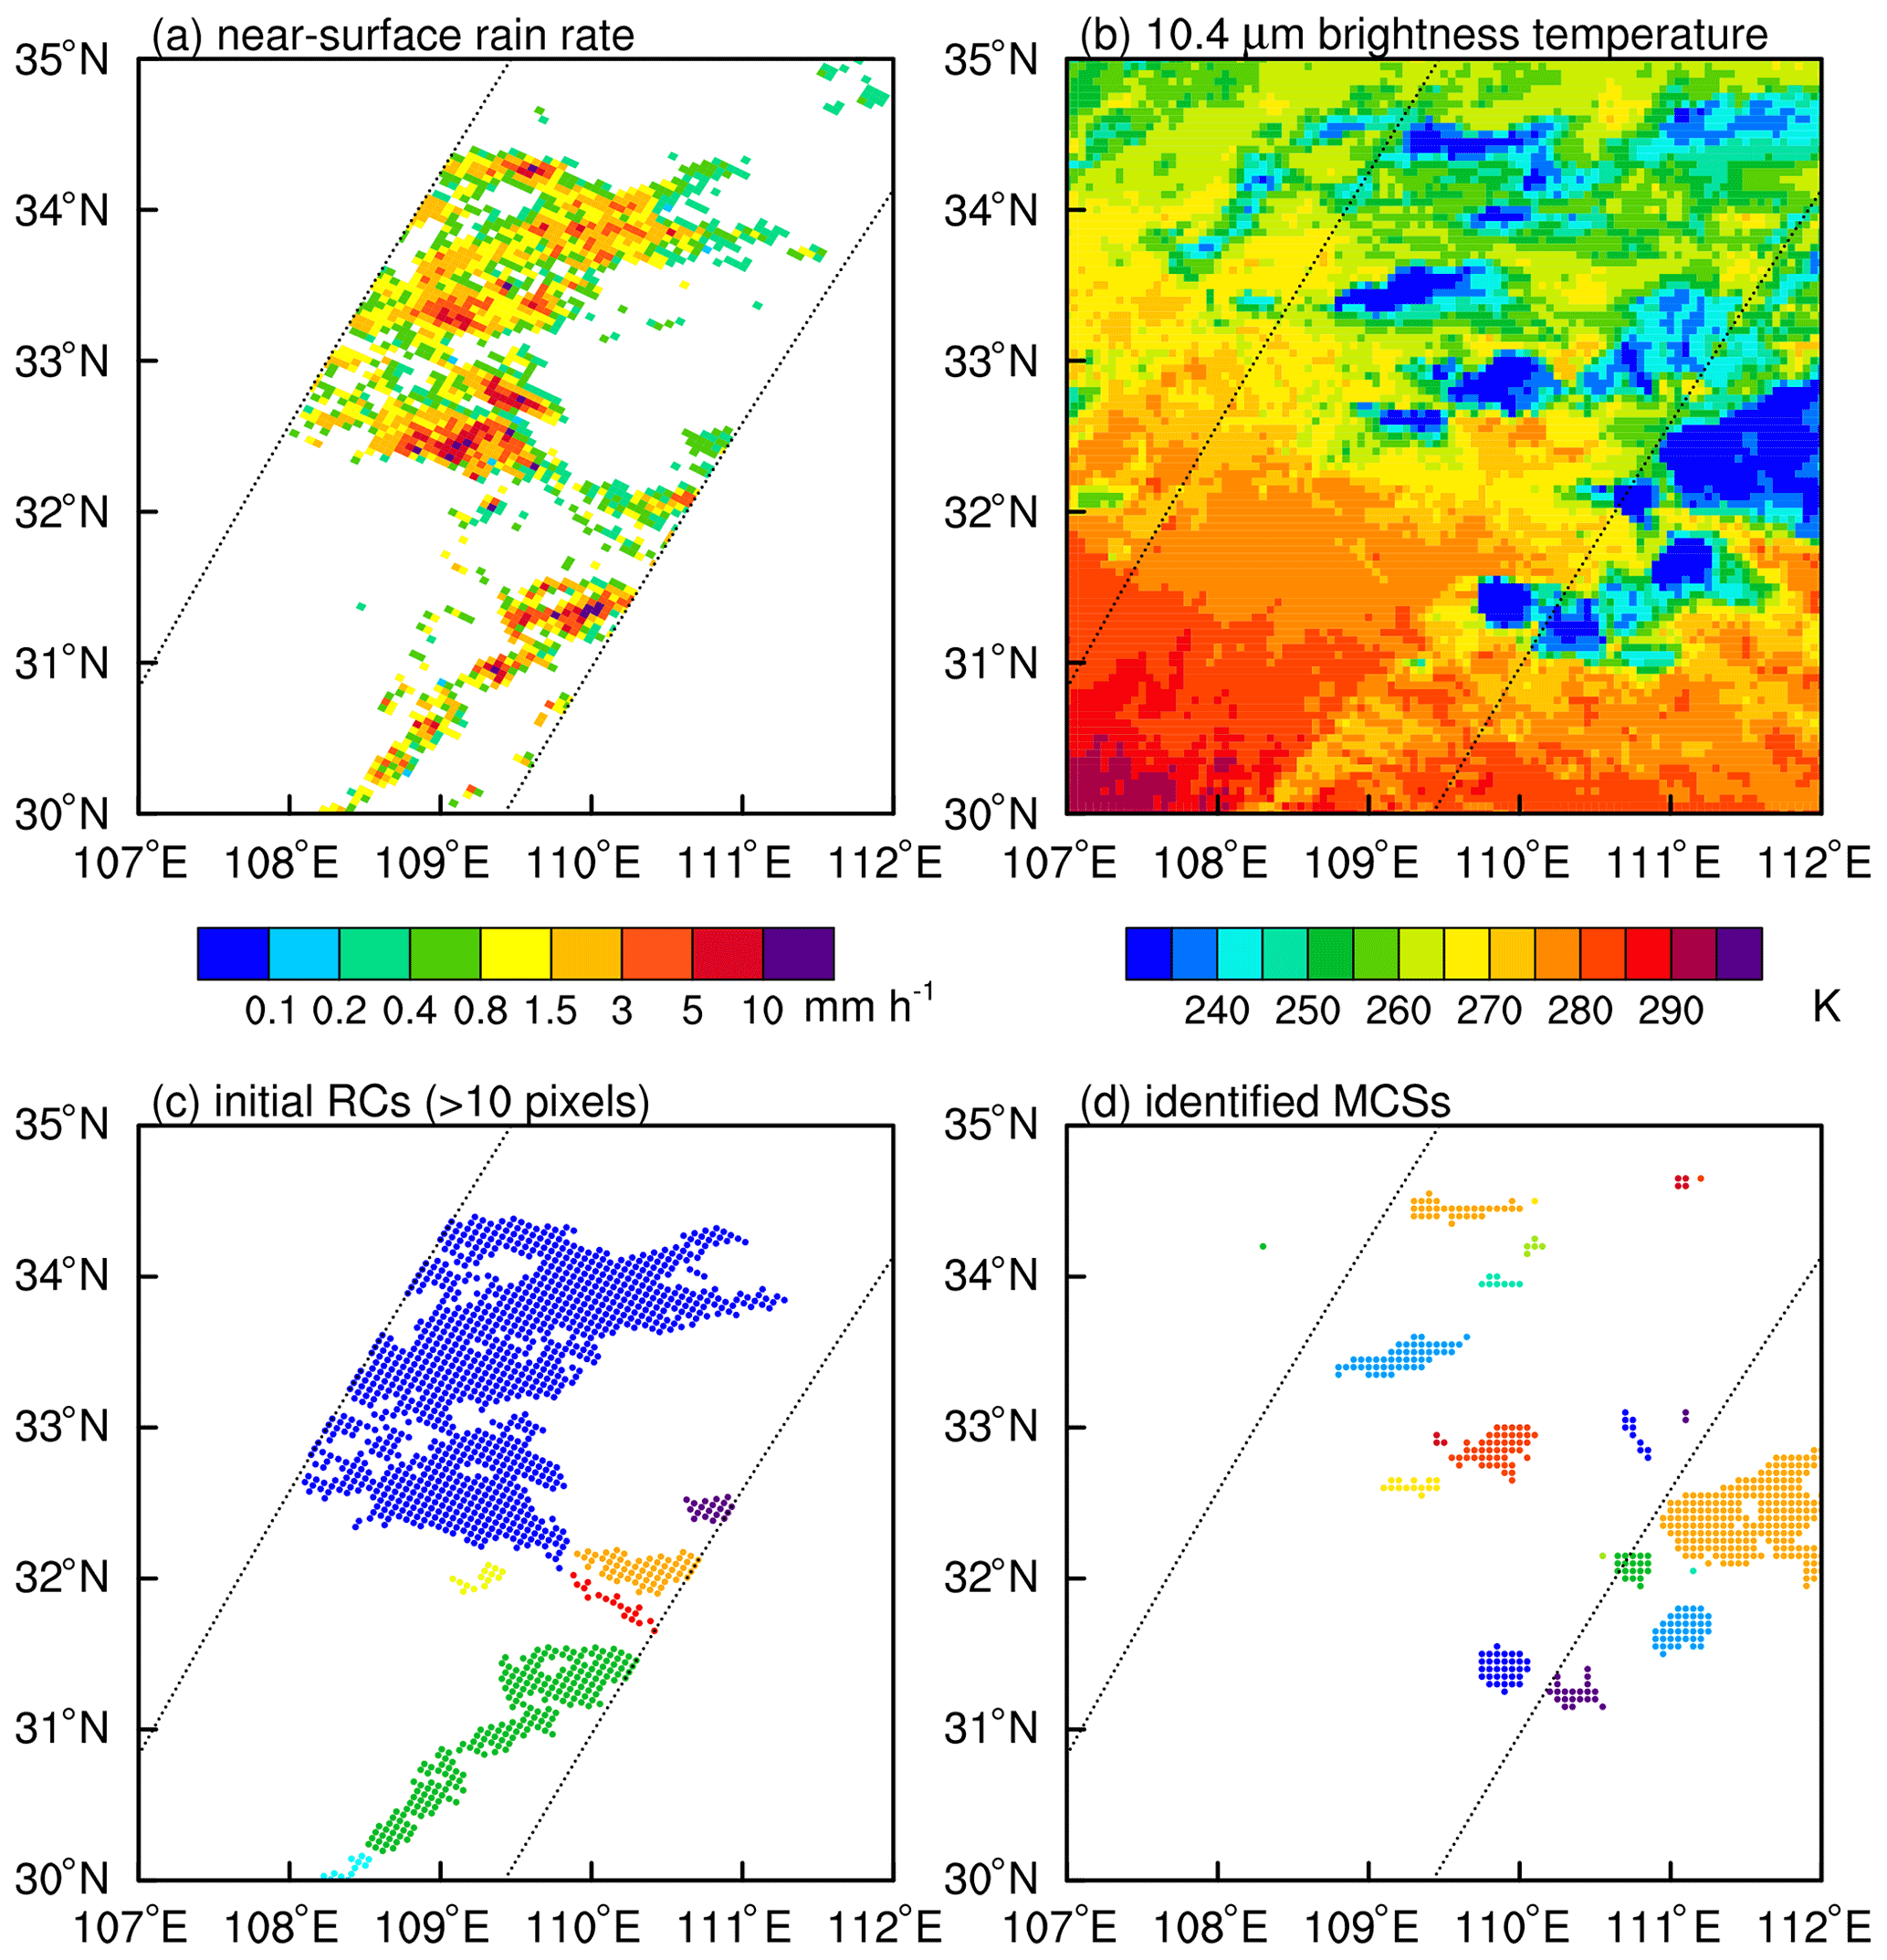
Figure 3Horizontal distributions of the (a) near-surface rain rate, (b) 10.4 µm brightness temperature, (c) initial RCs, and (d) identified MCSs for the precipitation event occurring at 10:08 UTC on 1 June 2016. The adjacent dots of different colors in panels (c) and (d) indicate different RCs or MCSs.
We compared the remapped contours of the initial RCs and the contours of MCSs to determine the mapping relationships between them. Specifically, we remapped the DPR pixels of initial RCs to 0.05∘ × 0.05∘ grids (consistent with the MCSs) and determined the overlapping grids between the initial RCs and the MCSs at the nearest time (±30 min). If there was no overlapping grid between one initial RC and any MCS, then the initial RC was matched to the nearest MCS within 100 km from the nearest pixel of the RC contour. If there was no MCS within 100 km of the initial RC, then the initial RC was filtered out. These filtered RCs contain isolated warm rain over the ocean, with a low rain top and usually weak near-surface precipitation (Lau and Wu, 2011; Chen and Fu, 2017).
After filtration, the remaining RC corresponded to at least one MCS. We carried out other resilient processes, including segmentation and consolidation, on individual clusters to derive the final RCs that corresponded to the relevant MCSs. The specific processes of segmentation and consolidation are described in the following section. We tracked the corresponding MCSs forward and backward to derive the life cycle evolution of the precipitating cloud. The tracking algorithm is also described in the following section.
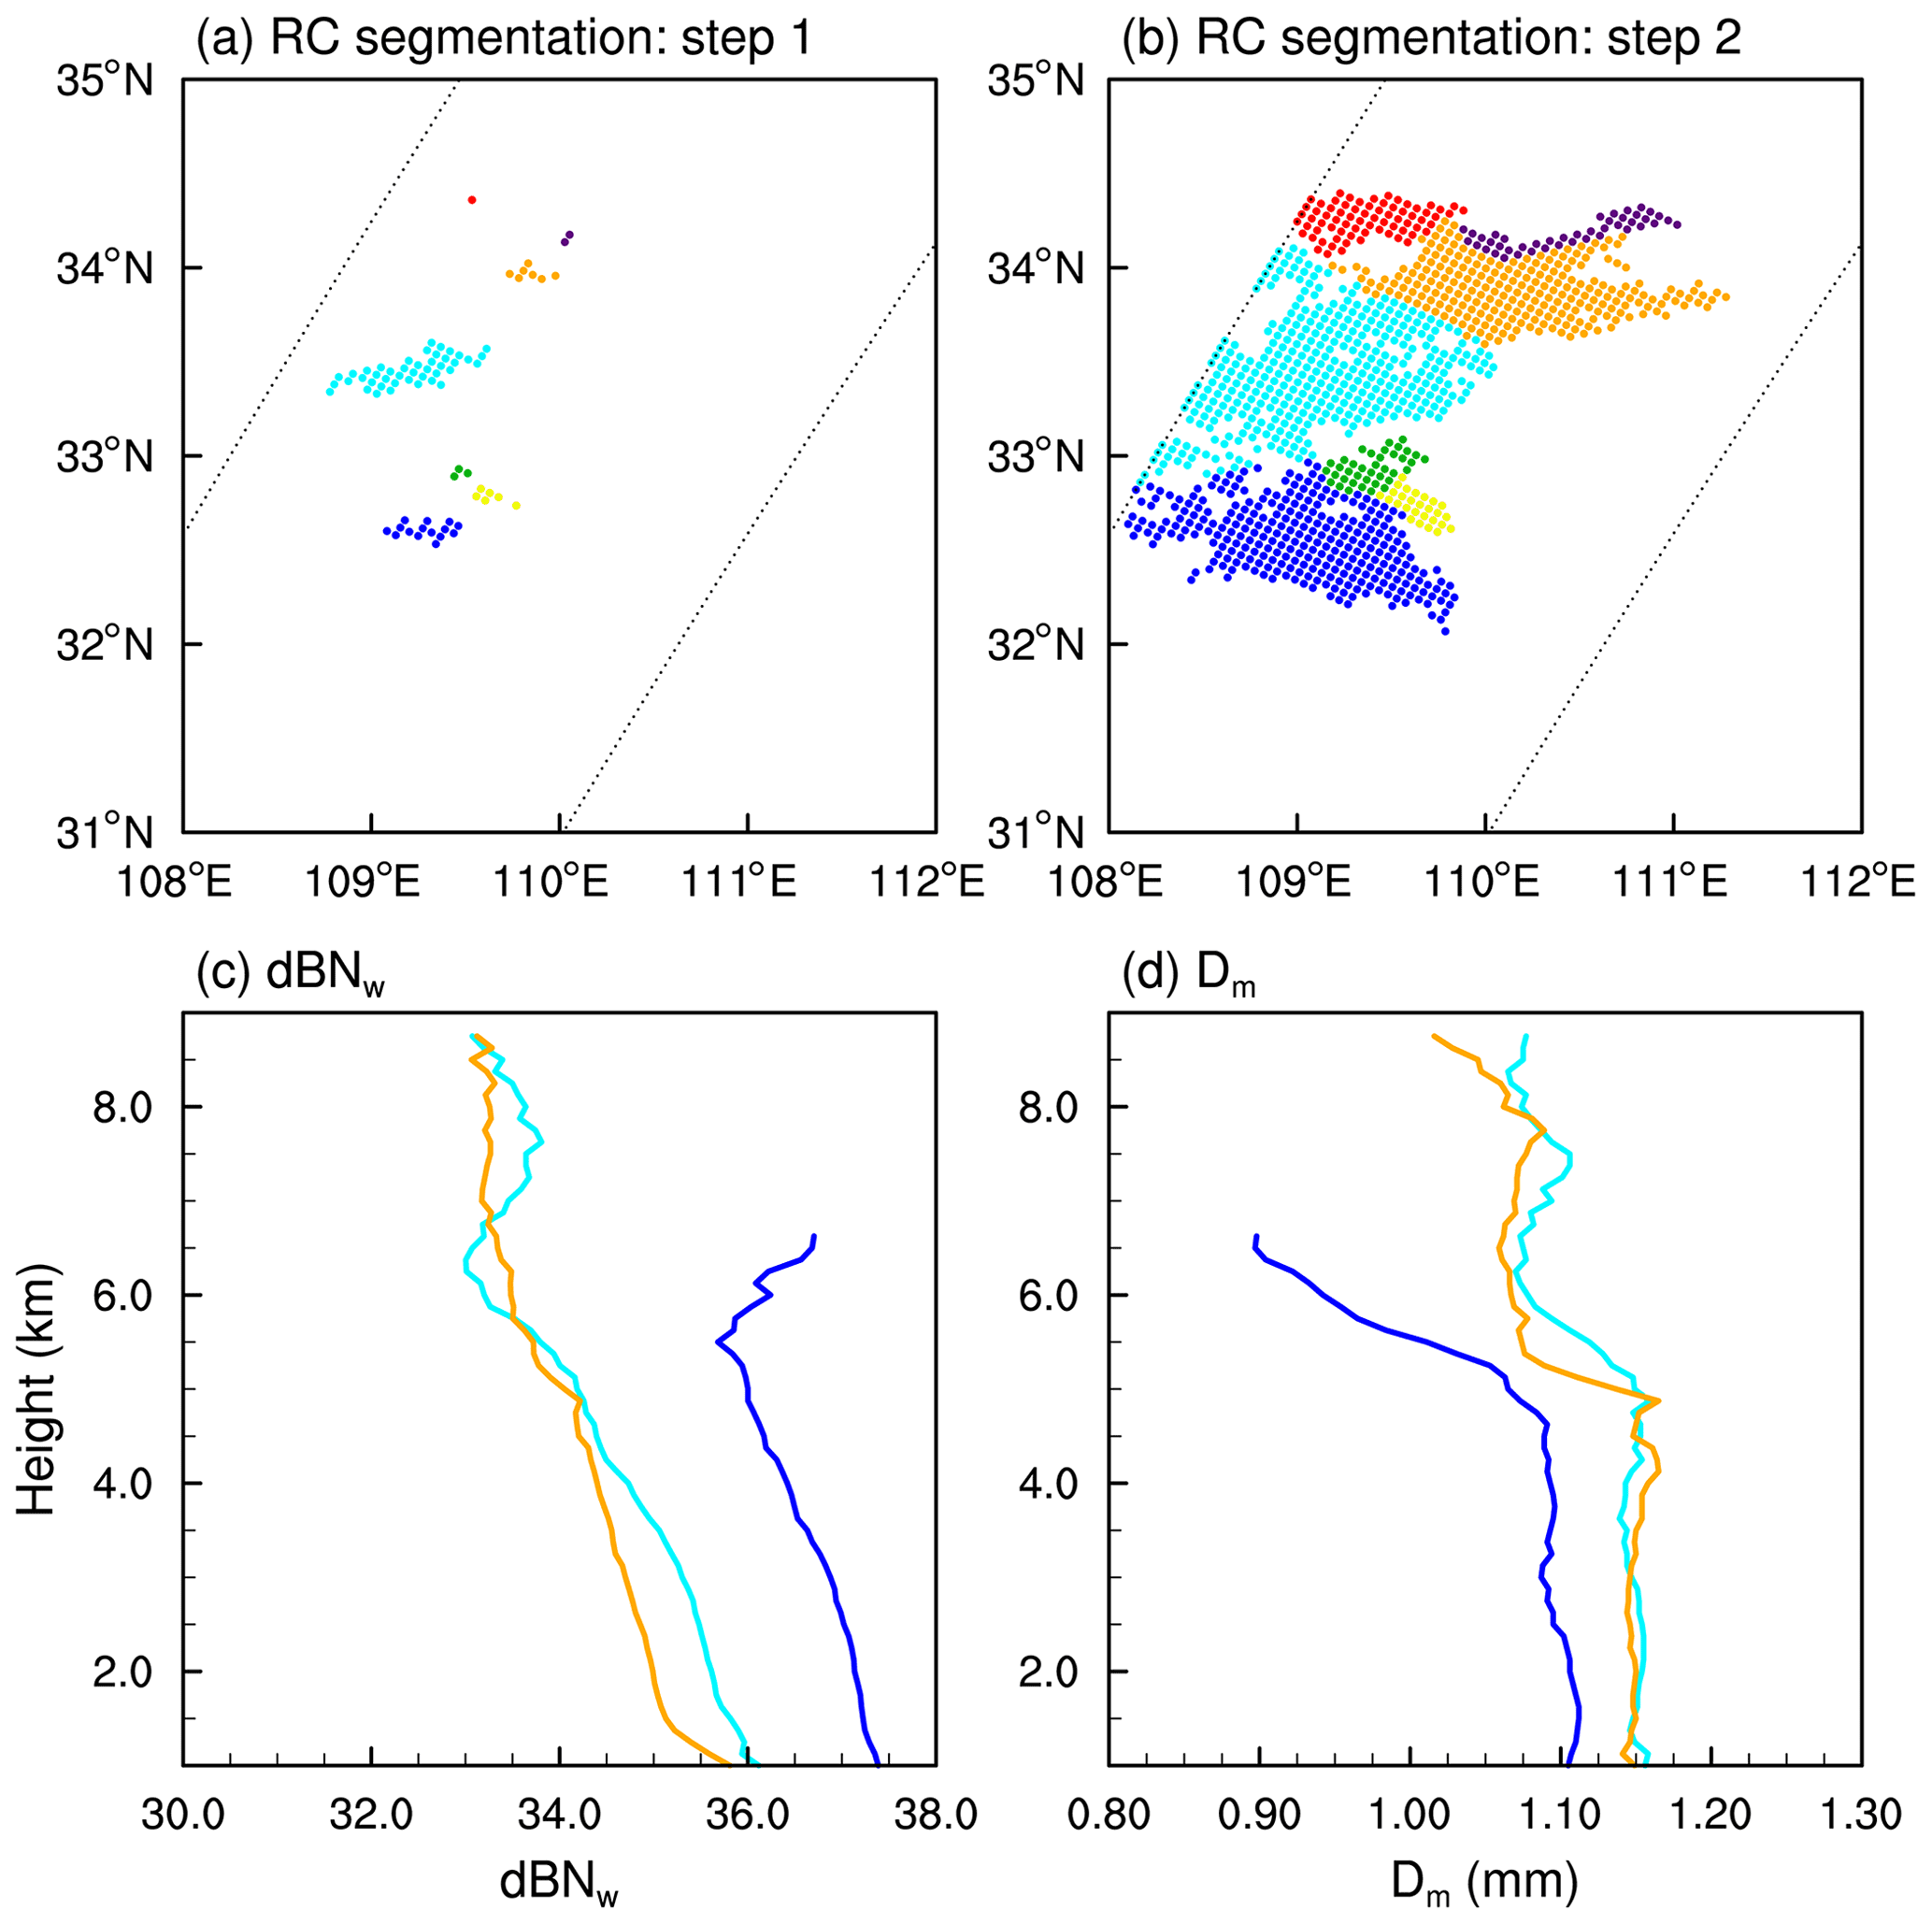
Figure 4(a, b) Demonstrations of RC pixels after two steps of RC segmentation algorithms and (c, d) the average DSD profiles of the divided RCs, which occurred at 10:08 UTC on 1 June 2016. The colors of the DSD profiles corresponding to the colors of the RCs are shown in panel (b).
3.1 Resilient segmentation of RCs
If one of the remaining RC corresponded to multiple MCSs, then it was resiliently segmented according to the contours of the MCSs. Figure 3 shows a precipitation event captured by the GPM DPR, which occurred at 10:08 UTC on 1 June 2016 over eastern China. The near-surface rain rate was mainly distributed in the interval 0.5–5 mm h−1 (Fig. 3a). The region of low-brightness temperature was scattered over several small areas (Fig. 3b). The horizontal distribution of the initial RCs showed that the precipitation pixels within 32–35∘ N belonged to the same initial RC with an area of about 28 000 km2 (Fig. 3c). This large initial RC had irregular boundaries and overlapped with seven different small MCSs, with areas ranging from 75 to 1225 km2 (Fig. 3c and d).
The segmentation algorithm consists of two main steps. In the previous algorithms, we gridded the DPR pixels to 0.05∘ × 0.05∘ grids to obtain the overlapping grids between the initial RCs and the MCSs. The first step was to remap the overlapping grids to the DPR pixels using just the reverse method; the areas overlapping with different MCSs were marked as different RC cores. Figure 4a shows the RC cores after the first step of the segmentation algorithm. Seven different RC cores are marked with different colors.
The second step was to use the image corrosion method (Gonzalez and Thomason, 1978) to gradually allocate the other DPR pixels within the initial RC to the RC cores. Specifically, we iteratively increase the RC cores by adding pixels around the area until all the other DPR pixels were allocated. If, at a certain round of the collision process, one certain pixel was allocated to multiple RC cores, its nearest 8 DPR pixels, including non-precipitation pixels, must contain allocated precipitation pixels from different RC cores. We would then calculate the rain rate gradients between the certain pixel and allocated precipitation pixels using rain rate difference divided by distance, and the certain pixel would be reallocated the RC core with minimum rain rate gradient. Figure 4b shows that the initial RC was segmented into seven new RCs. The largest three new RCs had areas of 7325 km2 (blue), 9850 km2 (cyan), and 6225 km2 (orange).
Figure 4c and d show the average DSD profiles of the three largest RCs. In general, all the average profiles of the droplet density (dBNw) and the effective diameter (Dm) of the three RCs show a clear turning point at 5.5 km height (around the freezing level). This is because the lower layer of this precipitation event was very humid (not shown), and the precipitation microphysics within this event was dominated by the “warm rain” process. However, the average near-surface dBNw of the southerly blue RC reached 37.4, which is significantly higher than the other two (36 and 35.7); the average near-surface Dm of this southerly blue RC was about 1.1 mm, which was significantly smaller than the other two (about 1.15 mm). This suggests that there are significant differences in the precipitation microphysics inside these three RCs, so resilient segmentation of the RC is required.
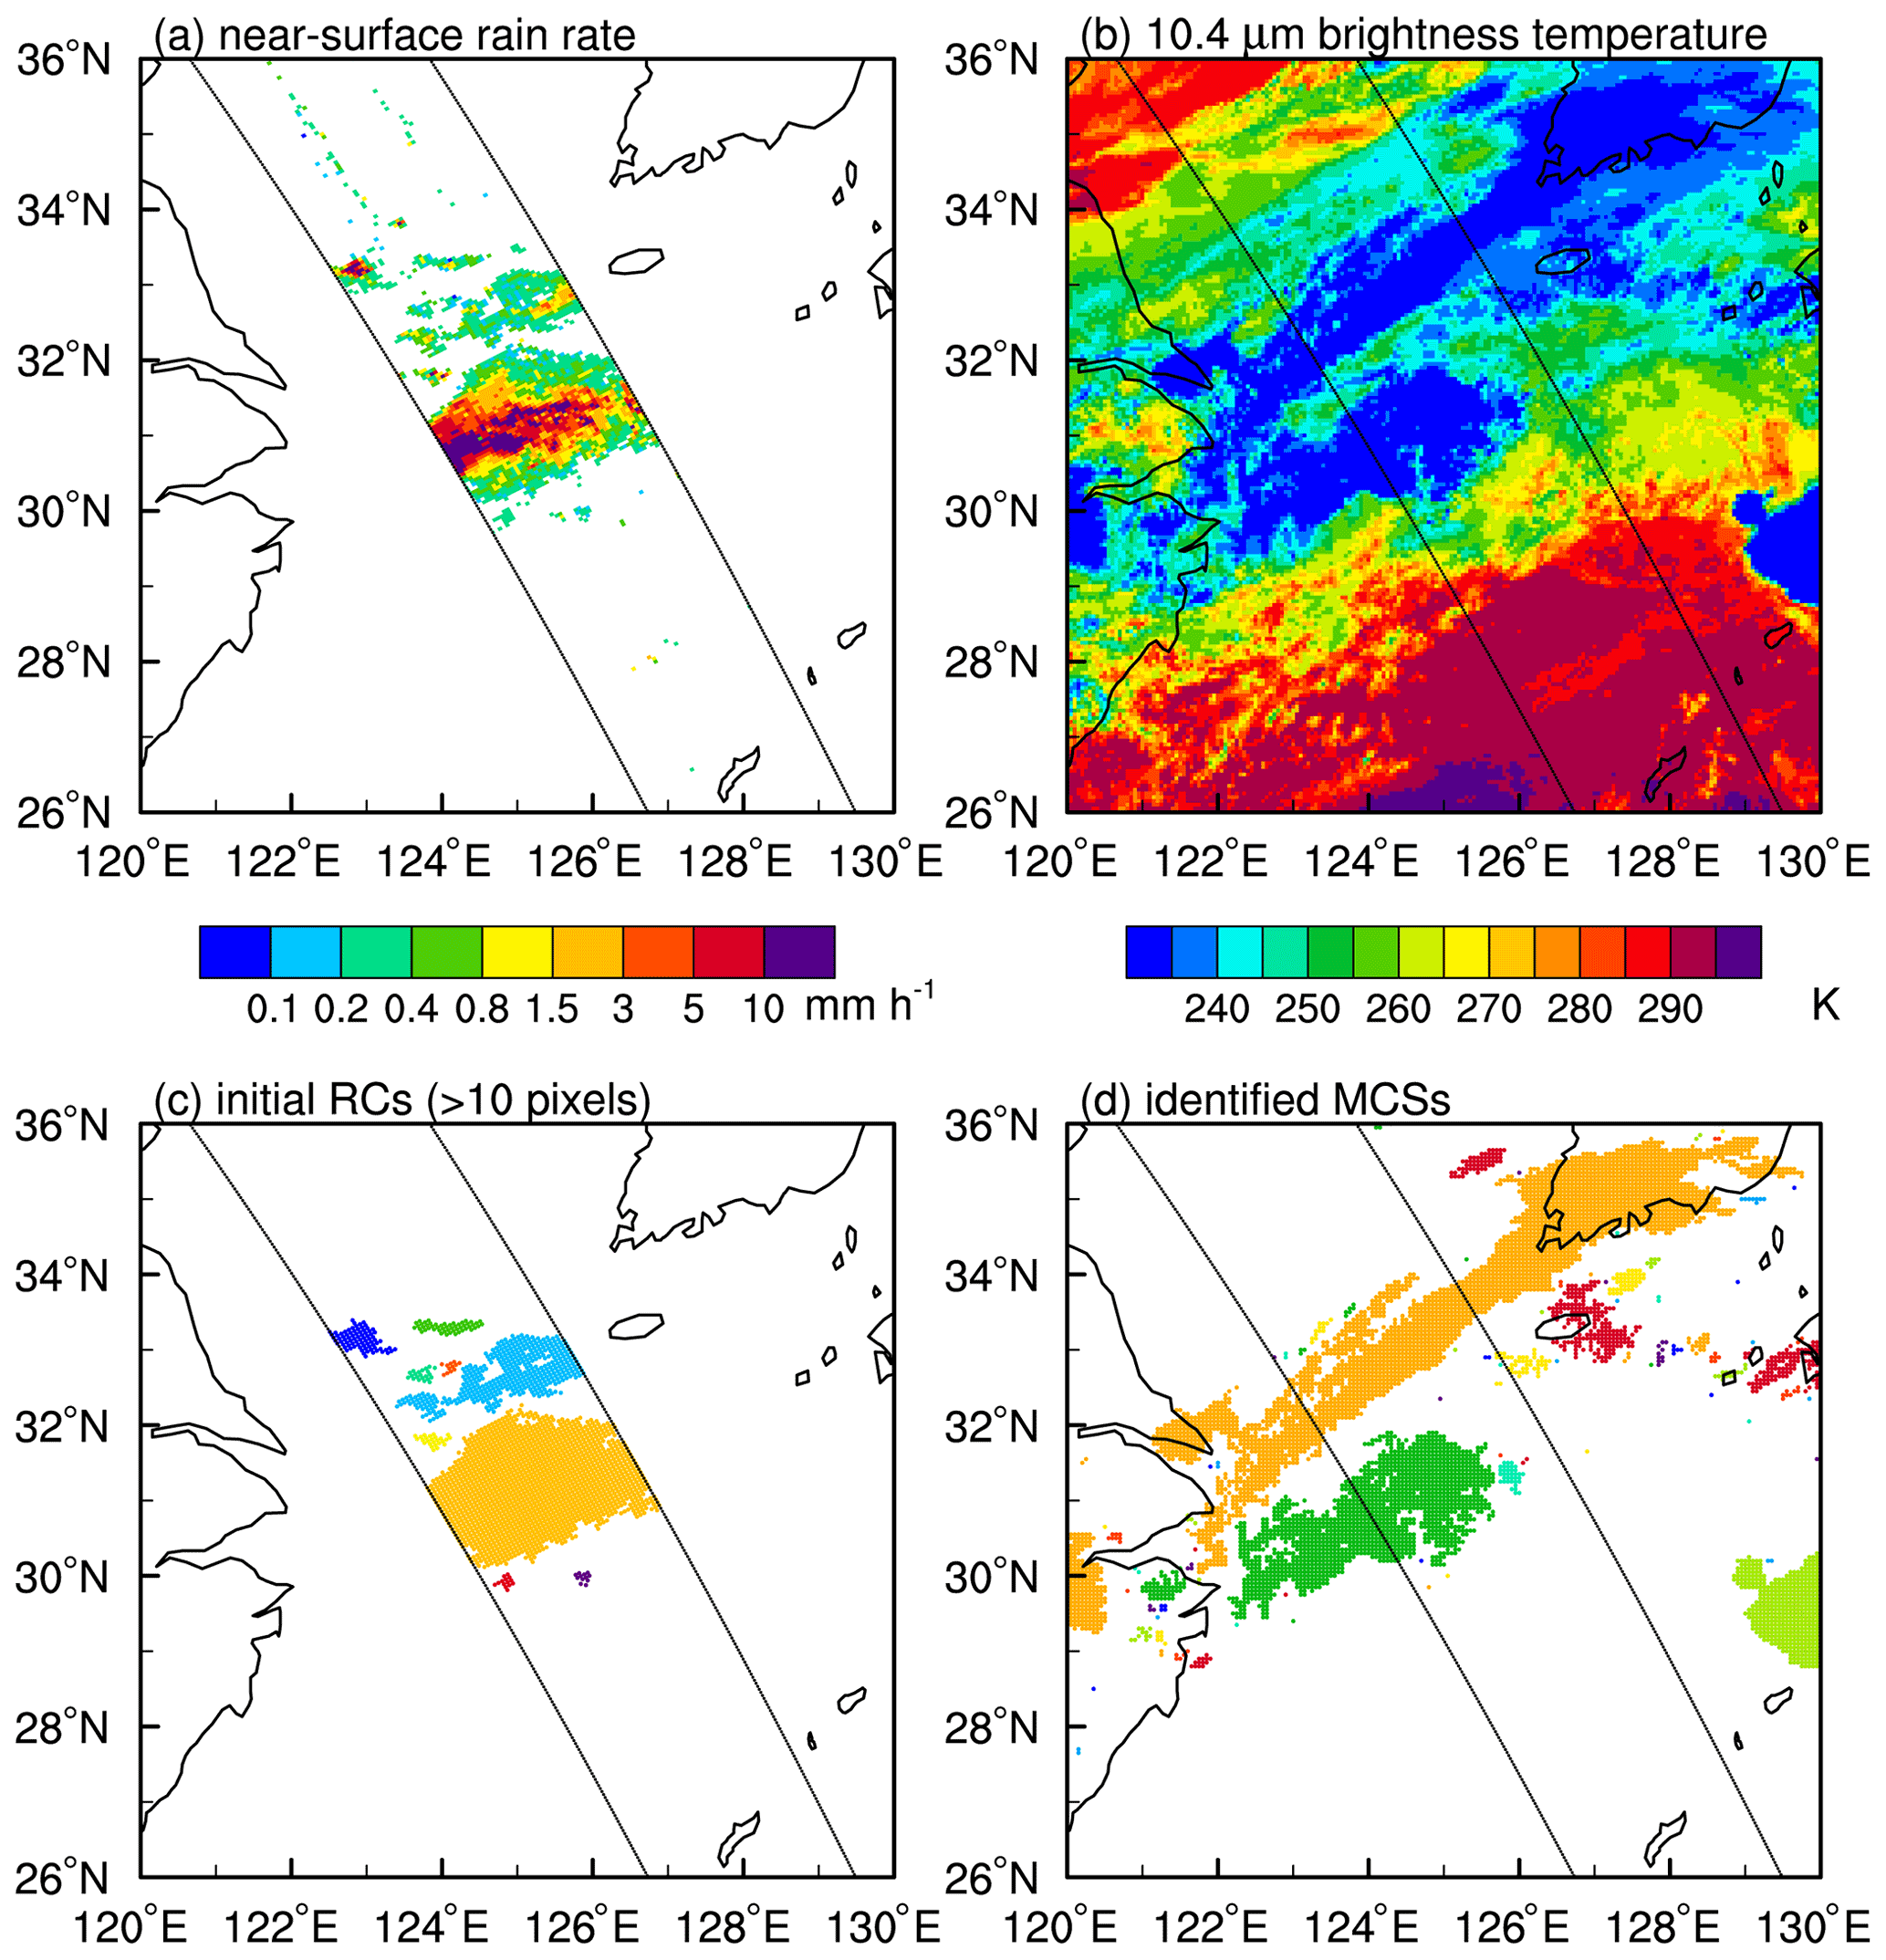
Figure 5Horizontal distributions of the (a) near-surface rain rate, (b) 10.4 µm brightness temperature, (c) initial RCs, and (d) identified MCSs for the precipitation event occurring at 23:09 UTC on 2 June 2020. The adjacent dots of different colors in panels (c) and (d) indicate different RCs or MCSs.
3.2 Resilient consolidation of RCs
After the segmentation process, each RC had only one corresponding MCS. However, there may still be multiple RCs corresponding to one MCS. For consistency, we wanted to consolidate these multiple RCs into one single RC.
Figure 5 shows a precipitation event captured by the GPM DPR that occurred at 23:09 UTC on 2 June 2020 over the East China Sea during the Meiyu period. The horizontal distribution of the 10.4 µm brightness temperature shows that the Meiyu clouds extended northeasterly from Shanghai to South Korea (Fig. 5b). The corresponding MCS of this event consisted of two parts: a southerly near-circular MCS and a northerly elongated MCS (Fig. 5d). The southerly near-circular MCS mainly corresponded to a large RC with smooth boundaries and intense precipitation (Fig. 5a and c). The central near-surface rain rate within the large RC exceeded 10 mm h−1. The northerly elongated MCS corresponded to multiple small initial RCs with irregular boundaries and weak precipitation (Fig. 5a and c). The near-surface rain rate of the RCs was mostly weaker than 1.5 mm h−1.
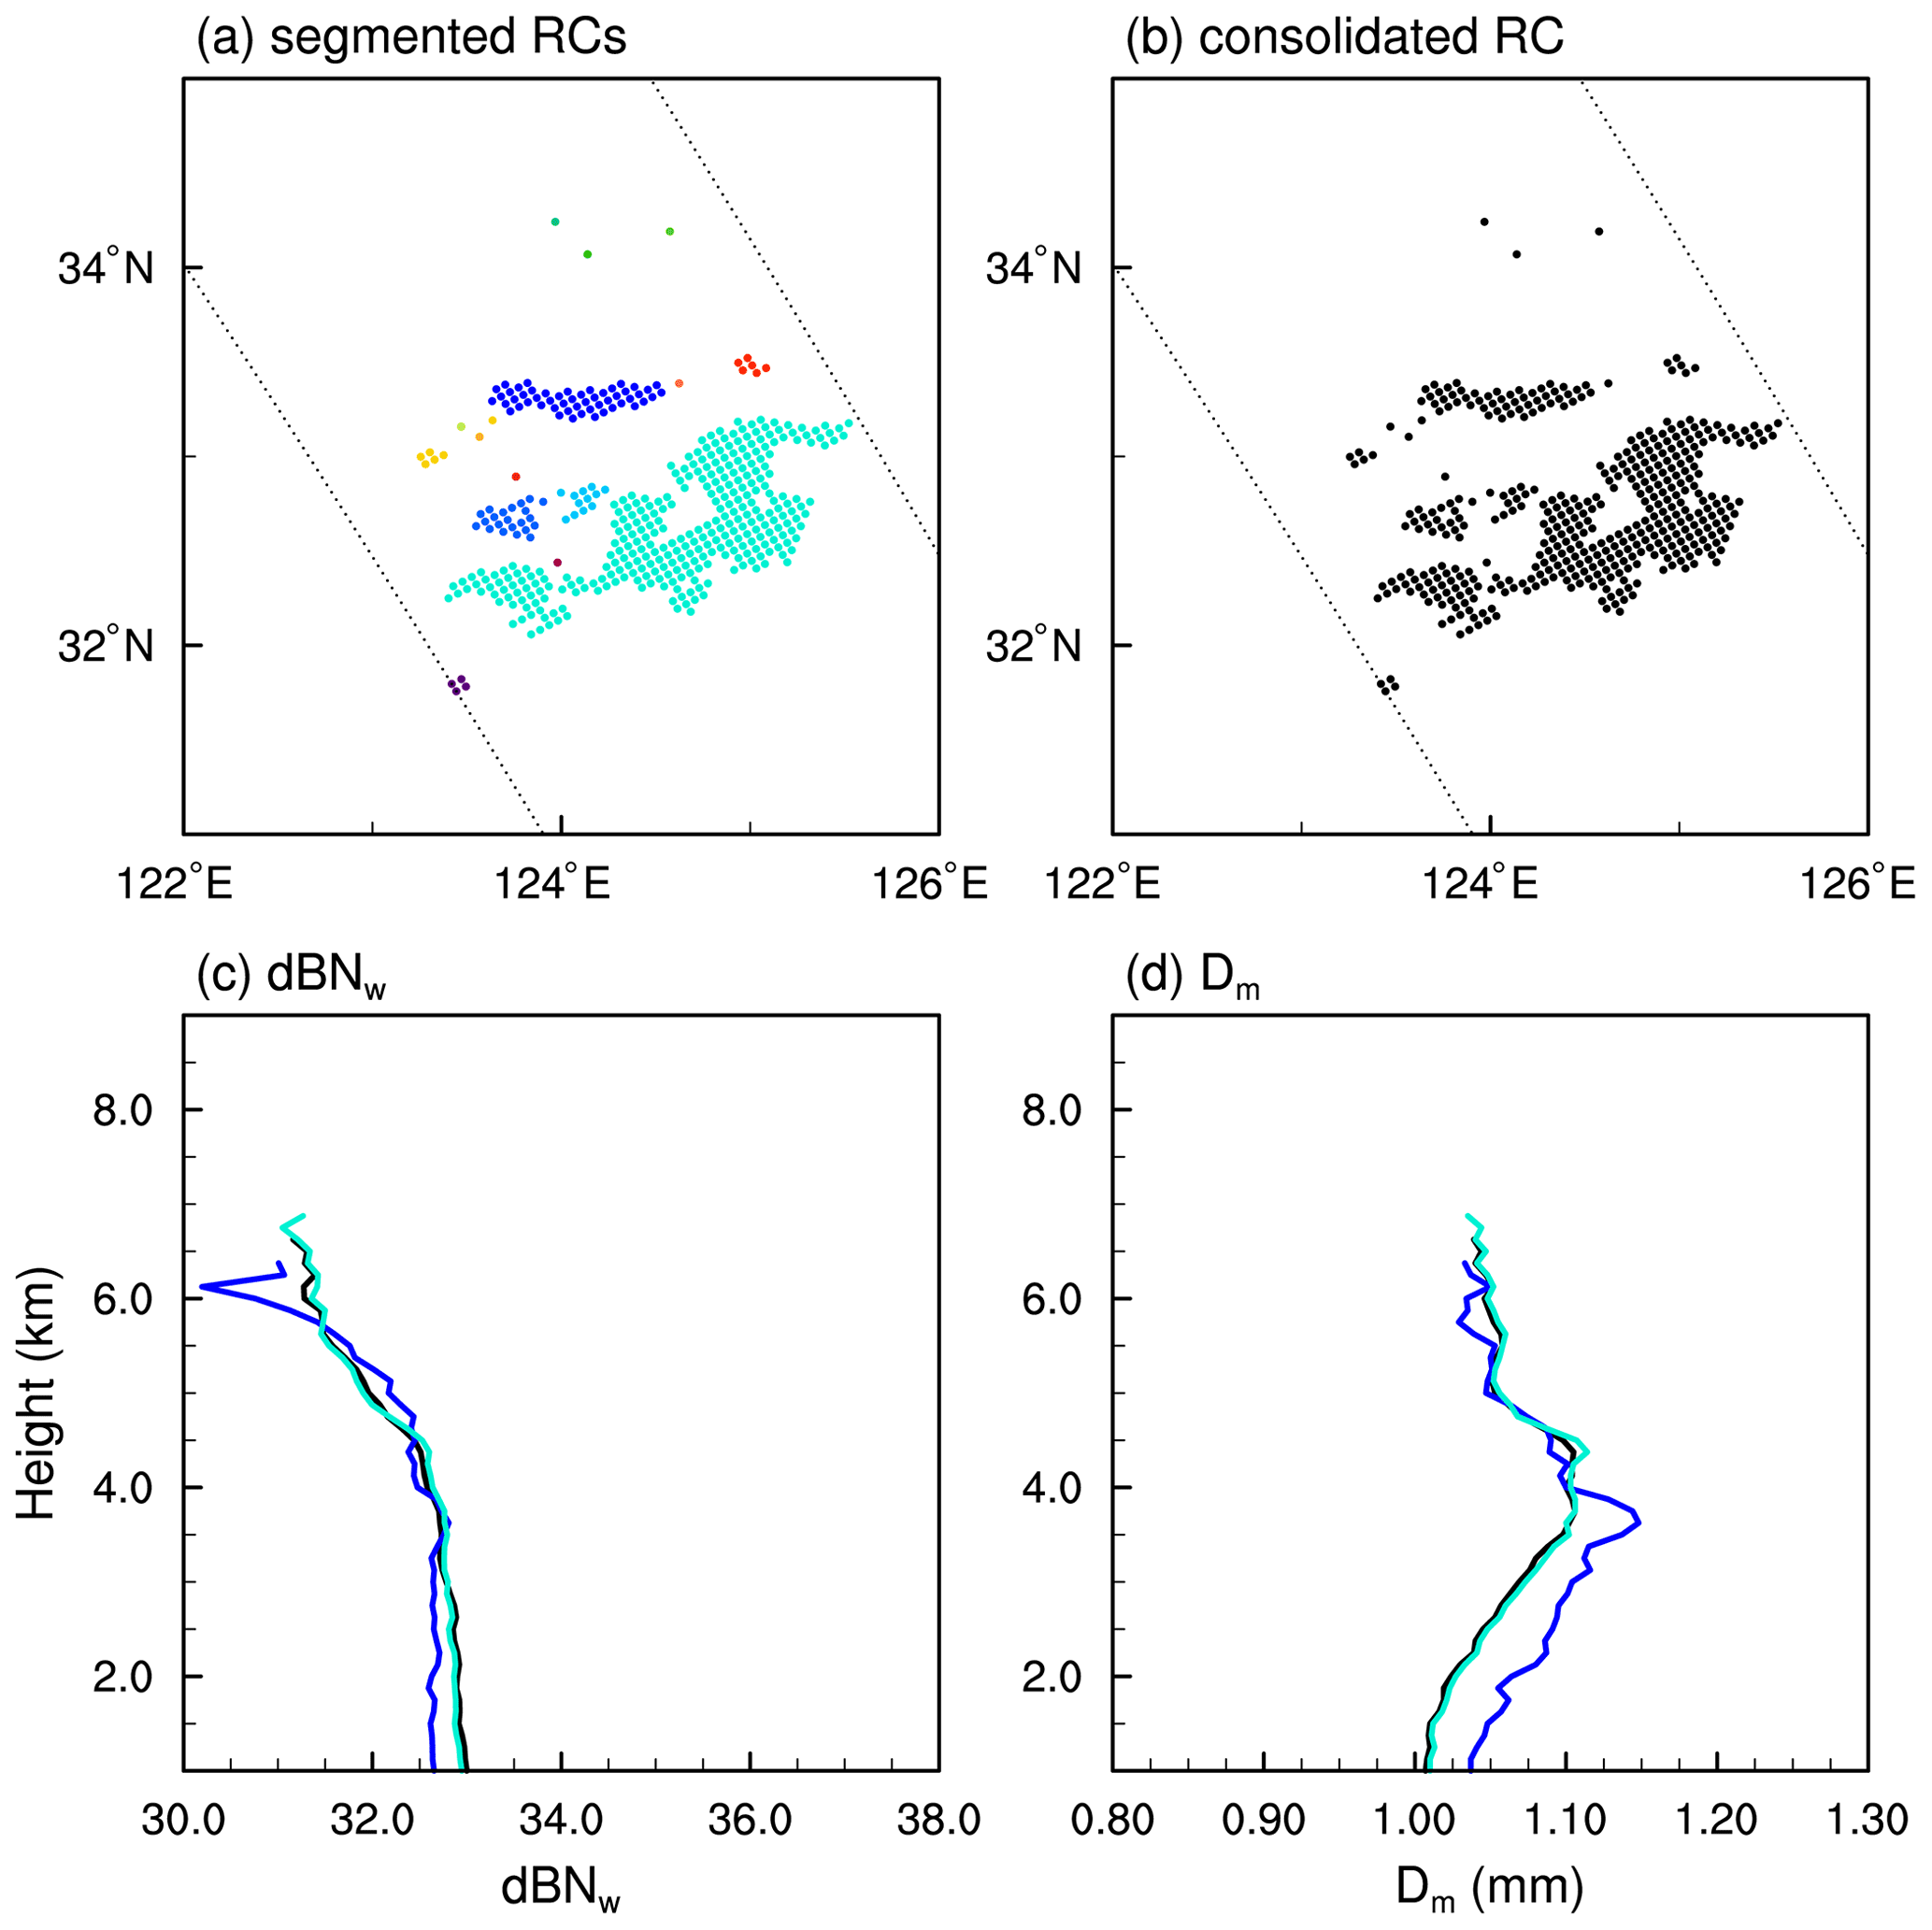
Figure 6Horizontal distributions of (a) the segmented RCs and (b) the consolidated RC and average DSD profiles (c, d) of them. The colors of the DSD profiles corresponding to the colors of the RCs are shown in panels (a) and (b).
Following the resilient consolidation principle, the small segmented RCs corresponding to the northerly elongated MCS were consolidated into one new RC (Fig. 6a and b). The average DSD profiles of the main RCs before and after consolidation are presented in Fig. 6c and d. The precipitation microphysics were dominated by ice-phase processes. Above the frozen layer, the droplet size increased with decreasing height due to the deposition, riming, and aggregation growth of droplets (Y. Chen et al., 2020b). Below the frozen layer, the droplet size gradually decreased with decreasing height as a result of evaporation. The near-surface dBNw was around 33, and the near-surface Dm was about 1.02 mm, indicating typical stratiform precipitation (Bringi et al., 2006; Wen et al., 2016). Specifically, the DSD profiles of the main RCs were fairly similar, proving that the consolidation process was reasonable.
By carrying out these resilient processes of filtration, segmentation, and consolidation on the initial RC, we obtained the final RC that had a one-to-one correspondence with the relevant MCS.
3.3 Life cycle evolution of the MCS
The life track of one final RC was derived from its corresponding (one-to-one) MCS. We took the corresponding MCS as the origin and tracked forward and backward from the MCS at temporal intervals of 1 h. The MCS tracking algorithm followed the widely used areal overlapping method with speed correction (Machado and Laurent, 2004; Fiolleau and Roca, 2013a; Ai et al., 2016; Chen et al., 2019; Wall et al., 2020). The threshold of the areal overlapping ratio was set to 50 % – that is, the overlapping area of successive MCSs must be >50 % of the area of the MCS at both later and earlier times. We first evaluated the moving speed of the MCS in the study area based on a preliminary tracking result without speed correction.
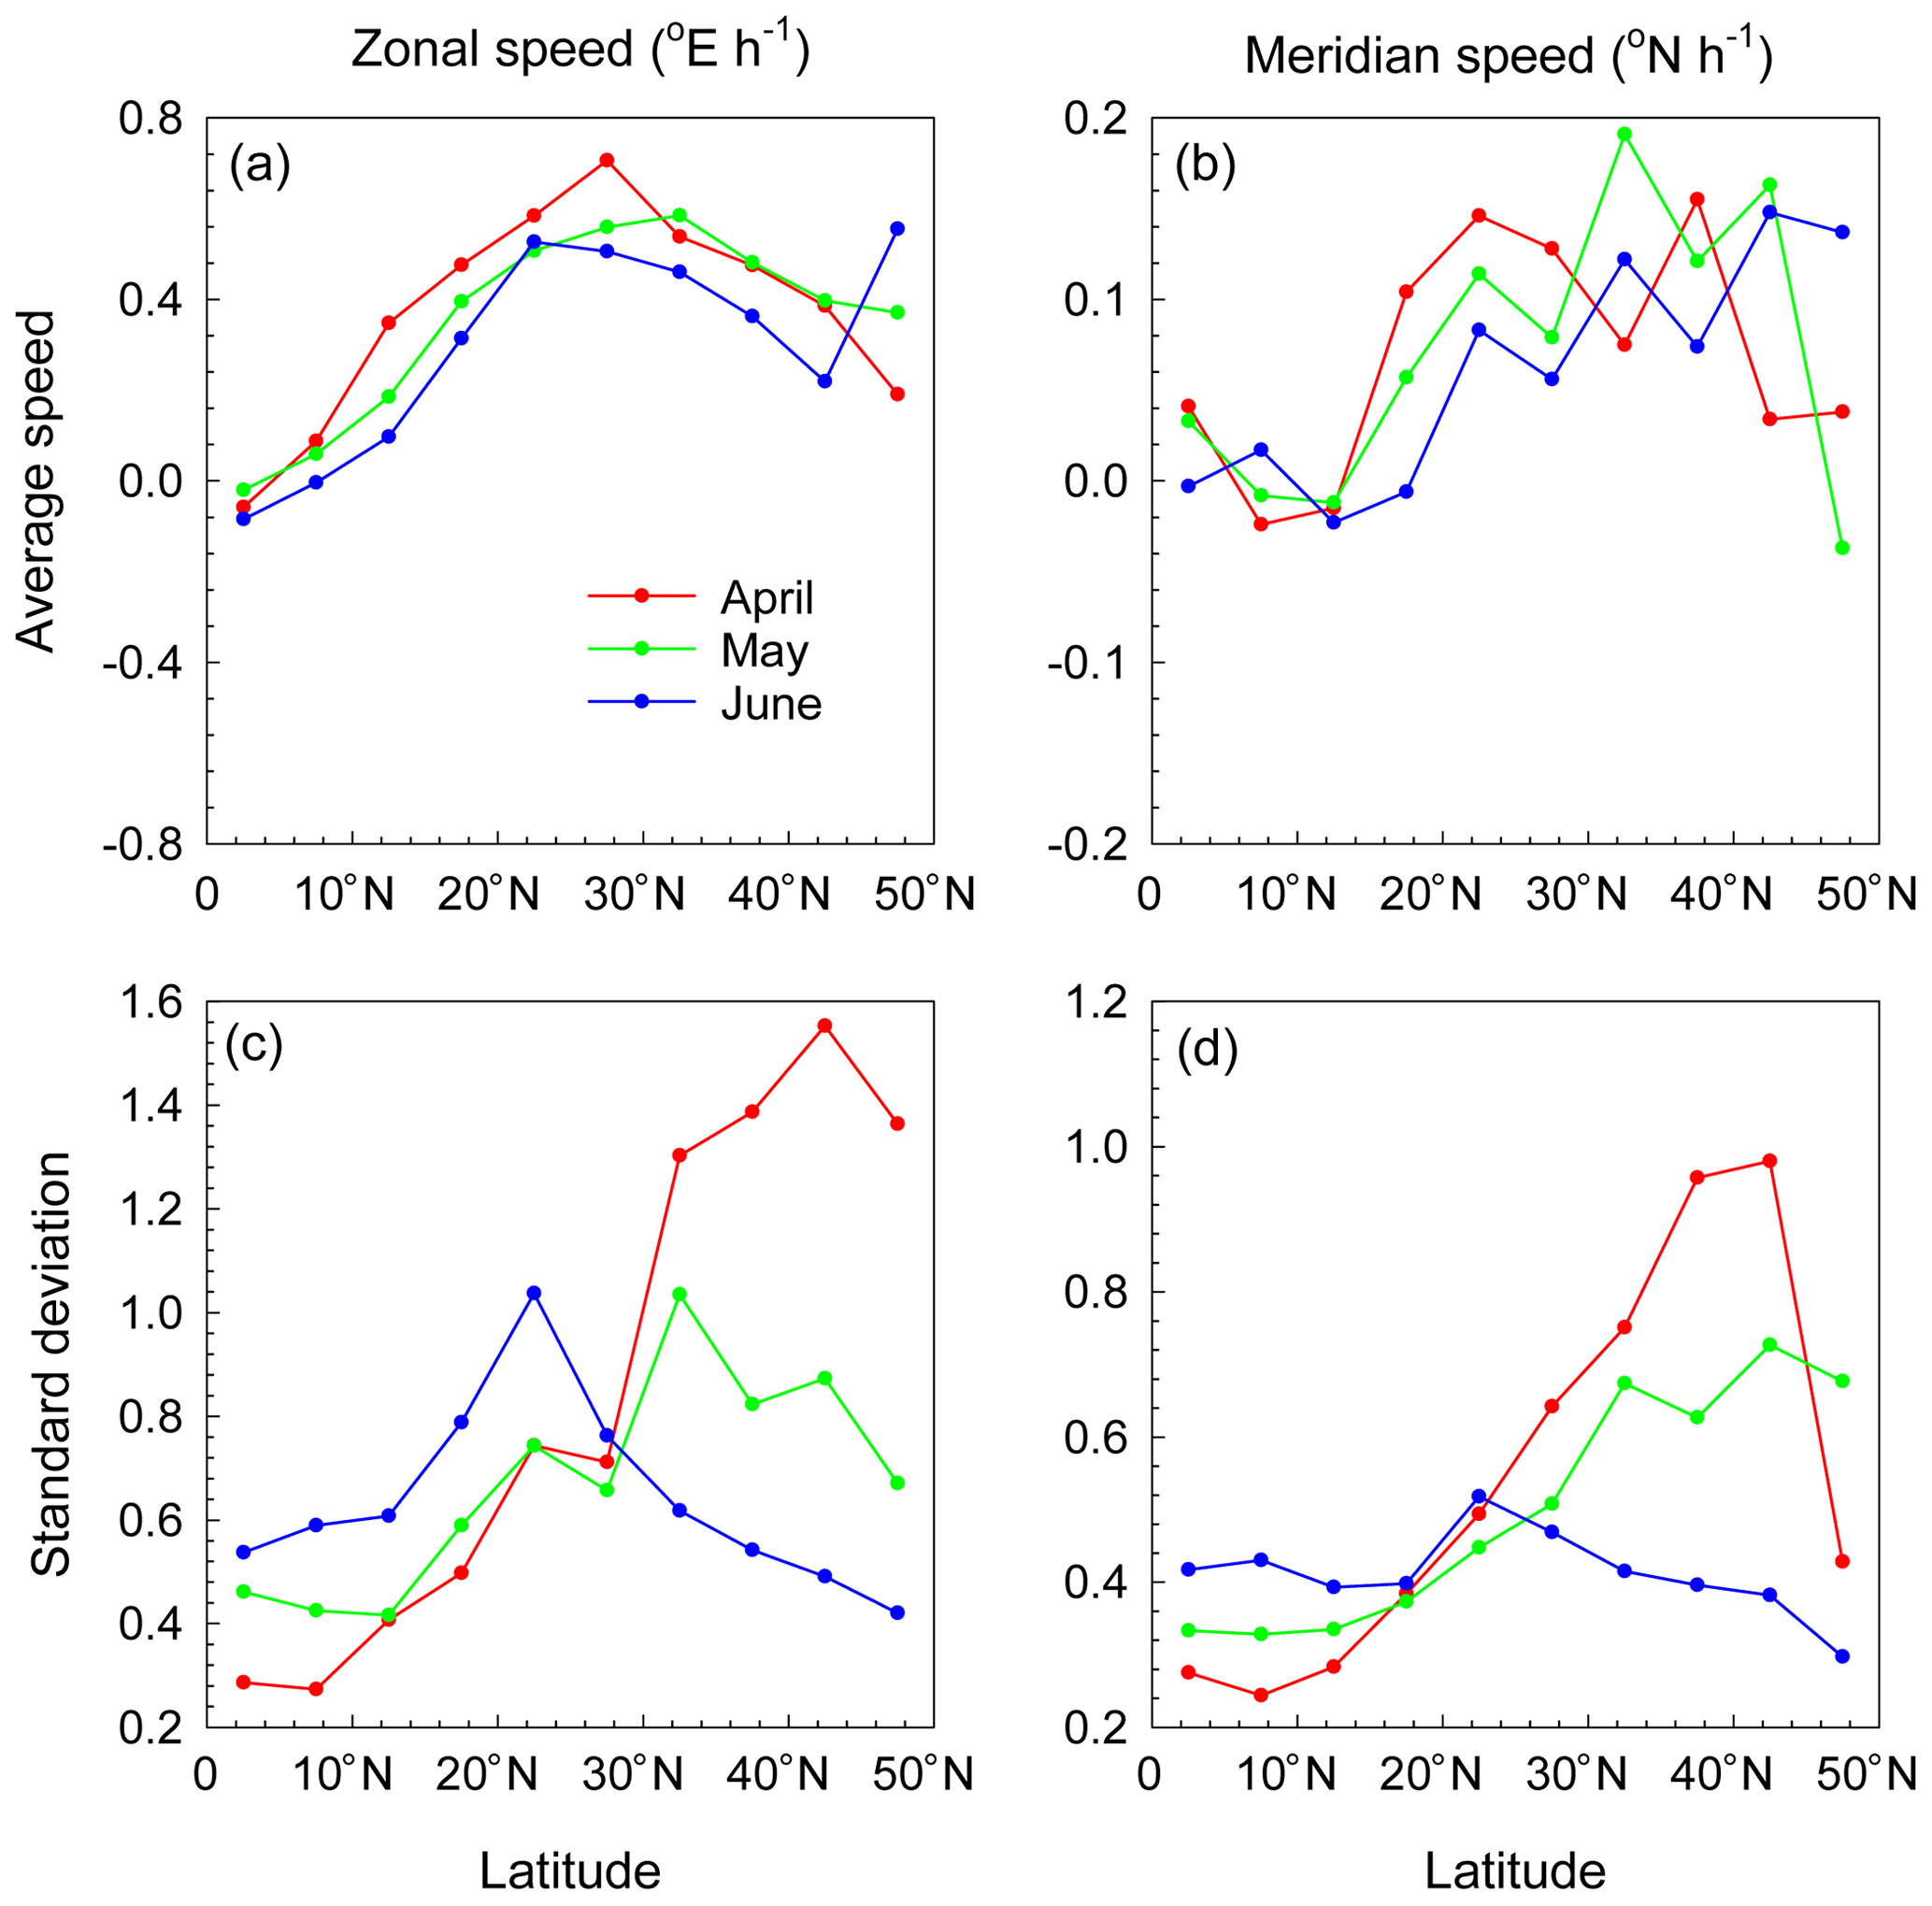
Figure 7(a, b) Average zonal and meridian moving speed of MCSs and (c, d) their standard deviations derived from the preliminary tracking result.
The movement of the MCS relied highly on the latitude and month as a result of the variance of the high-level wind field (Feng et al., 2021). Figure 7 shows the derived relationships between the moving speed of the MCS and latitude from April to June. In general, the zonal speed of the MCS was larger than the meridional speed, but their standard deviations were similar. The high-level wind field was weak in the region 0–10∘ N, which is affected by tropical depressions, so the average zonal and meridional velocities of the MCS were close to 0 (Fig. 7a and b). To the north of 10∘ N, the average zonal velocity of the MCS was seen as an eastward movement affected by high-level westerly winds, whereas the average meridional velocity was seen as a northward movement (Fig. 7a and b). The average zonal speed of the MCS reached a peak at around 30∘ N, corresponding to the position of the subtropical jet steam (Fig. 1).
The average moving speed of MCSs was similar in different months from April to June (Fig. 7a and b), but their standard deviations showed clear differences (Fig. 7c and d). In the area at about 40∘ N, the standard deviations of the zonal and meridional speeds in April reached 1.4∘ E h−1 and 1∘ N h−1, respectively. By contrast, the standard deviations of the zonal and meridional speeds in June were about 0.5∘ E h−1 and 0.4∘ N h−1, respectively. The reason for the differences in these standard deviations requires further study but may be related to the northward movement of the western Pacific subtropical high before the onset of the Meiyu season (Li et al., 2019). Besides, the movement of the MCS was fairly consistent during the Meiyu season, which usually occurs in June, as a result of the influence of a quasi-stationary front; the standard deviation of the moving speed of MCS would therefore be small.

Figure 8Demonstration of the tracking process for the precipitation event occurring at about 13:00 UTC on 20 June 2016. The light blue and deep blue areas indicate the actual MCS. The gray and light blue areas indicate the calculated MCS from the last record.
We used the average velocity of the MCS () as the initial velocity of the formal tracking algorithm. The standard deviation of the velocity of MCS was μr. The forward tracking algorithm (similar for backward tracking) was as follows:
-
Assuming the MCS at time 0 to be set {A0}, use the average velocity to calculate the possible set (t=1) of the MCS at time 1.
-
Use and the areal overlapping method to determine the actual MCS set {At} at time t. If {At} does not exist, stop tracking.
-
Calculate the instantaneous moving velocity of MCS (r) from {At} and {At−1}. If r exceeds the range of , let .
-
Use the instantaneous velocity r and {At} to calculate the possible set of the MCS at time t+1.
-
Let and skip to step 2.
Figure 8 shows an example of the tracking algorithm. The precipitation event occurred at about 13:00 UTC on 20 June 2016 over Kyushu Island, Japan (Fig. 8d). The gray and light blue areas represent the estimated MCS {At}, whereas the deep blue and light blue areas represent the actual MCS . In this case, the estimated MCS showed good agreement with the actual MCS, with the areal overlapping ratio reaching 80 % at most times (Fig. 8). During the eastward to northeastward movement of the MCS, the shape of the MCS gradually elongated along the direction of movement. Figure 8a and b show that the area of the MCS changed dramatically when splitting. We therefore do not recommend the use of only the temporal variance of the MCS area to identify the life stage of MCSs.
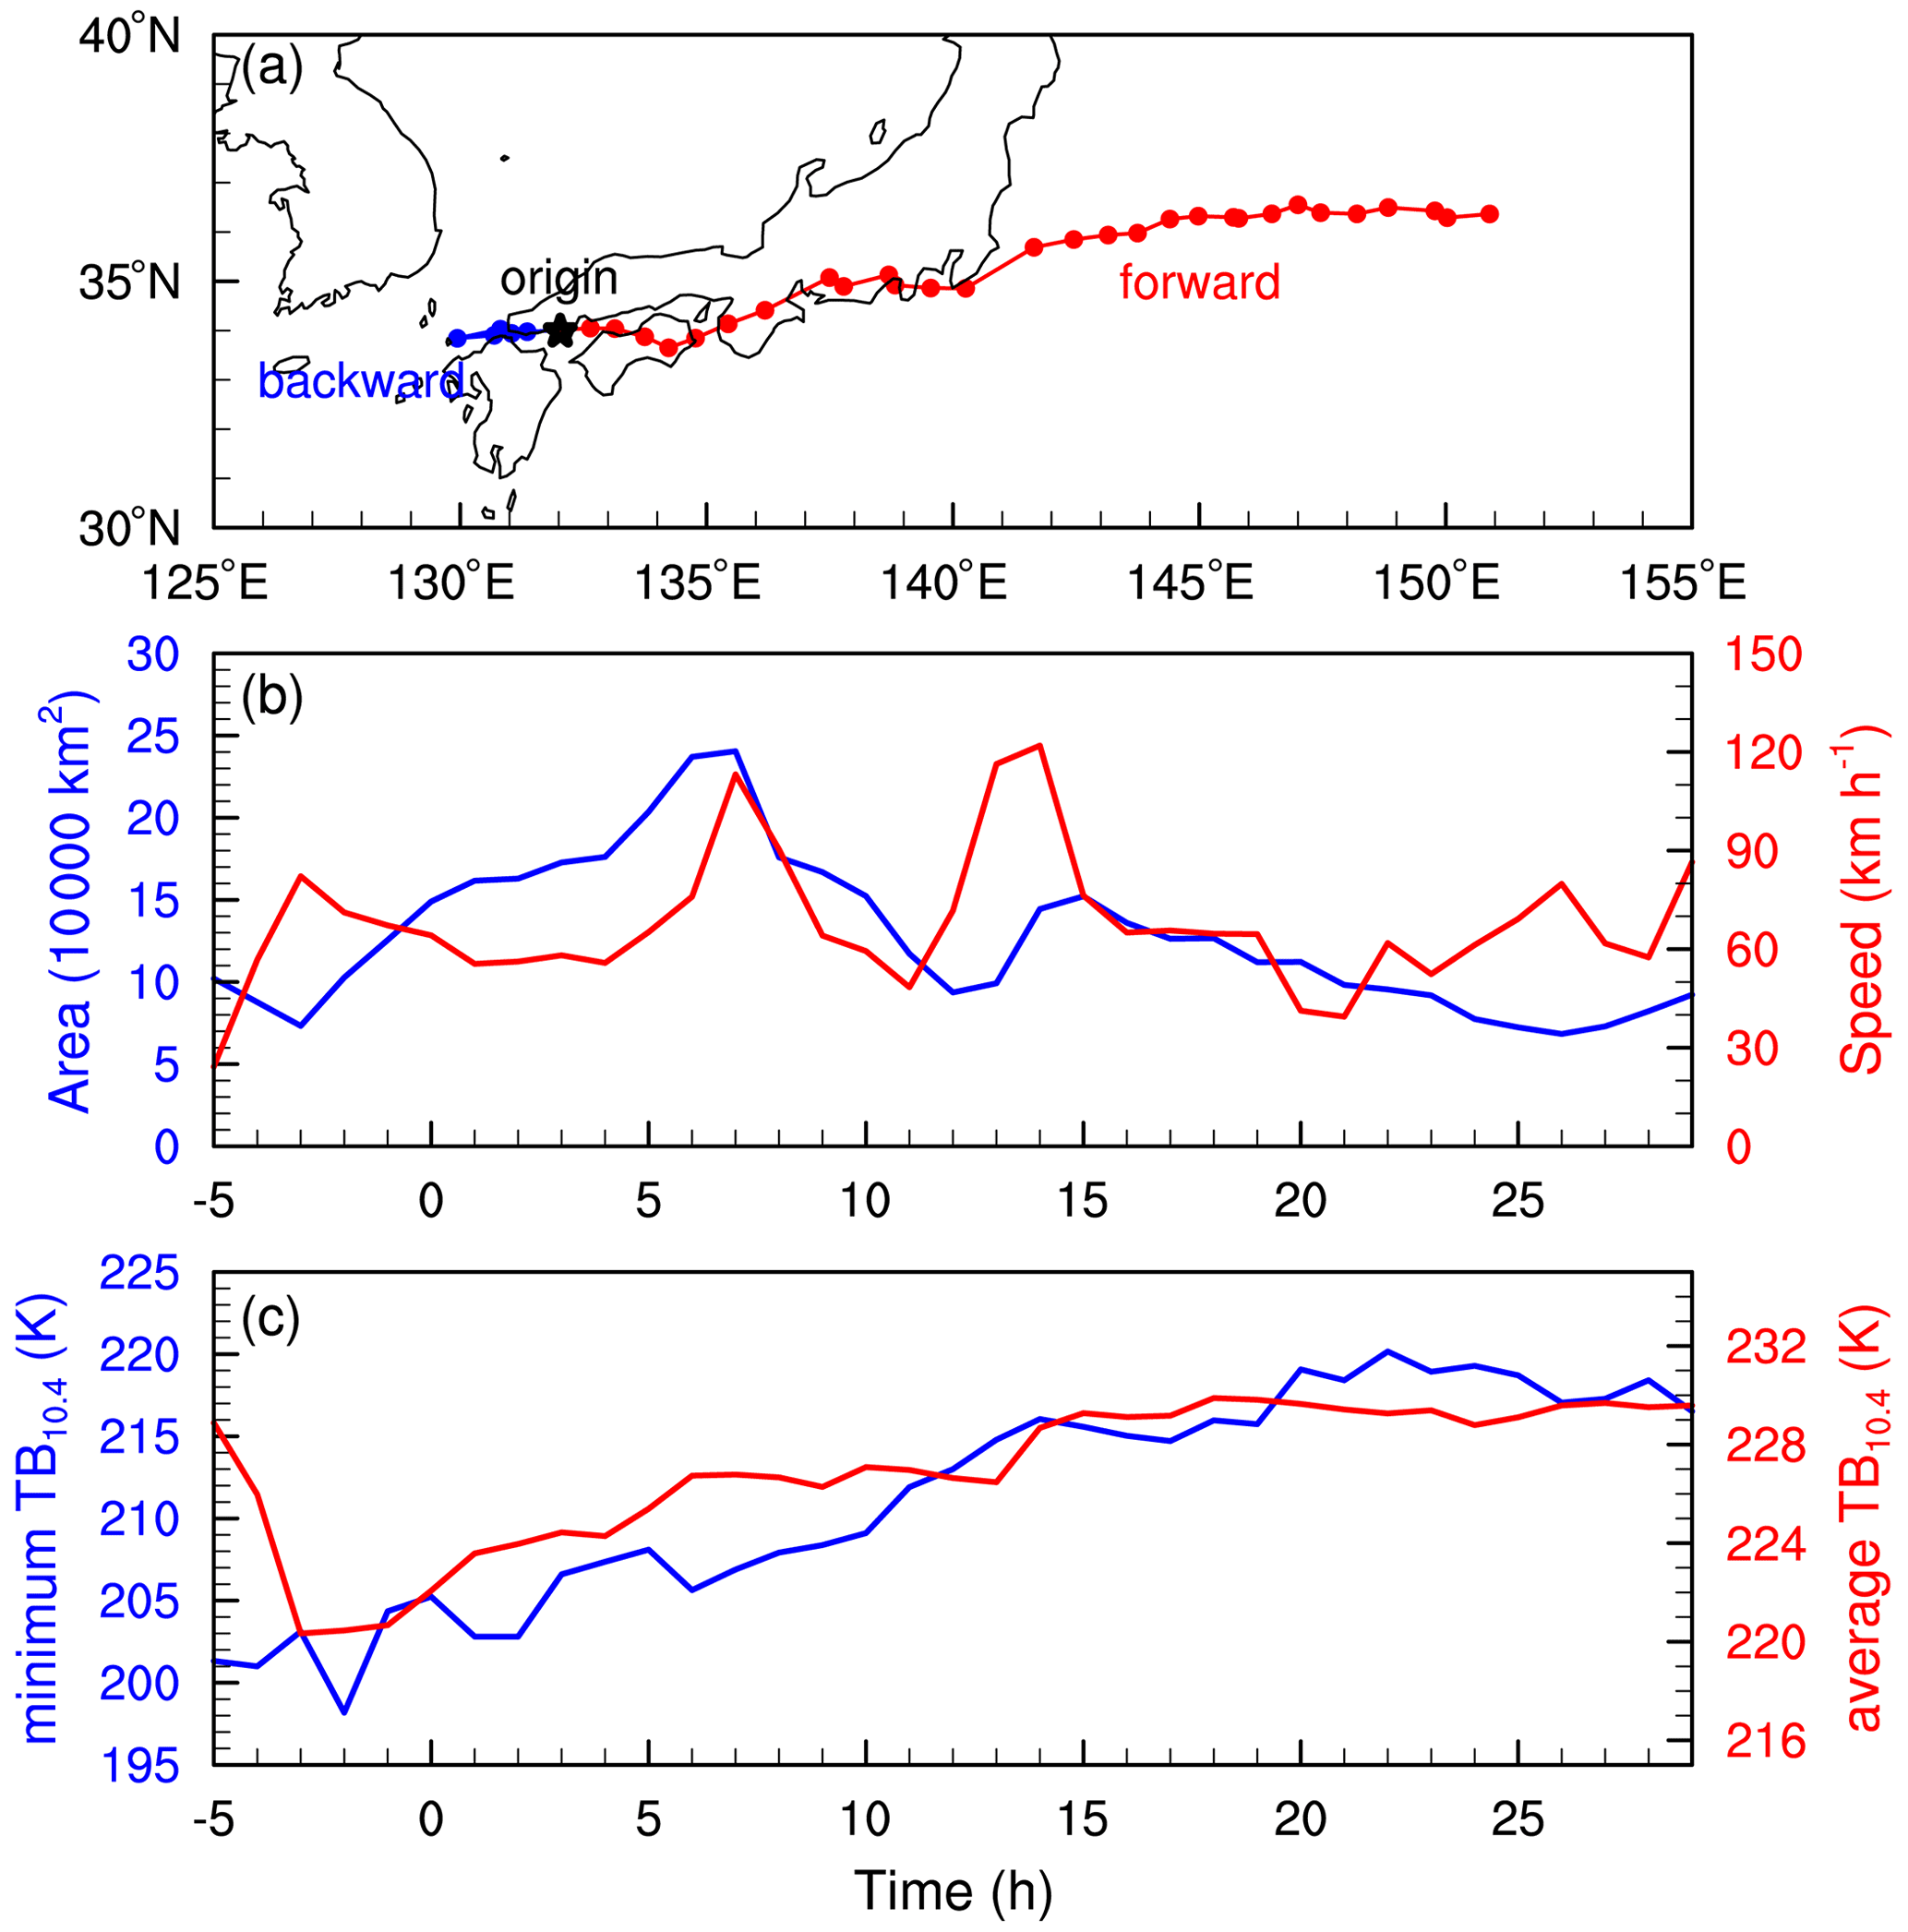
Figure 9(a) Moving track of the MCS occurring at 13:00 UTC on 20 June 2016 and (b) temporal variations in the area, speed, and (c) minimum and average 10.4 µm brightness temperature of the MCS.
Figure 9a shows the entire moving track of this MCS. The MCS had a lifetime of 34 h with a moving track >2000 km. The MCS originated on the ocean about 50 km west of Kyushu Island, Japan, and then moved eastward for about 10 h. After reaching Shikoku Island, the direction of movement turned northeastward, and the MCS lasted for another 24 h until it dissipated on the ocean about 1000 km east of Honshu Island.
Figure 9b and c show the temporal variations in several important parameters of the MCS. During the life cycle, the area of the MCS first increased and then decreased over time; the peak MCS area of 250 000 km2 occurred at about one-third of the life cycle (Fig. 9b). The moving speed of the MCS ranged from 30 to 120 km h−1 but was about 60 km h−1 during most of the life cycle (Fig. 9b). The temporal variations in the average and minimum 10.4 µm brightness temperature showed first a sharp decrease and then a slow increase (Fig. 9c). At the origin time, the brightness temperature of the MCS was in the trough period, and the area was increasing, suggesting that this precipitation event was caused by a mature-stage MCS.
The final dataset provides both three-dimensional precipitation information and life cycle information of 70 805 RCs and their corresponding MCS tracks during April to June 2016–2020 over eastern Asia. The precipitation parameters include the area, central location, average near-surface rain rate, average storm-top height, average Ku-band reflectivity profile, and average DSD profile of RCs; the life cycle information contains the time series of area, central location, and minimum and average cloud-top brightness temperature of corresponding MCS tracks. Specifically, the central latitude and longitude of RCs and MCSs in the dataset are defined as the average of all RC pixels (or MCS pixels), so the centroid may lie outside the contour.
The resilient dataset of rain clusters with life cycle evolution is freely available at https://doi.org/10.5281/zenodo.6198716 (Zhang et al., 2022).
We constructed a resilient dataset of rain clusters with life cycle evolution based on observations from the GPM DPR and Himawari-8 AHI. The three-dimensional precipitation structure of the RC was provided by GPM DPR data, and the relevant life cycle evolution of the MCS was obtained from the Himawari-8 AHI. The purpose of this dataset is to facilitate three-dimensional studies of the life cycle evolution of precipitation. In the process of constructing the dataset, we used a series of satellite data processing methods as summarized in the following.
First, using a connected component analysis method, we extracted initial RCs and MCSs from GPM 2ADPR orbital data with a horizontal resolution of 5 km and Himawari-8 AHI 10.4 µm channel hourly grid data on 0.05∘ × 0.05∘ grids. The contours of the initial RCs and MCSs were different as a result of factors, including the randomness of precipitation, the mismatch between cold cloud top and near-surface precipitation, the time differences between the two datasets, and the truncation effect of the DPR swath.
Second, we performed a series of resilient reprocessing steps to remove redundant contour information between the initial RCs and the MCSs, including filtration, segmentation, and consolidation on the initial RCs. We obtained the final RCs, which correspond one-to-one to the relevant MCSs. To evaluate the effectiveness of these algorithms, we carried out two case studies on the segmentation and consolidation algorithms. The results showed that the final RCs segmented by the algorithms had different DSD features, whereas those initial RCs with similar DSD profiles were consolidated into one final RC, indicating that our reprocessing algorithms were reasonable and necessary.
Third, we tracked the relevant MCS, corresponding one-to-one to the final RC, both forward and backward to obtain the life cycle evolution. The specific tracking algorithm is given in the main text and is based on the areal overlapping method with speed correction. The case study of the tracking algorithm showed that the temporal evolution of the cloud-top brightness temperature was more suitable for identifying the cloud life stages than the temporal evolution of the area of the MCS. The shape of the MCS gradually elongated along the direction of movement during the life cycle of the MCS.
We then calculated the area, central location, mean corrected radar reflectivity, mean DSD profiles, mean storm-top height, mean near-surface rain rate, and other precipitation information of the final RC and the temporal evolution of area, central location, cloud-top brightness temperature, and other information of the MCS from the tracking results. Both the RC information and the life cycle information of relevant MCS were stored in the resilient dataset.
This new dataset greatly reduces the size of the dataset from >200 GB per month to <10 MB per month and avoids complex data processing algorithms, which will facilitate studies of event-based precipitation and its life cycle evolution. The cloud parameters with vertical revolution retrieved from Himawari-8 AHI will be added to the dataset to investigate the relationships between cloud microphysics, precipitation microphysics, and cloud life cycle further (Y. Chen et al., 2020a). This work is now in progress but is not reported here due to the limited length of the paper. We will also develop and optimize our algorithms to further improve our dataset, such as using Himawari-8 data with a higher temporal resolution and longer time periods and segmenting the MCS based on convective cores.
AZ and YC conceived the idea and proposed this study. AZ prepared the data and drafted the manuscript. All the authors discussed the concepts and edited the manuscript.
The contact author has declared that neither they nor their co-authors have any competing interests.
Publisher's note: Copernicus Publications remains neutral with regard to jurisdictional claims in published maps and institutional affiliations.
The authors greatly appreciate the thoughtful comments and suggestions of the editor and anonymous reviewers. We would also like to acknowledge the National Aeronautics and Space Administration (NASA) for providing GPM 2ADPR dataset and the Japan Meteorological Agency (JMA) for providing Himawari-8 data.
This work was supported by the Guangdong Major Project of Basic and Applied Basic Research (grant no. 2020B0301030004), the National Natural Science Foundation of China (grant nos. 42005062, 42075004, and 42105068), the Guangdong Basic and Applied Basic Research Foundation (grant no. 2021A1515011404), and the Innovation Group Project of the Southern Marine Science and Engineering Guangdong Laboratory (Zhuhai) (grant no. 311021009).
This paper was edited by Lukas Gudmundsson and reviewed by two anonymous referees.
Aggarwal, P. K., Romatschke, U., Araguas-Araguas, L., Belachew, D., Longstaffe, F. J., Berg, P., Schumacher, C., and Funk, A.: Proportions of convective and stratiform precipitation revealed in water isotope ratios, Nat. Geosci., 9, 624–629, https://doi.org/10.1038/ngeo2739, 2016.
Ai, Y., Li, W., Meng, Z., and Li, J.: Life Cycle Characteristics of MCSs in Middle East China Tracked by Geostationary Satellite and Precipitation Estimates, Mon. Weather Rev., 144, 2517–2530, https://doi.org/10.1175/MWR-D-15-0197.1, 2016.
Bessho, K., Date, K., Hayashi, M., Ikeda, A., Imai, T., Inoue, H., Kumagai, Y., Miyakawa, T., Murata, H., Ohno, T., Okuyama, A., Oyama, R., Sasaki, Y., Shimazu, Y., Shimoji, K., Sumida, Y., Suzuki, M., Taniguchi, H., Tsuchiyama, H., Uesawa, D., Yokota, H., and Yoshida, R.: An Introduction to Himawari-8/9-Japan's New-Generation Geostationary Meteorological Satellites, J. Meteorol. Soc. Jpn., 94, 151–183, 2016.
Bringi, V. N., Thurai, M., Nakagawa, K., Huang, G. J., Kobayashi, T., Adachi, A., Hanado, H., and Sekizawa, S.: Rainfall Estimation from C-Band Polarimetric Radar in Okinawa, Japan: Comparisons with 2D-Video Disdrometer and 400 MHz Wind Profiler, J. Meteorol. Soc. Jpn., 84, 705–724, https://doi.org/10.2151/jmsj.84.705, 2006.
Chawla, I., Osuri, K. K., Mujumdar, P. P., and Niyogi, D.: Assessment of the Weather Research and Forecasting (WRF) model for simulation of extreme rainfall events in the upper Ganga Basin, Hydrol. Earth Syst. Sci., 22, 1095–1117, https://doi.org/10.5194/hess-22-1095-2018, 2018.
Chen, D., Guo, J., Yao, D., Lin, Y., Zhao, C., Min, M., Xu, H., Liu, L., Huang, X., Chen, T., and Zhai, P.: Mesoscale Convective Systems in the Asian Monsoon Region From Advanced Himawari Imager: Algorithms and Preliminary Results, J. Geophys. Res.-Atmos., 124, 2210–2234, https://doi.org/10.1029/2018JD029707, 2019.
Chen, D., Guo, J., Yao, D., Feng, Z., and Lin, Y.: Elucidating the Life Cycle of Warm-Season Mesoscale Convective Systems in Eastern China from the Himawari-8 Geostationary Satellite, Remote Sens.-Basel, 12, 2307, https://doi.org/10.3390/rs12142307, 2020.
Chen, Y. and Fu, Y.: Characteristics of VIRS Signals within Pixels of TRMM PR for Warm Rain in the Tropics and Subtropics, J. Appl. Meteorol. Clim., 56, 789–801, https://doi.org/10.1175/JAMC-D-16-0198.1, 2017.
Chen, Y., Fu, Y., Xian, T., and Pan, X.: Characteristics of cloud cluster over the steep southern slopes of the Himalayas observed by CloudSat, Int. J. Climatol., 37, 4043–4052, https://doi.org/10.1002/joc.4992, 2017.
Chen, Y., Chen, G., Cui, C., Zhang, A., Wan, R., Zhou, S., Wang, D., and Fu, Y.: Retrieval of the vertical evolution of the cloud effective radius from the Chinese FY-4 (Feng Yun 4) next-generation geostationary satellites, Atmos. Chem. Phys., 20, 1131–1145, https://doi.org/10.5194/acp-20-1131-2020, 2020a.
Chen, Y., Li, W., Chen, S., Zhang, A., and Fu, Y.: Linkage Between the Vertical Evolution of Clouds and Droplet Growth Modes as Seen From FY-4A AGRI and GPM DPR, Geophys. Res. Lett., 47, e2020GL088312, https://doi.org/10.1029/2020GL088312, 2020b.
Da, C.: Preliminary assessment of the Advanced Himawari Imager (AHI) measurement onboard Himawari-8 geostationary satellite, Remote Sens. Lett., 6, 637–646, 2015.
Feng, Z., Leung, L. R., Liu, N., Wang, J., Houze, R. A., Li, J., Hardin, J. C., Chen, D., and Guo, J.: A Global High-Resolution Mesoscale Convective System Database Using Satellite-Derived Cloud Tops, Surface Precipitation, and Tracking, J. Geophys. Res.-Atmos., 126, e2020JD034202, https://doi.org/10.1029/2020JD034202, 2021.
Feral, L., Mesnard, F., Sauvageot, H., Castanets, L., and Lemorton, J.: Rain cells shape and orientation distribution in south-west of France, Phys. Chem. Earth B, 25, 1073–1078, https://doi.org/10.1016/S1464-1909(00)00155-6, 2000.
Fiolleau, T. and Roca, R.: An Algorithm for the Detection and Tracking of Tropical Mesoscale Convective Systems Using Infrared Images From Geostationary Satellite, IEEE T. Geosci. Remote, 51, 4302–4315, 2013a.
Fiolleau, T. and Roca, R.: Composite life cycle of tropical mesoscale convective systems from geostationary and low Earth orbit satellite observations: method and sampling considerations, Q. J. Roy. Meteor. Soc., 139, 941–953, https://doi.org/10.1002/qj.2174, 2013b.
Freitas, S. R., Grell, G. A., Molod, A., Thompson, M. A., Putman, W. M., Santos E Silva, C. M., and Souza, E. P.: Assessing the Grell-Freitas Convection Parameterization in the NASA GEOS Modeling System, J. Adv. Model. Earth Sy., 10, 1266–1289, https://doi.org/10.1029/2017MS001251, 2018.
Freud, E. and Rosenfeld, D.: Linear relation between convective cloud drop number concentration and depth for rain initiation, J. Geophys. Res.-Atmos., 117, D2207, https://doi.org/10.1029/2011JD016457, 2012.
Fu, Y., Liu, Q., Gao, Y., Hong, X., Zi, Y., Zheng, Y., Li, R., and Heng, Z.: A feasible method for merging the TRMM microwave imager and precipitation radar data, J. Quant. Spectrosc. Ra., 122, 155–169, https://doi.org/10.1016/j.jqsrt.2012.08.028, 2013.
Fu, Y., Chen, Y., Zhang, X., Wang, Y., Li, R., Liu, Q., Zhong, L., Zhang, Q., and Zhang, A.: Fundamental Characteristics of Tropical Rain Cell Structures as Measured by TRMM PR, J. Meteorol. Res., 34, 1129–1150, https://doi.org/10.1007/s13351-020-0035-5, 2020.
Gentine, P., Pritchard, M., Rasp, S., Reinaudi, G., and Yacalis, G.: Could Machine Learning Break the Convection Parameterization Deadlock?, Geophys. Res. Lett., 45, 5742–5751, https://doi.org/10.1029/2018GL078202, 2018.
Gonzalez, R. C. and Thomason, M. G.: Syntactic pattern recognition: an introduction, American Council on Education, 0826814506, 1978.
Hamada, A. and Takayabu, Y. N.: Improvements in Detection of Light Precipitation with the Global Precipitation Measurement Dual-Frequency Precipitation Radar (GPM DPR), J. Atmos. Ocean. Tech., 33, 653–667, https://doi.org/10.1175/JTECH-D-15-0097.1, 2016.
Hersbach, H., Bell, B., Berrisford, P., Hirahara, S., Horányi, A., Muñoz Sabater, J., Nicolas, J., Peubey, C., Radu, R., Schepers, D., Simmons, A., Soci, C., Abdalla, S., Abellan, X., Balsamo, G., Bechtold, P., Biavati, G., Bidlot, J., Bonavita, M., Chiara, G., Dahlgren, P., Dee, D., Diamantakis, M., Dragani, R., Flemming, J., Forbes, R., Fuentes, M., Geer, A., Haimberger, L., Healy, S., Hogan, R. J., Hólm, E., Janisková, M., Keeley, S., Laloyaux, P., Lopez, P., Lupu, C., Radnoti, G., Rosnay, P., Rozum, I., Vamborg, F., Villaume, S., and Thépaut, J. N.: The ERA5 global reanalysis, Q. J. Roy. Meteor. Soc., 146, 1999–2049, https://doi.org/10.1002/qj.3803, 2020.
Houze, R. A.: Cloud dynamics, 2nd edn., Academic press, 9780123742667, 2014.
Houze, R. A., Rasmussen, K. L., Zuluaga, M. D., and Brodzik, S. R.: The variable nature of convection in the tropics and subtropics: A legacy of 16 years of the Tropical Rainfall Measuring Mission satellite, Rev. Geophys., 53, 994–1021, https://doi.org/10.1002/2015RG000488, 2015.
Iguchi, T., Seto, S., Meneghini, R., Yoshida, N., Awaka, J., Le, M., Chandrasekar, V., and Kubota, T.: GPM/DPR level-2 algorithm theoretical basis document, NASA Goddard Space Flight Center, https://gpm.nasa.gov/sites/default/files/document_files/ATBD_DPR_201811_with_Appendix3b_0.pdf (last access: 31 March 2022), 2010.
Iguchi, T., Seto, S., Meneghini, R., Yoshida, N., Awaka, J., Kubota, T., Kozu, T., Chandra, V., Le, M., Liao, L., Tanelli, S., and Durden, S.: An overview of the precipitation retrieval algorithm for the Dual-frequency Precipitation Radar (DPR) on the Global Precipitation Measurement (GPM) mission's core satellite, Conference on Earth Observing Missions and Sensors – Development, Implementation, and Characterization II, Kyoto, JAPAN, edited by: Shimoda, H. and Xiong, X., https://doi.org/10.1117/12.977352, 2012.
Kumar, S., Castillo-Velarde, C. D., Flores Rojas, J. L., Moya-Álvarez, A., Martínez Castro, D., Srivastava, S., and Silva, Y.: Precipitation structure during various phases the life cycle of precipitating cloud systems using geostationary satellite and space-based precipitation radar over Peru, GISci. Remote Sens., 57, 1057–1082, https://doi.org/10.1080/15481603.2020.1843846, 2020.
Lau, K. M. and Wu, H. T.: Climatology and changes in tropical oceanic rainfall characteristics inferred from Tropical Rainfall Measuring Mission (TRMM) data (1998–2009), J. Geophys. Res., 116, D17111, https://doi.org/10.1029/2011JD015827, 2011.
Li, H., He, S., Fan, K., and Wang, H.: Relationship between the onset date of the Meiyu and the South Asian anticyclone in April and the related mechanisms, Clim. Dynam., 52, 209–226, https://doi.org/10.1007/s00382-018-4131-5, 2019.
Li, P., Moseley, C., Prein, A. F., Chen, H., Li, J., Furtado, K., and Zhou, T.: Mesoscale Convective System Precipitation Characteristics over East Asia. Part I: Regional Differences and Seasonal Variations, J. Climate, 33, 9271–9286, https://doi.org/10.1175/JCLI-D-20-0072.1, 2020.
Li, W., Zhang, F., Yu, Y., Iwabuchi, H., Shen, Z., Wang, G., and Zhang, Y.: The semi-diurnal cycle of deep convective systems over Eastern China and its surrounding seas in summer based on an automatic tracking algorithm, Clim. Dynam., 56, 357–379, https://doi.org/10.1007/s00382-020-05474-1, 2021.
Liu, C. and Zipser, E. J.: The global distribution of largest, deepest, and most intense precipitation systems, Geophys. Res. Lett., 42, 3591–3595, https://doi.org/10.1002/2015GL063776, 2015.
Liu, C., Zipser, E. J., Cecil, D. J., Nesbitt, S. W., and Sherwood, S.: A Cloud and Precipitation Feature Database from Nine Years of TRMM Observations, J. Appl. Meteorol. Clim., 47, 2712–2728, https://doi.org/10.1175/2008JAMC1890.1, 2008.
Machado, L. A. T. and Laurent, H.: The convective system area expansion over amazonia and its relationships with convective system life duration and high-level wind divergence, Mon. Weather Rev., 132, 714–725, https://doi.org/10.1175/1520-0493(2004)132<0714:TCSAEO>2.0.CO;2, 2004.
Mapes, B. E. and Houze, R. A.: Cloud Clusters and Superclusters over the Oceanic Warm Pool, Mon. Weather Rev., 121, 1398–1415, https://doi.org/10.1175/1520-0493(1993)121<1398:CCASOT>2.0.CO;2, 1993.
Min, M., Wu, C., Li, C., Liu, H., Xu, N., Wu, X., Chen, L., Wang, F., Sun, F., Qin, D., Wang, X., Li, B., Zheng, Z., Cao, G., and Dong, L.: Developing the Science Product Algorithm Testbed for Chinese Next-Generation Geostationary Meteorological Satellites: Fengyun-4 Series, J. Meteorol. Res., 31, 708–719, https://doi.org/10.1007/s13351-017-6161-z, 2017.
Min, Q., Li, R., Wu, X., and Fu, Y.: Retrieving latent heating vertical structure from cloud and precipitation Profiles-Part I: Warm rain processes, J. Quant. Spectrosc. Ra., 122, 31–46, https://doi.org/10.1016/j.jqsrt.2012.11.030, 2013.
Miura, T., Kojima, M., Furukawa, K., Hyakusoku, Y., Ishikiri, T., Kai, H., Iguchi, T., Hanado, H., Nakagawa, K., Meynart, R., Neeck, S. P., and Shimoda, H.: Status of proto-flight model of the dual-frequency precipitation radar for the global precipitation measurement, edited by: Meynart, R., Neeck, S. P., and Shimoda, H., 2012, 853309, https://doi.org/10.1117/12.974782, 2012.
Montagnani, L., Moors, E. J., Papale, D., Sottocornola, M., Vaccari, F., and Williams, C.: Global patterns of land-atmosphere fluxes of carbon dioxide, latent heat, and sensible heat derived from eddy covariance, satellite, and meteorological observations, J. Geophys. Res., 116, G00J07, https://doi.org/10.1029/2010JG001566, 2011.
Morrison, H. and Milbrandt, J. A.: Parameterization of Cloud Microphysics Based on the Prediction of Bulk Ice Particle Properties. Part I: Scheme Description and Idealized Tests, J. Atmos. Sci., 72, 287–311, https://doi.org/10.1175/JAS-D-14-0065.1, 2015.
Nelson, E. L. and L'Ecuyer, T. S.: Global Character of Latent Heat Release in Oceanic Warm Rain Systems, J. Geophys. Res.-Atmos., 123, 4797–4817, https://doi.org/10.1002/2017JD027844, 2018.
Nesbitt, S. W., Cifelli, R., and Rutledge, S. A.: Storm morphology and rainfall characteristics of TRMM precipitation features, Mon. Weather Rev., 134, 2702–2721, https://doi.org/10.1175/MWR3200.1, 2006.
Nishant, N., Sherwood, S. C., and Geoffroy, O.: Aerosol-induced modification of organised convection and top-of-atmosphere radiation, NPJ climate and atmospheric science, 2, 33, https://doi.org/10.1038/s41612-019-0089-1, 2019.
Oki, T. and Kanae, S.: Global hydrological cycles and world water resources, Science, 313, 1068–1072, https://doi.org/10.1126/science.1128845, 2006.
Rosenfeld, D., Woodley, W. L., Lerner, A., Kelman, G., and Lindsey, D. T.: Satellite detection of severe convective storms by their retrieved vertical profiles of cloud particle effective radius and thermodynamic phase, J. Geophys. Res., 113, D04208, https://doi.org/10.1029/2007JD008600, 2008.
Schumacher, R. S. and Rasmussen, K. L.: The formation, character and changing nature of mesoscale convective systems, Nat. Rev. Earth Environ., 1, 300–314, https://doi.org/10.1038/s43017-020-0057-7, 2020.
Sun, L. and Fu, Y.: A new merged dataset for analyzing clouds, precipitation and atmospheric parameters based on ERA5 reanalysis data and the measurements of the Tropical Rainfall Measuring Mission (TRMM) precipitation radar and visible and infrared scanner, Earth Syst. Sci. Data, 13, 2293–2306, https://doi.org/10.5194/essd-13-2293-2021, 2021.
Vant-Hull, B., Rossow, W., and Pearl, C.: Global Comparisons of Regional Life Cycle Properties and Motion of Multiday Convective Systems: Tropical and Midlatitude Land and Ocean, J. Climate, 29, 5837–5858, https://doi.org/10.1175/JCLI-D-15-0698.1, 2016.
Wall, C. J., Hartmann, D. L., Thieman, M. M., Smith, W. L., and Minnis, P.: The Life Cycle of Anvil Clouds and the Top-of-Atmosphere Radiation Balance over the Tropical West Pacific, J. Climate, 31, 10059–10080, https://doi.org/10.1175/JCLI-D-18-0154.1, 2018.
Wall, C. J., Norris, J. R., Gasparini, B., Smith, W. L., Thieman, M. M., and Sourdeval, O.: Observational Evidence that Radiative Heating Modifies the Life Cycle of Tropical Anvil Clouds, J. Climate, 33, 8621–8640, https://doi.org/10.1175/JCLI-D-20-0204.1, 2020.
Wang, X., Min, M., Wang, F., Guo, J., Li, B., and Tang, S.: Intercomparisons of Cloud Mask Products Among Fengyun-4A, Himawari-8, and MODIS, IEEE T. Geosci. Remote., 57, 8827–8839, https://doi.org/10.1109/TGRS.2019.2923247, 2019.
Wen, L., Zhao, K., Zhang, G., Xue, M., Zhou, B., Liu, S., and Chen, X.: Statistical characteristics of raindrop size distributions observed in East China during the Asian summer monsoon season using 2-D video disdrometer and Micro Rain Radar data, J. Geophys. Res.-Atmos., 121, 2265–2282, https://doi.org/10.1002/2015JD024160, 2016.
Wilheit, T. and Kummerow, C. D.: Use of the TRMM-PR for Estimating the TMI Beam Filling Correction, J. Meteorol. Soc. Japan Ser. II, 87A, 255–263, https://doi.org/10.2151/jmsj.87A.255, 2009.
Yang, J., Zhang, Z., Wei, C., Lu, F., and Guo, Q.: Introducing the New Generation of Chinese Geostationary Weather Satellites, Fengyun-4, B. Am. Meteorol. Soc., 98, 1637–1658, https://doi.org/10.1175/BAMS-D-16-0065.1, 2017.
Yang, Y. X.: Resilient PNT Concept Frame, J. Geod. Geoinform. Sci., 2, 1–7, https://doi.org/10.11947/j.JGGS.2019.0301, 2019.
Zhang, A., Fu, Y., Chen, Y., Liu, G., and Zhang, X.: Impact of the surface wind flow on precipitation characteristics over the southern Himalayas: GPM observations, Atmos. Res., 202, 10–22, https://doi.org/10.1016/j.atmosres.2017.11.001, 2018.
Zhang, A. Q. and Fu, Y. F.: Life Cycle Effects on the Vertical Structure of Precipitation in East China Measured by Himawari-8 and GPM DPR, Mon. Weather Rev., 146, 2183–2199, https://doi.org/10.1175/MWR-D-18-0085.1, 2018.
Zhang, A. Q., Chen, C., and Chen, Y. L.: An event-based precipitation dataset with life cycle evolution using resilient algorithms (Version 3), Zenodo [data set], https://doi.org/10.5281/zenodo.6198716, 2022.
Zhang, X., Shen, W., Zhuge, X., Yang, S., Chen, Y., Wang, Y., Chen, T., and Zhang, S.: Statistical Characteristics of Mesoscale Convective Systems Initiated over the Tibetan Plateau in Summer by Fengyun Satellite and Precipitation Estimates, Remote Sens.-Basel, 13, 1652, https://doi.org/10.3390/rs13091652, 2021.
Zhuge, X. and Zou, X.: Summertime Convective Initiation Nowcasting over Southeastern China Based on Advanced Himawari Imager Observations, J. Meteorol. Soc. Japan. Ser. II, 96, 337–353, https://doi.org/10.2151/jmsj.2018-041, 2018.