the Creative Commons Attribution 4.0 License.
the Creative Commons Attribution 4.0 License.
 | 18 Mar 2022
C3ONTEXT: a Common Consensus on Convective OrgaNizaTion during the EUREC4A eXperimenT
The C3ONTEXT (a Common Consensus on Convective OrgaNizaTion during the EUREC4A eXperimenT) dataset is presented as an overview of the mesoscale cloud patterns identified during the EUREC4A (Elucidating the role of clouds–circulation coupling in climate) field campaign in early 2020. Based on infrared and visible satellite images, 50 researchers of the EUREC4A science team manually identified the four prevailing mesoscale patterns of shallow convection observed by Stevens et al. (2020). The common consensus on the observed mesoscale cloud patterns emerging from these manual classifications is presented. It builds the basis for future studies and reduces the subjective nature of these visually defined cloud patterns. This consensus makes it possible to contextualize the measurements of the EUREC4A field campaign and interpret them in the mesoscale setting. Commonly used approaches to capture the mesoscale patterns are computed for comparison and show good agreement with the manual classifications. All four patterns as classified by Stevens et al. (2020) were present in January–February 2020, although not all were dominant during the observing period of EUREC4A. Supplemental classifications of storm-resolving simulations suggest that the latter have a limited ability to replicate the observed cloud patterns and require further research.
The full dataset including post-processed datasets for easier usage are openly available at the Zenodo archive at https://doi.org/10.5281/zenodo.5979718 (Schulz, 2022a).
- Article
(36055 KB) - Full-text XML
- BibTeX
- EndNote


Clouds are often clustered. Examples of larger clusters are squall lines and the intertropical convergence zone. But also much smaller clouds like shallow trade wind cumuli are often seen clustered on a scale of several hundred kilometers. The understanding of these mesoscale patterns of shallow convection is still sparse. However, the ubiquity of these clouds and their reoccurring structure suggest that they play an important role in determining the radiative effects of the trade wind regimes (Bony et al., 2020). The EUREC4A (Elucidating the role of clouds–circulation coupling in climate) field campaign addresses among others, the question of which processes are at play that change the mesoscale appearance of shallow convection. Prior to the campaign, studies concentrated on the classification of mesoscale patterns based on satellite images by visual inspection (Stevens et al., 2020), rule-based algorithms (Bony et al., 2020; Janssens et al., 2021), supervised neural networks (Rasp et al., 2020) and unsupervised neural networks (Denby, 2020). Most of these methods focus on four specific mesoscale cloud patterns that have been identified as commonly occurring in the North Atlantic downwind trades (Stevens et al., 2020). An overview of these four patterns which are named by their visual impressions as sugar, gravel, flowers and fish is given in Fig. 1.
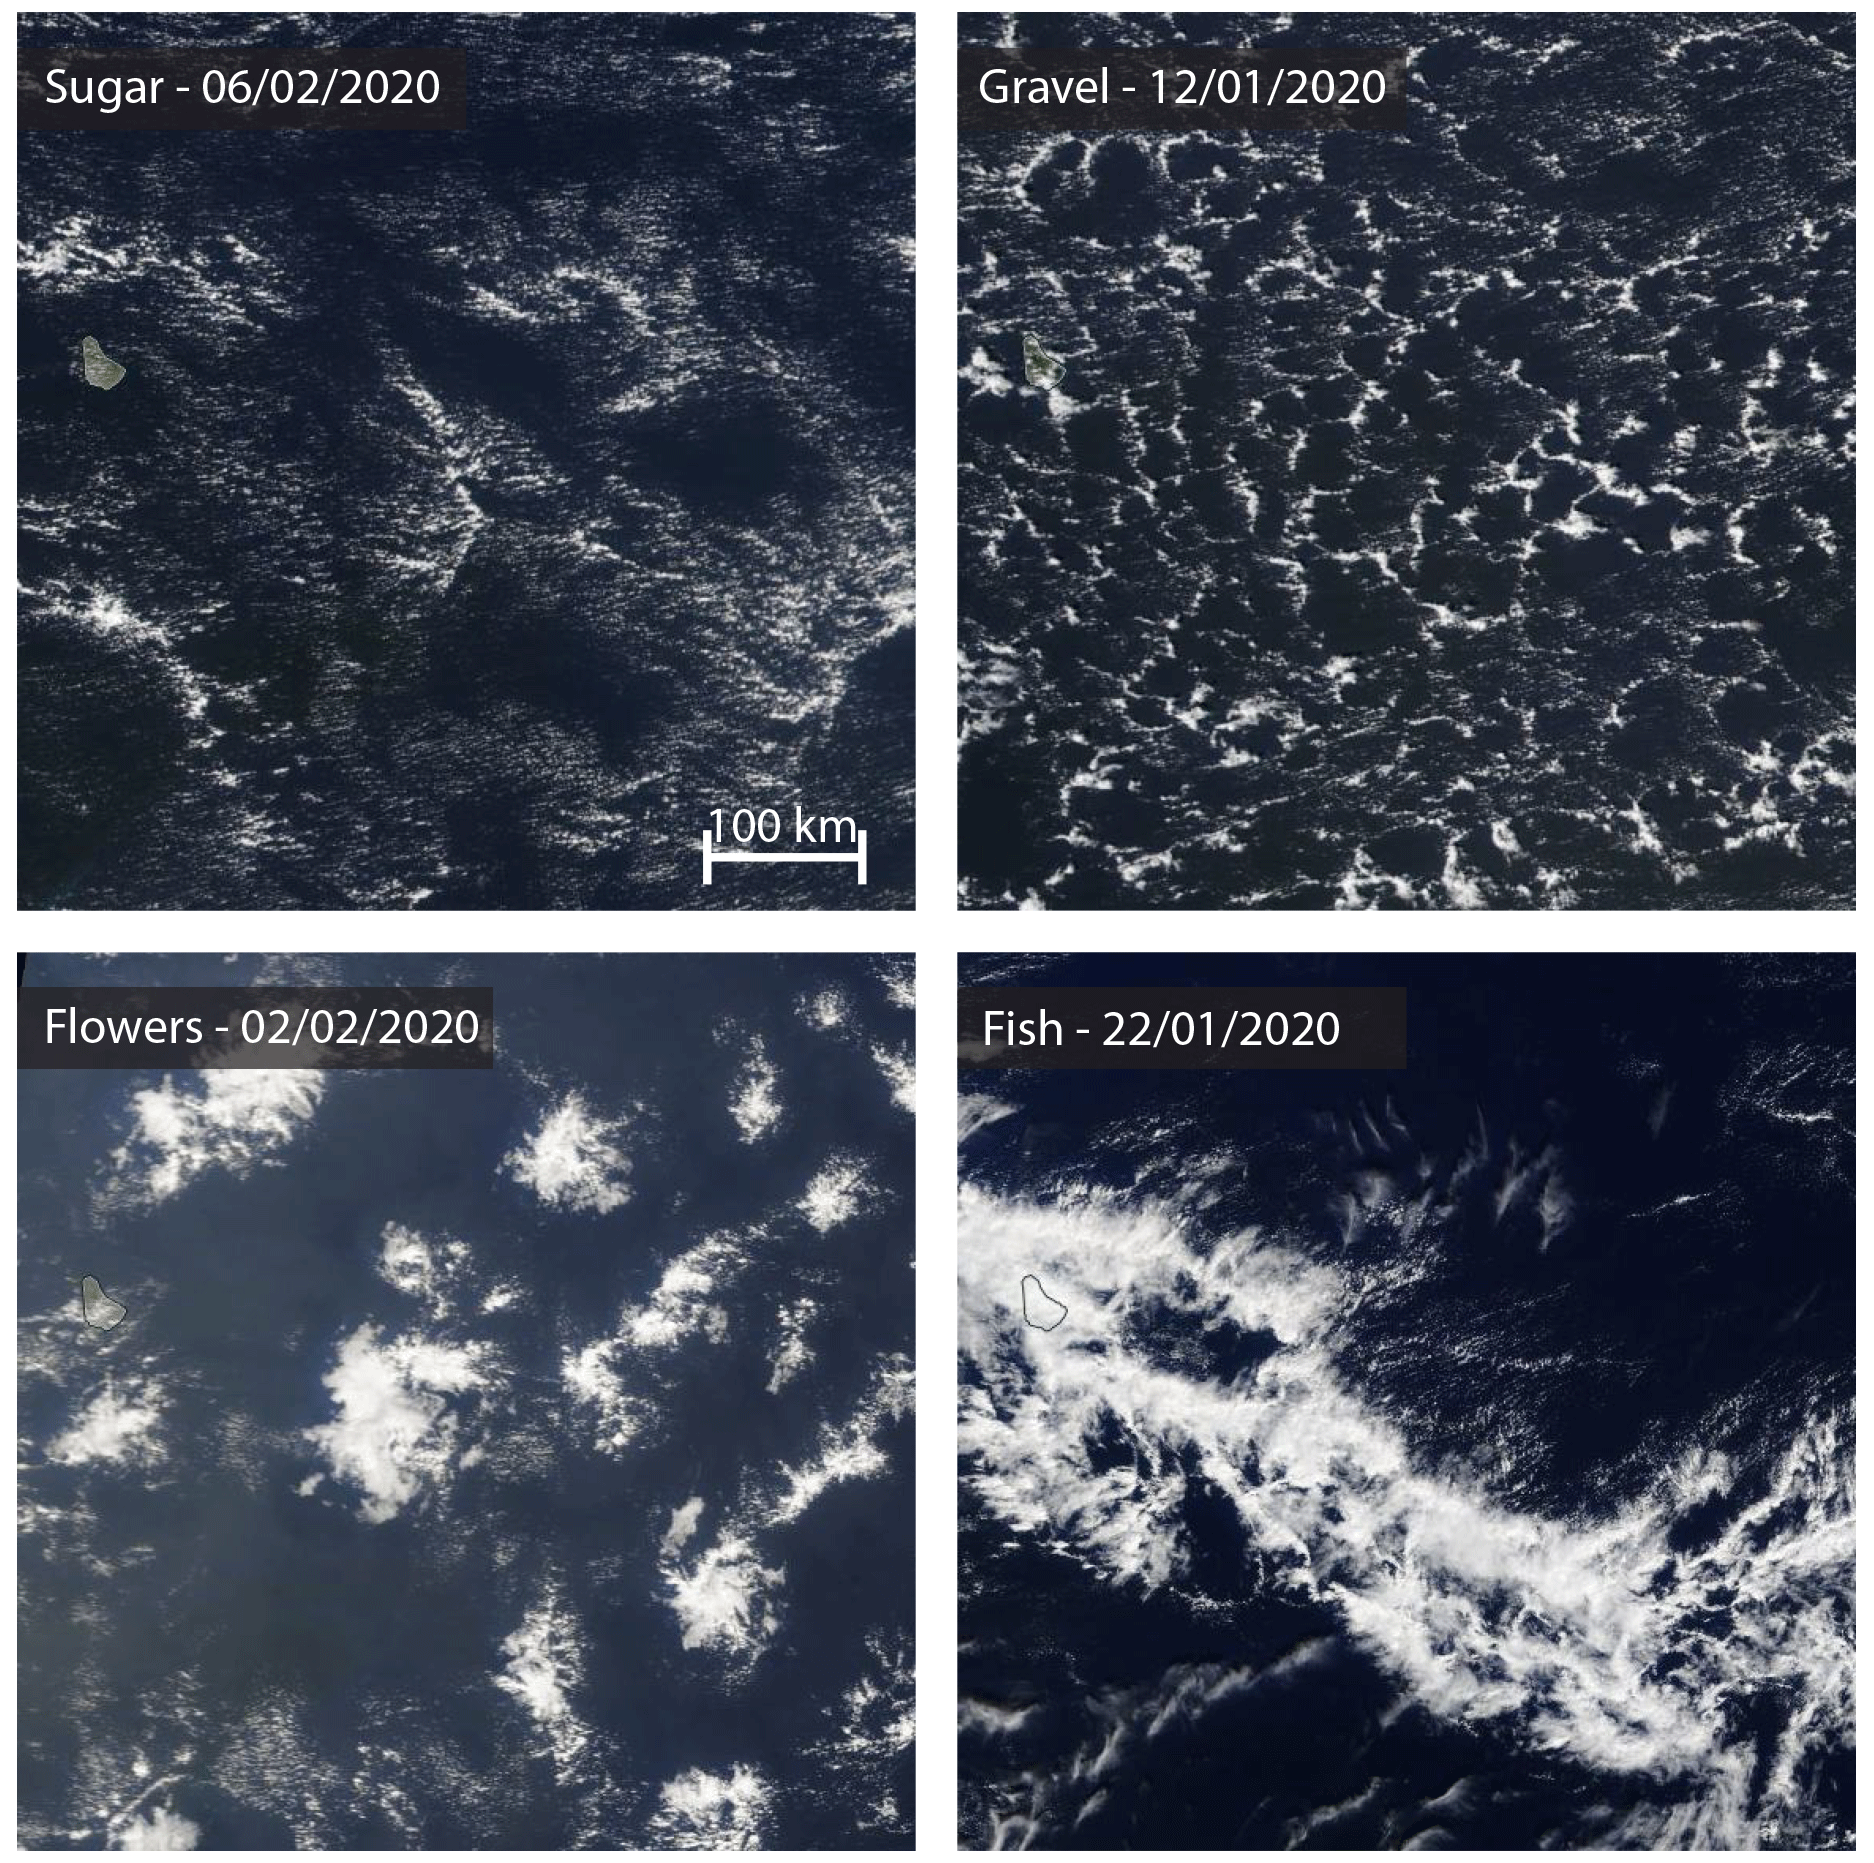
Figure 1Four classes of mesoscale patterns of shallow convection have been labeled by 50 scientists in satellite images of January and February 2020. An example of each of these classes is shown based on the reflectance measurements of the Moderate Resolution Imaging Spectroradiometer (MODIS) on board the Terra satellite (sugar and gravel) and the Visible Infrared Imaging Radiometer Suite (VIIRS) on board the Suomi National Polar-orbiting Partnership (NPP) satellite (flowers and fish). Example images provided by NASA Worldview.
These efforts show that the categorization of the mesoscale patterns is an elementary step in acquiring further knowledge about the cloud processes in the downstream trades; 50 scientists from 15 research institutes who were involved in the EUREC4A field campaign in January–February 2020 therefore participated in a joint online classification event. The results of this classification event are presented here. Due to the high attendance, the presented dataset can be interpreted as the common judgment of the EUREC4A science team on the mesoscale patterns of shallow convection in the wider trades during EUREC4A. The studied domain of 5–20∘ N, 62–40∘ W contains the entire research area, including both the Tradewind Alley in the north (12.5–14.5∘ N) and the Boulevard des Tourbillons close to the coast of South America (Stevens et al., 2021). This dataset therefore allows for consistently communicating about the otherwise subjectively defined patterns and puts the measurements taken during EUREC4A into their mesoscale context to advance the process understanding of shallow convection in the trades. The need for a better process understanding is highlighted by a supplemental classification of storm-resolving simulations covering the same time period.
The paper is structured as follows: the dataset and its collection are described in Sect. 2. Potential use cases are described in Sect. 3. In Sect. 4 additional classification methods that are able to detect the four mesoscale patterns are applied to the EUREC4A time period and compared to the manual classifications described in this paper. We conclude with Sect. 6.
The manual classifications were gathered through the online platform https://www.zooniverse.org/ (last access: 1 July 2020), which has already been successfully used in an earlier project by Rasp et al. (2020). The platform makes it possible to crowdsource labels for, e.g., machine learning projects. Additional workflows can be defined to separate different image sources or to separate, for example, labels made during a practice run from those that belong to the actual classification. The former allowed everyone to familiarize themselves with the https://www.zooniverse.org/ platform without influencing the results.
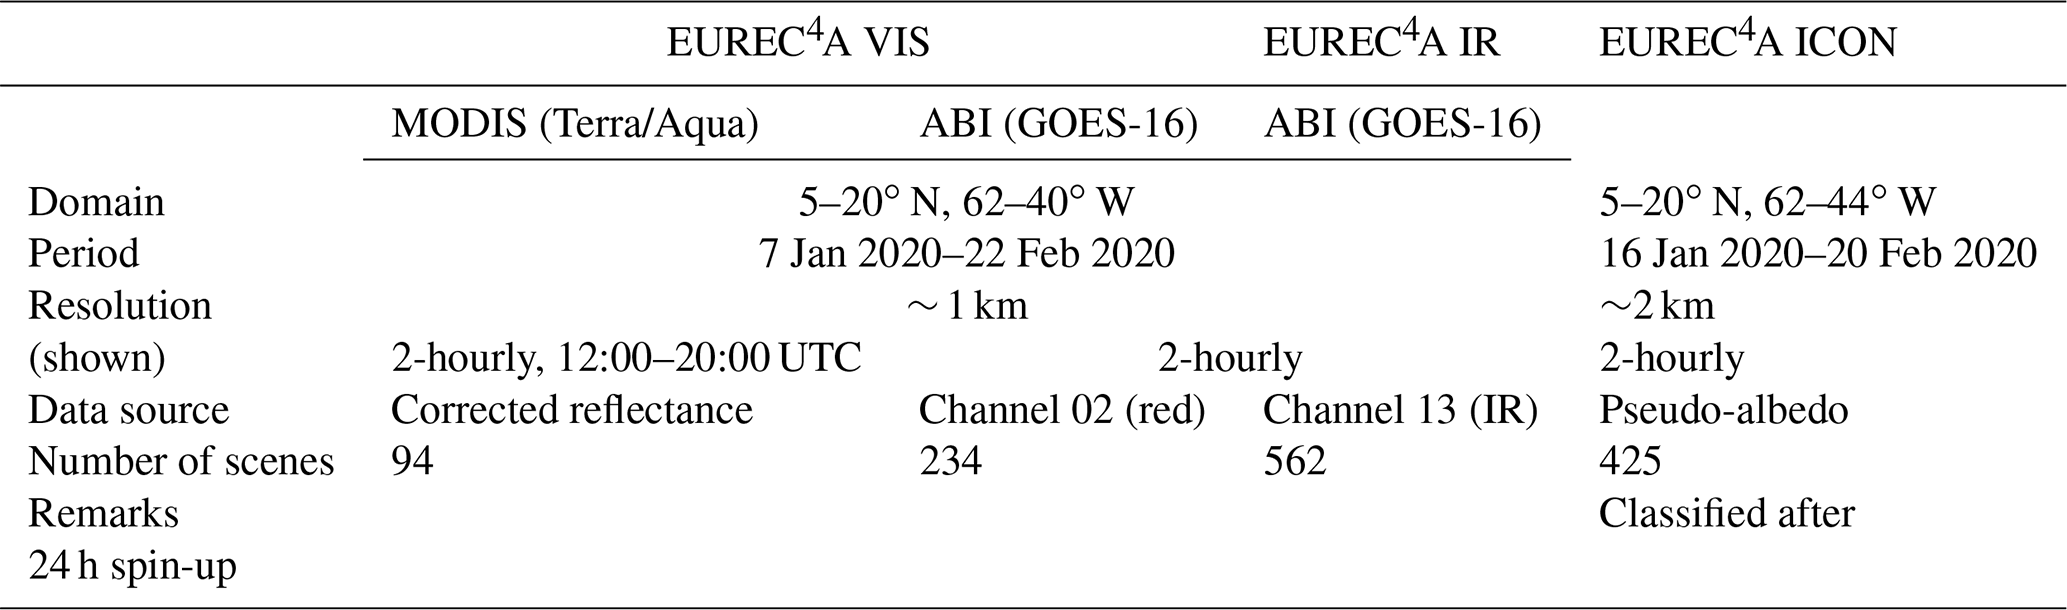
For this dataset, we defined three workflows. Two workflows are based on satellite observations. The first one is based on the visible channels of both the GOES-16 (Geostationary Operational Environmental Satellite) ABI (Advanced Baseline Imager) and MODIS on board the Aqua and Terra satellites and is called EUREC4A VIS. The second one is based on the “clean” infrared channel (channel 13) of GOES-16 ABI only (EUREC4A IR). To test how well storm-resolving simulations are able to reproduce the observed patterns, we included another workflow, EUREC4A ICON, which is based on ICON (ICOsahedral Nonhydrostatic) storm-resolving simulations covering the EUREC4A time period. The simulation has a grid spacing of 1.25 km and was initialized daily by the European Centre for Medium-Range Weather Forecasts Integrated Forecasting System (ECMWF IFS) and forced hourly. Each run is 48 h long. The first 24 h were discarded to allow for spin-up.
To visualize the simulation output, we calculated a pseudo-albedo α by following the approximation of Zhang et al. (2005):
where τ is the optical depth, LWP is the liquid water vapor path and N is an assumed cloud droplet number density. Here a number density of 70 cm−3 is used, which is at the lower end of the observed concentrations (Siebert et al., 2013).
All workflows are further described in Table 1.
Table 1Description of data sources used to create the images of the classification workflows.
On 24 March 2020 the international, virtual classification event was hosted with 50 scientists from 15 institutes participating in the creation of the pattern classifications. For a full day the participants classified patterns of shallow trade wind convection by labeling, i.e., drawing rectangles of variable sizes around, the four common types: sugar, gravel, flowers and fish (Stevens et al., 2020).
In the end, over 12 500 labels were gathered. The observational workflows got the majority of the labels (see Fig. 2) because the identification of the patterns in the model simulation was too demanding. The cloud features in the simulations had too little similarity with those found in nature. By comparing the distribution of labels in the individual workflows, Fig. 2 reveals that sugar was disproportionately rarely identified in the ICON simulations. The largest feature, like fish, however, has been identified more often. This supports the assumption that larger features are better reproduced in storm-resolving simulations than features of smaller scales, like sugar.
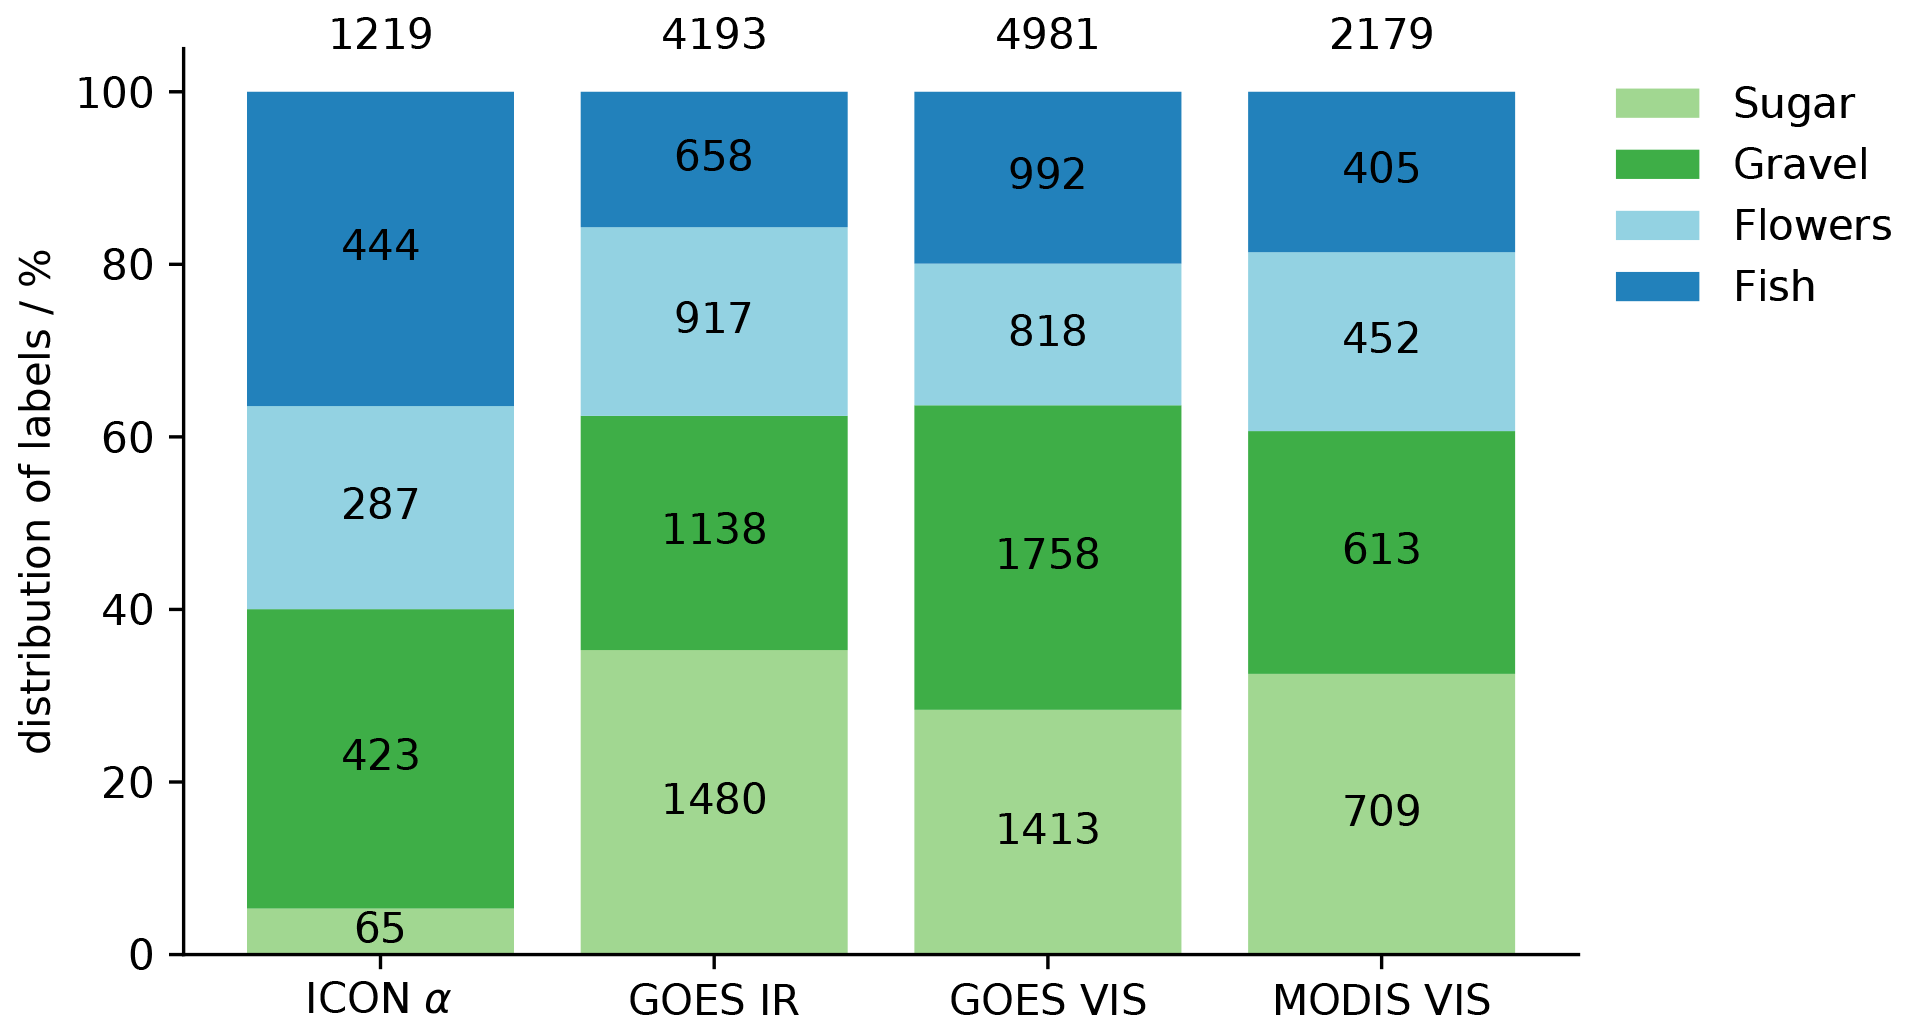
Figure 2Distribution of labels by data source. The relative distribution is shown on the y axis, while the absolute number of labels is indicated within each bar. The total number of labels per workflow is shown on the top of each bar.
Because all users have familiarity with the patterns either by previous work and/or being involved in the classification event of Rasp et al. (2020), it can be assumed that the labels are of high quality. In addition, they were trained immediately before starting the classification through an online presentation to get familiar with the labeling interface on https://www.zooniverse.org/ and to once more refresh the different mesoscale cloud pattern categories. Compared to Rasp et al. (2020), where the focus has been to classify as many diverse cloud scenes as possible to capture nature's variability and thus serve as a better machine learning dataset, the aim for this dataset is to create a common classification dataset for the EUREC4A time period that participating scientists agree on and can directly be used in further studies. Therefore, the temporal frequency has been increased from daily cloud scenes to 2-hourly cloud scenes to reflect also the changes on the sub-daily scale such as those identified by Vial et al. (2021). Due to this design difference, a single day is now on average classified 20 times in case of the visible workflow instead of just about 6 (3 per each daytime Aqua/Terra satellite overpass) as in Rasp et al. (2020). Each individual image is however still viewed about 3 times.

Figure 3Overview of processing levels of the datasets including the variable names used in the respective datasets.
After the joint classification event, over 12 500 labels were processed to make them more user friendly, especially because the raw data miss temporal and geospatial information. The processing steps with the intermediate products are illustrated in Fig. 3 and described as follows:
-
Level 0. The level 0 dataset consists of the raw data output and originates from the Zooniverse platform. It consists of CSV (comma-separated values) files that contain entries for each workflow, image (subject) and classification including technical details like the time spent on drawing a specific label. Labels are given by their origin (x,y) and their height (h) and width (w) given in pixel coordinates.
-
Level 1. The level 1 dataset is further processed and combines the information distributed over the level 0 dataset files. It contains each label as a separate entry and contains information about the classified object, the user, and the geographical and Cartesian coordinates of the label. This product is saved in a netCDF (Network Common Data Form) file.
-
Level 2. For the level 2 dataset, the data are merged by
classification_id.The
classification_idis a unique identifier of a classification, where a classification refers here to the process of labeling a single image by a single user. The user might use several labels of the same or a different kind to completely classify a scene. This process eliminates overlaps of same-user classifications for each pattern and turns the data into masks rather than coordinates (see Fig. 3). In cases where same-user classifications of different patterns overlap, the overlapping region is counted towards all classified patterns. This case is not handled specifically, as it shows the uncertainty a user had to classify a specific region as one or the other pattern. Masks have the advantage of being more easily queried whether a specific location is influenced by a mesoscale pattern or not. This product is saved in the Zarr format. -
Level 3. To make working with the dataset easier, the percentage of agreement (p) among users on a specific pattern on each location is calculated and saved as level 3 data for each workflow. It is calculated as follows:
where U is the number of users that have seen the particular image; c is the classification mask from the level 2 data; and i,j is the geographic coordinates. Because the labels of users that attributed several classes to a single pixel are not removed, ∑p can be greater than 100 %. An additional unclassified category is introduced to capture the agreement on unclassified regions, which is implicitly visible in, e.g., Fig. 4. Figure 4 shows how participants agreed on the different patterns on 12 February depending on the workflow. This figure is continued in Appendix A, where this overview of daily averaged classifications is given for each day to give an impression of the dataset and in particular the presence and distribution of mesoscale patterns during the EUREC4A field campaign. This product is saved in the Zarr format.
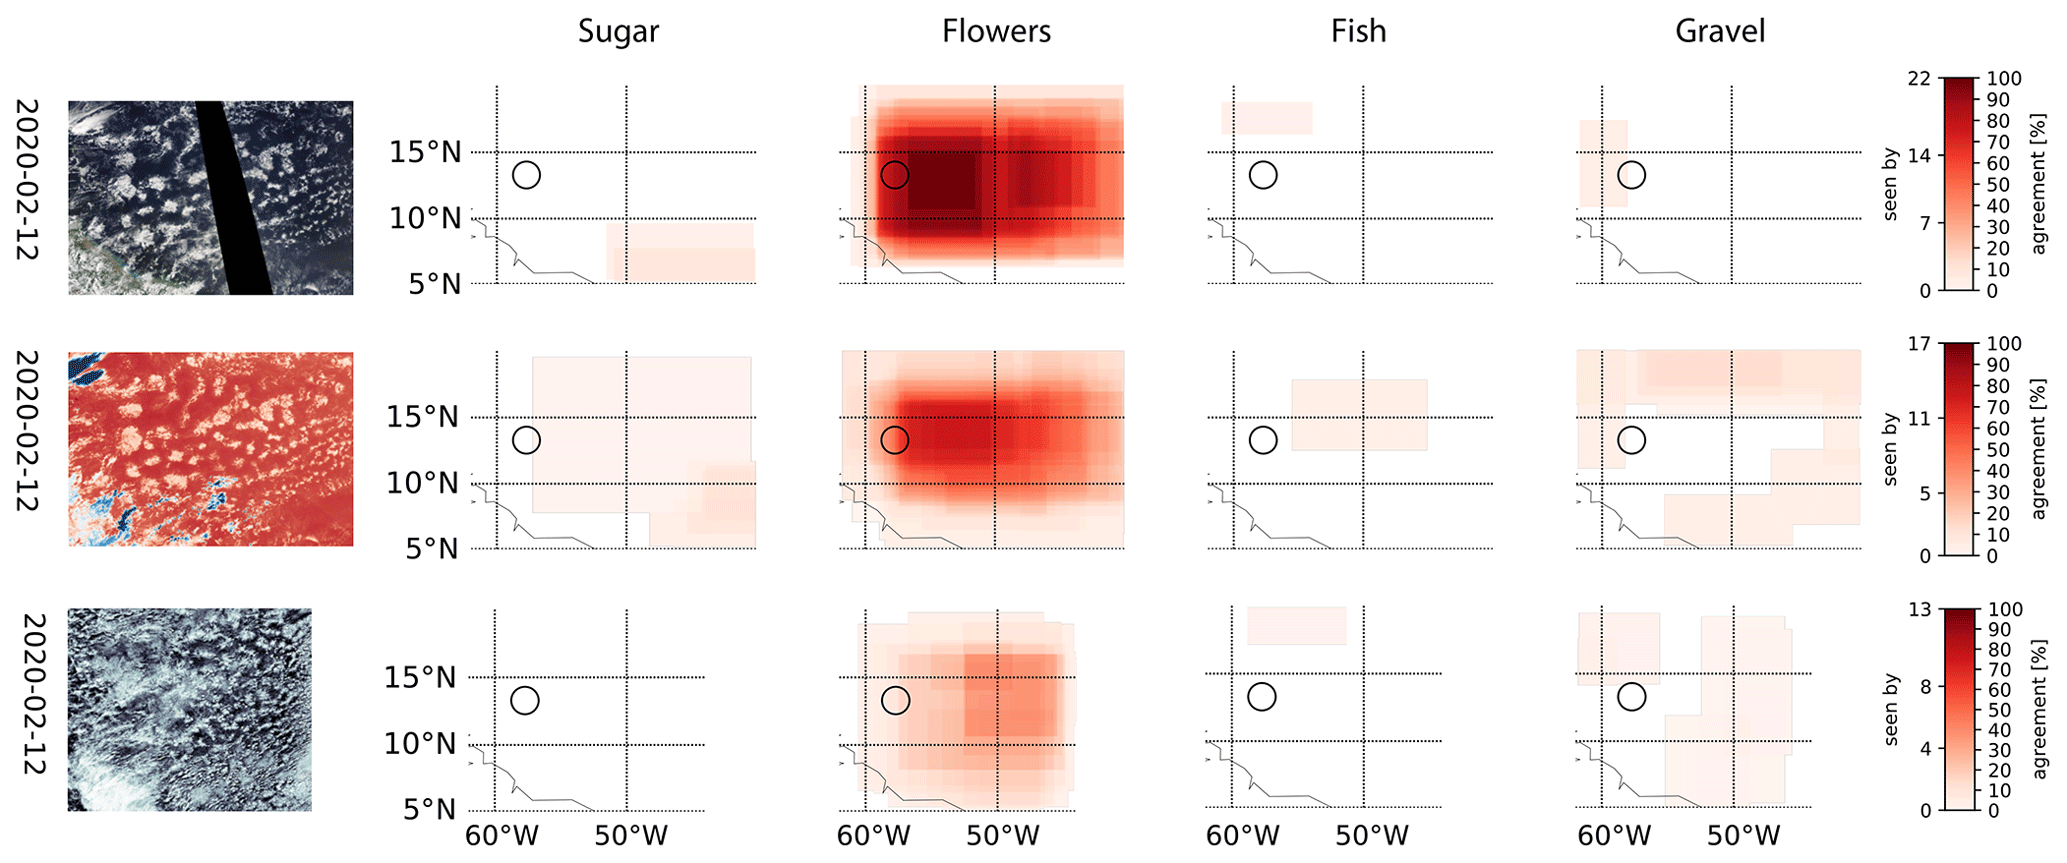
Figure 4Manual-classification examples for the three workflows (top to bottom: visible, infrared and simulation). The labels for each pattern (from left to right: sugar, flowers, fish and gravel) are shown next to the labeled image. Coastline of South America is marked in black. The circle marks the EUREC4A circle, one focus area of the EUREC4A field campaign and the main flight pattern of the participating research aircraft HALO (High Altitude and LOng Range Research Aircraft) (Konow et al., 2021). Coastlines are based on GSHHG (Global Self-consistent, Hierarchical, High-resolution Shorelines) shapefiles (Wessel and Smith, 1996). Please note that the date format in this figure is year-month-day.
The EUREC4A field campaign has been an international study with a wide range of research platforms and many minor objectives (Stevens et al., 2021). This dataset covers not only the core area of the experiment but also the wider area and time period. While the participating research airplanes and drones were mostly staying in the trade winds, some research vessels conducted measurements as far south as 6.5∘ N.
This dataset gives the opportunity to study all these measurements in the context of the mesoscale patterns observed in the downwind trades. Due to the high subjectivity of these mesoscale cloud pattern definitions, it is of particular importance to discuss results based on a common consensus to keep studies comparable. The C3ONTEXT dataset can serve as such a reference for the period of the EUREC4A field campaign.
Figure 5 shows the mesoscale context for three platforms participating in EUREC4A and representing different measurement strategies (see Stevens et al., 2021, for a complete list of platforms). Based on the classifications of the infrared workflow, the daily changes in the cloud patterns become apparent. The infrared workflow is preferred over the visible one because it covers both day and night and is therefore able to also capture the dial nature of the patterns (Vial et al., 2021). Before the intense observation period (IOP), 20 January to 20 February, the prevailing cloud pattern at the Barbados Cloud Observatory was gravel. With the start of the IOP, fish was detected most in the research area. After 24 January, patterns were much less widespread and well defined such that there was more disagreement on the patterns. This transition is independent of the location. Both the platforms in the north as well as R/V Atalante, which sailed further south in the Boulevard des Tourbillons (eddy boulevard), which is defined by Stevens et al. (2021) as the area of the coastline of Brazil where the North Brazil Current (NBC) rings occur, were embedded in a similar transition. The reduced frequency of classifications towards the end of the IOP around 15 February are caused by mid-level clouds obscuring the view of shallow convection.
In Appendix A the level 3 products are visualized for each studied day and can be used as a lookup table to quickly identify if a pattern has been identified at a specific time and place.

Figure 5Exemplary use case of level 3 data: mesoscale setting of research platforms during EUREC4A based on the EUREC4A IR workflow (a–c: Barbados Cloud Observatory (BCO), R/V Meteor and R/V Atalante). Please note that the date format in this figure is day.month.
Several methods have been developed to describe the mesoscale structure of shallow convection (Wood and Hartmann, 2006; Rasp et al., 2020; Bony et al., 2020; Denby, 2020). Here we focus on the comparison of the manual classifications with two other methods that specifically aim to detect the four mesoscale patterns of the downwind trades as defined by Stevens et al. (2020) and shown in Fig. 1. Bony et al. (2020) combined a measure of organization (Iorg, Tompkins and Semie, 2017) with the mean cluster size (S), while Rasp et al. (2020) developed a deep neural network to detect the patterns. Although Janssens et al. (2021) show that different combinations of metrics, like cloud fraction and fractal dimension, better describe the variance in a cloud field, the pair of Iorg and mean cluster size has been widely used and is considered here for better comparison.
To assess the agreement between the different classification methods, we compare the method of Bony et al. (2020) and a deep neural network based on Rasp et al. (2020) that detects the patterns in geostationary infrared images of GOES-16 ABI (Schulz et al., 2021) instead of visible images taken on board the polar-orbiting satellites Terra and Aqua. It should be noted that this deep neural network has not been trained with the manual classifications presented here but with the manual classifications of Rasp et al. (2020) which cover older years and included different geographical regions. The network is identical to the one used in Schulz et al. (2021).
Because the measure is sensitive to the domain size, we compute these metrics over a 10×10∘ sub-domain and consider only classifications within this domain for the comparison. Specifically, we focus on the region 10–20∘ N, 58–48∘ W. This domain size ensures that Iorg describes the organization on the mesoscale and the cloud patterns we are interested in. The method has been successfully used in this domain in Bony et al. (2020) and applied accordingly. Brightness temperatures between 280 and 290 K are regarded as clouds. Days where the 25th percentile of brightness temperatures within any satellite image is lower than 285 K are discarded to avoid a bias by high clouds.
Figure 6Comparison of the Iorg versus mean cluster size (S) classification method and the (a) manually classified patterns and (b) the neural network classifications. For each classification, the manually/automatically classified pattern area for each pattern is indicated as wedges of different sizes. Mean cluster size is given as a fraction of the domain size and multiplied by 104 to be consistent with Bony et al. (2020). Grey areas indicate the middle terciles of Iorg and S and are the bounds of the four pattern quadrants. All classifications are based on the GOES-16 ABI infrared images and are daily averages.
Figure 6 shows the comparison of the different methods. From the appearance of the patterns, we expect gravel and flowers to be rather regularly distributed and therefore to have a lower Iorg compared to fish and sugar. It should be noted that Iorg is calculated based on a threshold in brightness temperature, and therefore only the deeper clouds in the sugar field are considered leading to a higher Iorg value than one would expect from an otherwise rather randomly distributed cloud field. The mean cluster size should be small for sugar and gravel and larger for flowers and fish.
Indeed, the pattern area fraction maximizes for each pattern in the respective quadrant of the space independent of the classification method. Gravel classifications dominate the lower-left quadrant; sugar dominates the upper-left quadrant; and fish dominates the upper-right one. Flowers are harder to associate with a quadrant, as they are more centered. In general, the distribution has a large range of values for small mean cluster sizes and narrows with increasing mean cluster size.
This is also in alignment with Bony et al. (2020), where the lower-right quadrant includes not only flowers but also about 35 % of the fish cases (their Fig. 1c). Flowers' cloud entities are generally smaller than those of the fish pattern and therefore cannot separate very well from the other patterns.
Figure 7Time series of the area fraction covered by each pattern as identified in the workflows EUREC4A VIS (first bar), EUREC4A IR (second bar), EUREC4A ICON (third bar) and the deep neural network trained for the infrared classification of cloud patterns (fourth bar in a) within the area of 10–20∘N, 58–48∘ W. Thresholds of 0.1 (a) and 0.5 (b) have been applied to the percentage of agreement of the manual classifications and visualize that the overlap of different categories (cumulative area fractions above 1) is eliminated in the latter. Please note that the date format in this figure is year-month-day.
Figure 7 reveals the time series of the area fraction covered by the mesoscale patterns within the region of 10–20∘ N, 58–48∘ W and identified by the different classification approaches. For a better comparison with the EUREC4A VIS workflow, Fig. 7 is only based on daytime classifications (12:00–20:00 UTC).
To convert the agreement on patterns in the level 3 dataset into actual classifications, we applied a threshold of 0.1 to the percent agreement so that at least 10 % of participants who viewed a given scene must have agreed on a pattern. Agreement below this threshold is treated as an unclassified region. This threshold should be seen as a lower bound and is only used to reduce the noise of the classifications. For comparison, we also apply a stricter threshold of 0.5, which removes most of the overlap (Fig. 7b). The overall day-to-day changes remain robust. Figure 7 shows that in January–February 2020 all patterns were dominant at least once. It also shows that abrupt day-to-day changes of dominant patterns are rather rare, and a smooth transition from gravel to fish to sugar to flowers is observed.
Overall, the different classification methods agree well with each other, and no large discrepancies are found. This confirms that these methods are valid for further analysis of mesoscale patterns. While the metric is computationally cheap and can be easily applied to different regions, it is less suitable for short time periods because the terciles that attribute the pairs to specific quadrants are not robust for a small sample size. Terciles from other studies can only be used if the resolution of the dataset is the same. For short time periods, like those of typical campaigns where people are interested in specific days or even sub-daily variations, manual classifications are advantageous, as they do not require a large sample size. The neural network approach presents a good opportunity to extend the classifications to different time periods and regions by using manual classifications as a training set. Here, the manual classifications served as an additional independent validation dataset and proved once more the capabilities of the neural network which has been trained on the dataset of Rasp et al. (2020).
The C3ONTEXT dataset including raw data is openly available on the Zenodo database (European Organization For Nuclear Research and OpenAIRE, 2013; https://doi.org/10.5281/zenodo.5979718, Schulz, 2022a). The source code necessary to generate the dataset is available at https://doi.org/10.5281/zenodo.5989155 (Schulz, 2022b) together with examples on how to process the data and retrieve the classifications for any platform as shown in, e.g., Fig. 5.
Mesoscale patterns of shallow convection are a main focus of the EUREC4A field campaign that took place in January and February 2020. To gain a better process understanding of shallow convection in the trades, the classifications of mesoscale patterns offer the opportunity to study the measurements in their mesoscale context and thereby split the observations into less complex pieces and disentangle otherwise superimposed processes. Here, we present C3ONTEXT, a dataset on the common consensus on the mesoscale patterns which occurred during the broader EUREC4A time period and emerges from the manual classifications done by members of the EUREC4A science team.
C3ONTEXT reveals that all mesoscale cloud patterns are observed during the studied period of January and February 2020. However, in the intense observation period of the EUREC4A field campaign, 20 January to 20 February, gravel was only sporadically identified and not prevalent in the study area. In contrast, a week before the intense observation period, gravel dominated in the research area. Instruments that were already running at this time, like those at the Barbados Cloud Observatory, were able to gain measurements under the mesoscale influence of gravel and complement the measurements from the IOP.
The difficulties of the participants to classify the patterns in the output of a storm-resolving simulation demands further investigation into how well simulations can capture the variability of mesoscale patterns of shallow convection in the trades.
A comparison of the manual-classification approach with other methods used in the literature to identify the four mesoscale patterns of shallow convection reveals a generally good agreement and confirms the validity of the different approaches. Nevertheless, the manual classifications are beneficial for limited temporal and spatial studies especially when the classifications are done by a group of several trained scientists. This presents a way to gain a consensus of subjectively defined cloud patterns without an additional layer of complexity from a neural network or any other algorithm.
In general, it has been shown that with little effort, classifications of the cloud field are possible and can be a huge benefit for the community, encouraging this approach for future studies.
Figure A1Heatmaps of manual classifications based on MODIS (Aqua and Terra) visible imagery. Left to right: visible imagery during an Aqua overpass and user agreement on sugar, flowers, fish and gravel. The circle marks one focus area of the EUREC4A field campaign and the main flight pattern of the participating research aircraft HALO (Konow et al., 2021). Coastlines are based on GSHHG shapefiles (Wessel and Smith, 1996). Please note that the date format in this figure is year-month-day.

Figure A2As Fig. but for the infrared workflow. Images show the cloud field at 16:00 (except 11 February 2020 at 17:00). Please note that the date format in this figure is year-month-day.
Figure A3As Fig. but for the ICON albedo workflow. Images show the cloud field at midnight. Please note that the date format in this figure is year-month-day.
The contact author has declared that there are no competing interests.
Publisher’s note: Copernicus Publications remains neutral with regard to jurisdictional claims in published maps and institutional affiliations.
This article is part of the special issue “Elucidating the role of clouds–circulation coupling in climate: datasets from the 2020 (EUREC4A) field campaign”. It is not associated with a conference.
The author thanks the participants of the international remote classification event for their time in labeling the cloud patterns. Daniel Klocke is thanked for conducting the ICON storm-resolving simulations. Geet George is thanked for helpful feedback on an earlier version of this paper. Leif Denby, Isabel L. McCoy and one additional anonymous reviewer are thanked for their valuable feedback that helped to improve the paper. We acknowledge the use of imagery from the NASA Worldview application (https://worldview.earthdata.nasa.gov, last access: 23 March 2020), part of the NASA Earth Observing System Data and Information System (EOSDIS). GOES-16 Advanced Baseline Imager data are available at https://doi.org/10.7289/V5BV7DSR. Its level 1b radiances were converted with Raspaud et al. (2019) to brightness temperatures. This publication uses data generated via the https://www.zooniverse.org/ platform, development of which is funded by generous support, including a Global Impact Award from Google and by a grant from the Alfred P. Sloan Foundation.
This paper was edited by Gijs de Boer and reviewed by Leif Denby, Isabel L. McCoy, and one anonymous referee.
Bony, S., Schulz, H., Vial, J., and Stevens, B.: Sugar, Gravel, Fish, and Flowers: Dependence of Mesoscale Patterns of Trade-Wind Clouds on Environmental Conditions, Geophys. Res. Lett., 47, e2019GL085988, https://doi.org/10.1029/2019GL085988, 2020. a, b, c, d, e, f, g, h
Denby, L.: Discovering the Importance of Mesoscale Cloud Organization Through Unsupervised Classification, Geophys. Res. Lett., 47, e2019GL085190, https://doi.org/10.1029/2019GL085190, 2020. a, b
European Organization For Nuclear Research and OpenAIRE: Zenodo, https://doi.org/10.25495/7GXK-RD71, 2013. a
Janssens, M., de Arellano, J. V.-G., Scheffer, M., Antonissen, C., Siebesma, A. P., and Glassmeier, F.: Cloud Patterns in the Trades Have Four Interpretable Dimensions, Geophys. Res. Lett., 48, e2020GL091001, https://doi.org/10.1029/2020GL091001, 2021. a, b
Konow, H., Ewald, F., George, G., Jacob, M., Klingebiel, M., Kölling, T., Luebke, A. E., Mieslinger, T., Pörtge, V., Radtke, J., Schäfer, M., Schulz, H., Vogel, R., Wirth, M., Bony, S., Crewell, S., Ehrlich, A., Forster, L., Giez, A., Gödde, F., Groß, S., Gutleben, M., Hagen, M., Hirsch, L., Jansen, F., Lang, T., Mayer, B., Mech, M., Prange, M., Schnitt, S., Vial, J., Walbröl, A., Wendisch, M., Wolf, K., Zinner, T., Zöger, M., Ament, F., and Stevens, B.: EUREC4A's HALO, Earth Syst. Sci. Data, 13, 5545–5563, https://doi.org/10.5194/essd-13-5545-2021, 2021. a, b
Rasp, S., Schulz, H., Bony, S., and Stevens, B.: Combining Crowdsourcing and Deep Learning to Explore the Mesoscale Organization of Shallow Convection, B. Am. Meteorol. Soc., 101, E1980–E1995, https://doi.org/10.1175/BAMS-D-19-0324.1, 2020. a, b, c, d, e, f, g, h, i, j
Raspaud, M., Hoese, D., Lahtinen, P., Dybbroe, A., Finkensieper, S., Roberts, W., Rasmussen, L. Ø., Proud, S., Joro, S., Daruwala, R., Holl, G., Jasmin, T., BENR0, Leppelt, T., Egede, U., Garcia, R. K., Itkin, M., LTMeyer, Sigurðsson, E., Radar, S., Division, N., Aspenes, T., hazbottles, ColinDuff, joleenf, Cody, clementi, l., Honnorat, M., Schulz, H., Hatt, B., and Valentino, A.: Pytroll/Satpy: Version 0.16.0, Zenodo [code], https://doi.org/10.5281/zenodo.3250583, 2019. a
Schulz, H.: C3ONTEXT: A Common Consensus on Convective OrgaNizaTion during the EUREC4A eXperimenT, Zenodo [data set], https://doi.org/10.5281/zenodo.5979718, 2022a. a, b
Schulz, H.: C3ONTEXT: A Common Consensus on Convective OrgaNizaTion during the EUREC4A eXperimenT, Zenodo [code], https://doi.org/10.5281/zenodo.5989155, 2022b. a
Schulz, H., Eastman, R., and Stevens, B.: Characterization and Evolution of Organized Shallow Convection in the Downstream North Atlantic Trades, J. Geophys. Res.-Atmos., 126, e2021JD034575, https://doi.org/10.1029/2021JD034575, 2021. a, b
Siebert, H., Beals, M., Bethke, J., Bierwirth, E., Conrath, T., Dieckmann, K., Ditas, F., Ehrlich, A., Farrell, D., Hartmann, S., Izaguirre, M. A., Katzwinkel, J., Nuijens, L., Roberts, G., Schäfer, M., Shaw, R. A., Schmeissner, T., Serikov, I., Stevens, B., Stratmann, F., Wehner, B., Wendisch, M., Werner, F., and Wex, H.: The fine-scale structure of the trade wind cumuli over Barbados – an introduction to the CARRIBA project, Atmos. Chem. Phys., 13, 10061–10077, https://doi.org/10.5194/acp-13-10061-2013, 2013. a
Stevens, B., Bony, S., Brogniez, H., Hentgen, L., Hohenegger, C., Kiemle, C., L'Ecuyer, T. S., Naumann, A. K., Schulz, H., Siebesma, P. A., Vial, J., Winker, D. M., and Zuidema, P.: Sugar, Gravel, Fish and Flowers: Mesoscale Cloud Patterns in the Trade Winds, Q. J. Roy. Meteor. Soc., 146, 141–152, https://doi.org/10.1002/qj.3662, 2020. a, b, c, d, e, f
Stevens, B., Bony, S., Farrell, D., Ament, F., Blyth, A., Fairall, C., Karstensen, J., Quinn, P. K., Speich, S., Acquistapace, C., Aemisegger, F., Albright, A. L., Bellenger, H., Bodenschatz, E., Caesar, K.-A., Chewitt-Lucas, R., de Boer, G., Delanoë, J., Denby, L., Ewald, F., Fildier, B., Forde, M., George, G., Gross, S., Hagen, M., Hausold, A., Heywood, K. J., Hirsch, L., Jacob, M., Jansen, F., Kinne, S., Klocke, D., Kölling, T., Konow, H., Lothon, M., Mohr, W., Naumann, A. K., Nuijens, L., Olivier, L., Pincus, R., Pöhlker, M., Reverdin, G., Roberts, G., Schnitt, S., Schulz, H., Siebesma, A. P., Stephan, C. C., Sullivan, P., Touzé-Peiffer, L., Vial, J., Vogel, R., Zuidema, P., Alexander, N., Alves, L., Arixi, S., Asmath, H., Bagheri, G., Baier, K., Bailey, A., Baranowski, D., Baron, A., Barrau, S., Barrett, P. A., Batier, F., Behrendt, A., Bendinger, A., Beucher, F., Bigorre, S., Blades, E., Blossey, P., Bock, O., Böing, S., Bosser, P., Bourras, D., Bouruet-Aubertot, P., Bower, K., Branellec, P., Branger, H., Brennek, M., Brewer, A., Brilouet, P.-E., Brügmann, B., Buehler, S. A., Burke, E., Burton, R., Calmer, R., Canonici, J.-C., Carton, X., Cato Jr., G., Charles, J. A., Chazette, P., Chen, Y., Chilinski, M. T., Choularton, T., Chuang, P., Clarke, S., Coe, H., Cornet, C., Coutris, P., Couvreux, F., Crewell, S., Cronin, T., Cui, Z., Cuypers, Y., Daley, A., Damerell, G. M., Dauhut, T., Deneke, H., Desbios, J.-P., Dörner, S., Donner, S., Douet, V., Drushka, K., Dütsch, M., Ehrlich, A., Emanuel, K., Emmanouilidis, A., Etienne, J.-C., Etienne-Leblanc, S., Faure, G., Feingold, G., Ferrero, L., Fix, A., Flamant, C., Flatau, P. J., Foltz, G. R., Forster, L., Furtuna, I., Gadian, A., Galewsky, J., Gallagher, M., Gallimore, P., Gaston, C., Gentemann, C., Geyskens, N., Giez, A., Gollop, J., Gouirand, I., Gourbeyre, C., de Graaf, D., de Groot, G. E., Grosz, R., Güttler, J., Gutleben, M., Hall, K., Harris, G., Helfer, K. C., Henze, D., Herbert, C., Holanda, B., Ibanez-Landeta, A., Intrieri, J., Iyer, S., Julien, F., Kalesse, H., Kazil, J., Kellman, A., Kidane, A. T., Kirchner, U., Klingebiel, M., Körner, M., Kremper, L. A., Kretzschmar, J., Krüger, O., Kumala, W., Kurz, A., L'Hégaret, P., Labaste, M., Lachlan-Cope, T., Laing, A., Landschützer, P., Lang, T., Lange, D., Lange, I., Laplace, C., Lavik, G., Laxenaire, R., Le Bihan, C., Leandro, M., Lefevre, N., Lena, M., Lenschow, D., Li, Q., Lloyd, G., Los, S., Losi, N., Lovell, O., Luneau, C., Makuch, P., Malinowski, S., Manta, G., Marinou, E., Marsden, N., Masson, S., Maury, N., Mayer, B., Mayers-Als, M., Mazel, C., McGeary, W., McWilliams, J. C., Mech, M., Mehlmann, M., Meroni, A. N., Mieslinger, T., Minikin, A., Minnett, P., Möller, G., Morfa Avalos, Y., Muller, C., Musat, I., Napoli, A., Neuberger, A., Noisel, C., Noone, D., Nordsiek, F., Nowak, J. L., Oswald, L., Parker, D. J., Peck, C., Person, R., Philippi, M., Plueddemann, A., Pöhlker, C., Pörtge, V., Pöschl, U., Pologne, L., Posyniak, M., Prange, M., Quiñones Meléndez, E., Radtke, J., Ramage, K., Reimann, J., Renault, L., Reus, K., Reyes, A., Ribbe, J., Ringel, M., Ritschel, M., Rocha, C. B., Rochetin, N., Röttenbacher, J., Rollo, C., Royer, H., Sadoulet, P., Saffin, L., Sandiford, S., Sandu, I., Schäfer, M., Schemann, V., Schirmacher, I., Schlenczek, O., Schmidt, J., Schröder, M., Schwarzenboeck, A., Sealy, A., Senff, C. J., Serikov, I., Shohan, S., Siddle, E., Smirnov, A., Späth, F., Spooner, B., Stolla, M. K., Szkółka, W., de Szoeke, S. P., Tarot, S., Tetoni, E., Thompson, E., Thomson, J., Tomassini, L., Totems, J., Ubele, A. A., Villiger, L., von Arx, J., Wagner, T., Walther, A., Webber, B., Wendisch, M., Whitehall, S., Wiltshire, A., Wing, A. A., Wirth, M., Wiskandt, J., Wolf, K., Worbes, L., Wright, E., Wulfmeyer, V., Young, S., Zhang, C., Zhang, D., Ziemen, F., Zinner, T., and Zöger, M.: EUREC4A, Earth Syst. Sci. Data, 13, 4067–4119, https://doi.org/10.5194/essd-13-4067-2021, 2021. a, b, c, d
Tompkins, A. M. and Semie, A.: Organization of Tropical Convection in Low Vertical Wind Shears: Role of Updraft Entrainment, J. Adv. Model. Earth Sy., 9, 1046–1068, https://doi.org/10.1002/2016MS000802, 2017. a
Vial, J., Vogel, R., and Schulz, H.: On the Daily Cycle of Mesoscale Cloud Organization in the Winter Trades, Q. J. Roy. Meteor. Soc., 147, 2850–2873, https://doi.org/10.1002/qj.4103, 2021. a, b
Wessel, P. and Smith, W. H. F.: A Global, Self-Consistent, Hierarchical, High-Resolution Shoreline Database, J. Geophys. Res.-Sol. Ea., 101, 8741–8743, https://doi.org/10.1029/96JB00104, 1996. a, b
Wood, R. and Hartmann, D. L.: Spatial Variability of Liquid Water Path in Marine Low Cloud: The Importance of Mesoscale Cellular Convection, J. Climate, 19, 1748–1764, https://doi.org/10.1175/JCLI3702.1, 2006. a
Zhang, Y., Stevens, B., and Ghil, M.: On the Diurnal Cycle and Susceptibility to Aerosol Concentration in a Stratocumulus-Topped Mixed Layer, Q. J. Roy. Meteor. Soc., 131, 1567–1583, https://doi.org/10.1256/qj.04.103, 2005. a
- Abstract
- Introduction
- Data description and development
- Potential dataset use and reuse
- Comparison with other classifications
- Code and data availability
- Conclusions
- Appendix A: Daily classification overview
- Competing interests
- Disclaimer
- Special issue statement
- Acknowledgements
- Review statement
- References