the Creative Commons Attribution 4.0 License.
the Creative Commons Attribution 4.0 License.
 | 09 Mar 2022
An hourly ground temperature dataset for 16 high-elevation sites (3493–4377 m a.s.l.) in the Bale Mountains, Ethiopia (2017–2020)
Alexander R. Groos
Janik Niederhauser
Bruk Lemma
Mekbib Fekadu
Wolfgang Zech
Falk Hänsel
Luise Wraase
Naki Akçar
Heinz Veit
Tropical mountains and highlands in Africa are under pressure because of anthropogenic climate and land-use change. To determine the impacts on the afro-alpine environment and to assess the potential socio-economic consequences, the monitoring of essential climate and environmental variables at high elevation is fundamental. However, long-term temperature observations on the African continent above 3000 m are very rare. Here we present a consistent multiannual dataset of hourly ground temperatures for the Bale Mountains in the southern Ethiopian Highlands, which comprise Africa's largest tropical alpine area. The dataset covers the period from January 2017 to January 2020. To characterise and continuously monitor the mountain climate and ecosystem of the Bale Mountains along an elevation gradient from 3493 to 4377 m, ground temperature data loggers have been installed at seven sites at 2 cm depth; at four sites at 10 cm depth; and at five sites at 2, 10, and 50 cm depth. The statistical analysis of the generated time series reveals that ground temperatures in the Bale Mountains are subject to large daily fluctuations of up to 40 ∘C and minor seasonal variations on the order of 5 to 10 ∘C. Besides incoming short-wave radiation, ground moisture, and clouds at night, slope orientation and the type of vegetation coverage seem to be the main factors controlling daily and seasonal ground temperature variations. On the central Sanetti Plateau above 3800–4000 m, the mean annual ground temperature ranges from 9 to 11 ∘C. However, nocturnal ground frost down to a depth of 5 cm occurs frequently during the dry season from November to February. At the five sites where ground temperature is measured at three depths, the monitoring will be continued to trace long-term changes. To promote the further use of the ground temperature dataset by the wider research community dealing with the climate and geo-ecology of tropical mountains in eastern Africa, it is made freely available via the open-access repository Zenodo: https://doi.org/10.5281/zenodo.6047457 (Groos et al., 2022).
- Article
(10758 KB) - Full-text XML
- BibTeX
- EndNote


Tropical mountains and highlands cover only a relatively small area of the terrestrial surface, but they comprise a variety of landscapes, ecosystems, and climates and provide essential ecosystem services (e.g. Buytaert et al., 2011; Peters et al., 2019). Tropical alpine environments occur in the New Guinea Highlands in Australasia, in the Andes in South America, and in the Ethiopian Highlands and eastern Arc Mountains in Africa. These regions are biodiversity hotspots, and their flora and fauna are very rich in endemic species (e.g. Rahbek et al., 2019). They also constitute important fresh water sources, for both mountain and lowland ecosystems and communities, as they generate a continuous base flow in rivers through the release of water that is temporarily stored in wetlands and soils and in some areas also in snowfields and glaciers (e.g. Buytaert et al., 2006; Kaser et al., 2010; Mosquera et al., 2015; Chignell et al., 2019). All this emphasises that tropical mountains are crucial ecosystems that are locally, regionally, and globally of relevance to sustain biodiversity, water availability, and groundwater recharge.
The local impacts of ongoing anthropogenic climate and land-use change on individual tropical mountains are difficult to assess, but general developments such as the continuous shrinkage of mountain glaciers, the elevational shift in ecosystem boundaries, and the loss of certain habitats and species are evident (e.g. Kaser, 1999; Colwell et al., 2008; Buytaert et al., 2011; Peters et al., 2019; Rahbek et al., 2019; Veettil and Kamp, 2019). Other effects such as the reduction in the organic carbon storage potential below ground, associated with drier and warmer soil conditions, are discussed as well in this context (Buytaert et al., 2011). The magnitude of the aforementioned environmental changes might be amplified with increasing elevation in view of the elevation-dependent warming observed in several mountain ranges across the world (e.g. Diaz and Bradley, 1997; Pepin and Seidel, 2005; Pepin and Lundquist, 2008; Qin et al., 2009; Rangwala and Miller, 2012; Pepin et al., 2015). To determine the impacts of global climate change on tropical mountains and to assess the potential socio-economic consequences, the monitoring of essential climate and environmental variables at high elevations is fundamental (Beniston et al., 1997; Bojinski et al., 2014). However, weather stations for example with longer records (> 20 years) are rare above 3000 m and non-existent above 5000 m (Pepin et al., 2015). Most affected by the lack of climate observations are the tropics in general and the African continent in particular. Therefore, the tropical highlands and mountains in eastern Africa are either underrepresented or neglected in large-scale climate studies on high-elevation warming (e.g. Diaz and Bradley, 1997; Pepin and Seidel, 2005; Rangwala and Miller, 2012).
The tropical alpine environment in Africa is mainly confined to the eastern part of the continent and comprises the Ethiopian Highlands in the Horn of Africa as well as the Rwenzori Mountains and numerous isolated volcanic peaks in eastern Africa (Groos et al., 2021a). With regards to the modern afro-alpine climate and ecosystem, Mount Kilimanjaro is by far the best-studied and best-monitored tropical high-elevation site on the continent, with a maximum elevation of 5985 m. Biodiversity (Peters et al., 2019), ground temperature (Yoshikawa et al., 2021), and various meteorological variables (see Appelhans et al., 2016; Pepin et al., 2016; and Mölg et al., 2020) have been monitored temporarily or continuously along elevation gradients of up to 5000 m in the course of the last 2 decades. Meteorological and ground temperature data are also available for limited periods from Mount Kenya (Grab et al., 2004; Nicholson et al., 2013) and outside the tropics from the High Atlas (Vieira et al., 2017). In the Bale Mountains of southern Ethiopia, with an area of more than 200 km2 above 4000 m, Africa's largest tropical alpine environment (Groos et al., 2021a), the population of endangered species such as the Ethiopian wolf has been monitored since the 1980s (Gottelli et al., 1994; Marino et al., 2006), but continuous observations of any essential climate variable have been lacking until recently. Meteorological and ground temperature measurements from a few sites above 4000 m exist for the period 1984–1991 (Hillman, 1986; Gottelli and Sillero-Zubiri, 1990; Miehe and Miehe, 1994), but the data have not yet been digitised, revised, and made publicly available.
Within the framework of the joint Ethio-European research unit “The Mountain Exile Hypothesis” (Ossendorf et al., 2019), 10 automatic weather stations and 29 additional ground temperature data loggers have been installed in the Bale Mountains since the beginning of 2017 (see Fig. 1). The main objectives of the research unit are to reconstruct the natural and anthropogenic history of a model afro-alpine environment and to determine drivers and processes of climate and environmental change at high elevation. All generated datasets are stored in an on-demand processing database (Wöllauer et al., 2020). Part of the data have already been presented in previous studies (Lemma et al., 2020; Bittner et al., 2021; Groos et al., 2021b), but neither the meteorological nor the ground temperature datasets are yet openly accessible. The aim of this contribution is therefore to describe the ground temperature monitoring network that has been established in the Bale Mountains between 3493 and 4377 m and to share a consistent and comprehensive multiannual ground temperature dataset from a remote afro-alpine study site. Moreover, we briefly discuss the observed spatio-temporal ground temperature variations and outline how the dataset can benefit other studies addressing the climate, ecology, geomorphology, and soils of tropical mountains in eastern Africa and beyond.
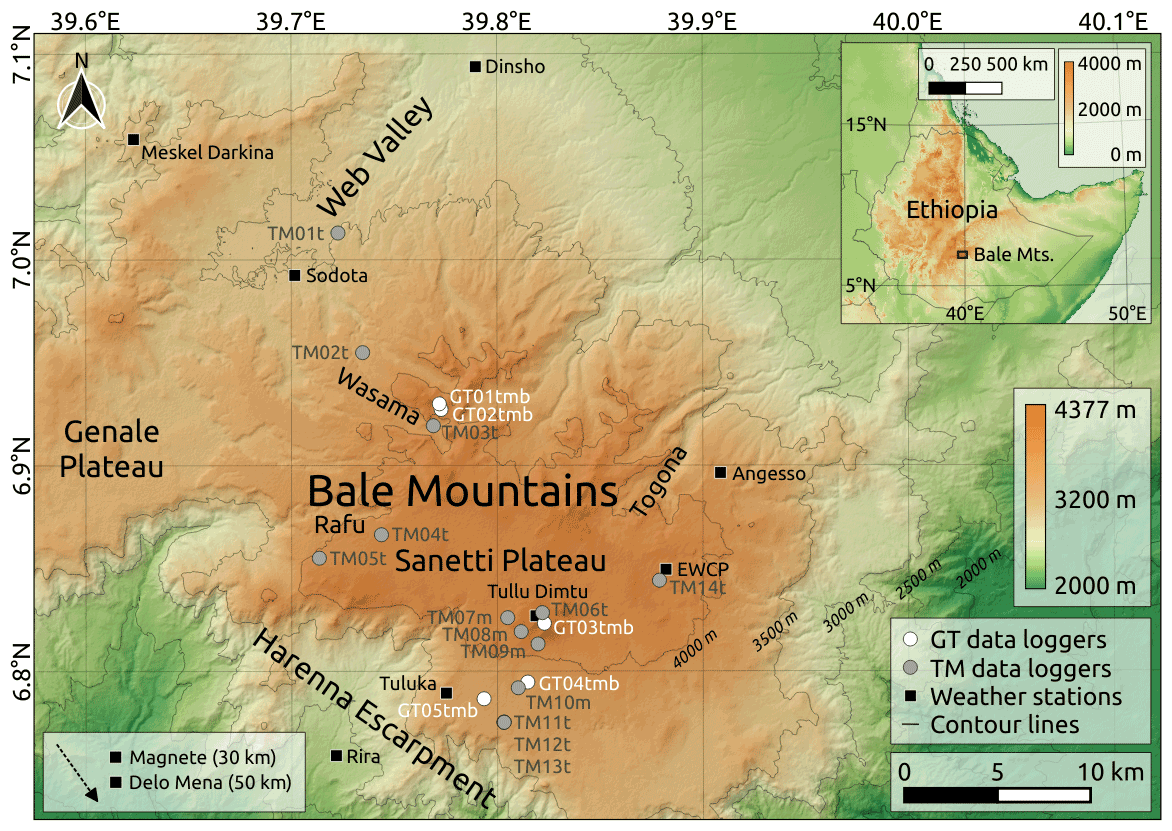
Figure 1Overview map of the ground temperature monitoring network and automatic weather stations in the Bale Mountains (southern Ethiopian Highlands), located in the Horn of Africa. While the high-quality GEOTEST (GT) ground temperature data loggers were installed at a depth of 2, 10, and 50 cm, the low-cost tempmate.®-B2 (TM) ground temperature data loggers were only placed at a depth of either 2 or 10 cm. The measurement depth of all loggers at each site is indicated by the lower-case letters t (top, 2 cm), m (middle, 10 cm), and b (bottom, 50 cm). All low-cost TM data loggers were collected in January 2020. The measurements are being continued at all five GT sites (white dots). The two weather stations, Magnete and Delo Mena, are located outside the map area. Data basis: SRTM 1 Arc-Second Global (United States Geological Survey).
The Bale Mountains (6.6–7.1∘ N, 39.5–40.0∘ E) are located south-east of the Main Ethiopian Rift in the Horn of Africa and cover an elevation range from below 2000 up to 4377 m. They are part of the larger Bale–Arsi massif and form the central section of the southern Ethiopian Highlands (Fig. 1). The base of the Bale–Arsi massif consists of Precambrian rocks and overlying Mesozoic sediments. Solidified trachytic and basaltic lava flows from the Cenozoic are responsible for the extensive subhorizontal volcanic plateaus that are generic for the Bale Mountains (Mohr, 1983; Miehe and Miehe, 1994; Osmaston et al., 2005; Hendrickx et al., 2014). Individual volcanic plugs and cinder cones, such as the highest peak, Tullu Dimtu (4377 m), rise above the central Sanetti Plateau. An extensive ice cap and numerous valley glaciers have shaped the landscape of the Bale Mountains during the Pleistocene (Osmaston et al., 2005; Groos et al., 2021a). While the southern margin of the plateau is bounded by the Harenna Escarpment, broad U-shaped valleys characterise the western, northern, and eastern declivity of the mountain range. Most of the basaltic and trachytic rocks, especially on the plateau, are covered by a fine regolith layer that is only sparsely vegetated (see Fig. 2). In areas where soils have developed, Andosols are the most widespread soil type (Lemma et al., 2019). Exceptional features on the Sanetti Plateau that provide evidence for seasonal or permanent ground frost in the past are relict large sorted stone stripes with a width of up to 15 m and a length of up to 1000 m (Groos et al., 2021b). The plateau is mainly covered by sparse afro-alpine vegetation, but Erica trees and shrubs occur at isolated spots (Miehe and Miehe, 1994; Gil-Romera et al., 2019).
The latitudinal oscillation of the intertropical convergence zone and zonal shift of the Congo air boundary determine the alternation of wet and dry seasons in the Ethiopian Highlands (e.g. Levin et al., 2009; Tierney et al., 2011; Costa et al., 2014). Due to orographic precipitation, the mountains in the region receive on average much more moisture than the surrounding lowlands (Gebrechorkos et al., 2019). In the Bale Mountains, the dry season (termed “Bega” in the local language) lasts roughly from November to February, when relatively dry north-easterly trade winds from the Arabian Peninsula and Arabian Sea prevail. A bimodal wet season with a transitional regime in between follows the dry season. The two precipitation maxima coincide roughly with the north and southward passage of the intertropical convergence zone above the Ethiopian Highlands. While the first phase of the rainy season from March to June (locally termed “Belg”) is usually more pronounced in the southern Ethiopian Highlands, the second one (locally termed “Kiremt”), lasting from July to October, is more distinct in the north (Miehe and Miehe, 1994; Seleshi and Zanke, 2004). During the rainy season, the moisture in the Bale Mountains originates primarily from the Indian Ocean, from where it is transported towards the Ethiopian Highlands via the south-easterly monsoon (Lemma et al., 2020). Snowfall during the wet seasons is rare and generally limited to the Sanetti Plateau and surrounding peaks. Moreover, the fresh snow typically melts within a few hours or days (Miehe and Miehe, 1994). Superficial ground frost occurs frequently during clear nights, although the current mean annual ground temperature on the plateau is on the order of 10 ∘C (Groos et al., 2021b). Geomorphological and chronological investigations of glacial and periglacial landforms reveal, however, that the Bale Mountains experienced a pronounced cold phase during the Pleistocene, leading to the past formation of an extensive ice cap (Osmaston et al., 2005; Groos et al., 2021a) and seasonal or permanent ground frost (Groos et al., 2021b).
3.1 Data loggers
To monitor ground temperature in the Bale Mountains and to establish a modern reference for the palaeoclimatic interpretation of periglacial landforms such as the large relict stone stripes on the Sanetti Plateau (Groos et al., 2021b), we have installed two different types of data loggers (see Fig. 2): high-quality UTL-3 Scientific Dataloggers (hereafter abbreviated as GT data loggers) and low-cost tempmate.®-B2 ground temperature data loggers (hereafter abbreviated as TM data loggers). The GT data loggers are developed by GEOTEST AG in collaboration with the Swiss Institute for Snow and Avalanche Research (WSL). They are mainly deployed to monitor ground temperature and permafrost in high mountain environments (e.g. Hoelzle et al., 1999; Imhof et al., 2000; Schrott et al., 2012; Frauenfelder et al., 2018; Rist et al., 2020). The GT data loggers consist of a waterproof housing, a YSI 44005 thermistor for measuring temperature, a memory for up to 65 000 readings, a replaceable 3.6 V lithium battery for the power supply, and a USB 2.0 interface for the data transfer. The measuring accuracy at 0 ∘C is better than ±0.1 ∘C, and the thermometric drift at 0 ∘C is less than ±0.01 ∘C per 100 months (Geotest, 2021).
The TM data loggers are developed by tempmate GmbH and have the size of a button cell. They consist of a splashproof housing, an unspecified thermistor, a memory for up to 8192 readings, and an irreplaceable 3.0 V battery. We wrapped the TM data loggers in thin tape for better protection (Fig. 2f). A logger-to-USB adapter is needed for connecting the loggers to a computer and retrieving the data. The measuring accuracy is ±0.5 ∘C in the temperature range from −10 to 65 ∘C (Tempmate, 2021).
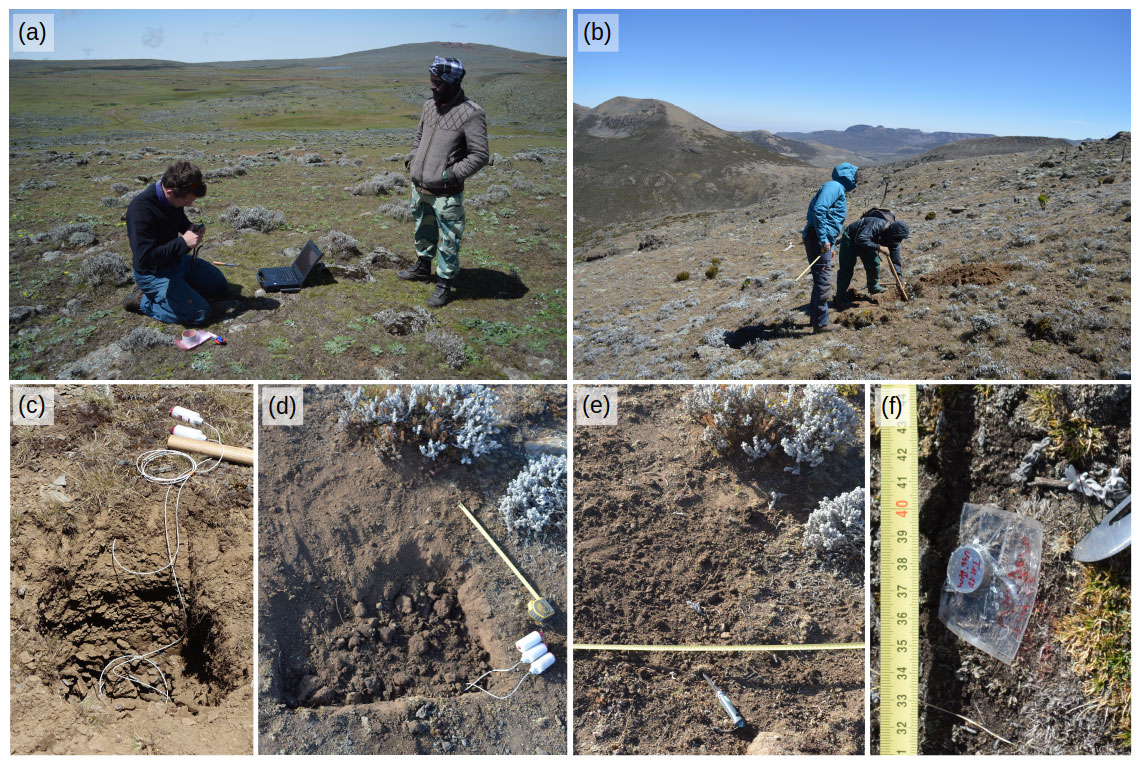
Figure 2Overview of the installation and maintenance of the ground temperature monitoring network in the Bale Mountains. (a) Environmental setting of logger TM14t (2 cm) at ca. 4100 m on the Sanetti Plateau. (b) Environmental setting of data loggers GT01t (2 cm), GT01m (10 cm), and GT01b (50 cm) at ca. 4200 m on the northern slope of Mount Wasama. (c–e) Exemplary installation procedure of data loggers at different depths. (f) Close-up view of a tiny TM data logger.
3.2 Ground temperature monitoring
To monitor ground temperature and frost occurrence in the Bale Mountains at different depths and elevations, we buried high-quality GT data loggers at 2 cm (top), 10 cm (middle), and 50 cm depth (bottom) in the regolith layer on Tullu Dimtu, on the northern and southern slopes of Mount Wasama, and at two stone stripe locations on the southern Sanetti Plateau (Fig. 1, Table 1). The five selected sites are located between 3877 and 4377 m and are all sparsely vegetated (Fig. 2). On Mount Wasama, GT data loggers were installed on the northern as well as on the southern slope to analyse the impact of slope orientation on seasonal ground temperature variations. Standard loggers without an external cable were used for the ground temperature measurements near the surface (at about 2 cm depth) and loggers with an external thermistor cable for the measurements at 10 and 50 cm depth (Fig. 2c–d). Each pit that was excavated for the data logger installation was backfilled in the same order to ensure as little disturbance as possible.
In addition to the 15 GT data loggers, 14 low-cost TM data loggers were installed at 2 or 10 cm depth in the regolith layer on the Sanetti Plateau and in two northern valleys (Wasama and Web) to increase the elevation range and spatial coverage of near-surface ground temperature measurements (Fig. 1, Table 1). None of the TM data loggers apart from TM09t and TM10t were covered by vegetation. Due to the much lower accuracy of the TM data loggers compared to the GT data loggers, we performed a comparative measurement at 12 ∘C and at 4 ∘C in a fridge in the lab over 6 h (see Fig. A1) with logger GT00 as a reference (the logger was stolen in the field before the first read-out and therefore does not appear in Fig. 1 and Table 1). Since the root mean square deviation of each TM data logger from the reference measurement was smaller than the stated accuracy of ±0.5 ∘C (at −10 to 65 ∘C), a calibration was unnecessary. For a direct cross-comparison in the field, data logger TM06t was installed next to GT03t at 2 cm depth on Tullu Dimtu. Two TM data loggers (TM09m and TM10m) were buried below small Erica trees at 10 cm depth for comparison with two scarcely vegetated sites (TM07m and TM08m).
Most data loggers have been monitoring ground temperature at an hourly resolution from January 2017 onward. Others were installed 1 year later (Table 1). While the low-cost TM data loggers were collected in January 2020, the high-quality GT data loggers continue measuring. The data download needs to be performed on site as a reliable mobile radio network for data transfer is not available in this remote mountain area. During the measurement period from January 2017 to January 2020 (last read-out), several issues occurred and caused data gaps in many of the ground temperature time series (Fig. 3). The position of the data loggers in the field was originally marked with small coloured plastic poles. However, the markers were too conspicuous. Vandalism led to the loss of several items. Dwarf shrubs and stones were used subsequently to mark the measurement sites.
Table 1Overview of the 29 ground temperature data loggers (excluding lost items) installed in the Bale Mountains. The measuring depth of a logger is indicated by the lower-case letters t (top, 2 cm), m (middle, 10 cm), and b (bottom, 50 cm).
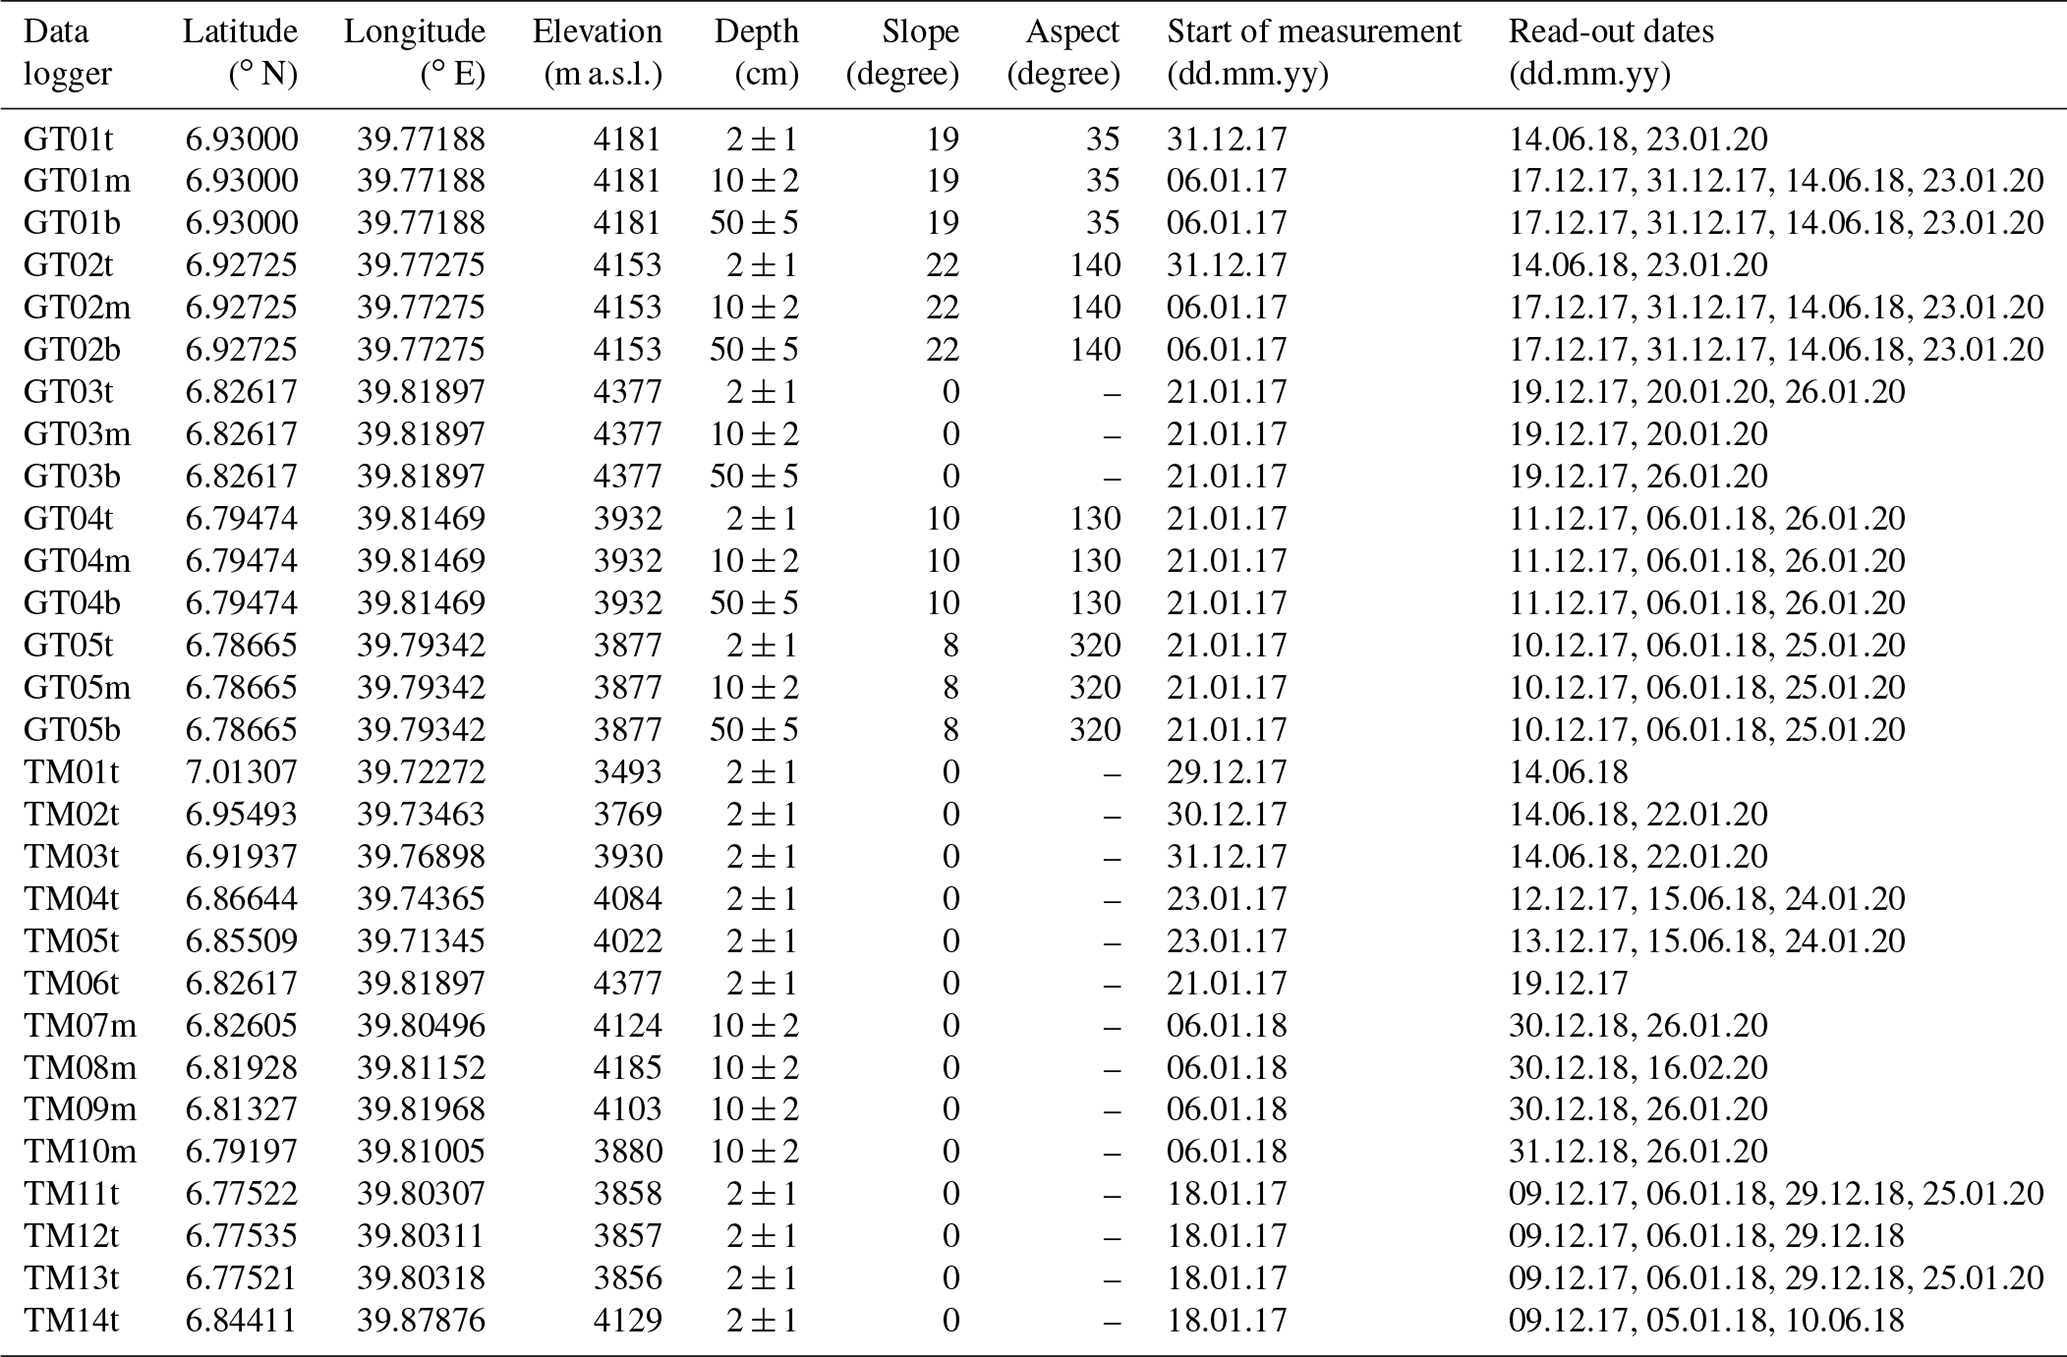
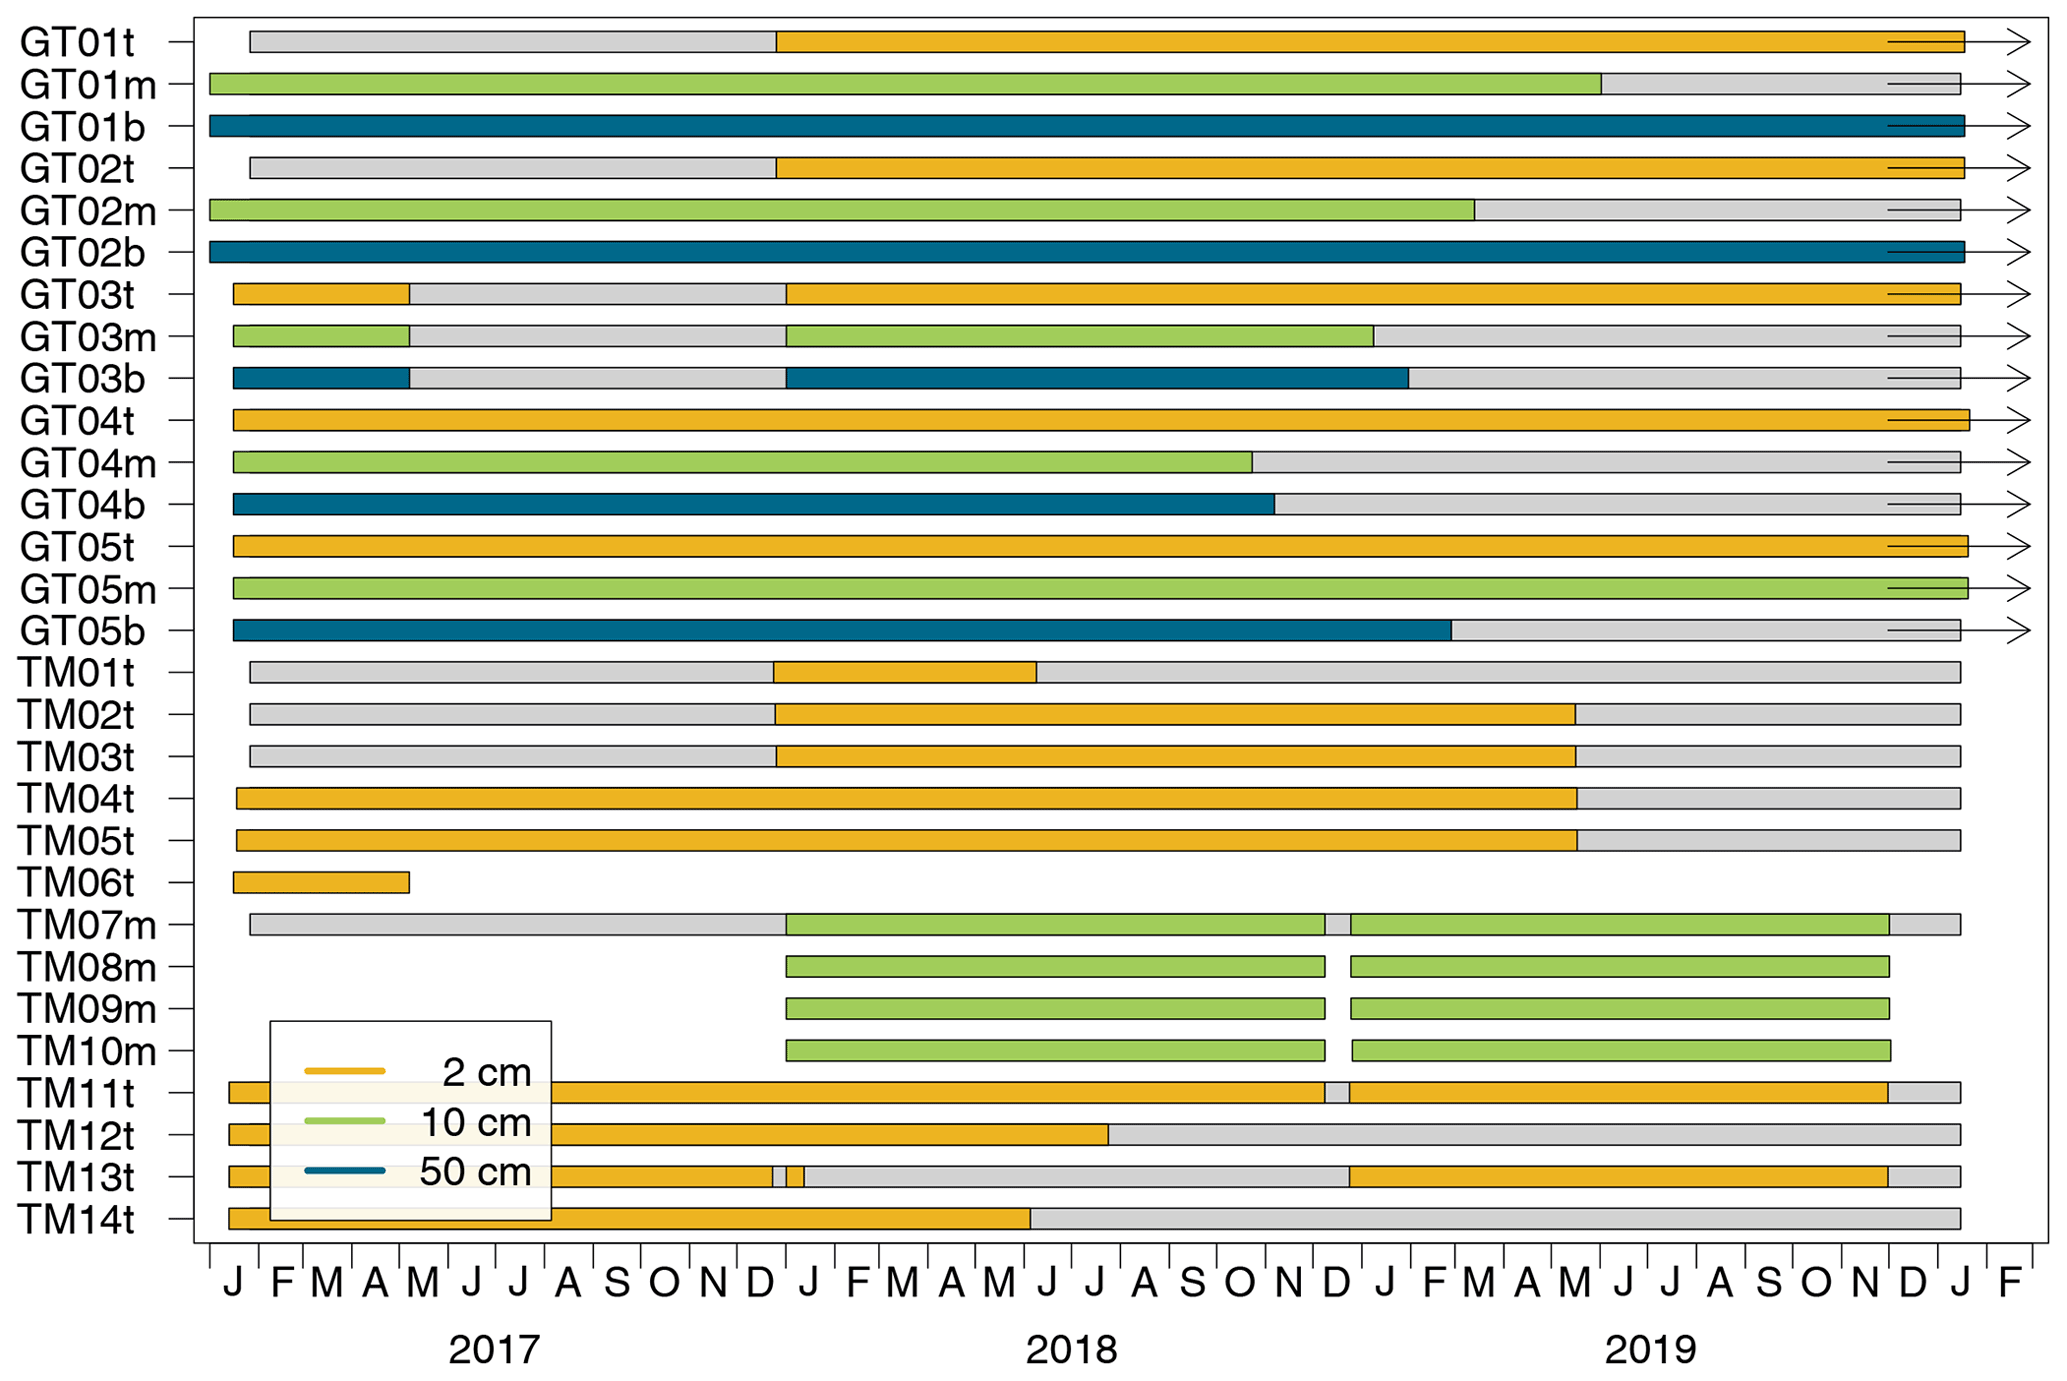
Figure 3Measurement periods and data gaps of all ground temperature data loggers installed in the Bale Mountains. The measuring depth of a logger is colour-coded and indicated by the lower-case letters t (top, 2 cm), m (middle, 10 cm), and b (bottom, 50 cm). Colour bars indicate measurement periods, and grey bars indicate data gaps that were filled using a linear regression model and available ground temperature data from a nearby logger (see Sect. 3.3). The arrows mark the time series that are being continued.
3.3 Data post-processing
All ground temperature data stored by the GT and TM loggers were checked manually and automatically using a simple filter to identify erroneous values as temporarily recorded by a few low-cost loggers. We only removed hourly measurements from the time series that were either unrealistic (e.g. values on the order of −20 to −40 ∘C) or that deviated from previous or subsequent measurements by more than ±10 ∘C. No other loggers than TM11t, TM12t, and TM13t were affected by this correction. Data logger GT05t was unintentionally installed at about 6 cm depth in January 2017 and not at 2 cm as planned. Because of its relocation towards the surface after the first read-out in December 2017, an increase in the daily temperature amplitude was noticed. To correct for this, we calculated hourly ground temperature gradients between 6 and 10 cm depth from the GT05t and GT05m data by applying a simple linear regression model. We used the obtained gradients to extrapolate the GT05t measurements from 6 to 2 cm in the period 21 January to 10 December 2017. All measurements of any data logger that were not recorded on the full hour were adjusted to the full hour by linear interpolation. See Sect. 6 (“Data availability”) for access to the original log files and for further information regarding any corrections made to each time series.
To obtain a complete and consistent dataset of hourly ground temperatures in the Bale Mountains for the period 1 February 2017 (first measurement) to 20 January 2020 (last read-out), we applied a statistical gap-filling approach. Most of the ground temperature measurements from different locations or depths overlap for a certain period in time (see Fig. 3) and allow a statistical correlation to be established. We applied a simple linear regression model to gap-fill missing data points in the time series of a logger using existing data from a nearby logger. If multiple loggers with a similar distance were considered for the gap-filling, we chose the one that yielded the best fit (i.e. the highest coefficient of determination R2) and lowest root mean square error (RMSE). The overlapping measurement period between the predicting logger and dependent logger was split into a calibration and validation part. For the gap-filling of incomplete time series at 10 or 50 cm depth, we drew on existing data from 2 cm depth of the same location. We used a moving average of the data from 2 cm depth to account for the time-lag response at greater depths to meteorological changes. The number of preceding hours considered for the calculation of the moving average that yielded the best prediction (high R2 and low RMSE) of the ground temperatures at 10 or 50 cm depth was chosen.
The validation of the simple linear regression models applied for the gap-filling of the time series at different depths revealed in general a strong correlation between the measured and modelled ground temperatures with a mean R2 of 0.85 ± 0.13 and a RMSE of 1.9 ± 1.4 ∘C (the provided uncertainty is the standard deviation of all model performances). The relatively high RMSE is the result of the great diurnal ground temperature amplitude close to the surface (see Sect. 4.2). The performance of the computed linear regression models differs from site to site (Fig. B1) and tends to decrease with increasing distance between the location of the predictor logger and the location of the target logger (see RMSE in Fig. B2). Although the environmental setting of most logger sites is similar (regolith layer, no or scarce vegetation, no or little shading, etc.), site-specific differences (e.g. varying relief or microclimate) may have affected the gap-filling procedure and probably explain the limited model performance at a few sites. The time series of the data loggers TM06t, TM08m, TM09m, and TM10m were not gap-filled as the data served only for comparative experiments (low-cost vs. high-quality loggers and vegetated vs. barren locations) and were dispensable for the temporal and elevational analysis. See Sect. 6 (“Data availability”) for access to the final ground temperature dataset and a detailed information sheet regarding the gap-filling procedure of the individual time series.
3.4 Data analysis
As the main focus of this contribution is the presentation and publication of the generated ground temperature dataset, we conducted a basic statistical analysis to quantify frost occurrence (i.e. number of frost hours) and spatio-temporal ground temperature variations in the Bale Mountains. We also included in the analysis meteorological data from the Tuluka automatic weather station (AWS) on the southern Sanetti Plateau to better understand the factors controlling ground temperature variations. The meteorological raw data are stored in an on-demand processing database system – currently with restricted access to the members of the joint Ethio-European Research Unit 2358 “The Mountain Exile Hypothesis” (Wöllauer et al., 2020). The data will be made publicly available at some point in the future (see Sect. 6). Fourteen data loggers (excluding TM06t) from 2 cm depth and five loggers (excluding TM07m, TM08m, TM09m, and TM10m) from 10 and 50 cm depth were considered for the calculation of mean annual ground temperatures, daily ground temperature cycles, thermal gradients, number of frost hours, frost penetration depth, and elevational gradients. To emphasise seasonal ground temperature variations related to changes in insolation, cloudiness, and humidity, we conducted the calculations separately for the entire study period, the dry season (Bega: November to February), and the two rainy seasons (Belg: March to June; Kiremt: July to October). Moreover, time series from different sites were compared to assess differences in the performance of low-cost and high-quality data loggers (TM06t vs. GT03t), to investigate differences in ground temperature between north-facing and south-facing slopes (GT01t, GT01m, and GT01b vs. GT02t, GT02m, and GT02b), and to study differences between vegetated and sparsely vegetated areas (TM09m and TM10m vs. TM07m and TM08m).
4.1 Data quality
The cross-comparison between the low-cost data logger (TM06t) and high-quality data logger (GT03t) at the summit of Tullu Dimtu during a 4-month period without any data gaps revealed a strong correlation (R2 = 0.98) between the measured ground temperatures. Both loggers measured almost the same mean ground temperature (8.44 vs. 8.48 ∘C). The root mean square deviation of the hourly ground temperature measured by the two different loggers was 1.7 ∘C. The standard deviation of the TM06t measurements was slightly larger than that of the GT03t measurements (9.0 vs. 7.3 ∘C) as GT03t was installed one to two centimetres deeper than TM06t. This shows that the tested low-cost loggers, which have not been explicitly designed for scientific applications, are suitable for short-term and mid-term (days to months) ground temperature measurements and experiments in high (tropical) mountains.
Both the high-quality and low-cost data loggers have reliably and accurately recorded ground temperature at an hourly resolution as long as the power supply was ensured. We noticed a relatively short battery life of 2 years for some of the GT and TM data loggers, leading to a substantial data loss between consecutive read-out dates; 2 years is shorter than the battery life stated by both manufacturers for the hourly sampling interval (GT: ca. 3–5 years; TM: ca. 5 years). The temporary power loss caused longer data gaps in some ground temperature time series. Unrealistic ground temperature measurements that were caused by a drop in battery voltage were only noticed in the time series of three low-cost loggers (TM11t, TM12t, and TM13t). Another reason for shorter data gaps was the limited memory capacity of the low-cost loggers, which was insufficient if the period of hourly measurements between two consecutive read-out dates was longer than 341 d. Because of the large number of thermistors installed in the Bale Mountains, data gaps in the affected ground temperature time series could be filled reasonably well using hourly data from other measuring sites (see Fig. B3).
4.2 Ground temperature variations
The ground temperatures observed in the Bale Mountains from January 2017 until January 2020 show characteristic short-term and long-term variations (Fig. 4). On the highest peak, Tullu Dimtu (4377 m), daily mean ground temperatures at 2 cm depth fluctuate around 7.6 ∘C and range between minimum 3 ∘C and maximum 12 ∘C. The mean multiannual air temperature at the same site as measured by the AWS is 2 ∘C and, thus, 5.6 ∘C lower than the mean multiannual ground temperature. Long-term ground temperature variations at the different monitoring sites (GT03, GT04, and GTO5) on the Sanetti Plateau are quasi-synchronous, although the multiannual mean may differ (Fig. 4). Ground temperatures at 10 and 50 cm depth mimic variations observed near the surface with a delay of several hours to days because of the thermal resistivity of the ground. A clear seasonal ground temperature cycle overlying the short-term fluctuations is solely visible in the time series from the southern slope of Mount Wasama (GT02), where ground temperatures reach their maximum in the dry season between November and February (Fig. 4).
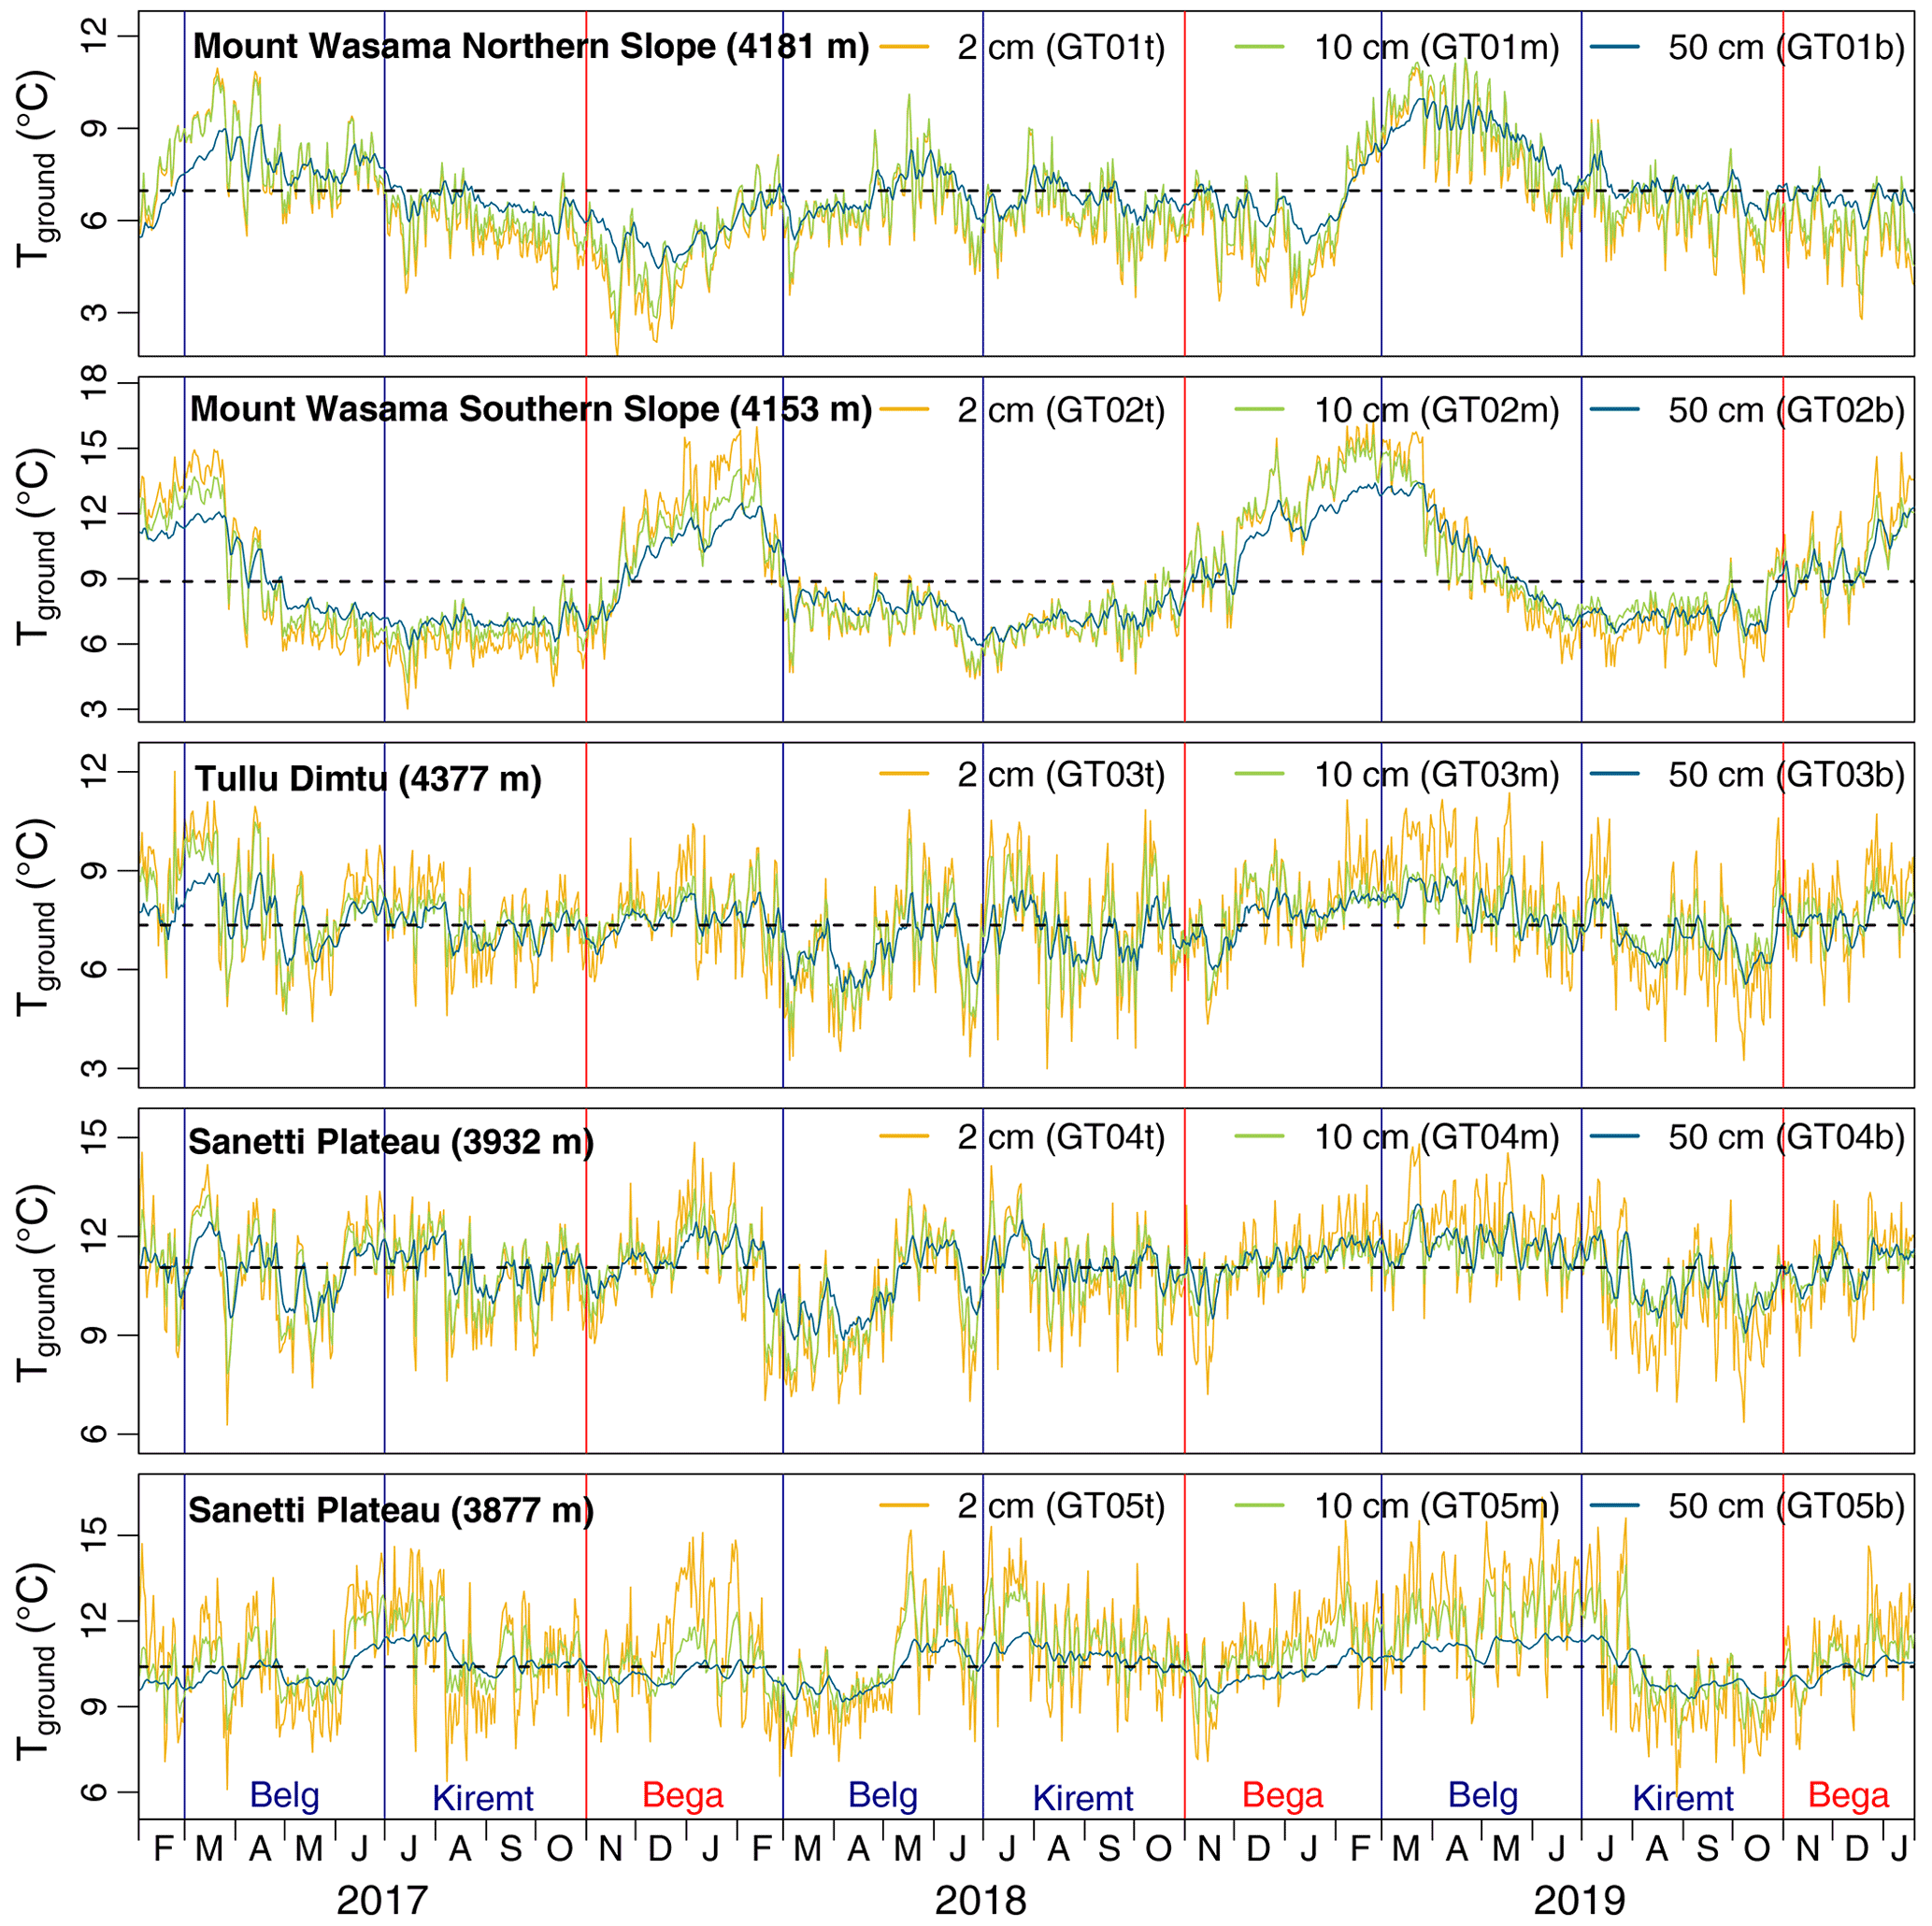
Figure 4Aggregated mean daily ground temperature at 2, 10, and 50 cm depth on Mount Wasama, Tullu Dimtu, and the Sanetti Plateau from 1 February 2017 until 20 January 2020. The dashed horizontal lines indicate the average ground temperature (integrated over depth) at each site during the measurement period. The vertical lines indicate the onset of the different seasons (blue: rainy season; red: dry season).
The analysis of aggregated meteorological data from the Tuluka AWS (3848 m) on the southern Sanetti Plateau reveals that incoming short-wave radiation in the Bale Mountains follows a clear seasonal cycle (Fig. 5c). The incoming short-wave radiation reaches its maximum during the dry season and is generally reduced during the two rainy seasons from March to October because of the frequent presence of clouds. In contrast to that, daily air temperatures are highest during the rainy seasons when the sun is overhead and lowest during the dry season when the solar elevation is lower (Fig. 5b). The asynchronicity between the seasonal maxima of daily air temperature and incoming short-wave radiation can be further explained by potential variations in the net long-wave radiation flux, which is not directly measured by the AWSs in the Bale Mountains. The increased fraction of water vapour in the atmospheric boundary layer above the Sanetti Plateau during the rainy season as indicated by the relative humidity in Fig. 5d should theoretically lead to a greater nocturnal absorption of the outgoing long-wave radiation and, thus, to a greater warming of the atmosphere than during the dry season. Ground temperature variations on the Sanetti Plateau in turn do not simply reflect changes in the net short-wave radiation flux, air temperature, or air humidity (Fig. 5a). To a certain degree, they must also be controlled by ground moisture (indicated by the precipitation sum in Fig. 5e), which in principle affects the surface energy balance through evaporative cooling and heat absorption.
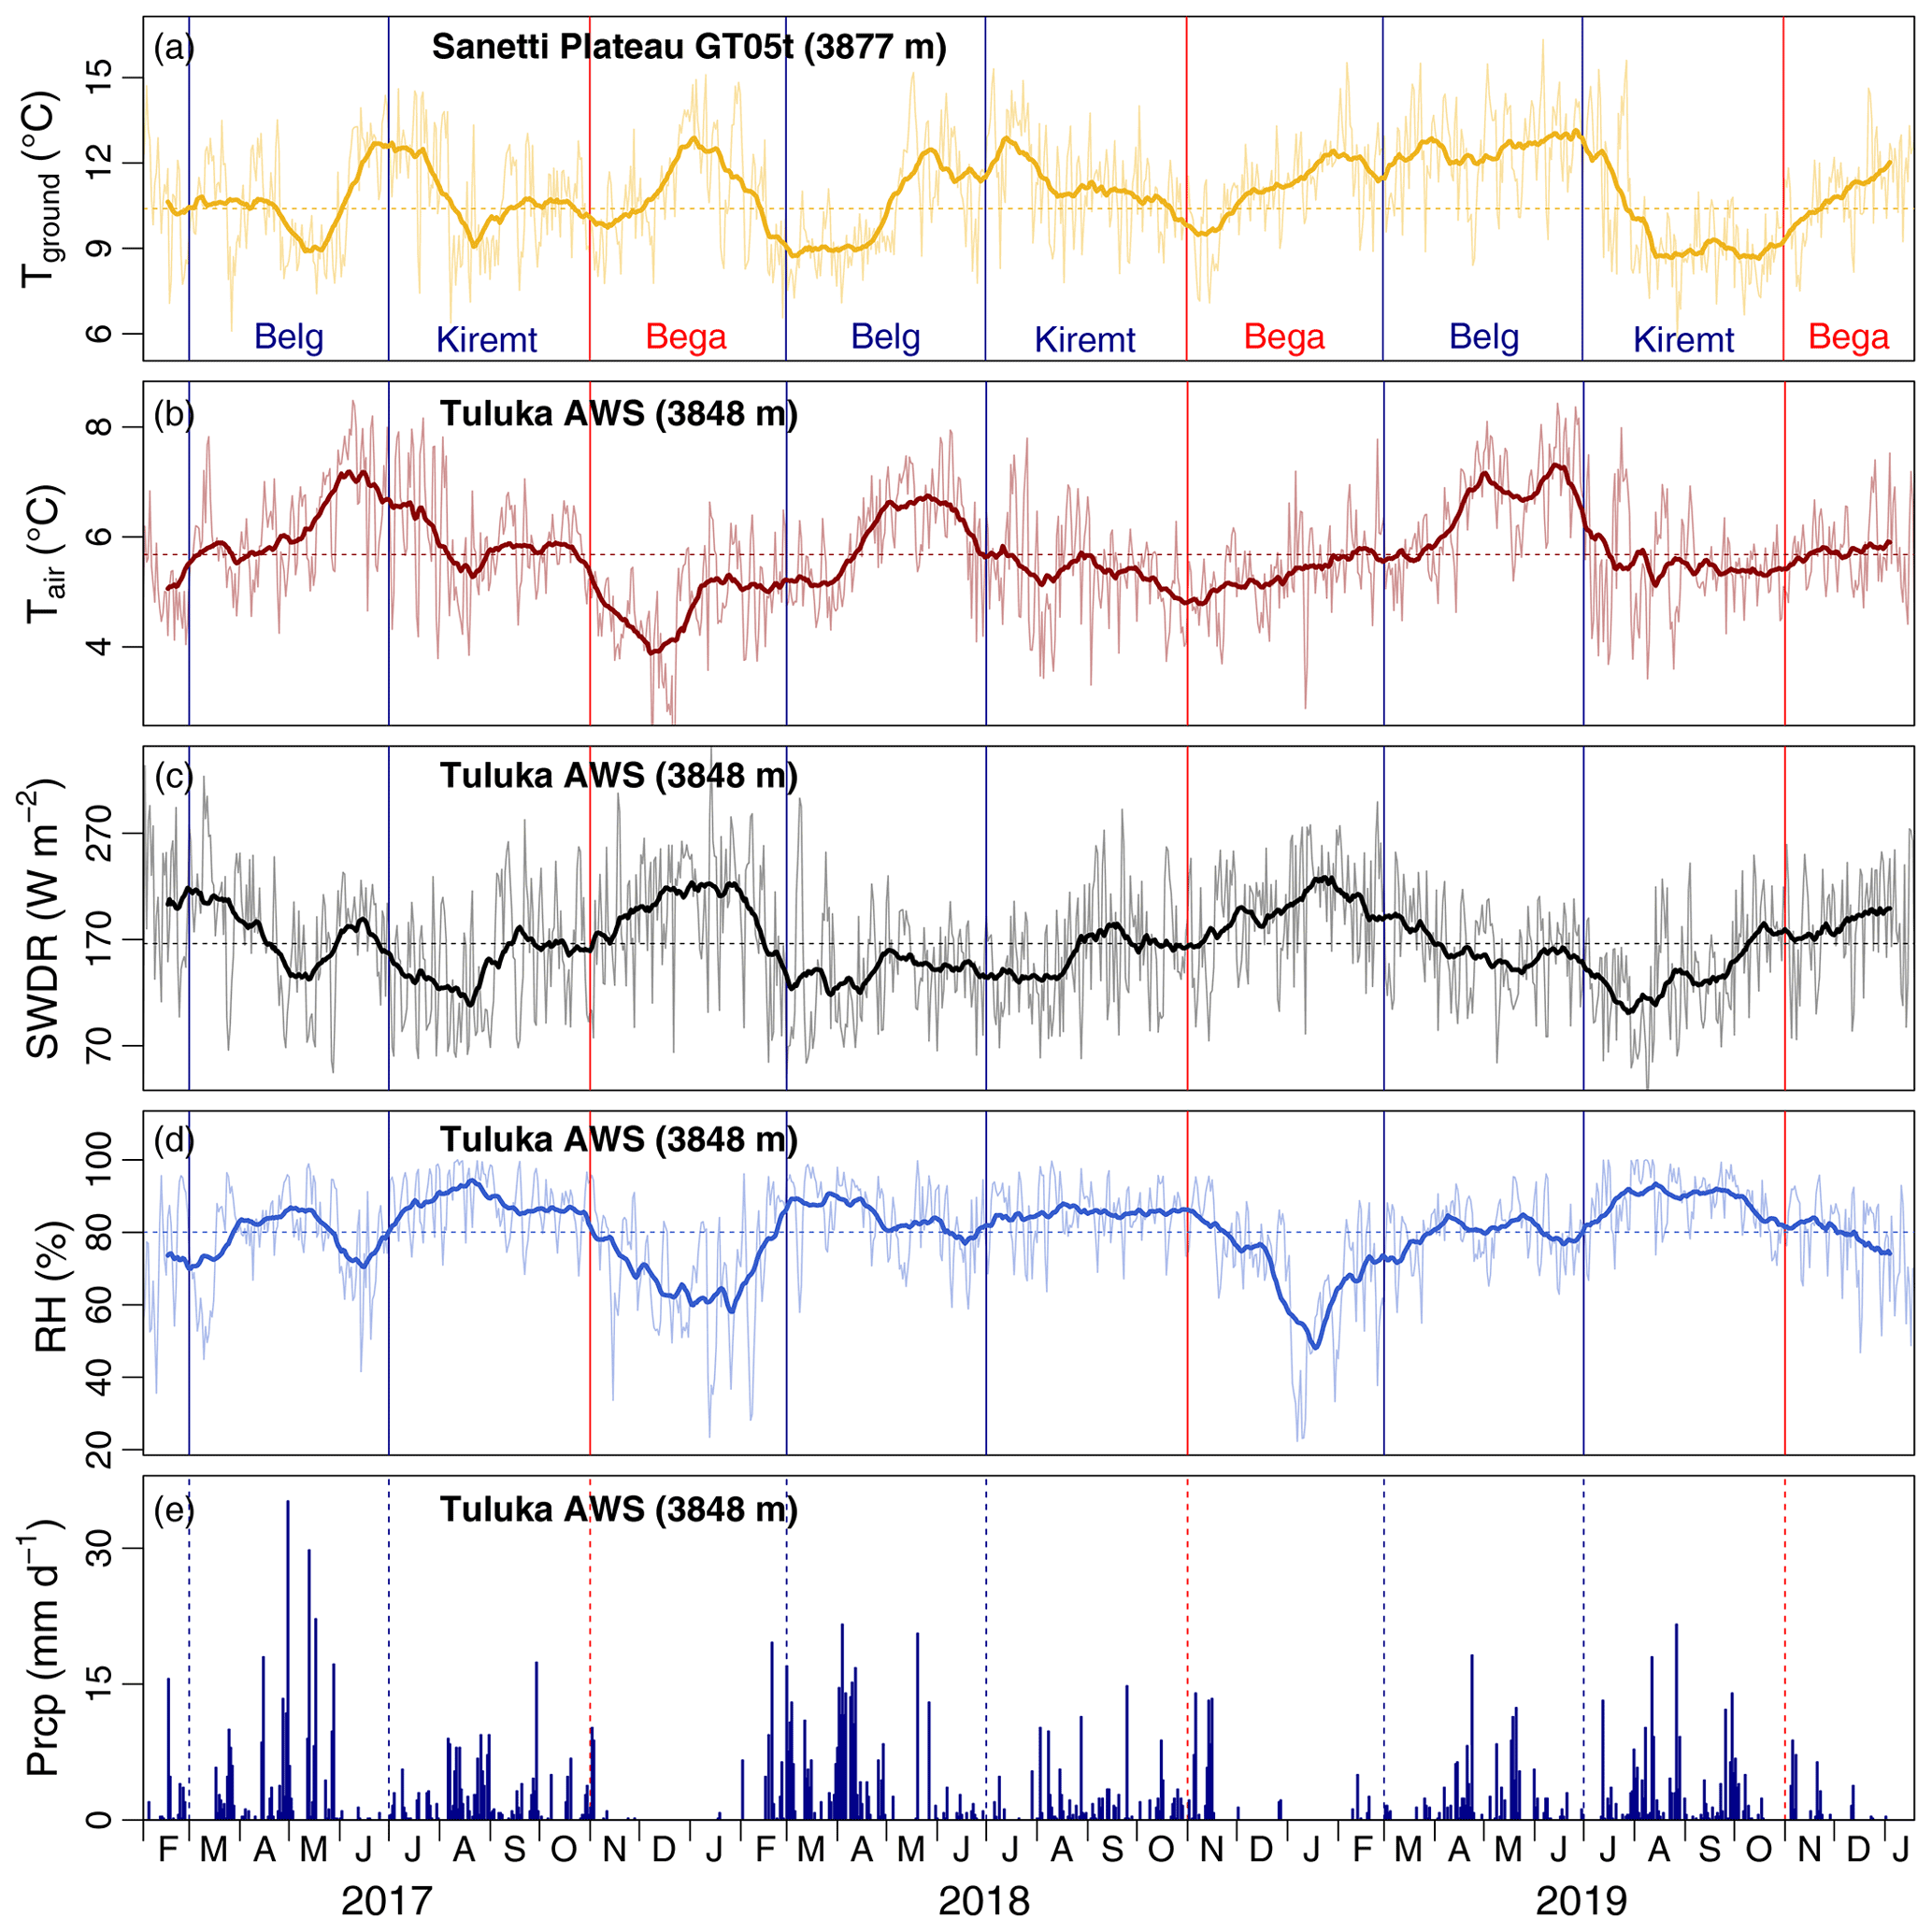
Figure 5Aggregated mean daily (a) ground temperature, (b) air temperature, (c) short-wave downward radiation (SWDR), and (d) relative humidity (RH) on the southern Sanetti Plateau. The bold lines represent smoothed daily values using a simple moving average with a window size of 31 d. The dashed horizontal lines indicate the average of each variable during the measurement period. (e) Daily precipitation (Prcp) sum. Note that the ground temperature data logger GT05t and the Tuluka AWS are about 2 km apart. The vertical lines indicate the onset of the different seasons (blue: rainy season; red: dry season).
The impact of clouds as well as air and ground moisture on the surface energy balance is also reflected in the diurnal ground temperature cycle. During the dry season, the diurnal ground temperature amplitude in the Bale Mountains at 2 cm depth is on the order of 15–25 ∘C and, thus, more pronounced than the daily amplitude (ca. 10–15 ∘C) during both rainy seasons (Fig. 6a). Maximum hourly ground temperatures of more than 40 ∘C have been measured at 2 cm depth on the western and southern Sanetti Plateau (e.g. at the location of loggers GT05t, TM04t, and TM05t; see Fig. 1) in the afternoon during cloudless days. At the same location, near-surface hourly ground temperatures can decrease below −5 ∘C during clear nights. Nocturnal ground frost is also common at depressions such as the Wasama Valley (see TM03t in Fig. 1) that favour cold-air ponding (Fig. C1). Nocturnal ground frost on the Sanetti Plateau occurs predominantly during the dry season “Bega” from November to February (Fig. 7). However, temperatures below 0 ∘C were measured exclusively near the surface as the freezing front penetrates only the upper 5 cm of the ground (Fig. D1). At 10 cm depth and below, frost was not detected at any of the logger locations during the entire study period.
Annual ground temperatures increase from the highest peak, Tullu Dimtu (4377 m), down to the lowest logger location, in the Web Valley (3493 m), by 0.63 ∘C per 100 m (Fig. 6c), but nocturnal frost can still occur at the valley bottoms along the northern declivity up to 25 d yr−1. The ground temperature lapse rate is a bit lower than the atmospheric lapse rate of 0.70 ∘C per 100 m in the Bale Mountains as calculated for the same period (Groos et al., 2021a). The diurnal ground temperature amplitude decreases considerably with depth. Ground temperatures at 50 cm depth and below vary little throughout the day (Fig. 6a). The difference between the mean daily ground temperature near the surface and at 50 cm depth is relatively constant and rarely larger than 2 ∘C (Fig. 6b). Although the effect is not very pronounced, the thermal gradient from the surface to 50 cm depth tends to be negative during the dry season and near zero or positive during the rainy seasons.
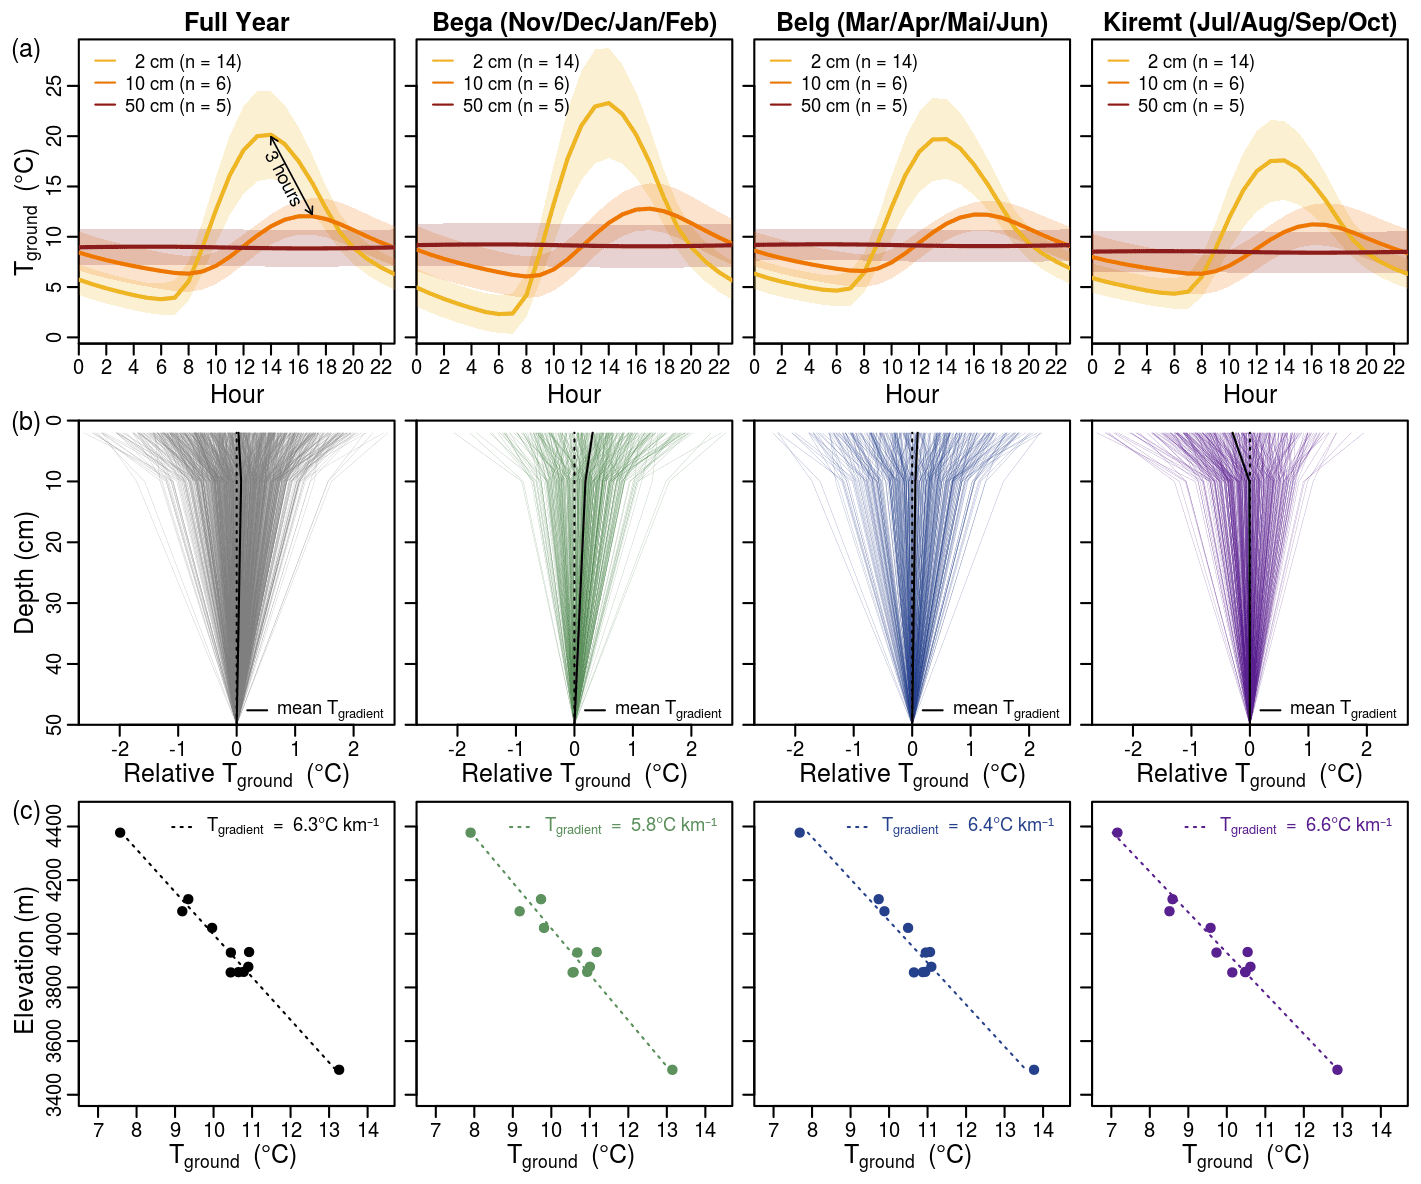
Figure 6(a) Mean diurnal ground temperature cycle at 2, 10, and 50 cm depth averaged over all data loggers from the same depth for the period 1 February 2017 to 20 January 2020 and separately for the dry season (Bega) and two rainy seasons (Belg and Kiremt). The shaded areas display the spectrum (standard deviation) of diurnal ground temperature cycles originating from the different logger locations. (b) Daily ground temperature profiles for the period 1 February 2017 to 20 January 2020. Each line represents a mean daily ground temperature profile averaged over the five locations where data loggers were installed at 2, 10, and 50 cm depth. (c) Annual and seasonal ground temperature gradients between 3493 and 4377 m for the period 1 February 2017 to 20 January 2020 considering all data loggers installed at 2 cm depth (excluding the “cold-biased” GT01t logger from the northern slope of Mount Wasama, the “warm-biased” GT02t logger from the southern slope of Mount Wasama, and the “warm-biased” TM02t logger from the Wasama Valley).
4.3 Influence of slope orientation and vegetation on ground temperature
The comparative experiment on Mount Wasama in the northern part of the Bale Mountains (Fig. 1) shows clear differences between the thermal regime of the southern and northern slopes (Fig. 8a). The southern slope is on average more than 2 ∘C warmer and reveals a more pronounced seasonality and larger diurnal amplitude, which favours freezing and thawing and might explain the exclusive presence of solifluction lobes on the southern slope. While the mean daily temperature on the southern slope peaks towards the end of the dry (i.e. cloudless) season (January to February), when the insolation on south-facing slopes at 7∘ N is highest, it reaches its maximum on the northern slope a few months later, when the insolation on north-facing slopes is at its maximum in the Bale Mountains. However, the ground temperature peak and amplitude on the northern slope are subdued as the period of highest insolation coincides with the rainy season (Fig. 8a, c).
The ground temperature differences between vegetated and unvegetated areas on the Sanetti Plateau are less obvious (Fig. 8b). Small Erica trees and bushes reduce the diurnal temperature amplitudes of the ground they are shading (Fig. 8d), but the vegetation itself has only little impact on the seasonal ground temperature variations. Like on Mount Wasama, both south-exposed logger locations on Tullu Dimtu (vegetated and unvegetated; TM09m and TM08m) have their temperature maxima at the end of the dry season. The vegetated and unvegetated monitoring sites in the flat part of the plateau (TM10m and TM07m) heat up rather during May to July. This means that slope orientation has a larger impact on annual ground temperature variations, whereas vegetation mainly affects short-term variability and the diurnal amplitude (Fig. 8b, d).
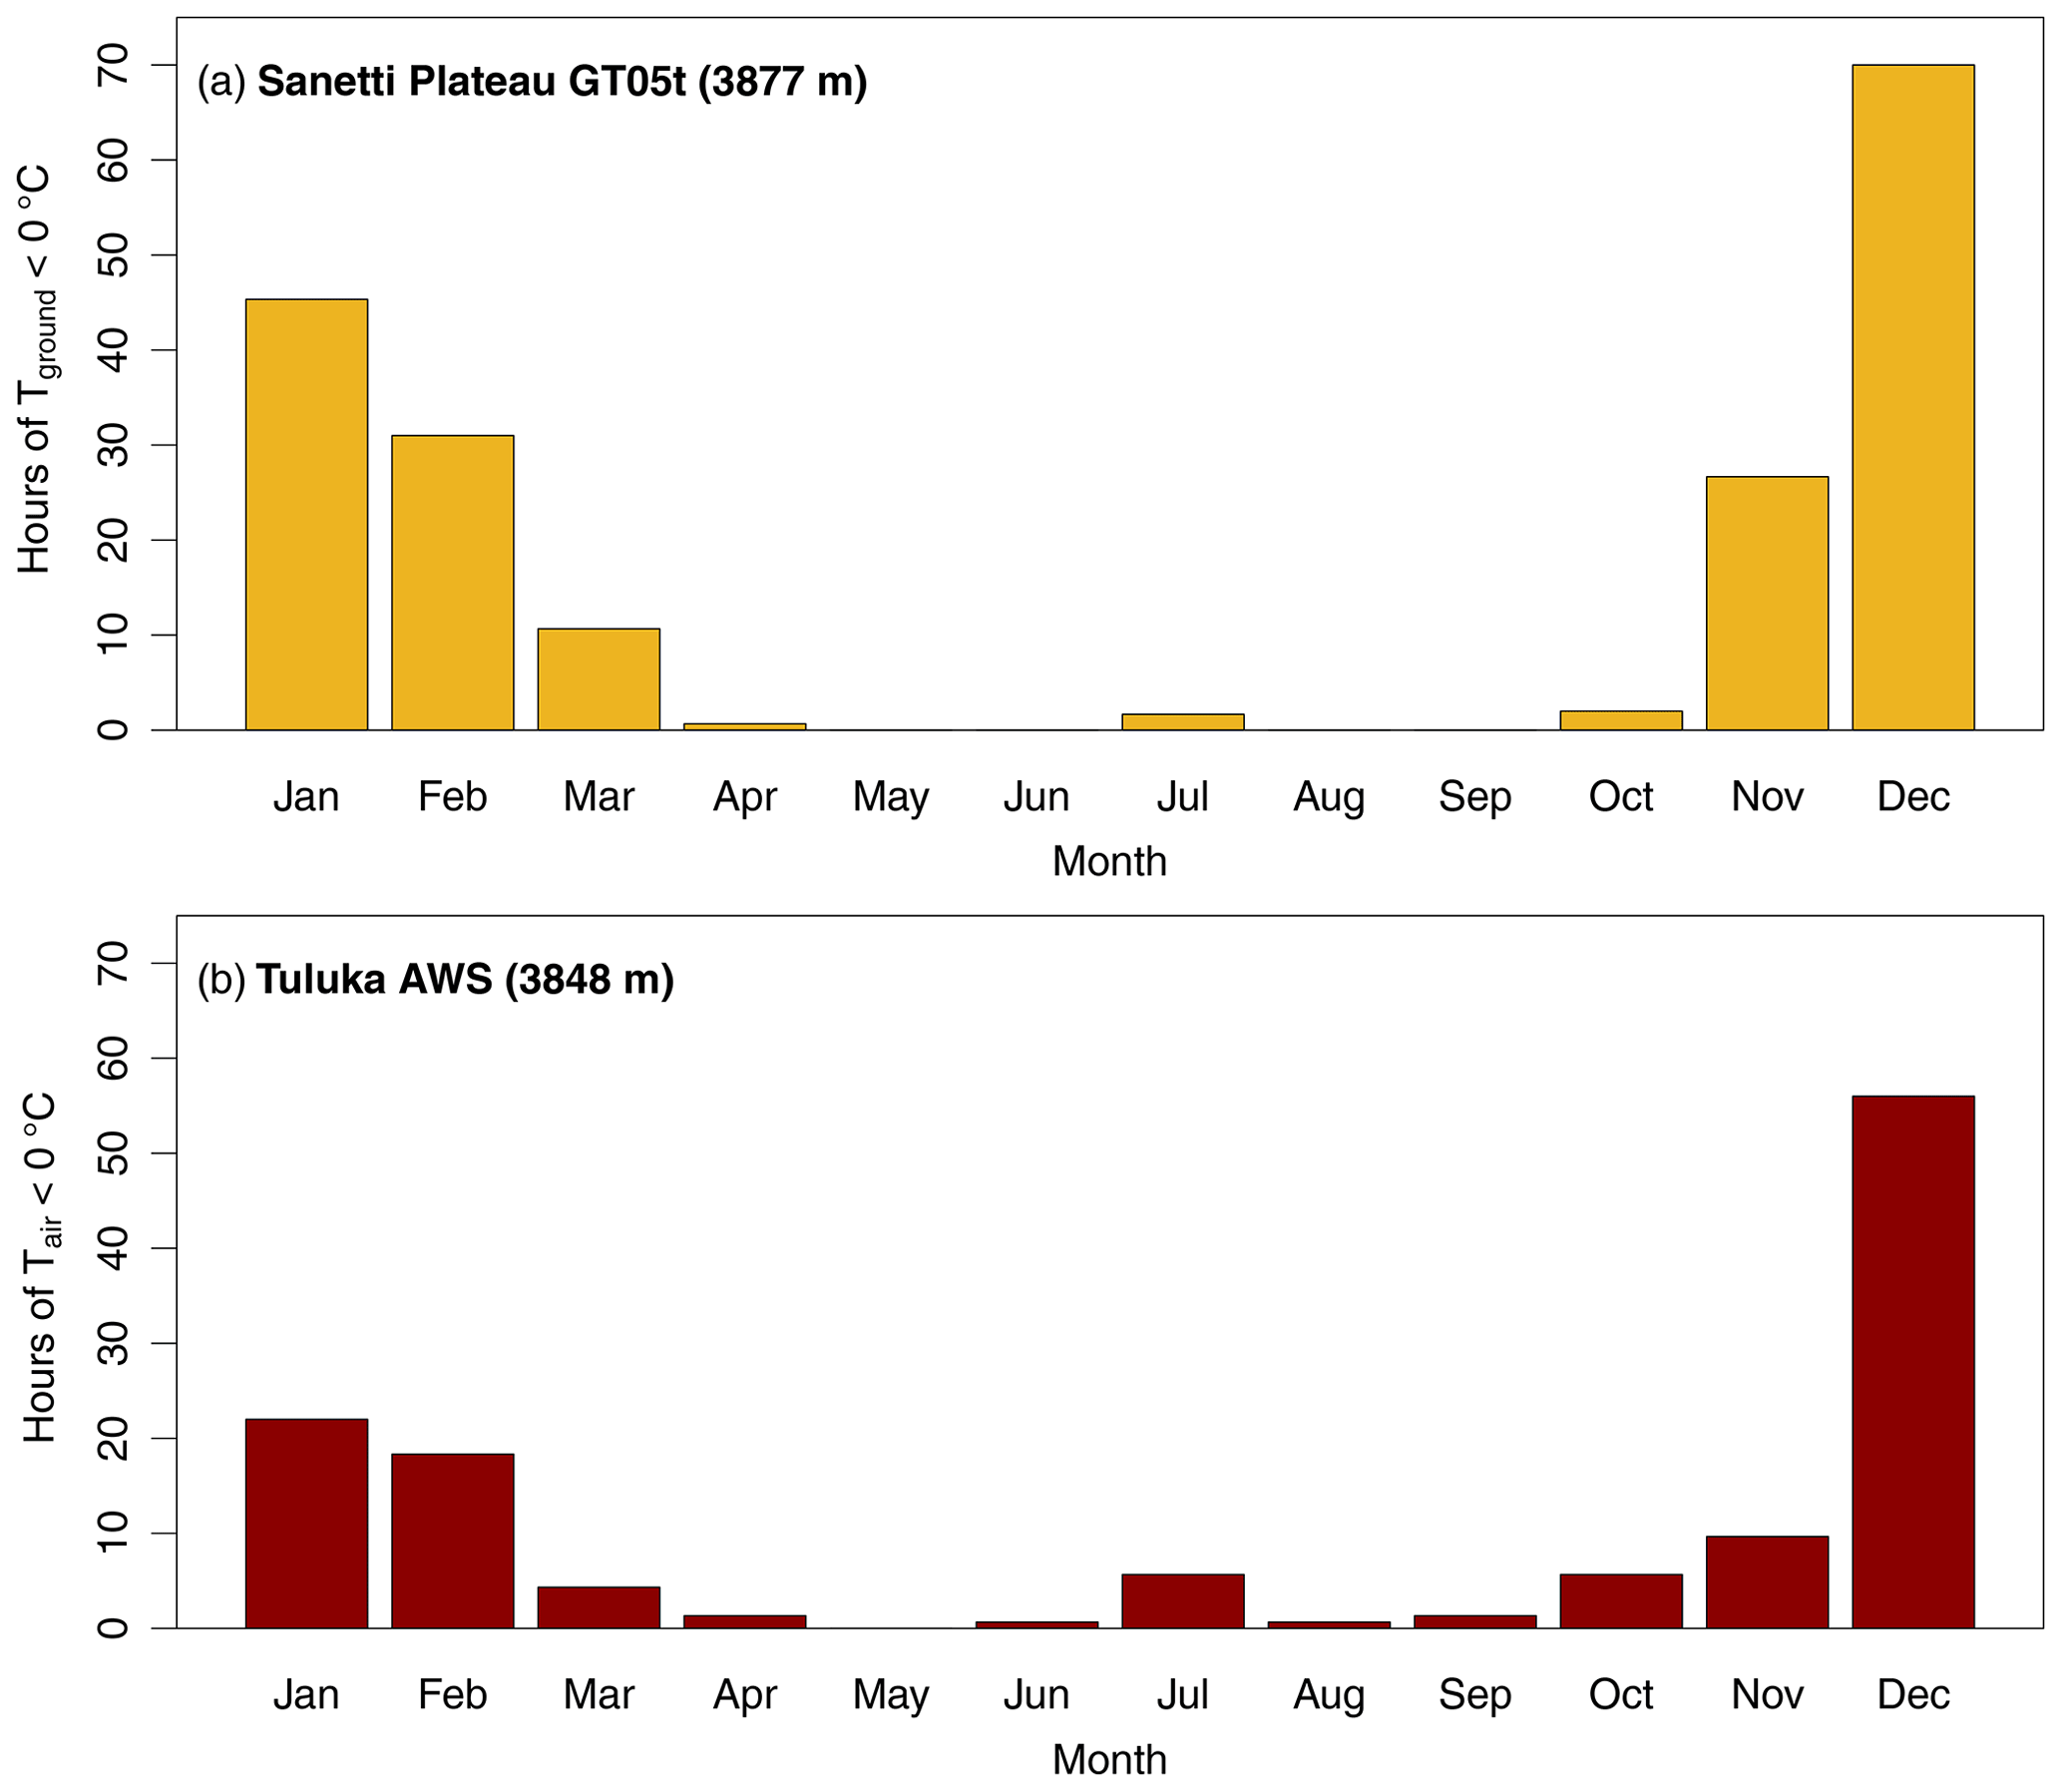
Figure 7(a) Hours of ground frost (Tground < 0 ∘C) per month (3-year mean, 2017–2020) at 2 cm depth on the southern Sanetti Plateau as measured by data logger GT05t. (b) Hours of Tair below 0 ∘C per month (3-year mean, 2017–2020) at the Tuluka AWS. Note that frost occurs predominantly during the dry season “Bega” from November to February.
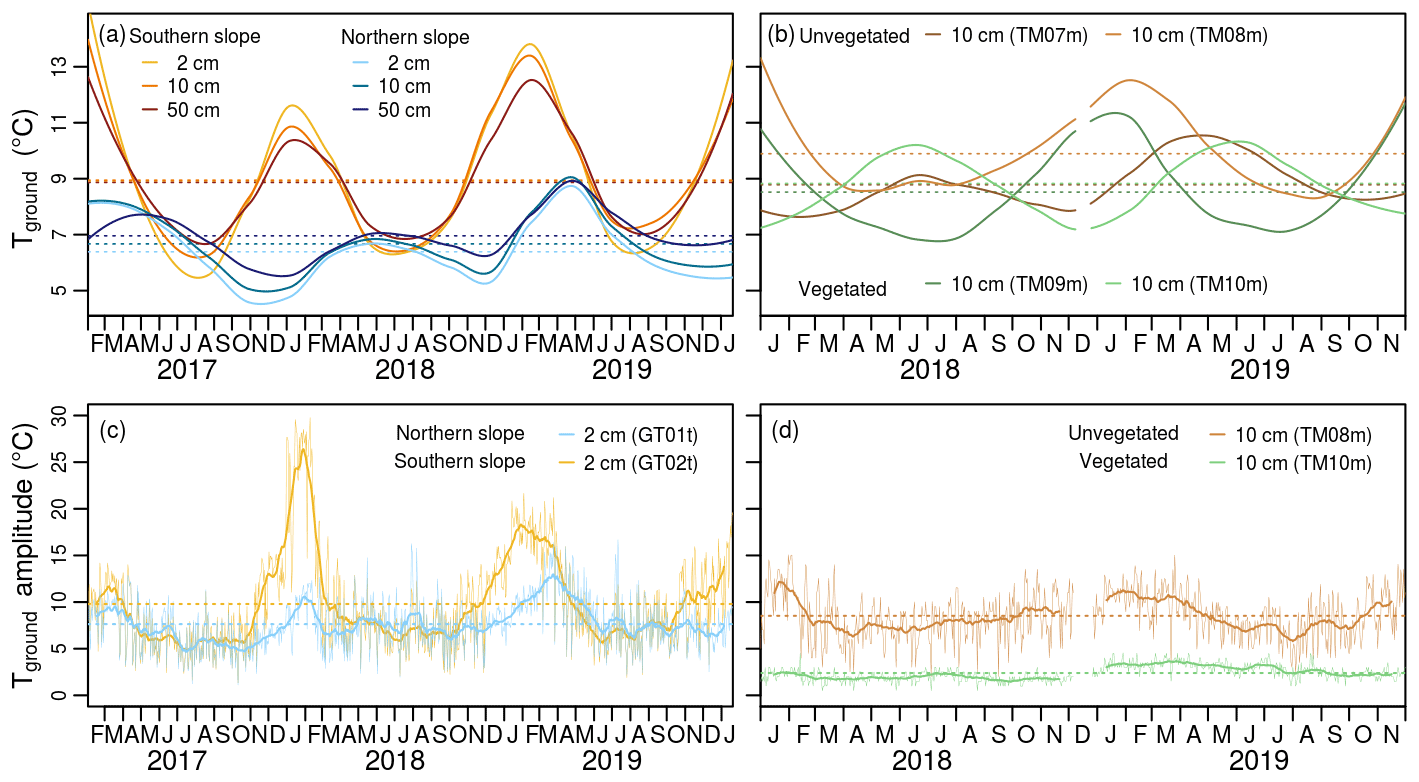
Figure 8(a) Comparison between smoothed hourly ground temperatures at 2, 10, and 50 cm depth on the northern slope (elevation: 4181 m; data loggers: GT01t, GT01m, and GT01b) and on the southern slope (4153 m; GT02t, GT02m, and GT02b) of Mount Wasama. (b) Comparison between smoothed ground temperatures at 10 cm depth at sites with an Erica cover and sites without. Note that the data loggers TM07m and TM10m are located on west-exposed slopes, while TM08m and TM09m are located on south-exposed slopes. A local regression with a smoothing span of 0.32 was applied to derive long-term ground temperature variations from hourly measurements. The colour-coded dashed lines indicate the mean of each time series. (c) Daily ground temperature amplitude of data loggers GT01t and GT02t and (d) data loggers TM08m and TM10m. The bold lines represent smoothed daily values using a simple moving average with a window size of 31 d.
The presented ground temperature dataset from the tropical Bale Mountains in the southern Ethiopian Highlands comprises hourly measurements from multiple depths and sites along an elevation gradient from 3493 up to 4377 m. Besides the measurements that have been obtained in the course of the permafrost monitoring programme on Kilimanjaro (Yoshikawa et al., 2021), the multiannual dataset from the Bale Mountains represents the most comprehensive ground temperature observation from an afro-alpine study site. Many of the installed data loggers were collected in January 2020 after 3 years of operation, but the hourly ground temperature monitoring will be continued at five sites between 3877 and 4377 m on the Sanetti Plateau and on Mount Wasama (see Fig. 1) to study the long-term climate and environmental change at high elevation. The data that will be obtained in the future will also be made publicly available via the repository stated in Sect. 6 (“Data availability”). We intend to update the repository on an annual basis.
Both types of data loggers installed in the Bale Mountains have reliably and accurately measured ground temperature. While the high-quality scientific data loggers are recommended for long-term monitoring, the low-cost loggers are only adequate for temporary experiments due to their limited memory capacity and irreplaceable battery. To avoid vandalism and the loss of equipment, our experience shows that natural markers such as stones and dwarf shrubs are more suitable for tagging the data logger's position than coloured plastic poles, especially in populated and touristic mountain regions. The large number of installed data loggers in a remote mountain area with incomplete mobile network coverage requires a high level of maintenance. However, the advantage of a monitoring network consisting of numerous loggers is twofold: firstly, a greater variety of locations can be monitored; secondly, data gaps in one particular time series can be filled using data from a nearby monitoring site. The large number of monitoring sites in the Bale Mountains enabled us to generate a gapless 3-year hourly ground temperature dataset. Since other deterministic or stochastic methods such as machine learning might further improve the data-gap-filling in the original time series (e.g. Lepot et al., 2017), we are publishing the original log files along with the post-processed ground temperature dataset.
Although an in-depth evaluation of the presented dataset is beyond the scope of this contribution, the conducted statistical analysis provides fundamental insights into the ground thermal regime and into the spatio-temporal variations in ground temperature in the Ethiopian Highlands. Relict large sorted stone stripes and polygons on the Sanetti Plateau are a strong indicator for sporadic permafrost or at least seasonal ground frost in the Bale Mountains during the Late Pleistocene (Groos et al., 2021b). However, the current mean annual ground temperature in the range of 7 to 11 ∘C at the highest sites (Fig. 4) suggests that contemporary permafrost is either absent or restricted to isolated patches in the southern Ethiopian Highlands. Recent studies indicate that contemporary permafrost in Africa occurs at the highest mountain, Kilimanjaro (Yoshikawa et al., 2021), and outside the tropics, at the upper reaches of the High Atlas (Vieira et al., 2017). Similar to the thermal conditions on Mount Kenya (Grab et al., 2004), nocturnal superficial ground frost is common in the Bale Mountains during the dry season (Figs. 7 and D1) and favours the formation of typical small-scale periglacial landforms (Groos et al., 2021b). Because of the strong insolation in the tropics, the diurnal ground temperature amplitude near the surface can be more than 30 to 40 ∘C (see Figs. 8c and B3).
The comparison of the observed ground temperatures with meteorological data from the Sanetti Plateau shows that the mean annual air temperature is 5.6 ∘C lower than the ground temperature at the same elevation. The offset can be explained by the strong insolation and relatively low air density at the highest tropical mountains. A similar offset between the mean annual air temperature and ground temperature has also been observed on Kilimanjaro (Yoshikawa et al., 2021). Moreover, the comparison on the Sanetti Plateau suggests that temporal ground temperature variations are predominantly controlled by fluctuations in the net radiation as well as changes in the groundwater content, which regulates the thermal balance through heat absorption and evaporative cooling (Fig. 5). Vegetation dampens the diurnal ground temperature amplitude, whereas slope orientation determines the seasonal timing and amplitude of the ground temperature maxima (Fig. 8). To calculate long-term ground temperature trends and assess ongoing climate and environmental change in the afro-alpine belt, the established time series need to be further extended.
Continuous observational data with a high temporal resolution such as the ground temperature time series presented here serve a wide range of scientific needs, from the validation of remote sensing products (Kraaijenbrink et al., 2018) and the application of numerical models (e.g. Groos et al., 2021b) to the monitoring of climate and environmental changes and the investigation of ground thermal regimes (e.g. Grab et al., 2004; Vieira et al., 2017; Yoshikawa et al., 2021). The ground temperature data along with the meteorological data from the Bale Mountains provide a robust basis to characterise the meteorological and environmental peculiarities of the afro-alpine belt in the Ethiopian Highlands. Geo-statistical and machine learning techniques have been applied in other studies to create high-resolution maps of temperature, precipitation, and humidity for Mount Kilimanjaro on the basis of meteorological data from different sites (see Appelhans et al., 2016). Due to the large number of monitoring sites in the Bale Mountains, the ground temperature data could be analysed in a similar way to generate maps of spatial ground temperature variations. Moreover, for mountain regions where both air and ground temperature are measured simultaneously, their statistical relationship can principally be used to generate air temperature maps from remotely sensed land surface temperatures (e.g. Pepin et al., 2016). In the Bale Mountains, distributed meteorological, ecological, and ground temperature data are of particular interest to better understand the relationship between spatial ground property variations and the scattered distribution of Erica trees across the Sanetti Plateau (Miehe and Miehe, 1994; Lemma et al., 2019; Mekonnen et al., 2019) as well as the scattered occurrence of endemic giant root rats (Tachyoryctes macrocephalus) that spend most of their time in large underground nests in the afro-alpine belt (Vlasatá et al., 2017).
Besides the aforementioned ecological topics, in situ ground temperature data are also required to study freeze–thaw cycles in the afro-alpine belt with the aim to elucidate the implications for the formation of contemporary periglacial landforms (e.g. Grab et al., 2004). Moreover, the current measurements are required as a modern reference to estimate the Late Pleistocene cooling that probably provided the preconditions for the formation of the relict sorted patterned ground on the Sanetti Plateau (Groos et al., 2021b). Given that the monitoring is continued successfully over the next years, the extended ground temperature dataset may be evaluated in terms of the elevation-dependent warming observed in other mountain ranges worldwide (e.g. Pepin et al., 2015). Eventually, the ground temperature dataset may also be used to validate satellite-based or drone-based thermal imagery (e.g. Kraaijenbrink et al., 2018) and, in combination with the meteorological data, to evaluate the performance of regional climate models in the mountains and highlands of eastern Africa (e.g. Collier et al., 2019).
The multiannual ground temperature dataset from the Bale Mountains (Ethiopian Highlands) can be downloaded via the open-access repository Zenodo: https://doi.org/10.5281/zenodo.6047457 (Groos et al., 2022). The repository contains a readme file (“readme.txt”), a GeoPackage (“Data_Logger_Location.gpkg”), a thermal infrared time-lapse video (“thermal_infrared_time-lapse_video.mp4”; see Video supplement), a metadata file for the video (“video_metadata.txt”), and two compressed sub-folders (“raw_data” and “processed_data”).
The GeoPackage provides information on the location and environmental setting of each logger and can be easily opened and displayed in a geographic information system. The coordinate reference system is WGS84 (EPSG code: 4326).
The folder “raw_data” contains the original log files of all GT and TM data loggers (see Table 1) in a tab-delimited text format with the logger ID and download date encoded in the file name. The date format of the GT data loggers is YYYY.MM.DD hh:mm:ss East Africa Time (EAT). The date format of the TM data loggers is DD.MM.YYYY hh:mm:ss EAT.
The folder “processed_data” contains the followings two files:
-
“hourly_hround_temperatures.csv” is a compilation of hourly ground temperature data from all GT and TM data loggers installed in the Bale Mountains (see Table 1). The dataset covers the period from 1 January 2017 to 31 January 2020, but individual time series may be shorter or contain data gaps (see Fig. 3). We use the international date format (ISO 8601): YYYY-MM-DD hh:mm:ss EAT. The following numerical indices (or a combination of them) in the columns starting with “Flag_*” are used to provide additional information on the post-processing of each hourly measurement of each time series: 0 (no data available), 1 (original data, no post-processing), 2 (data interpolated to full hour), 3 (erroneous data corrected), 4 (erroneous data removed), 5 (data gap-filled).
-
“information_sheet_data_gap-filling.ods” is an overview table with relevant information regarding the filling of (longer) data gaps in the ground temperature time series. The gap-filling procedure based on simple linear regression models is described individually for each logger.
The meteorological data from the 10 automatic weather stations in the Bale Mountains, which have been operated since 2017, are currently post-processed and analysed in the framework of the DFG Research Unit 2358 “The Mountain Exile Hypothesis”. The data will be made publicly available at some point in the future. However, individual access to the weather station data may be granted before on request to the coordination board of the research unit (bale@staff.uni-marburg.de).
Although tropical mountains and highlands in Africa are under pressure because of anthropogenic climate and land-use change, long-term monitoring programmes of essential climate and environmental variables are lacking in most afro-alpine areas. To characterise and continuously monitor the meteorological and ecological conditions of Africa's largest tropical afro-alpine environment in the Bale Mountains (southern Ethiopian Highlands), 29 ground temperature data loggers have been installed at 16 sites along an elevation gradient from 3493 to 4377 m since the beginning of 2017. On the basis of the original time series, a complete 3-year ground temperature dataset with a temporal resolution of 1 h has been generated for this remote high-elevation site. At five sites above ∼3900 m, the monitoring will be continued to trace long-term climate and environmental changes. The 3-year time series provide insights in the spatio-temporal variations in ground temperature and reveal the impact of certain meteorological variables, groundwater content, vegetation, and slope orientation on these variations. Moreover, the data show the frequent occurrence of nocturnal ground frost in the afro-alpine belt to a depth of about 5 cm. However, the mean annual ground temperatures of more than 7 ∘C on the highest peaks suggest that permafrost in the southern Ethiopian Highlands is either absent or restricted to isolated patches. To promote the further use of the ground temperature dataset by the wider research community, it is made freely available together with the original log files via the open-access repository Zenodo (Groos et al., 2022). The dataset may serve a wide range of scientific applications, ranging from the validation of remote sensing products and the modelling of spatial ground temperature variations to the investigation of certain natural processes such as the formation of periglacial landforms or the geographic distribution of species that live underground such as the giant root rat.
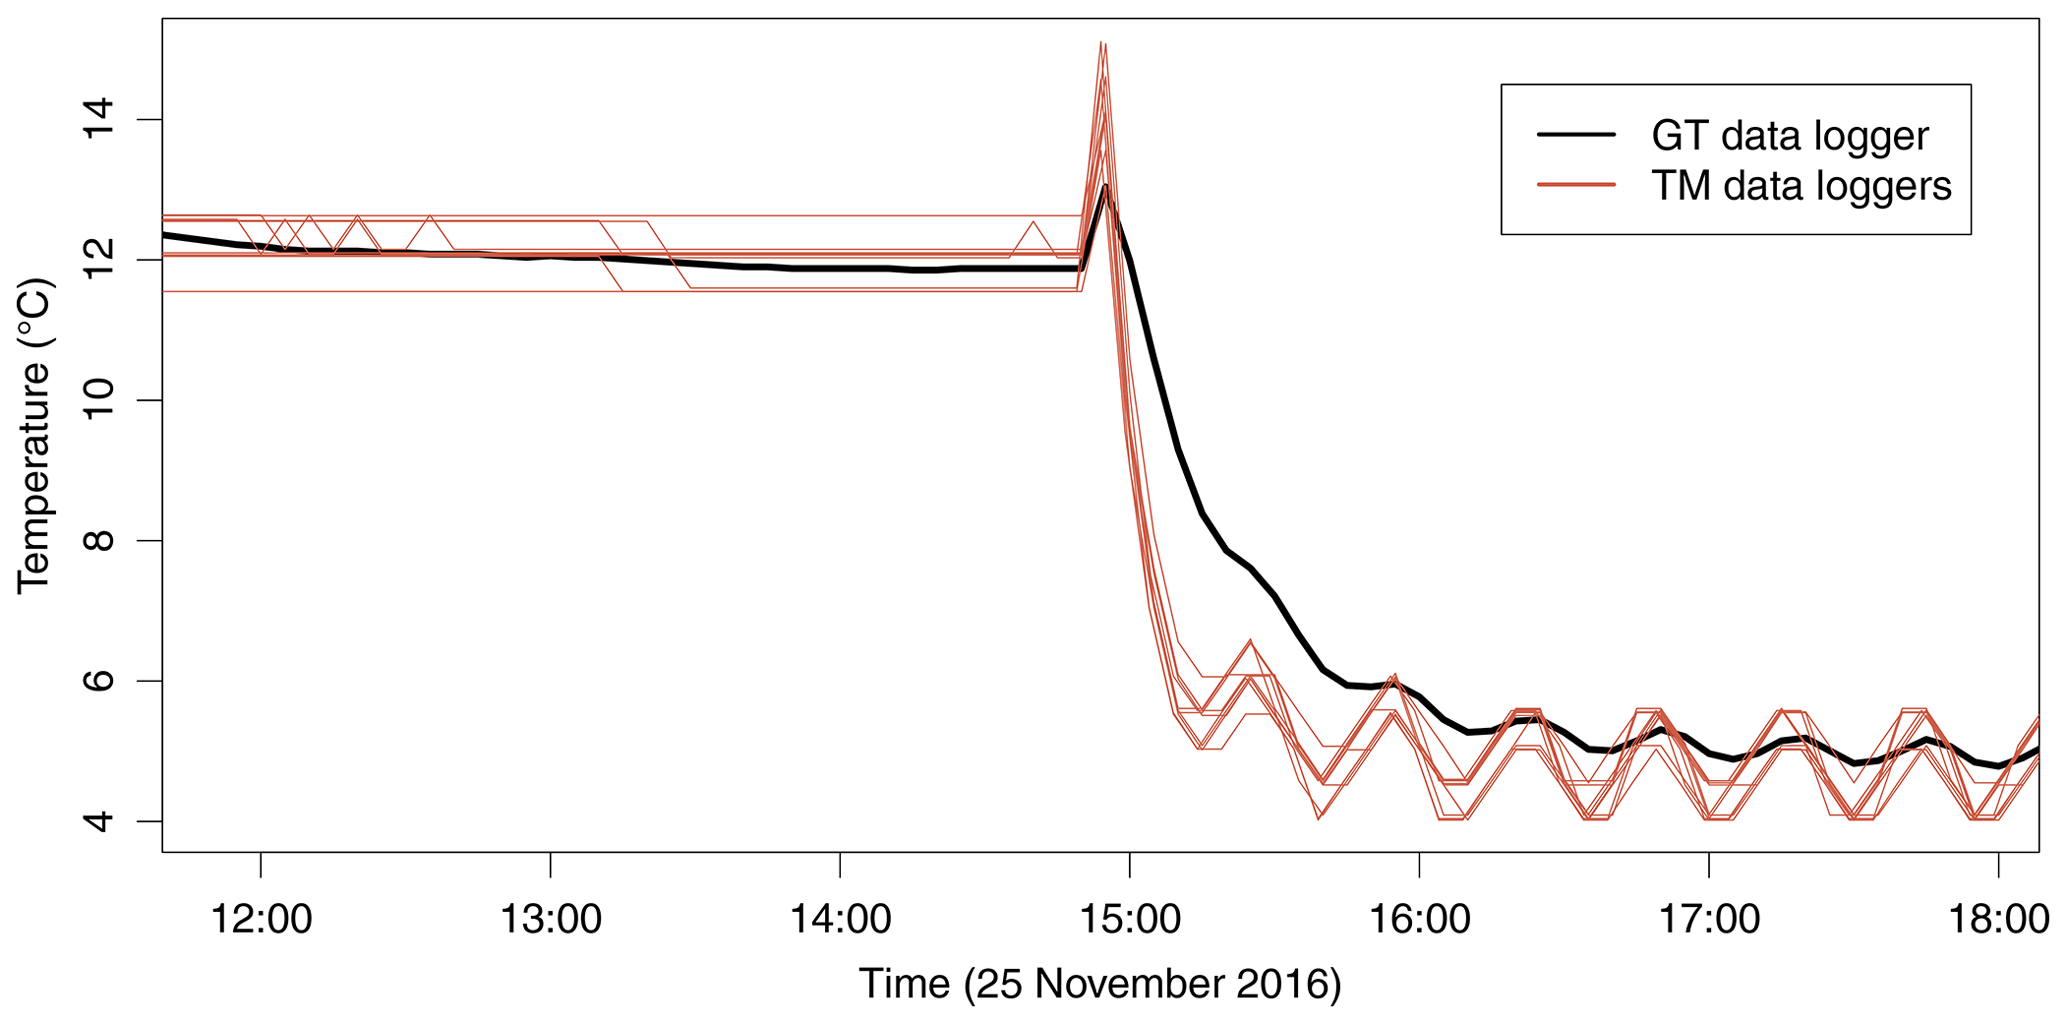
Figure A1Comparative measurement of the TM data loggers with a high-quality GT data logger as a reference. The experiment was conducted over 6 h at 4 and 12 ∘C in a fridge in the lab. The sampling interval was 15 min. Note that the GT data logger has a longer response time than the TM data loggers as it was designed primarily for measuring ground temperatures and not ambient air temperatures. The offset between the TM data loggers and the GT data logger is less than the measuring accuracy of the TM loggers (±0.5 ∘C at −10 to 65 ∘C).

Figure B1Scatter plots of measured vs. modelled ground temperature for each time series that was gap-filled using a linear regression model and data from a logger in the vicinity. Colour code according to Fig. 3. The data period and regression equations considered for the validation procedure of each time series are provided in the supplementary file “information_sheet_data_gap-filling.ods” (see Sect. 6).
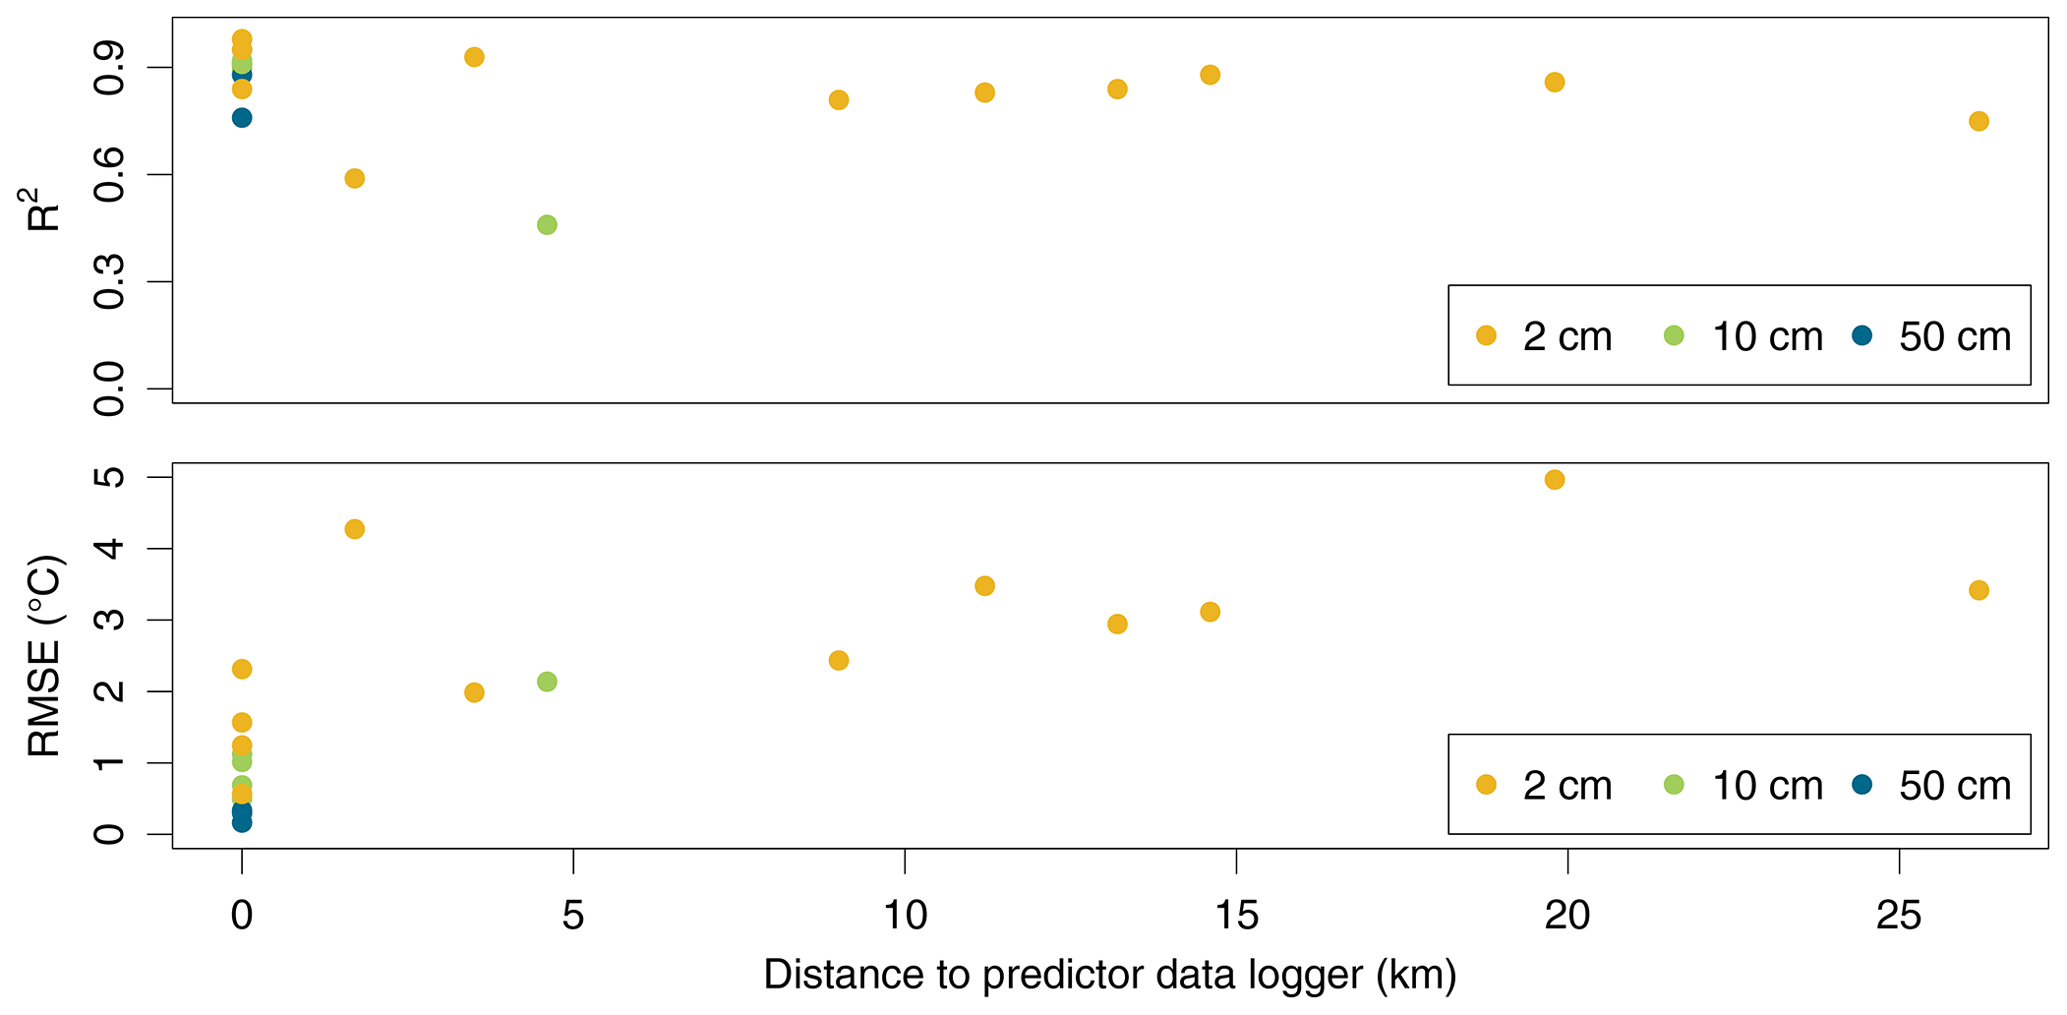
Figure B2Coefficient of determination (R2) and root mean square error (RMSE) of each gap-filled ground temperature time series with respect to the absolute distance (in kilometres) to the data logger (predictor) used for the gap-filling procedure. Please refer to Sect. 3.3 and the supplementary file “information_sheet_data_gap-filling.ods” (Sect. 6) for more details regarding the gap-filling procedure.
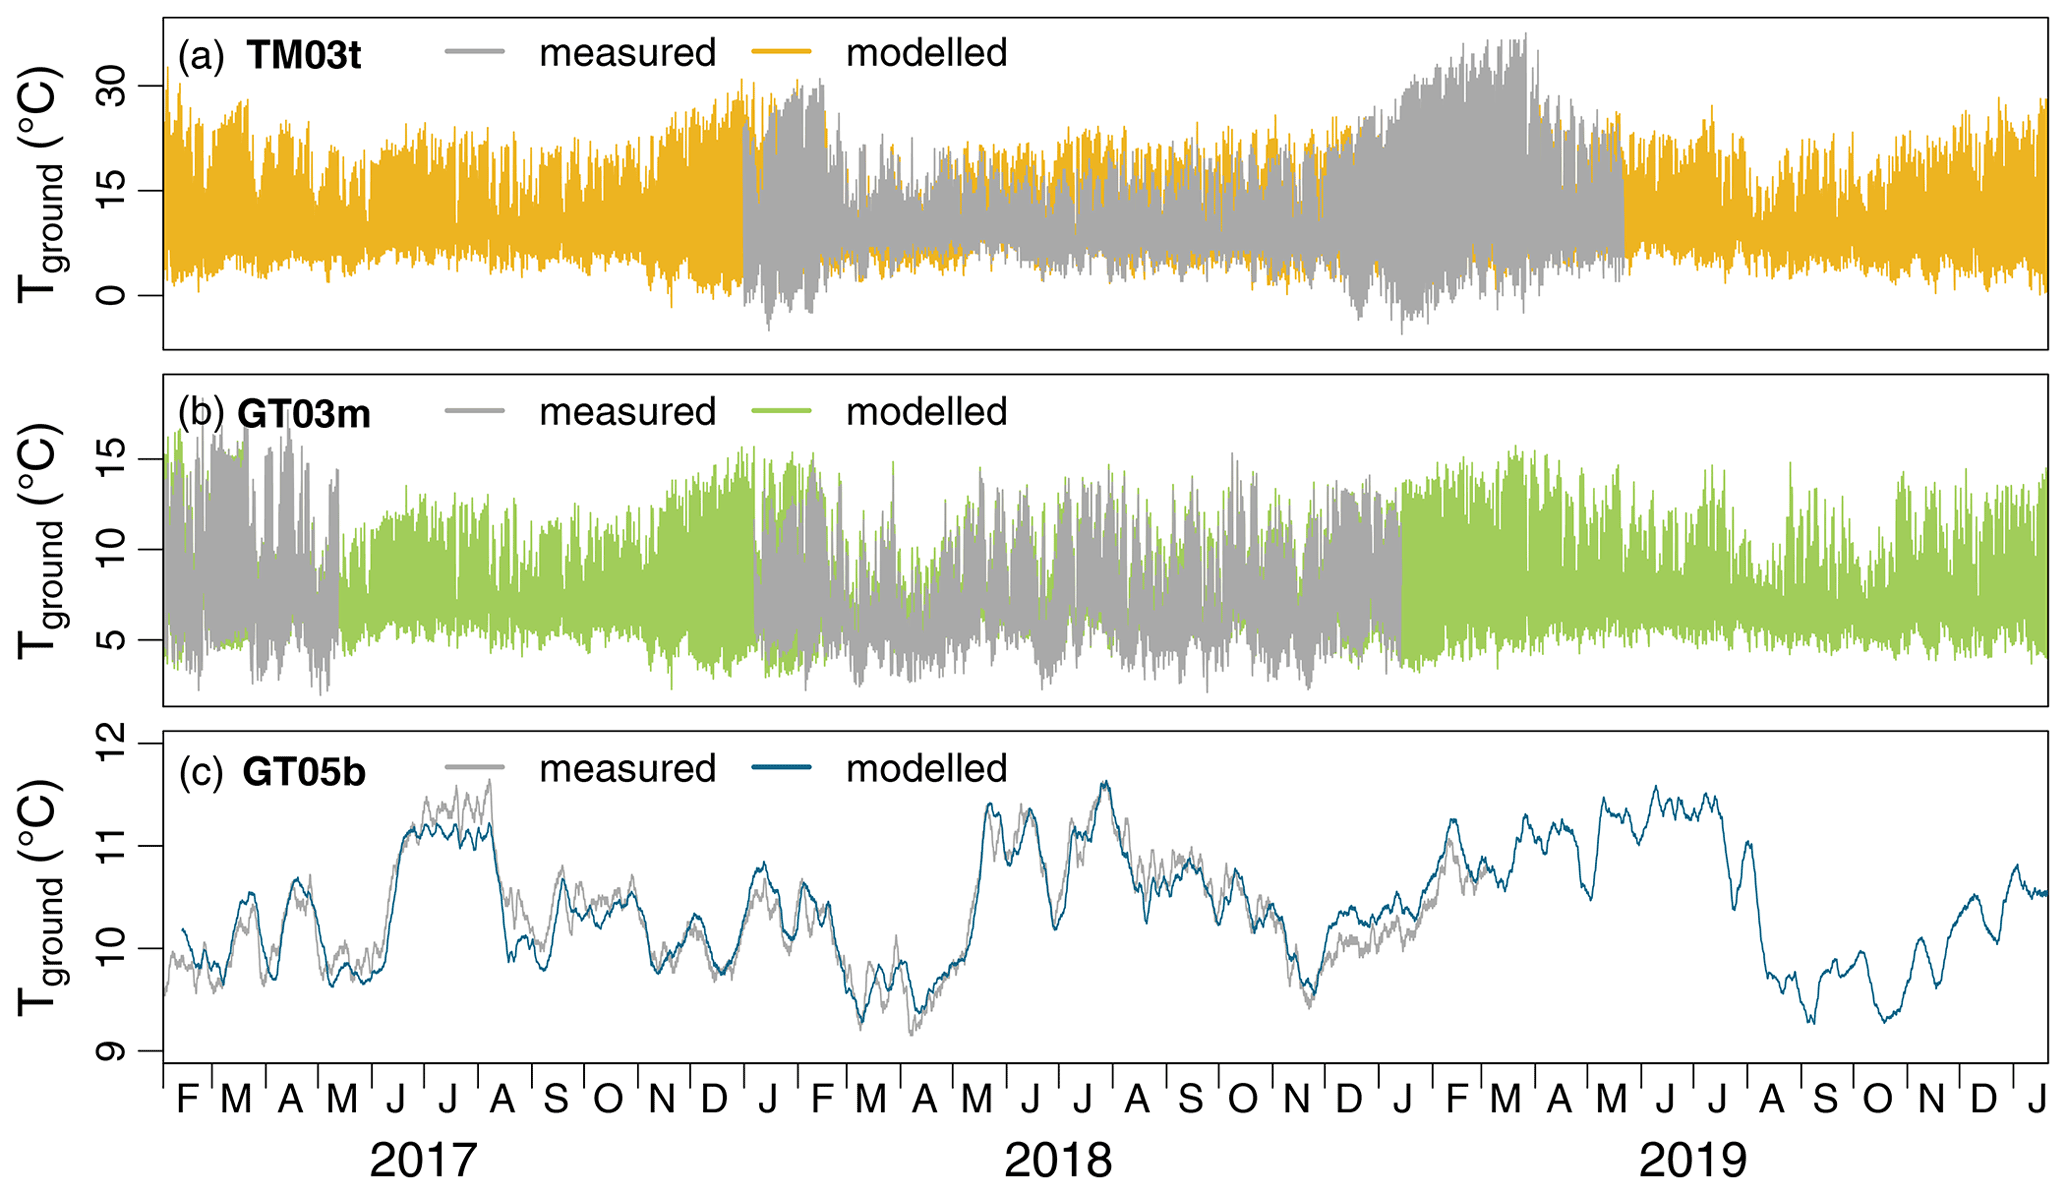
Figure B3Examples of gap-filled hourly ground temperature time series at (a) 2 cm, (b) 10 cm, and (c) 50 cm depth using a simple linear regression model and data from a logger in the vicinity. Please refer to Sect. 3.3 and the supplementary file “information_sheet_data_gap-filling.ods” (Sect. 6) for more details regarding the gap-filling procedure.

Figure C1Thermal infrared photo of the Wasama Valley from 23 January 2020 at about 05:30 local time (EAT). Orange to red colours indicate higher temperatures, whereas blue to black colours show lower temperatures. The location of the camera was close to the ground temperature logger TM03t (see Fig. 1). The view is to the east. The valley drains from the left and right in the photo background to the lowest areas in the bottom right. The corresponding thermal infrared time-lapse video is included in the Zenodo repository (Groos et al., 2022) and can be watched online: https://vimeo.com/676294827 (Groos, 2022).

Figure D1Estimated maximum frost penetration depth at logger location GT05 on the southern Sanetti Plateau assuming a linear ground temperature gradient between 2 and 10 cm depth (i.e. between loggers GT05t and GT05m). Only hourly measurements in the period February 2017 to January 2020 when Tground at 2 cm depth was below 0 ∘C were considered. The potential frost penetration depth is represented by the intersection of the blue and black lines. As the temperature profiles in the upper centimetres of the ground usually follow a nonlinear rather than a linear function, the actual frost penetration depth was probably less than the estimated one.
The supplemental thermal infrared time-lapse video (https://vimeo.com/676294827) (Groos, 2022) visualises the phenomenon of nocturnal cold-air drainage and ponding in the Wasama Valley in the Bale Mountains, Ethiopia (for more information see Appendix C and the metadata file in Sect. 6).
ARG, HV, NA, and WZ designed the research concept. ARG, HV, and NA installed the ground temperature data loggers. ARG, BL, and MF maintained the ground temperature monitoring network and read out the data. ARG and JN processed and analysed the ground temperature data. FH, BL, MF, and LW set up and maintained the weather stations. FH and LW processed the meteorological data, and ARG analysed them. ARG drafted the manuscript and created the figures. All authors contributed to the final version of the paper.
The contact author has declared that neither they nor their co-authors have any competing interests.
Publisher's note: Copernicus Publications remains neutral with regard to jurisdictional claims in published maps and institutional affiliations.
We thank the Ethiopian Wildlife Conservation Authority, the College of Natural and Computational Sciences (Addis Ababa University), the Department of Plant Biology and Biodiversity Management (Addis Ababa University), the Philipps University of Marburg, the Frankfurt Zoological Society, the Ethiopian Wolf Project, and the Bale Mountains National Park for their cooperation and permission to conduct fieldwork. We also very much appreciate the support of Beriso Kemal, Edris Abduku, Mohammed Kedir, Temame, Terefe Endale, Geremew Mebratu, Sabrina Erlwein, Lukas Munz, Julian Struck, Wege Abebe, Aschalew Gashaw, Katinka Thielsen, Tiziana Koch, and Georg Miehe, without whom it would not have been possible to install and maintain the comprehensive ground temperature monitoring network in the Ethiopian Highlands. Last, we thank the editor Giulio G. R. Iovine, Nick Pepin, and two anonymous reviewers for their constructive remarks during review, which greatly enhanced the structure and quality of the paper and dataset.
This research has been supported by the Swiss National Science Foundation (SNSF; grant no. 200021E-165446/1) and the German Research Foundation (DFG) in the framework of the joint Ethio-European Research Unit 2358 “The Mountain Exile Hypothesis”.
This paper was edited by Giulio G. R. Iovine and reviewed by Nick Pepin and two anonymous referees.
Appelhans, T., Mwangomo, E., Otte, I., Detsch, F., Nauss, T., and Hemp, A.: Eco-Meteorological Characteristics of the Southern Slopes of Kilimanjaro, Tanzania, Int. J. Climatol., 36, 3245–3258, https://doi.org/10.1002/joc.4552, 2016. a, b
Beniston, M., Diaz, H. F., and Bradley, R. S.: Climatic Change at High Elevation Sites: An Overview, Climatic Change, 36, 233–251, https://doi.org/10.1007/978-94-015-8905-5_1, 1997. a
Bittner, L., Gil-Romera, G., Grady, D., Lamb, H. F., Lorenz, E., Weiner, M., Meyer, H., Bromm, T., Glaser, B., and Zech, M.: The Holocene Lake-Evaporation History of the Afro-Alpine Lake Garba Guracha in the Bale Mountains, Ethiopia, Based on δ18O Records of Sugar Biomarker and Diatoms, Quaternary Res., 1–14, https://doi.org/10.1017/qua.2021.26, online first, 2021. a
Bojinski, S., Verstraete, M., Peterson, T. C., Richter, C., Simmons, A., and Zemp, M.: The Concept of Essential Climate Variables in Support of Climate Research, Applications, and Policy, B. Am. Meteorol. Soc., 95, 1431–1443, https://doi.org/10.1175/BAMS-D-13-00047.1, 2014. a
Buytaert, W., Célleri, R., De Bièvre, B., Cisneros, F., Wyseure, G., Deckers, J., and Hofstede, R.: Human Impact on the Hydrology of the Andean Páramos, Earth-Sci. Rev., 79, 53–72, https://doi.org/10.1016/j.earscirev.2006.06.002, 2006. a
Buytaert, W., Cuesta-Camacho, F., and Tobón, C.: Potential Impacts of Climate Change on the Environmental Services of Humid Tropical Alpine Regions: Climate Change and Environmental Services, Glob. Ecol. Biogeogr., 20, 19–33, https://doi.org/10.1111/j.1466-8238.2010.00585.x, 2011. a, b, c
Chignell, S. M., Laituri, M. J., Young, N. E., and Evangelista, P. H.: Afroalpine Wetlands of the Bale Mountains, Ethiopia: Distribution, Dynamics, and Conceptual Flow Model, Ann. Am. Assoc. Geogr., 109, 791–811, https://doi.org/10.1080/24694452.2018.1500439, 2019. a
Collier, E., Sauter, T., Mölg, T., and Hardy, D.: The Influence of Tropical Cyclones on Circulation, Moisture Transport, and Snow Accumulation at Kilimanjaro During the 2006–2007 Season, J. Geophys. Res.-Atmos., 124, 2019JD030682, https://doi.org/10.1029/2019JD030682, 2019. a
Colwell, R. K., Brehm, G., Cardelus, C. L., Gilman, A. C., and Longino, J. T.: Global Warming, Elevational Range Shifts, and Lowland Biotic Attrition in the Wet Tropics, Science, 322, 258–261, https://doi.org/10.1126/science.1162547, 2008. a
Costa, K., Russell, J., Konecky, B., and Lamb, H.: Isotopic Reconstruction of the African Humid Period and Congo Air Boundary Migration at Lake Tana, Ethiopia, Quaternary Sci. Rev., 83, 58–67, https://doi.org/10.1016/j.quascirev.2013.10.031, 2014. a
Diaz, H. F. and Bradley, R. S.: Temperature Variations During the Last Century at High Elevation Sites, Clim. Chang., 36, 253–279, https://doi.org/10.1007/978-94-015-8905-5_2, 1997. a, b
Frauenfelder, R., Isaksen, K., Lato, M. J., and Noetzli, J.: Ground thermal and geomechanical conditions in a permafrost-affected high-latitude rock avalanche site (Polvartinden, northern Norway), The Cryosphere, 12, 1531–1550, https://doi.org/10.5194/tc-12-1531-2018, 2018. a
Gebrechorkos, S. H., Hülsmann, S., and Bernhofer, C.: Long-Term Trends in Rainfall and Temperature Using High-Resolution Climate Datasets in East Africa, Sci. Rep., 9, 1–9, https://doi.org/10.1038/s41598-019-47933-8, 2019. a
Geotest: UTL-3 Temperature Datalogger, https://www.geotest.ch/en/innovation/utl-temperature-datalogger, last access: 22 February 2021. a
Gil-Romera, G., Adolf, C., Benito, B. M., Bittner, L., Johansson, M. U., Grady, D. A., Lamb, H. F., Lemma, B., Fekadu, M., Glaser, B., Mekonnen, B., Sevilla-Callejo, M., Zech, M., Zech, W., and Miehe, G.: Long-Term Fire Resilience of the Ericaceous Belt, Bale Mountains, Ethiopia, Biol. Lett., 15, 20190357, https://doi.org/10.1098/rsbl.2019.0357, 2019. a
Gottelli, D. and Sillero-Zubiri, C.: The Simien Jackal: Ecology and Conservation. The Bale Mountains Research Project, Wildlife Conservation International, New York, 1990. a
Gottelli, D., Sillero-Zubiri, C., Applebaum, G. D., Roy, M. S., Girman, D. J., Garcia-Moreno, J., Ostrander, E. A., and Wayne, R. K.: Molecular Genetics of the Most Endangered Canid: The Ethiopian Wolf Canis Simensis, Mol. Ecol., 3, 301–312, https://doi.org/10.1111/j.1365-294X.1994.tb00070.x, 1994. a
Grab, S. W., Gatebe, C. K., and Kinyua, A. M.: Ground Thermal Profiles from Mount Kenya, East Africa, Geogr. Ann. Ser. A, 86, 131–141, https://doi.org/10.1111/j.0435-3676.2004.00219.x, 2004. a, b, c, d
Groos, A. R.: Nocturnal cold-air drainage and ponding in the Bale Mountains, Ethiopia, Vimeo [video], https://vimeo.com/676294827, last access: 26 January 2022. a, b
Groos, A. R., Akçar, N., Yesilyurt, S., Miehe, G., Vockenhuber, C., and Veit, H.: Nonuniform Late Pleistocene Glacier Fluctuations in Tropical Eastern Africa, Sci. Adv., 7, eabb6826, https://doi.org/10.1126/sciadv.abb6826, 2021a. a, b, c, d, e
Groos, A. R., Niederhauser, J., Wraase, L., Hänsel, F., Nauss, T., Akçar, N., and Veit, H.: The enigma of relict large sorted stone stripes in the tropical Ethiopian Highlands, Earth Surf. Dynam., 9, 145–166, https://doi.org/10.5194/esurf-9-145-2021, 2021b. a, b, c, d, e, f, g, h, i
Groos, A. R., Niederhauser, J., Lemma, B., Fekadu, M., Zech, W., Hänsel, F., Wraase, L., Akçar, N., and Veit, H.: An hourly ground temperature dataset for 16 high elevation sites (3493–4377 m a.s.l.) in the Bale Mountains, Ethiopia (2017–2020) (v1.1.2), Zenodo [data set], https://doi.org/10.5281/zenodo.6047457, 2022. a, b, c, d
Hendrickx, H., Jacob, M., Frankl, A., Guyassa, E., and Nyssen, J.: Quaternary Glacial and Periglacial Processes in the Ethiopian Highlands in Relation to the Current Afro-Alpine Vegetation, Z. Geomorphol., 59, 37–57, https://doi.org/10.1127/0372-8854/2014/0128, 2014. a
Hillman, J. C.: Bale Mountains National Park : management plan, Ethiopian Wildlife Conservation Organisation, Ministry of Agriculture, Addis Ababa, Ethiopia, 250 pp., 1986. a
Hoelzle, M., Wegmann, M., and Krummenacher, B.: Miniature Temperature Dataloggers for Mapping and Monitoring of Permafrost in High Mountain Areas: First Experience from the Swiss Alps, Permafrost Periglac., 10, 113–124, https://doi.org/10.1002/(SICI)1099-1530(199904/06)10:2<113::AID-PPP317>3.0.CO;2-A, 1999. a
Imhof, M., Pierrehumbert, G., Haeberli, W., and Kienholz, H.: Permafrost Investigation in the Schilthorn Massif, Bernese Alps, Switzerland, Permafrost Periglac., 11, 189–206, https://doi.org/10.1002/1099-1530(200007/09)11:3<189::AID-PPP348>3.0.CO;2-N, 2000. a
Kaser, G.: A Review of the Modern Fluctuations of Tropical Glaciers, Global Planet. Change, 22, 93–103, https://doi.org/10.1016/S0921-8181(99)00028-4, 1999. a
Kaser, G., Großhauser, M., and Marzeion, B.: Contribution Potential of Glaciers to Water Availability in Different Climate Regimes, P. Natl. Acad. Sci. USA, 107, 20223–20227, https://doi.org/10.1073/pnas.1008162107, 2010. a
Kraaijenbrink, P. D. A., Shea, J. M., Litt, M., Steiner, J. F., Treichler, D., Koch, I., and Immerzeel, W. W.: Mapping Surface Temperatures on a Debris-Covered Glacier With an Unmanned Aerial Vehicle, Front. Earth Sci., 6, 1–19, https://doi.org/10.3389/feart.2018.00064, 2018. a, b
Lemma, B., Mekonnen, B., Glaser, B., Zech, W., Nemomissa, S., Bekele, T., Bittner, L., and Zech, M.: Chemotaxonomic patterns of vegetation and soils along altitudinal transects of the Bale Mountains, Ethiopia, and implications for paleovegetation reconstructions – Part II: lignin-derived phenols and leaf-wax-derived n-alkanes, E&G Quaternary Sci. J., 68, 189–200, https://doi.org/10.5194/egqsj-68-189-2019, 2019. a, b
Lemma, B., Kebede Gurmessa, S., Nemomissa, S., Otte, I., Glaser, B., and Zech, M.: Spatial and Temporal 2H and 18O Isotope Variation of Contemporary Precipitation in the Bale Mountains, Ethiopia, Isot. Environ. Health Stud., 56, 1–14, https://doi.org/10.1080/10256016.2020.1717487, 2020. a, b
Lepot, M., Aubin, J.-B., and Clemens, F.: Interpolation in Time Series: An Introductive Overview of Existing Methods, Their Performance Criteria and Uncertainty Assessment, Water, 9, 796, https://doi.org/10.3390/w9100796, 2017. a
Levin, N. E., Zipser, E. J., and Cerling, T. E.: Isotopic Composition of Waters from Ethiopia and Kenya: Insights into Moisture Sources for Eastern Africa, J. Geophys. Res., 114, 1–13, https://doi.org/10.1029/2009JD012166, 2009. a
Marino, J., Sillero-Zubiri, C., and Macdonald, D.: Trends, Dynamics and Resilience of an Ethiopian Wolf Population, Anim. Conserv., 9, 49–58, https://doi.org/10.1111/j.1469-1795.2005.00011.x, 2006. a
Mekonnen, B., Zech, W., Glaser, B., Lemma, B., Bromm, T., Nemomissa, S., Bekele, T., and Zech, M.: Chemotaxonomic patterns of vegetation and soils along altitudinal transects of the Bale Mountains, Ethiopia, and implications for paleovegetation reconstructions – Part 1: stable isotopes and sugar biomarkers, E&G Quaternary Sci. J., 68, 177–188, https://doi.org/10.5194/egqsj-68-177-2019, 2019. a
Miehe, S. and Miehe, G.: Ericaceous Forests and Heathlands in the Bale Mountains of South Ethiopia – Ecology and Man’s Impact, Traute Warnke Reinbek, Hamburg, 206 pp., 1994. a, b, c, d, e, f
Mohr, P.: Ethiopian Flood Basalt Province, Nature, 303, 577–584, https://doi.org/10.1038/303577a0, 1983. a
Mölg, T., Hardy, D. R., Collier, E., Kropač, E., Schmid, C., Cullen, N. J., Kaser, G., Prinz, R., and Winkler, M.: Mesoscale atmospheric circulation controls of local meteorological elevation gradients on Kersten Glacier near Kilimanjaro summit, Earth Syst. Dynam., 11, 653–672, https://doi.org/10.5194/esd-11-653-2020, 2020. a
Mosquera, G. M., Lazo, P. X., Célleri, R., Wilcox, B. P., and Crespo, P.: Runoff from Tropical Alpine Grasslands Increases with Areal Extent of Wetlands, Catena, 125, 120–128, https://doi.org/10.1016/j.catena.2014.10.010, 2015. a
Nicholson, L. I., Prinz, R., Mölg, T., and Kaser, G.: Micrometeorological conditions and surface mass and energy fluxes on Lewis Glacier, Mt Kenya, in relation to other tropical glaciers, The Cryosphere, 7, 1205–1225, https://doi.org/10.5194/tc-7-1205-2013, 2013. a
Osmaston, H. A., Mitchell, W. A., and Osmaston, J. A. N.: Quaternary Glaciation of the Bale Mountains, Ethiopia, J. Quaternary Sci., 20, 593–606, https://doi.org/10.1002/jqs.931, 2005. a, b, c
Ossendorf, G., Groos, A. R., Bromm, T., Tekelemariam, M. G., Glaser, B., Lesur, J., Schmidt, J., Akçar, N., Bekele, T., Beldados, A., Demissew, S., Kahsay, T. H., Nash, B. P., Nauss, T., Negash, A., Nemomissa, S., Veit, H., Vogelsang, R., Woldu, Z., Zech, W., Opgenoorth, L., and Miehe, G.: Middle Stone Age Foragers Resided in High Elevations of the Glaciated Bale Mountains, Ethiopia, Science, 365, 583–587, https://doi.org/10.1126/science.aaw8942, 2019. a
Pepin, N. C. and Lundquist, J. D.: Temperature Trends at High Elevations: Patterns across the Globe, Geophys. Res. Lett., 35, L14701, https://doi.org/10.1029/2008GL034026, 2008. a
Pepin, N. C. and Seidel, D. J.: A Global Comparison of Surface and Free-Air Temperatures at High Elevations, J. Geophys. Res., 110, D03104, https://doi.org/10.1029/2004JD005047, 2005. a, b
Pepin, N. C., Bradley, R. S., Diaz, H. F., Baraer, M., Caceres, E. B., Forsythe, N., Fowler, H., Greenwood, G., Hashmi, M. Z., Liu, X. D., Miller, J. R., Ning, L., Ohmura, A., Palazzi, E., Rangwala, I., Schöner, W., Severskiy, I., Shahgedanova, M., Wang, M. B., Williamson, S. N., and Yang, D. Q.: Elevation-Dependent Warming in Mountain Regions of the World, Nat. Clim. Change, 5, 424–430, https://doi.org/10.1038/nclimate2563, 2015. a, b, c
Pepin, N. C., Maeda, E. E., and Williams, R.: Use of Remotely Sensed Land Surface Temperature as a Proxy for Air Temperatures at High Elevations: Findings from a 5000 m Elevational Transect across Kilimanjaro: MODIS LST versus Tair at high elevations, J. Geophys. Res.-Atmos., 121, 9998–10015, https://doi.org/10.1002/2016JD025497, 2016. a, b
Peters, M. K., Hemp, A., Appelhans, T., Becker, J. N., Behler, C., Classen, A., Detsch, F., Ensslin, A., Ferger, S. W., Frederiksen, S. B., Gebert, F., Gerschlauer, F., Gütlein, A., Helbig-Bonitz, M., Hemp, C., Kindeketa, W. J., Kühnel, A., Mayr, A. V., Mwangomo, E., Ngereza, C., Njovu, H. K., Otte, I., Pabst, H., Renner, M., Röder, J., Rutten, G., Schellenberger Costa, D., Sierra-Cornejo, N., Vollstädt, M. G. R., Dulle, H. I., Eardley, C. D., Howell, K. M., Keller, A., Peters, R. S., Ssymank, A., Kakengi, V., Zhang, J., Bogner, C., Böhning-Gaese, K., Brandl, R., Hertel, D., Huwe, B., Kiese, R., Kleyer, M., Kuzyakov, Y., Nauss, T., Schleuning, M., Tschapka, M., Fischer, M., and Steffan-Dewenter, I.: Climate–Land-Use Interactions Shape Tropical Mountain Biodiversity and Ecosystem Functions, Nature, 568, 88–92, https://doi.org/10.1038/s41586-019-1048-z, 2019. a, b, c
Qin, J., Yang, K., Liang, S., and Guo, X.: The Altitudinal Dependence of Recent Rapid Warming over the Tibetan Plateau, Climatic Change, 97, 321–327, https://doi.org/10.1007/s10584-009-9733-9, 2009. a
Rahbek, C., Borregaard, M. K., Colwell, R. K., Dalsgaard, B., Holt, B. G., Morueta-Holme, N., Nogues-Bravo, D., Whittaker, R. J., and Fjeldså, J.: Humboldt's Enigma: What Causes Global Patterns of Mountain Biodiversity?, Science, 365, 1108–1113, https://doi.org/10.1126/science.aax0149, 2019. a, b
Rangwala, I. and Miller, J. R.: Climate Change in Mountains: A Review of Elevation-Dependent Warming and Its Possible Causes, Climatic Change, 114, 527–547, https://doi.org/10.1007/s10584-012-0419-3, 2012. a, b
Rist, A., Roth, L., and Veit, H.: Elevational Ground/Air Thermal Gradients in the Swiss Inner Alpine Valais, Arct. Antarct. Alp. Res., 52, 341–360, https://doi.org/10.1080/15230430.2020.1742022, 2020. a
Schrott, L., Otto, J.-C., and Keller, F.: Modelling Alpine Permafrost Distribution in the Hohe Tauern Region, Austria, Austrian J. Earth Sci., 105, 169–183, 2012. a
Seleshi, Y. and Zanke, U.: Recent Changes in Rainfall and Rainy Days in Ethiopia, Int. J. Climatol., 24, 973–983, https://doi.org/10.1002/joc.1052, 2004. a
Tempmate: Temperature and humidity miniature data logger, https://www.tempmate.com/temperature-logger/tempmate-b-series/, last access: 22 February 2021. a
Tierney, J. E., Russell, J. M., Sinninghe Damsté, J. S., Huang, Y., and Verschuren, D.: Late Quaternary Behavior of the East African Monsoon and the Importance of the Congo Air Boundary, Quaternary Sci. Rev., 30, 798–807, https://doi.org/10.1016/j.quascirev.2011.01.017, 2011. a
Veettil, B. K. and Kamp, U.: Global Disappearance of Tropical Mountain Glaciers: Observations, Causes, and Challenges, Geosciences, 9, 1–25, https://doi.org/10.3390/geosciences9050196, 2019. a
Vieira, G., Mora, C., and Faleh, A.: New observations indicate the possible presence of permafrost in North Africa (Djebel Toubkal, High Atlas, Morocco), The Cryosphere, 11, 1691–1705, https://doi.org/10.5194/tc-11-1691-2017, 2017. a, b, c
Vlasatá, T., Šklíba, J., Lövy, M., Meheretu, Y., Sillero-Zubiri, C., and Šumbera, R.: Daily Activity Patterns in the Giant Root Rat (Tachyoryctes Macrocephalus), a Fossorial Rodent from the Afro-Alpine Zone of the Bale Mountains, Ethiopia, J. Zool., 302, 157–163, https://doi.org/10.1111/jzo.12441, 2017. a
Wöllauer, S., Zeuss, D., Hänsel, F., and Nauss, T.: TubeDB: An on-Demand Processing Database System for Climate Station Data, Comput. Geosci., 146, 104641, https://doi.org/10.1016/j.cageo.2020.104641, 2020. a, b
Yoshikawa, K., Hardy, D. R., Narita, K., Bolton, W. R., Stanilovskaya, J., and Sparrow, E. B.: Ground Thermal Regimes and Implications for Permafrost Distribution on Kilimanjaro, Tanzania, Arct. Antarc. Alp. Res., 53, 127–145, https://doi.org/10.1080/15230430.2021.1903375, 2021. a, b, c, d, e
- Abstract
- Introduction
- Study area
- Data and methods
- Results
- Discussion
- Data availability
- Conclusions
- Appendix A: Cross-comparison of GT and TM data loggers
- Appendix B: Data gap-filling of the ground temperature time series
- Appendix C: Nocturnal cold-air drainage and ponding in the Wasama Valley
- Appendix D: Ground frost on the Sanetti Plateau
- Video supplement
- Author contributions
- Competing interests
- Disclaimer
- Acknowledgements
- Financial support
- Review statement
- References