the Creative Commons Attribution 4.0 License.
the Creative Commons Attribution 4.0 License.
 | 05 Mar 2021
An extended time series (2000–2018) of global NPP-VIIRS-like nighttime light data from a cross-sensor calibration
Zuoqi Chen
Chengshu Yang
Yuyu Zhou
Shenjun Yao
Xingjian Qian
Congxiao Wang
Bin Wu
Jianping Wu
The nighttime light (NTL) satellite data have been widely used to investigate the urbanization process. The Defense Meteorological Satellite Program Operational Linescan System (DMSP-OLS) stable nighttime light data and Suomi National Polar-orbiting Partnership Visible Infrared Imaging Radiometer Suite (NPP-VIIRS) nighttime light data are two widely used NTL datasets. However, the difference in their spatial resolutions and sensor design requires a cross-sensor calibration of these two datasets for analyzing a long-term urbanization process. Different from the traditional cross-sensor calibration of NTL data by converting NPP-VIIRS to DMSP-OLS-like NTL data, this study built an extended time series (2000–2018) of NPP-VIIRS-like NTL data through a new cross-sensor calibration from DMSP-OLS NTL data (2000–2012) and a composition of monthly NPP-VIIRS NTL data (2013–2018). The proposed cross-sensor calibration is unique due to the image enhancement by using a vegetation index and an auto-encoder model. Compared with the annual composited NPP-VIIRS NTL data in 2012, our product of extended NPP-VIIRS-like NTL data shows a good consistency at the pixel and city levels with R2 of 0.87 and 0.95, respectively. We also found that our product has great accuracy by comparing it with DMSP-OLS radiance-calibrated NTL (RNTL) data in 2000, 2004, 2006, and 2010. Generally, our extended NPP-VIIRS-like NTL data (2000–2018) have an excellent spatial pattern and temporal consistency which are similar to the composited NPP-VIIRS NTL data. In addition, the resulting product could be easily updated and provide a useful proxy to monitor the dynamics of demographic and socioeconomic activities for a longer time period compared to existing products. The extended time series (2000–2018) of nighttime light data is freely accessible at https://doi.org/10.7910/DVN/YGIVCD (Chen et al., 2020).
- Article
(9356 KB) - Full-text XML
- BibTeX
- EndNote


With the artificial electric light widely equipped in most buildings and infrastructures, the nighttime light (NTL) remote sensing data have been extensively used to investigate human activities (Gaston et al., 2013; Falchi et al., 2011; Elvidge et al., 1997a; Baugh et al., 2013; Li et al., 2018). Thus far, two NTL data sources, the Defense Meteorological Satellite Program Operational Linescan System (DMSP-OLS) and Suomi National Polar-orbiting Partnership-Visible Infrared Imaging Radiometer Suite (NPP-VIIRS) nighttime light data, have been increasingly used to monitor and analyze the urban structure and socioeconomic characteristics of the city during urbanization processes, such as the estimation of the population (Sutton et al., 2001; Xu et al., 2015; Elvidge et al., 1997b; Yu et al., 2018) and economic development (Zhao et al., 2017; Lo, 2002; Ma et al., 2012; Yu et al., 2015; X. Zhao et al., 2019), identification of energy (Shi et al., 2018, 2016b) and environmental issues (Ou et al., 2013; Shi et al., 2016a; Liu et al., 2018; Jiang et al., 2018), and the detection of urban area (Shi et al., 2014a; Cao et al., 2009; Zhou et al., 2014; Z. Chen et al., 2019; Zhou et al., 2015) and its spatial structure (Chen et al., 2015; Lu et al., 2018; Z. Chen et al., 2017; Yu et al., 2014; Wu et al., 2019).
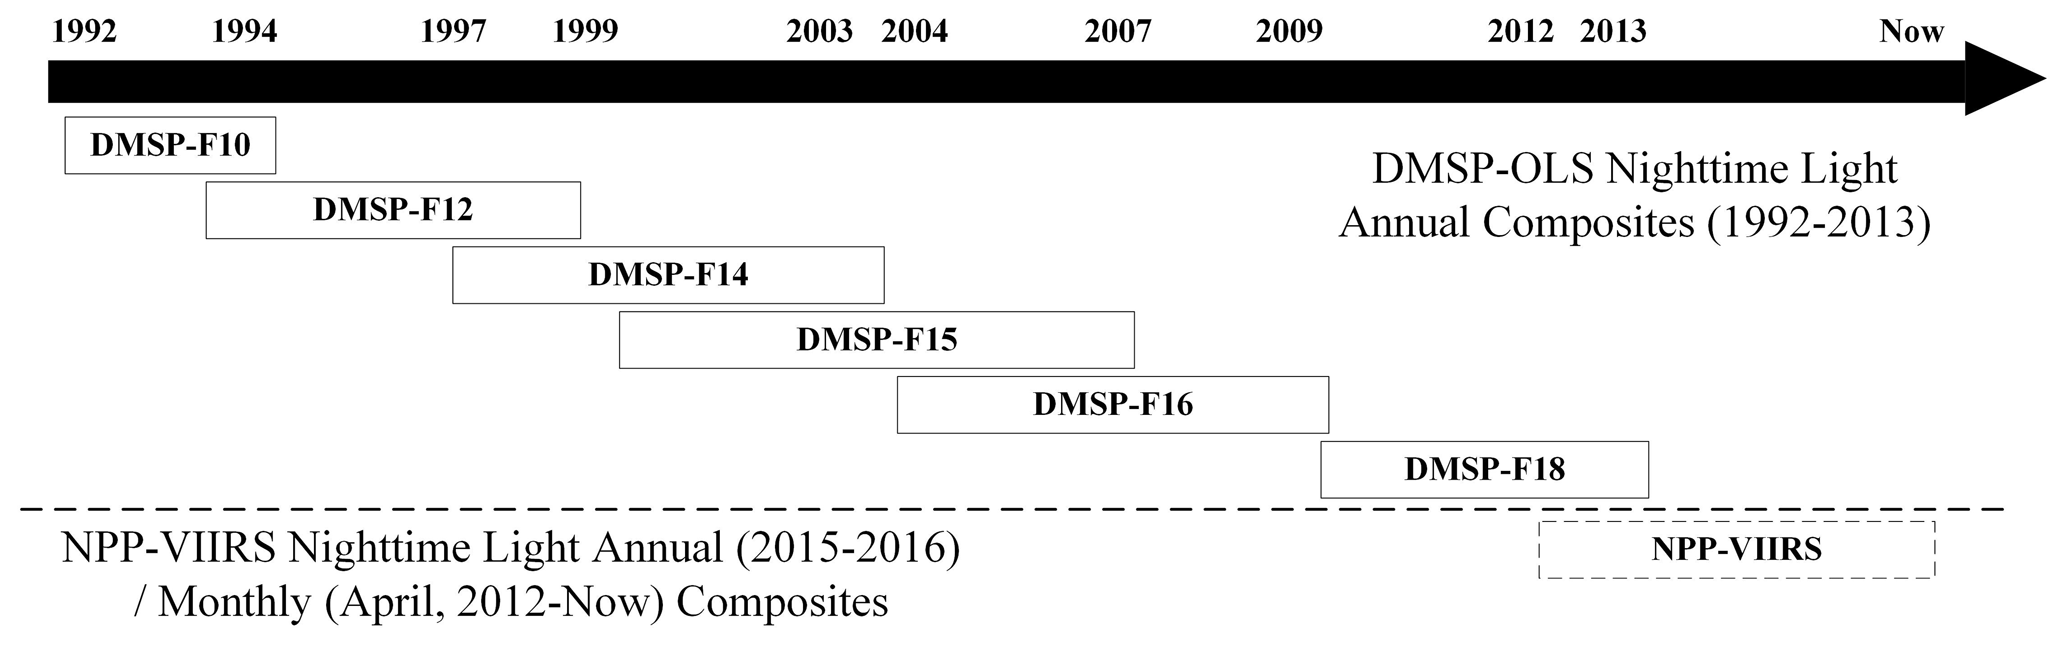
While both of the two NTL datasets are acknowledged as good proxies for detecting the dynamics of demographic and socioeconomic activities at different spatial scales (Yang et al., 2019), their applications were always limited by their quality and available time span. The DMSP-OLS NTL annually composited data can only be collected from 1992 to 2013 (Fig. 1). It has disadvantages, including the lack of on-orbit radiance calibration, saturation issues, and blooming issues (Letu et al., 2010; Cao et al., 2019; Elvidge et al., 2014; Levin et al., 2020), which limit its potential applications. The NPP-VIIRS NTL data have a better data quality (e.g., higher spatial resolution of ∼500 m, etc.) and a superior detection ability, but the short available time span would cause problems when long-term analysis is required. As shown in Fig. 1, the monthly composited data are from April 2012 to the present, and the annual NPP-VIIRS NTL data cover only 2015 and 2016. In addition, DMSP-OLS NTL data record the digital number (DN), which is substantially different from the radiance value in NPP-VIIRS NTL data. Consequently, these two sets of NTL data are not comparable and could not be directly used together. In this light, an extended time series of nighttime light data with appropriate quality and a better consistency is desirable for long-term temporal nighttime light applications.
In the literature, there have been some studies for extending NTL data by integrating DMSP-OLS data and NPP-VIIRS NTL data (Jeswani, 2017). Among them, Shao et al. (2014), according to the NPP-VIIRS day–night band data and lunar irradiance model, developed a vicarious radiometric calibration for DMSP-OLS daily NTL data. However, this model requires selecting specific events at night as criteria and is not suitable for the annual DMSP-OLS NTL composite data. Zhu et al. (2017) and Li et al. (2017) both attempted to use a power function for integrating the DMSP-OLS NTL data and NPP-VIIRS NTL data. Zhu et al. (2017) fitted the power function by using the cumulated DMSP-OLS and NPP-VIIRS NTL intensity within each province in China from 1992 to 2015. Then this power function was applied to the cumulated NPP-VIIRS NTL intensity to generate simulated DMSP-OLS NTL intensity. The power function from Li et al. (2017) was fitted from annual DMSP-OLS NTL data and monthly NPP-VIIRS NTL data. This power function was then conducted to inter-calibrate these two NTL sets of data for analyzing Syria's major human settlement loss during a war. These power functions both heavily relied on the strategy of training sample selection and are not easy to be extended to other world regions or the entire world. Instead of using power function and traditional DMSP-OLS stable NTL data, Zheng et al. (2019) conducted a geographically weighted regression model to fit the radiance-calibrated DMSP-OLS NTL data and NPP-VIIRS NTL data and then generated the DMSP-like NPP-VIIRS NTL data for further research. M. Zhao et al. (2019) proposed a sigmoid function model with a series of preprocessing procedures to convert NPP-VIIRS NTL data into simulated DMSP-OLS NTL data from 1992 to 2018 in Southeast Asia. Li et al. (2020) provided a global DMSP-OLS-like NTL data, called harmonized DMSP-OLS NTL data, through a stepwise calibration of DMSP-OLS NTL data and a kernel density-based integration of calibrated DMSP-OLS and NPP-VIIRS NTL data. However, since NPP-VIIRS NTL data have a better quality than DMSP-OLS NTL data, the performance of estimating social-economic index and extracting urban spatial structure from NPP-VIIRS NTL is much higher (Shi et al., 2014b; Z. Chen et al., 2017). Therefore, simulating an extended time series of a NPP-VIIRS-like NTL dataset other than traditional DMSP-OLS-like NTL data would be very helpful for further analysis and applications. Given the difficulties mentioned above, a new approach to cross-sensor calibrate these two sets of NTL data is still a challenge.
Recently, deep learning technologies present great potential for image processing, such as image restoration, image denoising, and target recognition/classification (Goodfellow et al., 2016). An auto-encoder model proposed by Hinton and Zemel (1994) contains a set of recognition weights for encoding the input data and a set of generative weights for reconstructing a similar input data. With convolutional neural networks (CNN), the auto-encoder model becomes more powerful for learning high-level image features and enhancing the input image quality (Wang and Tao, 2016; Jain and Seung, 2009). For instance, Tan and Eswaran (2008) and Vincent et al. (2010) successfully developed a stacked auto-encoder network with CNN to reconstruct and denoise handwritten digital images, respectively. H. Chen et al. (2017) applied a residual encoder–decoder convolutional neural network (RED-CNN) to enhance a CT image from low dense to normal dense. By analogy, the DMSP-OLS NTL data can be regarded as the low-density image with some noise, while the NPP-VIIRS NTL data can be treated as the high-quality image. According to the successful cases from the literature mentioned above, it is believed that the auto-encoder model is promising in converting DMSP-OLS NTL data to NPP-VIIRS NTL data.
In this study, we developed an auto-encoder (AE) model including convolutional neural networks to integrate DMSP-OLS NTL and NPP-VIIRS NTL data and generated an extended time series of global annual NPP-VIIRS-like NTL data from 2000 to 2018. The Google Earth Engine (GEE) platform (Kumar and Mutanga, 2018) and a parallel computing platform named Compute Unified Device Architecture (CUDA) of the graphics processing unit (Huang et al., 2015) were used in the proposed framework. The remainder of this paper is organized as follows. Section 2 describes the data involved in this study and the illustration of data preprocessing. The auto-encoder network structure and cross-sensor calibration are presented in Sect. 3. In Sects. 4 and 5, the extended time series of global NPP-VIIRS-like NTL data, accuracy evaluation, spatial pattern, and temporal consistency are discussed. The findings are summarized in the final section.
Table 1The list of data used in this study.
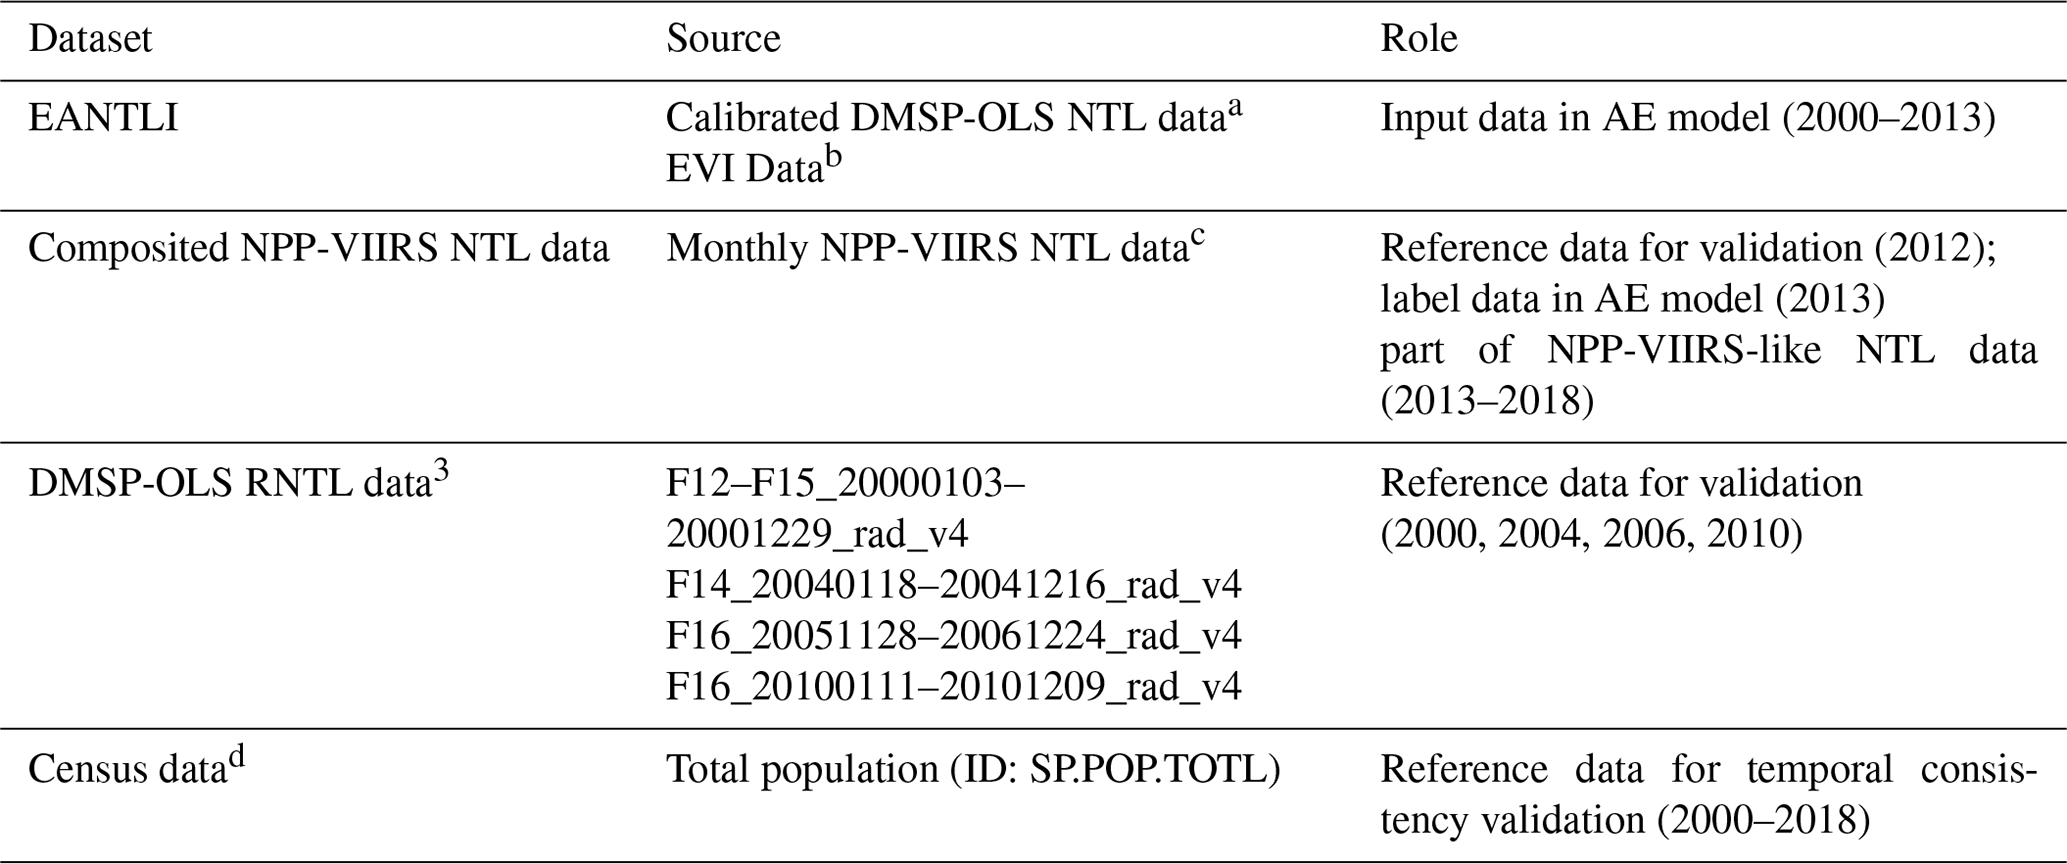
a Accessed from Li et al. (2020) in February 2020. b Accessed from MOD13A1 version 5 based on Google Earth Engine in May 2020. c Accessed from the Earth Observation Group (EOG) from the Colorado School of Mines (https://payneinstitute.mines.edu/eog/nighttime-lights/, last access: 20 May 2020) in May 2020. d Accessed from the World Bank (2020) in May 2020.
This study used three datasets (Table 1). The first one is the enhanced vegetation index adjusted NTL index (EANTLI) of 2000–2013 (Zhuo et al., 2015) as an input dataset in the AE model. It was derived from the annual calibrated DMSP-OLS NTL data and Enhanced Vegetation Index (EVI) data produced by the Moderate Resolution Imaging Spectroradiometer. The second dataset is the composited NPP-VIIRS NTL data from 2012 to 2018, which was annually summarized from the monthly NPP-VIIRS NTL data. The 2013 composited NPP-VIIRS NTL data were used as the label data in the AE model, and the 2012 data were introduced as the reference for validation. The 2013–2018 data were appended to the NPP-VIIRS-like NTL data (2000–2012) simulated by the AE model. The third one is the DMSP-OLS radiance-calibrated NTL (RNTL) data for the validation procedure.
2.1 Enhanced vegetation index adjusted NTL index (EANTLI)
Due to the mentioned issues in the annual DMSP-OLS NTL data, an enhanced vegetation index adjusted NTL index (EANTLI) of 2000–2013 was used as an input in the AE model to simulate NPP-VIIRS-like NTL data. EANTLI was proposed by Zhuo et al. (2015) by fusing the EVI and DMSP-OLS NTL data. EANTLI not only reduces the saturation problems but also enhances the nighttime light intensity variations. It can be expressed mathematically in the following equation:
where EVI represents the value from the annual average EVI value, NTL is the DMSP-OLS NTL intensity, and nNTL indicates the normalized NTL.
In this study, to get an EANTLI dataset with better temporal consistency, the calibrated DMSP-OLS NTL data replaced the original DMSP-OLS NTL data in Eq. (1). The calibrated DMSP–OLS NTL data of 2000–2013 used in this study were derived from the original annual DMSP-OLS NTL data via a stepwise calibration (Li and Zhou, 2017). The calibrated DMSP–OLS NTL data have a better temporal consistency and a greater agreement with the NPP-VIIRS NTL data (Li et al., 2020). This calibrated NTL data cover the same extent (180 to 180∘ longitude and −65 to 75∘ latitude) and spatial resolution (30 arcsec). The data record the digital number (DN) values with a range from 0 to 63. Zero indicates no nighttime light intensity (used as background), while 63 indicates the highest nighttime light intensity.
The 16 d EVI products (MOD13A1) with a spatial resolution of 500 m are involved. To mitigate the sensitivity to seasonal and interannual fluctuations, the MOD13A1 EVI products were processed as an annual average EVI (Jing et al., 2015) using Google Earth Engine. It is worth noting that since the MOD13A1 EVI data are only available from 2000 onwards, we only processed the enhanced vegetation index adjusted NTL index (EANTLI) of 2000–2013. More details and advantages of calibrated DMSP–OLS NTL and EANTLI can be found in Li et al. (2020) and Zhuo et al. (2015).
2.2 Composited NPP-VIIRS NTL data
The monthly NPP-VIIRS NTL data were calibrated and aggregated to the annual NPP-VIIRS NTL data from 2012 to 2018. The composited NPP-VIIRS NTL data of 2012 were for the validation process, the composited NPP-VIIRS NTL data of 2013 were for the training process in the AE model, and the composited NPP-VIIRS NTL data from 2013 to 2018 were appended to the final product as a part of the NPP-VIIRS-like NTL data.
The version 1 monthly NPP-VIIRS NTL composite data (vcm version) of April 2012 to December 2018 provided by the Colorado School of Mines were used to composite annual NPP-VIIRS NTL data. The monthly NPP-VIIRS NTL data cover the same extent of calibrated DMSP-OLS NTL data with a finer spatial resolution of 15 arcsec (approximately 500 m near the Equator) and a more sensitive sensor with a unit of nanowatts per centimeter squared per steradian (nW cm−2 sr−1). Since the official annual NPP-VIIRS NTL data are only available in 2015 and 2016 and they require inaccessible parameters to repeat the official annual composite process for other years (Elvidge et al., 2017), we composited new annual NPP-VIIRS NTL data by using the median value of 12 NPP-VIIRS NTL monthly sets of composite data per each pixel. To differentiate with the official annual NPP-VIIRS NTL data (2015 and 2016), we named our annual NPP-VIIRS NTL data composited NPP-VIIRS NTL data in the following sections.
We used the median value instead of the traditional average or max value because the monthly NPP-VIIRS NTL data were contaminated by stray light in the mid-to-high latitude regions during the entire summer, and the contaminated pixels are reassigned as 0 in the official monthly composite data (Elvidge et al., 2017). As the mean value could lower the NTL intensity and the max value could highlight the abnormal value, the median value could be more reliable than the mean or max value (Liu et al., 2010). A validation of these median composited NPP-VIIRS NTL data was conducted as described in the following section.
According to the correction model of NPP-VIIRS NTL data proposed by Shi et al. (2014b) and Ma et al. (2014), a dark background mask and a nighttime light intensity threshold value are required to remove pixels of unstable and abnormal nighttime light intensity, respectively. First, the dark background mask consists of the EANTLI pixels with the value of 0 and the NPP-VIIRS NTL pixels with an intensity lower than 1 nW cm−2 sr−1. We then filtered the corresponding annual NPP-VIIRS data by using this dark background mask. Then, we assumed that the NTL intensities in other areas do not exceed the maximum NTL intensity in the center of large cities. If the pixel has a value larger than the maximum, this pixel was identified as the abnormal pixel and was adjusted (Shi et al., 2014b). According to the global city rank from the Globalization and World Cities (GaWC) Research Network (Taylor et al., 2010), two cities (New York City in the United States and London in the United Kingdom) with the alpha level and the two largest cities in China (Shanghai and Beijing) were selected in this study to capture the maximum NTL intensity as the threshold to adjust the abnormal pixels for each year. Once an NPP-VIIRS NTL pixel value is higher than this threshold value, this pixel value will be replaced by its maximum NTL intensity within its eight neighbor pixels to eliminate the abnormal value.
2.3 DMSP-OLS radiance-calibrated NTL (RNTL) data
Since the NPP-VIIRS NTL data are only available after 2012, DMSP-OLS RNTL data in 2000, 2004, 2006, and 2010 were selected as reference data to evaluate if our product has good accuracy during the entire time series. The DMSP-OLS RNTL data have a radiance calibration based on preflight sensor parameters and are free from sensor saturation (Feng-Chi et al., 2015). However, this dataset is still unitless because the lack of an onboard calibration system for all DMSP-OLS data results in the imprecise measurement of the sensor degradation over time. DMSP-OLS RNTL data have the same extent as the original DMSP-OLS NTL data with the same spatial resolution (30 arcsec), but they are only available in specific years. The four selected DMSP-OLS RNTL data were accessed from Earth Observation Group (EOG) from the Colorado School of Mines, as shown in Table 1.
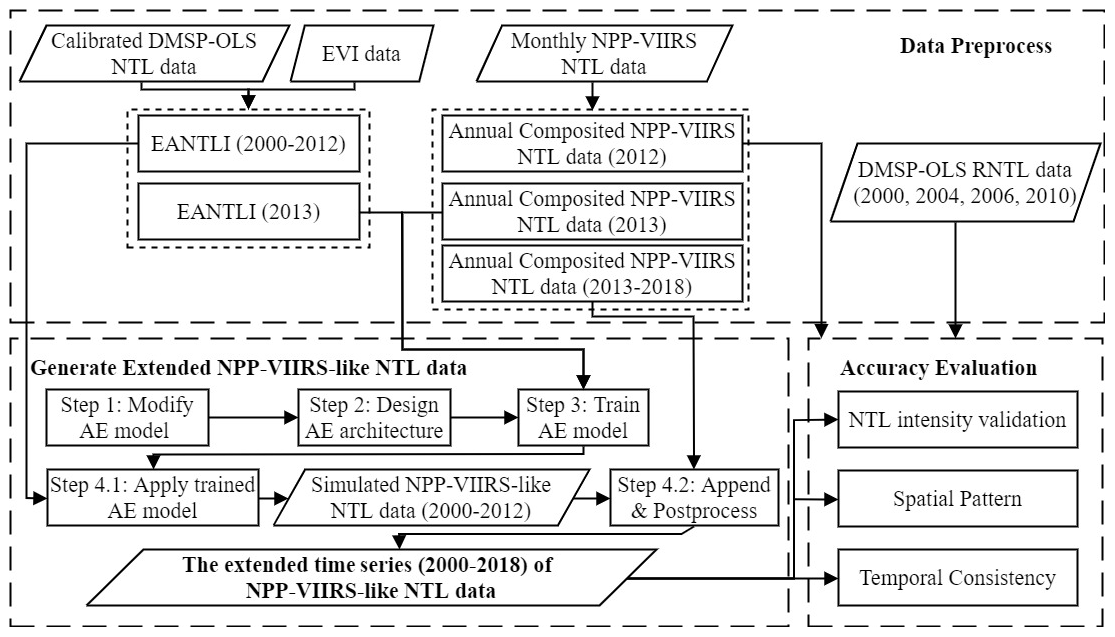
As outlined in Fig. 2, after data preprocessing, a four-step approach was proposed to generate an extended time series (2000–2018) of NPP-VIIRS-like NTL data from the EANTLI data and composited NPP-VIIRS NTL data. In step 1, a modified auto-encoder model was developed. In steps 2 and 3, the architecture of the auto-encoder model with CNN was designed, and the cross-sensor calibration model was trained. In step 4, an extended time series (2000–2018) of the NPP-VIIRS-like NTL dataset was generated using the trained model by inputting the 2000–2012 EANTLI data and appending the composited NPP-VIIRS NTL data (2013–2018) with postprocessing of the data. Finally, a comprehensive accuracy evaluation was conducted.
3.1 The auto-encoder (AE) model
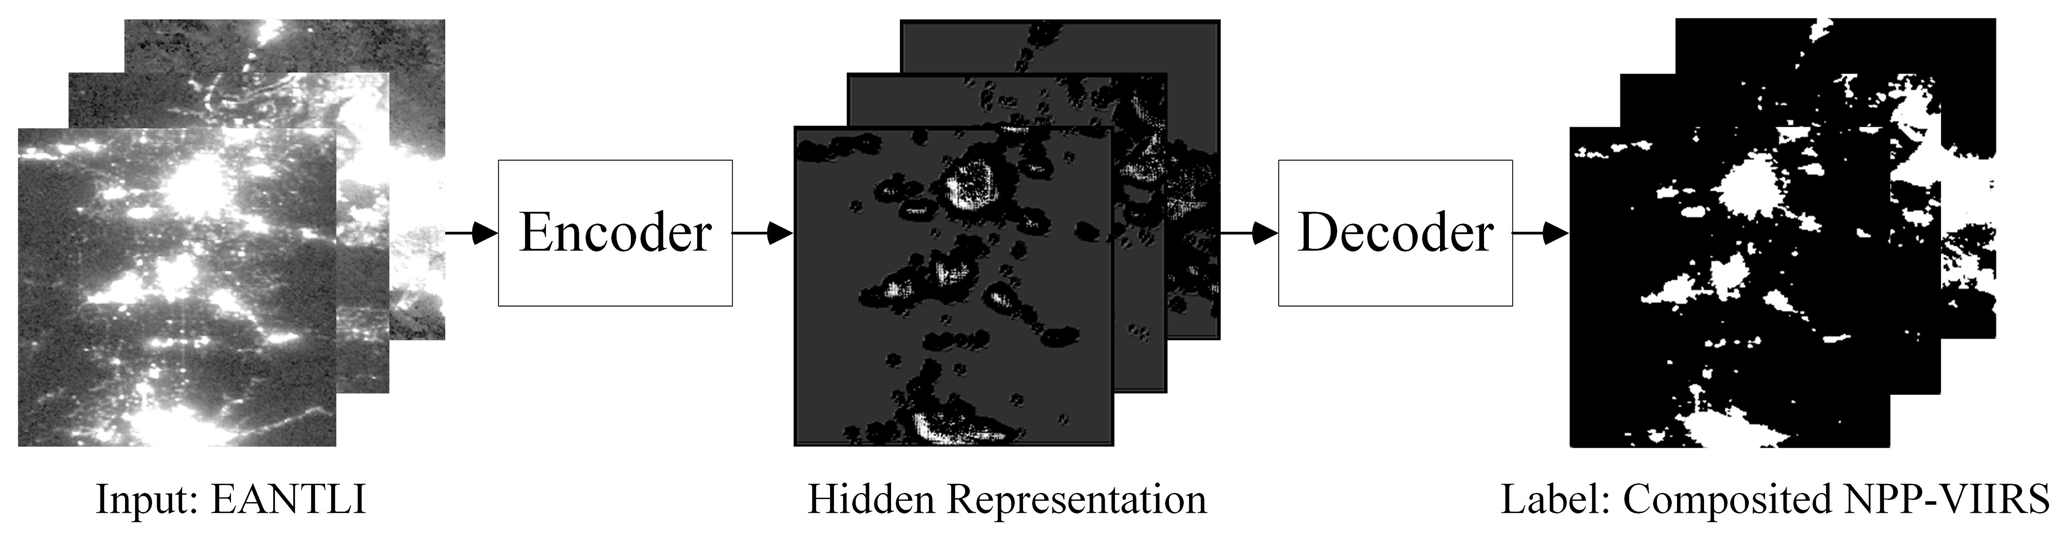
The auto-encoder model was trained by setting the 2013 EANTLI data as input data and the 2013 composited NPP-VIIRS NTL data as the label. Then, the trained model was adopted to simulate the NPP-VIIRS-like NTL data by inputting the 2000–2011 EANTLI data. The auto-encoder model includes two main parts (encoder and decoder), as shown in Fig. 3. Let , , and be the annual EANTLI data, composited NPP-VIIRS NTL data, and simulated NPP-VIIRS-like NTL data. The encoder part is to learn a deterministic mapping fθ which could transfer X into a hidden representation (H). A typical deterministic mapping function can be expressed as
where x∈X, and θ represents the parameter set, including weight matrix (W) and offset (b). In contrast, the traditional decoder part is to reconstruct X using the high-level features extracted from the hidden representation (H). This reconstruction is called the decoder and can be expressed as
where h∈H, and θ′ represents the parameter set, including weight matrix (W′) and offset (b′). However, in this study, the decoder part was modified to map the composited NPP-VIIRS NTL data (Y) rather than the traditional reconstruction of X, which means that the problem can be transformed to build two functions, fθ and , via deep learning technology to minimize a specific loss function (e.g., mean square error):
3.2 The auto-encoder with a CNN architecture design
AE and CNN have both demonstrated excellent performance on the image feature extractions. In this study, based on the AE and CNN framework, we proposed a 10-layer network architecture as the cross-sensor calibration model (Fig. 4). This model includes five convolutional operations for encoding EANTLI data and then stacks five deconvolutional operations for decoding in symmetry. Because our intention is to reconstruct images instead of classifying targets, the fully connected layers in the traditional encoder and decoder parts were removed from our architecture.
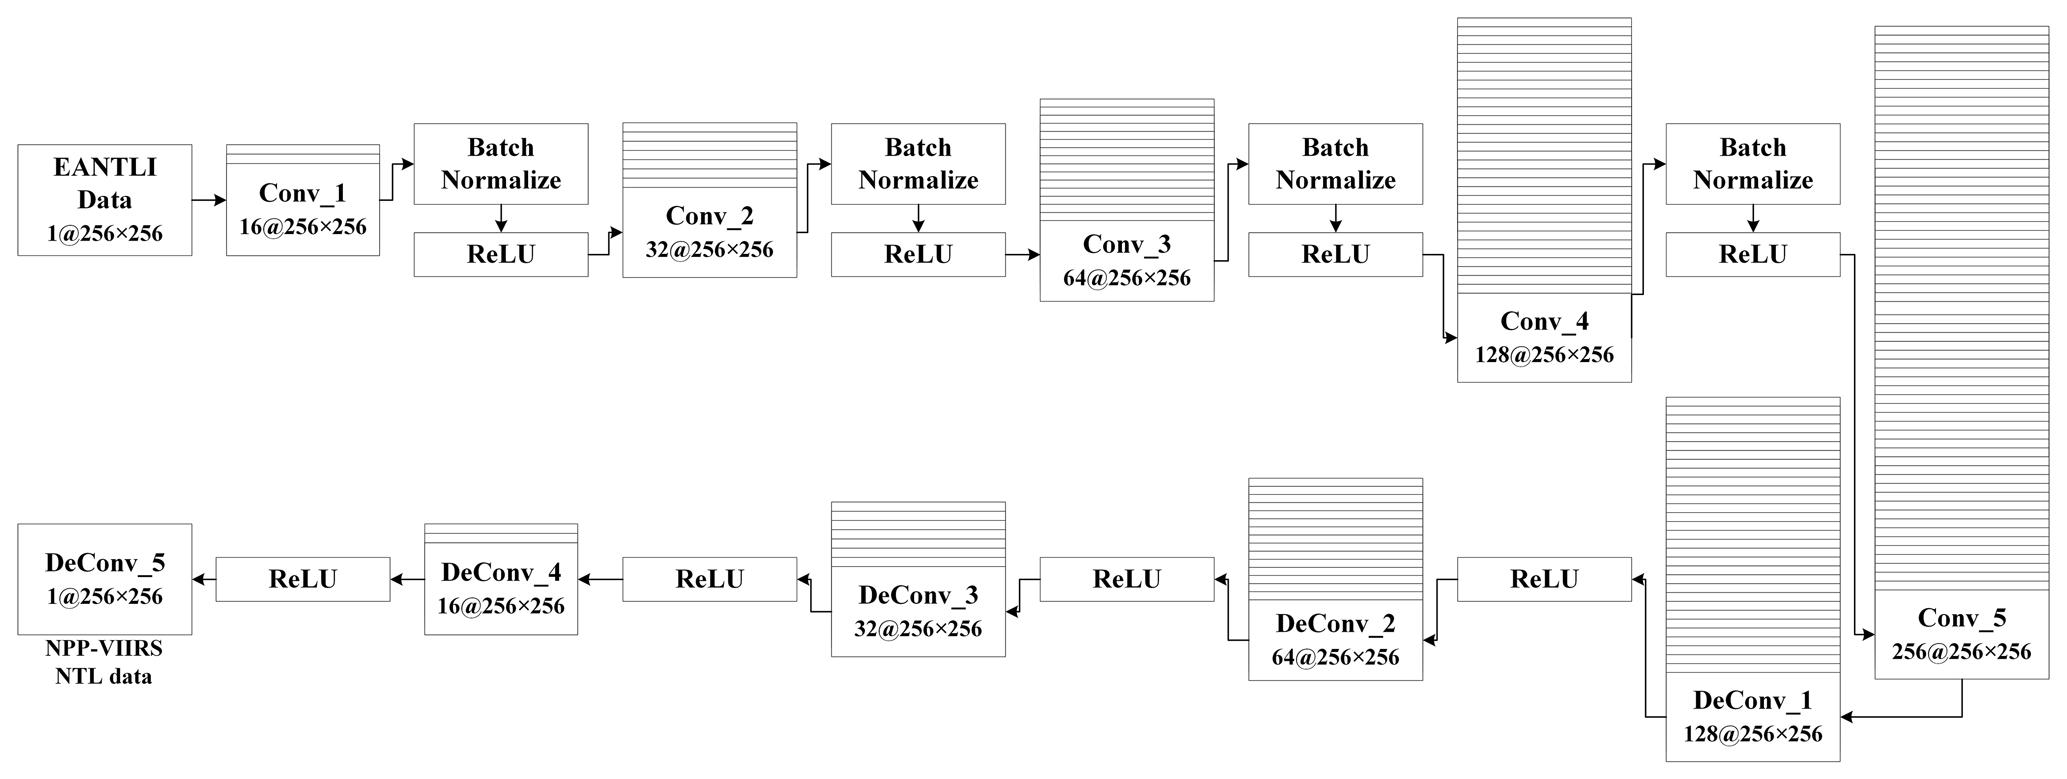
The kernel size of convolutional and deconvolutional operations adopted in this architecture is 3 by 3 with a stride and padding of 1 to keep the size of the output layers the same as the input layers. In the encoder part, the batch normalization (BN) operations were added after each convolution layer to avoid the vanishing or exploding gradient problem (Ioffe and Szegedy, 2015). The rectified linear unit (ReLU) function was applied in this architecture as the activation function after each convolutional and deconvolutional layer except the last deconvolutional layer. The ReLU function can be formed as
The traditional CNN structure always contains more than one pooling operation to improve its learning efficiency, but these pooling operations could lose the details of the input images. To keep as much of the image information as possible, the pooling processes among all layers were deleted.
3.3 Training auto-encoder model with a CNN architecture
Considering the balance between computational limitation and efficiency, the EANTLI data and composited NPP-VIIRS NTL data were severally split into tiles of 256×256 pixels. Since both sets of NTL data cover the year 2013, we built a training set of paired tiles, as , by using the 2013 EANTLI data and composited NPP-VIIRS NTL data, respectively, where N indicates the number of tiles. Then this training set was input to train the auto-encoder model designed above by minimizing the loss function L between composited NPP-VIIRS NTL data (Y) and simulated NPP-VIIRS-like NTL data (). The loss function adopted in this study is the mean square error function and was then optimized by the Adam algorithm proposed by Kingma and Ba (2014) in each deep learning step. The loss function can be formed as
3.4 Generating an extended time series of NPP-VIIRS-like NTL data
We generated the extended time series (2000–2018) of NPP-VIIRS-like NTL data with two components. First, the trained AE model was applied to the 2000–2012 EANTLI data to generate the simulated NPP-VIIRS-like NTL data covering the same period. Second, we composited annual NPP-VIIRS NTL data (2013–2018) from monthly data. Via appending these two components, the extended time series (2000–2018) of global NPP-VIIRS-like NTL data was generated.
The split tiles of 2000–2012 EANTLI data with the same size (256 by 256) were input into the trained auto-encoder model to simulate the NPP-VIIRS-like NTL data. Due to the fluctuation of EVI data, the input EANTLI data have several abnormal pixels, which makes the output NTL pixels unreasonable. Thus, postprocessing of the data is required for the simulated NPP-VIIRS-like data which involves three procedures. Firstly, as it is not reasonable to simulate lights where there is no stable light source, the EANTLI pixels with DN value of 0 were extracted as a dark background mask for each year and overlaid with the simulated NPP-VIIRS-like data to assign the pixels in the same locations as 0. Meanwhile, because of the NPP-VIIRS sensor's detection limitation, the simulated NTL intensity lower than 1 nW cm−2 sr−1 was also assigned as 0 (Ma et al., 2014). Finally, to ensure simulated NPP-VIIRS NTL data have the same temporal change as the calibrated DMSP-OLS NTL images, the simulated NPP-VIIRS-like intensity was computed by
where SNTL(year, i) and NTL(year, i) indicate the simulated NPP-VIIRS-like intensity and calibrated DMSP-OLS NTL intensity of the ith pixel in the year (from 2000 to 2012).
4.1 Training of the auto-encoder model with CNN
In the training process of the AE model, the learning rate in this study was initialized as and optimized by using the Adam algorithm. For weight initialization, this study employed the method proposed by He et al. (2015) instead of the traditional random weights from Gaussian distribution. Theoretically, the AE model was iteratively trained until the reconstruction loss became stable. In this study, the loss value tended to be stable around 200 when the number of training iterations reached 4000, which implies that an increase in iterations beyond 4000 cannot further improve the model precision.

Figure 5The comparison with kernel density between the global composited NPP-VIIRS NTL data and extended NPP-VIIRS-like NTL data in 2012 (unit: nW cm−2 sr−1) (a) at the pixel and (b) city levels. The solid line denotes the 1:1 line, and N is the number of sample points (cities).
4.2 Accuracy evaluation
According to the pixel-level and city-level validations between the extended NPP-VIIRS-like NTL data and composited NPP-VIIRS NTL data of 2012 (Fig. 5), our result is close to the composited NPP-VIIRS NTL data at both spatial scales. At the pixel level, 150 000 random pixels were selected as validation points, and the coefficient of determination (R2) between our results and the composited NPP-VIIRS NTL data of 2012 was 0.87 with a root mean squared error (RMSE) of 2.96 nW cm−2 sr−1 at the significant level. The dots were colored based on their kernel density, which follows the color ramp of the density scale. A warmer colored dot represents a higher density. It can be observed that the dots were mostly clustered around the low NTL intensity (the origin of the coordinates). For the city-level validation, the total NTL intensity for each city (i.e., the sum of all pixels' NTL intensities within each of the 40 000 cities) was adopted as the variable, and the results showed that the extended NPP-VIIRS-like NTL data have a better performance with an R2 of 0.94 and a RMSE of 3024.62 nW cm−2 sr−1 (Fig. 5b). Most of the dots in these two scatter plots are around the non-bias (1:1) line (red line in Fig. 5), which implies that the extended NPP-VIIRS-like NTL data have a positive 1:1 relationship with the composited NPP-VIIRS NTL data.
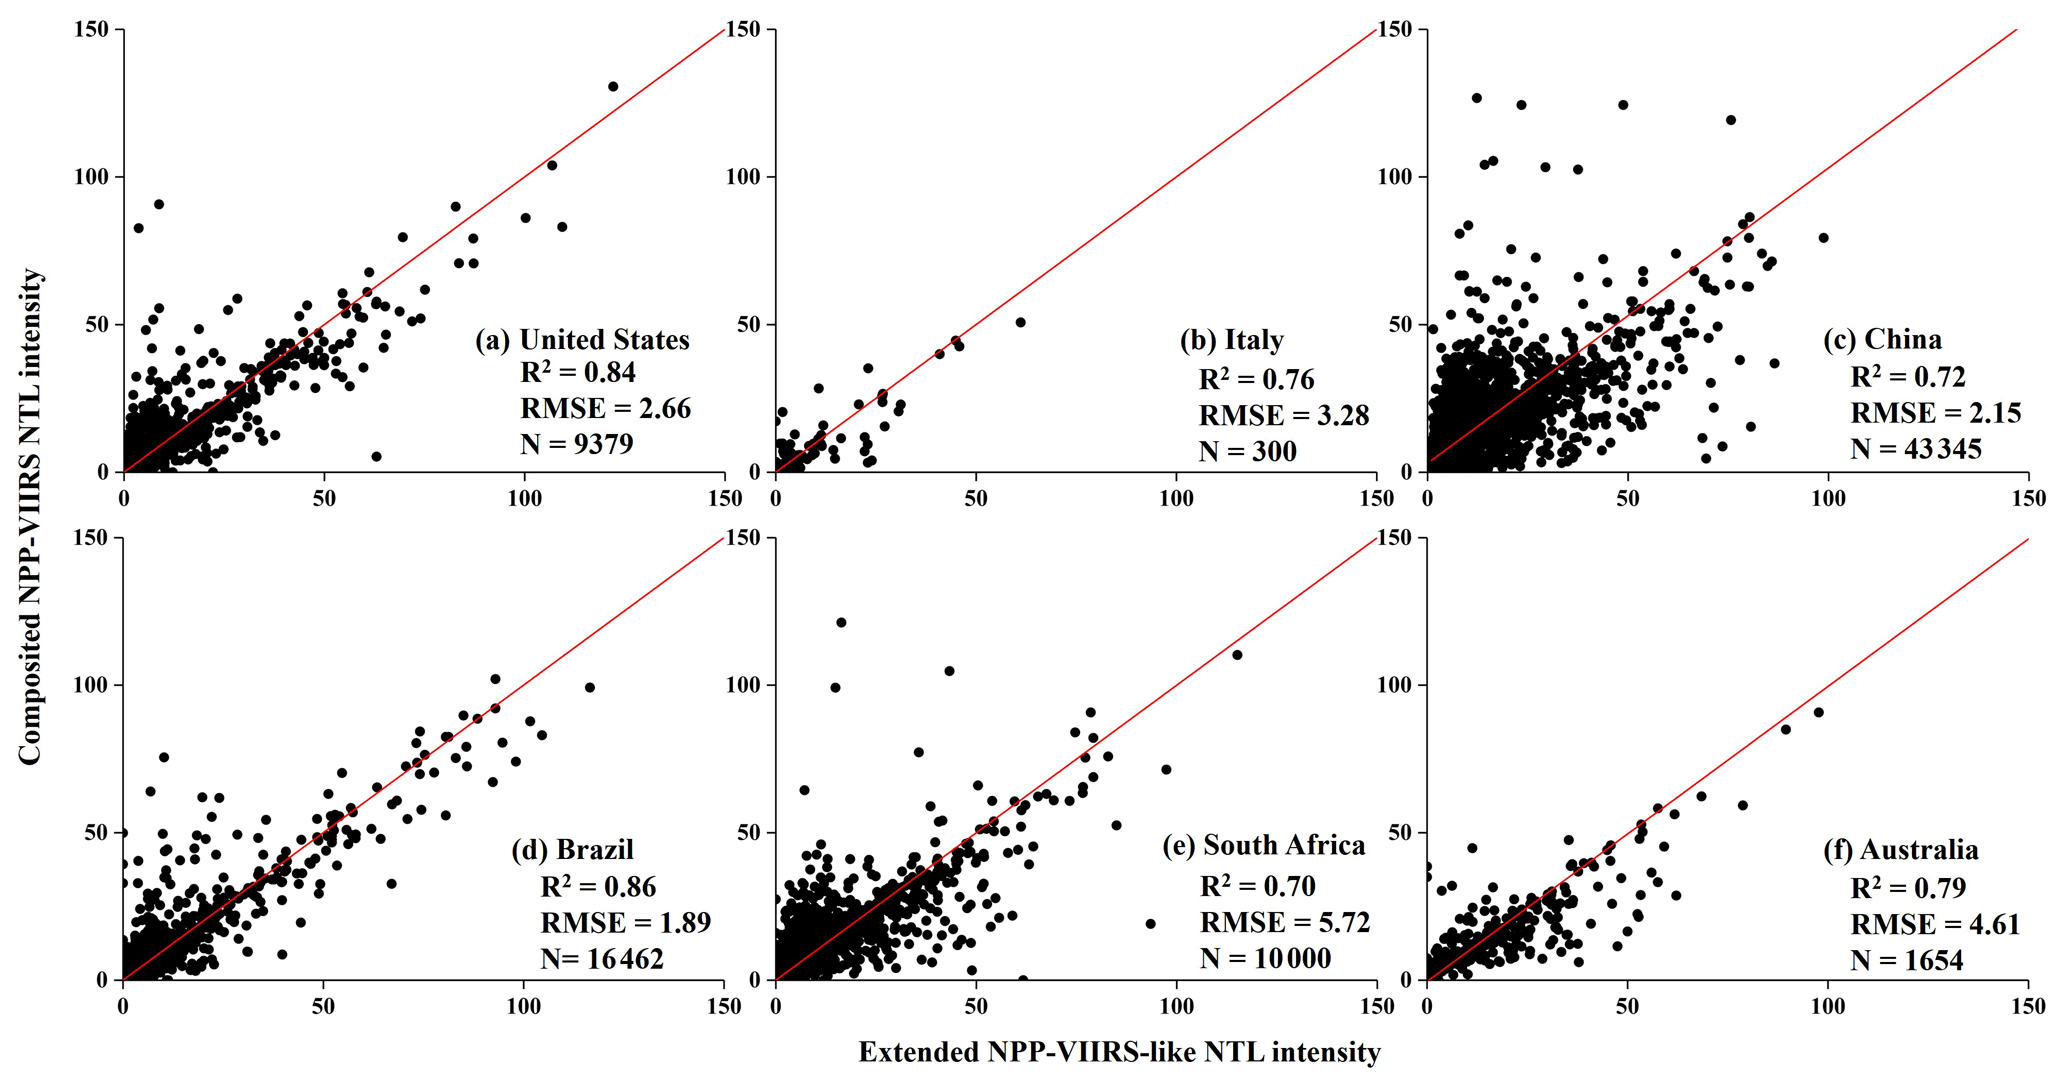
Figure 6The comparison between composited NPP-VIIRS NTL data and extended NPP-VIIRS-like NTL data in 2012 (unit: nW cm−2 sr−1) at the pixel level in six countries. The solid line denotes the 1:1 line, and N is the number of sample points (cities).
Among the global validation points, we also selected six subsets within six countries (United States, Italy, China, Brazil, South Africa, and Australia) and found that the accuracy in these countries is acceptable and has no significant spatial variation (Fig. 6). Brazil has the highest accuracy (R2=0.86), followed by the United States (R2=0.84). The rest of the countries all have an accuracy higher than 0.7. Australia has an R2 of 0.79, while Italy and China have an R2 of 0.76 and 0.72, respectively. South Africa also has a good R2 of 0.70. In particular, the RMSE of each sample country is very small (from 1.67 to 5.72), which means our results are very similar to the calibrated NPP-VIIRS NTL intensity at the pixel level.
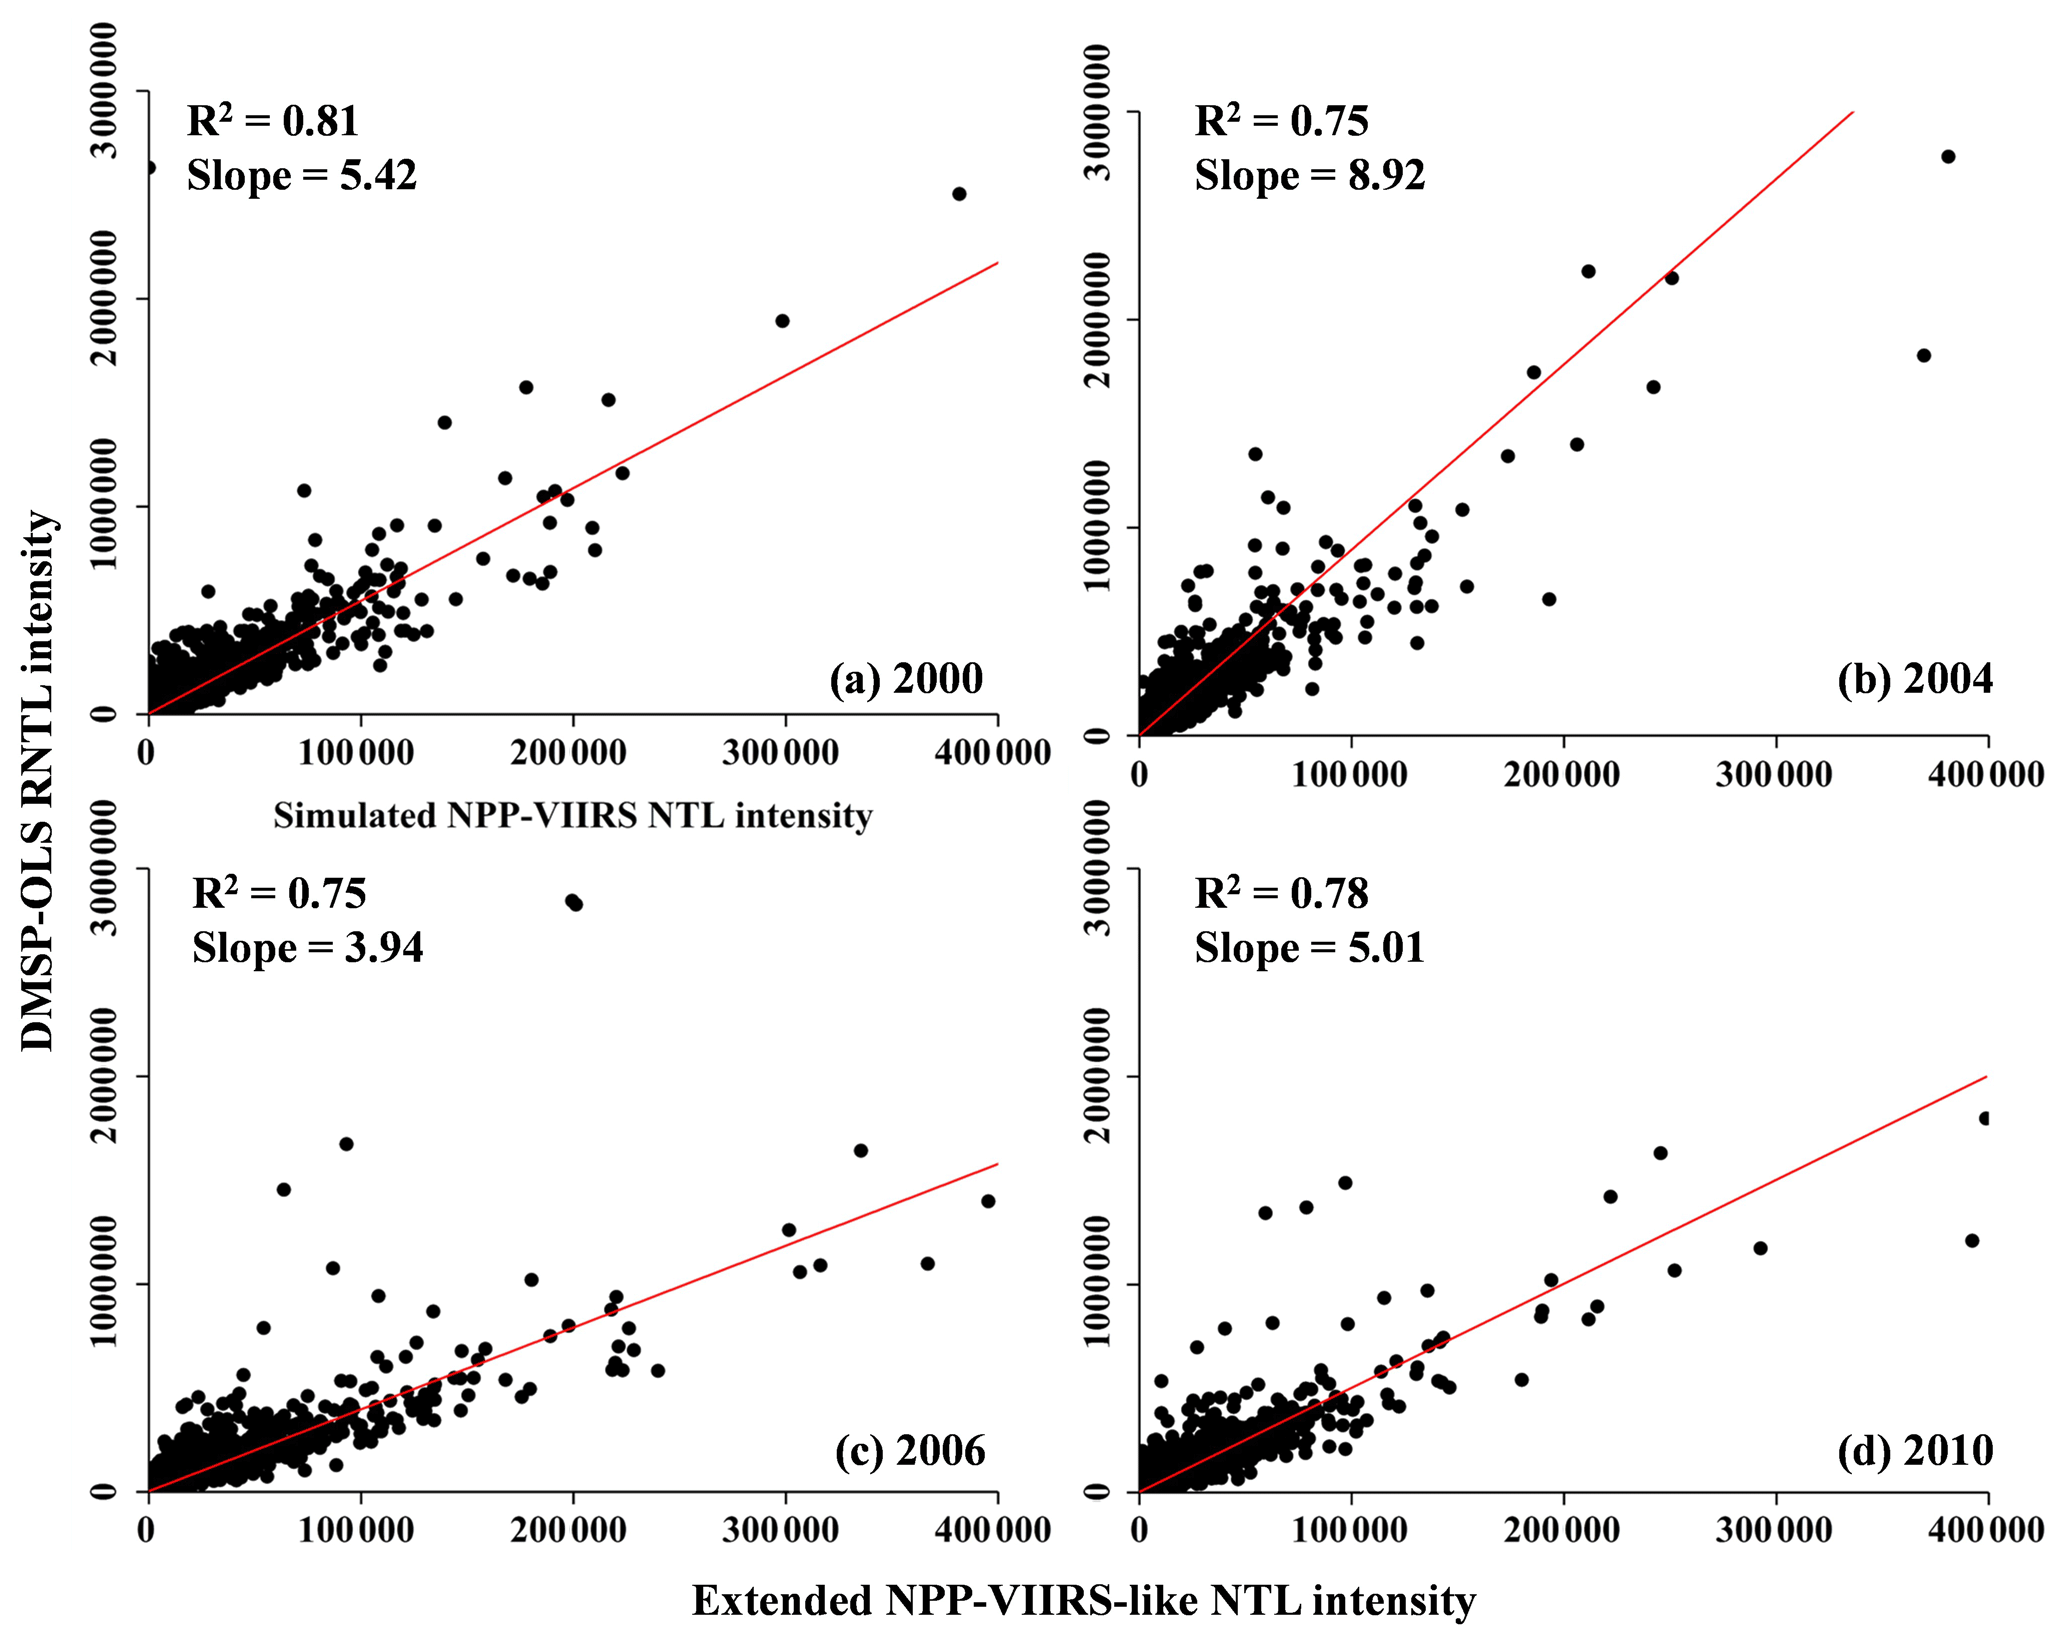
Figure 7The comparison between the annual DMSP-OLS RNTL intensity (DN Value) and extended NPP-VIIRS-like NTL intensity (unit: nW cm−2 sr−1) at the city level in (a) 2000, (b) 2004, (c) 2006, and (d) 2010.
Figure 7 shows that our extended NPP-VIIRS-like NTL data have a strong agreement with the DMSP-OLS RNTL data in the same 40 000 cities in 4 years (2000, 2004, 2006, and 2010), which implies that the AE model is suitable for simulating NPP-VIIRS-like NTL data during the entire period. Before 2012, the composited NPP-VIIRS NTL data are not available for the validation, but the DMSP-OLS RNTL data are accessible in some separate years. To validate our results before 2012, we have to use the DMSP-OLS RNTL data as the reference data. The DMSP-OLS RNTL data were calibrated by using preflight sensor calibrations and have no actual radiance value. Thus, this validation was conducted at the city level, and the total NPP-VIIRS-like NTL intensity and DMSP-OLS RNTL intensity of each city were calculated and scattered (Fig. 7). In these 4 years, all the R2 values are higher than 0.75 and demonstrate our model does work for this entire time series. Note that the DMSP-OLS RNTL data still have interannual biases due to sensor degradation and other sources (Feng-Chi et al., 2015), resulting in the different slopes of trend lines in 4 years.
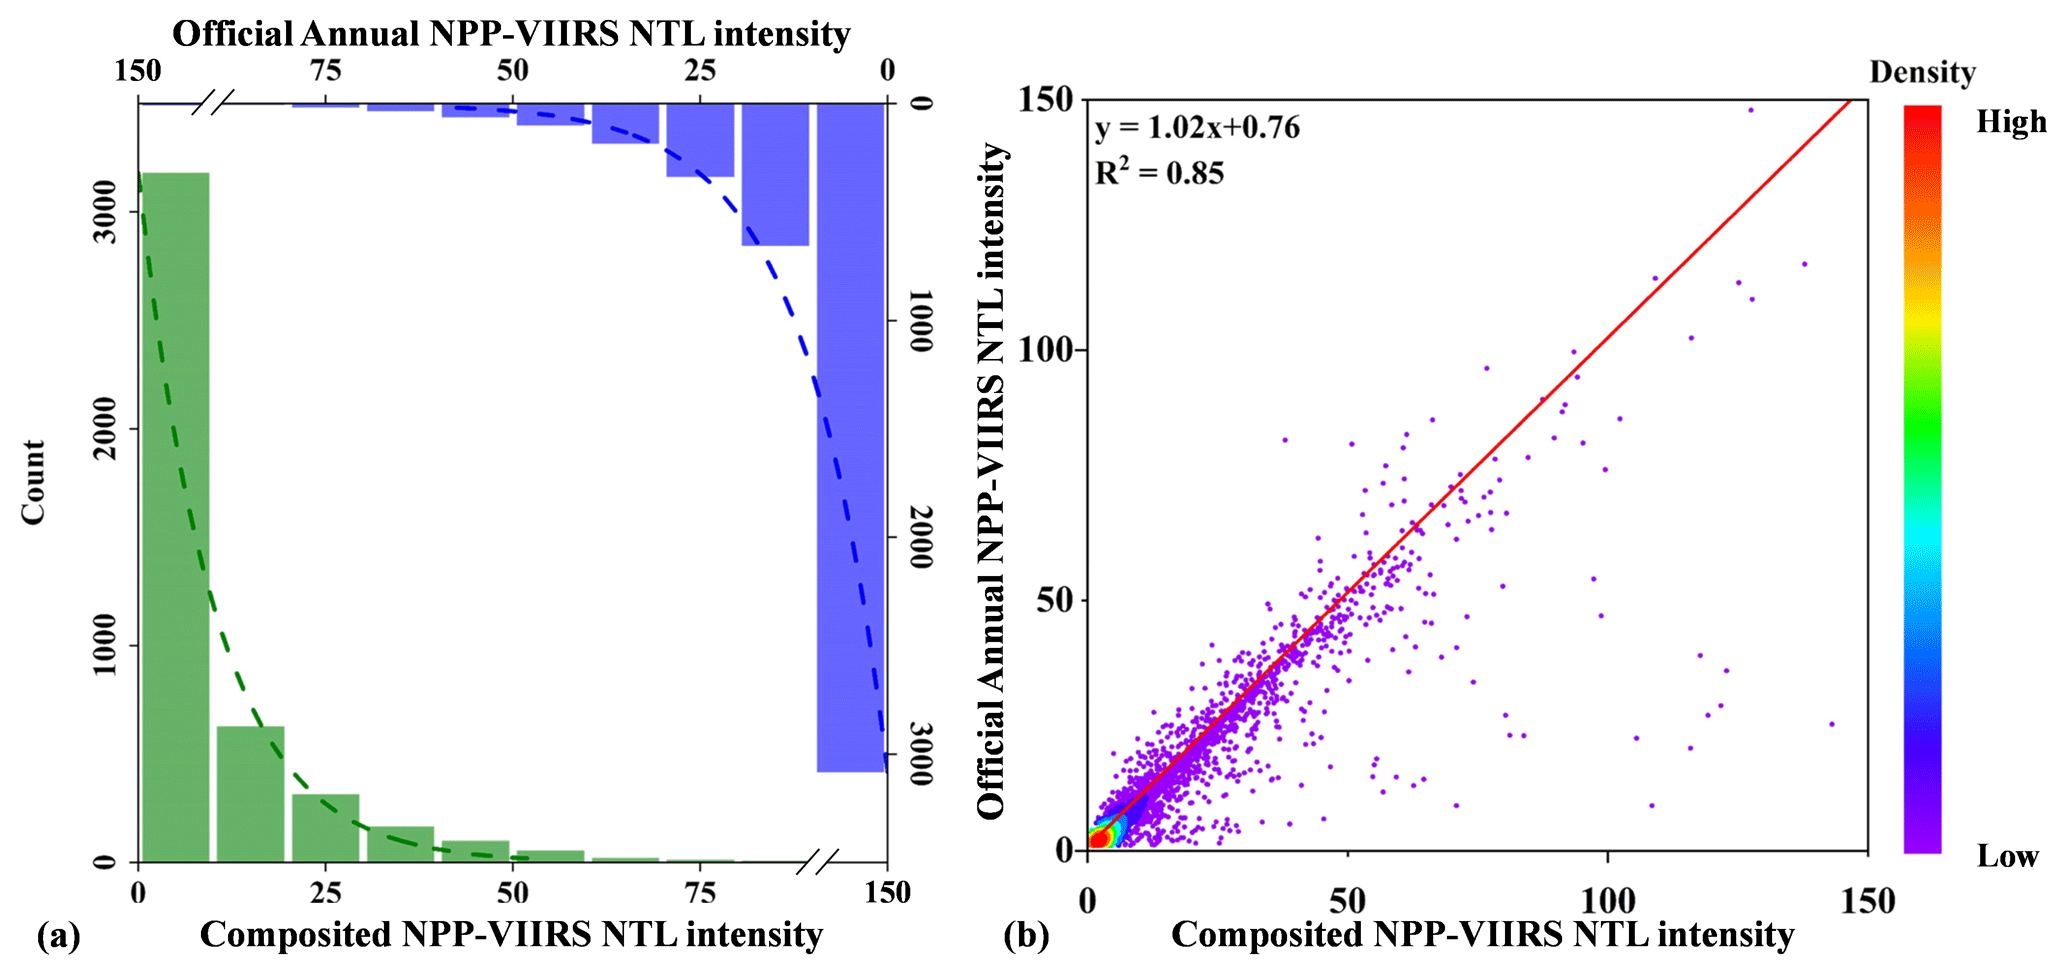
Figure 8A comparison of composited and official annual NPP-VIIRS NTL data via (a) histograms and (b) scatter plot with kernel density.
Finally, a comparison between the composited NPP-VIIRS NTL data and the official annual NPP-VIIRS NTL data in 2015 was performed based on 5000 random validation pixels, and the result indicated the former is close to the latter (see Fig. 8). In other words, using the median value to composite annual NPP-VIIRS NTL data is reasonable and appropriate. In Fig. 8a, the similar distribution of green bars and blue bars in these two histogram plots indicate that the pixel numbers of composited and official annual NPP-VIIRS NTL data are similar within each bin at 10 nW cm−2 sr−1. The result illustrates that these two datasets have a significant statistic similarity. Meanwhile, the scatter plot between these two NTL intensities at the pixel level (Fig. 8b) showed that our composited NPP-VIIRS NTL data have a strong linear relationship (R2=0.85 and the slope is close to 1) with the official annual NPP-VIIRS NTL data. Both validation results proved that the composited annual NPP-VIIRS NTL data generation model based on median values is a reasonable solution.
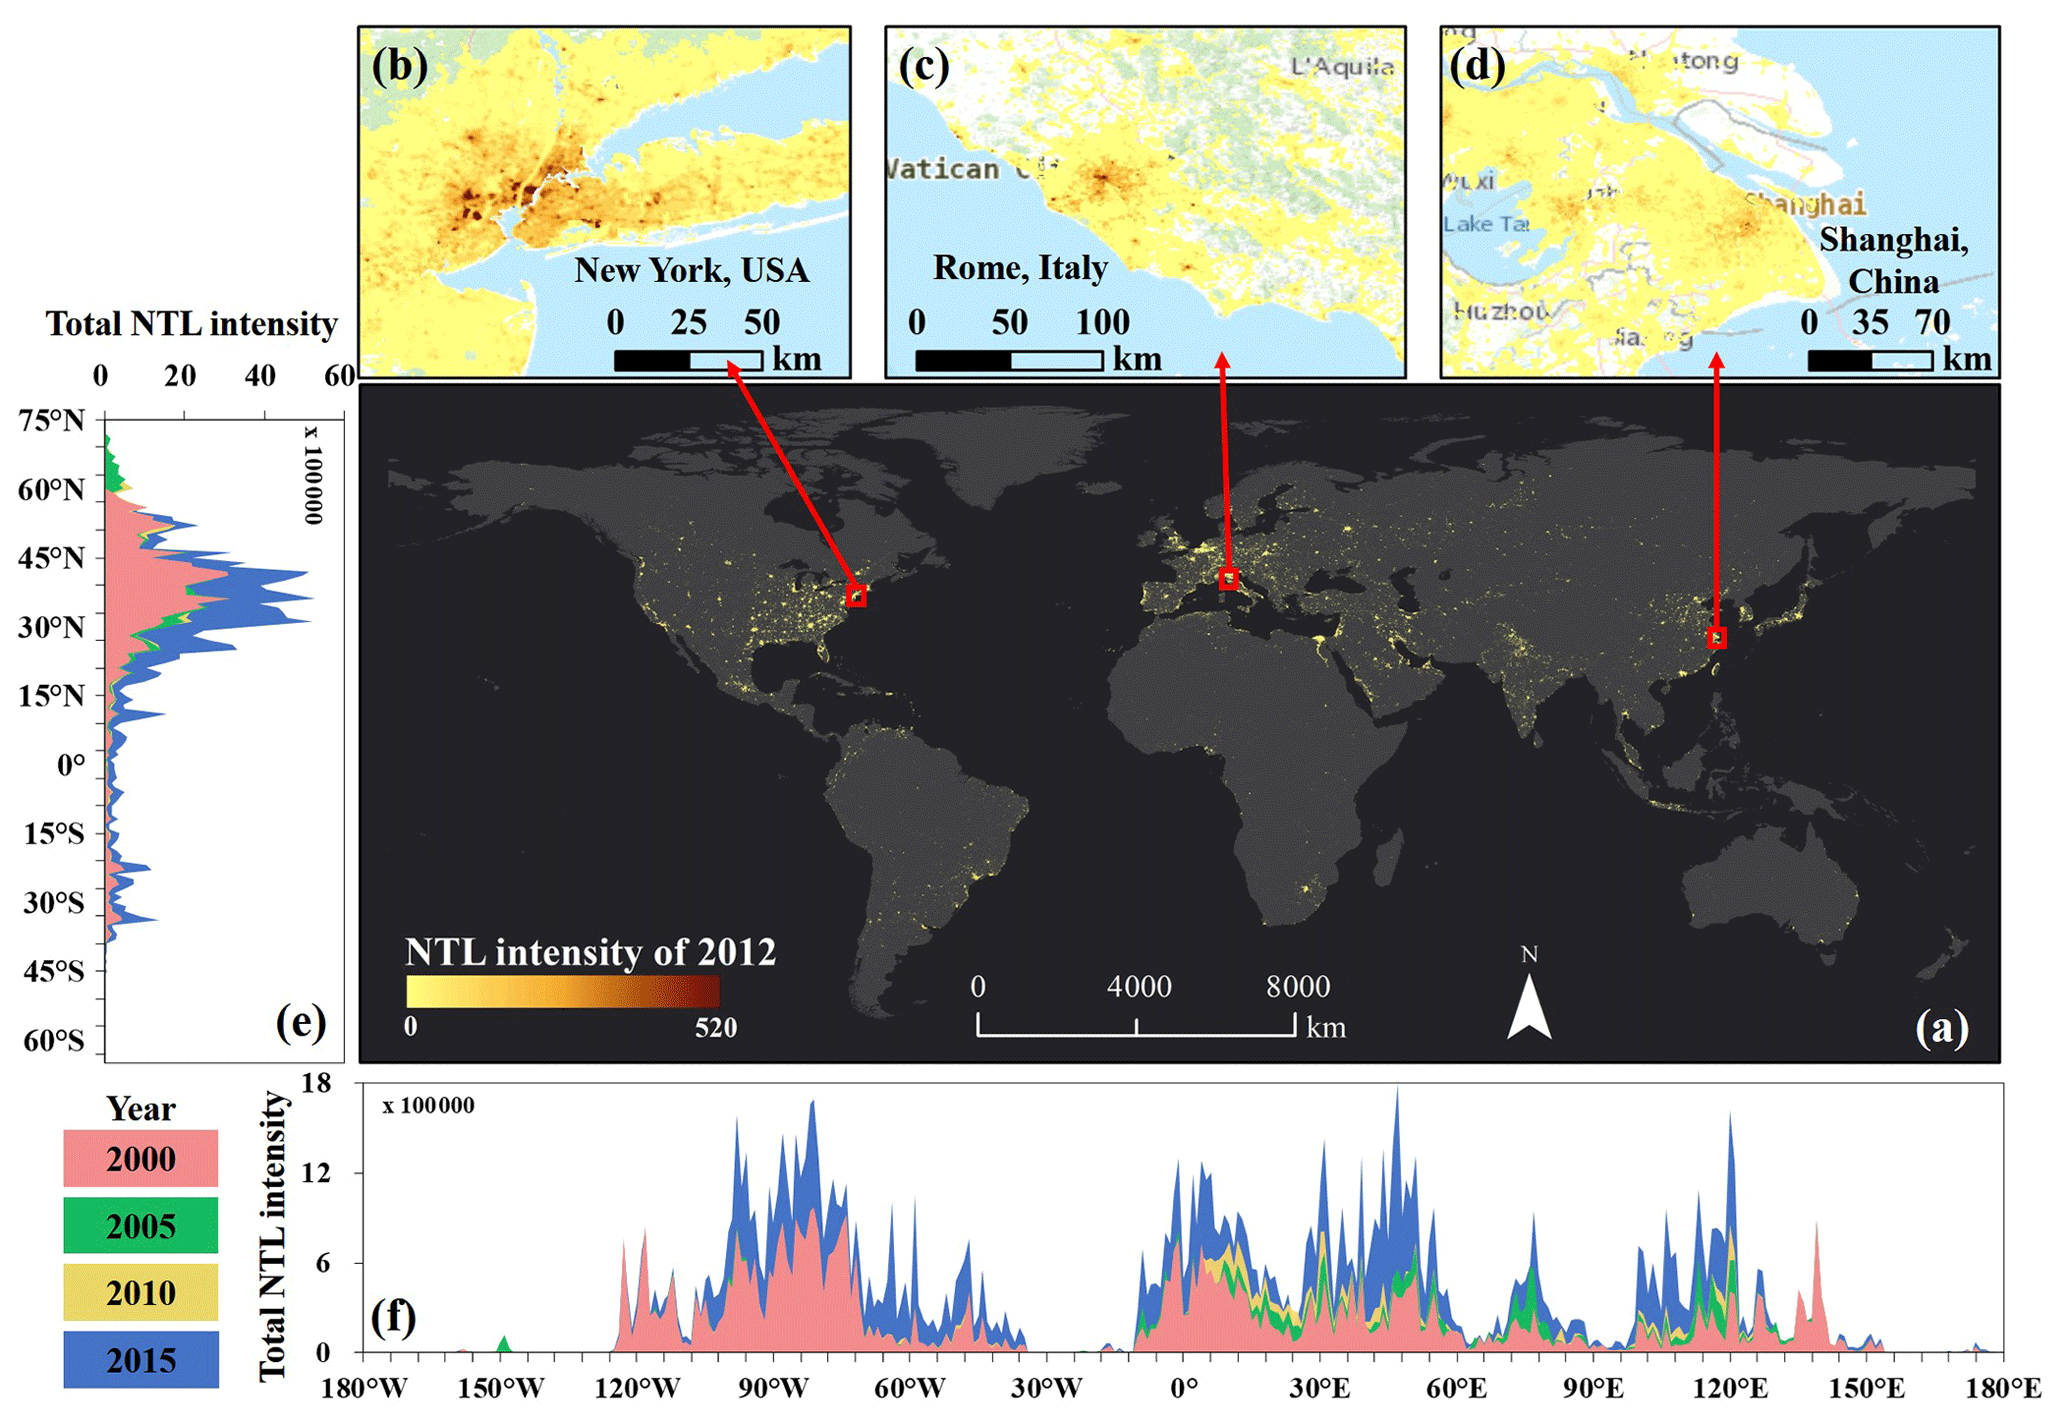
Figure 9The extended NPP-VIIRS-like NTL data (unit: nW cm−2 sr−1) with three enlarged subplots of New York, Rome, and Shanghai in 2012 and the dynamics of NTL intensity from 2000 to 2015 by longitude and latitude (1∘ bins).
4.3 The extended time series (2000–2018) of global NPP-VIIRS-like NTL data
Figure 9 shows the global spatial distribution of extended NPP-VIIRS-like NTL in 2012, including three enlarged subplots of New York, Rome, and Shanghai. From each enlarged subplot (Fig. 9b–d), our results could provide more information for urbanization evaluation, such as the road network and urban spatial structure. In addition, our product can be used to explore the differences in NTL intensity among cities. For example, these three enlarged subplots clearly show that New York had higher NTL intensity than either of the other two cities.
The dynamics (2000–2018) of extended NTL intensity were also plotted in Fig. 9e and f. At the global scale, higher NTL intensities clustered in the region from 20 to 45∘ N, while those with lower values were located in the Southern Hemisphere. The region from 30 to 45∘ N had no significant change in NTL intensity during the 2000–2010 period but had a great enhancement after 2010. For the region from 15 to 30∘ N, the NTL intensity was increasing during the 15 years, which was mostly caused by China's development. In the longitudinal direction, one of the NTL intensity peaks within the Western Hemisphere region was mostly located in the United States (from 70 to 100∘ W). In the Eastern Hemisphere region, there were three significant peaks in Europe, the Middle East, and China (from west to east). The temporal changes in NTL intensity between 2000 and 2005 were generally slighter than those between 2005 and 2010, but from 2010 to 2015, the blue part (2015) in Fig. 9e and f was larger than the yellow part (2010), which implies that the NTL intensity strengthened almost all over the world. This result was highly associated with the global economic recovery after the global financial crisis of 2007–2008 (W. Chen et al., 2019).
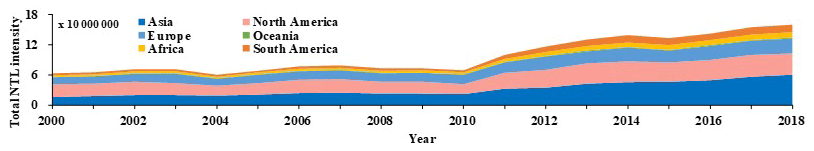
Figure 10 reports the trend in NTL intensity from our extended NPP-VIIRS-like NTL data within each continent. Globally, the NTL intensity had more than doubled during the period from 2000 to 2018, from 60 million to almost 150 million nW cm−2 sr−1. At the regional scale, Asia and North America had the most intense NTL intensity increase and seemed to be the main contributors to global urbanization. As the second group, both Europe and South America had a stable but slow increase. In Oceania and Africa, the NTL intensity had no obvious growth, especially before 2010.
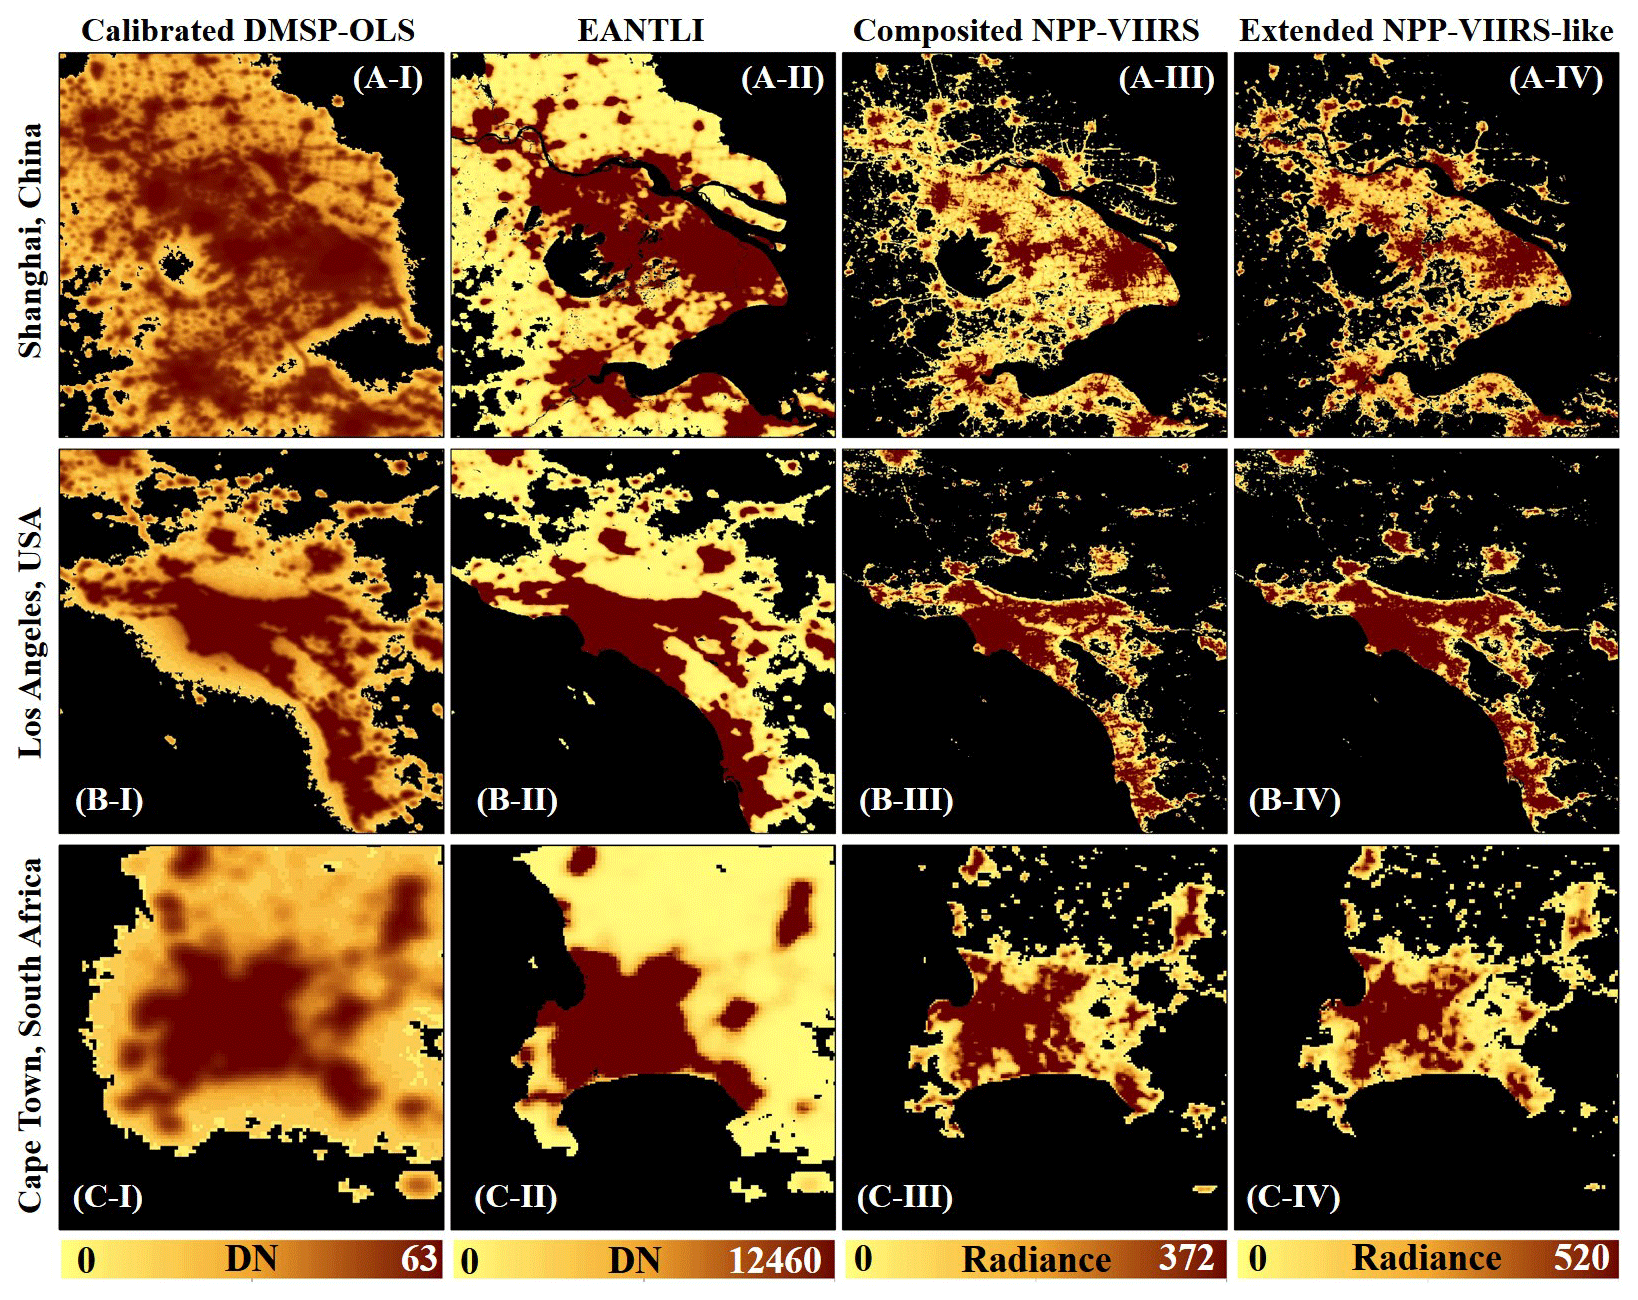
Figure 11Spatial patterns of NTL intensity in 2012 of (I) calibrated DMSP-OLS data, (II) EANTLI data, (III) composited NPP-VIIRS NTL data, and (IV) our extended NPP-VIIRS-like NTL data in three cities (a) Shanghai, China, (b) Los Angeles, United States, and (c) Cape Town, South Africa.
5.1 Evaluation of spatial patterns of extended NPP-VIIRS-like NTL data in 2012
The extended NPP-VIIRS-like NTL data (Fig. 11.IV) and the composited NPP-VIIRS NTL data (Fig. 11.III) show significant spatial variations in NTL intensity and less saturation and blooming problems than the calibrated DMSP-OLS data and EANTLI data (Fig. 11.I and II). In Fig. 11, the calibrated DMSP-OLS data have severe saturation and blooming problems in all three selected cities: Shanghai, Los Angeles, and Cape Town. By fusing the calibrated DMSP-OLS data and EVI data, the quality of the produced EANTLI data has a significant improvement, but it is still suffering a blooming problem. For example, in the periphery of the urban area, many pixels that are supposed to be dark have low NTL intensity, which makes the lit areas much larger than the reality. Compared to the EANTLI data, the composited NPP-VIIRS NTL data and our extended NPP-VIIRS-like NTL data have already obtained a great improvement. Firstly, the main road network can be easily found from the composited or extended NPP-VIIRS NTL data, which indicates that these two datasets can provide more spatial details of the NTL intensity. Secondly, the urban hierarchy structure is much clearer, and each lit area can be identified due to the effective elimination of the blooming problem.
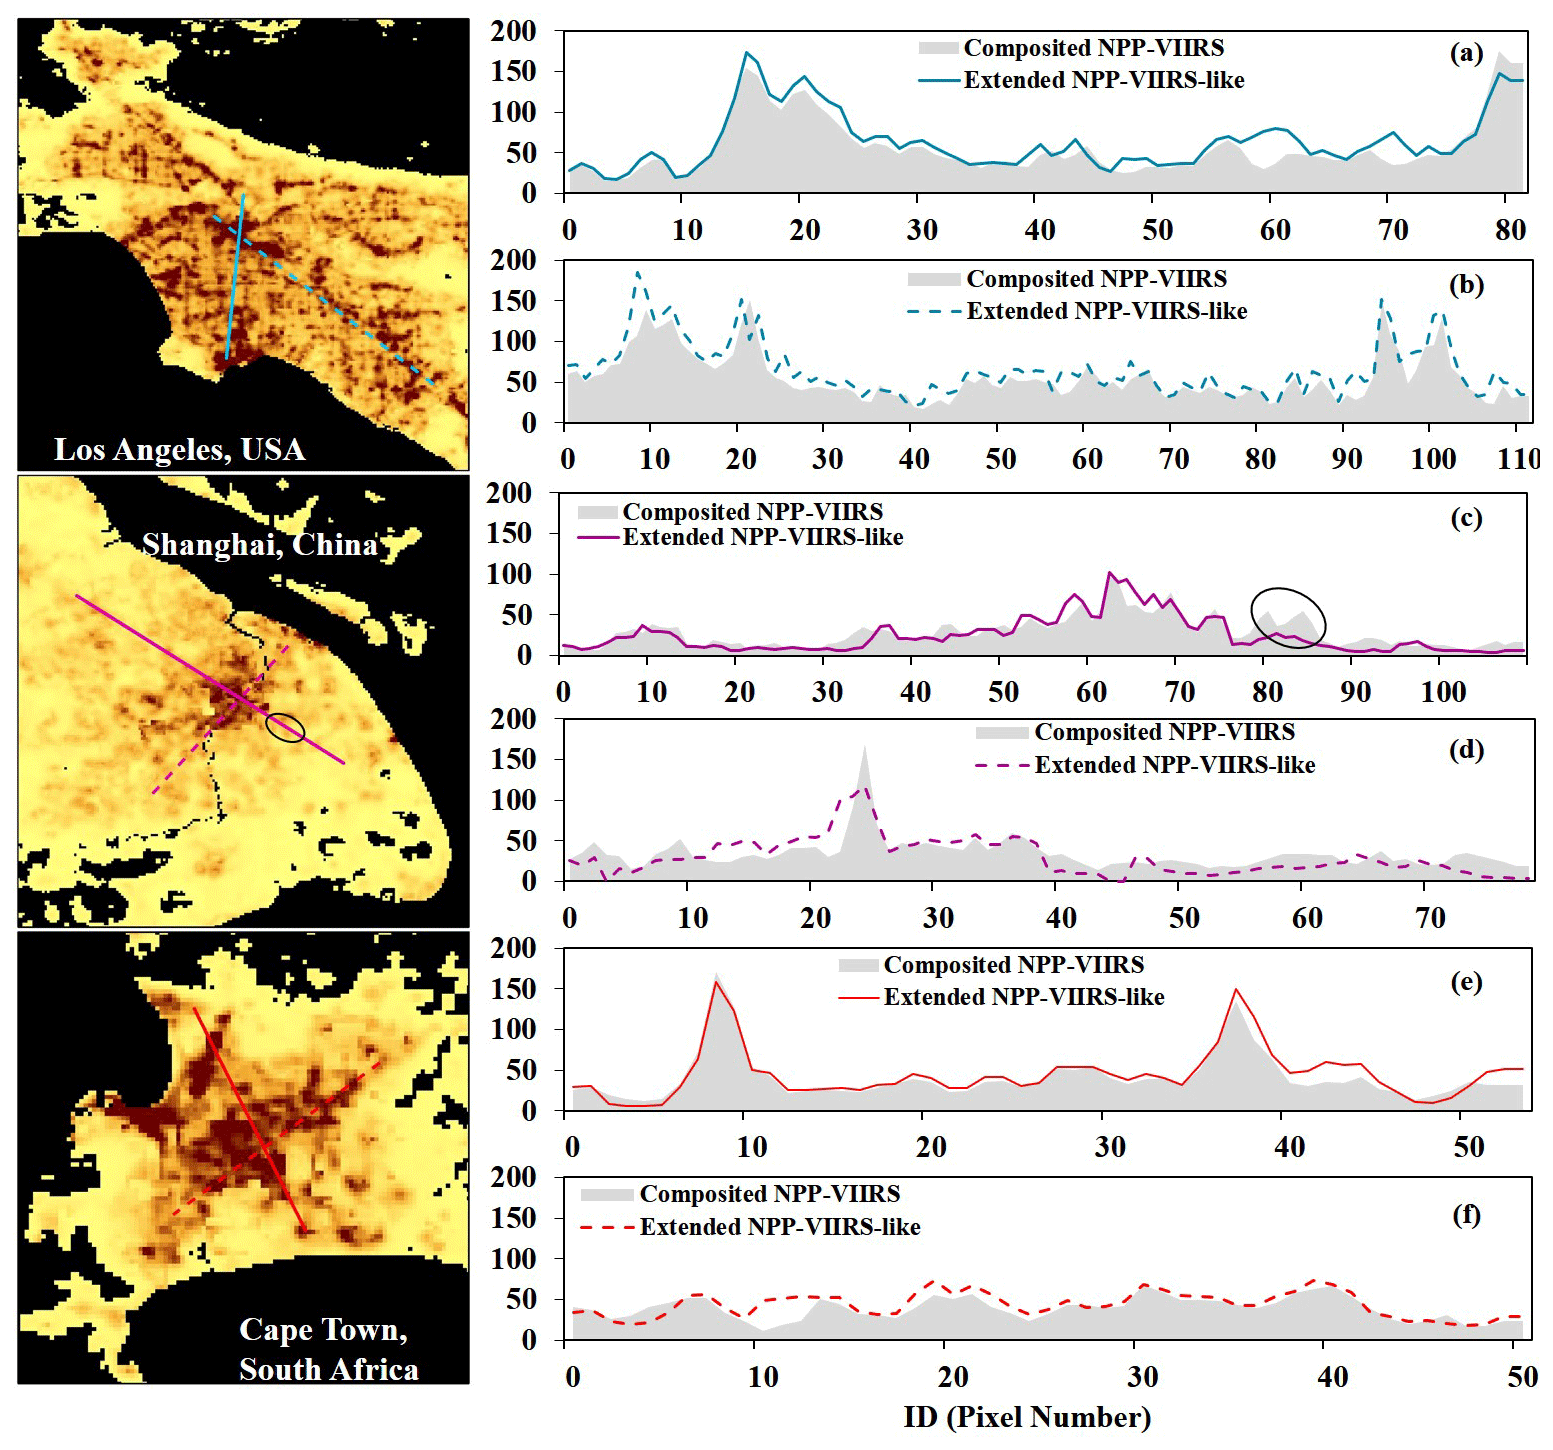
Figure 12Profiles of composited NPP-VIIRS NTL data and extended NPP-VIIRS-like NTL intensity (unit: nW cm−2 sr−1) across (a, b) Los Angeles, United States, (c, d) Shanghai, China, and (e, f) Cape Town, South Africa.
The fluctuation of extended NPP-VIIRS-like NTL data (solid or dashed line) agrees well with that of the composited NPP-VIIRS NTL data (gray part) from the six profiles across Shanghai, Los Angeles, and Cape Town in Fig. 12. In these three cities, the general trends of extended NPP-VIIRS-like NTL data are consistent with the those of composited NPP-VIIRS NTL data, especially within the urban core area, even though these extended NPP-VIIRS-like NTL profiles showed a small overestimation. Parts of the extended NPP-VIIRS-like NTL profiles in Shanghai have an underestimation when compared with the composited NPP-VIIRS NTL data. This situation mostly appeared within the urban periphery region (e.g., ID: 80–90 in Fig. 12c) and could be caused by some extreme situations, such as dramatically unbalanced development which leads to specific pixels with an abnormally high NTL intensity, while the surrounding pixels have a relative low NTL intensity. Under such a situation, the surrounding pixels might lower the centric pixel's NTL intensity when the convolutional and deconvolutional operations were conducted.
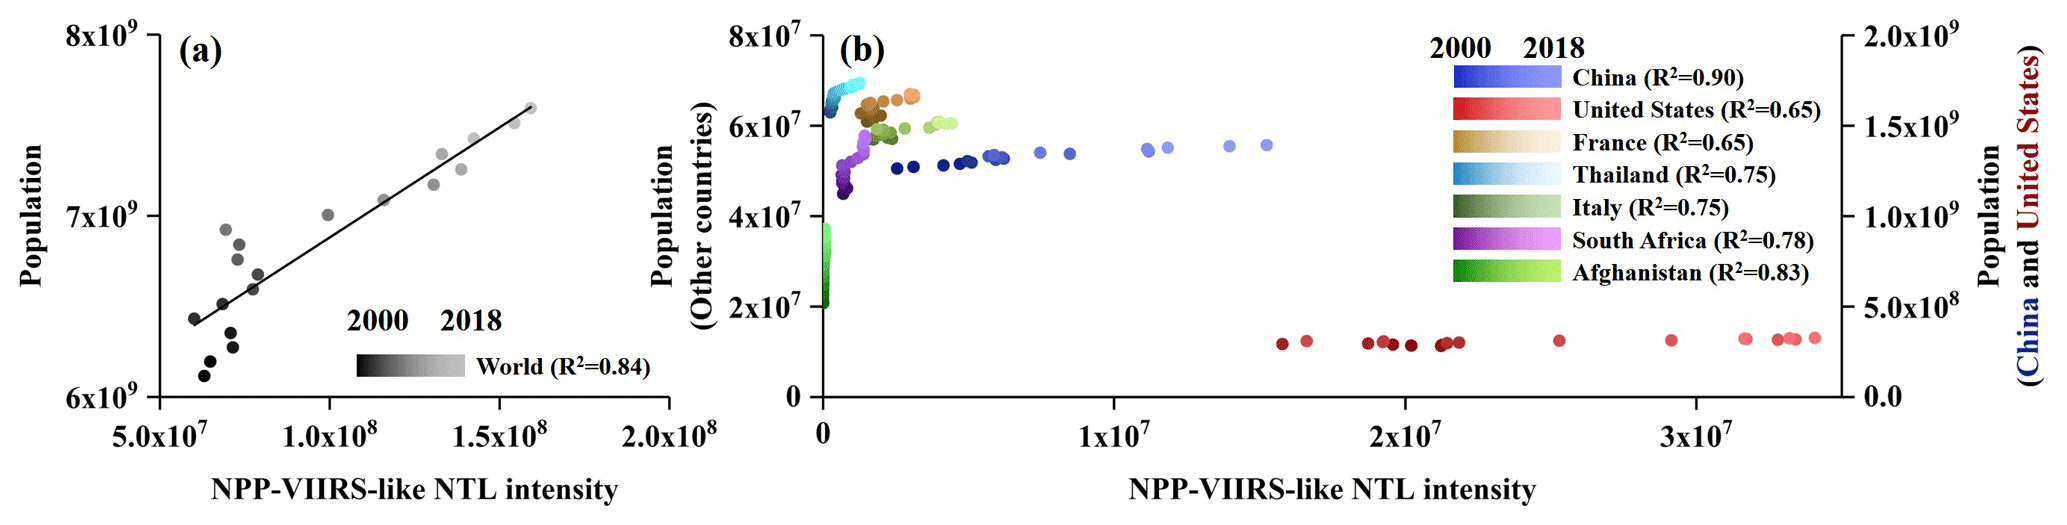
Figure 13Comparison of total population with total NTL intensity for (a) the globe and (b) seven representative countries.
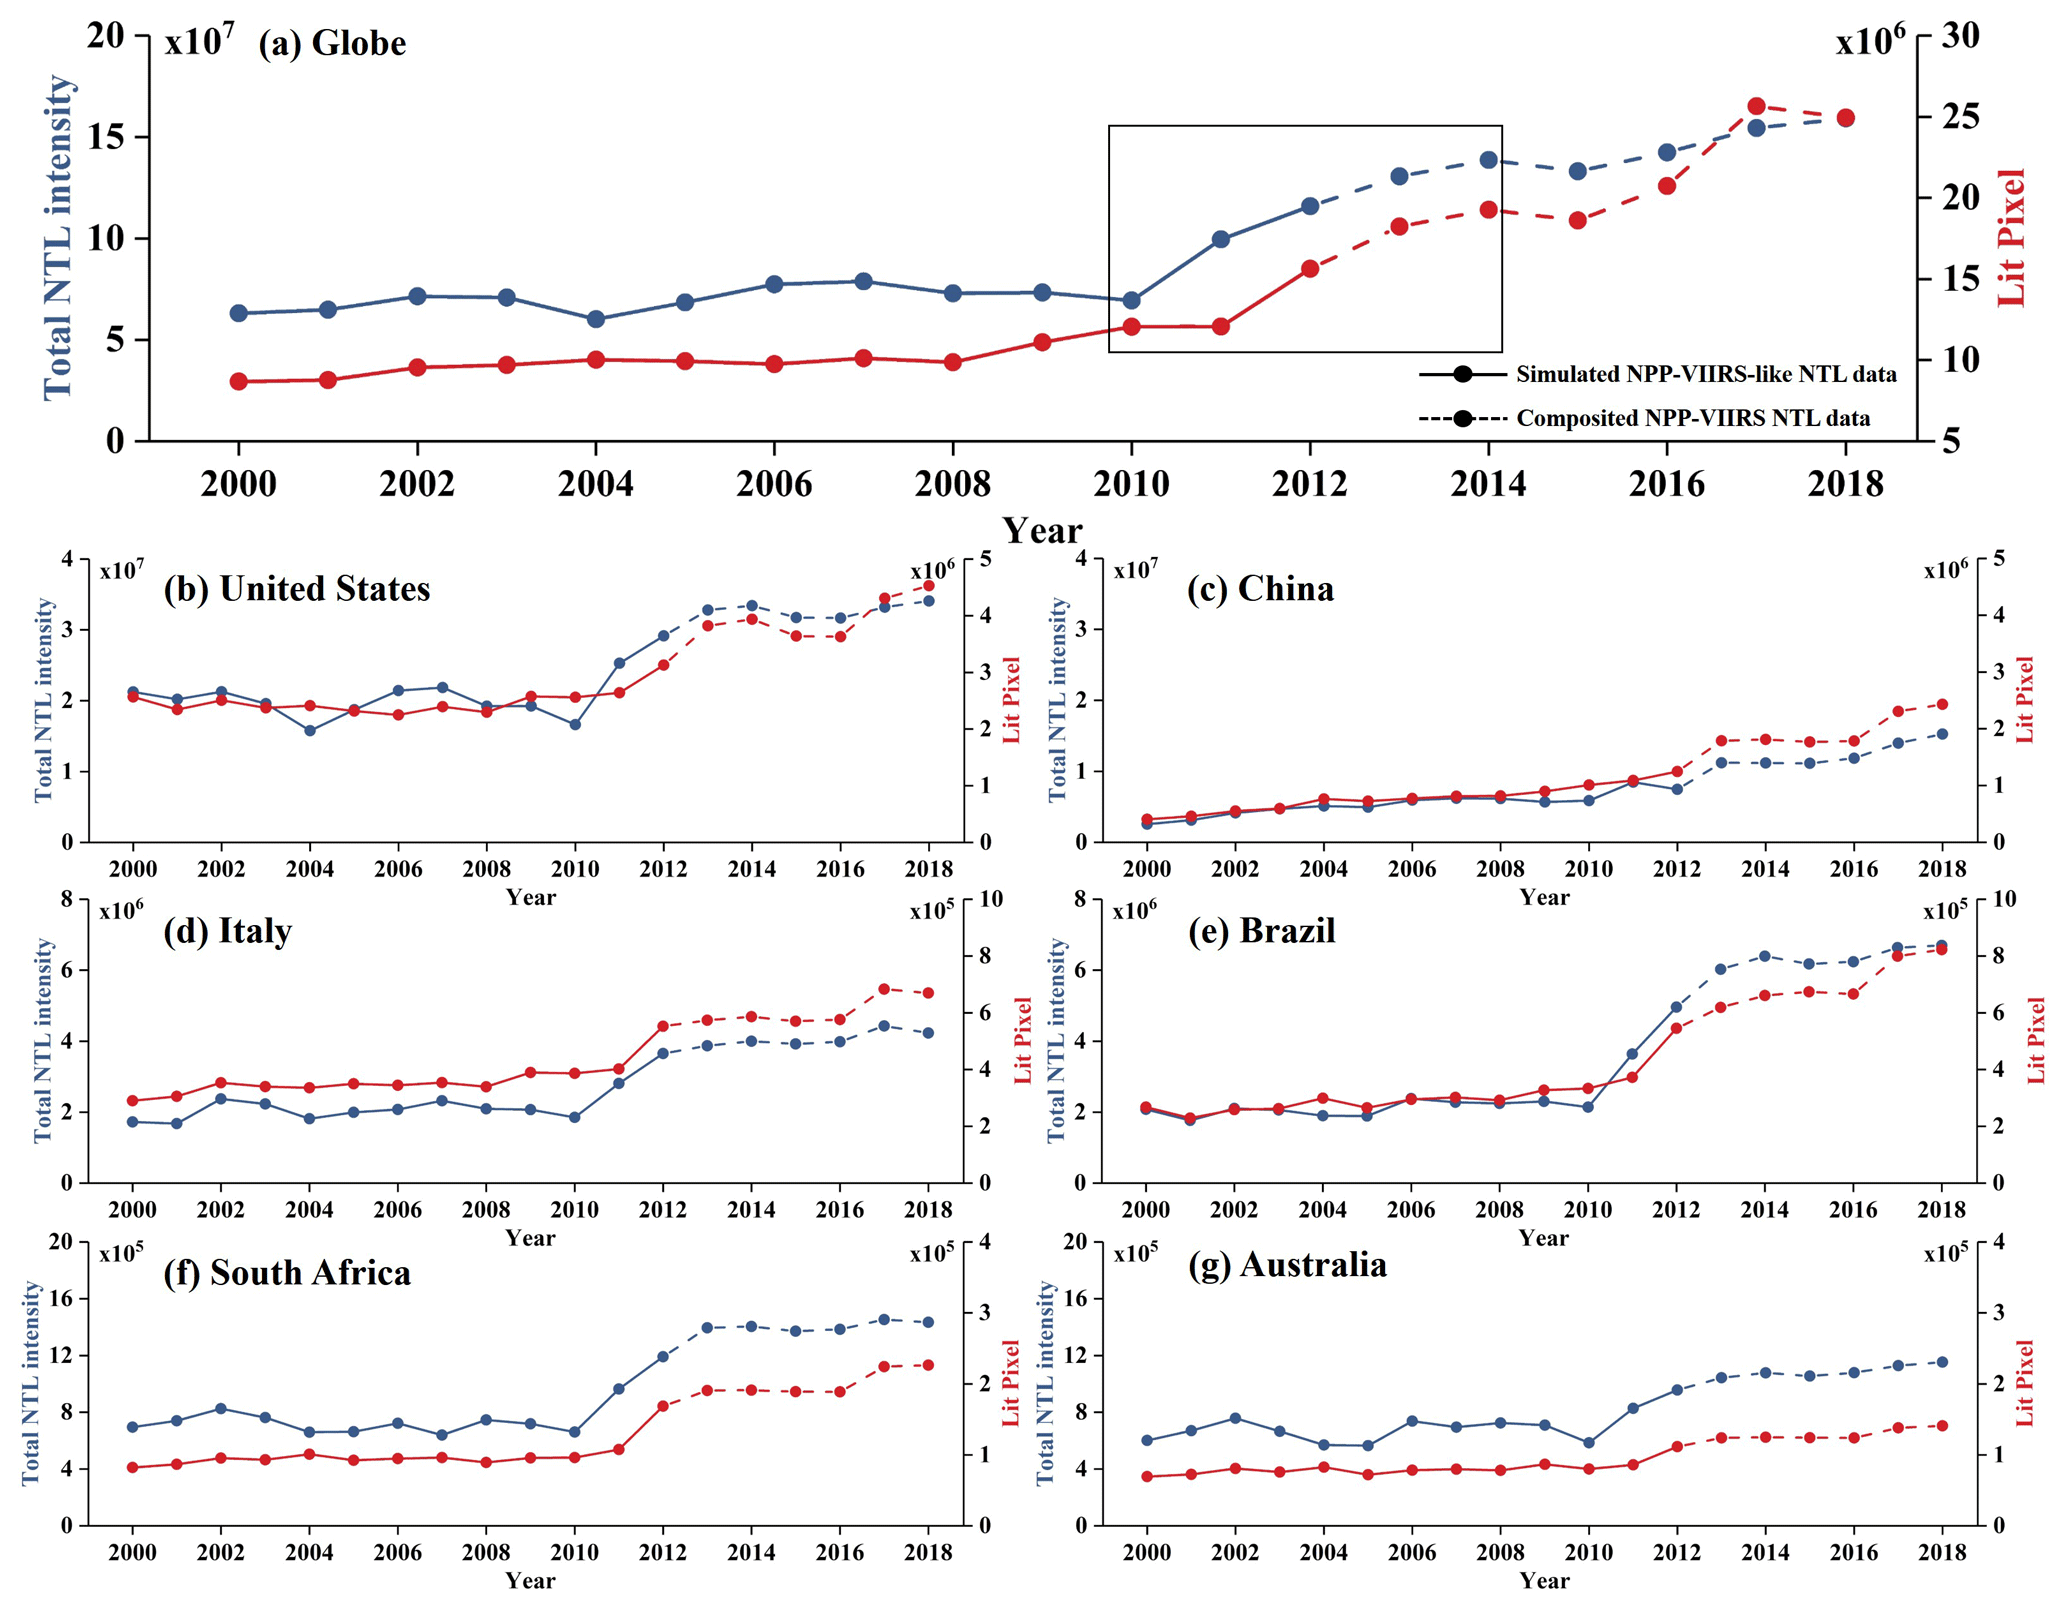
Figure 14Temporal trend of extended time series (2000–2018) NPP-VIIRS-like NTL data for the total NTL intensity and lit pixels at (a) the global scale and within six selected countries: (b) United States, (c) China, (d) Italy, (e) Brazil, (f) South Africa, and (g) Australia.
5.2 Evaluation of temporal consistency of the time series (2000–2018) of NPP-VIIRS-like NTL data
We compared the extended time series of NPP-VIIRS-like NTL data with the time series of census data and analyzed the range of the NTL intensity change near the temporal joining point (that is, the final year of simulated NPP-VIIRS-like NTL data and the first year of the composited NPP-VIIRS NTL data; see the rectangular box in Fig. 14). The results show that the extended time series of NPP-VIIRS-like NTL data has a consistent temporal trend at both global and regional scales.
Firstly, our NPP-VIIRS-like NTL data have a similar trend with the population from 2000 to 2018 (see Fig. 13). The census data of the entire world and seven countries were collected from World Bank Open Data (Table 1). A linear regression model was conducted to compare the population and total NTL intensity. The R2 at the global scale is 0.84 (Fig. 13a), and the R2 of seven selected countries (Fig. 13b) ranges from 0.65 (in the United States and France) to 0.90 (in China). This result illustrated that the NPP-VIIRS-like NTL data (2000–2018) have a reasonable temporal trend. Also, in China and Afghanistan, the extended NTL data have a better performance (R2 is larger than 0.8) of population estimation.
Secondly, our extended time series (2000–2018) of NPP-VIIRS-like NTL data has a smooth temporal change even near the temporal joining point (the year of 2012) between the simulated NPP-VIIRS-like NTL data and composited NPP-VIIRS NTL data. In Fig. 14a, the total NTL intensity and lit pixels (NTL intensity greater than 1 nW cm−2 sr−1) were measured at the global scale from 2000 to 2018. The total NTL intensity and lit pixel increased steadily in the first 10 years (2000–2010). From 2010 to 2014, the changes in total NTL intensity and lit pixels both increased much faster than before but were still stable, and no sudden jumps were found during the period (the rectangular box in Fig. 14). In the last 4 years (2014–2018), the increases in total NTL intensity became small and slow, while the lit pixel has a “U” shape with the peak in 2017. Consequently, our NPP-VIIRS-like NTL data source change from simulated NPP-VIIRS-like NTL data (2000–2012) to composited NPP-VIIRS NTL data (2013–2018) does not cause any unreasonable change in NTL intensity during the entire period at the global scale.
As shown in Fig. 14b–g, the number of lit pixels within each of the six selected countries has a stable trend, while the total NTL intensity has some fluctuations before 2010. From 2007 to 2010, an obvious reduction in NTL intensity was apparent in these six selected countries and even all over the world. After 2010, most countries had recovered and had an increase in the NTL intensity. This temporal change in NTL intensity is consistent with the worldwide Great Recession (2007–2010). This result proves that our extended NPP-VIIRS-like NTL data can truly detect the NTL intensity growth or reduction within a country. Meanwhile, we also found that each country had a different fluctuation range during the Great Recession. For example, as shown in Fig. 14b and c, the United States had a sharp decrease, but the decrement in China is slight, which is similar to the argument provided by Wen and Wu (2019) that China is able to withstanding the Great Recession. It means that our product has the capability of revealing the details of NTL intensity change.
5.3 Limitations
The artificial light from the oceans is not a stable light source (e.g., ship, offshore oil well) and could bring about a misunderstanding during the AE model training. Hence, a land area mask was applied to remove the ocean parts even though this procedure could reduce the ability to detect information from oceans, such as fishery (Waluda et al., 2008) and boats (Elvidge et al., 2015). Although our experiments, e.g., for population estimation, have indicated that the NPP-VIIRS-like NTL data have great potential in urban research, more applications are still required to promote this dataset.
Another issue is about the composited NPP-VIIRS NTL data generation based on its median value. We found some abnormal pixels which were not lit in the 2012 median annual NPP-VIIRS NTL data. This is because the NPP-VIIRS NTL monthly composite data were only available from April 2012, and the NTL data in the high latitude regions have been affected (Román and Stokes, 2015; Levin, 2017; Román et al., 2018). In summary, this missing data (from January to March) and the stray light in summer make the median NTL intensity become biased (lower than the usual level or even becoming zero). Thus, the cities or pixels with no lit issues were removed in the validation procedure.
In this study, we are more concerned about the statistical relationship between DMSP-OLS NTL data and NPP-VIIRS NTL data. However, the land cover and land use data could be useful to mitigate the underestimations in Fig. 12c because these data can help distinguish the extreme development situation. Meanwhile, introducing physical parameters during the preprocessing of data could probably further improve our extended NTL product because it has been proven that physical parameters such as viewing angle (Li et al., 2019) and lunar zenith angle (Román et al., 2018) could influence the NTL data quality. However, due to the limitation of data accessibility, the land cover and land use data and physical parameters were not involved in this study.
The source code of the AE architecture for this product is available at https://doi.org/10.7910/DVN/JRM2XE (Chen et al., 2021).
The extended time series (2000–2018) of nighttime light data in the WGS84 coordinate system with a spatial resolution of 15 arcsec (∼500 m) can be freely accessed at https://doi.org/10.7910/DVN/YGIVCD (Chen et al., 2020), which is stored as a zip file (∼50 MB) for each year. By uncompressing the zip file, the annual NPP-VIIRS-like NTL data are provided in GeoTIFF format (∼9 GB). These data can be processed using open-source software such as QGIS. We also included two data tables as Microsoft Excel XLSX files. One contains 40 000 sample points for comparing composited and official annual NPP-VIIRS NTL data in Fig. 8, and the other is the data used for the temporal trend analysis of our extended time series of NPP-VIIRS-like NTL data in Fig. 14.
An extended time series (2000–2018) of NPP-VIIRS-like NTL data was produced in this study. This product includes two parts: the simulated NPP-VIIRS-like NTL data (2000–2012) from DMSP-OLS NTL data and the composited annual NPP-VIIRS NTL data (2013–2018). Compared to the composited NPP-VIIRS NTL data in 2012, our extended NPP-VIIRS-like NTL data show good accuracy globally at the pixel (R2: 0.87, RMSE: 2.96) and city (R2: 0.95, RMSE: 3024.62) levels. At the regional scale, all countries show an acceptable accuracy. The R2 ranges from 0.70 to 0.86, and the RMSE is lower than 6 nW cm−2 sr−1. DMSP-OLS RNTL data in 2000, 2004, 2006, and 2010 were compared with the extended NPP-VIIRS-like NTL data. All R2 are higher than 0.75, which implies that our model is reliable. These evaluations indicate that our extended NPP-VIIRS-like NTL data have a reasonably good and spatially different quality.
Generally, our extended time series (2000–2018) of NPP-VIIRS-like NTL data shows a similar spatial pattern as the composited NPP-VIIRS NTL data with good quality regarding the spatial pattern and temporal consistency. The temporal trend agrees with the population change and a global economic event (i.e., the Great Recession). The NTL intensity of our product does not fluctuate around neighboring years between the simulated NPP-VIIRS-like NTL data (2000–2012) and composited NPP-VIIRS NTL data (2013–2018).
The extended NPP-VIIRS-like NTL data from 2000 to 2018 can be used to better evaluate and analyze the dynamics of demographic and socioeconomic characteristics during urbanization. For example, we can investigate the urban spatial structure, even the road network and its temporal dynamic, for a long time period. Our proposed NTL dataset is available until 2018 so far, but it can be extended in future when the monthly NPP-VIIRS NTL data for the whole year (e.g., 2019) become available.
ZC designed and developed the methodology and software, performed analysis and validation, and wrote the paper. BY supported and designed the study and wrote the paper. CY developed the methodology, performed validation, and reviewed the paper. YZ performed the validation and wrote the paper. SY wrote the paper. XQ developed the methodology and performed the validation. BW designed the methodology and performed analysis. JW supported and supervised the study.
The authors declare that they have no conflict of interest.
We would like to thank the Earth Observation Group for providing the original DMSP-OLS and NPP-VIIRS NTL data.
This research has been supported by the National Natural Science Foundation of China (grant nos. 41871331 and 41801343), the China Postdoctoral Science Foundation (grant no. 2020M671921), the Major Program of National Social Science Foundation of China (grant no. 17ZDA068), and the Fundamental Research Funds for the Central Universities of China.
This paper was edited by Kirsten Elger and reviewed by two anonymous referees.
Baugh, K., Hsu, F.-C., Elvidge, C. D., and Zhizhin, M.: Nighttime lights compositing using the VIIRS day-night band: Preliminary results, Proceedings of the Asia-Pacific Advanced Network, 35, 70–86, https://doi.org/10.7125/APAN.35.8, 2013.
Cao, X., Chen, J., Imura, H., and Higashi, O.: A SVM-based method to extract urban areas from DMSP-OLS and SPOT VGT data, Remote Sens. Environ., 113, 2205–2209, https://doi.org/10.1016/j.rse.2009.06.001, 2009.
Cao, X., Hu, Y., Zhu, X., Shi, F., Zhuo, L., and Chen, J.: A simple self-adjusting model for correcting the blooming effects in DMSP-OLS nighttime light images, Remote Sens. Environ., 224, 401–411, https://doi.org/10.1016/j.rse.2019.02.019, 2019.
Chen, H., Zhang, Y., Kalra, M. K., Lin, F., Chen, Y., Liao, P., Zhou, J., and Wang, G.: Low-dose CT with a residual encoder-decoder convolutional neural network, IEEE T. Med. Imaging, 36, 2524–2535, 2017.
Chen, W., Mrkaic, M., and Nabar, M. S.: The global economic recovery 10 years after the 2008 financial crisis, International Monetary Fund, Washington D.C., USA, 2019.
Chen, Z., Yu, B., Hu, Y., Huang, C., Shi, K., and Wu, J.: Estimating House Vacancy Rate in Metropolitan Areas Using NPP-VIIRS Nighttime Light Composite Data, IEEE J. Sel. Top. Appl., 8, 2188–2197, https://doi.org/10.1109/JSTARS.2015.2418201, 2015.
Chen, Z., Yu, B., Song, W., Liu, H., Wu, Q., Shi, K., and Wu, J.: A New Approach for Detecting Urban Centers and Their Spatial Structure With Nighttime Light Remote Sensing, IEEE T. Geosci. Remote, 55, 6305–6319, https://doi.org/10.1109/TGRS.2017.2725917, 2017.
Chen, Z., Yu, B., Zhou, Y., Liu, H., Yang, C., Shi, K., and Wu, J.: Mapping Global Urban Areas From 2000 to 2012 Using Time-Series Nighttime Light Data and MODIS Products, IEEE J. Sel. Top. Appl., 12, 1143–1153, https://doi.org/10.1109/JSTARS.2019.2900457, 2019.
Chen, Z., Yu, B., Yang, C., Zhou, Y., Qian, X., Wang, C., Wu, B., and Wu, J.: An extended time-series (2000-2018) of global NPP-VIIRS-like nighttime light data, Harvard Dataverse, https://doi.org/10.7910/DVN/YGIVCD, 2020.
Chen, Z., Yu, B., Yang, C., Zhou, Y., Qian, X., Wang, C., Wu, B., and Wu, J.: Source Code for the extended time-series (2000–2018) of global NPP-VIIRS-like nighttime light data, Harvard Dataverse, https://doi.org/10.7910/DVN/JRM2XE, 2021.
Elvidge, C. D., Baugh, K. E., Kihn, E. A., Kroehl, H. W., and Davis, E. R.: Mapping city lights with nighttime data from the DMSP operational linescan system, Photogramm. Eng. Rem. S., 63, 727–734, 1997a.
Elvidge, C. D., Baugh, K. E., Kihn, E. A., Kroehl, H. W., Davis, E. R., and Davis, C. W.: Relation between satellite observed visible-near infrared emissions, population, economic activity and electric power consumption, Int. J. Remote Sens., 18, 1373–1379, https://doi.org/10.1080/014311697218485, 1997b.
Elvidge, C. D., Hsu, F.-C., Baugh, K. E., and Ghosh, T.: National Trends in Satellite-Observed Lighting 1992–2012, in Global Urban Monitoring and Assessment Through Earth Observation, 97, CRC Press, Boca Raton, https://doi.org/10.1201/b17012-9, 2014.
Elvidge, C. D., Zhizhin, M., Baugh, K., and Hsu, F.-C.: Automatic Boat Identification System for VIIRS Low Light Imaging Data, Remote Sens., 7, 3020–3036, https://doi.org/10.3390/rs70303020, 2015.
Elvidge, C. D., Baugh, K., Zhizhin, M., Hsu, F. C., and Ghosh, T.: VIIRS night-time lights, Int. J. Remote Sens., 38, 5860–5879, https://doi.org/10.1080/01431161.2017.1342050, 2017.
Falchi, F., Cinzano, P., Elvidge, C. D., Keith, D. M., and Haim, A.: Limiting the impact of light pollution on human health, environment and stellar visibility, J. Environ. Manage., 92, 2714–2722, https://doi.org/10.1016/j.jenvman.2011.06.029, 2011.
Feng-Chi, H., Kimberly, B., Tilottama, G., Mikhail, Z., and Christopher, E.: DMSP-OLS Radiance Calibrated Nighttime Lights Time Series with Intercalibration, Remote Sens., 7, 1855–1876, https://doi.org/10.3390/rs70201855, 2015.
Gaston, K. J., Bennie, J., Davies, T. W., and Hopkins, J.: The ecological impacts of nighttime light pollution: a mechanistic appraisal, Biol. Rev., 88, 912–927, https://doi.org/10.1111/brv.12036, 2013.
Goodfellow, I., Bengio, Y., and Courville, A.: Deep learning, MIT press, Cambridge, MA, USA, 2016.
He, K., Zhang, X., Ren, S., and Sun, J.: Delving Deep into Rectifiers: Surpassing Human-Level Performance on ImageNet Classification, Proceedings of the 2015 IEEE International Conference on Computer Vision (ICCV), Santiago, Chile, 13–16 December, 1026–1034, 2015.
Hinton, G. E. and Zemel, R. S.: Autoencoders, minimum description length and Helmholtz free energy, Adv. Neur. In., 6, 3–10, 1994.
Huang, Y., Chen, Z., Wu, B., Chen, L., Mao, W., Zhao, F., Wu, J., Wu, J., and Yu, B.: Estimating Roof Solar Energy Potential in the Downtown Area Using a GPU-Accelerated Solar Radiation Model and Airborne LiDAR Data, Remote Sens., 7, 15877, https://doi.org/10.3390/rs71215877, 2015.
Ioffe, S. and Szegedy, C.: Batch normalization: Accelerating deep network training by reducing internal covariate shift, arXiv preprint arXiv:1502.03167, 2015.
Jain, V. and Seung, S.: Natural image denoising with convolutional networks, Adv. Neur. In., 769–776, 2009.
Jeswani, R.: Evaluation of the consistency of DMSP-OLS and SNPP-VIIRS Night-time Light Datasets, Master Thesis, Geo-Information Science and Earth Observation, University of Twente, 2017.
Jiang, W., He, G., Leng, W., Long, T., Wang, G., Liu, H., Peng, Y., Yin, R., and Guo, H.: Characterizing Light Pollution Trends across Protected Areas in China Using Nighttime Light Remote Sensing Data, ISPRS Int. J. Geo-Inf., 7, 243, https://doi.org/10.3390/ijgi7070243, 2018.
Jing, W., Yang, Y., Yue, X., and Zhao, X.: Mapping Urban Areas with Integration of DMSP/OLS Nighttime Light and MODIS Data Using Machine Learning Techniques, Remote Sens., 7, 12419, https://doi.org/10.3390/rs70912419, 2015.
Kingma, D. P. and Ba, J.: Adam: A method for stochastic optimization, arXiv preprint arXiv:1412.6980, 2014.
Kumar, L. and Mutanga, O.: Google Earth Engine Applications Since Inception: Usage, Trends, and Potential, Remote Sens., 10, 1509, https://doi.org/10.3390/rs10101509, 2018.
Letu, H., Hara, M., Yagi, H., Naoki, K., Tana, G., Nishio, F., and Shuhei, O.: Estimating energy consumption from night-time DMPS/OLS imagery after correcting for saturation effects, Int. J. Remote Sens., 31, 4443–4458, https://doi.org/10.1080/01431160903277464, 2010.
Levin, N.: The impact of seasonal changes on observed nighttime brightness from 2014 to 2015 monthly VIIRS DNB composites, Remote Sens. Environ., 193, 150–164, https://doi.org/10.1016/j.rse.2017.03.003, 2017.
Levin, N., Kyba, C. C. M., Zhang, Q., Sánchez de Miguel, A., Román, M. O., Li, X., Portnov, B. A., Molthan, A. L., Jechow, A., Miller, S. D., Wang, Z., Shrestha, R. M., and Elvidge, C. D.: Remote sensing of night lights: A review and an outlook for the future, Remote Sens. Environ., 237, 111443, https://doi.org/10.1016/j.rse.2019.111443, 2020.
Li, X. and Zhou, Y.: A Stepwise Calibration of Global DMSP/OLS Stable Nighttime Light Data (1992–2013), Remote Sens., 9, 637, https://doi.org/10.3390/rs9060637, 2017.
Li, X., Li, D., Xu, H., and Wu, C.: Intercalibration between DMSP/OLS and VIIRS night-time light images to evaluate city light dynamics of Syria's major human settlement during Syrian Civil War, Int. J. Remote Sens., 38, 5934–5951, https://doi.org/10.1080/01431161.2017.1331476, 2017.
Li, X., Zhan, C., Tao, J., and Li, L.: Long-Term Monitoring of the Impacts of Disaster on Human Activity Using DMSP/OLS Nighttime Light Data: A Case Study of the 2008 Wenchuan, China Earthquake, Remote Sens., 10, 588, https://doi.org/10.3390/rs10040588, 2018.
Li, X., Ma, R., Zhang, Q., Li, D., Liu, S., He, T., and Zhao, L.: Anisotropic characteristic of artificial light at night – Systematic investigation with VIIRS DNB multi-temporal observations, Remote Sens. Environ., 233, 111357, https://doi.org/10.1016/j.rse.2019.111357, 2019.
Li, X., Zhou, Y., Zhao, M., and Zhao, X.: A harmonized global nighttime light dataset 1992–2018, Sci. Data, 7, 168, https://doi.org/10.1038/s41597-020-0510-y, 2020.
Liu, H., Wang, L., Sherman, D., Gao, Y., and Wu, Q.: An object-based conceptual framework and computational method for representing and analyzing coastal morphological changes, Int. J. Geogr. Inf. Sci., 24, 1015–1041, https://doi.org/10.1080/13658810903270569, 2010.
Liu, X., Ou, J., Wang, S., Li, X., Yan, Y., Jiao, L., and Liu, Y.: Estimating spatiotemporal variations of city-level energy-related CO2 emissions: An improved disaggregating model based on vegetation adjusted nighttime light data, J. Clean. Prod., 177, 101–114, https://doi.org/10.1016/j.jclepro.2017.12.197, 2018.
Lo, C.: Urban Indicators of China from Radiance-Calibrated Digital DMSP-OLS Nighttime Images, Ann. Assoc. Am. Geogr., 92, 225–240, https://doi.org/10.1111/1467-8306.00288, 2002.
Lu, H., Zhang, C., Liu, G., Ye, X., and Miao, C.: Mapping China's Ghost Cities through the Combination of Nighttime Satellite Data and Daytime Satellite Data, Remote Sens., 10, 1037, https://doi.org/10.3390/rs10071037, 2018.
Ma, T., Zhou, C., Pei, T., Haynie, S., and Fan, J.: Quantitative estimation of urbanization dynamics using time series of DMSP/OLS nighttime light data: A comparative case study from China's cities, Remote Sens. Environ., 124, 99–107, https://doi.org/10.1016/j.rse.2012.04.018, 2012.
Ma, T., Zhou, C., Pei, T., Haynie, S., and Fan, J.: Responses of Suomi- NPP VIIRS- derived nighttime lights to socioeconomic activity in China's cities, Remote Sens. Lett., 5, 165–174, https://doi.org/10.1080/2150704x.2014.890758, 2014.
Ou, J., Liu, X., Li, X., and Chen, Y.: Quantifying the relationship between urban forms and carbon emissions using panel data analysis, Landscape Ecology, 28, 1889–1907, https://doi.org/10.1007/s10980-013-9943-4, 2013.
Román, M. O. and Stokes, E. C.: Holidays in lights: Tracking cultural patterns in demand for energy services, Earths Future, 3, 182–205, https://doi.org/10.1002/2014EF000285, 2015.
Román, M. O., Wang, Z., Sun, Q., Kalb, V., Miller, S. D., Molthan, A., Schultz, L., Bell, J., Stokes, E. C., Pandey, B., Seto, K. C., Hall, D., Oda, T., Wolfe, R. E., Lin, G., Golpayegani, N., Devadiga, S., Davidson, C., Sarkar, S., Praderas, C., Schmaltz, J., Boller, R., Stevens, J., Ramos González, O. M., Padilla, E., Alonso, J., Detrés, Y., Armstrong, R., Miranda, I., Conte, Y., Marrero, N., MacManus, K., Esch, T., and Masuoka, E. J.: NASA's Black Marble nighttime lights product suite, Remote Sens. Environ., 210, 113–143, https://doi.org/10.1016/j.rse.2018.03.017, 2018.
Shao, X., Cao, C., Zhang, B., Qiu, S., Elvidge, C., and Von Hendy, M.: Radiometric calibration of DMSP-OLS sensor using VIIRS day/night band, Earth Observing Missions and Sensors: Development, Implementation, and Characterization III, Beijing, China, 19 December, 92640A, 2014.
Shi, K., Huang, C., Yu, B., Yin, B., Huang, Y., and Wu, J.: Evaluation of NPP-VIIRS night-time light composite data for extracting built-up urban areas, Remote Sens. Lett., 5, 358–366, https://doi.org/10.1080/2150704X.2014.905728, 2014a.
Shi, K., Yu, B., Huang, Y., Hu, Y., Yin, B., Chen, Z., Chen, L., and Wu, J.: Evaluating the Ability of NPP-VIIRS Nighttime Light Data to Estimate the Gross Domestic Product and the Electric Power Consumption of China at Multiple Scales: A Comparison with DMSP-OLS Data, Remote Sens., 6, 1705–1724, https://doi.org/10.3390/rs6021705, 2014b.
Shi, K., Chen, Y., Yu, B., Xu, T., Chen, Z., Liu, R., Li, L., and Wu, J.: Modeling spatiotemporal CO2 (carbon dioxide) emission dynamics in China from DMSP-OLS nighttime stable light data using panel data analysis, Appl. Energ., 168, 523–533, https://doi.org/10.1016/j.apenergy.2015.11.055, 2016a.
Shi, K., Chen, Y., Yu, B., Xu, T., Yang, C., Li, L., Huang, C., Chen, Z., Liu, R., and Wu, J.: Detecting spatiotemporal dynamics of global electric power consumption using DMSP-OLS nighttime stable light data, Appl. Energ., 184, 450–463, https://doi.org/10.1016/j.apenergy.2016.10.032, 2016b.
Shi, K., Yu, B., Huang, C., Wu, J., and Sun, X.: Exploring spatiotemporal patterns of electric power consumption in countries along the Belt and Road, Energy, 150, 847–859, https://doi.org/10.1016/j.energy.2018.03.020, 2018.
Sutton, P., Roberts, D., Elvidge, C., and Baugh, K.: Census from Heaven: an estimate of the global human population using night-time satellite imagery, Int. J. Remote Sens., 22, 3061–3076, https://doi.org/10.1080/01431160010007015, 2001.
Tan, C. C. and Eswaran, C.: Reconstruction of handwritten digit images using autoencoder neural networks, 2008 Canadian Conference on Electrical and Computer Engineering, Niagara Falls, Ontario, Canada, 4–7 May, 000465-000470, 2008.
Taylor, P. J., Ni, P., Derudder, B., Hoyler, M., Huang, J., Lu, F., Pain, K., Witlox, F., Yang, X., and Bassens, D.: Measuring the world city network: new results and developments, in: ICTs for Mobile and Ubiquitous Urban Infrastructures: Surveillance, Locative Media and Global Networks: Surveillance, Locative Media and Global Networks, Hershey, PA, USA, 15–23, https://doi.org/10.4018/978-1-60960-051-8.ch002, 2010.
Vincent, P., Larochelle, H., Lajoie, I., Bengio, Y., and Manzagol, P.-A.: Stacked denoising autoencoders: Learning useful representations in a deep network with a local denoising criterion, J. Mach. Learn. Res., 11, 3371–3408, https://doi.org/10.1016/j.mechatronics.2010.09.004, 2010.
Waluda, C. M., Griffiths, H. J., and Rodhouse, P. G.: Remotely sensed spatial dynamics of the Illex argentinus fishery, Southwest Atlantic, Fish. Res., 91, 196–202, https://doi.org/10.1016/j.fishres.2007.11.027, 2008.
Wang, R. and Tao, D.: Non-local auto-encoder with collaborative stabilization for image restoration, IEEE T. Image Process., 25, 2117–2129, 2016.
Wen, Y. and Wu, J.: Withstanding the Great Recession Like China, The Manchester School, 87, 138–182, https://doi.org/10.1111/manc.12223, 2019.
World Bank: Population, total, World Development Indicators, available at: https://data.worldbank.org/indicator/SP.POP.TOTL, last access: 10 May 2020.
Wu, B., Yu, B., Yao, S., Wu, Q., Chen, Z., and Wu, J.: A surface network based method for studying urban hierarchies by night time light remote sensing data, Int. J. Geogr. Inf. Sci., 33, 1377–1398, https://doi.org/10.1080/13658816.2019.1585540, 2019.
Xu, H., Yang, H., Li, X., Jin, H., and Li, D.: Multi-Scale Measurement of Regional Inequality in Mainland China during 2005–2010 Using DMSP/OLS Night Light Imagery and Population Density Grid Data, Sustainability, 7, 13469, https://doi.org/10.3390/SU71013469, 2015.
Yang, C., Yu, B., Chen, Z., Song, W., Zhou, Y., Li, X., and Wu, J.: A Spatial-Socioeconomic Urban Development Status Curve from NPP-VIIRS Nighttime Light Data, Remote Sens., 11, 2398, https://doi.org/10.3390/rs11202398, 2019.
Yu, B., Shu, S., Liu, H., Song, W., Wu, J., Wang, L., and Chen, Z.: Object-based spatial cluster analysis of urban landscape pattern using nighttime light satellite images: a case study of China, Int. J. Geogr. Inf. Sci., 28, 2328–2355, https://doi.org/10.1080/13658816.2014.922186, 2014.
Yu, B., Shi, K., Hu, Y., Huang, C., Chen, Z., and Wu, J.: Poverty Evaluation Using NPP-VIIRS Nighttime Light Composite Data at the County Level in China, IEEE J-Stars, 8, 1217–1229, https://doi.org/10.1109/JSTARS.2015.2399416, 2015.
Yu, B., Lian, T., Huang, Y., Yao, S., Ye, X., Chen, Z., Yang, C., and Wu, J.: Integration of nighttime light remote sensing images and taxi GPS tracking data for population surface enhancement, Int. J. Geogr. Inf. Sci., 33, 687–706, https://doi.org/10.1080/13658816.2018.1555642, 2018.
Zhao, M., Zhou, Y., Li, X., Zhou, C., Cheng, W., Li, M., and Huang, K.: Building a Series of Consistent Night-Time Light Data (1992-2018) in Southeast Asia by Integrating DMSP-OLS and NPP-VIIRS, IEEE T. Geosci. Remote, 58, 1843–1856, https://doi.org/10.1109/TGRS.2019.2949797, 2019.
Zhao, N., Liu, Y., Cao, G., Samson, E. L., and Zhang, J.: Forecasting China's GDP at the pixel level using nighttime lights time series and population images, GISci. Remote Sens., 54, 407–425, https://doi.org/10.1080/15481603.2016.1276705, 2017.
Zhao, X., Yu, B., Liu, Y., Chen, Z., Li, Q., Wang, C., and Wu, J.: Estimation of Poverty Using Random Forest Regression with Multi-Source Data: A Case Study in Bangladesh, Remote Sens., 11, 375, https://doi.org/10.3390/rs11040375, 2019.
Zheng, Q., Weng, Q., and Wang, K.: Developing a new cross-sensor calibration model for DMSP-OLS and Suomi-NPP VIIRS night-light imageries, ISPRS Journal of Photogrammetry and Remote Sensing, 153, 36–47, https://doi.org/10.1016/j.isprsjprs.2019.04.019, 2019.
Zhou, Y., Smith, S. J., Elvidge, C. D., Zhao, K., Thomson, A., and Imhoff, M.: A cluster-based method to map urban area from DMSP/OLS nightlights, Remote Sens. Environ., 147, 173–185, 2014.
Zhou, Y., Smith, S. J., Zhao, K., Imhoff, M., Thomson, A., Bond-Lamberty, B., Asrar, G. R., Zhang, X., He, C., and Elvidge, C. D.: A global map of urban extent from nightlights, Environ. Res. Lett., 10, 054011, https://doi.org/10.1088/1748-9326/10/5/054011, 2015.
Zhu, X., Yang, H., Ge, W., and Ma, M.: Modeling the Spatiotemporal Dynamics of Gross Domestic Product in China Using Extended Temporal Coverage Nighttime Light Data, Remote Sens., 9, 626, https://doi.org/10.3390/rs9060626, 2017.
Zhuo, L., Zheng, J., Zhang, X., Li, J., and Liu, L.: An improved method of night-time light saturation reduction based on EVI, Int. J. Remote Sens., 36, 4114–4130, https://doi.org/10.1080/01431161.2015.1073861, 2015.