the Creative Commons Attribution 4.0 License.
the Creative Commons Attribution 4.0 License.
 | 02 Mar 2021
Daily Terra–Aqua MODIS cloud-free snow and Randolph Glacier Inventory 6.0 combined product (M*D10A1GL06) for high-mountain Asia between 2002 and 2019
Sher Muhammad
Amrit Thapa
Snow is a dominant water resource in high-mountain Asia (HMA) and crucial for mountain communities and downstream populations. Snow cover monitoring is significant to understand regional climate change, managing meltwater, and associated hazards/disasters. The uncertainties in passive optical remote-sensing snow products, mainly underestimation caused by cloud cover and overestimation associated with sensors' limitations, hamper the understanding of snow dynamics. We reduced the biases in Moderate Resolution Imaging Spectroradiometer (MODIS) Terra and Aqua daily snow data and generated a combined daily snow product for high-mountain Asia between 2002 and 2019. An improved MODIS 8 d composite MOYDGL06* product was used as a training data for reducing the underestimation and overestimation of snow in daily products. The daily MODIS Terra and Aqua images were improved by implementing cloud removal algorithms followed by gap filling and reduction in overestimated snow beyond the respective 8 d composite snow extent of the MOYDGL06* product. The daily Terra and Aqua snow products were combined and merged with the Randolph Glacier Inventory version 6.0 (RGI 6.0) described as M*D10A1GL06 to make a more complete cryosphere product with 500 m spatial resolution. The pixel values in the daily combined product are preserved and reversible to the individual Terra and Aqua improved products. We suggest a weight of 0.5 and 1 to snow pixels in either or both Terra and Aqua products, respectively, for deriving snow cover statistics from our final snow product. The values 200, 242, and 252 indicate snow pixels in both Terra and Aqua and have a weight of 1, whereas pixels with snow in one of the Terra or Aqua products have a weight of 0.5. On average, the M*D10A1GL06 product reduces 39.1 % of uncertainty compared to the MOYDGL06* product. The uncertainties due to cloud cover (underestimation) and sensor limitations, mainly larger solar zenith angle (SZA) (overestimation) reduced in this product, are approximately 32.9 % and 6.2 %, respectively. The data in this paper are mainly useful for observation and simulation of climate, hydro-glaciological forcings, calibration, validation, and other water-related studies. The data are available at https://doi.org/10.1594/PANGAEA.918198 (Muhammad, 2020) and the algorithm source code at https://doi.org/10.5281/zenodo.3862058 (Thapa, 2020).
- Article
(11238 KB) - Full-text XML
- BibTeX
- EndNote


Seasonal snow supplies a dominant runoff contribution to the major rivers in high-mountain Asia (HMA) sufficient for more than one-fifth of the global population (Armstrong et al., 2019). Snowmelt mostly dominates the spring runoff in HMA and plays a vital role in the water supplies for various sectors (Han et al., 2019). Glaciers contribute most of the meltwater in the peak summer season and are significantly losing mass due to climate change in the early 21st century (IPCC, 2019; Muhammad et al., 2019a). Also, climate change alters the snowmelt seasonality, onset timing, and water availability in the peak summer season (Hall et al., 2012; Ryberg et al., 2016). It is important to understand such changes for efficient water management and preparation for extreme events (Tian et al., 2017; Kääb et al., 2018) like floods and droughts (Haq et al., 2012; Memon et al., 2015; Miyan, 2015), particularly in the densely populated downstream areas (Scott et al., 2019). The vast spatial extent and topographic complexity of snow-covered mountains make field-based monitoring difficult (Immerzeel et al., 2009; Muhammad and Tian, 2016; Muhammad et al., 2019b); therefore, remote sensing is the most appropriate tool for cryosphere observations (Muhammad and Tian, 2020).
Remote-sensing snow products are important in hydrological and other snow-related research (Hall et al., 2002; Li et al., 2019). The temporal coverage of remote-sensing snow data is sufficient for climate change studies (e.g., NOAA Advanced Very High Resolution Radiometer (AVHRR) snow data have been available since the 1980s) (Hori et al., 2017). However, the spatial resolution before this century was relatively coarse (Hüsler et al., 2012), which has been improved since the early 21st century by the most popular and up-to-date snow product from the Moderate Resolution Imaging Spectroradiometer (MODIS) on board Terra and Aqua (Hall et al., 2007). The advantage of these datasets is the daily temporal resolution, and the disadvantage is the low spatial resolution and a large swath of approximately 2300 km. These limitations cause a snow overestimation at the image edges and in the images acquired in the off-nadir view (Riggs et al., 2016). Another major constraint in these passive optical remote-sensing products is the cloud cover causing the spatial and temporal time-series discontinuity. The cloud contamination in the original 8 d composite MODIS snow cover products is comparatively less than the daily products (Hall et al., 2002) but remains significant; e.g., in the Karakoram the Terra and Aqua 8 d images are 9 % and 15 % cloud-covered on average, respectively (Thapa and Muhammad, 2020). To reduce the remaining clouds up to 99.98 % in the original 8 d composite products M*D10A2, a new Terra and Aqua composite product, namely MOYDGL06*, was developed for HMA using a multi-step approach (Muhammad and Thapa, 2020). This product, MOYDGL06*, is a significant contribution to snow-related studies. However, the 8 d composite is the maximum snow for 8 consecutive days, which does not detect the exact timing of snow onset and melt (Hall et al., 2005). Similar limitations are likely using the 8 d composite products for the snowmelt runoff modeling, which requires daily snow information.
This study considers the temporal limitations in the 8 d composite data and improves the daily MODIS snow products. Various methods, including spatial and temporal filters, are used for cloud removal in MODIS data (Li et al., 2019), but less attention has been given to the removal of the overestimation attributed to the large solar zenith angle (SZA) and a wide swath of each tile. In this study, a daily cloud-free product combining MODIS Terra (MOD10A1) and Aqua (MYD10A1) is generated using the 8 d composite MOYDGL06* product as a reference, which is not only useful for cloud removal but also reduces overestimation. Larger SZA mainly causes an overestimation which was further reduced in the daily product by combining Terra and Aqua following the MOYDGL06* product methodology with a slightly different approach. We also fill the missing data gaps, remove overestimation in the daily snow data using the respective 8 d composite snow images, and merge the improved Terra and Aqua snow assigning values reversible to the individual Terra and Aqua improved products. The improved Terra and Aqua cloud-free snow composite product merged with Randolph Glacier Inventory version 6 (RGI 6.0), namely M*D10A1GL06, is developed to make a more complete daily cryosphere product covering the period between 2002 and 2019. This product will significantly improve the hydro-glaciological applications and snow-related observations in high-mountain Asia (HMA).
The MODIS Terra and Aqua combined daily snow product in this paper cover HMA as in Muhammad and Thapa (2020) with the geographic extent of latitude 24.32–49.19∘ N and longitude 58.22–122.48∘ E. The 10 major river basins of the Hindu Kush, Karakoram, and Himalaya (HKH) region and Tibetan Plateau are covered in this study. Snow data in this study have a daily temporal resolution and 500 m spatial resolution. The product is derived from MODIS Terra (MOD10A1) and Aqua (MYD10A1), and glacier (GL), version 6 (06), named M*D10A1GL06. The data in this product for the period between 2002 and 2019 are available in GeoTIFF format.
The input data for this study include Collection 6 (C6) of the daily MODIS Terra (MOD10A1) and Aqua (MYD10A1) products for the period between 2002 and 2019. The snow data were downloaded from https://earthdata.nasa.gov/ (last access: 24 January 2020) of NASA's Earth Science Data Systems (ESDS) program. The algorithm in C6 has significantly reduced the errors of omission and commission in snow pixel detection mainly due to low illumination conditions and high solar zenith angle (SZA) as compared to Collection 5 (C5) (Riggs et al., 2016). The data are described as 0–100 (Normalized Difference Snow Index (NDSI) snow cover), 200 (missing data), 201 (no decision), 211 (night), 237 (inland water), 239 (ocean), 250 (cloud), 254 (detector saturated), and 255 (fill) (Riggs et al., 2016; Riggs and Hall, 2016a, b). The data for snow pixels are the NDSI values of 0–1 scaled to the range of 0–100 derived from the daily surface reflectance product (MOD09GA). We have converted the NDSI values to binary snow using the range applied in version 5 (40–100) of M*D10A1 products. The values in the M*D10A1 products were reclassified into three classes: (1) the values 40–100 are snow class and reclassified to 200, (2) value 250 is cloud and reclassified to 50, and (3) the rest of the values are classified as no snow (25), to make them comparable with the improved 8 d composite MOYDGL06* product (Muhammad and Thapa, 2020).
The cloudy pixels in daily Terra and Aqua snow products were replaced by snow, no snow, or remain cloud-covered using the corresponding 8 d composite improved snow (MOYDGL06*) product (2002–2018) with reduced uncertainty of underestimation and overestimation (Muhammad and Thapa, 2019; 2020) for the period between 2002 and 2019. We processed the 8 d composite images for the year 2019 following the methodology of MOYDGL06* to extend the improved daily snow product to 2019. The Terra and Aqua daily products were separately processed and improved by removing clouds and overestimation. In the initial processing, the overestimation is reduced to the extent of 8 d composite images by discarding snow in daily MODIS images falling beyond the maximum extent of snow in the corresponding 8 d composites (MOYDGL06*) as shown in Eq. (1). We call the snow beyond the 8 d composite snow extent an overestimation because the 8 d composite images are the maximum extent of snow in the eight consecutive images.
The value 50 in the superscript represents clouds, and M*D10A1 represents MOD10A1 and MYD10A1. The MOD10A1 and MYD10A1 were separately processed and shown here in the same equation.
Also, the daily MODIS product contains gaps with missing data between two successive strips with an increased gap near the Equator. The missing data pixels caused by such gaps in the daily Terra and Aqua products were filled using the corresponding snow or no snow pixels of the MOYDGL06* product using Eq. (2).
The superscript NoData represents a gap in either daily MODIS Terra or Aqua data.
The improved MODIS Terra and Aqua daily snow products were combined and merged with RGI 6.0 to make an improved and combined snow and glacier product. The methodology of merging daily products is different from that of MOYDGL06* as the nature of the daily and 8 d product is different to some extent. We did not replace snow pixels with no snow if a pixel is snow in either the Terra or Aqua product and suggest assigning a weight of 0.5 while using this product for snow cover analysis. The snow data in this product are also preserved to make the separated Terra or Aqua products retrievable from this product. The Terra and Aqua snow data were combined using the following Eqs. (3)–(7).
The combination of daily improved snow from Terra and Aqua with RGI was also carried out in the same way, except in the case of cloud in the snow data, the glacier ice is described a either debris-covered or debris-free and derived from the RGI 6.0 inventory. The glaciers (debris-covered and debris-free) are described as 240 and 250 if they are exposed; otherwise they are given different values depending on whether the glacier is covered with MODIS Terra, Aqua, or both of the snow products. The description of improved daily snow combined with the RGI product is described by the following values.
25: No snow classes
50: Cloud
198: Snow only in Terra
199: Snow only in Aqua
200: Snow in both Terra and Aqua
238: Debris-covered ice with Terra snow
239: Debris-covered ice with Aqua snow
240: Exposed debris-covered ice
242: Debris-covered ice with snow in both Terra and Aqua
248: Debris-free ice with Terra snow
249: Debris-free ice with Aqua snow
250: Exposed debris-free ice
252: Debris-free ice with snow in both Terra and Aqua
There are 36 missing images in the original snow products, with 35 in Terra snow and 1 in the Aqua snow, equivalent to 0.29 % of the total snow data, which is insignificant for the time series. The missing data in the Terra snow with ordinal dates are 2003032, 2003199, 2003351–2003358, 2004050, 2004248, 2004277, 2005265, 2006172, 2006235, 2008355–2008358, 2009252, 2010065, 2010177, 2014299, 2016050–2016059, and 2017114. The missing data were replaced with adjacent images to complete the time series. A single missing image was replaced by the preceding image, while multiple missing images were replaced by preceding and succeeding images adjacent to the absent images. The Aqua missing snow image of 2003167 was replaced by 2003166 to complete the time series.
The product in this paper was named by merging the names of original products, e.g., combining the Terra product (MOD10A1_Maximum_Snow_Extent_2002289) and Aqua product (MYD10A1_Maximum_Snow_Extent_2002289) merged with RGI06 (GL06) and named MOYD10A1GL06_Maximum_Snow_Extent_2002289 in the daily improved snow product (M*D10A1GL06).
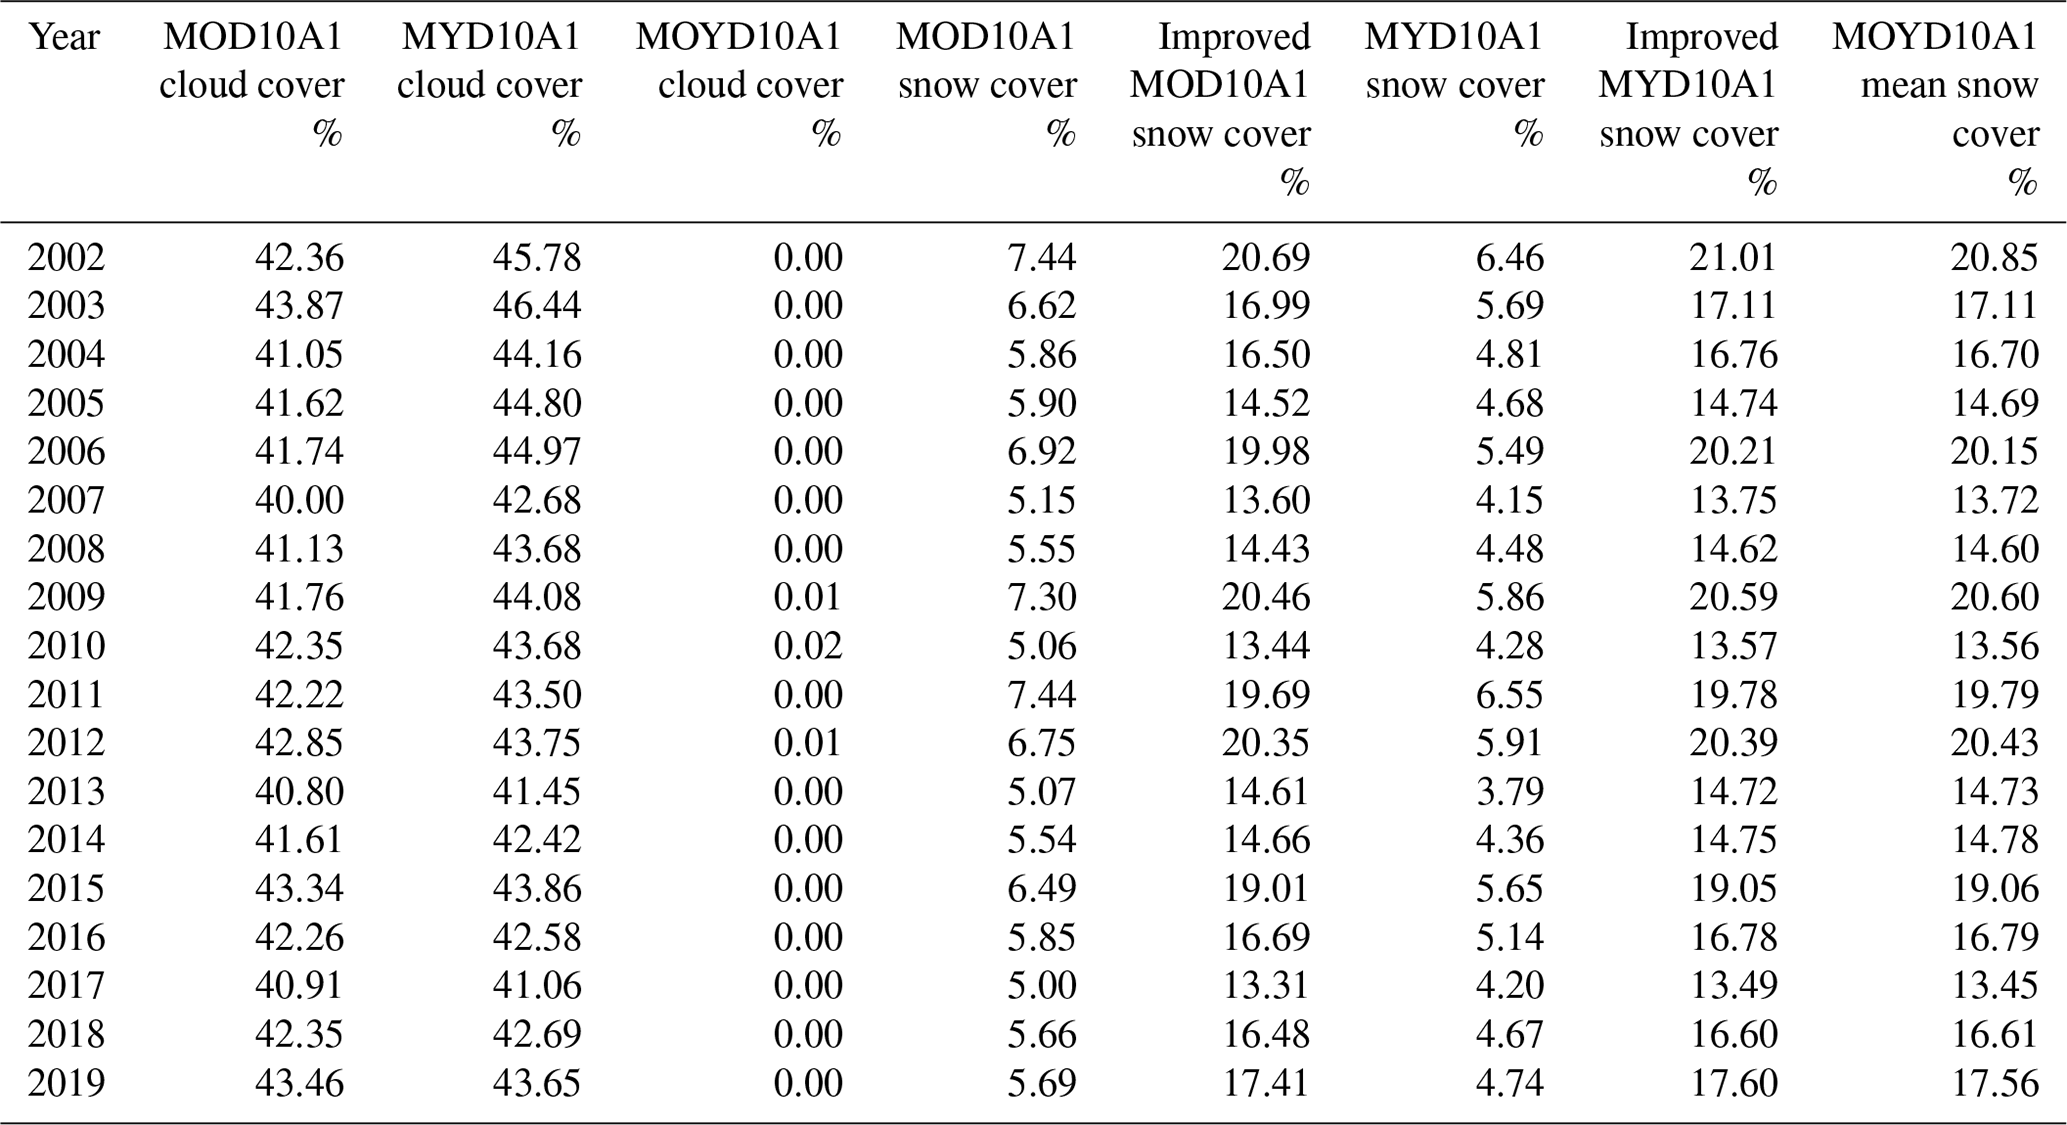
This study improved and combined daily MODIS Terra and Aqua snow data merged with RGI 6.0 separately into debris-covered and debris-free parts of the glacier (M*D10A1GL06) for the period of 18 years between 2002 and 2019. Our methodology used the improved 8 d MOYDGL06* product as training data for improving the daily product. The 8 d data for 2019 was also improved following the algorithm described in Muhammad and Thapa (2020) as the 8 d composite product is available until 2018. It is important to mention that the snow data in the 8 d composite product are valued as 200 (snow) and 210 (no snow). These values were reclassified as 200 (note to the users of the R code associated with this paper) to improve the daily snow data. The major issues of underestimation in MODIS data, which we also highlighted in the previous paper (Muhammad and Thapa, 2020) because of clouds and overestimation caused by large sensor zenith angle (SZA), were reduced in this paper. The effect of SZA was reduced by merging the daily Terra and Aqua products with snow if the pixel is snow in both products while giving a weight of 0.5 if the pixel is snow in one of the Terra or Aqua products. This criterion reduces 6.2 % of the overestimation in the daily composite snow product. The cloud in daily Terra MODIS (MOD10A1) and Aqua MODIS (MYD10A1) and respective improved products are shown in Fig. 1. The original daily Terra and Aqua images between 2002 and 2019 were cloud-covered by 41.96 % and 43.42 %, respectively. We almost completely removed cloud cover in this paper with the remaining clouds of 0.001 % as shown by a straight red line in Fig. 1. On average, the cloud cover in the original Terra is slightly less than Aqua data; however, the spatial distribution of clouds varies significantly with time. The cloud cover is significantly higher in the daily original snow product (42.7 % on average) as compared to the 8 d composite product with 3.66 % cloud cover. These cloud cover statistics indicate that more than 91 % of the clouds were reduced in the 8 d composite M*D10A2 products available at the National Snow and Ice Data Center (Riggs et al., 2016) in HMA on average. This made our final Terra and Aqua combined daily snow product 99.99 % cloud-free on average. The cloud cover of the original and improved Terra and that of the original and improved Aqua are shown in Fig. 2a and b. The annual average snow cover in the original Terra snow product was 6.07 % and increased to 16.82 % in the improved Terra snow product. Similarly, the original Aqua snow product was 5.05 % and increased to 16.97 % in the improved Aqua snow product. The original Terra and Aqua average snow was 5.56 % and increased to 16.95 % in the improved Terra and Aqua combined snow. An example of the original Terra and Aqua images containing clouds and missing data, causing snow underestimation and the improved Terra and Aqua combined snow products, is shown in Fig. 3. The average annual clouds and snow statistics for the original Terra MOD10A1, Aqua MYD10A1, improved Terra MOD10A1, improved Aqua MOD10A1, and the combined Terra and Aqua MOYD10A1 product are shown in Table 1.
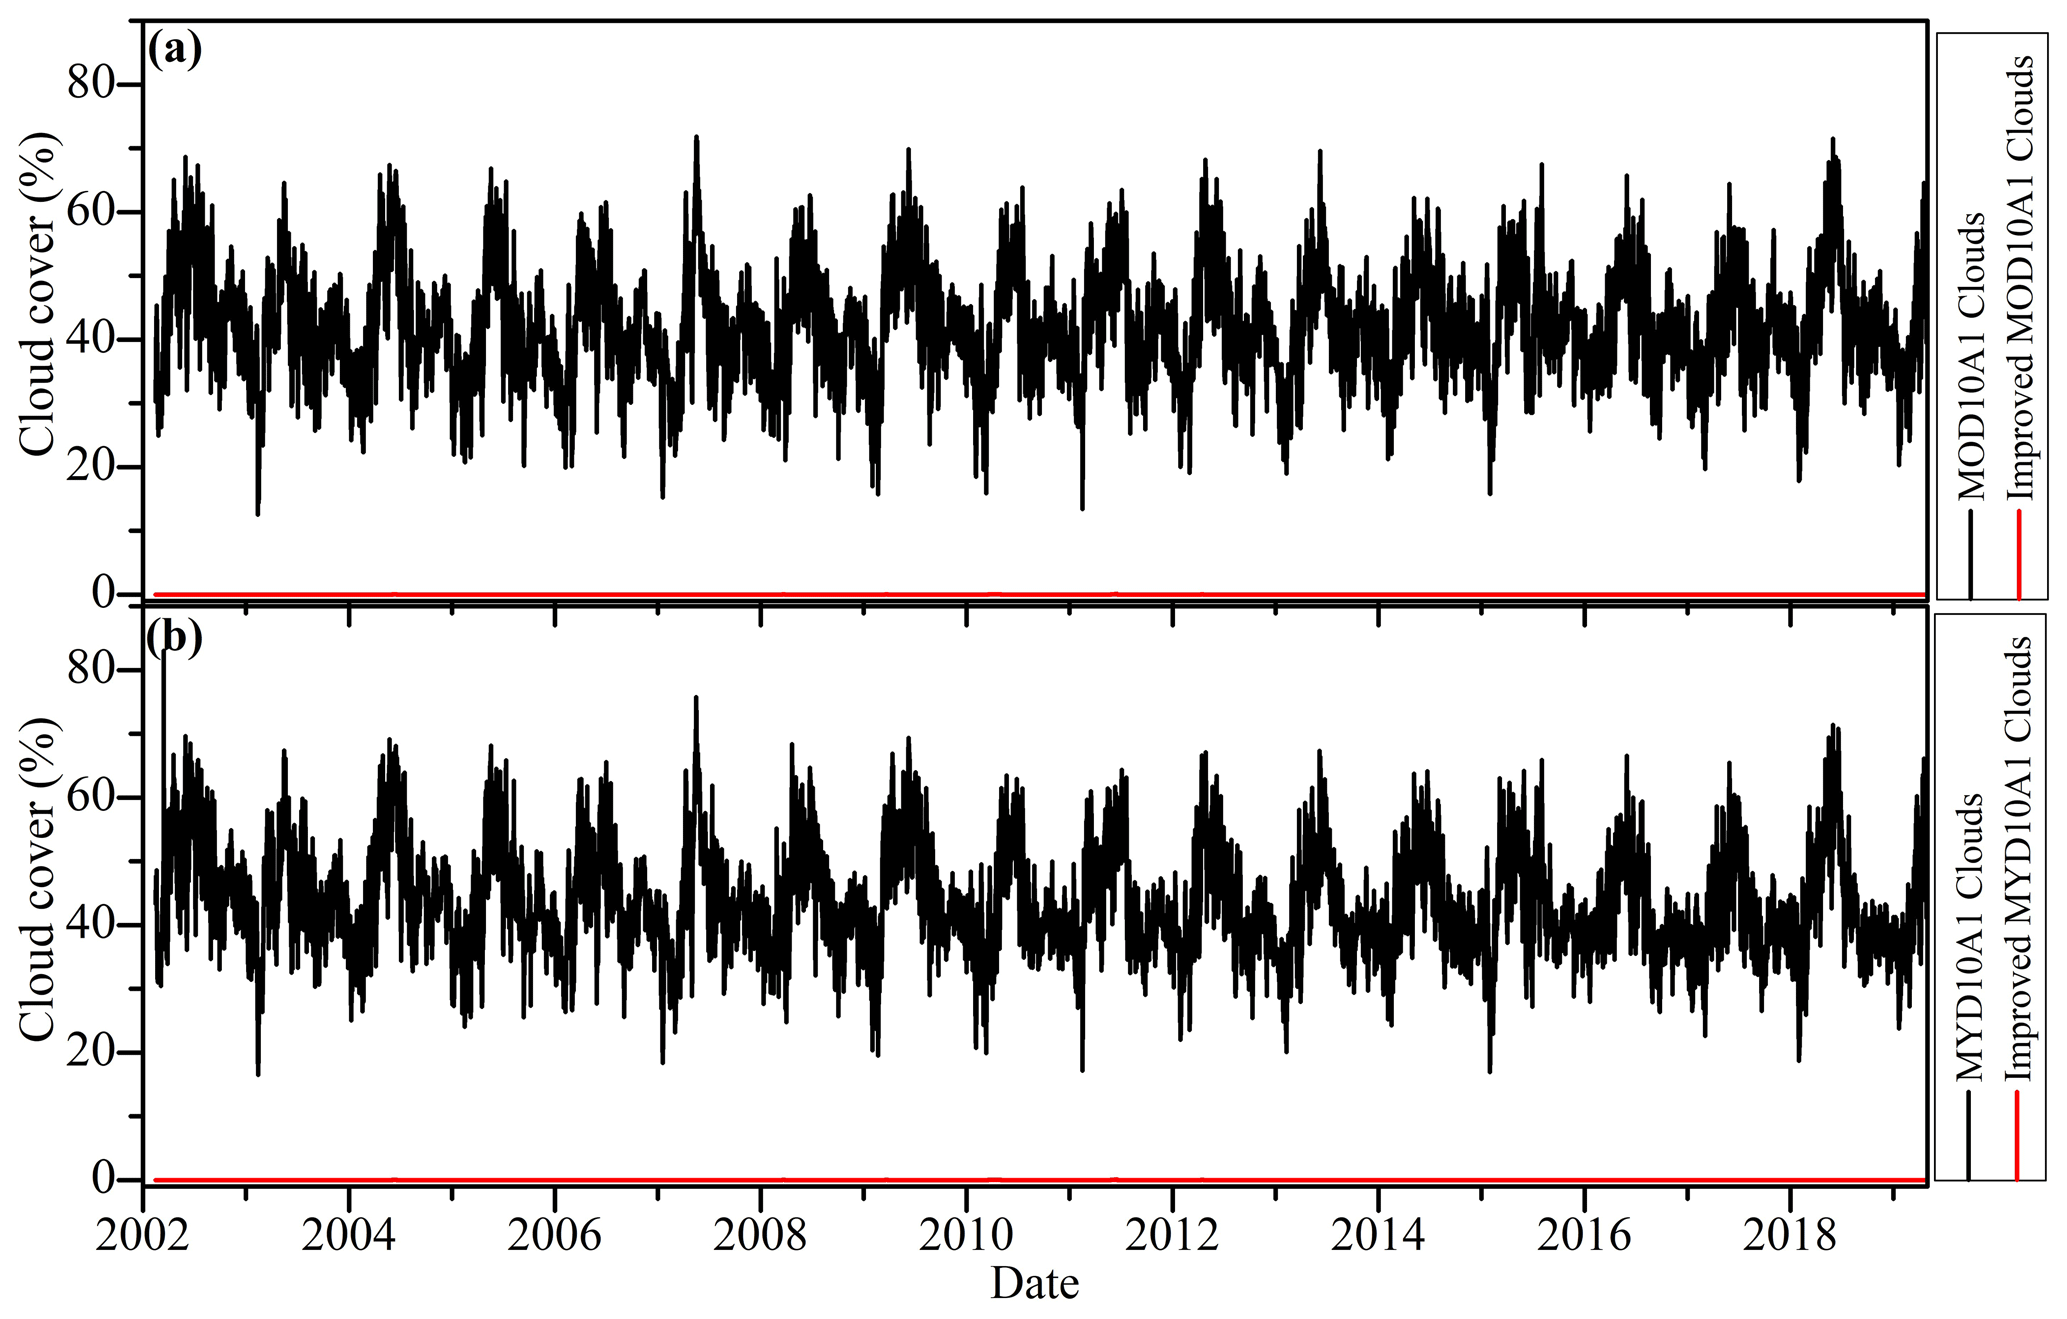
Figure 1Cloud cover in MOD10A1, MYD10A1, and their improved snow products between 2002 and 2019. Cloud cover in the original MOD10A1 and MYD10A1 products is shown in black color and the improved MOD10A1 and MYD10A1 products in red color. Panel (a) shows cloud cover in the original MOD10A1 and improved MOD10A1 products, and panel (b) shows the original MYD10A1 and improved MYD10A1 products.

Figure 2Snow cover in MOD10A1, MYD10A1, and their improved products between 2002 and 2019. Snow cover in the original MOD10A1 and MYD10A1 products is shown in black color and the improved MOD10A1 and MYD10A1 products in red color. Panel (a) shows snow cover in the original MOD10A1 and improved MOD10A1 products, and panel (b) shows the original MYD10A1 and improved MOD10A1 products.
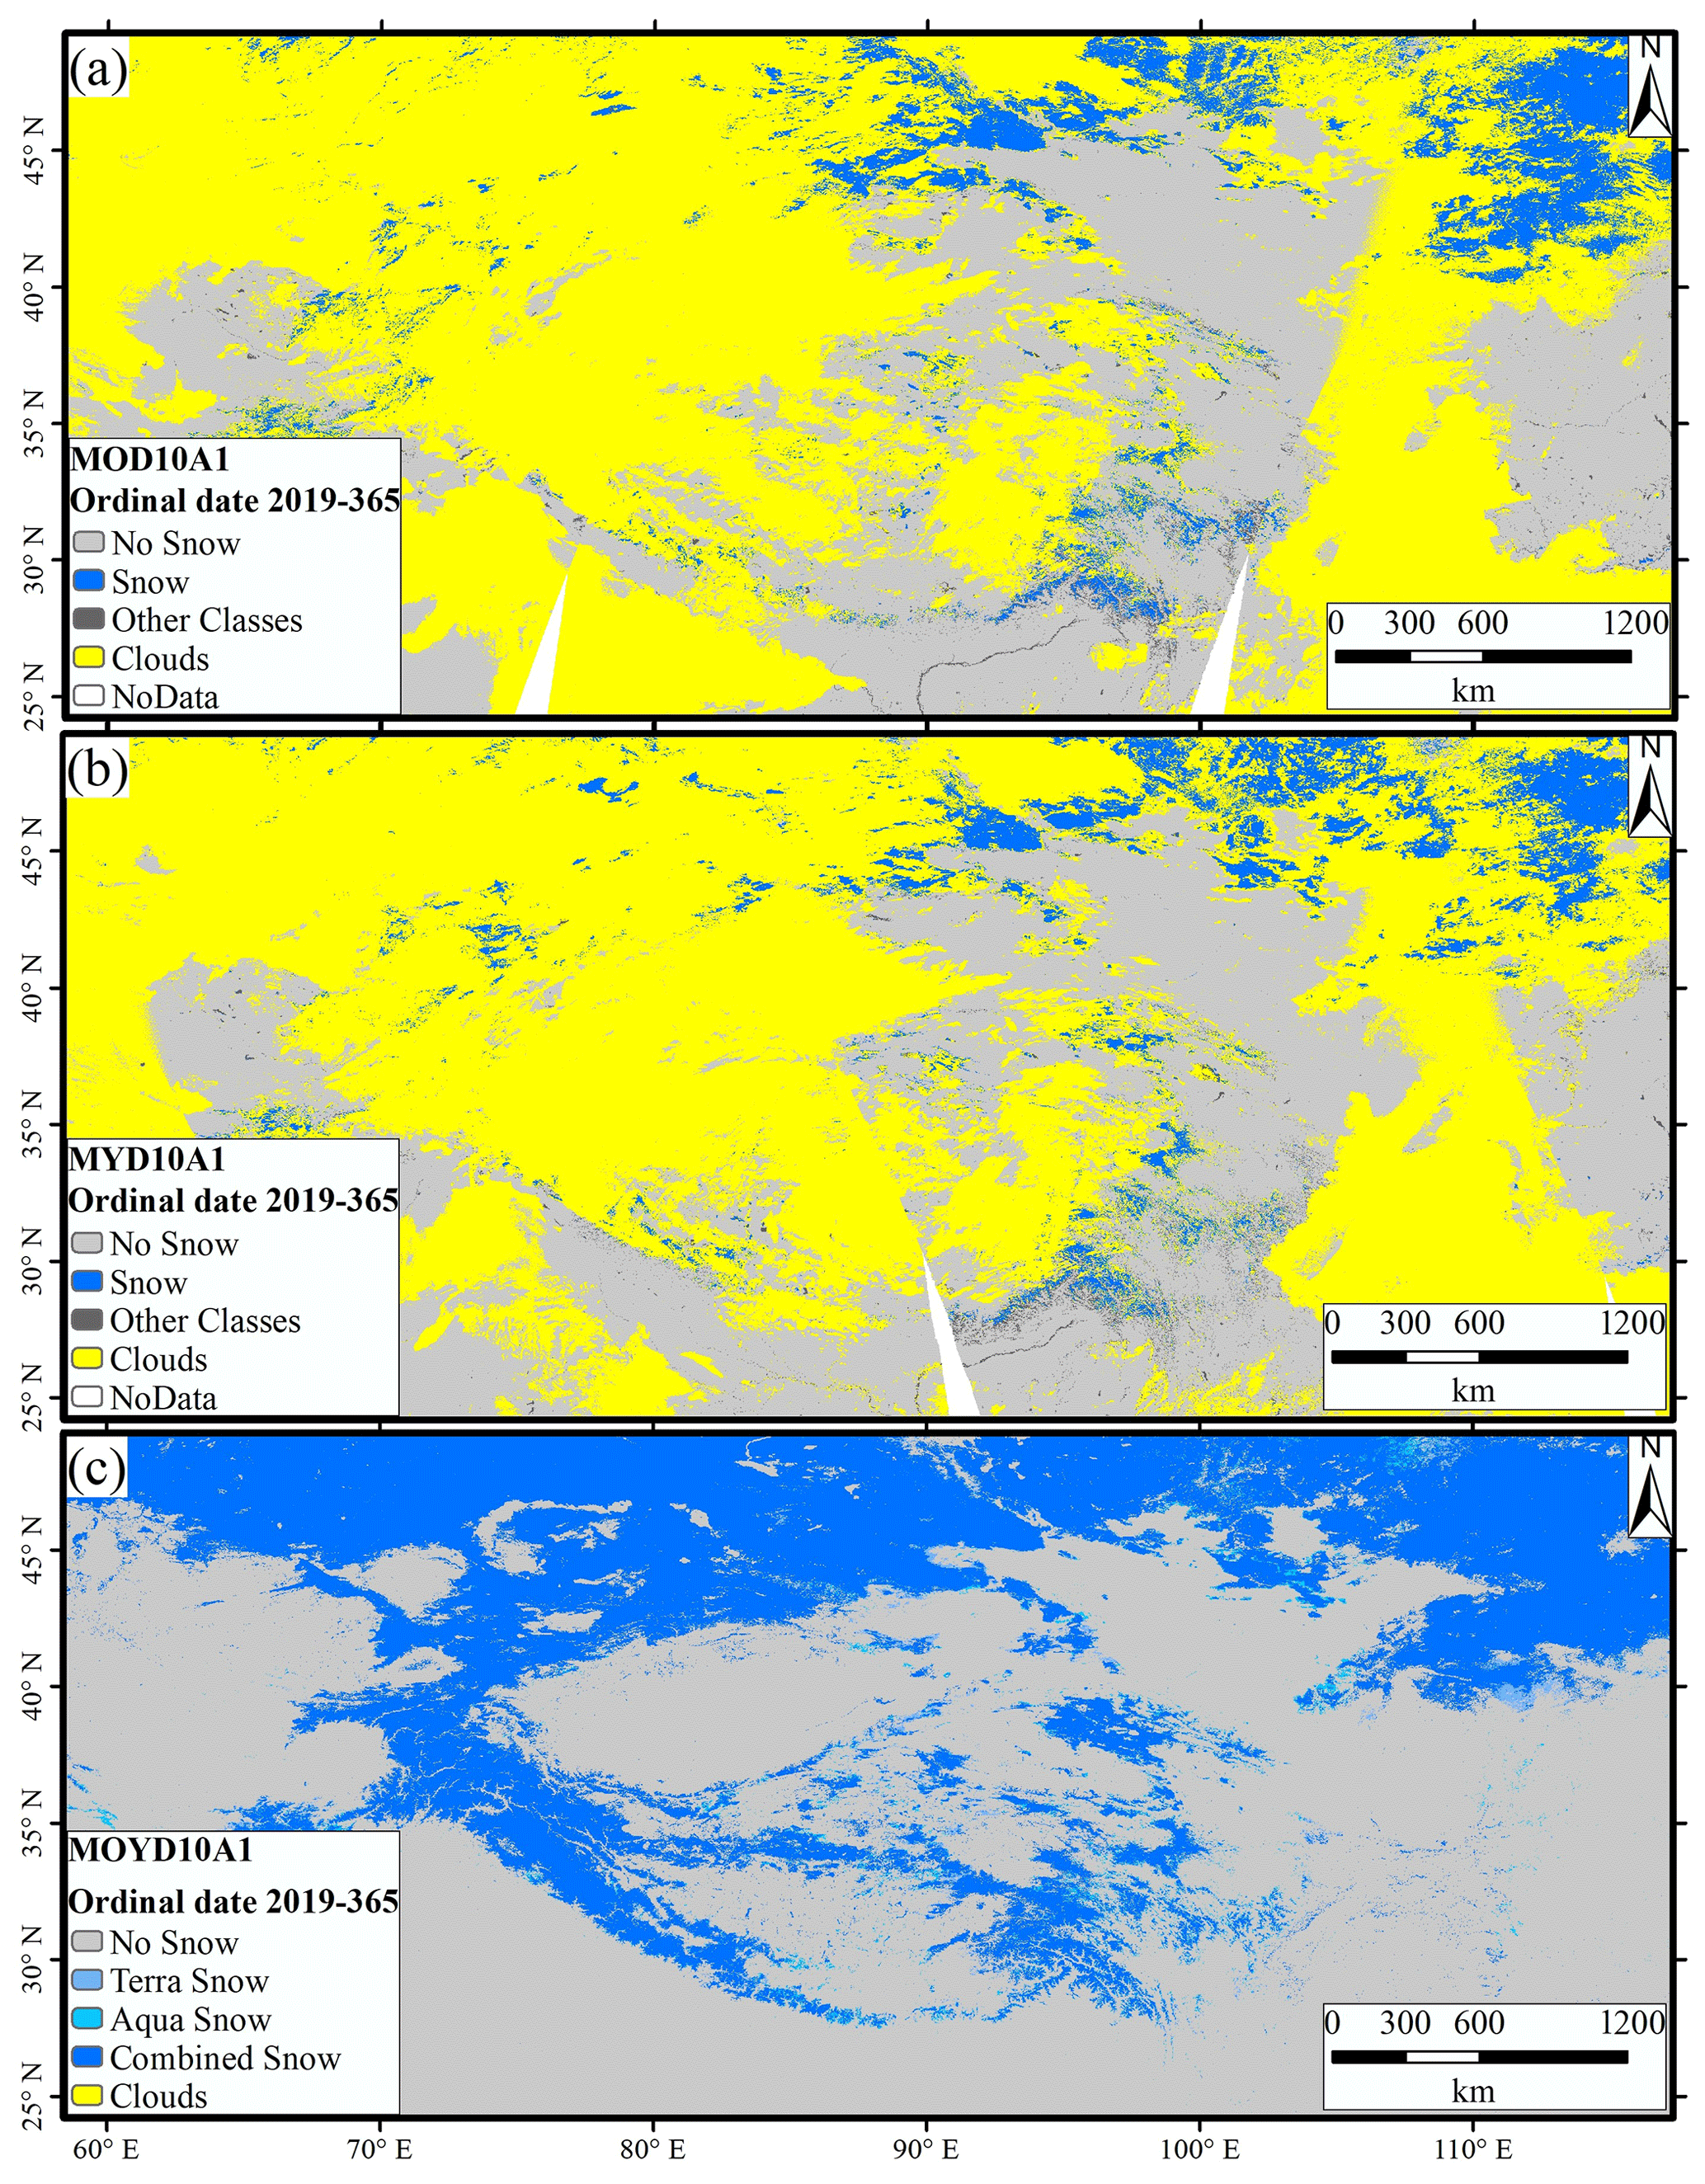
Figure 3Comparison of the MOD10A1 3 (a) and MYD10A1 3 (b) snow data containing cloud cover and gaps and MOYD10A1 3 (c) with cloud removal and filling missing data gaps.
Table 1MOD10A1, MYD10A1, and MOYD10A1 MODIS annual average cloud and snow cover statistics between 2002 and 2019.
Removing unmatched Terra and Aqua data in daily snow may increase the underestimation for areas where SZA is greater (Sayer et al., 2015). It is particularly challenging to detect snow when SZA exceeds 70∘ (Riggs et al., 2016), which constitutes up to 8 % of the data (Horváth et al., 2014). Similarly, for SZA >60∘ the cloud optical thickness increases (Loeb and Davies, 1997), which is overcome by removing clouds using the 8 d composite data containing snow data overlapped by Terra and Aqua. In contrast, assigning a weight of 0.5 to such data may reduce the overestimation to 50 % of the data acquired from off-nadir view. To assess the variability of snow overestimation mainly due to SZA differences, we compared the minimum (snow overlapped by Terra and Aqua), maximum (snow in either Terra or Aqua), and mean snow (weight of 1 to minimum snow and 0.5 to maximum snow). The maximum and minimum snow cover area showed a difference of 12.4 % on average for the whole study area, whereas the mean snow differs by 6.2 % on average in comparison to the minimum and maximum snow. Therefore, we suggest using the mean snow for snow cover analysis using this product. Also, both the minimum and maximum snow may be analyzed for estimating a range of snow cover area. The original Terra and Aqua, minimum, maximum, and mean of the improved snow are shown in Fig. 4, showing the difference explained above for the study period. There are significant variations and underestimation in the original snow mainly due to the persistence of clouds as shown in Fig. 4.
On average, 87.6 % of the individually improved Terra and Aqua snow pixels coincided with the improved Terra and Aqua combined snow products. The remaining 12.4 % of the mismatched snow pixels in the individual Terra and Aqua is suggested to give a weight of 0.50 to be used in combination with the coincided snow for understanding snow cover dynamics, regarded as mean snow. This criterion enables us to discard 50 % of the mismatched snow (6.2 %) in the improved Terra and Aqua composite product. The use of either minimum, maximum, or mean snow data may be used with caution for small-scale studies as the difference and mismatch may vary from region to region. Also, it is important to mention that the mismatch does not include those snow pixels in the individual Terra and Aqua snow products which fall beyond the snow extent of the respective 8 d composite images. The mismatch of snow is mainly caused by the off-nadir view, low spatial resolution, and large swaths of the satellite (Muhammad and Thapa, 2020). The derived product is based on the improved and validated 8 d composite product; therefore, we did not re-validate it. It is important to mention that the MOYDGL06* product shows an overestimation of 32 % on average when compared with the M*D10A1GL06 product developed in this paper as shown in Fig. 5. These results are quite critical for studies related to snow onset and melt timing and related hydrological simulations. The snow products should be carefully selected depending on the nature of application to avoid biases and uncertainty. The daily product generated in this research is mainly recommended for hydro-glaciological, water, and snow-related studies with high-temporal (daily) resolution except for very small scale studies. An example image of the improved snow product with the description of values in the methodology and data availability sections is shown in Fig. 6.
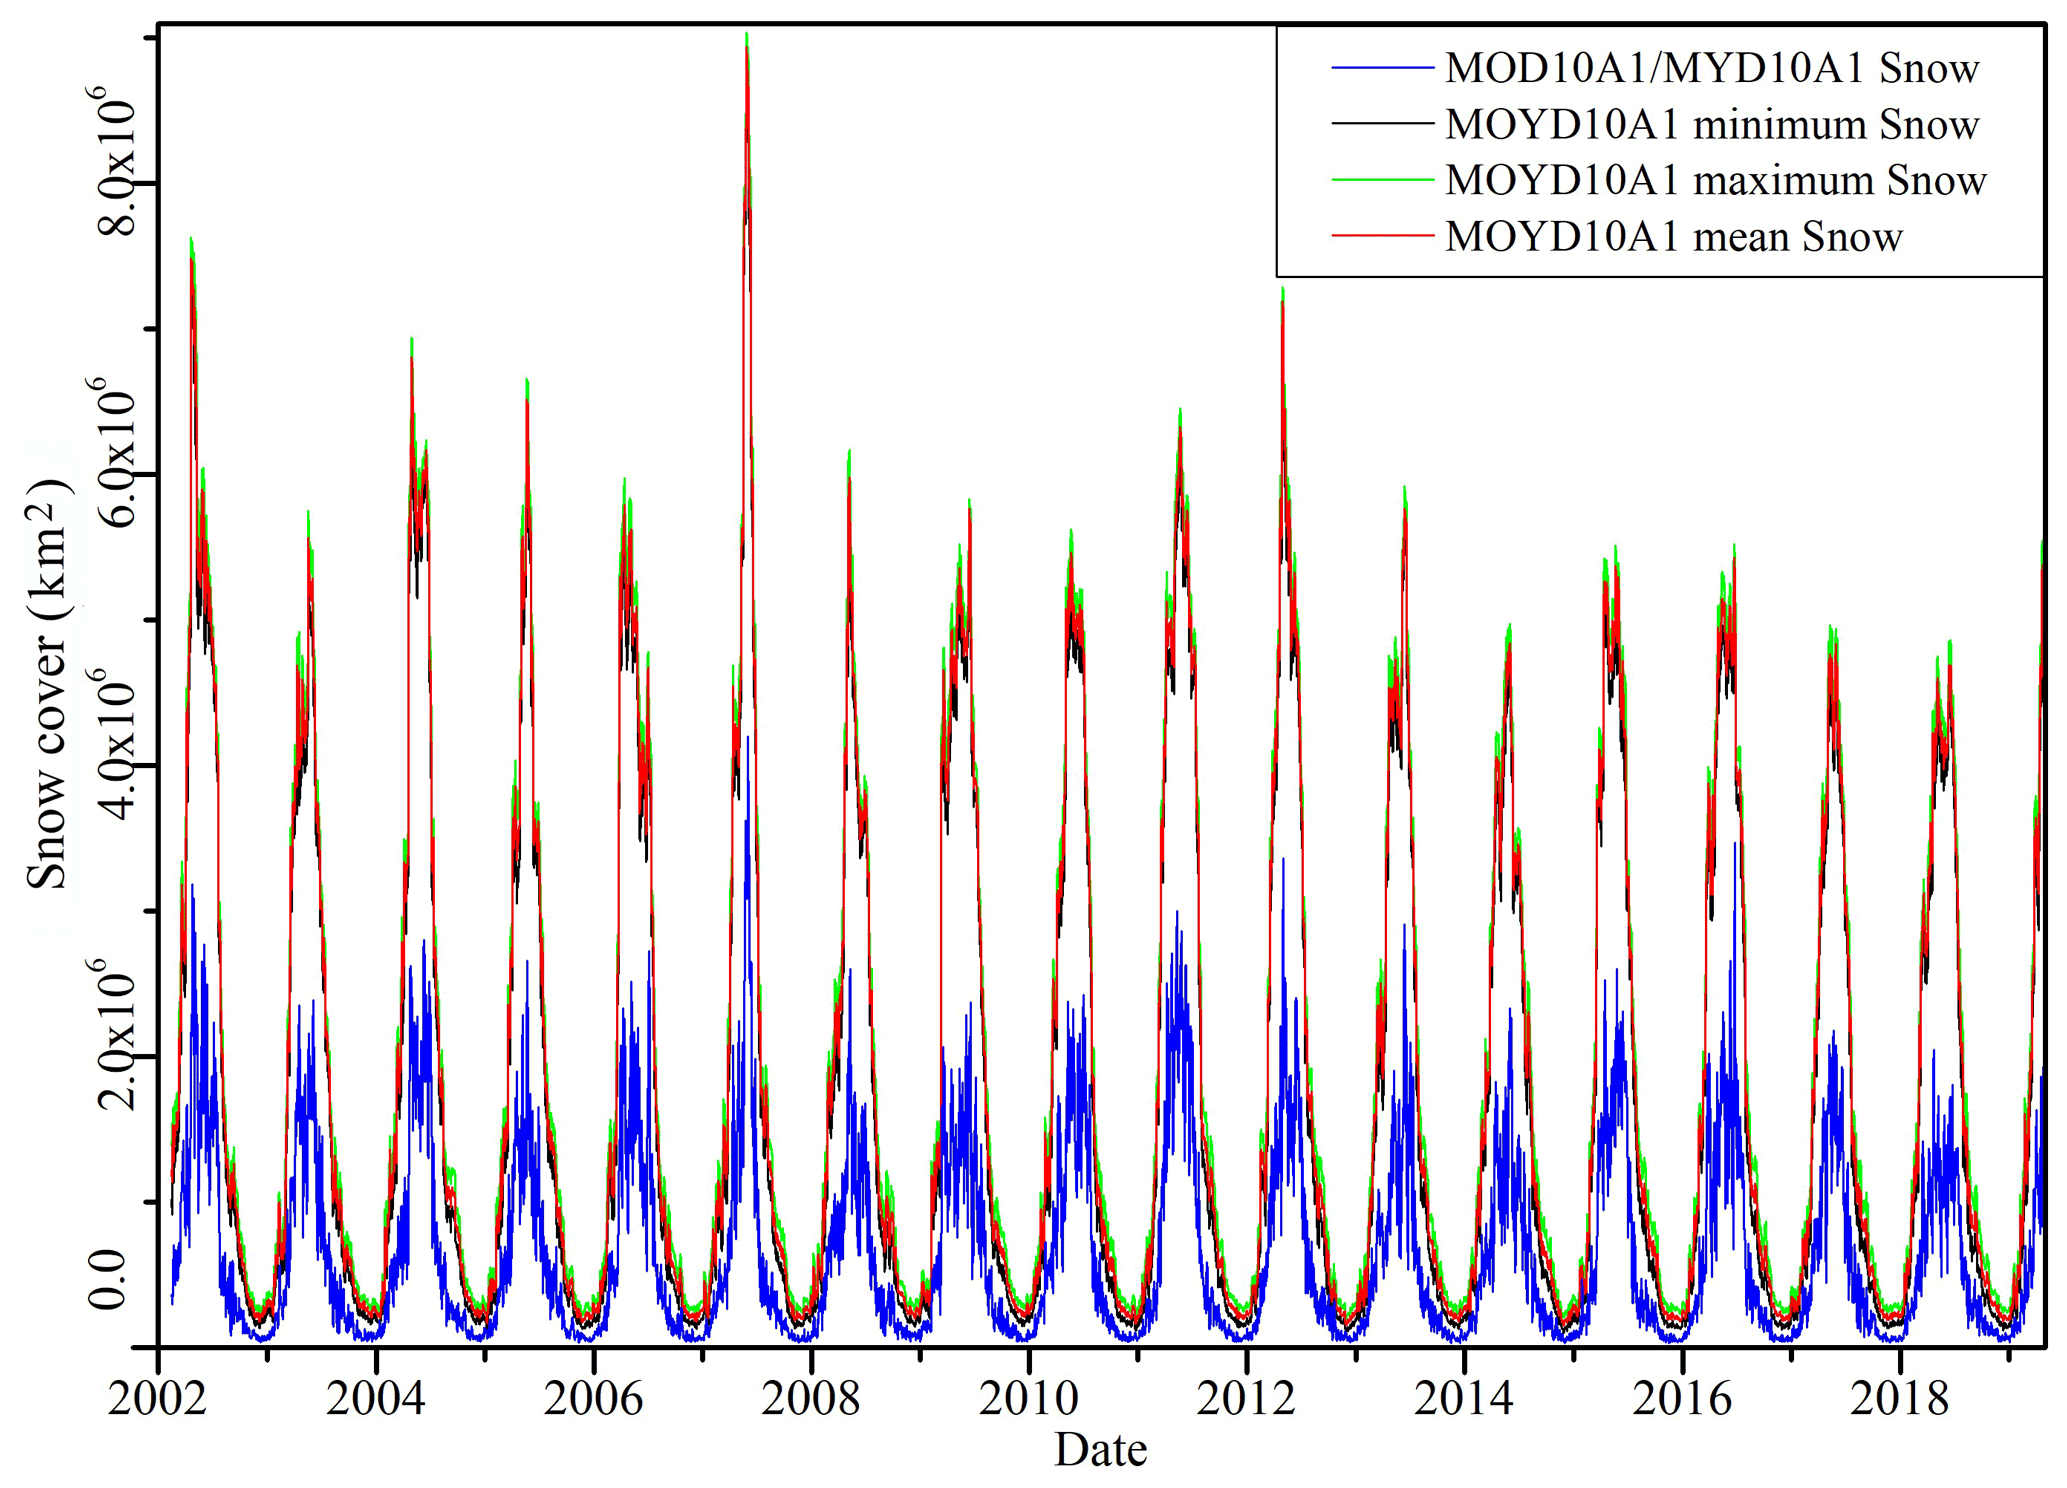
Figure 4Original MOD10A1/MYD10A1 and improved MOD10A1/MYD10A1 snow cover between 2002 and 2019. The original MOD10A1/MYD10A1 is the average snow cover of both satellites before improvement. The minimum snow cover is the snow overlapped by Terra and Aqua in the improved MOYD10A1 product, whereas the maximum snow in the improved MOYD10A1 product is snow in either Terra or Aqua products.
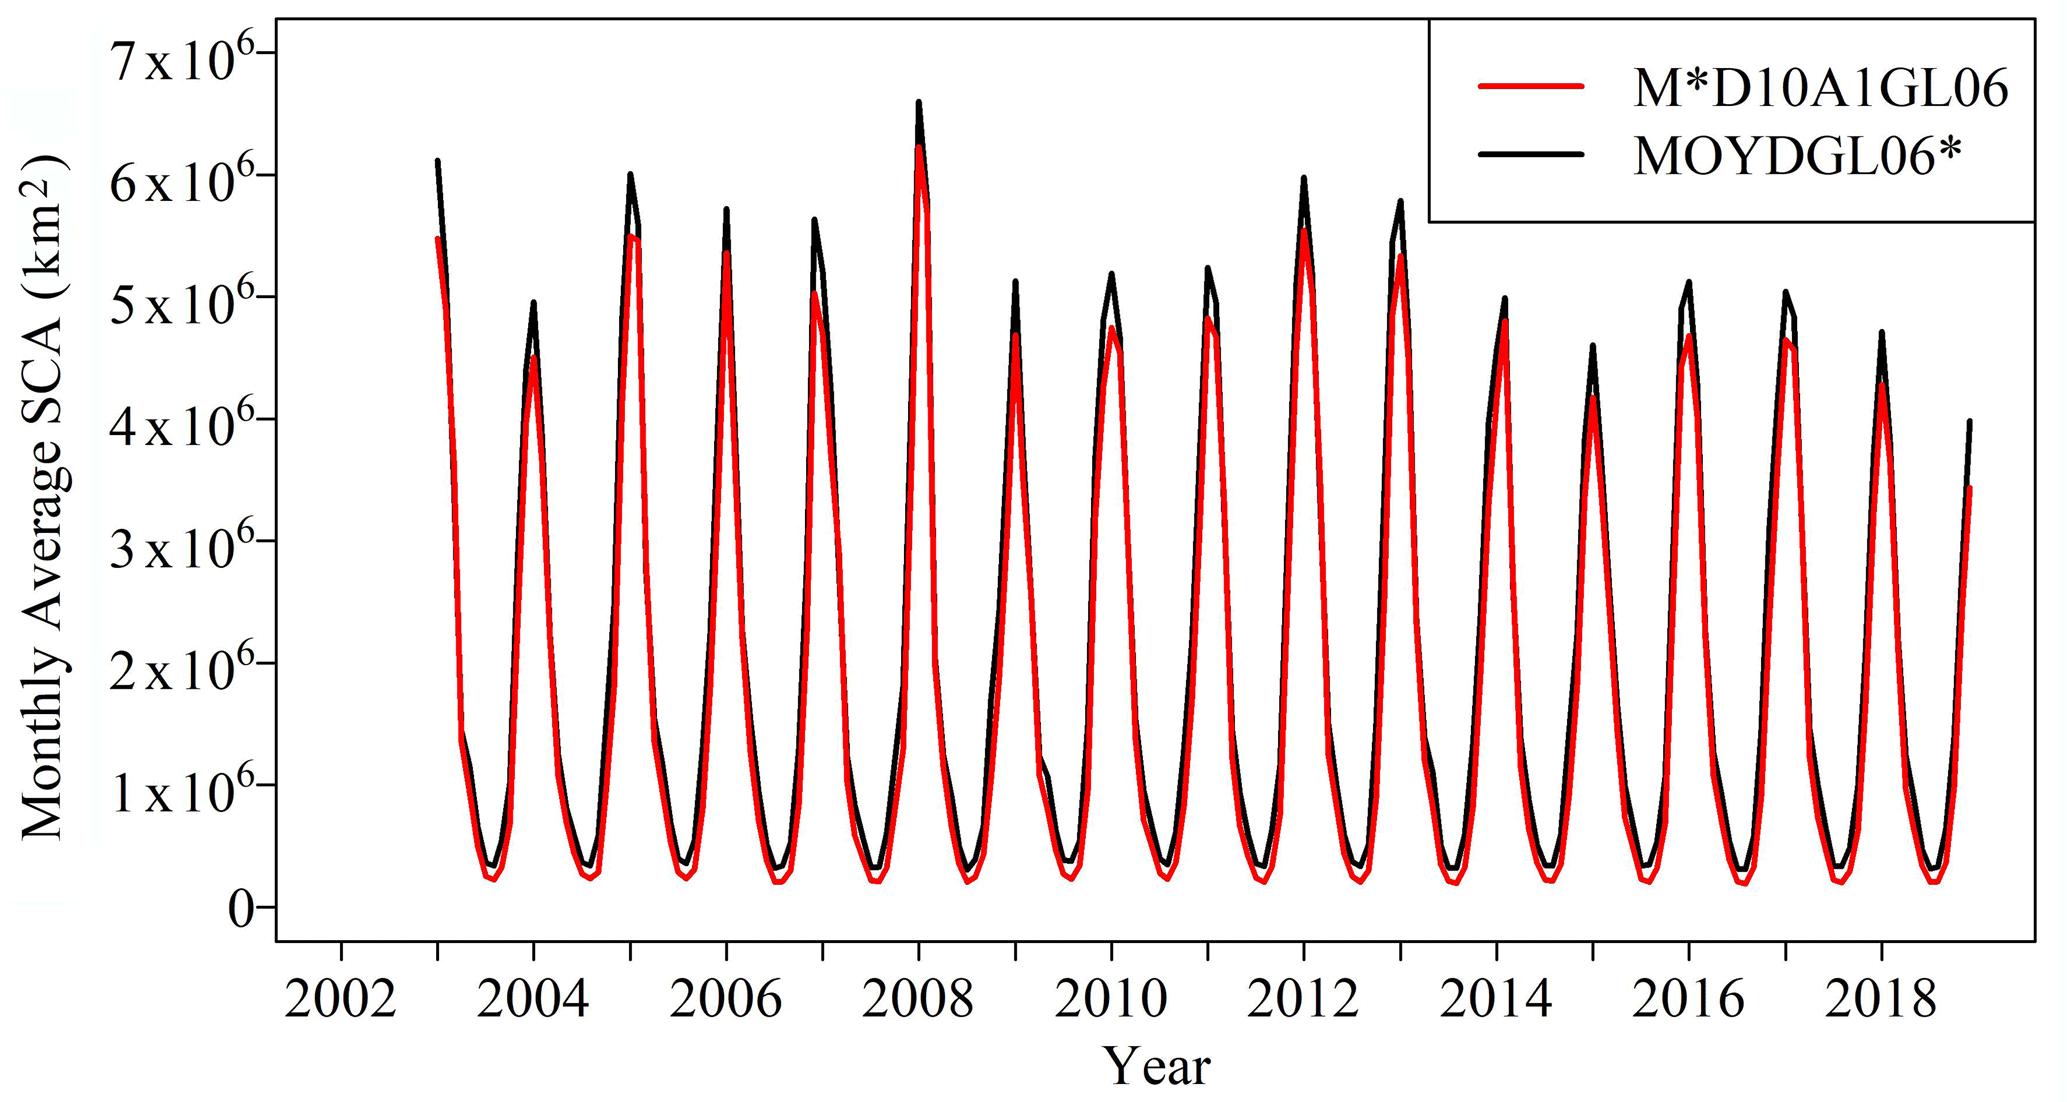
Figure 5Difference between the daily improved M*D10A1GL06 and 8 d composite MOYDGL06* products on a monthly interval. The MOYDGL06* product shows overall positive bias and overestimation of ∼32 % on average compared to M*D10A1GL06.
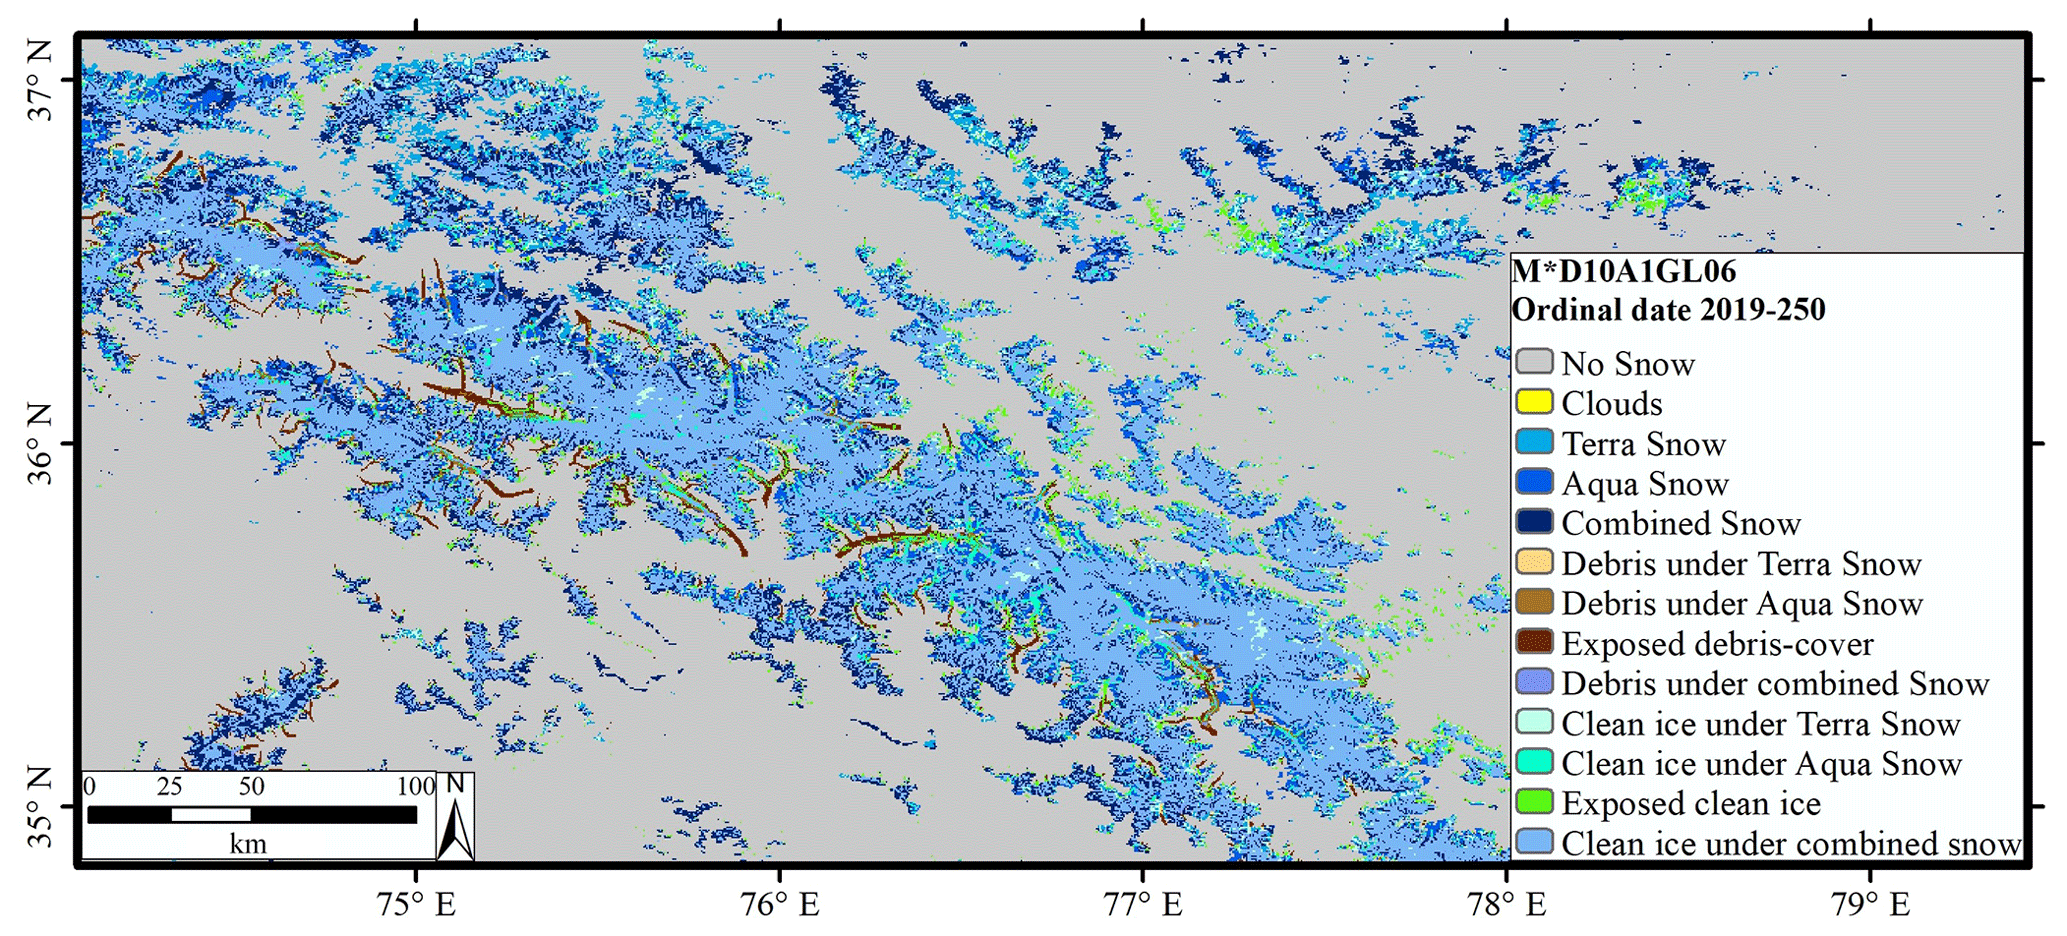
Figure 6An example of the M*D10A1GL06 product with the values of all the classified pixels as described in the methodology.
The daily composite snow product derived in this paper from MODIS Terra (MOD10A1) and Aqua (MYD10A1) version 6 merged with RGI 6.0 is named M*D10A1GL06. The improved snow product is flagged by 13 numbers to represent no snow, snow, and other classes. The values in the combined product are classified as no snow (25), cloud in both Terra and Aqua (50), Terra snow (198), Aqua snow (199), both Terra and Aqua snow (200), debris under Terra snow (238), debris under Aqua snow (239), exposed debris (240), debris cover under Terra and Aqua snow (242), clean ice under Terra snow (248), clean ice under Aqua snow (249), exposed ice (250), and clean ice under Terra and Aqua snow (252). For studies using this product to analyze snow cover, we recommend using a weight of 0.5 for snow pixels if present in either the Terra or Aqua product described by values 198, 199, 238, 239, 248, and 249 and a weight of 1 for the pixels with snow in both the Terra and Aqua products with values 200, 242, and 252. The combined and improved snow product compared to the original Terra and Aqua snow products for the study period is shown in Fig. 4. The combined product will serve as baseline data for hydro-glaciological and other water-related applications. The data are available at https://doi.org/10.1594/PANGAEA.918198 (Muhammad, 2020). The source code of the algorithm for this product is available at https://doi.org/10.5281/zenodo.3862058 (Thapa, 2020). The dataset README file with the data at PANGAEA gives the information about the data and code.
This study results in an improved Terra and Aqua MODIS version 6 combined daily snow products merged with RGI 6.0, named M*D10A1GL06. The product is a 99.99 % cloud-free product covering the temporal window from 2002 to 2019 with 500 m spatial resolution over the high mountains of Asia. The product is cloud-free, reducing an underestimation of 32.9 % and an overestimation of 6.2 %, and missing data are gap filled. The product is described by 13 values to make it separable and reversible to the individual Terra and Aqua products. The value 25 is no snow; 50 is cloud; and 200, 242, and 252 represent snow in both Terra and Aqua. When snow is detected in either the Terra or Aqua dataset, it is denoted as 198, 199, 238, 239, 248, and 249, where the even and odd values represent Terra and Aqua snow, respectively. The exposed debris-covered and debris-free ice are denoted as 240 and 250, which is similar to the MOYDGL06* product. The average cloud persistency is 42.7 % of the original products (both Terra and Aqua) for the study region in the observed period. There is a 12.4 % mismatch between the Terra and Aqua snow in the improved snow product primarily due to a large SZA, wide swath, and low spatial resolution which limit accurate snow detection in the complex topography. To reduce the effect of the mismatch in snow data from 50 % to 6.2 % in the statistical analysis, we suggest a weight of 0.5 to the mismatched snow pixels. The clouds cause 32.9 % underestimation in snow pixels, which together with a 6.2 % mismatch due to a larger SZA causes an uncertainty of 39.1 % on average. The mentioned uncertainty does not include the snow underestimation due to the data gaps and overestimation of snow pixels occurring beyond the 8 d maximum extent of snow in the MOYDGL06* product. The daily snow M*D10A1GL06 product associated with this paper can provide a valuable input dataset for hydro-glaciological and climate modeling, snow cover dynamics, and other water-related studies.
SM designed the study, conceptualized the methodology, and wrote the paper. AT developed the R code and contributed to the manuscript. Both the authors contributed to the data quality control.
The authors declare that they have no conflict of interest.
The views and interpretations in this publication are those of the authors and are not necessarily attributable to the ICIMOD.
This work was supported by the Cryosphere Initiative of the International Centre for Integrated Mountain Development (ICIMOD), funded by Norway and by core funds of the ICIMOD contributed by the governments of Afghanistan, Australia, Austria, Bangladesh, Bhutan, China, India, Myanmar, Nepal, Norway, Pakistan, Sweden, and Switzerland.
This research has been supported by the International Centre for Integrated Mountain Development (ICIMOD, grant no. 3-939-241-0-P).
This paper was edited by Birgit Heim and reviewed by two anonymous referees.
Armstrong, R. L., Rittger, K., Brodzik, M. J., Racoviteanu, A., Barrett, A. P., Khalsa, S. J. S., Raup, B., Hill, A. F., Khan, A. L., Wilson, A. M., Kayastha, R. B., Fetterer, F., and Armstrong, B.: Runoff from glacier ice and seasonal snow in High Asia: separating melt water sources in river flow, Reg. Environ. Chang., 19, 1249–1261, https://doi.org/10.1007/s10113-018-1429-0, 2019.
Hall, D. K. and Riggs, G. A.: Accuracy assessment of the MODIS snow products, Hydrol. Process., 21, 1534–1547, https://doi.org/10.1002/hyp.6715, 2007.
Hall, D. K., Riggs, G. A., Salomonson, V. V., Digirolamo, N. E., and Bayr, K. J.: MODIS snow-cover products, Remote Sens. Environ., 83, 181–194, https://doi.org/10.1016/S0034-4257(02)00095-0, 2002.
Hall, D. K., Kelly, R. E., Foster, J. L., and Chang, A. T.: Estimation of Snow Extent and Snow Properties, in: Encyclopedia of Hydrological Sciences, edited by: Anderson, M. G., Wiley, Berlin, 811–829, https://doi.org/10.1002/0470848944.hsa062, 2005.
Hall, D. K., Foster, J. L., DiGirolamo, N. E., and Riggs, G. A.: Snow cover, snowmelt timing and stream power in the Wind River Range, Wyoming, Geomorphology, 137, 87–93, https://doi.org/10.1016/j.geomorph.2010.11.011, 2012.
Han, P., Long, D., Han, Z., Du, M., Dai, L., and Hao, X.: Improved understanding of snowmelt runoff from the headwaters of China's Yangtze River using remotely sensed snow products and hydrological modeling, Remote Sens. Environ., 224, 44–59, https://doi.org/10.1016/j.rse.2019.01.041, 2019.
Haq, M., Akhtar, M., Muhammad, S., Paras, S., and Rahmatullah, J.: Techniques of Remote Sensing and GIS for flood monitoring and damage assessment: A case study of Sindh province, Pakistan, Egypt, J. Remote Sens. Sp. Sci., 15, 135–141, https://doi.org/10.1016/j.ejrs.2012.07.002, 2012.
Hori, M., Sugiura, K., Kobayashi, K., Aoki, T., Tanikawa, T., Kuchiki, K., Niwano, M., and Enomoto, H.: A 38-year (1978–2015) Northern Hemisphere daily snow cover extent product derived using consistent objective criteria from satellite-borne optical sensors, Remote Sens. Environ., 191, 402–418, https://doi.org/10.1016/j.rse.2017.01.023, 2017.
Horváth, Á., Seethala, C., and Deneke, H.: View angle dependence of MODIS liquid water path retrievals in warm oceanic clouds, J. Geophys. Res., 119, 8304–8328, https://doi.org/10.1002/2013JD021355, 2014.
Hüsler, F., Jonas, T., Wunderle, S., and Albrecht, S.: Validation of a modified snow cover retrieval algorithm from historical 1-km AVHRR data over the European Alps, Remote Sens. Environ., 121, 497–515, https://doi.org/10.1016/j.rse.2012.02.018, 2012.
Immerzeel, W. W., Droogers, P., de Jong, S. M., and Bierkens, M. F. P.: Large-scale monitoring of snow cover and runoff simulation in Himalayan river basins using remote sensing, Remote Sens. Environ. 113, 40–49, https://doi.org/10.1016/j.rse.2008.08.010, 2009.
IPCC: IPCC Special Report on the Ocean and Cryosphere in a Changing Climate, edited by: Pörtner, H.-O., Roberts, D.C., Masson-Delmotte, P., Zhai, M., Tignor, E., Poloczanska, K., Mintenbeck, A., Alegría, M., Nicolai, A., Okem, J., Petzold, B., and Weyer, N.M., 1–765, 2019.
Kääb, A., Leinss, S., Gilbert, A., Bühler, Y., Gascoin, S., Evans, S. G., Bartelt, P., Berthier, E., Brun, F., Chao, W. A., Farinotti, D., Gimbert, F., Guo, W., Huggel, C., Kargel, J. S., Leonard, G. J., Tian, L., Treichler, D., and Yao, T.: Massive collapse of two glaciers in western Tibet in 2016 after surge-like instability, Nat. Geosci., 11, 114–120, https://doi.org/10.1038/s41561-017-0039-7, 2018.
Li, X., Jing, Y., Shen, H., and Zhang, L.: The recent developments in cloud removal approaches of MODIS snow cover product, Hydrol. Earth Syst. Sci., 23, 2401–2416, https://doi.org/10.5194/hess-23-2401-2019, 2019.
Loeb, N. G. and Davies, R.: Angular dependence of observed reflectances: A comparison with plane parallel theory, J. Geophys. Res.-Atmos., 102, 6865–6881, https://doi.org/10.1029/96JD03586, 1997.
Memon, A. A., Muhammad, S., Rahman, S., and Haq, M.: Flood monitoring and damage assessment using water indices: A case study of Pakistan flood-2012, Egypt, J. Remote Sens. Sp. Sci., 18, 99–106, https://doi.org/10.1016/j.ejrs.2015.03.003, 2015.
Miyan, M. A.: Droughts in asian least developed countries: Vulnerability and sustainability, Weather Clim. Extrem., 7, 8–23, https://doi.org/10.1016/j.wace.2014.06.003, 2015.
Muhammad, S.: Improved daily MODIS TERRA/AQUA Snow and Randolph Glacier Inventory (RGI6.0) data for High Mountain Asia (2002–2019), PANGAEA, https://doi.org/10.1594/PANGAEA.918198, 2020.
Muhammad, S. and Thapa, A.: Improved MODIS TERRA/AQUA composite Snow and glacier (RGI6.0) data for High Mountain Asia (2002–2018), PANGAEA, https://doi.org/10.1594/PANGAEA.901821, 2019.
Muhammad, S. and Thapa, A.: An improved Terra–Aqua MODIS snow cover and Randolph Glacier Inventory 6.0 combined product (MOYDGL06*) for high-mountain Asia between 2002 and 2018, Earth Syst. Sci. Data, 12, 345–356, https://doi.org/10.5194/essd-12-345-2020, 2020.
Muhammad, S. and Tian, L.: Changes in the ablation zones of glaciers in the western Himalaya and the Karakoram between 1972 and 2015, Remote Sens. Environ., 187, 505–512, https://doi.org/10.1016/j.rse.2016.10.034, 2016.
Muhammad, S. and Tian, L.: Mass balance and a glacier surge of Guliya ice cap in the western Kunlun Shan between 2005 and 2015, Remote Sens. Environ., 244, 111832, https://doi.org/10.1016/j.rse.2020.111832, 2020.
Muhammad, S., Tian, L., and Khan, A.: Early twenty-first century glacier mass losses in the Indus Basin constrained by density assumptions, J. Hydrol., 574, 467–475, https://doi.org/10.1016/j.jhydrol.2019.04.057, 2019a.
Muhammad, S., Tian, L., and Nüsser, M.: No significant mass loss in the glaciers of Astore Basin (North-Western Himalaya), between 1999 and 2016, J. Glaciol., 65, 270–278, https://doi.org/10.1017/jog.2019.5, 2019b.
Riggs, G. A. and Hall, D. K.: MODIS/Aqua Snow Cover Daily L3 Global 500 m Grid, Version 6, available at: http://nsidc.org/data/MYD10A1/versions/6 (last access: 22 January 2020), 2016a.
Riggs, G. A. and Hall, D. K.: MODIS/Terra Snow Cover Daily L3 Global 500 m Grid, Version 6, available at: http://nsidc.org/data/MYD10A1/versions/6 (last access: 22 January 2020), 2016b.
Riggs, G. A., Hall, D. K., and Salomonson, V.: MODIS Snow Products Collection 6, available at: https://modis-snow-ice.gsfc.nasa.gov/uploads/C6_MODIS_Snow_User_Guide.pdf (last access: 22 January 2020), 2016.
Ryberg, K. R., Akyüz, F. A., Wiche, G. J., and Lin, W.: Changes in seasonality and timing of peak streamflow in snow and semi-arid climates of the north-central United States, 1910–2012, Hydrol. Process., 30, 1208–1218, https://doi.org/10.1002/hyp.10693, 2016.
Sayer, A. M., Hsu, N. C., and Bettenhausen, C.: Implications of MODIS bow-tie distortion on aerosol optical depth retrievals, and techniques for mitigation, Atmos. Meas. Tech., 8, 5277–5288, https://doi.org/10.5194/amt-8-5277-2015, 2015.
Scott, C. A., Zhang, F., Mukherji, A., Immerzeel, W., Mustafa, D., and Bharati, L.: Water in the Hindu Kush Himalaya, in: The Hindu Kush Himalaya Assessment, Springer International Publishing, 257–299, 2019.
Thapa, A: Filter modis daily snow using 8-day improved snow, combine improved daily snow and merge with RGI glacier, Zenodo, https://doi.org/10.5281/zenodo.3862058, 2020.
Thapa, A. and Muhammad S.: Contemporary Snow Changes in the Karakoram Region Attributed to Improved MODIS Data between 2003 and 2018, Water, 12, 2681, https://doi.org/10.3390/w12102681, 2020.
Tian, L., Yao, T., Gao, Y., Thompson, L., Mosley-Thompson, E., Muhammad, S., Zong, J., Wang, C., Jin, S., and Li, Z.: Two glaciers collapse in western Tibet, J. Glaciol., 63, 194–197, https://doi.org/10.1017/jog.2016.122, 2017.