the Creative Commons Attribution 4.0 License.
the Creative Commons Attribution 4.0 License.
 | 23 Dec 2021
NESEA-Rice10: high-resolution annual paddy rice maps for Northeast and Southeast Asia from 2017 to 2019
Jichong Han
Zhao Zhang
Yuchuan Luo
Juan Cao
Liangliang Zhang
Fei Cheng
Huimin Zhuang
Jing Zhang
Fulu Tao
An accurate paddy rice map is crucial for ensuring food security, particularly for Southeast and Northeast Asia. MODIS satellite data are useful for mapping paddy rice at continental scales but have a mixed-pixel problem caused by the coarse spatial resolution. To reduce the mixed pixels, we designed a rule-based method for mapping paddy rice by integrating time series Sentinel-1 and MODIS data. We demonstrated the method by generating annual paddy rice maps for Southeast and Northeast Asia in 2017–2019 (NESEA-Rice10). We compared the resultant paddy rice maps with available agricultural statistics at subnational levels and existing rice maps for some countries. The results demonstrated that the linear coefficient of determination (R2) between our paddy rice maps and agricultural statistics ranged from 0.80 to 0.97. The paddy rice planting areas in 2017 were spatially consistent with the existing maps in Vietnam (R2=0.93) and Northeast China (R2=0.99). The spatial distribution of the 2017–2019 composite paddy rice map was consistent with that of the rice map from the International Rice Research Institute. The paddy rice planting area may have been underestimated in the region in which the flooding signal was not strong. The dataset is useful for water resource management, rice growth, and yield monitoring. The full product is publicly available at https://doi.org/10.5281/zenodo.5645344 (Han et al., 2021a). Small examples can be found from the following DOI: https://doi.org/10.17632/cnc3tkbwcm.1 (Han et al., 2021b).
- Article
(17918 KB) - Full-text XML
-
Supplement
(2436 KB) - BibTeX
- EndNote


Rice is one of the world's main food sources, accounting for approximately 12 % of the global cropland area (Zhang et al., 2018; Singha et al., 2019). Approximately 90 % of the world's rice is produced in Asian countries (Chen et al., 2012; Yeom et al., 2021). Rice provides food for over 50 % of the world's population (Minasny et al., 2019). The consumption of rice increases as the world's population increases. Additionally, approximately of CH4 emissions in the atmosphere come from methane emissions from rice paddies (Ehhalt et al., 2001; Xin et al., 2017; Zhang et al., 2020). Rice agriculture is significant in food security, water resource security, disease transmission, and environmental sustainability (Clauss et al., 2018b; Li et al., 2020; Park et al., 2018). An accurate planting area and spatial distribution information are the basis for monitoring paddy rice growth and predicting yield. However, few spatial maps of paddy fields at continental scales exist (Li et al., 2020; Singha et al., 2019). Therefore, it is necessary to produce a paddy rice map dataset with high spatial resolution.
Many methods for mapping rice have been developed based on different remote sensing data, including (1) machine learning classifiers (e.g., random forest and support vector machines), (2) phenology-based classifiers, (3) rule-based algorithms, and (4) the time series algorithm approach (Dong et al., 2016a, b; Bazzi et al., 2019; Dong and Xiao, 2016; Luo et al., 2020b, a; Nelson et al., 2014; Phung et al., 2020; Minasny et al., 2019; Shew and Ghosh, 2019; Xiao et al., 2006; Zhan et al., 2021). Satellite image sources include MODIS, Landsat, Sentinel, RADARSAT, and PALSAR (Dong and Xiao, 2016; Shao et al., 2001; Singha et al., 2019; Zhou et al., 2016). Many studies have demonstrated that phenology-based classifiers using MODIS data are useful for mapping paddy rice at continental scales (Dong et al., 2016b; Xiao et al., 2006; Zhang et al., 2020). The transplanting period of rice is a distinct characteristic used for distinguishing rice from other crops or land use types. For example, Xiao et al. (2006) mapped paddy rice at continental scales (South Asia and Southeast Asia, SE Asia) using the phenological characteristics in the period of flooding and transplanting. Additionally, this method was successfully applied in other large regions (Xin et al., 2020; Zhang et al., 2017, 2020). The International Rice Research Institute (IRRI) extracted the distribution of paddy rice for Asia (Nelson and Gumma, 2015). However, the paddy rice maps generated using MODIS data contain a large number of mixed pixels caused by the coarse spatial resolution (500 m) (Dong et al., 2015, 2016b; Shew and Ghosh, 2019), particularly in hilly areas (Z. Liu et al., 2019). The mixed land cover types within MODIS pixels can affect the accuracy of the rice map (Sun et al., 2009). Fine spatial resolution images, including Landsat TM/ETM+/OLI, Huan Jing (HJ), and Sentinel-2 images, are also used for mapping paddy rice. Some previous studies have shown that rice maps generated from Landsat images have relatively high accuracy (Dong et al., 2016a; Torbick et al., 2017). However, they are only suitable for relatively small study areas in which cloud cover is minimal and not for continental scales (Ramadhani et al., 2020; Torbick et al., 2017). In contrast to optical satellite images, synthetic aperture radar (SAR) data are unaffected by clouds (Park et al., 2018). Moreover, SAR data have the special characteristics of backscatter changes during the growth of paddy rice (Bazzi et al., 2019; Clauss et al., 2018b; Nguyen et al., 2016; Phung et al., 2020; Planque et al., 2021). For example, Singha et al. (2019) mapped the rice map for Bangladesh based on Sentinel-1 data and random forest classifiers with good accuracy. Although paddy rice has been mapped in several studies using SAR data, they are still difficult to use widely over large areas because of the lack of a large number of ground truth samples (Clauss et al., 2018b; Minh et al., 2019; Nguyen et al., 2016; Phung et al., 2020; Minasny et al., 2019; Zhan et al., 2021; Zhang et al., 2018). Because the average area of crop fields in many regions in Asia is less than half a hectare (Maclean et al., 2013), it is critical to generate paddy rice maps with higher spatial resolution at continental scales than past efforts with MODIS.
Optical remote sensing images and SAR data have complementary information (Park et al., 2018; Wang et al., 2015). The combination of optical and SAR images can provide opportunities for mapping paddy rice with a few mixed pixels and a high spatial resolution at continental scales. MODIS data have the advantage of high temporal resolution, which reduces cloud problems and provides valuable spectral information for identifying paddy rice. Sentinel-1 SAR data with a high spatial resolution (10 m) provide backscatter information for different land types. Therefore, the integration of MODIS and SAR images may solve the mixed-pixel issue to a great degree and enable the production of more reliable paddy rice maps than those based only on MODIS images (Dong and Xiao, 2016; Park et al., 2018; Torbick et al., 2010; Wang et al., 2015). We take advantage of both MODIS and SAR strengths to map paddy rice fields at a large scale.
Thus, we aim to improve the MODIS-based method for mapping paddy rice fields by integrating Sentinel-1 SAR data to reduce mixed-pixel effects. Then we use the method to generate paddy rice maps in 2017–2019 for SE Asia and Northeast Asia (NE Asia). The map products will be useful for scientific communities and stakeholders for many purposes.
2.1 Study area
The study areas were NE and SE Asia. NE Asia is composed of Northeast China (Liaoning, Jilin, and Heilongjiang province), the Democratic People's Republic of Korea, the Republic of Korea, and Japan (Dong et al., 2016b; Yeom et al., 2021). The main paddy-rice-producing regions in NE Asia are concentrated in the plain in Northeast China, the western plain of the Korean Peninsula, and the alluvial plains around the Japanese islands. In SE Asia, the countries where rice is planted intensively include Indonesia, Thailand, Vietnam, Myanmar, the Philippines, Malaysia, and Myanmar. SE Asia cultivates approximately 30 % of the world's rice (Bridhikitti and Overcamp, 2012; Huke and Huke, 1997). The dense planting areas of rice in SE Asia are located in valleys and deltas, such as the Red River delta in northern Vietnam and the Mekong River delta in southern Vietnam (Clauss et al., 2018a; Phung et al., 2020). The Mekong delta produces more than half the rice in Vietnam (Bouvet and Le Toan, 2011). The main rice cropping system in NE Asia is single rice (Dong et al., 2016b). By contrast, three rice cropping systems are dominant in SE Asia: single rice, double rice, and triple rice (Laborte et al., 2017). Because climate and crop calendars vary across SE and NE Asia, the study area was classified into eight refined agroecological zones based on temperature, seasonal precipitation, and farming practices from previous studies (Oliphant et al., 2019; Suepa et al., 2016). The zones were further subdivided into 41 regions for classification (Fig. 1).
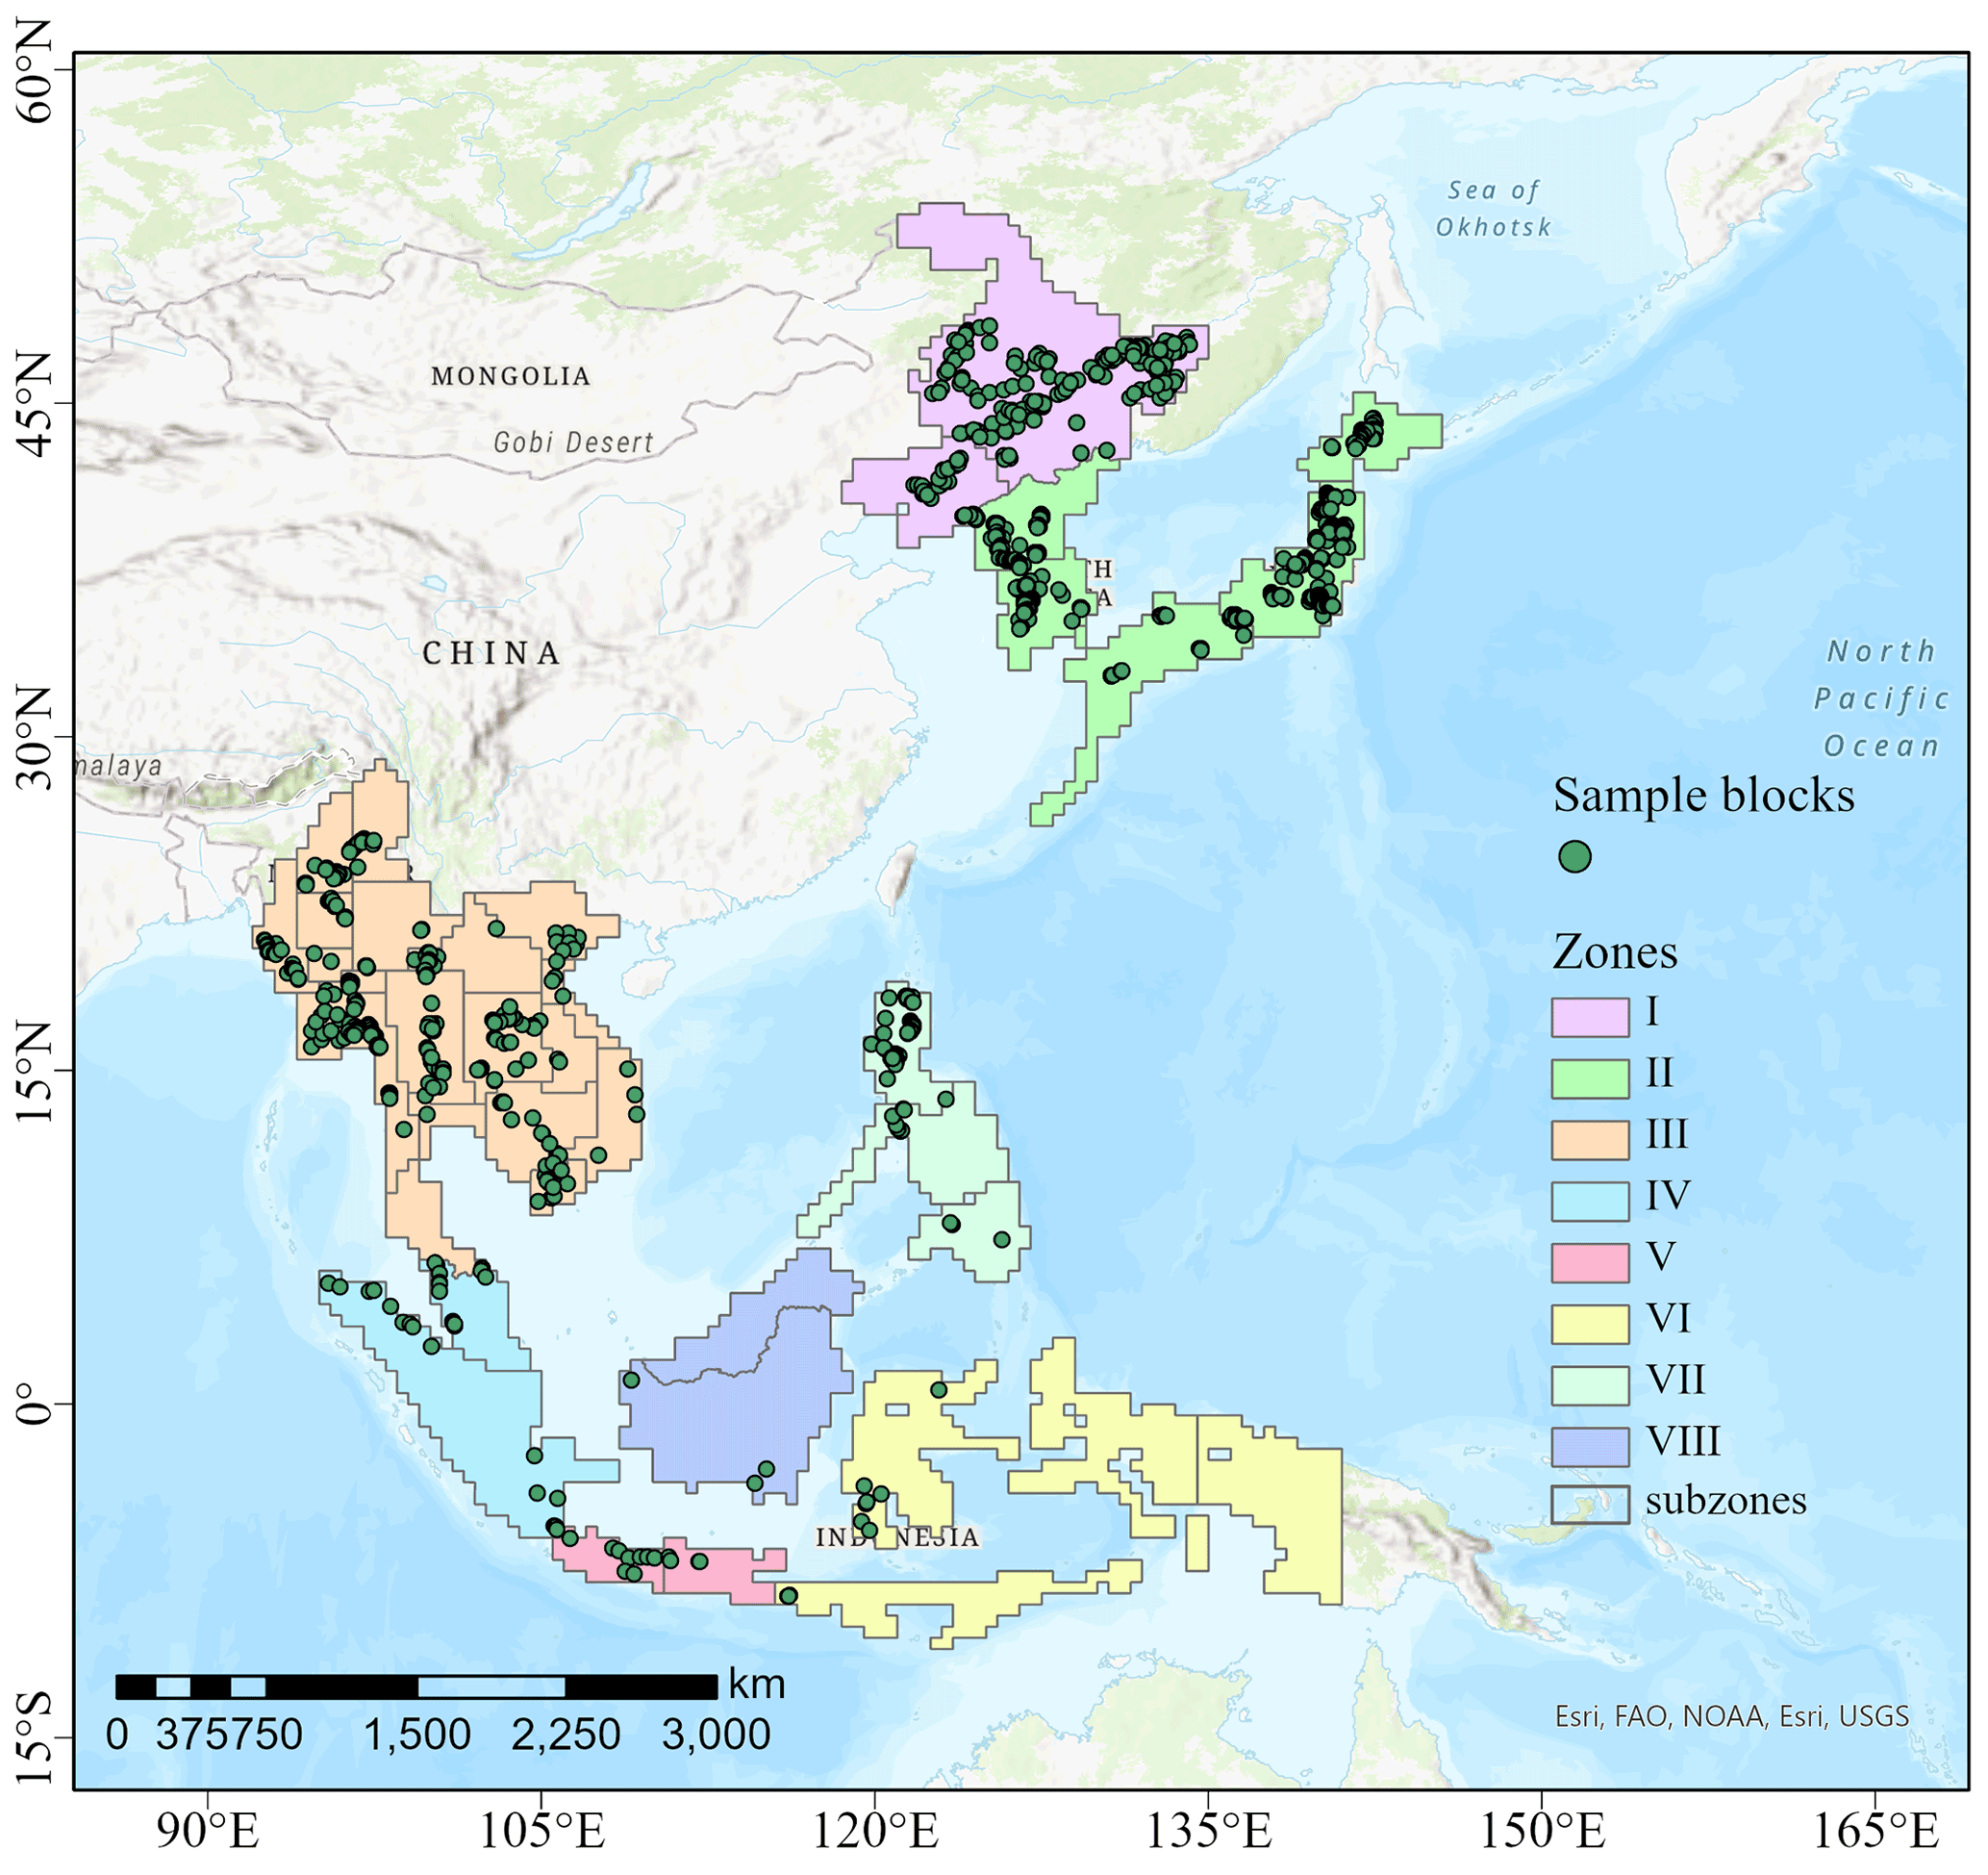
Figure 1Agroecological zones and 100 m radius sample blocks in SE and NE Asia.
2.2 Data source
2.2.1 Satellite imagery
We acquired the time series MOD09A1 images from the Google Earth Engine (GEE) data catalog (https://developers.google.com/earth-engine/datasets/, last access: 18 June 2021). The 8 d composite MOD09A1 provides seven surface reflectance bands (red, blue, green, near-infrared, and shortwave infrared 1–2 bands) at 500 m spatial resolution. We used the blue band (≥0.2) to remove cloudy pixels (Chen et al., 2012; Xiao et al., 2006). We projected MODIS data using the WGS1984 coordinate system. Additionally, we collected SAR data with 10 m resolution in interferometric wide-swath mode from the Sentinel-1 satellite (Torres et al., 2012). To maximize the frequency of observations, we used the Level-1 ground range detected (GRD) product in ascending and descending orbits. We pre-processed the GRD data with VH (Vertical transmit Horizontal receive) and VV (Vertical transmit Vertical receive) polarization that we acquired (e.g., calibration and geocoding) using the Sentinel-1 Toolbox on the GEE (https://developers.google.com/earth-engine/datasets/catalog/COPERNICUS_S1_GRD, last access: 18 June 2021) (Singha et al., 2019; C. Liu et al., 2020). Following this, we applied a filter with a boxcar kernel (30×30) moving to reduce speckle noise (Minasny et al., 2019). However, the rugged terrain and side-looking SAR imaging geometry caused radiometric distortion (Mullissa et al., 2021; Vollrath et al., 2020). To increase the quality of observations, we used the physical reference model (volume) proposed by Vollrath et al. (2020) to make a radiometric slope correction for Sentinel-1 on the GEE. Figure S1 in the Supplement shows an example of the effect of slope correction in SE Asia using the model. The code can be found at https://github.com/ESA-PhiLab/radiometric-slope-correction (last access: 18 June 2021).
2.2.2 Terrain data
We generated digital elevation model (DEM) data from the Shuttle Radar Topography Mission (SRTM) Version 4 (Reuter et al., 2007). The spatial resolution of the DEM was 90 m × 90 m. We acquired the DEM data and calculated the slope map from the DEM on the GEE platform (Table 1).
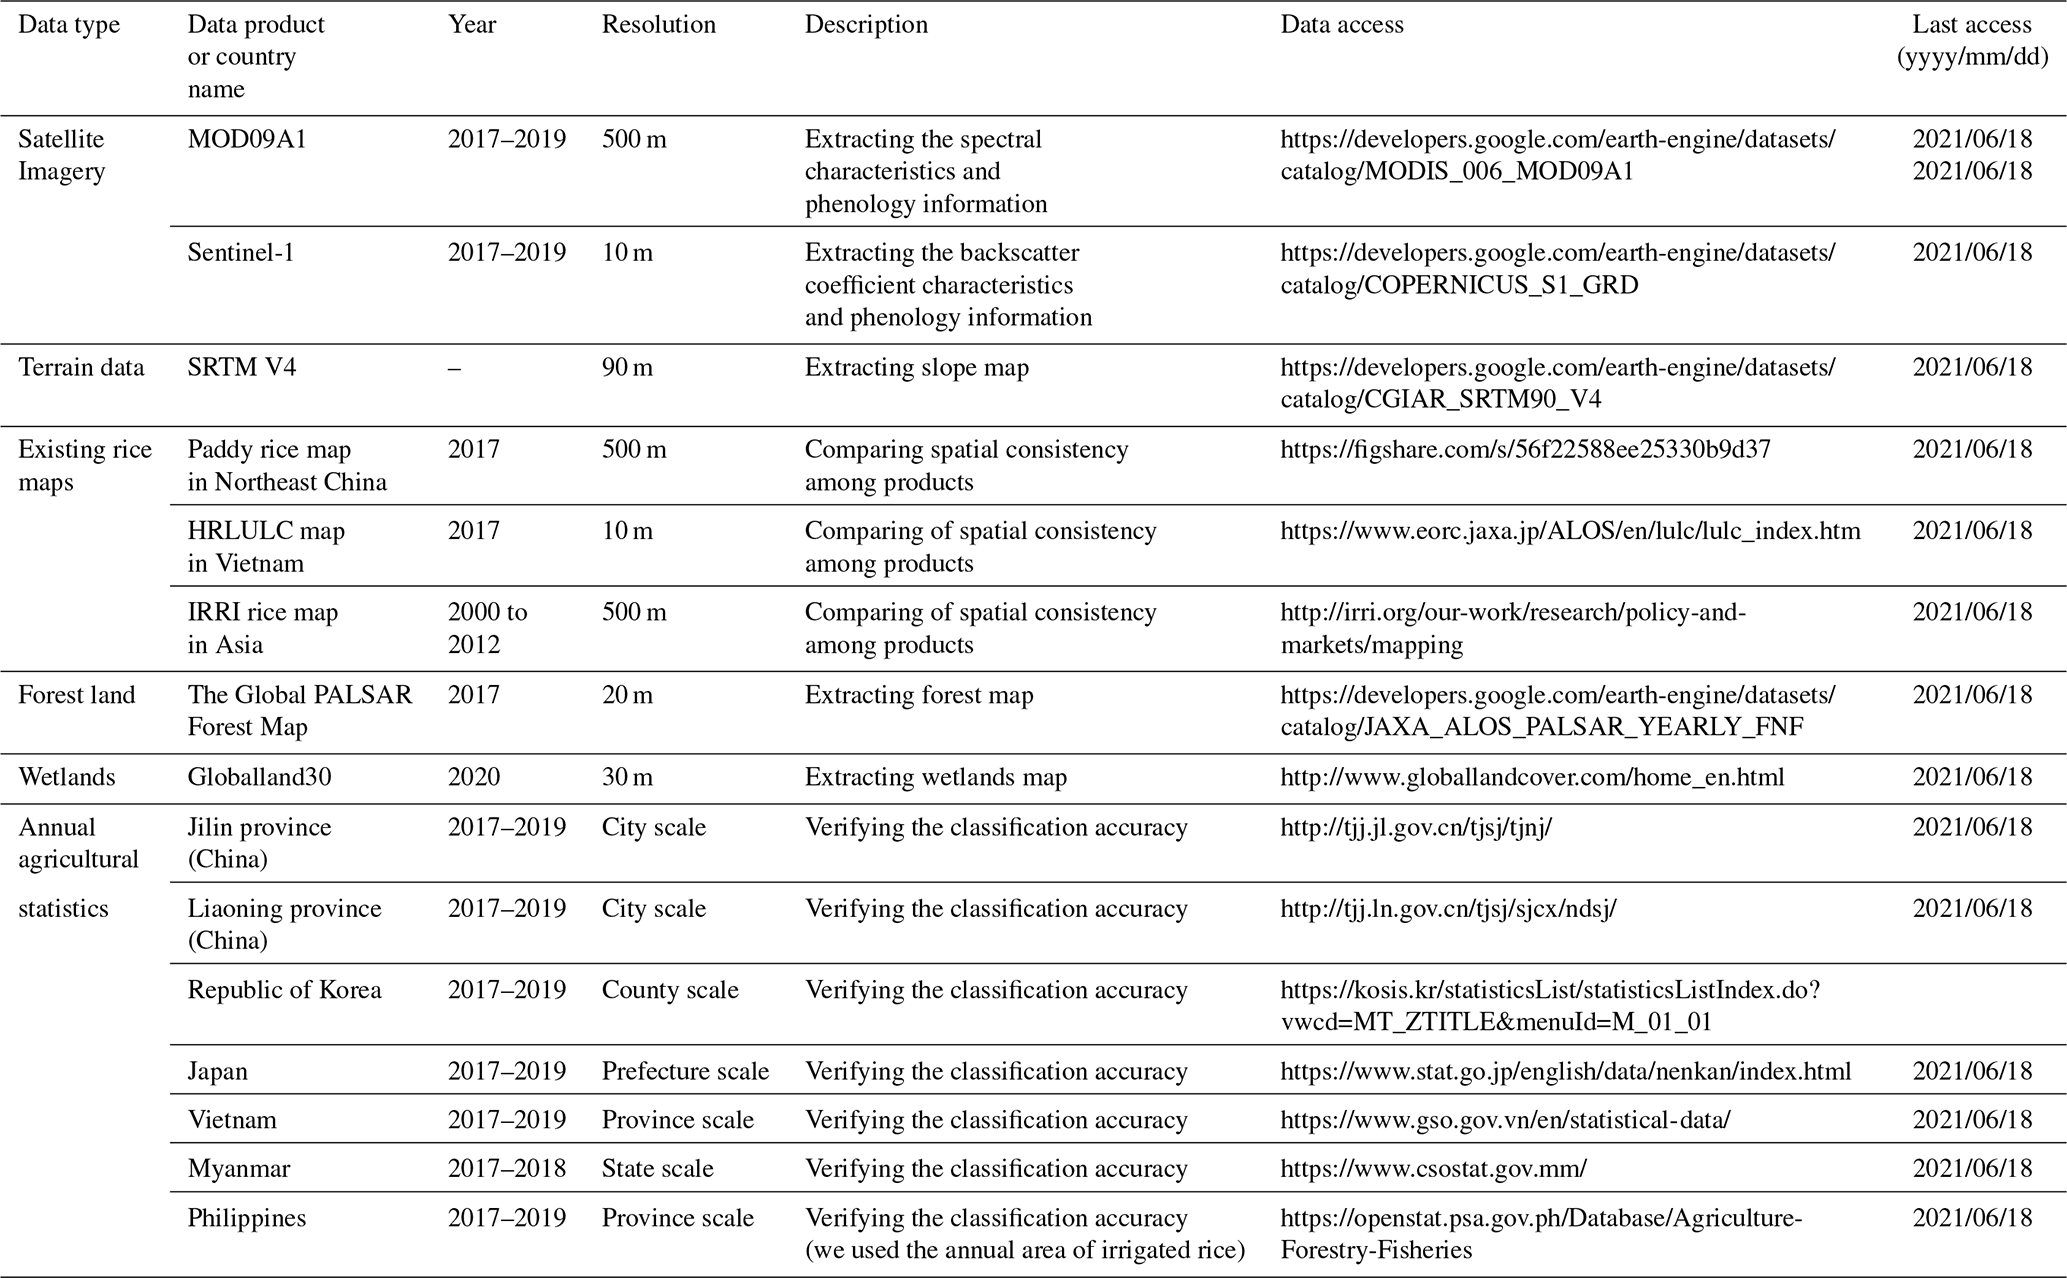
Table 1Detailed information about the data used in this study.
2.2.3 Forest land
We extracted the forest land mask from the Global PALSAR Forest Map in 2017 (Table 1). The Global PALSAR Forest Map (25 m spatial resolution) was generated by the Japan Aerospace Exploration Agency (JAXA) (Shimada et al., 2014). Pixels with a forest area larger than 0.5 ha and forests covering over 10 % of the pixel area were defined as forest pixels (Shimada et al., 2014).
2.2.4 Wetland
We extracted the distribution of wetland from the GlobeLand30 dataset in 2020. GlobeLand30 is available from the National Geomatics Center of China (Table 1). This product at 30 m spatial resolution with high accuracy was generated using Landsat, Chinese HJ-1, and GF-1 satellite images (http://www.globallandcover.com, last access: 18 June 2021) (Chen et al., 2015).
Finally, we resampled all the raster data to 10 m to match the spatial resolution of Sentinel-1.
2.2.5 Agricultural statistics
We collected annual rice planting area census data at the subnational level (state, province, city, prefecture, or county) from the available statistical yearbooks of various countries. The agricultural statistics were provided by agricultural statistical offices. The areas in the statistics data were converted into hectares (ha). Detailed information about the collected agricultural statistics in this study is presented in Table 1.
2.2.6 Existing rice maps
We collected the existing publicly available rice maps from three sources: (1) the 500 m spatial resolution paddy rice map with high accuracy in Southern China in 2017 that was generated using the phenology- and pixel-based algorithm from MODIS data (Xin et al., 2020), (2) the High-Resolution Land Use and Land Cover (HRLULC) map for Vietnam in 2017 (Hashimoto et al., 2014) with 10 m spatial resolution generated using multiple remote sensing data sources, and (3) the 500 m resolution rice maps of Asia obtained from the IRRI (Nelson and Gumma, 2015), which were mainly derived from MODIS data. We compared these existing products with our paddy rice maps.
2.3 Methodology
2.3.1 Analyzing the characteristics of spectral indices from paddy rice
There are three growing stages for paddy rice: transplanting, growing, and post-harvest periods (Singha et al., 2019). Flooding signals in the transplanting period are unique characteristics that distinguish paddy rice from other crops (Clauss et al., 2016; Dong et al., 2016b; Sun et al., 2009). The color combination of MODIS images (R/G/B = band7/band2/band1) in the transplanting stage of the paddy rice field has a prominent tone (Fig. S5). We calculated the land surface water index (LSWI) and enhanced vegetation index (EVI) for each image:
where ρSWIR, ρNIR, ρRED, and ρBLUE are values of band 6, band 2, band 1, and band 3, respectively. Note that we chose EVI instead of the normalized difference vegetation index (NDVI) for paddy rice identification because NDVI is more sensitive to atmospheric contamination and has a saturation issue (Zhang et al., 2015). Figure 2 shows the standard temporal profile of the EVI and LSWI of different paddy rice planting systems (single, double, and triple) at three typical sites. When LSWI plus 0.05 is larger than EVI, it indicates that the paddy rice is in the transplanting period. Both the EVI and LSWI values increase after paddy rice is transplanted. EVI values are higher than LSWI values because the fields are fully covered by the rice canopy. The EVI decreases during the post-harvest period. Both double paddy rice and triple paddy rice have flooding signals. The above phenomena are consistent with previous studies (Dong et al., 2016b; Minh et al., 2019; Shew and Ghosh, 2019; Xiao et al., 2006). The profiles of the LSWI and EVI of some land cover types (e.g., water, urban, and forest) are different from paddy rice (Fig. S3). Therefore, color gradations and the relationship between EVI and LSWI are useful for extracting phenological information of paddy rice. In this study, we did not smooth the EVI and LSWI time series. LSWI changes under different dry and wet conditions and smoothing the EVI and LSWI time series may eliminate the true paddy rice flood signal (L. Liu et al., 2020). Therefore, we did not reconstruct the EVI and LSWI datasets.
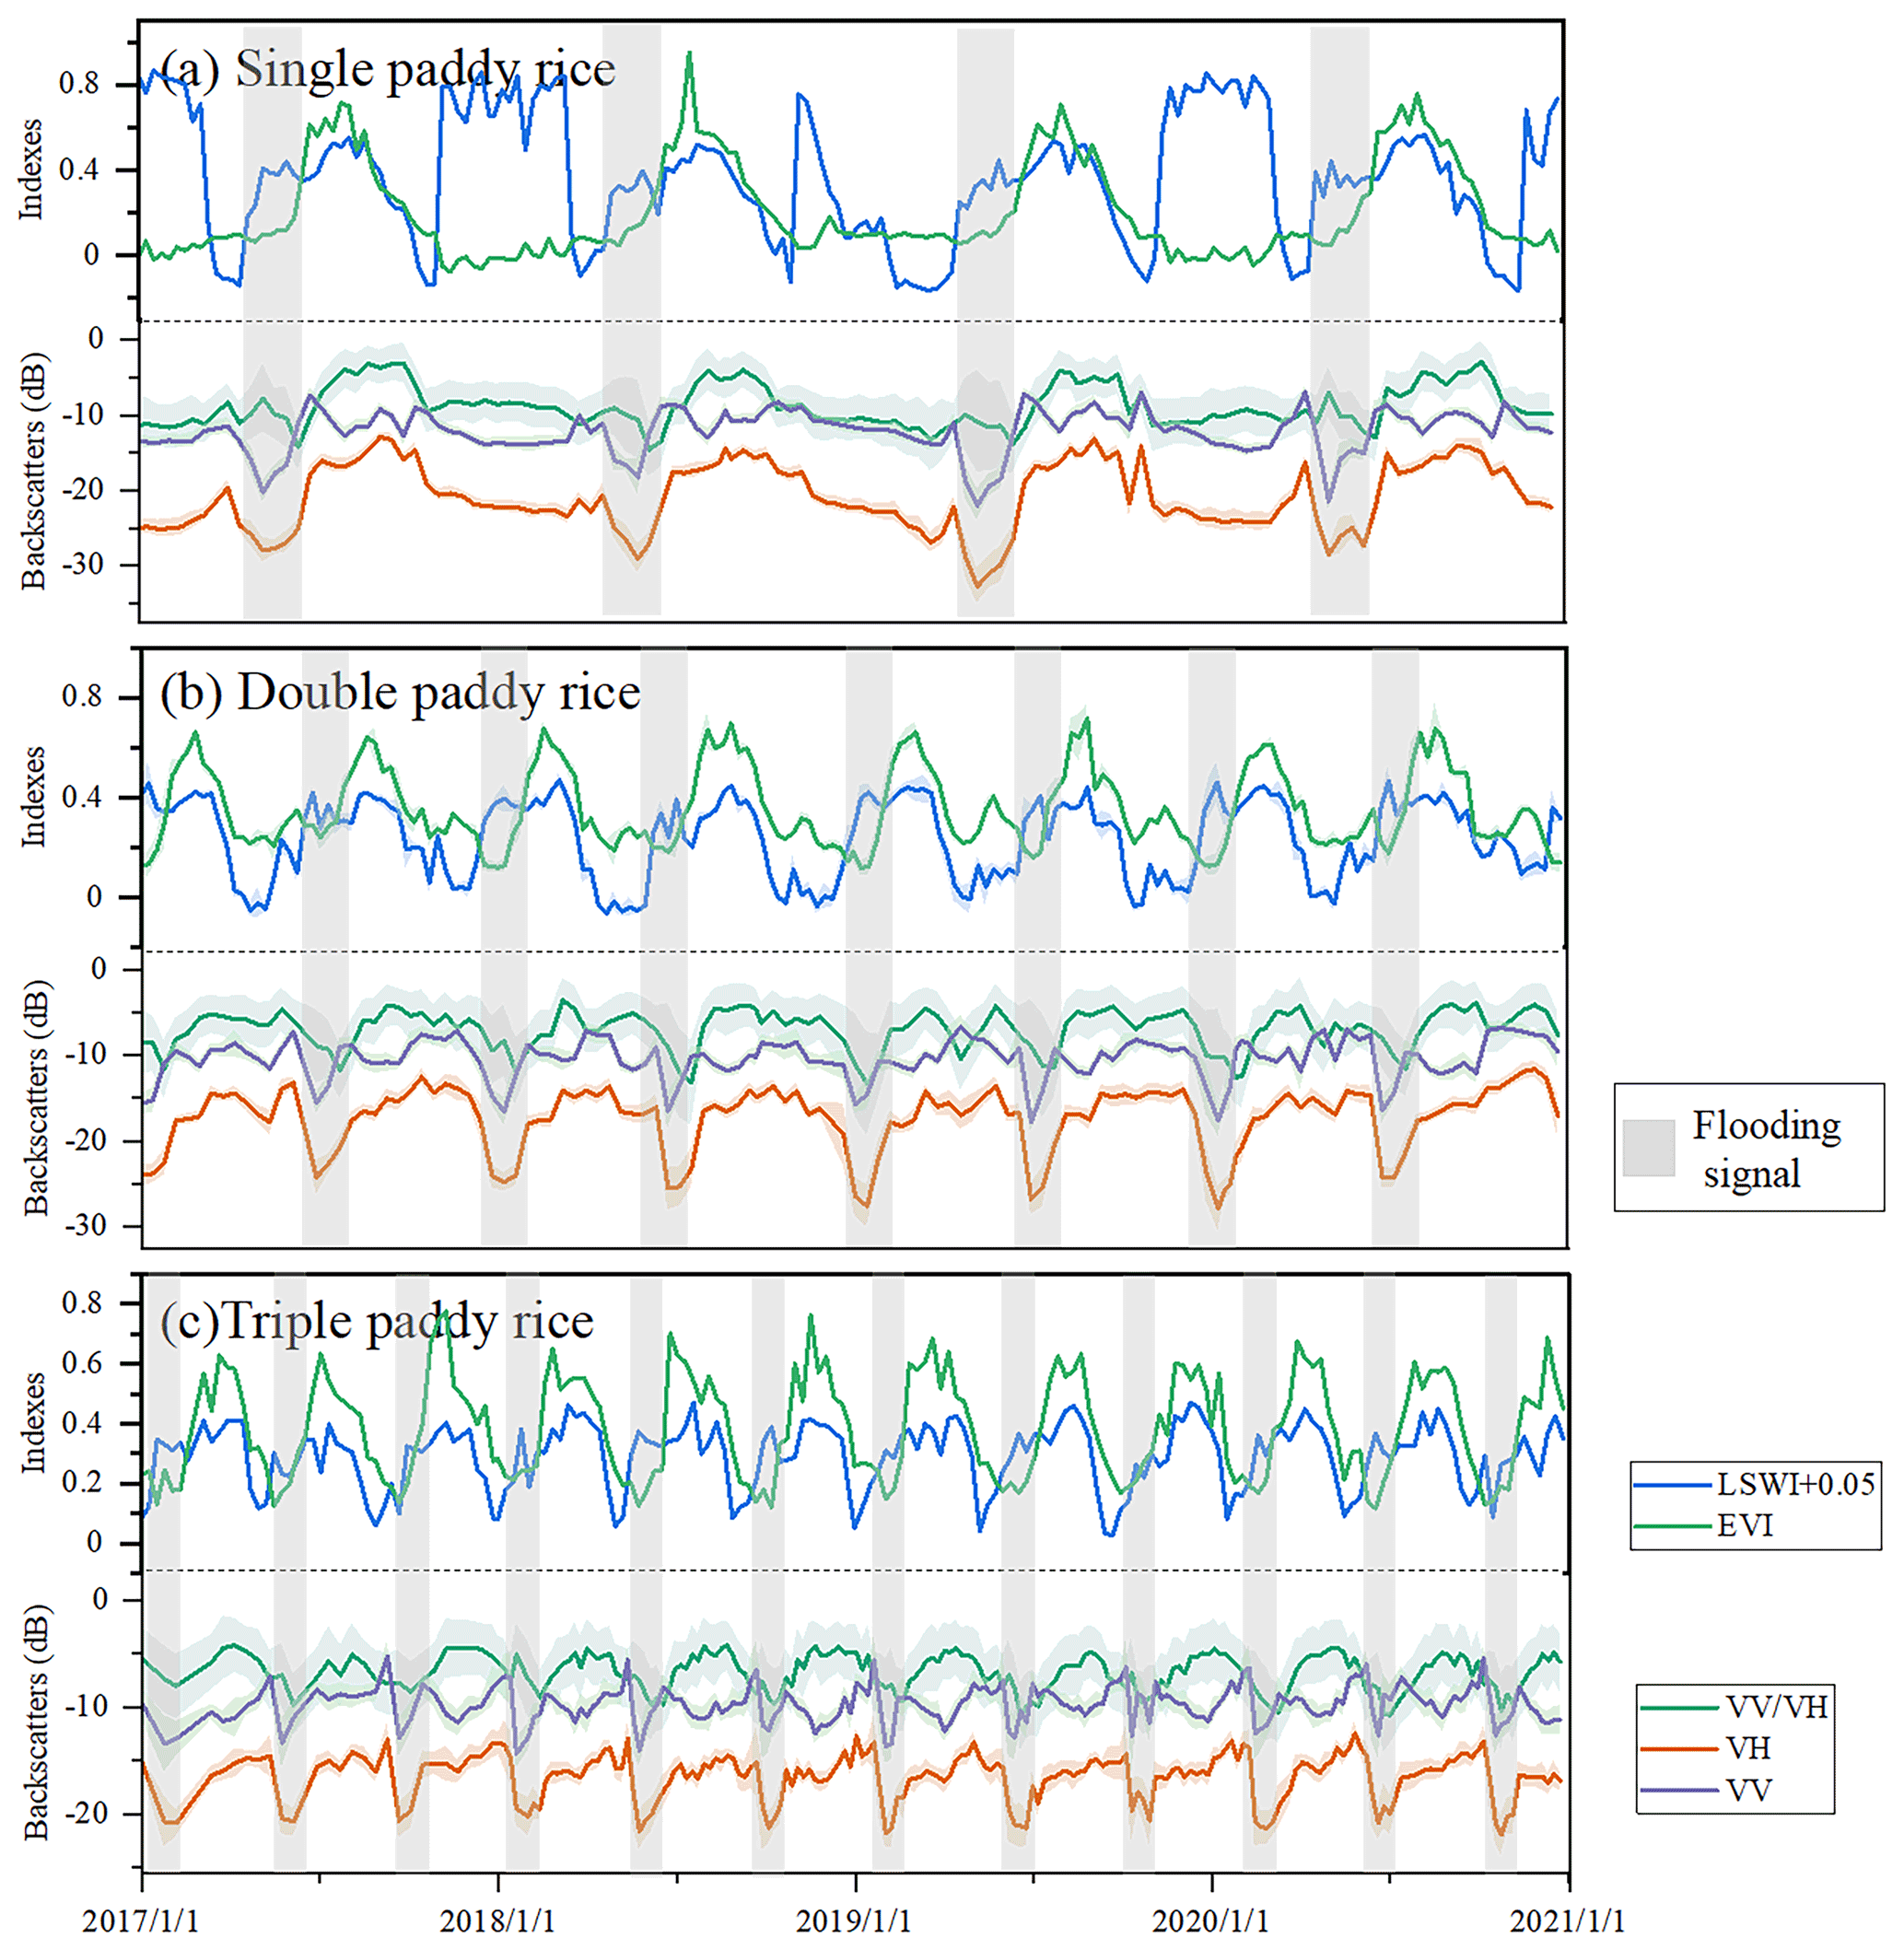
Figure 2Temporal profile analysis of EVI, LSWI, VV, VH, and VH/VV ratio from three typical paddy rice sites with different latitudes during 2017–2020: (a) single paddy rice in Northeast China (46.804562∘ N, 131.896961∘ E), (b) double paddy rice in the Philippines (15.630637∘ N, 120.864242∘ E), and (c) triple paddy rice in Indonesia (8.6211997∘ S, 116.141157∘ E). The shaded areas indicate the standard deviation.
2.3.2 Analyzing the characteristics of backscatter coefficients from paddy rice
The backscatter coefficients change as paddy rice grows and develops. Paddy rice fields appear as a black area in the VH image on the transplanting date (Fig. S2) because the water (flood) in the transplanting period decreases the VH backscatter coefficient values (Dineshkumar et al., 2019; Torbick et al., 2017). The VH and VV backscatter coefficients have a local minimum value during the transplanting period in all reference paddy rice fields (Fig. 2). After transplanting, the VH backscatter coefficients increase as the paddy rice grows and reaches a peak at the heading stage (Zhan et al., 2021; Zhang et al., 2018). The VH backscatter coefficients decrease after the rice harvest stage (Phung et al., 2020; Singha et al., 2019; Torbick et al., 2017). Additionally, paddy rice has consistent temporal behavior in the VH/VV ratio and VH. The profiles of the dynamic backscatter coefficients of some land cover types (e.g., water, urban, and forest) are different from those of paddy rice (Fig. S4). Therefore, color gradations and the time series of backscatter coefficients are useful for identifying paddy rice phenology information (Yulianto et al., 2019; Phung et al., 2020; Zhan et al., 2021).
2.3.3 Sample blocks collected for extracting phenological parameters
Paddy rice in SE and NE Asia is cultivated using diverse cropping systems because of the climate and other natural conditions (Dong et al., 2016a; Laborte et al., 2017; Nelson et al., 2014; Shew and Ghosh, 2019). With reference to previous studies (Clauss et al., 2016; Gumma et al., 2014; C. Liu et al., 2020; Phan et al., 2019; Phung et al., 2020), we acquired information about the flooding signal period and length of the growing season for each subzone using sampling-based information. We selected sample blocks that were distributed over the different rice-growing zones across SE and NE Asia. Each block was a polygon with a radius of 100 m. We collected the sample blocks according to multiple rules (Clauss et al., 2016; Dong et al., 2016a; Fikriyah et al., 2019; Singha et al., 2019). First, the time series of the backscatter coefficients and vegetation index of the mean values from all pixels in each sample block were consistent with the phenological characteristics of paddy rice (Sect. 2.3.1 and 2.3.2). Second, the sample blocks were also digitized using Google Earth or Sentinel-1/2 images using visual interpretation referring to previous studies (Dong et al., 2016a; Zhang et al., 2015). Third, we also used existing rice maps and calendar information as complementary information (Laborte et al., 2017; Maclean et al., 2013). Note that not all Google Earth or Sentinel-2 images were available throughout SE and NE Asia. We collected a total of 438 sample blocks and 504 sample blocks using the above rules for SE and NE Asia, respectively (Fig. 1). These blocks covered most paddy rice fields in the study areas. We generated mean backscatter coefficients and vegetation index time series profiles for each block. Following this, we manually extracted the paddy rice growth and phenological parameters based on the backscatter time series characteristics. Finally, we obtained the phenological information for each subzone from the sample blocks (Gumma et al., 2014; C. Liu et al., 2020). Although there may be some limitations in extracting phenological parameters for zones using random samples, it may be one of the most effective approaches currently available (Clauss et al., 2016; Gumma et al., 2014; Han et al., 2021c; Li et al., 2020; Phan et al., 2019; Phung et al., 2020).
2.3.4 Algorithm for identifying paddy rice fields
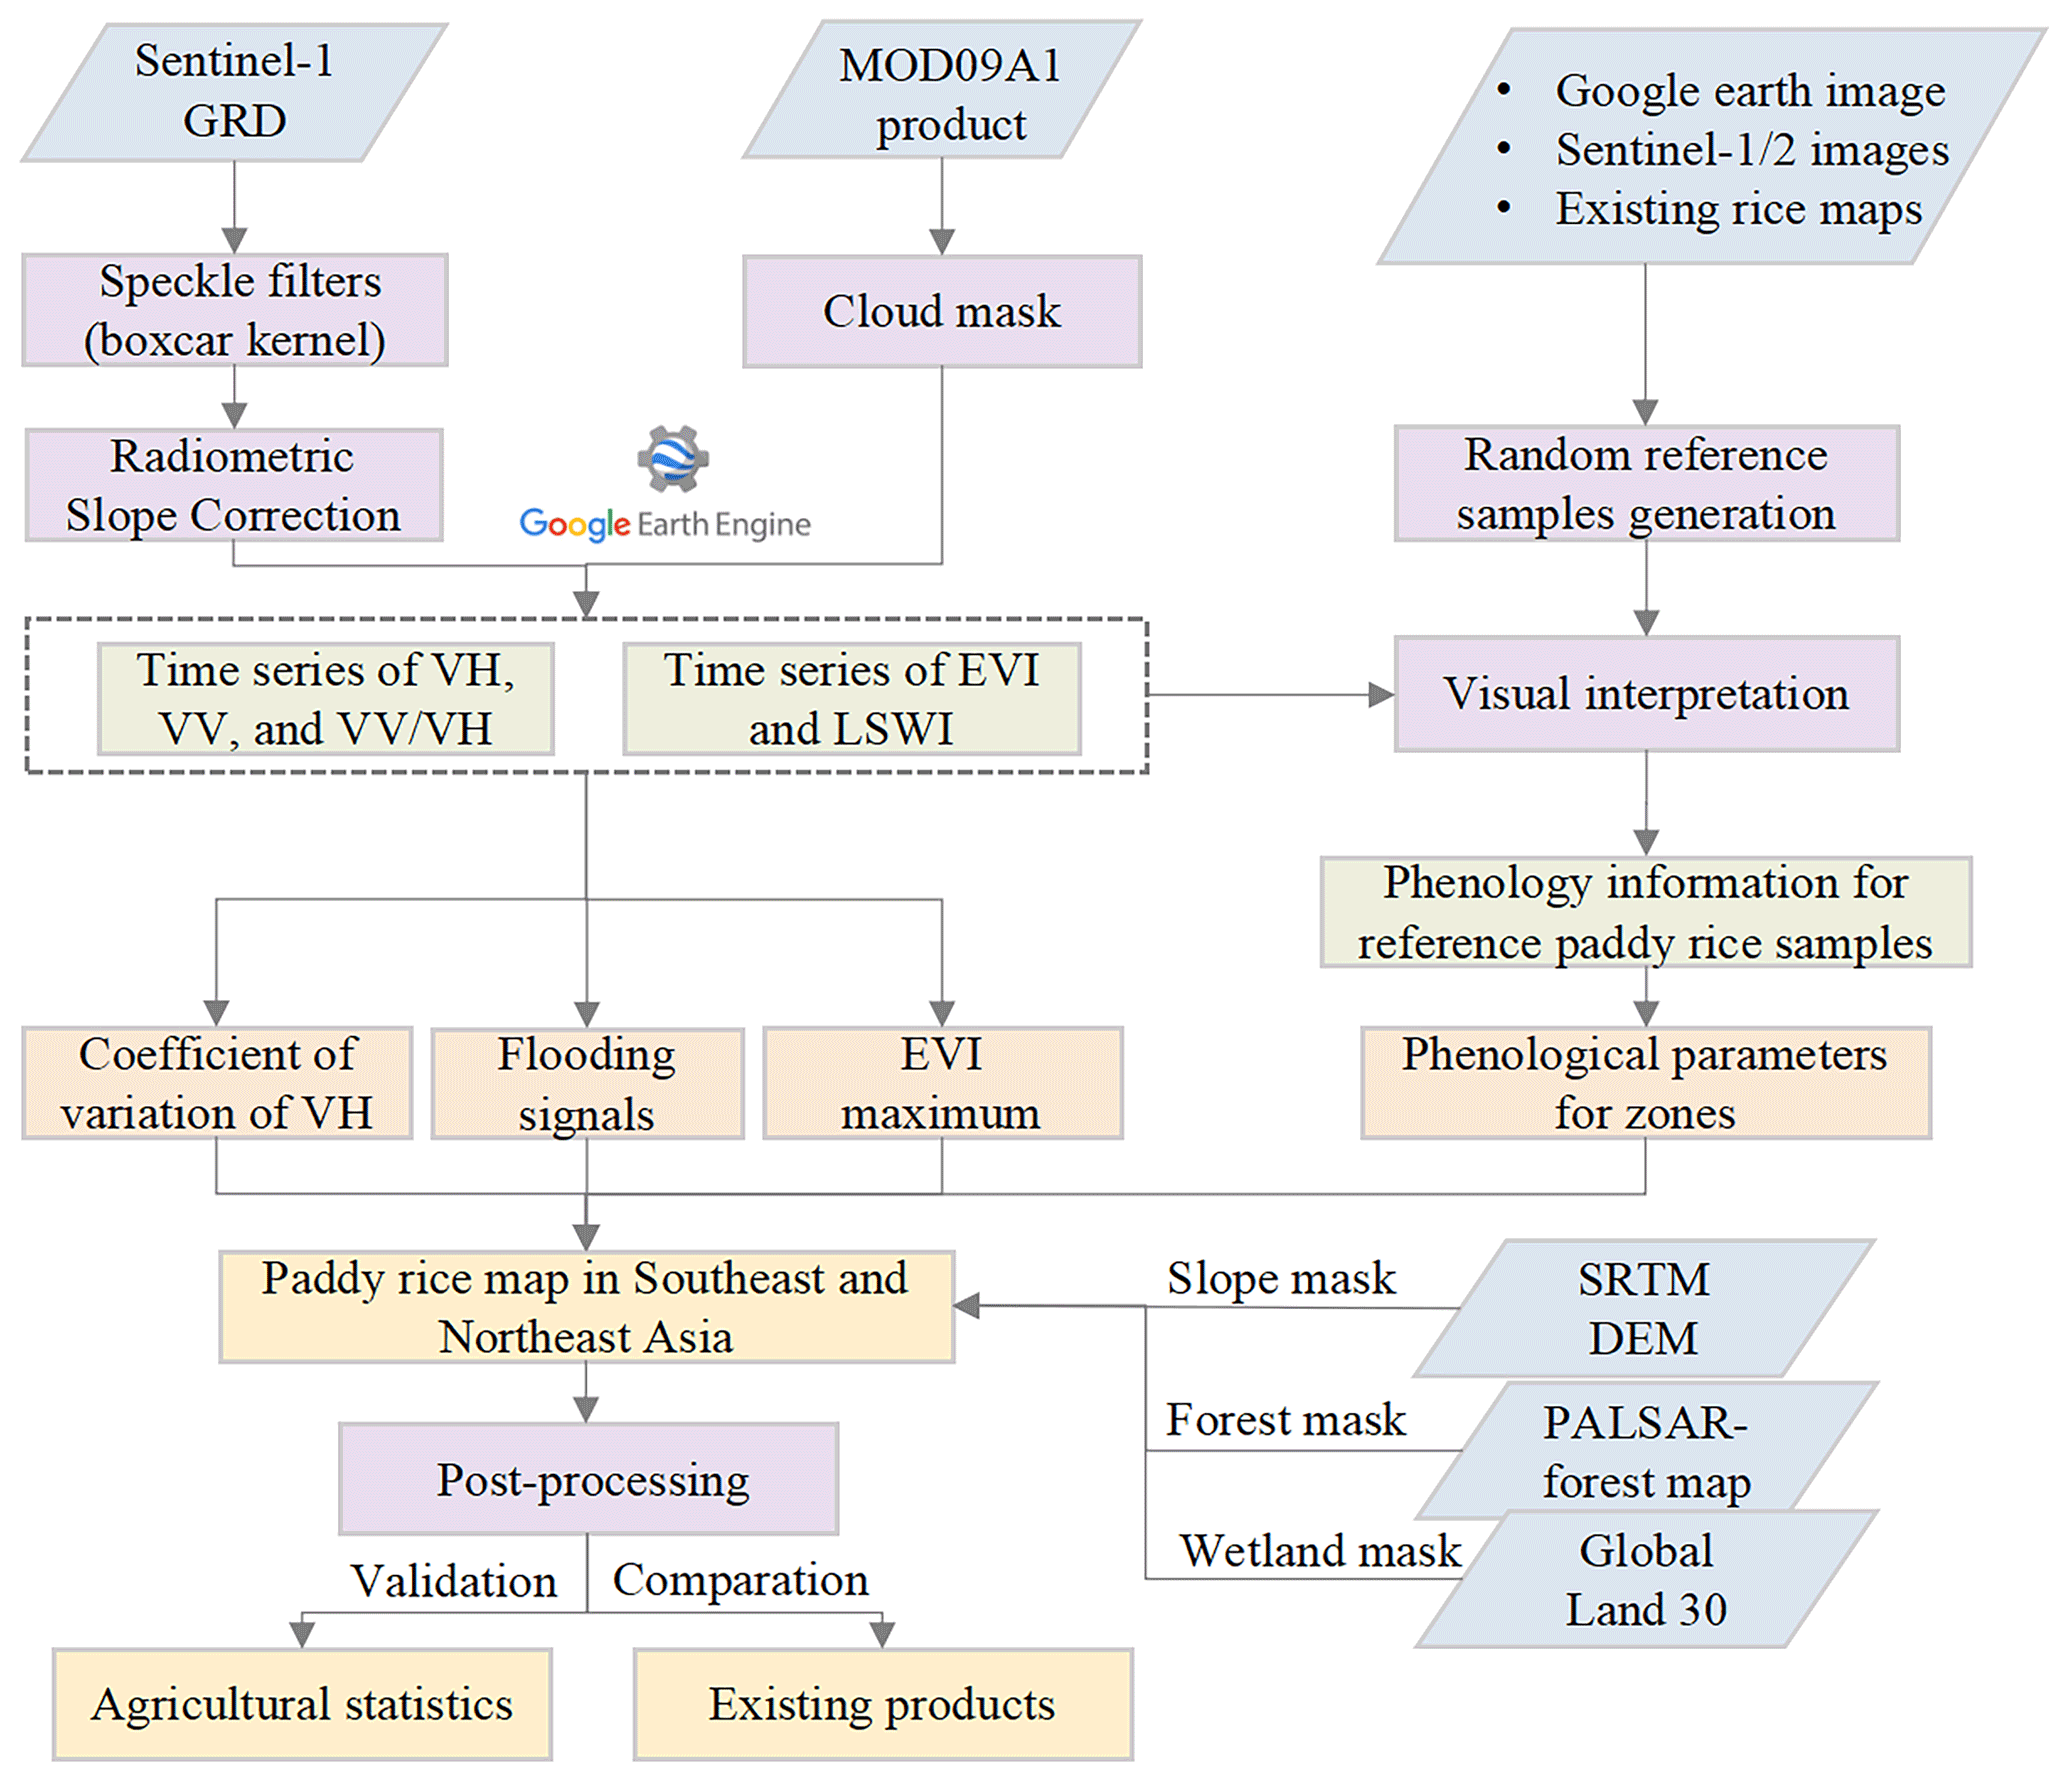
We used a rule-based method to map paddy rice and produce annual paddy rice maps for SE and NE Asia in 2017–2019 at 10 m resolution (NESEA-Rice10) using the phenological features of paddy rice (Fig. 3). The steps for generating the paddy rice maps are as follows.
1. Detect the flooding area of paddy rice. The key features used to identify paddy rice are the flooding signals in the transplanting phase (Dong and Xiao, 2016). We used LSWI EVI and LSWI <0.45 to extract the flooding signals. This rule has been used to successfully map potential paddy rice fields over large areas (Sakamoto et al., 2009; Xiao et al., 2006; Zhou et al., 2016). Because paddy rice flooding signals occur over a short period, non-permanent flooding (e.g., persistent water bodies and fishponds) should be removed (Nelson et al., 2014; Zhang et al., 2015). We removed pixels that had more than 20 composite periods identified as flooding signals during a year.
In addition to the optical MODIS-based LSWI–EVI relationship approach, we also applied the minimum value of VH data in the transplanting stage to identify flooding signals, as suggested in previous studies (Clauss et al., 2018b). VH has a higher sensitivity in paddy rice growth stages than VV polarization (Inoue et al., 2020; Nguyen et al., 2016; Wakabayashi et al., 2019). However, the minimum value of VH in different regions is different because Sentinel-1 data are affected by the incidence angle (ranging from approximately 30 to 45∘) (Fig. S6) (Phung et al., 2020; Singha et al., 2019; Zhang et al., 2018). Currently, it is still challenging to normalize the incidence angle over a large area on the GEE. The VH value of the water surface changes continuously from −21 to −34 dB as the incidence angle changes (Phung et al., 2020). To reduce the incidence angle effect on the Sentinel-1 images, we considered −20 dB as the conservative baseline threshold to achieve the minimum VH value. In previous studies, researchers also proved the effectiveness of this threshold for identifying flooding signals in paddy fields (Clauss et al., 2018b; Nguyen et al., 2015, 2016; Nguyen and Wagner, 2017; Zhang et al., 2018). To further improve the accuracy of flooding signal extraction, we fine-tuned the baseline threshold of VH for each subzone based on the histogram of sample blocks collected in Sect. 2.3.3. We considered the pixels that met all the above conditions as flooding signals.
2. The EVI of paddy rice increased rapidly after the transplanting period because of the increasing numbers of leaves and biomass (Chen et al., 2012). Therefore, we removed pixels with a maximum EVI value of less than 0.4, as suggested in previous studies (Kontgis et al., 2015; Sakamoto et al., 2009).
3. Moreover, the coefficient of variation (CV) has been proven to be an effective indicator for distinguishing crop types and non-cropland (Huang et al., 2021; C. Liu et al., 2020; Rose et al., 2021; Whelen and Siqueira, 2018). The VH backscatter coefficient of crops, particularly of paddy rice, has a larger time series variation range than non-agricultural land (e.g., urban and water) (Fig. S4). Based on this time series characteristic, paddy rice may be identified from different land surfaces. Therefore, we removed pixels with CV values greater than −0.4 and less than −0.1 calculated using VH during the growth of paddy rice (Rose et al., 2021; Whelen and Siqueira, 2018). The threshold was determined from the histogram of the paddy rice sample blocks in the study area. The histograms can be found in Fig. S7. We measured the CVVH using the temporal mean (mean) and standard deviation (SD) of the time series of VH during the paddy rice growth period:
4. We used the mask with slopes larger than 5∘ to remove steep terrain; it is unsuitable to plant paddy rice on sloping land (Sun et al., 2009).
5. We used the PALSAR-based forest map in 2017 as a mask (Wang et al., 2015; Zhang et al., 2017).
6. We used the water mask from GlobalLand30 in 2020 referring to the study of Zhang et al. (2015) to reduce the misclassification of paddy rice as it is challenging to extract paddy rice from wetlands because paddy rice and wetland have similar characteristics to flooding signals (Zhang et al., 2015; Zhou et al., 2016). 7. We classified pixels that met all of the above rules as paddy rice. Following this, we deleted small isolated pixels (connected components less than 12 pixels) to remove the “salt and pepper” effect in the classification (https://catalog.data.gov/dataset/global-food-security-support-analysis-data-gfsad-cropland-extent-2015-southeast-and-northe, last access: 18 June 2021).
The single cropping system for paddy rice identification is not ideal because of the difference in paddy rice cultivation time in some regions of SE Asia (Fikriyah et al., 2019; Shew and Ghosh, 2019). Therefore, we combined all paddy rice fields identified at different times into the annual map. We applied the improved method to generate the annual paddy rice maps for SE and NE Asia in 2017–2019. Please note that the method we improved may not extract rice fields (e.g., rain-fed paddy rice and upland rice) if flooding signals are not available (Xiao et al., 2006; Zhang et al., 2017).
2.4 Accuracy assessment
It is challenging to evaluate the accuracy of the classification at continental scales (Xiao et al., 2006; Zhang et al., 2020). We used two strategies to evaluate the paddy rice maps as accurately as possible. First, we compared the available agricultural statistics on a subnational level in some countries (Table 1). Referring to the study of Xiao et al. (2006), we calculated the annual area of paddy rice based on paddy intensity. The paddy intensities of countries in NE Asia, Myanmar, Vietnam, and the Philippines were 1, 1.4, 2.2, and 2, respectively. Second, we compared the spatial consistency between our classification results and existing rice maps (Table 1). We used the coefficient of determination (R2) to measure the consistency between our paddy rice maps, agricultural statistics, and existing products.
where n is the total number of administrative units, xi represents the mapped paddy rice areas, is the corresponding mean value, ki represents the agricultural statistics or areas from existing rice maps, and is the corresponding mean value.

Figure 4Comparison of the resultant annual paddy rice areas and the agricultural statistics at the subnational level in different countries from 2017 to 2019. The marginal kernel density plot above or to the right of each scatterplot shows the distribution of the data in one dimension.
3.1 Comparison of the classification with agricultural statistics
The paddy rice maps in SE and NE Asia in 2017–2019 are presented in Figs. S8 and S9, respectively. We calculated the annual paddy rice area using the pixel number approach for each administrative unit. The estimated annual rice paddy areas were significantly correlated with the agricultural statistics at subnational levels. The resultant paddy rice maps and the agricultural statistics had relatively high correlations in Northeast China (R2 ranged from 0.82 to 0.89, p<0.01) (Fig. 4a). The paddy areas in Changchun, Jilin, and Tonghua were underestimated. This is mainly because of the lack of available satellite data. When we excluded the three cities, R2 ranged from 0.85 to 0.97, with significant correlations. Additionally, there were significant correlations between the paddy rice maps and agricultural statistics in the Republic of Korea (Fig. 4b), but the results underestimated the paddy rice area (R2 ranged from 0.80 to 0.82, p<0.01). The main reason may be that many small rice fields were situated in narrow valleys in the mountains (Dong et al., 2016b; Peng et al., 2011). The correlations were high in most counties in Japan (R2 ranged from 0.89 to 0.93, p<0.01). In Hokkaido, the paddy rice areas were overestimated (Fig. 4c), as they were by Zhang et al. (2018). The resultant paddy rice areas were consistent with the agricultural statistics in Myanmar, with R2 ranging from 0.91 to 0.94 (Fig. 4d), and in Vietnam, with R2 equal to 0.97 in the 3 years (Fig. 4e). R2 between the paddy rice maps and the statistical data ranged from 0.81 to 0.87 in the Philippines, but rice areas in some provinces were underestimated (Fig. 4f). Cloud contamination may be a major reason for the underestimation (Peng et al., 2011; Xiao et al., 2006). The spatial distribution of paddy rice was visually consistent with that of the higher spatial resolution images in some typical testing regions (Fig. S10).
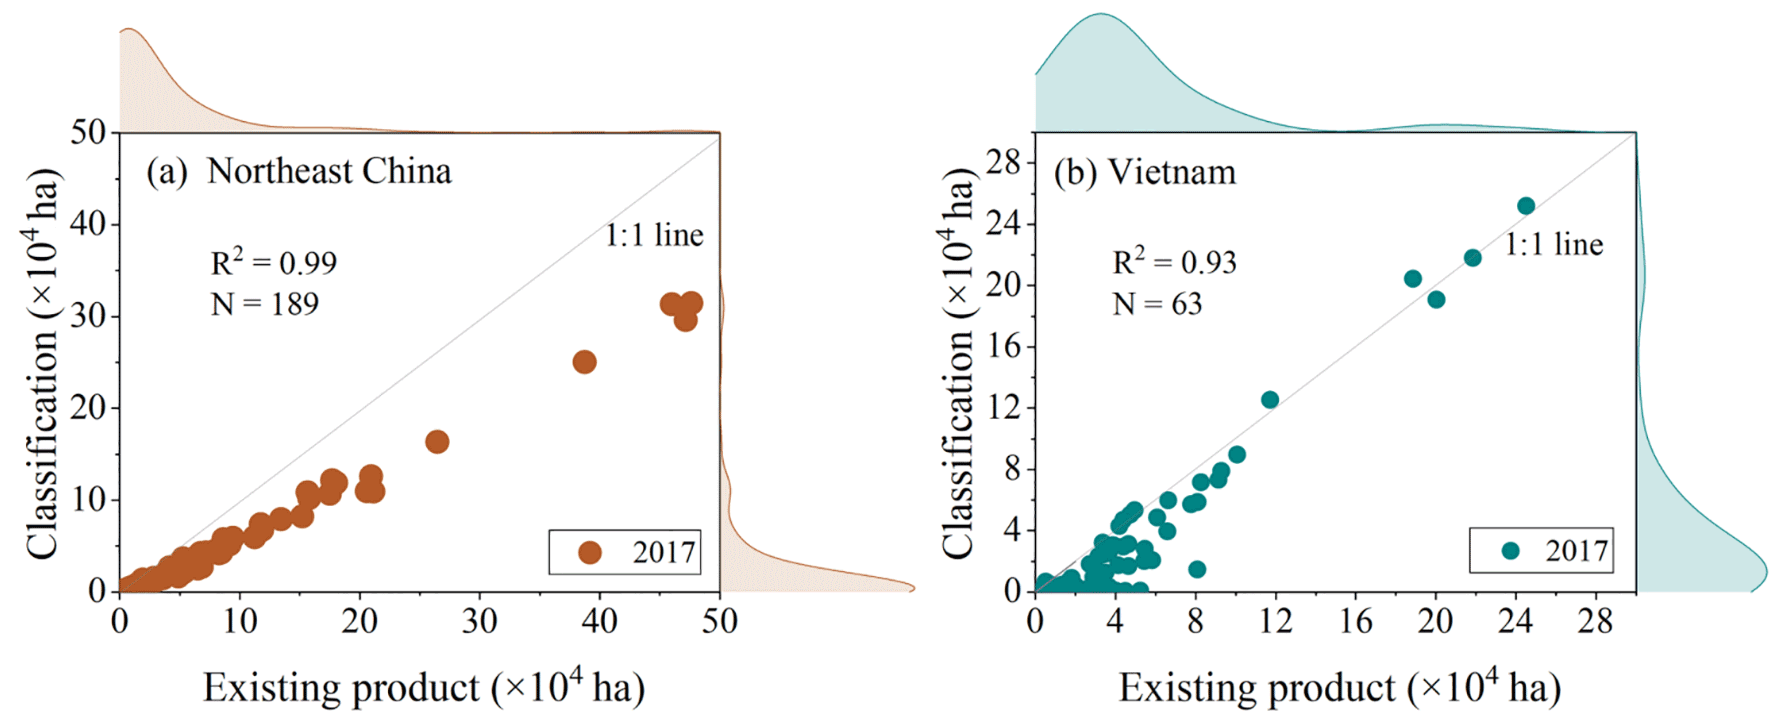
Figure 5Comparison of the annual paddy rice area between our classification and existing datasets at the subnational level in Northeast China (a) and Vietnam (b). The marginal kernel density plot above or to the right of each scatterplot shows the distribution of the data in one dimension.
3.2 Comparison of the classification with other annually available rice maps
We further compared the resultant rice maps with existing rice maps at the subnational level. The annually available datasets included the MODIS-based rice paddy map with 500 m resolution for Northeast China in 2017 and the JAXA-derived rice map with a 10 m resolution for Vietnam in 2017 (Sect. 2.2.6). The paddy rice area statistics from our maps and existing products significantly correlated with R2=0.99 (p<0.01) for Northeast China and R2= 0.93 (p<0.01) for Vietnam (Fig. 5). We note that the paddy rice area in our maps was smaller than that in the MODIS-based product for Northeast China. The main reason may be that the 500 m resolution MODIS-based paddy rice map had a large number of mixed pixels. Although the spatial patterns of our maps were consistent with the MODIS-based products (Figs. S11 and S12), our maps contained more details with fewer mixed pixels (Fig. 9a–f). Additionally, the detailed information at the field scale was consistent for both our maps and the JAXA-derived paddy rice map (Fig. 9g–r). Overall, the comparison of the classification with existing products confirmed the reliability of the paddy rice maps that we generated.
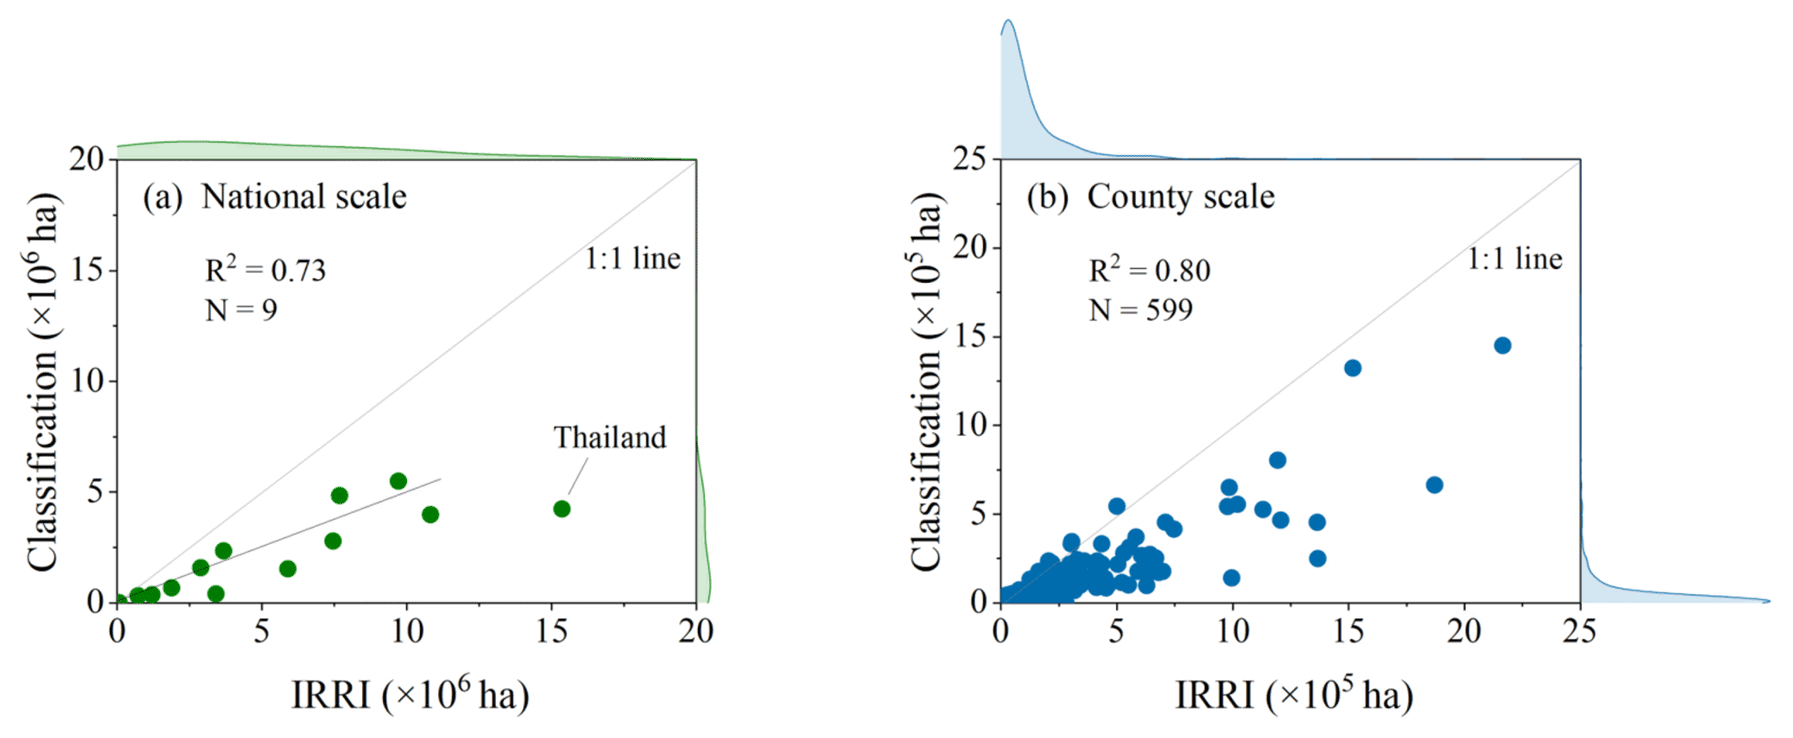
Figure 6Comparisons between the paddy rice area in our study and IRRI dataset in SE Asia at the (a) national and (b) county levels. The marginal kernel density plot above or to the right of each scatterplot shows the distribution of the data in one dimension.
3.3 Comparison of the composite paddy rice map and IRRI dataset
The composite paddy rice map is a mosaic of rice planting areas in 3 years (2017–2019) where rice has been detected in 1 or more years. We compared the composite paddy rice areas with IRRI products at the national and subnational levels in SE and NE Asia. The results demonstrated that the correlations between them were significant at both levels (R2 ranged from 0.73 to 0.80) (Fig. 6). The paddy rice area based on the IRRI product was higher than our results. The main reason may be that our method reduced the mixed pixels in the paddy rice map and that the IRRI product from MODIS overestimated the area, as in previous studies (Fig. S13) (Chen et al., 2012; Li et al., 2020; Nelson and Gumma, 2015). The difference between the two datasets may also be partly caused by the inconsistent epoch composite years in the two datasets. Moreover, although the distribution of paddy rice was consistent between our results and the IRRI product, there were regional differences. Our paddy rice map underestimated the rice area in Thailand (Fig. 6a), which may be because the rice planted in eastern Thailand has no obvious strong flooding signals (Zhang et al., 2020). Despite the various spatial resolutions and different years in the rice paddy data, the intercomparison verified the accuracy of our dataset.
3.4 Spatial patterns of paddy rice areas
In NE Asia, paddy rice fields are primarily cultivated in the longitude range from 123 to 134∘ E and latitude range from 45 to 48∘ N (Fig. 7). In Northeast China, paddy rice is mainly cultivated in Heilongjiang (Sanjiang Plain) and Liaoning provinces. Paddy rice in the Democratic People's Republic of Korea and the Republic of Korea is distributed in the western coastal plains. Some paddy rice fields are located in narrow valleys. Rice fields in Japan are mainly on the coastal alluvial plains.
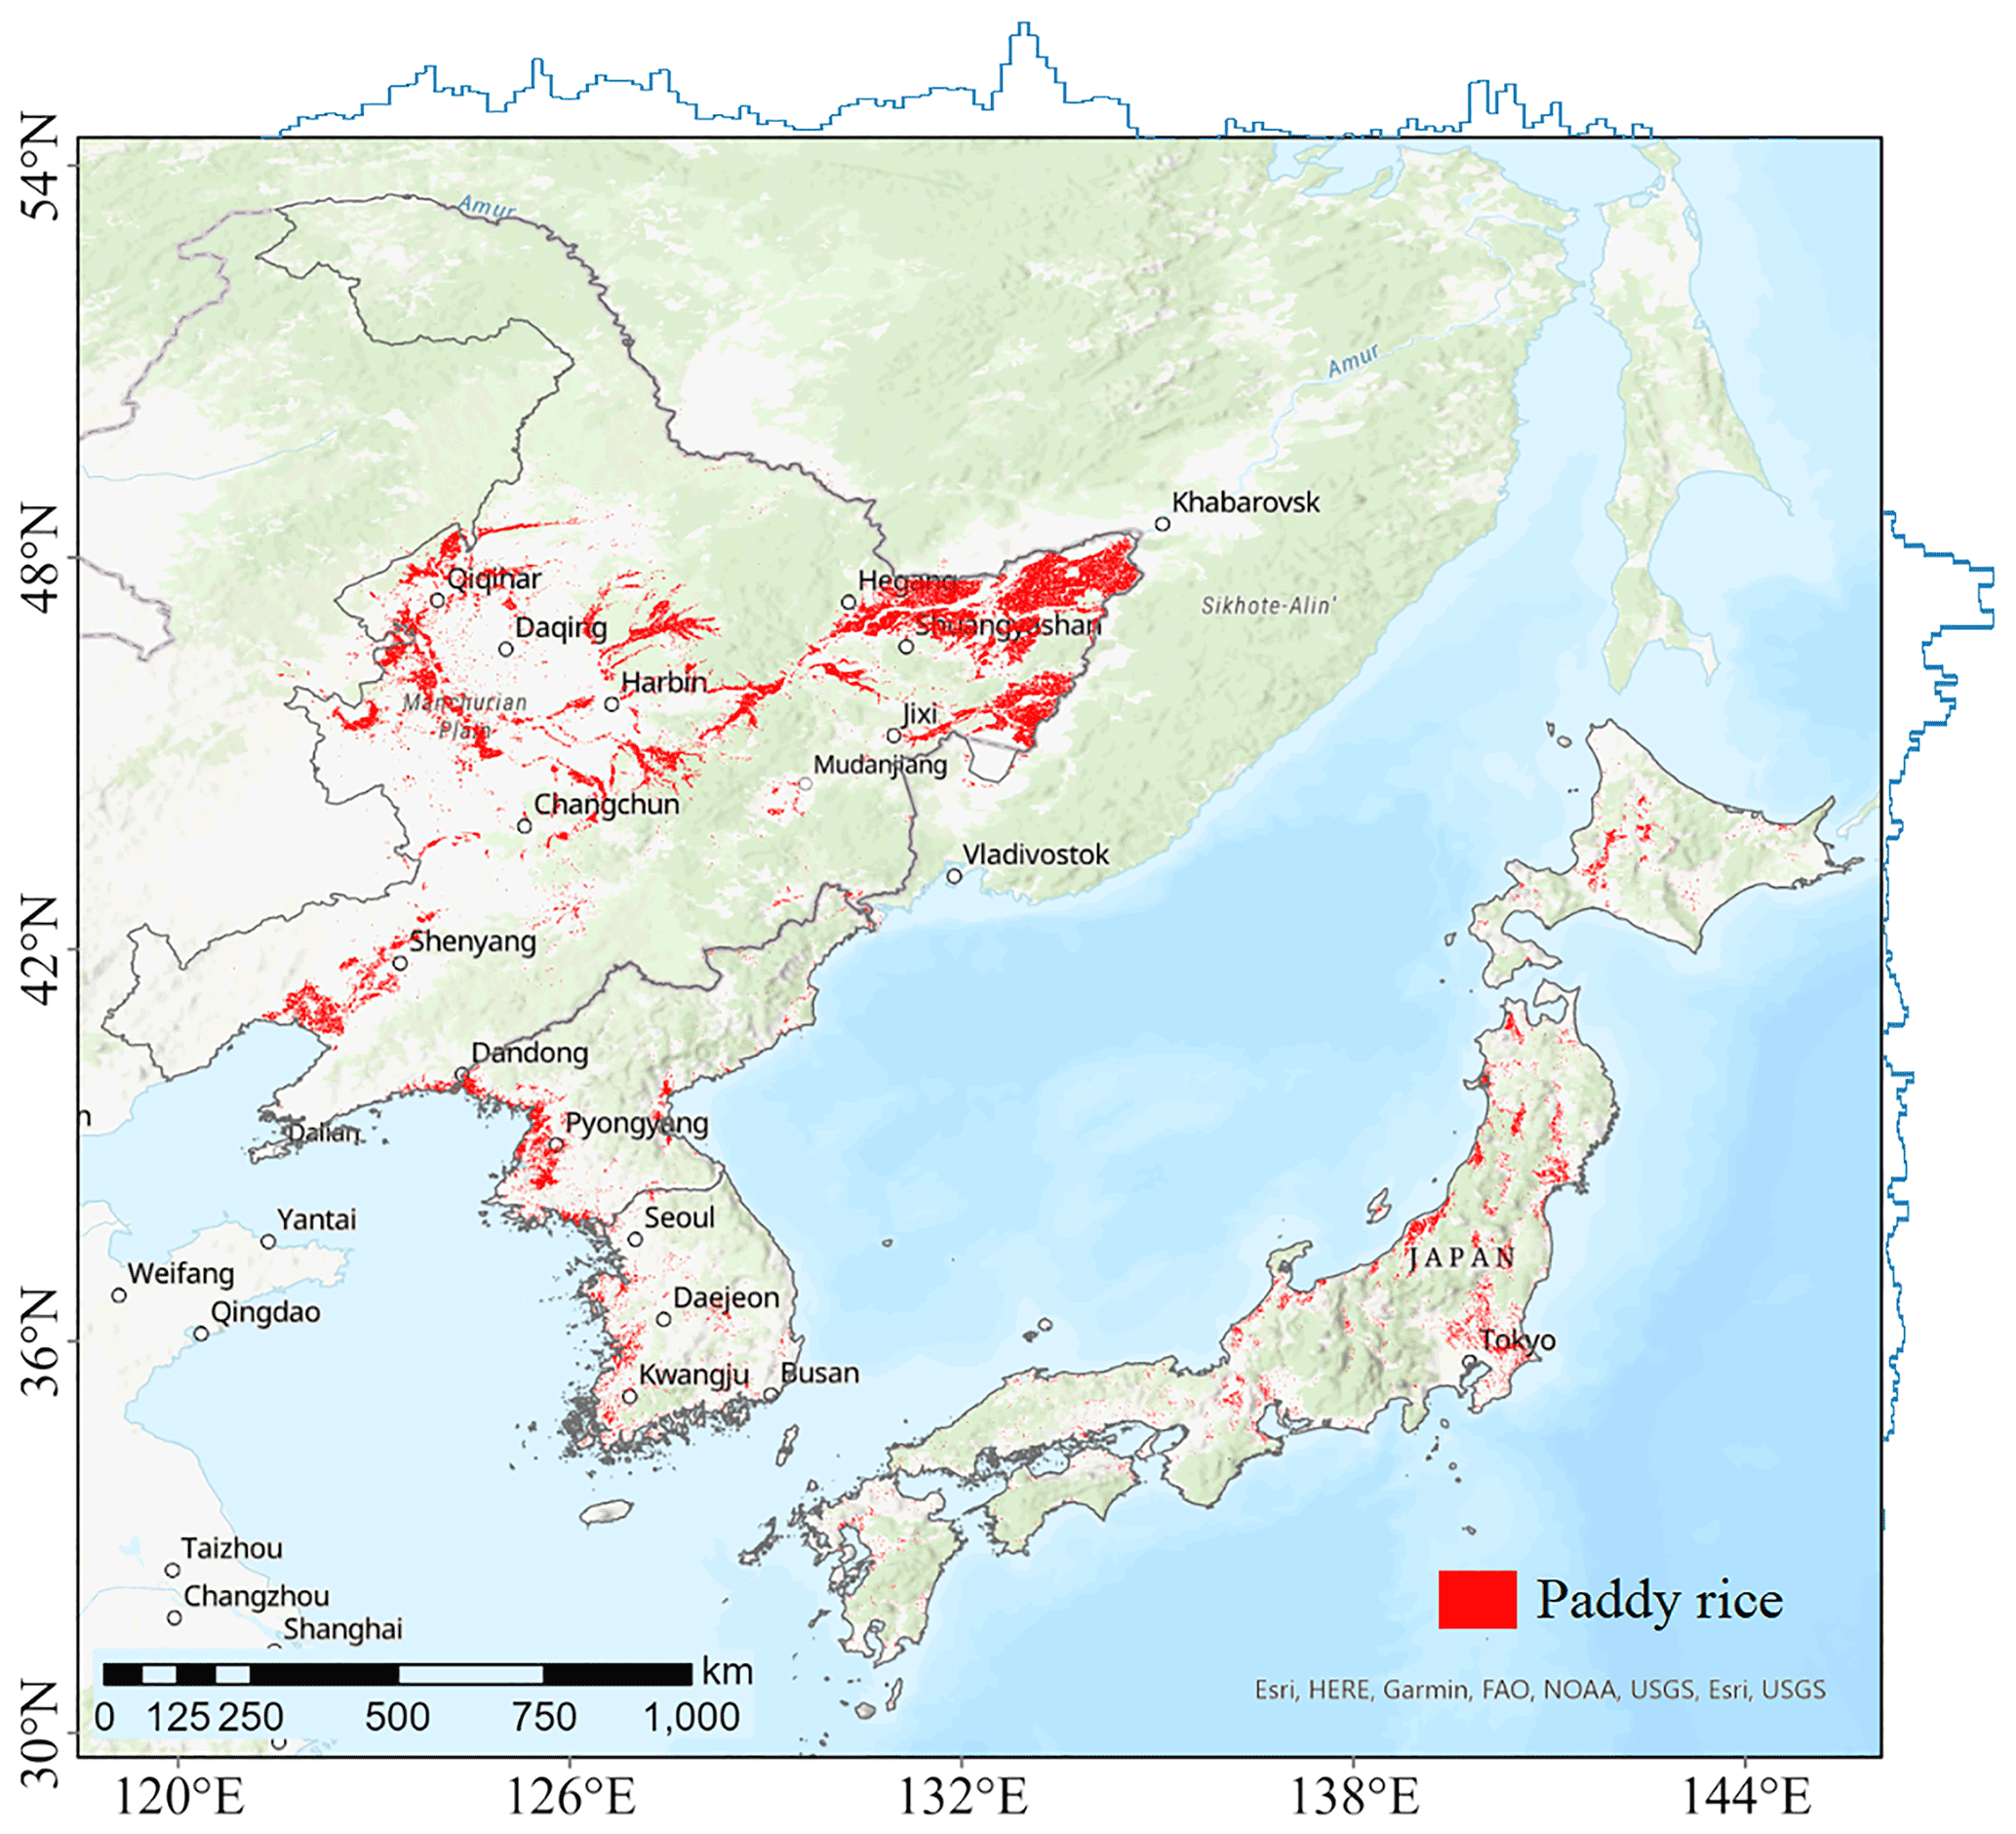
Figure 7Spatial distribution of classified composite paddy rice with a 10 m spatial resolution in NE Asia during 2017–2019. The curves represent the relative change rate in the distribution of the number of paddy rice pixels along the longitude and latitude gradients.
Paddy rice is generally planted in the plains and deltas of rivers in SE Asia in the latitude range from 10 to 21∘ N and the longitude range from 94 to 106∘ E (Fig. 8). For example, the Mekong Basin and Hong River delta are typical main rice-growing areas in Vietnam. Paddy rice in the Philippines is mostly grown in the northern plains and scattered in the southern Philippines. Most of the rice cultivation in Malaysia is in the northwest corner of the peninsular region.
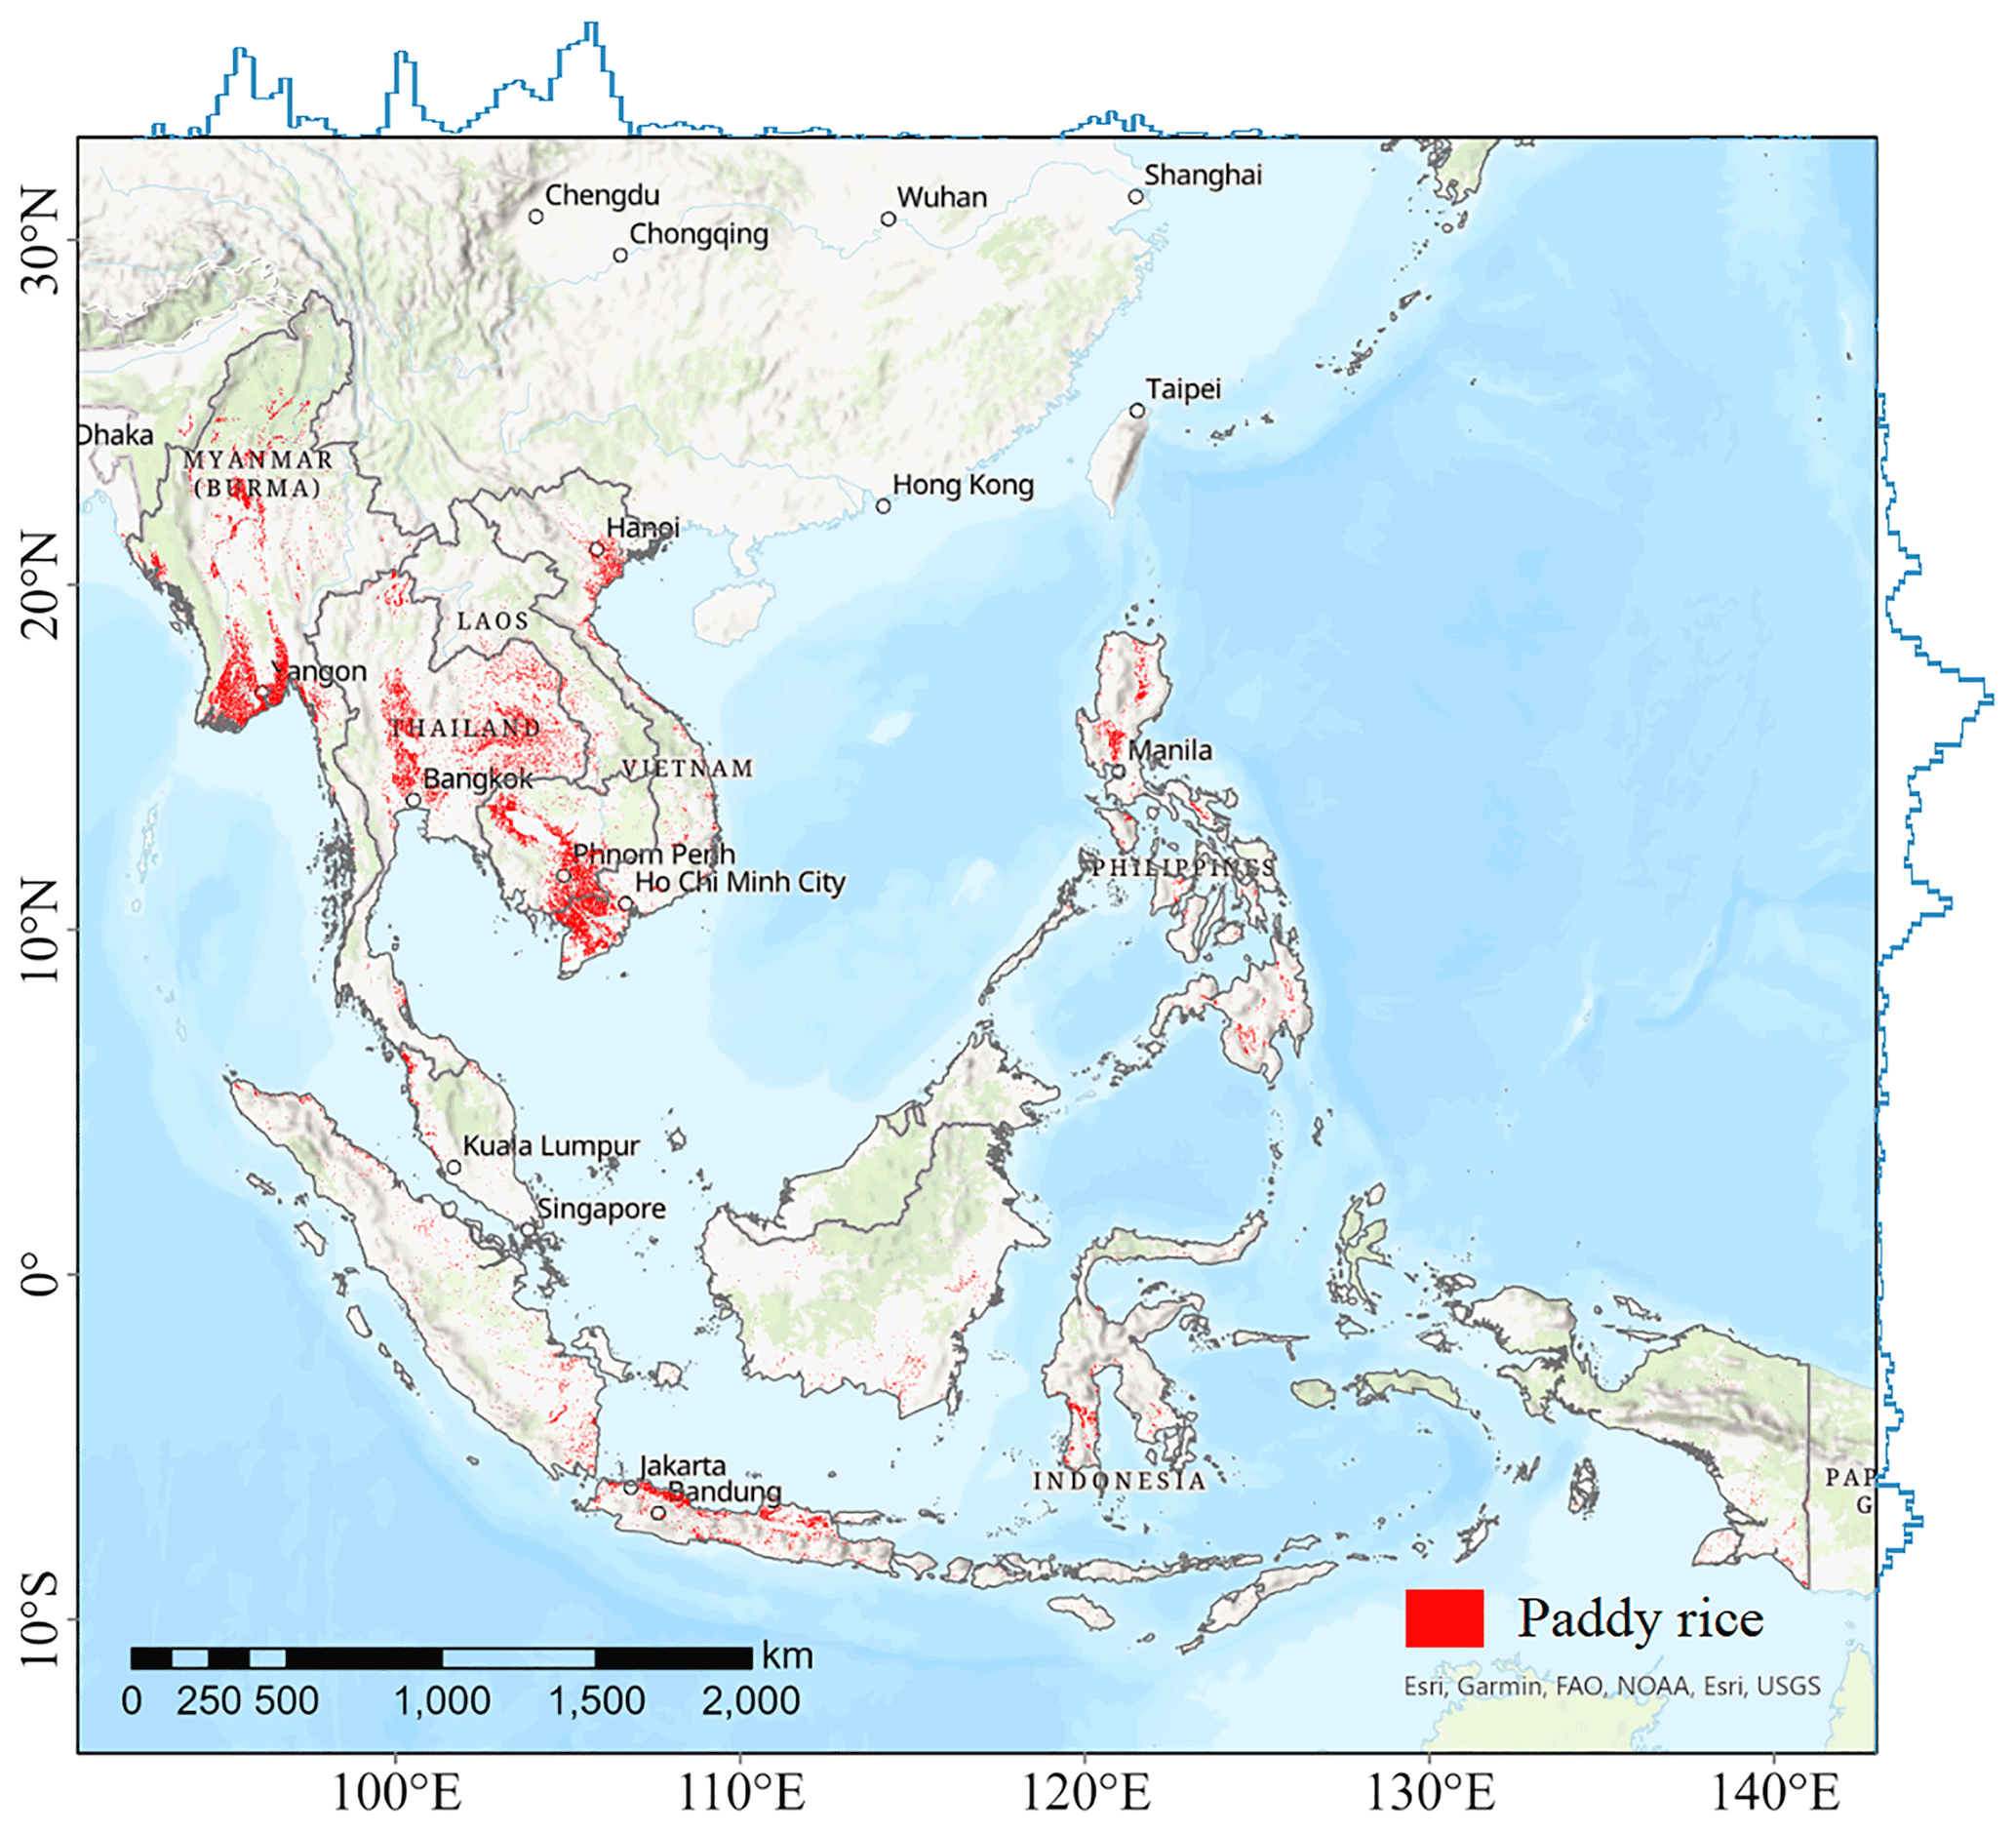
Figure 8Spatial distribution of classified composite paddy rice with 10 m spatial resolution in SE Asia during 2017–2019. The curves represent the relative change rate in the distribution of the number of paddy rice pixels along the longitude and latitude gradients.
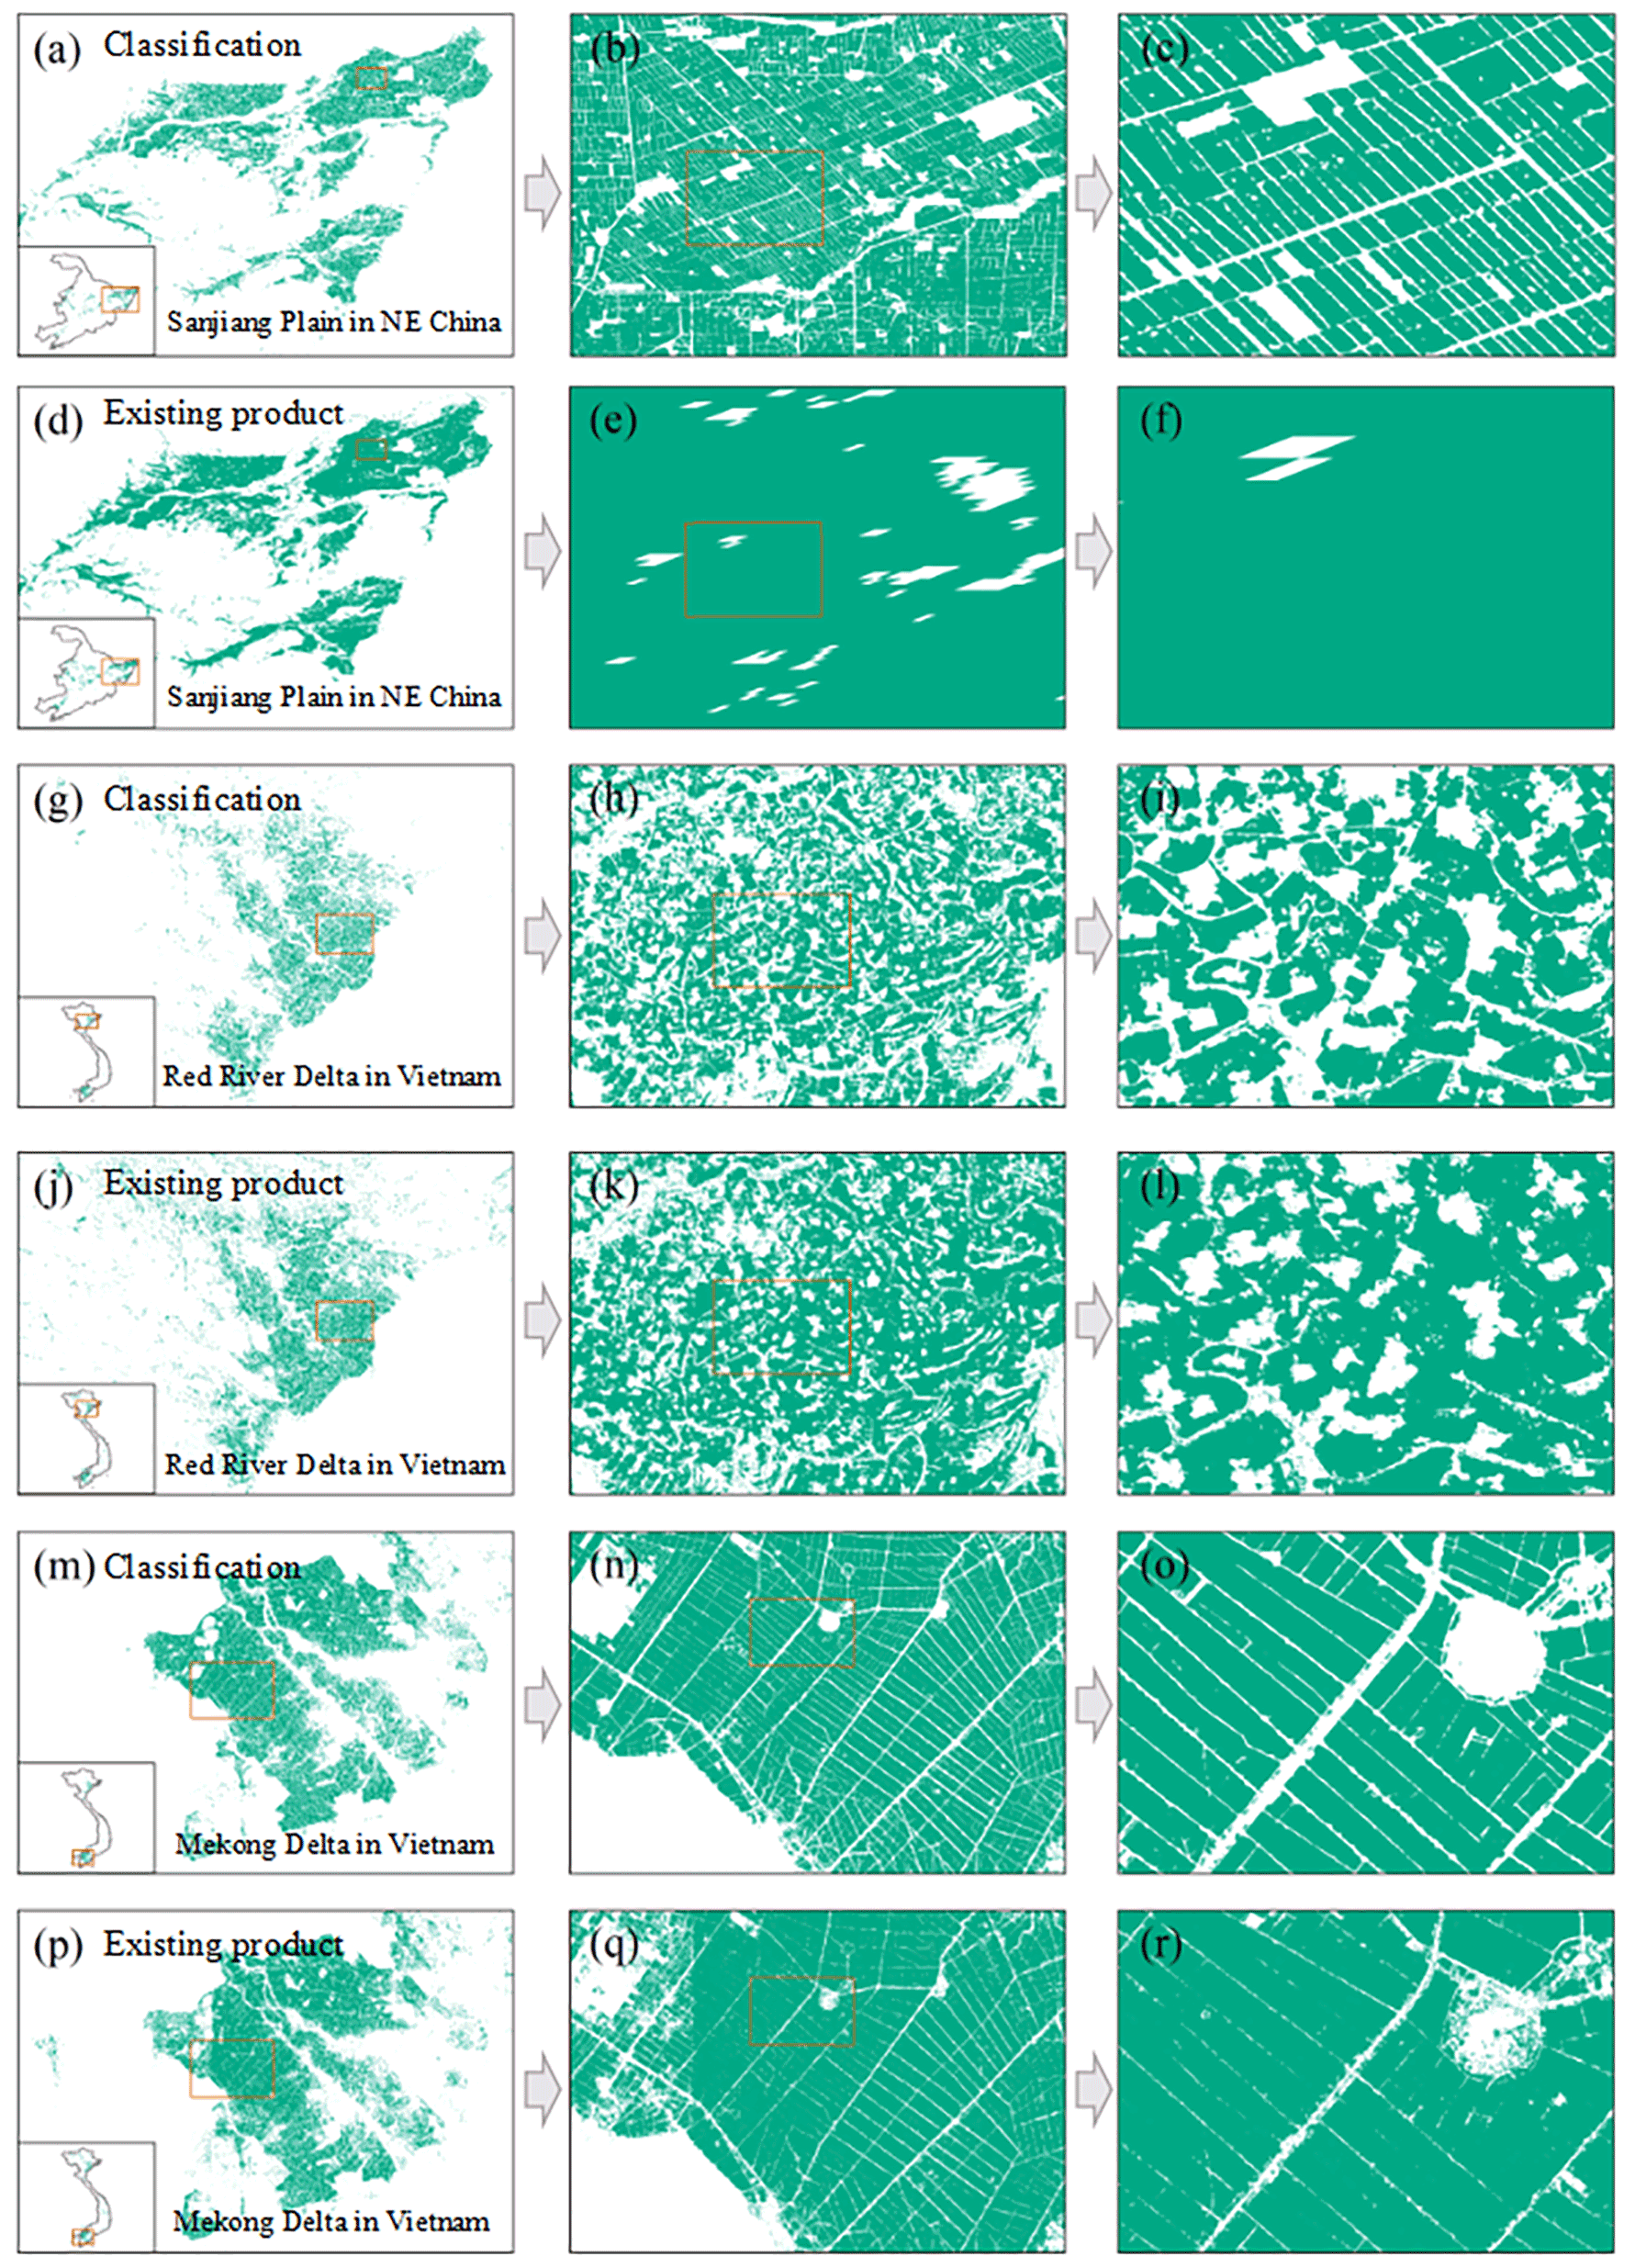
Figure 9Visual comparison of our paddy rice maps and existing products in typical regions in 2017: (a–c, g–i, m–o) classification using our method. The example data for (a, g, m) can be found at the following link: https://doi.org/10.17632/cnc3tkbwcm.1 (Han et al., 2021b); see example 01–03. (d–f) MODIS-based paddy rice fields and (j–l, p–r) JAXA-derived rice fields are also shown.
MODIS data were useful for mapping paddy rice at continental scales using combined EVI and LSWI analysis. Most paddy rice fields were fragmented in Asia (Li et al., 2020; Lowder et al., 2016). Therefore, it is difficult to solve the intra-class temporal variability of paddy rice pixels caused by the coarse resolution of 500 m (Dong et al., 2016b; Xiao et al., 2006). Mixed pixels may cause an overestimation of the rice cultivation areas (Nelson and Gumma, 2015). We improved the MODIS-based approach by incorporating Sentinel-1 data and used the approach to identify paddy rice fields in SE and NE Asia for 2017–2019. Reducing the mixed-pixel problem is the key point of the improved paddy rice mapping method. Compared with the paddy rice maps acquired from existing MODIS-based products, our classification provides more information about field details with a higher spatial resolution (10 m) (Fig. 9). Therefore, the integration of MODIS and Sentinel-1 data makes it possible to improve the accuracy of mapping paddy rice at continental scales.
Although our paddy rice maps are consistent with existing products, some uncertainty sources still affect the mapping results. First, identifying small paddy rice fields in hilly regions is challenging for MODIS data, which will lead to an underestimation of the area of paddy rice fields (Dong and Xiao, 2016; Zhang et al., 2015). For example, the rice planting area is smaller than the agricultural statistics in the mountainous provinces of the Republic of Korea (Fig. 10). The classification method relies on rice paddies containing irrigation water during transplanting stages. Therefore, rain-fed paddy rice and upland rice may not be detected because of the unavailability of flooding signals (Zhang et al., 2017). The main reason for the underestimation of the rice area in eastern Thailand may be that the flooding signal of rice was not detected, which has also been mentioned in previous studies (Bridhikitti and Overcamp, 2012; Guo et al., 2019; Zhang et al., 2020). Although MODIS data with a high temporal resolution was used in our method, the accuracy of rice maps is still affected by cloud contamination (Fig. 11a–b) (Dong and Xiao, 2016). Missing observations in Sentinel-1 data would lead to noteworthy omission errors (Fig. 11c–d). In addition, both the thresholds of different indicators and phenological information extracted by sample blocks may affect the accuracy of the classification (Dirgahayu and Parsa, 2019; Jeong et al., 2012; Li et al., 2020; Yeom et al., 2021). Finally, uncertainties in other land cover products used in this study may also affect the accuracy of the classification.
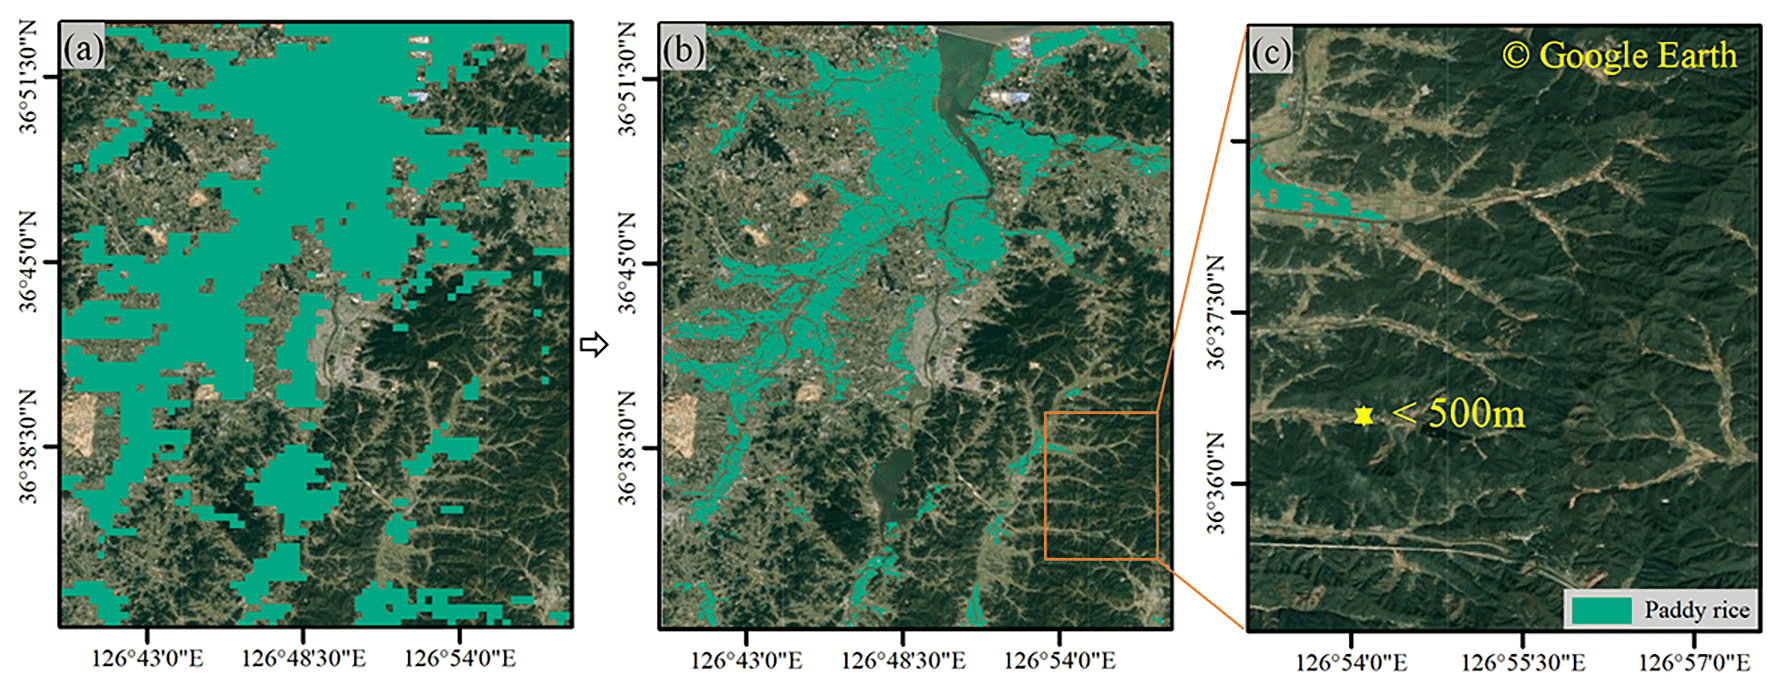
Figure 10Estimated distribution of paddy rice in 2017 in mountainous regions in South Korea: (a) flooding signal based on MODIS indices, a (b) paddy rice map generated by our method, and (c) mountainous landscapes acquired from © Google Earth.. The example data for b can be found at the following link: https://doi.org/10.17632/cnc3tkbwcm.1 (Han et al., 2021b; see example 04).
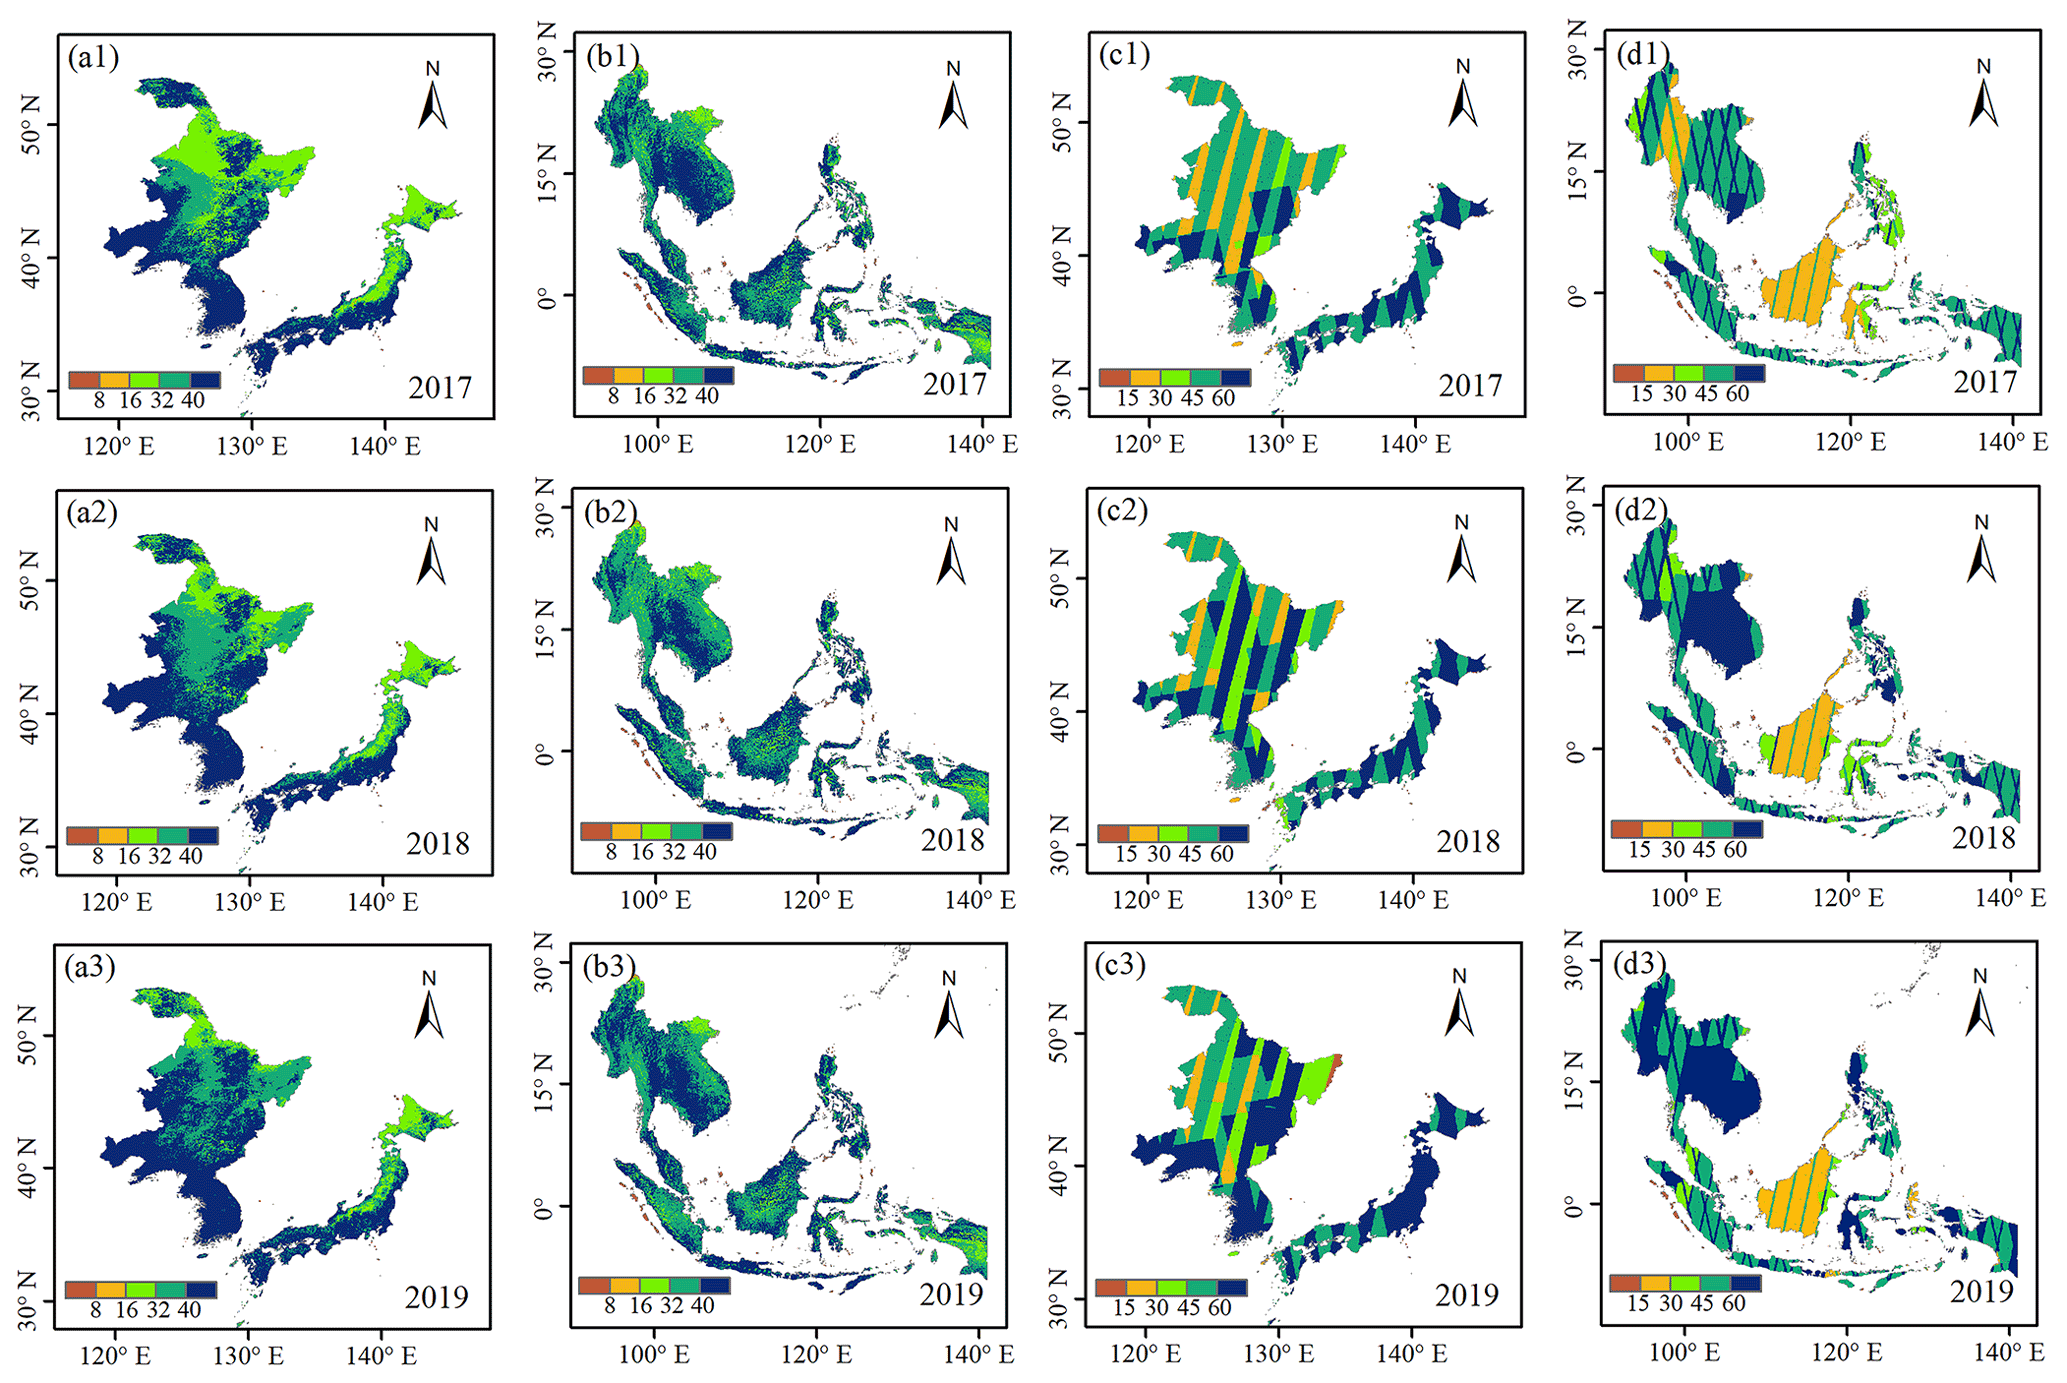
Figure 11Spatial distribution map of good-quality observation numbers during 2017 to 2019 for (a1–a3) MODIS images in Northeast Asia, (b1–b3) MODIS images in Southeast Asia, (c1–c3) Sentinel-1 images in Northeast Asia, and (d1–d3) Sentinel-1 images in Southeast Asia.
Under the combined effects of climate change and human activities, such as frequent extreme disasters, population growth, and urban expansion, knowing the spatial distribution of paddy rice is important for food security. The potential applications of the dataset include (1) improving paddy rice yield prediction accuracy, as crop masks are the basis for paddy rice yield prediction, and previous studies have demonstrated that the accuracy of crop masks affects the accuracy of yield prediction (J. Liu et al., 2019; Zhang et al., 2019); (2) assessing damage to agriculture from extreme hazards as floods are one of the major natural disasters in Southeast Asia, and high-resolution paddy rice maps will improve the accuracy of the area and yield loss estimates for flooded farmland (Phan et al., 2019); and (3) estimating greenhouse-relevant methane emissions. Paddy rice is an important source of methane in the atmosphere (Redeker et al., 2000). Accurate paddy rice maps and crop intensity maps facilitate the estimation of methane emissions (Zhang et al., 2020). In addition, paddy maps are helpful in making land-use decisions for the government.
Recently, as more Sentinel-2 images with higher resolutions have become available, combining Sentinel-2 and other satellite images have improved the temporal resolution of the data. For example, the Harmonized Landsat and Sentinel-2 (HLS) project provide images with 2–3 d at 30 m spatial resolution by combining Landsat 8 satellite and Sentinel-2 satellite data (https://hls.gsfc.nasa.gov/, last access: 5 November 2021). Zhang et al. (2021) mapped the global cropping intensity with a high spatial resolution by integrating the Sentinel-2, Landsat 8, and MODIS satellites. Therefore, combining multi-source remote sensing data provides opportunities for global rice mapping in the future. In addition, the increasing number of Planet satellite images at higher resolutions (3–5 m) could further improve the accuracy of the paddy rice map in the future (https://www.planet.com/, last access: 5 November 2021). To further improve the accuracy of paddy rice map products, more accurate information on cropland and forest masks and crop calendars will need to be developed in the future.
The datasets of the paddy rice maps for SE and NE Asia from 2017 to 2019 are available on a public repository. A small example of the data can be found at the following DOI: https://doi.org/10.17632/cnc3tkbwcm.1 (Han et al., 2021b). The full product with 5∘ per grid cell can be downloaded from the following DOI: https://doi.org/10.5281/zenodo.5645344 (Han et al., 2021a). The spatial reference system of the datasets is EPSG:4326. We encourage users to validate this dataset independently. Please note that some small islands are not classified, and thus data for these areas are not available.
We constructed a paddy rice map database for SE and NE Asia for 3 years (2017–2019) at a 10 m spatial resolution (NESEA-Rice10) by integrating MODIS and Sentinel-1 data. The paddy rice planting areas in our database were significantly correlated with those from the official statistics. The distribution of paddy rice in the maps was consistent with existing data products. Additionally, our method reduced the effects of mixed pixels and provided more detailed spatial information than MODIS-based paddy rice maps. We demonstrated that multi-sensor data integration has the advantages of improving the spatial resolution of rice maps and reducing mixed pixels. To summarize, we provided more accurate paddy rice maps at continental scales using the improved method for paddy rice mapping.
The supplement related to this article is available online at: https://doi.org/10.5194/essd-13-5969-2021-supplement.
ZZ and JH designed the study. JH, YL, and JC collected datasets. JH and YL implemented the research. JH, ZZ, YL, and JC wrote the original manuscript. JH, ZZ, YL, JC, LZ, FC, HZ, FT, and JZ revised the manuscript.
The contact author has declared that neither they nor their co-authors have any competing interests.
Publisher's note: Copernicus Publications remains neutral with regard to jurisdictional claims in published maps and institutional affiliations.
We thank the editors and anonymous reviewers for their valuable comments. We thank Maxine Garcia from Liwen Bianji (Edanz) (https://www.liwenbianji.cn/, last access: 23 August 2021) for editing the English text of a draft of this manuscript.
This research has been supported by the National Natural Science Foundation of China (grant no. 42061144003).
This paper was edited by David Carlson and reviewed by two anonymous referees.
Bazzi, H., Baghdadi, N., El Hajj, M., Zribi, M., Minh, D. H. T., Ndikumana, E., Courault, D., and Belhouchette, H.: Mapping paddy rice using Sentinel-1 SAR time series in Camargue, France, Remote Sens., 11, 887, https://doi.org/10.3390/rs11070887, 2019.
Bouvet, A. and Le Toan, T.: Use of ENVISAT/ASAR wide-swath data for timely rice fields mapping in the Mekong River Delta, Remote Sens. Environ., 115, 1090–1101, https://doi.org/10.1016/j.rse.2010.12.014, 2011.
Bridhikitti, A. and Overcamp, T. J.: Estimation of Southeast Asian rice paddy areas with different ecosystems from moderate-resolution satellite imagery, Agr. Ecosyst. Environ., 146, 113–120, https://doi.org/10.1016/j.agee.2011.10.016, 2012.
Chen, C. F., Son, N. T., and Chang, L. Y.: Monitoring of rice cropping intensity in the upper Mekong Delta, Vietnam using time-series MODIS data, Adv. Space Res., 49, 292–301, https://doi.org/10.1016/j.asr.2011.09.011, 2012.
Chen, J., Chen, J., Liao, A., Cao, X., Chen, L., Chen, X., He, C., Han, G., Peng, S., and Lu, M.: Global land cover mapping at 30 m resolution: A POK-based operational approach, ISPRS J. Photogramm., 103, 7–27, https://doi.org/10.1016/j.isprsjprs.2014.09.002, 2015.
Clauss, K., Yan, H., and Kuenzer, C.: Mapping paddy rice in China in 2002, 2005, 2010 and 2014 with MODIS time series, Remote Sens., 8, 434, https://doi.org/10.3390/rs8050434, 2016.
Clauss, K., Ottinger, M., Leinenkugel, P., and Kuenzer, C.: Estimating rice production in the Mekong Delta, Vietnam, utilizing time series of Sentinel-1 SAR data, Int. J. Appl. Earth Obs., 73, 574–585, https://doi.org/10.1016/j.jag.2018.07.022, 2018a.
Clauss, K., Ottinger, M., and Künzer, C.: Mapping rice areas with Sentinel-1 time series and superpixel segmentation, Int. J. Remote Sens., 39, 1399–1420, https://doi.org/10.1080/01431161.2017.1404162, 2018b.
Dineshkumar, C., Kumar, J. S., and Nitheshnirmal, S.: Rice Monitoring Using Sentinel-1 Data in the Google Earth Engine Platform, Proceedings, 24, 4, https://doi.org/10.3390/IECG2019-06206, 2019.
Dirgahayu, D. and Parsa, I. M.: Detection Phase Growth of Paddy Crop Using SAR Sentinel-1 Data, IOP Conf. Ser.: Earth Environ. Sci., 280, 012020, https://doi.org/10.1088/1755-1315/280/1/012020, 2019.
Dong, J. and Xiao, X.: Evolution of regional to global paddy rice mapping methods: A review, ISPRS J. Photogramm., 119, 214–227, https://doi.org/10.1016/j.isprsjprs.2016.05.010, 2016.
Dong, J., Xiao, X., Kou, W., Qin, Y., Zhang, G., Li, L., Jin, C., Zhou, Y., Wang, J., Biradar, C., Liu, J., and Moore, B.: Tracking the dynamics of paddy rice planting area in 1986–2010 through time series Landsat images and phenology-based algorithms, Remote Sens. Environ., 160, 99–113, https://doi.org/10.1016/j.rse.2015.01.004, 2015.
Dong, J., Xiao, X., Menarguez, M. A., Zhang, G., Qin, Y., Thau, D., Biradar, C., and Moore, B.: Mapping paddy rice planting area in northeastern Asia with Landsat 8 images, phenology-based algorithm and Google Earth Engine, Remote Sens. Environ., 185, 142–154, https://doi.org/10.1016/j.rse.2016.02.016, 2016a.
Dong, J., Xiao, X., Zhang, G., Menarguez, M., Choi, C., Qin, Y., Luo, P., Zhang, Y., and Moore, B.: Northward expansion of paddy rice in northeastern Asia during 2000–2014, Geophys. Res. Lett., 43, 3754–3761, https://doi.org/10.1002/2016GL068191, 2016b.
Ehhalt, D., Prather, M., Dentener, F., Derwent, R., Dlugokencky, E. J., Holland, E., Isaksen, I., Katima, J., Kirchhoff, V., and Matson, P.: Atmospheric chemistry and greenhouse gases, Climate Change 2001: The Scientific Basis. Contribution of Working Group I to the Third Assessment Report of the Intergovernmental Panel on Climate Change, Pacific Northwest National Lab. (PNNL), Richland, WA, US, Cambridge University Press, 4, 239–287, 2001.
Fikriyah, V. N., Darvishzadeh, R., Laborte, A., Khan, N. I., and Nelson, A.: Discriminating transplanted and direct seeded rice using Sentinel-1 intensity data, Int. J. Appl. Earth Obs., 76, 143–153, https://doi.org/10.1016/j.jag.2018.11.007, 2019.
Gumma, M. K., Thenkabail, P. S., Maunahan, A., Islam, S., and Nelson, A.: Mapping seasonal rice cropland extent and area in the high cropping intensity environment of Bangladesh using MODIS 500 m data for the year 2010, ISPRS J. Photogramm., 91, 98–113, https://doi.org/10.1016/j.isprsjprs.2014.02.007, 2014.
Guo, Y., Jia, X., Paull, D., and Benediktsson, J. A.: Nomination-favoured opinion pool for optical-SAR-synergistic rice mapping in face of weakened flooding signals, ISPRS J. Photogramm., 155, 187–205, https://doi.org/10.1016/j.isprsjprs.2019.07.008, 2019.
Han, J., Zhang, Z., Luo, Y., Cao, J., Zhang, L., Cheng, F., Zhang, H., and Zhang, J.: NESEA-Rice10: high-resolution annual paddy rice maps for Northeast and Southeast Asia from 2017 to 2019, Zenodo [data set], https://doi.org/10.5281/zenodo.5645344, 2021a.
Han, J., Zhang, Z., Luo, Y., Cao, J., Zhang, L., Cheng, F., Zhuang, H., and Zhang, J.: AsiaRiceMap10m Example data, V1, Mendeley Data [data set], https://doi.org/10.17632/cnc3tkbwcm.1, 2021b.
Han, J., Zhang, Z., Luo, Y., Cao, J., Zhang, L., Zhang, J., and Li, Z.: The RapeseedMap10 database: annual maps of rapeseed at a spatial resolution of 10 m based on multi-source data, Earth Syst. Sci. Data, 13, 2857–2874, https://doi.org/10.5194/essd-13-2857-2021, 2021c.
Hashimoto, S., Tadono, T., Onosato, M., Hori, M., and Shiomi, K.: A new method to derive precise land-use and land-cover maps using multi-temporal optical data, Journal of The Remote Sensing Society of Japan, 34, 102–112, https://doi.org/10.11440/rssj.34.102, 2014.
Huang, X., Reba, M., Coffin, A., Runkle, B. R., Huang, Y., Chapman, B., Ziniti, B., Skakun, S., Kraatz, S., and Siqueira, P.: Cropland mapping with L-band UAVSAR and development of NISAR products, Remote Sens. Environ., 253, 112180, https://doi.org/10.1016/j.rse.2020.112180, 2021.
Huke, R. E. and Huke, E. H.: Rice area by type of culture: South, Southeast, and East Asia. A review and updated data base, IRRI, Manila, ISBN 9712200922, 1997.
Inoue, S., Ito, A., and Yonezawa, C.: Mapping Paddy fields in Japan by using a Sentinel-1 SAR time series supplemented by Sentinel-2 images on Google Earth Engine, Remote Sens., 12, 1622, https://doi.org/10.3390/rs12101622, 2020.
Jeong, S., Kang, S., Jang, K., Lee, H., Hong, S., and Ko, D.: Development of Variable Threshold Models for detection of irrigated paddy rice fields and irrigation timing in heterogeneous land cover, Agr. Water Manage., 115, 83–91, https://doi.org/10.1016/j.agwat.2012.08.012, 2012.
Kontgis, C., Schneider, A., and Ozdogan, M.: Mapping rice paddy extent and intensification in the Vietnamese Mekong River Delta with dense time stacks of Landsat data, Remote Sens. Environ., 169, 255–269, https://doi.org/10.1016/j.rse.2015.08.004, 2015.
Laborte, A. G., Gutierrez, M. A., Balanza, J. G., Saito, K., Zwart, S. J., Boschetti, M., Murty, M. V. R., Villano, L., Aunario, J. K., and Reinke, R.: RiceAtlas, a spatial database of global rice calendars and production, Scientific Data, 4, 170074, https://doi.org/10.1038/sdata.2017.74, 2017.
Li, H., Fu, D., Huang, C., Su, F., Liu, Q., Liu, G., and Wu, S.: An Approach to High-Resolution Rice Paddy Mapping Using Time-Series Sentinel-1 SAR Data in the Mun River Basin, Thailand, Remote Sens., 12, 3959, https://doi.org/10.3390/rs12233959, 2020.
Liu, C., Zhang, Q., Tao, S., Qi, J., Ding, M., Guan, Q., Wu, B., Zhang, M., Nabil, M., and Tian, F.: A new framework to map fine resolution cropping intensity across the globe: Algorithm, validation, and implication, Remote Sens. Environ., 251, 112095, https://doi.org/10.1016/j.rse.2020.112095, 2020.
Liu, J., Shang, J., Qian, B., Huffman, T., Zhang, Y., Dong, T., Jing, Q., and Martin, T.: Crop Yield Estimation Using Time-Series MODIS Data and the Effects of Cropland Masks in Ontario, Canada, Remote Sens., 11, 2419, https://doi.org/10.3390/rs11202419, 2019.
Liu, L., Xiao, X., Qin, Y., Wang, J., Xu, X., Hu, Y., and Qiao, Z.: Mapping cropping intensity in China using time series Landsat and Sentinel-2 images and Google Earth Engine, Remote Sens. Environ., 239, 111624, https://doi.org/10.1016/j.rse.2019.111624, 2020.
Liu, Z., Hu, Q., Tan, J., and Zou, J.: Regional scale mapping of fractional rice cropping change using a phenology-based temporal mixture analysis, Int. J. Remote Sens., 40, 2703–2716, https://doi.org/10.1080/01431161.2018.1530812, 2019.
Lowder, S. K., Skoet, J., and Raney, T.: The Number, Size, and Distribution of Farms, Smallholder Farms, and Family Farms Worldwide, World Dev., 87, 16–29, https://doi.org/10.1016/j.worlddev.2015.10.041, 2016.
Luo, Y., Zhang, Z., Chen, Y., Li, Z., and Tao, F.: ChinaCropPhen1km: a high-resolution crop phenological dataset for three staple crops in China during 2000–2015 based on leaf area index (LAI) products, Earth Syst. Sci. Data, 12, 197–214, https://doi.org/10.5194/essd-12-197-2020, 2020a.
Luo, Y., Zhang, Z., Li, Z., Chen, Y., Zhang, L., Cao, J., and Tao, F.: Identifying the spatiotemporal changes of annual harvesting areas for three staple crops in China by integrating multi-data sources, Environ. Res. Lett., 15, 074003, https://doi.org/10.1088/1748-9326/ab80f0, 2020b.
Maclean, J., Hardy, B., and Hettel, G.: Rice Almanac: Source book for one of the most important economic activities on earth, IRRI, Los Baños, Philippines, https://doi.org/10.1079/9780851996363.0000, 2013.
Minasny, B., Shah, R. M., Che Soh, N., Arif, C., and Indra Setiawan, B.: Automated near-real-time mapping and monitoring of rice extent, cropping patterns, and growth stages in Southeast Asia using Sentinel-1 time series on a Google Earth Engine platform, Remote Sens., 11, 1666, https://doi.org/10.3390/rs11141666, 2019.
Minh, H. V. T., Avtar, R., Mohan, G., Misra, P., and Kurasaki, M.: Monitoring and mapping of rice cropping pattern in flooding area in the Vietnamese Mekong Delta using Sentinel-1A data: a case of an Giang Province, ISPRS Int. J. Geo-Inf., 8, 211, https://doi.org/10.3390/ijgi8050211, 2019.
Mullissa, A., Vollrath, A., Odongo-Braun, C., Slagter, B., Balling, J., Gou, Y., Gorelick, N., and Reiche, J.: Sentinel-1 SAR Backscatter Analysis Ready Data Preparation in Google Earth Engine, Remote Sens., 13, 1954, https://doi.org/10.3390/rs13101954, 2021.
Nelson, A. and Gumma, M. K.: A map of lowland rice extent in the major rice growing countries of Asia, IRRI, Los Baños, Philippines, available at: http://irri.org/our-work/research/policy-and-markets/mapping.37 (last access: 21 December 2021), 2015.
Nelson, A., Setiyono, T., Rala, A. B., Quicho, E. D., Raviz, J. V., Abonete, P. J., Maunahan, A. A., Garcia, C. A., Bhatti, H. Z. M., and Villano, L. S.: Towards an operational SAR-based rice monitoring system in Asia: Examples from 13 demonstration sites across Asia in the RIICE project, Remote Sens., 6, 10773–10812, https://doi.org/10.3390/rs61110773, 2014.
Nguyen, D. B. and Wagner, W.: European rice cropland mapping with Sentinel-1 data: The Mediterranean region case study, Water, 9, 392, https://doi.org/10.3390/w9060392, 2017.
Nguyen, D. B., Clauss, K., Cao, S., Naeimi, V., Kuenzer, C., and Wagner, W.: Mapping rice seasonality in the Mekong Delta with multi-year Envisat ASAR WSM data, Remote Sens., 7, 15868–15893, https://doi.org/10.3390/rs71215808, 2015.
Nguyen, D. B., Gruber, A., and Wagner, W.: Mapping rice extent and cropping scheme in the Mekong Delta using Sentinel-1A data, Remote Sens. Lett., 7, 1209–1218, https://doi.org/10.1080/2150704X.2016.1225172, 2016.
Oliphant, A. J., Thenkabail, P. S., Teluguntla, P., Xiong, J., Gumma, M. K., Congalton, R. G., and Yadav, K.: Mapping cropland extent of Southeast and Northeast Asia using multi-year time-series Landsat 30-m data using a random forest classifier on the Google Earth Engine Cloud, Int. J. Appl. Earth Obs., 81, 110–124, https://doi.org/10.1016/j.jag.2018.11.014, 2019.
Park, S., Im, J., Park, S., Yoo, C., Han, H., and Rhee, J.: Classification and mapping of paddy rice by combining Landsat and SAR time series data, Remote Sens., 10, 447, https://doi.org/10.3390/rs10030447, 2018.
Peng, D., Huete, A. R., Huang, J., Wang, F., and Sun, H.: Detection and estimation of mixed paddy rice cropping patterns with MODIS data, Int. J. Appl. Earth Obs., 13, 13–23, https://doi.org/10.1016/j.jag.2010.06.001, 2011.
Phan, A., Ha, D. N., Man, C. D., Nguyen, T. T., Bui, H. Q., and Nguyen, T. T. N.: Rapid assessment of flood inundation and damaged rice area in red river delta from sentinel 1A imagery, Remote Sens., 11, 2034, https://doi.org/10.3390/rs11172034, 2019.
Phung, H.-P., Nguyen, L.-D., Nguyen-Huy, T., Le-Toan, T., and Apan, A. A.: Monitoring rice growth status in the Mekong Delta, Vietnam using multitemporal Sentinel-1 data, J. Appl. Remote Sens., 14, 014518, https://doi.org/10.1117/1.JRS.14.014518, 2020.
Planque, C., Lucas, R., Punalekar, S., Chognard, S., Hurford, C., Owers, C., Horton, C., Guest, P., King, S., and Williams, S.: National crop mapping using sentinel-1 time series: A knowledge-based descriptive algorithm, Remote Sens., 13, 846, https://doi.org/10.3390/rs13050846, 2021.
Ramadhani, F., Pullanagari, R., Kereszturi, G., and Procter, J.: Automatic mapping of rice growth stages using the integration of SENTINEL-2, MOD13Q1, and SENTINEL-1, Remote Sens., 12, 3613, https://doi.org/10.3390/rs12213613, 2020.
Redeker, K. R., Wang, N.-Y., Low, J. C., McMillan, A., Tyler, S. C., and Cicerone, R. J.: Emissions of Methyl Halides and Methane from Rice Paddies, Science, 290, 966–969, https://doi.org/10.1126/science.290.5493.966, 2000.
Reuter, H. I., Nelson, A., and Jarvis, A.: An evaluation of void-filling interpolation methods for SRTM data, Int. J. Geogr. Inf. Sci., 21, 983–1008, https://doi.org/10.1080/13658810601169899, 2007.
Rose, S., Kraatz, S., Kellndorfer, J., Cosh, M. H., Torbick, N., Huang, X., and Siqueira, P.: Evaluating NISAR's cropland mapping algorithm over the conterminous United States using Sentinel-1 data, Remote Sens. Environ., 260, 112472, https://doi.org/10.1016/j.rse.2021.112472, 2021.
Sakamoto, T., Van Phung, C., Kotera, A., Nguyen, K. D., and Yokozawa, M.: Analysis of rapid expansion of inland aquaculture and triple rice-cropping areas in a coastal area of the Vietnamese Mekong Delta using MODIS time-series imagery, Landscape Urban Plan., 92, 34–46, https://doi.org/10.1016/j.landurbplan.2009.02.002, 2009.
Shao, Y., Fan, X., Liu, H., Xiao, J., Ross, S., Brisco, B., Brown, R., and Staples, G.: Rice monitoring and production estimation using multitemporal RADARSAT, Remote Sens. Environ., 76, 310–325, https://doi.org/10.1016/S0034-4257(00)00212-1, 2001.
Shew, A. M. and Ghosh, A.: Identifying dry-season rice-planting patterns in bangladesh using the Landsat archive, Remote Sens., 11, 1235, https://doi.org/10.3390/rs11101235, 2019.
Shimada, M., Itoh, T., Motooka, T., Watanabe, M., Shiraishi, T., Thapa, R., and Lucas, R.: New global forest/non-forest maps from ALOS PALSAR data (2007–2010), Remote Sens. Environ., 155, 13–31, https://doi.org/10.1016/j.rse.2014.04.014, 2014.
Singha, M., Dong, J., Zhang, G., and Xiao, X.: High resolution paddy rice maps in cloud-prone Bangladesh and Northeast India using Sentinel-1 data, Scientific Data, 6, 1–10, https://doi.org/10.1038/s41597-019-0036-3, 2019.
Suepa, T., Qi, J., Lawawirojwong, S., and Messina, J. P.: Understanding spatio-temporal variation of vegetation phenology and rainfall seasonality in the monsoon Southeast Asia, Environ. Res., 147, 621–629, https://doi.org/10.1016/j.envres.2016.02.005, 2016.
Sun, H., Huang, J., Huete, A. R., Peng, D., and Zhang, F.: Mapping paddy rice with multi-date moderate-resolution imaging spectroradiometer (MODIS) data in China, Journal of Zhejiang University-SCIENCE A, 10, 1509–1522, https://doi.org/10.1631/jzus.A0820536, 2009.
Torbick, N., Salas, W. A., Hagen, S., and Xiao, X.: Monitoring rice agriculture in the Sacramento Valley, USA with multitemporal PALSAR and MODIS imagery, IEEE J. Sel. Top. Appl., 4, 451–457, https://doi.org/10.1109/JSTARS.2010.2091493, 2010.
Torbick, N., Chowdhury, D., Salas, W., and Qi, J.: Monitoring rice agriculture across myanmar using time series Sentinel-1 assisted by Landsat-8 and PALSAR-2, Remote Sens., 9, 119, https://doi.org/10.3390/rs9020119, 2017.
Torres, R., Snoeij, P., Geudtner, D., Bibby, D., Davidson, M., Attema, E., Potin, P., Rommen, B., Floury, N., Brown, M., Traver, I. N., Deghaye, P., Duesmann, B., Rosich, B., Miranda, N., Bruno, C., L'Abbate, M., Croci, R., Pietropaolo, A., Huchler, M., and Rostan, F.: GMES Sentinel-1 mission, Remote Sens. Environ., 120, 9–24, https://doi.org/10.1016/j.rse.2011.05.028, 2012.
Vollrath, A., Mullissa, A., and Reiche, J.: Angular-based radiometric slope correction for Sentinel-1 on google earth engine, Remote Sens., 12, 1867, https://doi.org/10.3390/rs12111867, 2020.
Wakabayashi, H., Motohashi, K., Kitagami, T., Tjahjono, B., Dewayani, S., Hidayat, D., and Hongo, C.: FLOODED AREA EXTRACTION OF RICE PADDY FIELD IN INDONESIA USING SENTINEL-1 SAR DATA, Int. Arch. Photogramm. Remote Sens. Spatial Inf. Sci., XLII-3/W7, 73–76, https://doi.org/10.5194/isprs-archives-XLII-3-W7-73-2019, 2019.
Wang, J., Xiao, X., Qin, Y., Dong, J., Zhang, G., Kou, W., Jin, C., Zhou, Y., and Zhang, Y.: Mapping paddy rice planting area in wheat-rice double-cropped areas through integration of Landsat-8 OLI, MODIS, and PALSAR images, Scientific Reports, 5, 10088, https://doi.org/10.1038/srep10088, 2015.
Whelen, T. and Siqueira, P.: Coefficient of variation for use in crop area classification across multiple climates, Int. J. Appl. Earth Obs., 67, 114–122, https://doi.org/10.1016/j.jag.2017.12.014, 2018.
Xiao, X., Boles, S., Frolking, S., Li, C., Babu, J. Y., Salas, W., and Moore, B.: Mapping paddy rice agriculture in South and Southeast Asia using multi-temporal MODIS images, Remote Sens. Environ., 100, 95–113, https://doi.org/10.1016/j.rse.2005.10.004, 2006.
Xin, F., Xiao, X., Zhao, B., Miyata, A., Baldocchi, D., Knox, S., Kang, M., Shim, K., Min, S., and Chen, B.: Modeling gross primary production of paddy rice cropland through analyses of data from CO2 eddy flux tower sites and MODIS images, Remote Sens. Environ., 190, 42–55, https://doi.org/10.1016/j.rse.2016.11.025, 2017.
Xin, F., Xiao, X., Dong, J., Zhang, G., Zhang, Y., Wu, X., Li, X., Zou, Z., Ma, J., and Du, G.: Large increases of paddy rice area, gross primary production, and grain production in Northeast China during 2000–2017, Sci. Total Environ., 711, 135183, https://doi.org/10.1016/j.scitotenv.2019.135183, 2020.
Yeom, J.-M., Jeong, S., Deo, R. C., and Ko, J.: Mapping rice area and yield in northeastern asia by incorporating a crop model with dense vegetation index profiles from a geostationary satellite, GISci. Remote Sens., 58, 1–27, https://doi.org/10.1080/15481603.2020.1853352, 2021.
Yulianto, S., Arifandri, R., Alhasanah, F., Sumargana, L., and Sadmono, H.: Sentinel-1 Dual-Polarization Data Analysis to Identify Paddy Growth Stages in Indramayu District, IOP Conf. Ser.: Earth Environ. Sci., 280, 012021, https://doi.org/10.1088/1755-1315/280/1/012021, 2019.
Zhan, P., Zhu, W., and Li, N.: An automated rice mapping method based on flooding signals in synthetic aperture radar time series, Remote Sens. Environ., 252, 112112, https://doi.org/10.1016/j.rse.2020.112112, 2021.
Zhang, G., Xiao, X., Dong, J., Kou, W., Jin, C., Qin, Y., Zhou, Y., Wang, J., Menarguez, M. A., and Biradar, C.: Mapping paddy rice planting areas through time series analysis of MODIS land surface temperature and vegetation index data, ISPRS J. Photogramm., 106, 157–171, https://doi.org/10.1016/j.isprsjprs.2015.05.011, 2015.
Zhang, G., Xiao, X., Biradar, C. M., Dong, J., Qin, Y., Menarguez, M. A., Zhou, Y., Zhang, Y., Jin, C., and Wang, J.: Spatiotemporal patterns of paddy rice croplands in China and India from 2000 to 2015, Sci. Total Environ., 579, 82–92, https://doi.org/10.1016/j.scitotenv.2016.10.223, 2017.
Zhang, G., Xiao, X., Dong, J., Xin, F., Zhang, Y., Qin, Y., Doughty, R. B., and Moore, B.: Fingerprint of rice paddies in spatial–temporal dynamics of atmospheric methane concentration in monsoon Asia, Nat. Commun., 11, 1–11, https://doi.org/10.1038/s41467-019-14155-5, 2020.
Zhang, M., Wu, B., Zeng, H., He, G., Liu, C., Tao, S., Zhang, Q., Nabil, M., Tian, F., Bofana, J., Beyene, A. N., Elnashar, A., Yan, N., Wang, Z., and Liu, Y.: GCI30: a global dataset of 30 m cropping intensity using multisource remote sensing imagery, Earth Syst. Sci. Data, 13, 4799–4817, https://doi.org/10.5194/essd-13-4799-2021, 2021.
Zhang, X., Wu, B., Ponce-Campos, G. E., Zhang, M., Chang, S., and Tian, F.: Mapping up-to-date paddy rice extent at 10 m resolution in china through the integration of optical and synthetic aperture radar images, Remote Sen., 10, 1200, https://doi.org/10.3390/rs10081200, 2018.
Zhang, Y., Chipanshi, A., Daneshfar, B., Koiter, L., Champagne, C., Davidson, A., Reichert, G., and Bédard, F.: Effect of using crop specific masks on earth observation based crop yield forecasting across Canada, Remote Sensing Applications: Society and Environment, 13, 121–137, https://doi.org/10.1016/j.rsase.2018.10.002, 2019.
Zhou, Y., Xiao, X., Qin, Y., Dong, J., Zhang, G., Kou, W., Jin, C., Wang, J., and Li, X.: Mapping paddy rice planting area in rice-wetland coexistent areas through analysis of Landsat 8 OLI and MODIS images, Int. J. Appl. Earth Obs., 46, 1–12, https://doi.org/10.1016/j.jag.2015.11.001, 2016.