the Creative Commons Attribution 4.0 License.
the Creative Commons Attribution 4.0 License.
 | 21 Dec 2021
Modelling seabed sediment physical properties and organic matter content in the Firth of Clyde
Matthew C. Pace
David M. Bailey
David W. Donnan
Bhavani E. Narayanaswamy
Hazel J. Smith
Douglas C. Speirs
William R. Turrell
Michael R. Heath
High-quality quantitative maps of seabed sedimentary physical and geochemical properties have numerous research and conservation applications, including habitat and ecosystem modelling, marine spatial planning, and ecosystem service mapping. However, such maps are lacking for many ecologically and economically important marine areas. Using legacy data supplemented by measurements from recent benthic surveys, modelled hydrodynamic variables, and high-resolution bathymetry, quantitative maps for the top 10 cm of seabed sediment were generated via a combination of statistical and machine-learning techniques for the Firth of Clyde, a semi-enclosed coastal sea on the west coast of Scotland. The maps include sediment fractions of mud, sand, and gravel; whole-sediment median grain size; sediment permeability and porosity; rates of natural seabed abrasion; and sediment particulate organic carbon and nitrogen content. Properties were mapped over an unstructured grid so that very high resolutions were achieved close to the coastlines, where sediments may be expected to be spatially heterogeneous.
Overall, the maps reveal extensive areas of very low sediment permeability coupled with low rates of natural seabed disturbance. Moreover, muddy sediments in the inner Firth of Clyde, Inchmarnock Water, and the sea lochs are enriched in organic carbon and nitrogen relative to the sediments of the outer Firth of Clyde. As a demonstration of the value of these maps, the standing stock of organic carbon and nitrogen in the surficial sediments of the Clyde was calculated. The Clyde stores 3.42 and 0.33 million t of organic carbon and nitrogen in the top 10 cm of seabed sediment, respectively, substantially contributing to Scotland's coastal and shelf blue carbon stocks. Data products are available from https://doi.org/10.15129/2003faa2-ee93-4c11-bb16-48485f5f136d (Heath and Pace, 2021).
- Article
(7281 KB) - Full-text XML
-
Supplement
(9790 KB) - BibTeX
- EndNote


Seabed surficial sediment properties are a defining feature of shelf-sea ecosystems, determining organic matter storage, nutrient recycling and contaminant degradation, turbidity, and habitat availability for and productivity of benthos and fish (Ehrenhauss et al., 2004; Janssen et al., 2005; Kamann et al., 2007; Neumann et al., 2017b; Serpetti et al., 2016). Maps of sediment properties are therefore important for marine planning and conservation (e.g. Schiele et al., 2015) and assessments of marine service provision (Cowling et al., 2008; Townsend et al., 2014), especially in coastal waters, where anthropogenic disturbance is often greatest (Eigaard et al., 2017), and sediments can be extremely heterogeneous (Serpetti et al., 2011). However, maps of adequate resolution are lacking for many regions.
For many decades the standard procedure for characterising seabed sediment samples involved sieving through standard meshes to separate fractions designated mud (sometimes divided into silt and clay), sand, and gravel. The proportions by weight of these fractions were then used to classify the sediment usually according to either the Wentworth or Folk scheme (Folk, 1954; Wentworth, 1922). In reality the grain size boundaries between these three fractions are arbitrary, the classification schemes themselves are a compromise between simplicity and detail, and they were originally designed for specific purposes. For example the Folk scheme was designed to resolve the importance of transport on sediment grain distributions (Valentine, 2019).
Recent seabed sediment samples are often analysed by laser diffraction instruments, which provide a finely resolved size distribution of grain sizes based on particle volume. Summary measurements of sediment properties from these instruments are typically reported on a continuous scale rather than by class, e.g. median grain size, skewness, kurtosis. These properties can be related to other more-difficult-to-measure features such as porosity, permeability, and organic matter content. However, it is often the case that laser size distributions are aggregated to the traditional mud, sand, and gravel size classes so that sediments can be classified according to the traditional Folk or Wentworth schemes or similar (e.g. Lepland et al., 2014), and the continuous variable data are not reported. Note however that there may not be a simple 1:1 relationship between laser size classes and sieve-based classes (Fisher et al., 2017; Wilson et al., 2018).
Most seabed sediment maps display classification data, e.g. https://www.bgs.ac.uk/data/services/offprodwms.html (last access: 24 July 2020), http://www.mareano.no/kart/mareano_en.html?language=en (last access: 24 July 2020). The reason is that for the main part they rely on sample data accumulated over many decades, most of which is class-based. However, classification maps have a number of limitations. In particular, they are not easily scalable to finer resolution. For example the EMODnet seabed habitat classification map is gridded at a resolution of approximately 100 m (https://www.emodnet-seabedhabitats.eu/, last access: 24 July 2020), but the sediment class descriptors are so broad that areas of shelf and coastal seabed are portrayed as homogeneous at scales of tens of kilometres. In reality, there may be important heterogeneity in whole-sediment grain size compositions which cannot be resolved by the classification scheme.
Misiuk et al. (2019) compared and contrasted categorical and continuous variable approaches to mapping seabed sediments and for one particular case study found that both had a similar performance. However, while this may be true generally, it remains the case that it is extremely difficult to meaningfully recover whole-sediment continuous properties such as median grain size or mud content from class-based data. These properties are the key to imputing other hard-to-measure variables such as carbon content or permeability, based on statistical relationships developed from more limited sampling. Several authors have attempted to extract estimates of such variables from categorical data (Burrows et al., 2014; Smeaton et al., 2020), but this approach may lead to over- or under-predictions, especially for properties like permeability which vary by several orders of magnitude within a single grain size class (Serpetti et al., 2016).
Sediment carbon inventories are a case in point with regard to class-based data. Smeaton et al. (2020) estimated the marine sedimentary carbon stock in Scottish shelf seas from the British Geological Survey 1:25 000 seabed sediment classification but resorted to assigning a mean carbon content to each class based on statistical summaries by Diesing et al. (2017) for samples collected only in the North Sea and integrating the areas of each sediment class. Diesing et al. (2017) were the first to apply random forest algorithms (Breiman, 2001) to the prediction of sediment organic carbon content, relying on categorical Folk sediment classes to extrapolate predictions and estimate carbon stocks within the NW European shelf. More recently, Smeaton et al. (2021) combined geostatistical models and sedimentary carbon statistical summaries to map carbon stocks across the UK Exclusive Economic Zone (EEZ). Their approach leveraged a large volume of available marine data and delineated characteristic sedimentary organic carbon content differences in coastal and offshore areas yet retained a dependence on mapping to sediment classes. In contrast, using methods similar to Stephens and Diesing (2015), Wilson et al. (2018) used random forest algorithms to generate synthetic maps of sediment carbon content across the whole NW European shelf by blending interpolated and predicted maps (0.125∘ resolution – approximately 10 km). Interpolation was confined to the alphahull – a convex shape defined around a set of raw samples assembled from international databases within which sample density exceeded a given threshold. Outside this hull the distributions were predicted by a random forest with inputs of bathymetric and hydrodynamic data.
Wilson et al. (2018) also used the random forest approach to map mud, sand, and gravel compositions; porosity; permeability; and the probability of encountering exposed bedrock. Mitchell et al. (2019) used a similar approach to modelling mud, sand, and gravel composition at higher spatial resolution (approximately 0.2 km). Data products from studies such as these have proved to be extremely valuable and have been used in a range of different applications including biodiversity–ecosystem functioning relationships (Maureaud et al., 2019), benthic community sensitivity to trawling disturbance (Rijnsdorp et al., 2018), and the economic cost of disrupting sedimentary carbon storage (Avelar et al., 2017; Luisetti et al., 2019, 2020).
Here, the approach taken by Wilson et al. (2018) was followed and applied at very high spatial resolution (down to 50 m) in a semi-enclosed coastal sea (Firth of Clyde, SW Scotland) where there are strong gradients of bathymetry, tidally dominated hydrodynamics, and sediment properties. The Firth of Clyde and associated sea lochs feature several deep post-glacial basins lined with very fine, organic-rich mud which has been heavily impacted by trawling (McIntyre et al., 2012). To date, sediments in the Clyde have only been mapped at a coarse resolution or as part of larger continental shelf mapping exercises (e.g. Diesing et al., 2017; Mitchell et al., 2019; Smeaton et al., 2021; Wilson et al., 2018). In the following sections, the compilation of legacy data and the collection of additional field samples and their laboratory analysis are first reported. Subsequently, statistical modelling methods used to generate the maps from the source data and the subsequent validation of these data products are described. Finally, an application of these data products to calculate the standing stock of organic carbon and nitrogen in the surficial sediment of the Firth of Clyde is presented and the implications for future research discussed.
2.1 Study area
The scope of this study is the generation of high-resolution full-coverage maps for sediment fractions of mud, sand, and gravel; whole-sediment median grain size; sediment permeability and porosity; rates of natural seabed abrasion; and sediment particulate organic carbon and nitrogen content in the Firth of Clyde. The Firth of Clyde is situated on the west coast of Scotland and covers an area of approximately 3600 km2 (Fig. 1).
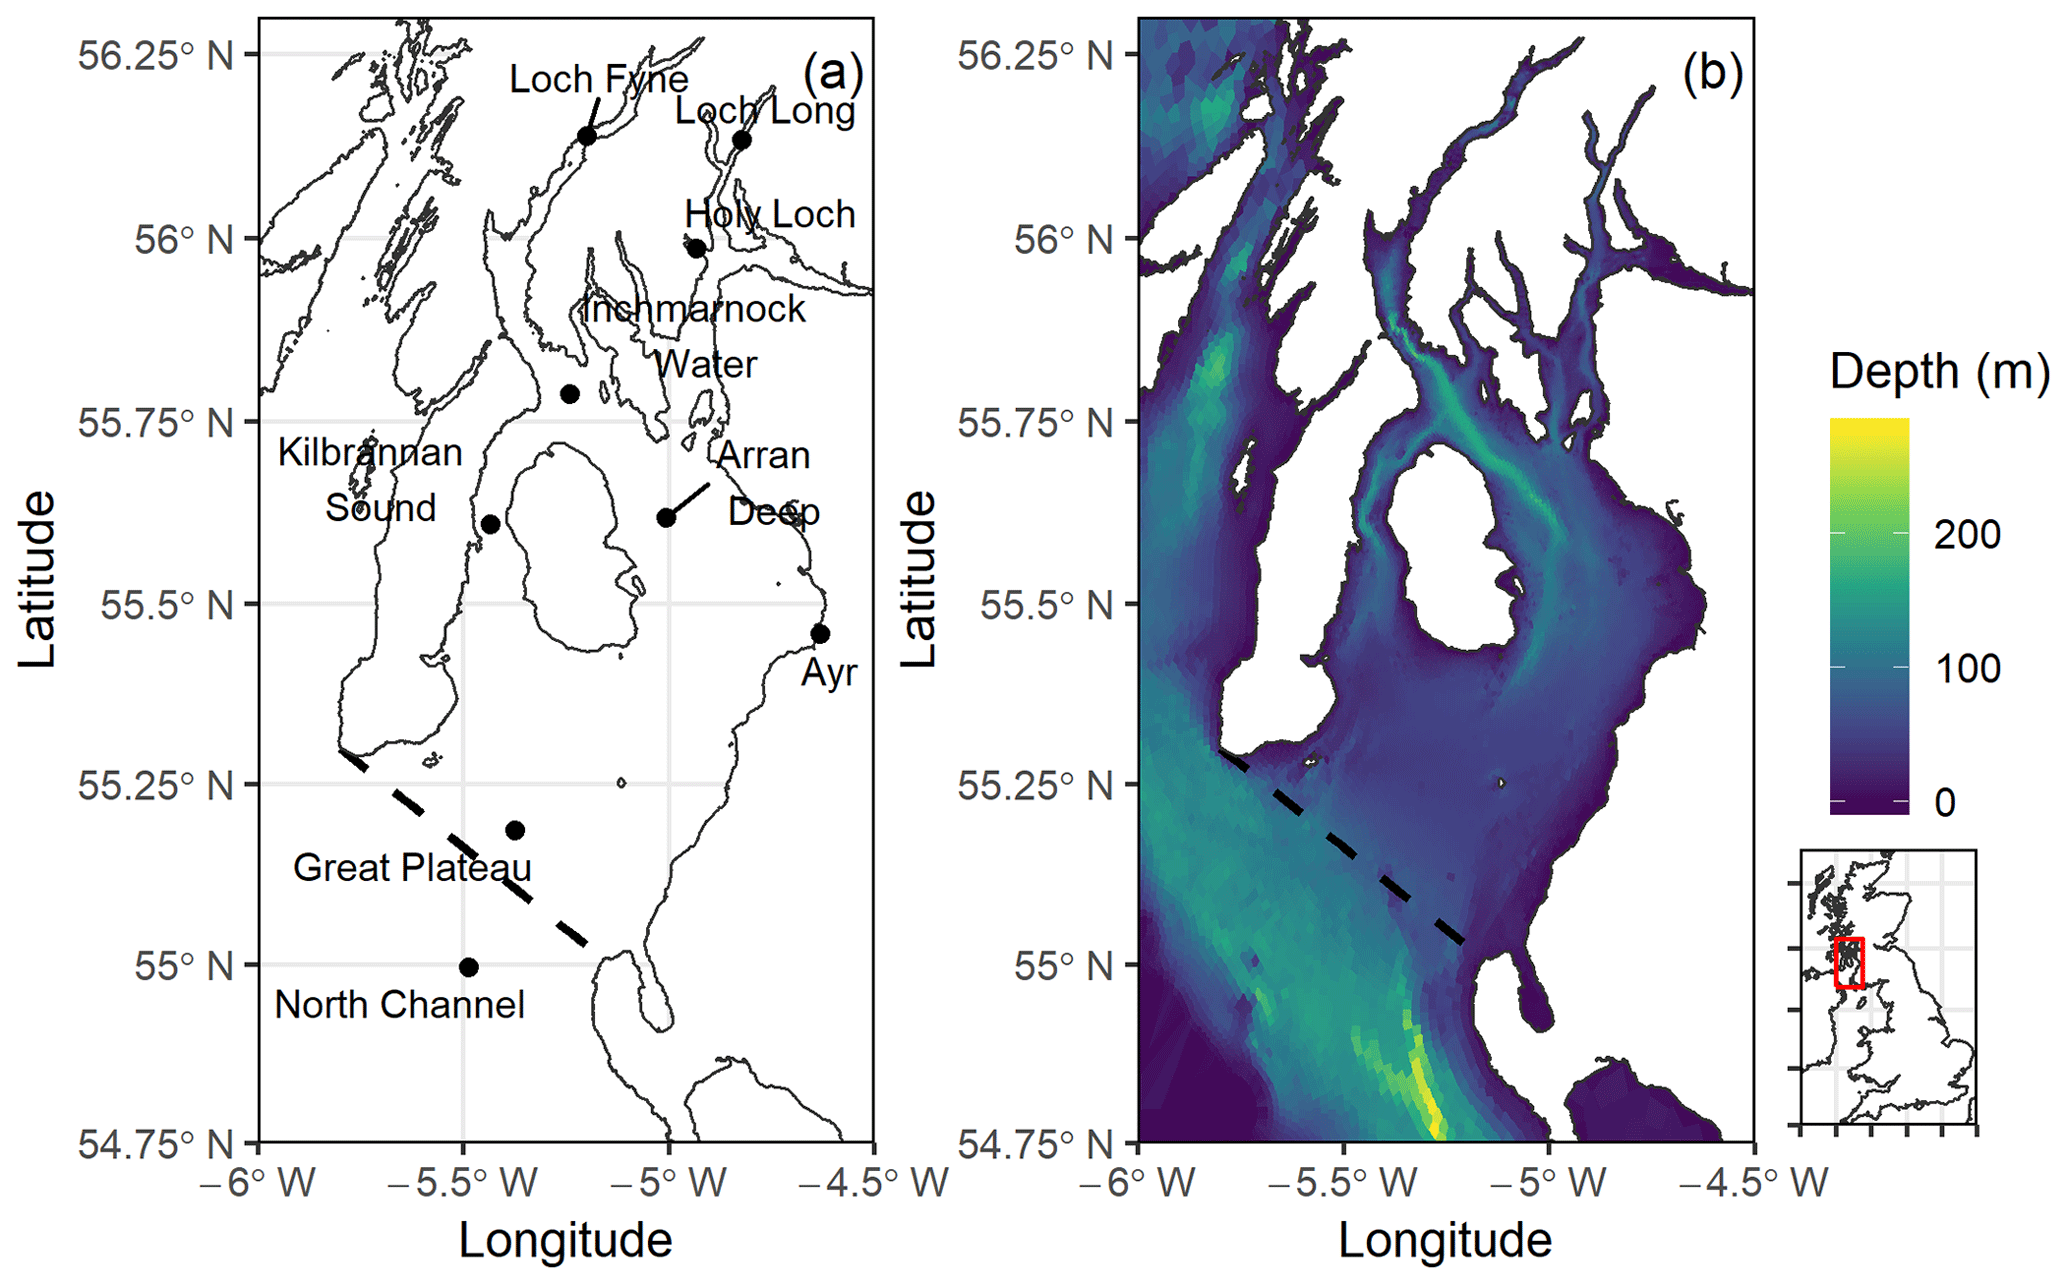
Figure 1Maps of the Firth of Clyde showing (a) locations referred to in text and (b) bathymetry mapped over an unstructured grid. Seabed depth is shown in metres, and the dashed line shows the outer geographical limits of the Firth of Clyde. The location of the Firth of Clyde on the west coast of Scotland is shown inset. Bathymetry data source: Sabatino et al. (2016).
2.2 Data centres and legacy data
The compilation and initial processing of data from the Firth of Clyde are outlined in the following sections. Where measurements of key variables for the Firth of Clyde were lacking or sparse, measurements were supplemented with data from surrounding coastal seas. The sources of data used in the analyses described below are listed in Table 1.
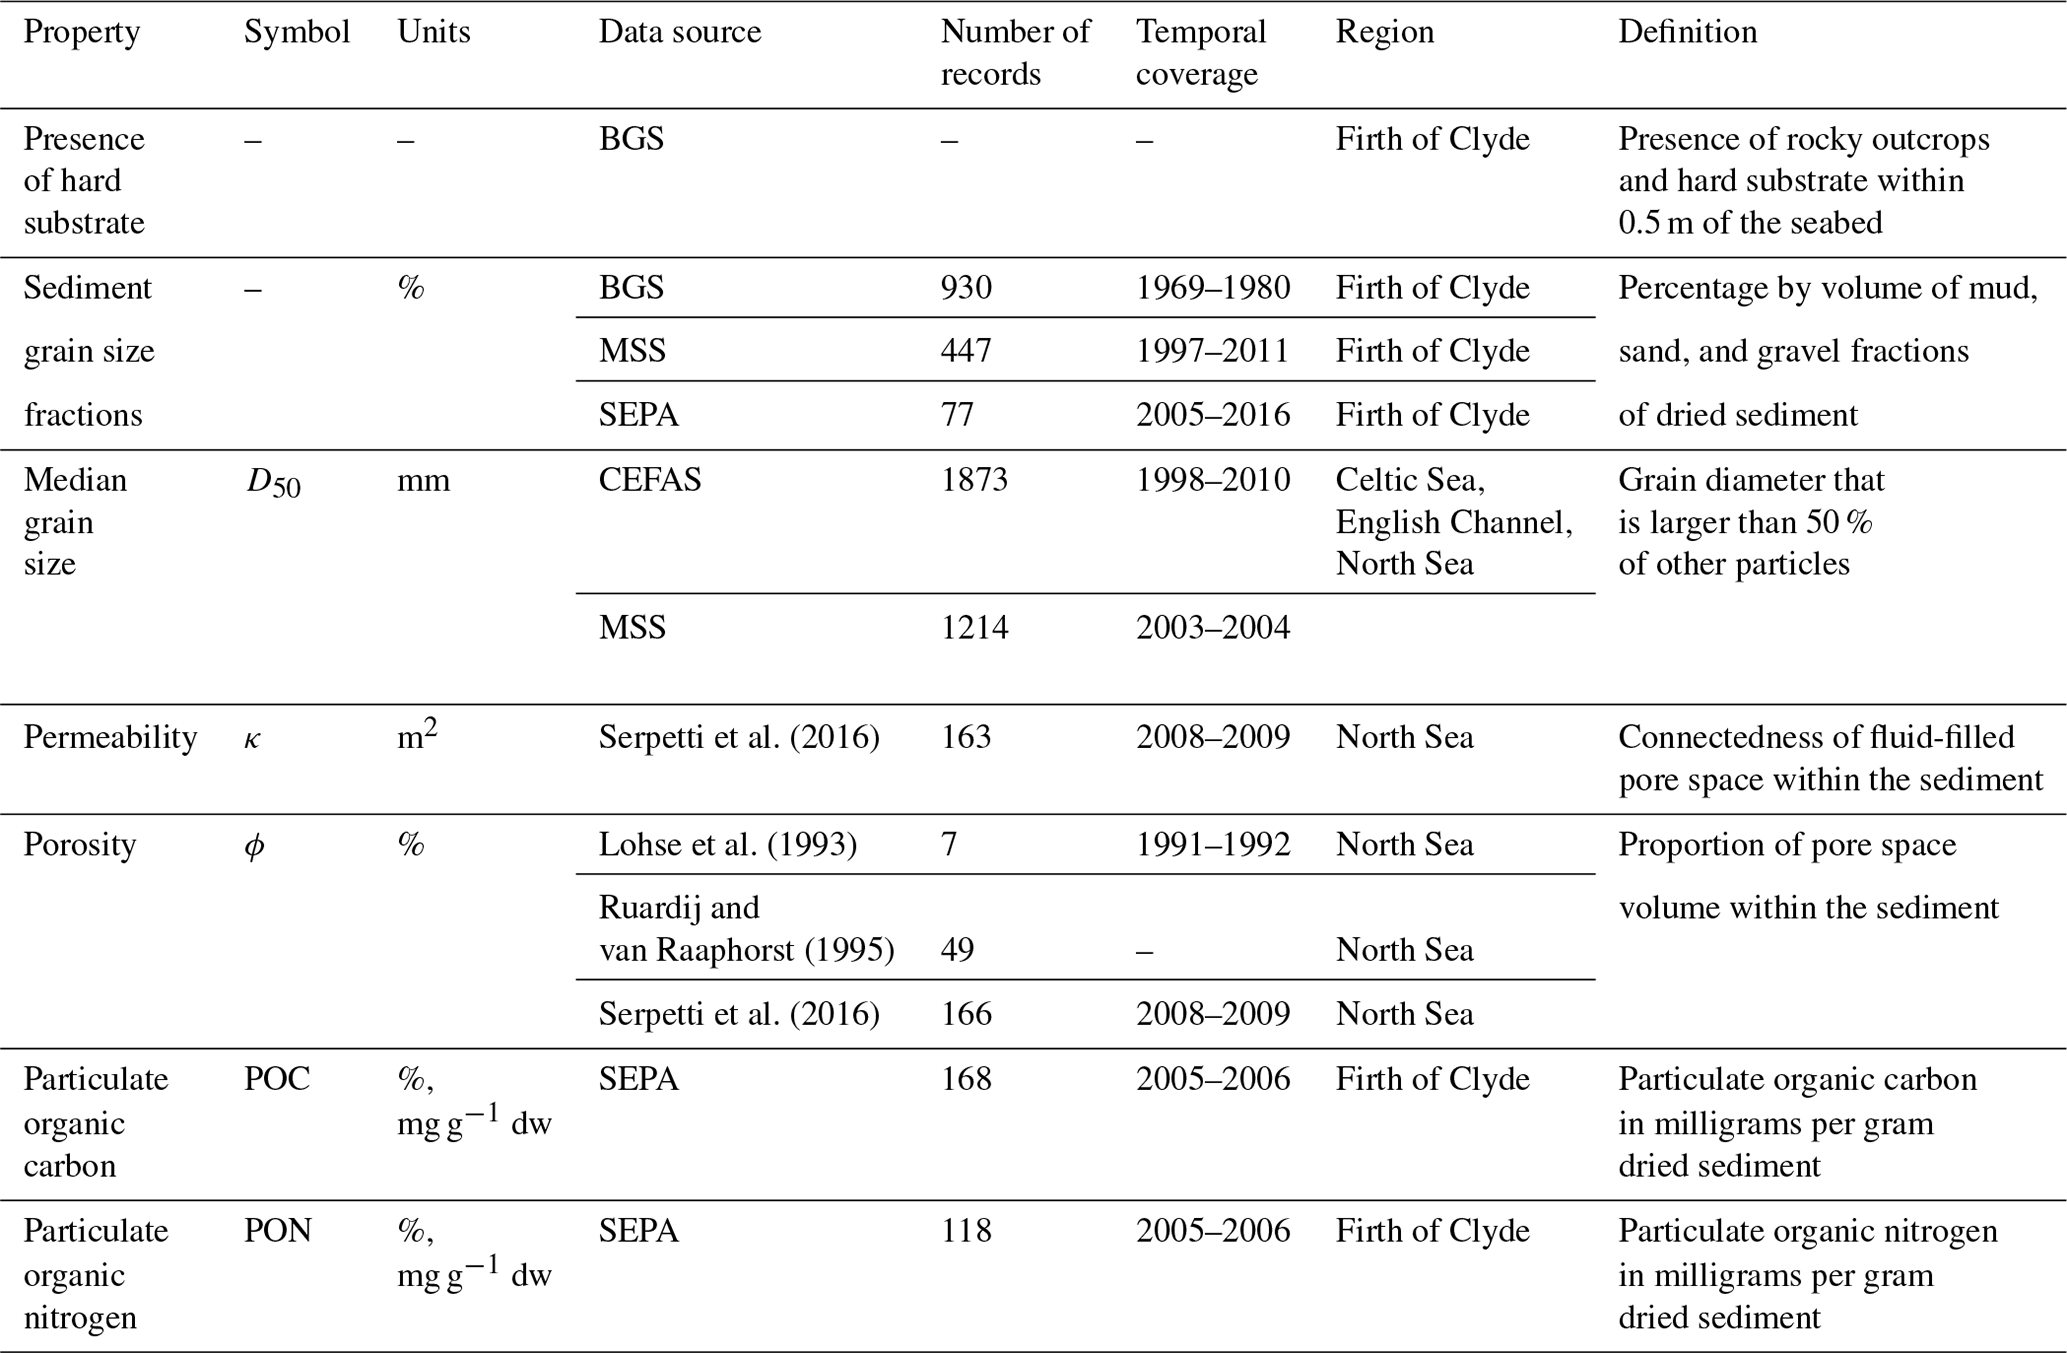
Table 1Sources of seabed data from data centres and the published literature and the number of records used from each source. Sources include the British Geological Survey (BGS); Marine Scotland Science (MSS); the Scottish Environmental Protection Agency (SEPA); and the Centre for Environment, Fisheries and Aquaculture Science (CEFAS). Dry weight: dw.
2.2.1 Rock distribution
Although rock outcrops and hard substrata cover a relatively small proportion of the total seabed area in the Firth of Clyde, they play a functionally distinct role as benthic habitats and in the cycling of nutrients within marine ecosystems. Hence, for a complete characterisation of seabed properties, the distinction between areas of sediment and hard substrate is important.
The most extensive available dataset on the distribution of bare rock and hard substrate features in Scottish coastal waters was compiled by the British Geological Survey (BGS) from the interpretation of archived acoustic data and seabed samples (http://www.bgs.ac.uk/discoverymetadata/13605550.html, last access: 24 June 2020). These data were obtained as polygons representing areas of hard substrate, defined by the BGS as rock and sediments with a grain size of larger than 64 mm within 0.5 m of the seabed (Gafeira et al., 2010). Additional point observations of seabed substrate in the Clyde estuary were digitised from the Admiralty chart no. 2007 covering the River Clyde.
2.2.2 Sediment grain size fractions
Data on the percentages of mud, sand, and gravel in Firth of Clyde sediments from the BGS and Marine Scotland were inherited from Wilson et al. (2018), and additional legacy measurements were requested from the Scottish Environmental Protection Agency (SEPA). Marine Scotland data comprised percentages of mud and sand, excluding the gravel fraction. BGS data were derived from samples collected during cruises carried out in the late 1960s and 1970s with detailed information on sample collection and processing in Chesher et al. (1972) and Deegan et al. (1973). SEPA measurements were made from grab samples collected annually from a network of 18 stations to fulfil the Clean Safe Seas Environmental Monitoring Programme (CSEMP) reporting obligations as well as additional surveys. Sampled locations were well distributed across the Firth of Clyde and in the associated sea lochs, with a high density of points in the outer firth (Fig. 2).
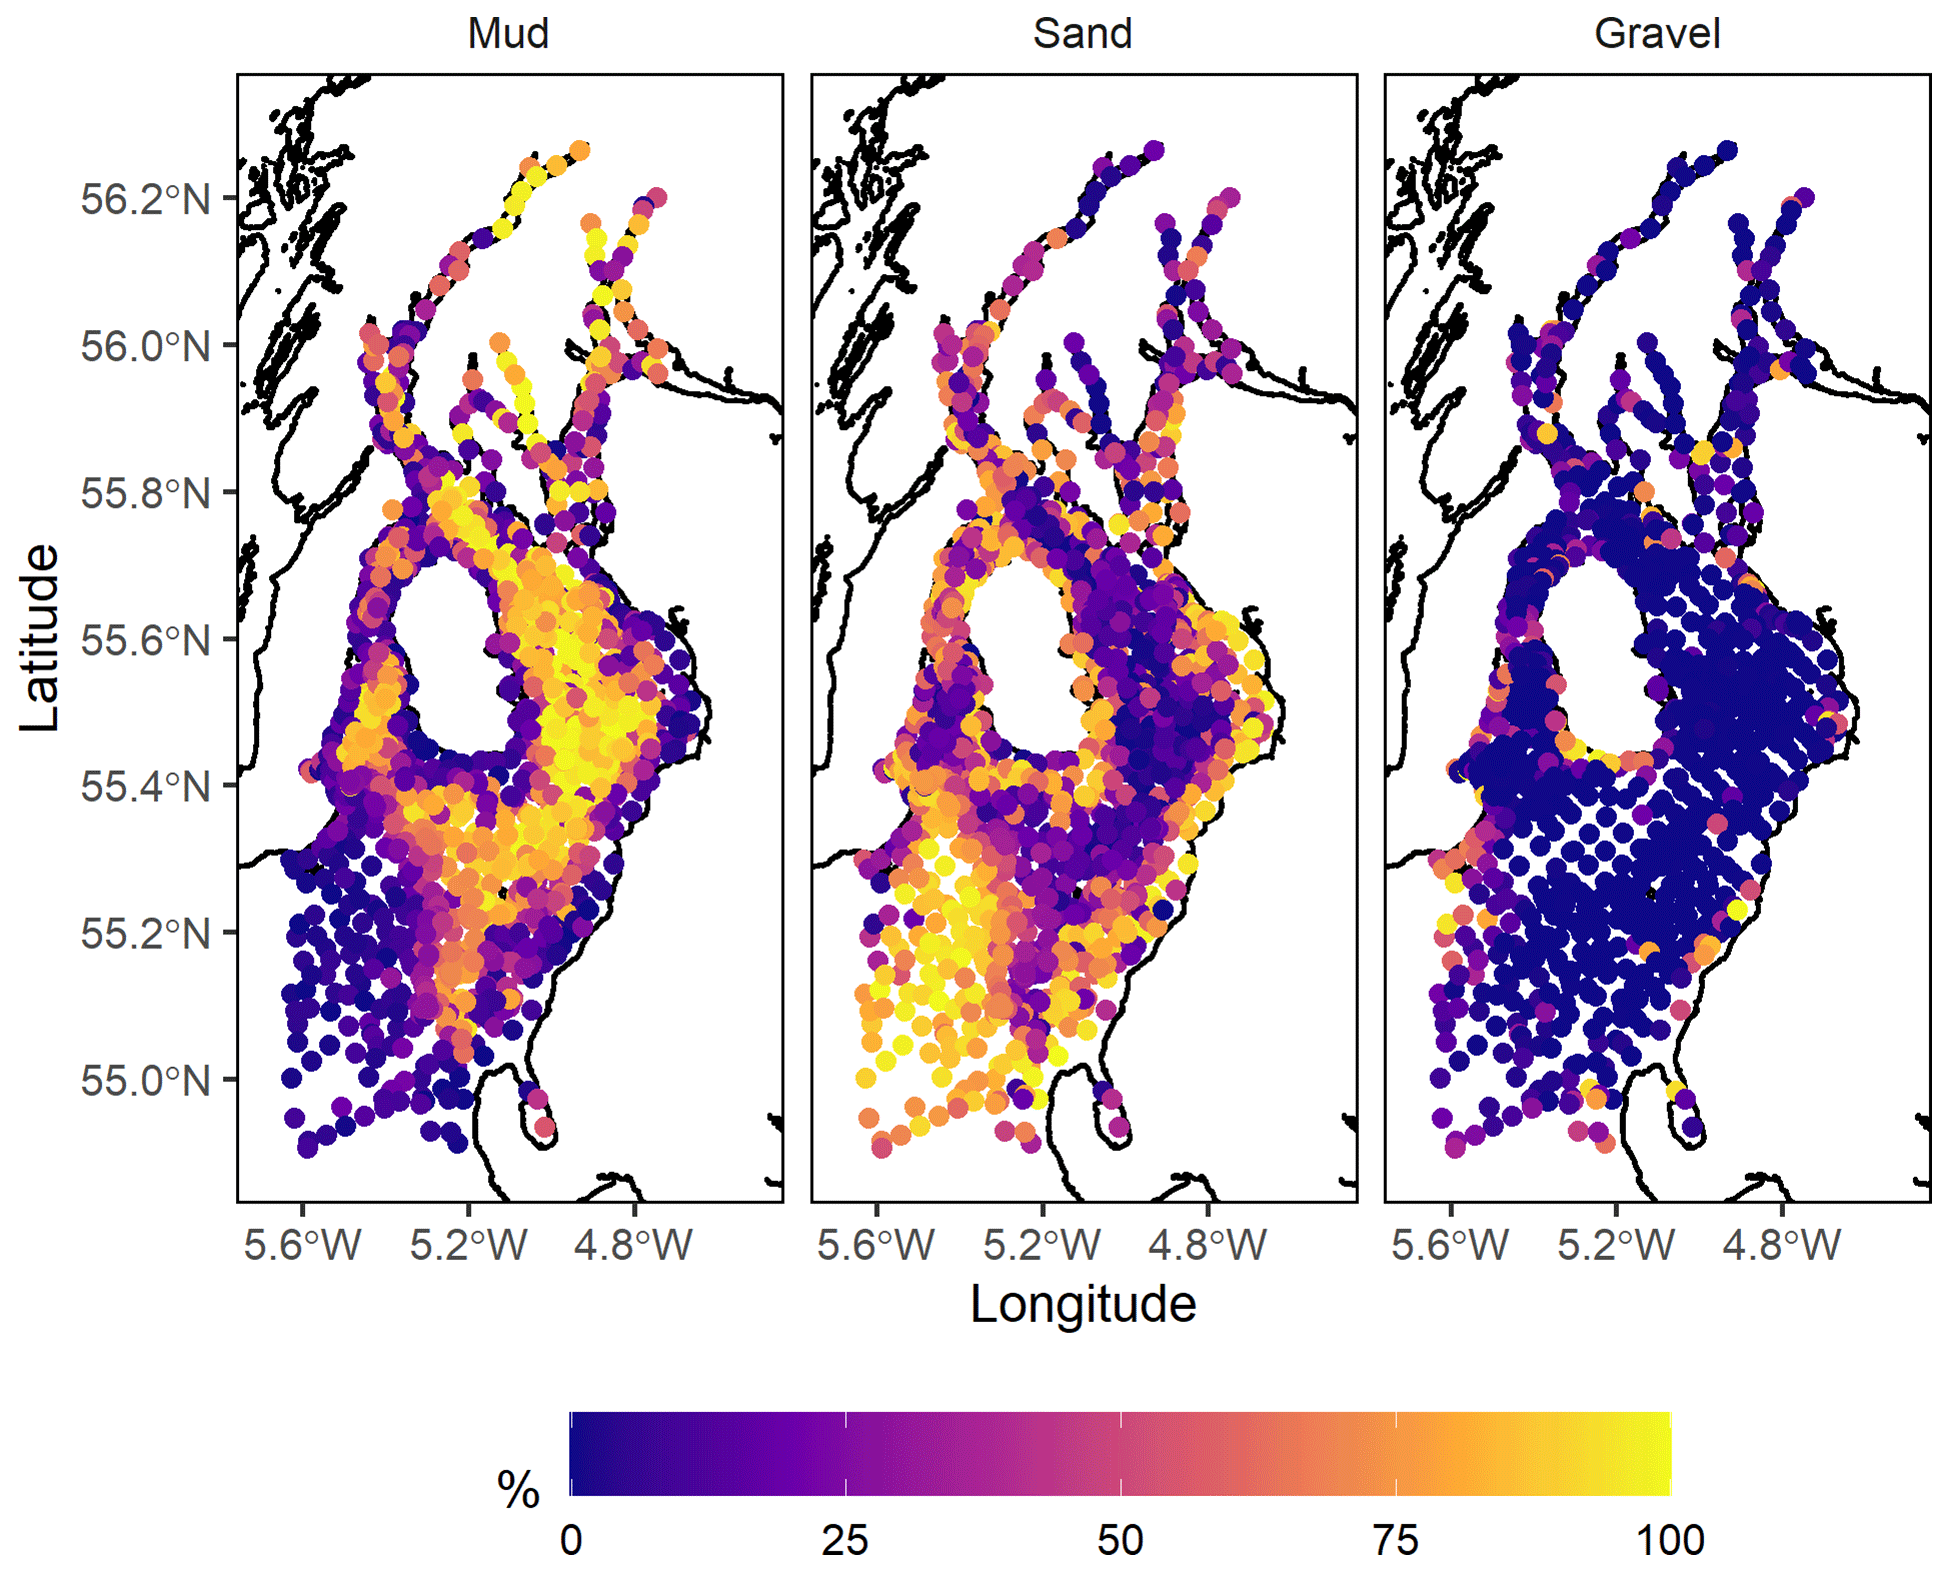
Figure 2Locations sampled by BGS, MSS, and SEPA for the measurement of percentage mud, sand, and gravel in seabed sediments in the Firth of Clyde.
The data were filtered to retain only grab samples and maintain a consistent sampling method. Analysis techniques differed between sources. Sediment fractions reported by the BGS were measured from sieved samples, whereas Marine Scotland and SEPA data were obtained via laser diffraction analysis. Inconsistency between measurements derived from laser and sieve methods have long been reported in the literature. A correction formula by Wilson et al. (2018) was used to correct sieve diffraction-derived mud and sand fraction measurements in samples containing less than 60 % mud to laser-measured equivalents. The numbers of records used in the analysis from each data source are shown in Table 1.
2.2.3 Median grain size
Whole-sediment median grain size data for the Firth of Clyde are sparse. Marine Scotland sediment data for the Firth of Clyde include measurements of median grain size for only the combined mud and sand fractions, and these were therefore omitted from the analysis. Fresh measurements of median grain size were carried out from samples collected during recent research cruises in the Firth of Clyde (Sect. 2.3), yet these data were insufficient for the mapping of predicted median grain size from environmental variables. However, whole-sediment median grain size is related to the proportions of mud, sand, and gravel fractions (Wilson et al., 2018), permitting prediction of this property from full-coverage sediment grain size fraction maps, given an appropriate fitted statistical relationship. Hence, to fit a statistical model predicting the whole-sediment median grain size for a wide range of marine sediments, the sparse measurements of whole-sediment median grain size and fractions of mud, sand, and gravel in the Firth of Clyde were supplemented by data comprising these variables and collected by the Centre for Environment, Fisheries and Aquaculture Science (CEFAS) from the Celtic Sea, English Channel, and North Sea as well as data collected by Marine Scotland from the North Sea (Fig. 3).
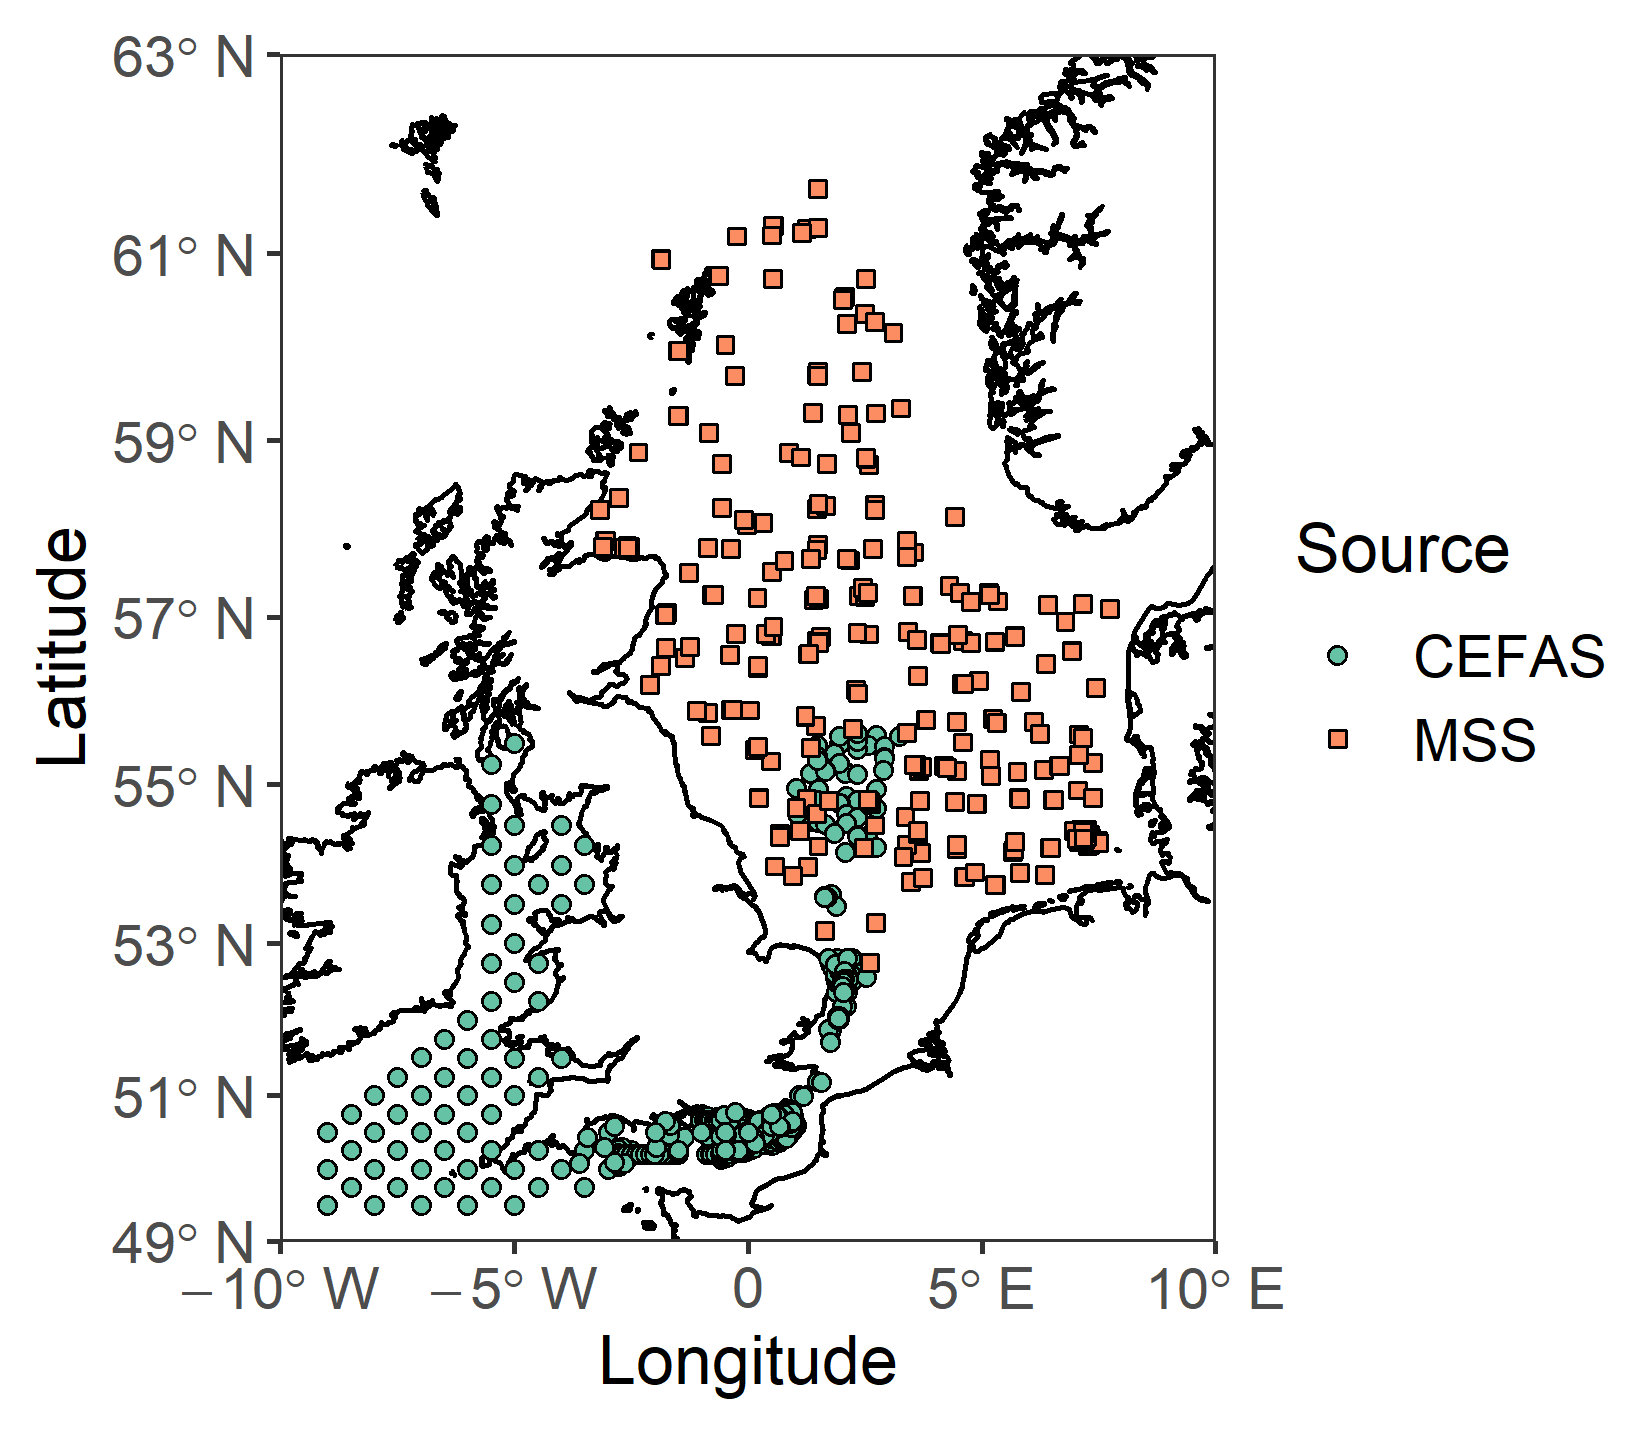
Figure 3Sampling locations for sediment data obtained from CEFAS and MSS for the statistical modelling of relationships between median grain size and fractions of mud, sand, and gravel.
2.2.4 Permeability and porosity
Measurements of seabed sediment permeability and porosity in the Firth of Clyde are lacking, and these properties were prioritised in the collection of additional field data (see Sect. 2.3). Given the difficulty of carrying out permeability measurements on fresh samples of undisturbed seabed sediment (Wilson et al., 2008), there are few published datasets on the permeability of marine sediments available globally. Extensive work has been carried out to empirically relate permeability to measurements of grain size distribution for a range of sediment types (Qi et al., 2015; see review and meta-analysis by Shepherd, 1989). Recent parameterisations of empirical expressions predicting marine sediment permeability from grain size variables have been carried out by Wilson et al. (2018) and Neumann et al. (2017a). However, there remains considerable uncertainty regarding the suitability of these expressions for predicting the permeability of muddy seabed given the lack of data for fine-grained sediments. Similarly, sediment porosity is inversely related to grain size (Moore and Keller, 1984), and several authors have derived expressions relating sediment porosity to median grain size and mud content in natural marine sediments (e.g. Silburn et al., 2017; Wilson et al., 2018). Therefore, sediment permeability and porosity data from neighbouring coastal seas were used to supplement fresh measurements for the Firth of Clyde and parameterise relationships that extended to the finer-grained sediments of the Clyde. The best available dataset on seabed sediment permeability was collected by Serpetti et al. (2016) for seven stations off Stonehaven in the North Sea between 2008 and 2009. This spans 163 measurements of permeability; median grain size; and percentages of mud, sand, and gravel in the top 10 cm of seabed sediment from undisturbed cores collected from a range of sediment types.
Sediment porosity and median grain size data for the North Sea representative of the top 10 cm of sediment and published by Lohse et al. (1993), Ruardij and van Raaphorst (1995), and Serpetti et al. (2016) were used.
2.2.5 Fishing abrasion pressure
In recent years, the use of seabed swept-area ratio (SAR) as a quantitative metric of seabed fishing pressure has gained traction in the published literature (e.g. Bolam et al., 2017; Hiddink et al., 2016; Rijnsdorp et al., 2016). SAR is the ratio between the total area swept by the gears of a fishing fleet and the area of a grid cell that the values were aggregated over (Eigaard et al., 2016, 2017). To briefly summarise the process of computing SAR, vessel monitoring system (VMS) positions are merged with logbook data to obtain locations of fishing operations. These are then combined with footprint estimates for given gear arrangements to obtain the area swept by the gear and then aggregated over a regular grid.
Data for the seabed-surface swept-area ratio calculated over a regular grid at a resolution of were obtained from the Joint Nature Conservation Committee (JNCC) for the period 2009–2016. These data cover UK vessels only (Dan Edwards, personal communication, 2019), and it is therefore assumed that the number of non-UK vessels fishing in the Clyde is negligible. Given that these data were already spatially gridded, a climatology of mean annual swept-area ratio was compiled (Fig. 4).
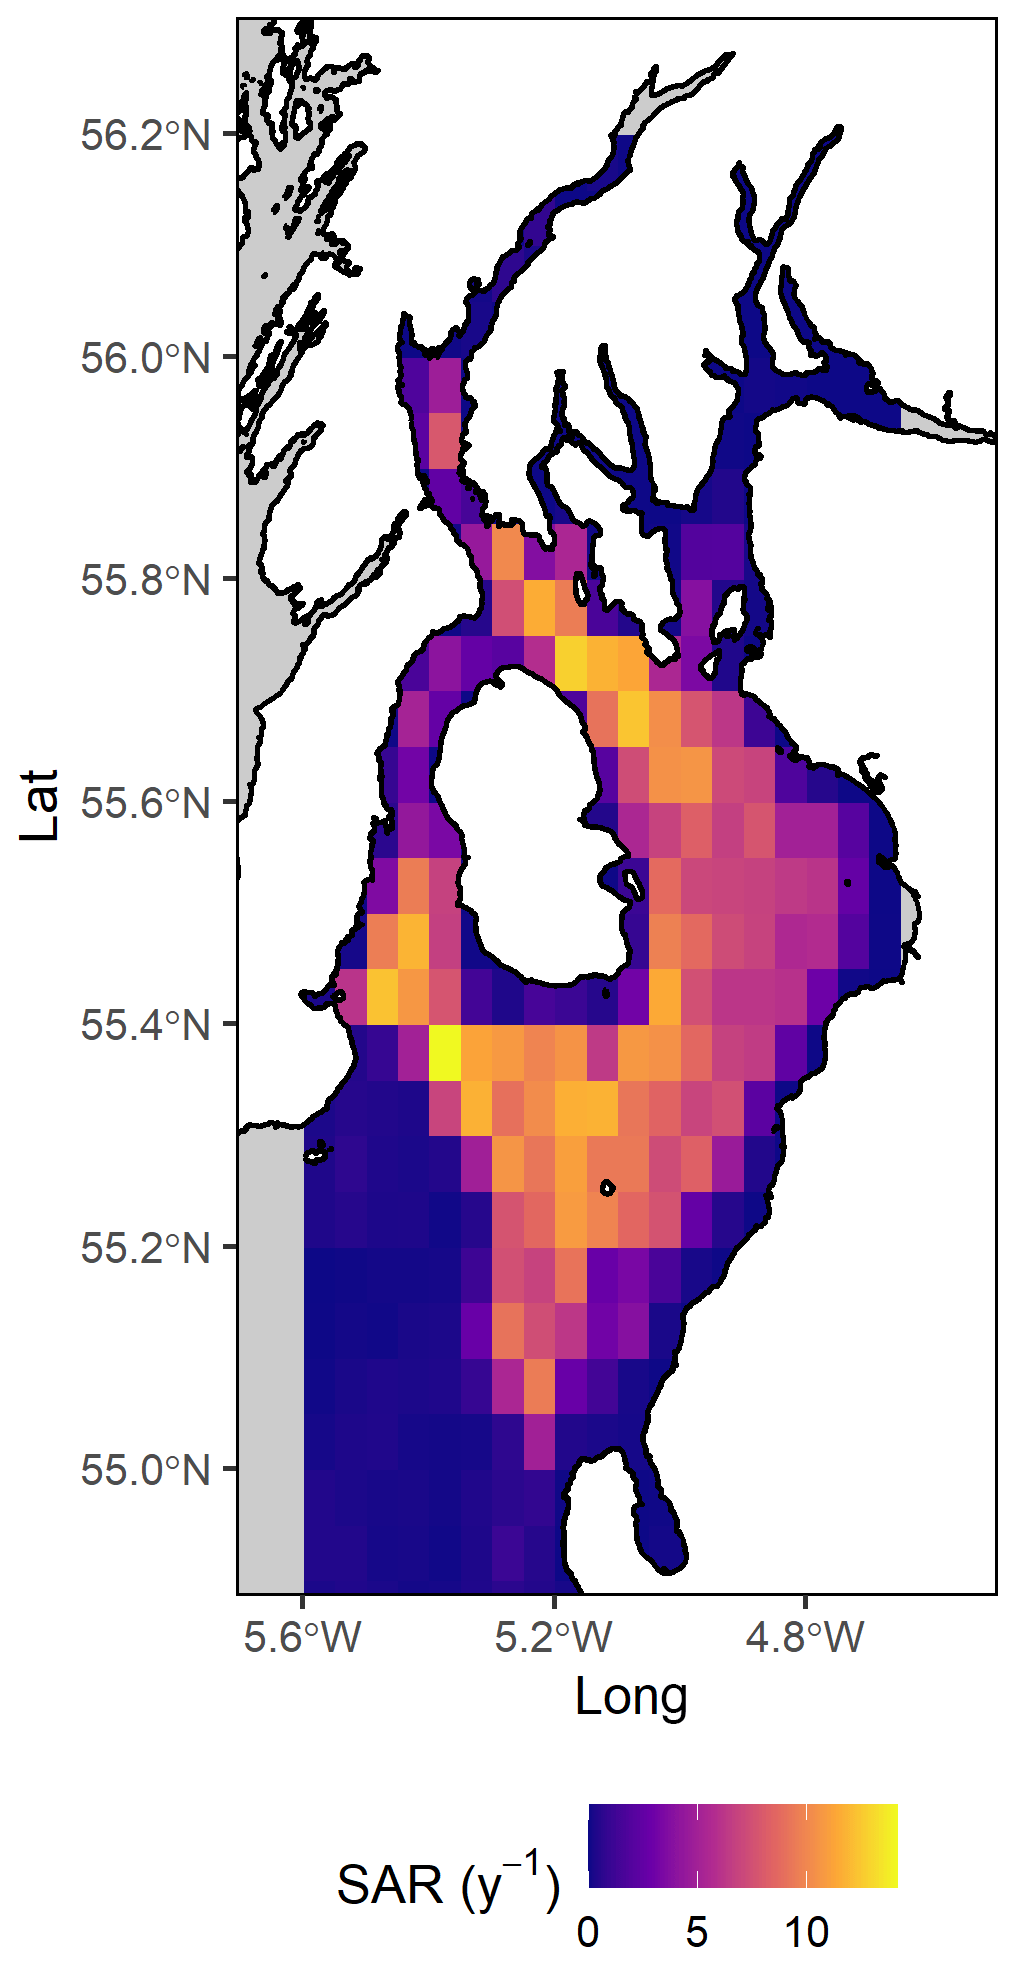
Figure 4Mean annual swept-area ratio (SAR) for the years 2009–2016. Spatial distribution of seabed abrasion pressure from fishing vessels with an overall length greater than 12 m. Areas where no data are available are shown in grey.
2.2.6 Seabed organic matter content
Data on sediment organic carbon and nitrogen content and sediment fractions of mud, sand, and gravel were requested from SEPA for the Firth of Clyde. SEPA measurements of organic carbon and nitrogen content were taken from the <63 µm grain size fraction rather than the whole sediment. Using these values directly would over-predict organic carbon and nitrogen as organic matter is expected to be overwhelmingly associated with the mud fraction (Wiesner et al., 1990).
The organic matter content associated with the gravel fraction (>2000 µm) was assumed to be negligible, and the average density of carbon and nitrogen associated with the sand fraction for a range of marine sediments was calculated (see Appendix A). These estimates were then used to scale SEPA measurements of organic carbon and nitrogen to the whole sediment.
2.3 Additional data collection
Research cruises in the Firth of Clyde were carried out between 24–28 April and 13–17 October 2017 for the collection of additional seabed sediment geotechnical and nutrient content data. Respectively, 35 stations in the outer Firth of Clyde and 14 stations in the inner Firth of Clyde and sea lochs were sampled over the course of the two cruises. Measurements of seabed sediment grain size and particulate organic carbon and nitrogen were carried out on seabed sediment samples collected using a 0.1 m2 Day grab. Sediment subsamples were taken from each grab sample using a 5 cm×3.5 cm acrylic minicore tube and frozen immediately following collection aboard the research vessel at −18 ∘C in sealable polyethylene bags for subsequent laboratory analysis. Sediment particulate organic carbon and nitrogen content was measured from freeze-dried Day grab subsamples using a Costech 4020 elemental combustion analyser. The remainder of the freeze-dried subsample was sieved for 10 min through a stack of 11.20, 8.00, 5.56, 3.35, 2.36, 2.00, and 1.40 mm mesh sieves mounted on a sieve shaker. The sediment fractions retained on each sieve were weighed to the nearest 0.1 mg and further analysed using a Beckman Coulter LS230 laser diffraction particle size analyser. The sieve and laser diffraction data were blended and summary statistics – including median grain size; percentage fractions of mud, sand, and gravel; skewness; and kurtosis – were calculated using GRADISTAT v8 (Blott and Pye, 2001).
Measurements of sediment permeability, porosity, and grain size were made from undisturbed seabed sediment cores sampled using a Craib corer (Craib, 1965). Following collection, seabed sediment cores were refrigerated in the dark with loosely fitted caps, and analysis for permeability was carried out within 8 h of collection. Cores were trimmed to the top 10 cm of seabed sediment prior to analysis. The hydraulic conductivity (K) of the top 10 cm of seabed sediment was measured via the falling head method (Klute and Dirksen, 1986). The decline in water level between two different hydraulic heads was recorded over a 2 h interval, and the hydraulic conductivity was calculated via
where t is the time (s) taken for the level of the percolating fluid to decline between hydraulic head differences H1 and H2 (m); L and A are the length (m) and cross-sectional area (m2) of the sediment sample, respectively; and a is the cross-sectional area (m2) of the water reservoir. The intrinsic permeability is related to the hydraulic conductivity via the expression
where g is the acceleration due to gravity (9.81 m s−2), ρ is fluid density (1027 kg m−3), and η is dynamic viscosity of the fluid ( kg m−1 s−1). Following the measurement of hydraulic conductivity, sediment cores were extruded from the acrylic tubes, sealed in polythene bags, and frozen at −12 ∘C for subsequent porosity and grain size analysis. Sediment was weighed before and after drying in an oven at 105 ∘C for 24 h (Moore and Keller, 1984), and sediment porosity was calculated for each core slice via
where VT is the volume of saturated sediment (cm3) calculated from the thickness of the slice and the internal cross-sectional area of the acrylic core tube, and Vw is the pore volume calculated with the expression
where dw and ww are the dry and wet weights (g) of the sample, and ρ is the water density taken to be 1 g cm−3 given that solutes are retained in the dried sediment. Grain size analysis was then carried out as previously described for sediment grab samples.
2.4 Mapping seabed properties
All data processing and statistical modelling were carried out using the R statistical program (R Core Team, 2019). Several seabed properties were modelled using random forest models, which outperformed generalised additive and linear models in the prediction of sediment grain size fractions and organic carbon and nitrogen content. Random forest models were fitted in the present study using the ranger package (v0.11.2) (Wright and Ziegler, 2017). It has the advantage of capturing complex non-linear relationships in the data and reducing the variance in model prediction whilst being relatively insensitive to irrelevant explanatory variables (Hastie et al., 2009). Random forest models have been applied to numerous marine mapping challenges, including the distribution of vulnerable benthic species (Portela et al., 2015), global patterns in seafloor biomass (Wei et al., 2010), the diversity and biomass of reef fish communities (Knudby et al., 2010), and the particle size fractions (Li et al., 2011; Stephens and Diesing, 2015) and organic carbon content (Diesing et al., 2017; Wilson et al., 2018) of seabed sediments.
Although implementations of random forest models typically carry out an internal cross-validation using “out-of-bag” data, this does not account for spatial autocorrelation. To provide a more robust estimate of model prediction accuracy, a spatial cross-validation was run where data are binned at a resolution of lat 0.125∘ and long 0.25∘, increments of approximately 13.9 and 15.75 km, respectively, into spatial blocks. A third of the data blocks are randomly assigned as test data, and the model is trained on the remaining data and evaluated against the test data. This process is repeated, and the model performance metric is averaged between successive iterations until the error stabilises. The suitability of the binning resolution was determined for each model separately by evaluating residual autocorrelation in semivariograms generated for models fitted to the full data, following recommendations by Roberts et al. (2017). A total of 1000 iterations were used for the cross-validation of rock and sediment grain size fraction models, whereas 2000 iterations were used for the organic carbon and nitrogen models.
A suite of environmental variables were selected as candidate predictors of seabed sedimentology and organic matter based on their expected importance in the Firth of Clyde, evidence from published research, and availability. The grain size distribution of surficial seabed sediments may be predicted by topographic features such as bathymetry (Bockelmann et al., 2018), seabed roughness, and distance to the coast (Stephens and Diesing, 2015; Wilson et al., 2018). Tidal current speeds and bed shear stress are important drivers of sediment mobilisation and transport (Soulsby, 1997). These variables are also predictors of seabed organic carbon (Diesing et al., 2017), in part due to the strong relationship between the sediment grain size and organic matter content (Wiesner et al., 1990). Environmental variables were calculated from a high-resolution unstructured-grid Finite-Volume Community Ocean Model (FVCOM) hydrodynamic model configured for the Firth of Clyde (Sabatino et al., 2016). The model was forced using a combination of tidal, atmospheric, meteorological, and hydrological data to capture tidal-, wind-, and density-driven flow in the Firth of Clyde for the years 2005 and 2006, generating hourly estimates of current velocity over an irregular grid of triangular cells that provides higher spatial resolution close to the coast. A detailed description of the calibration and validation of the Clyde FVCOM hydrodynamic model is given by Sabatino et al. (2016). The full list of explanatory environmental variables used to predict seabed physical properties and sedimentary organic matter is given in Table 2.
Table 2Explanatory environmental variables used to predict seabed physical properties and particulate organic carbon (POC) and nitrogen (PON) content. For each predicted sedimentary property, the explanatory variables used are listed (x). In addition, for properties where model selection was carried out, the explanatory variables that were evaluated but not retained in the optimal model are also listed (o).
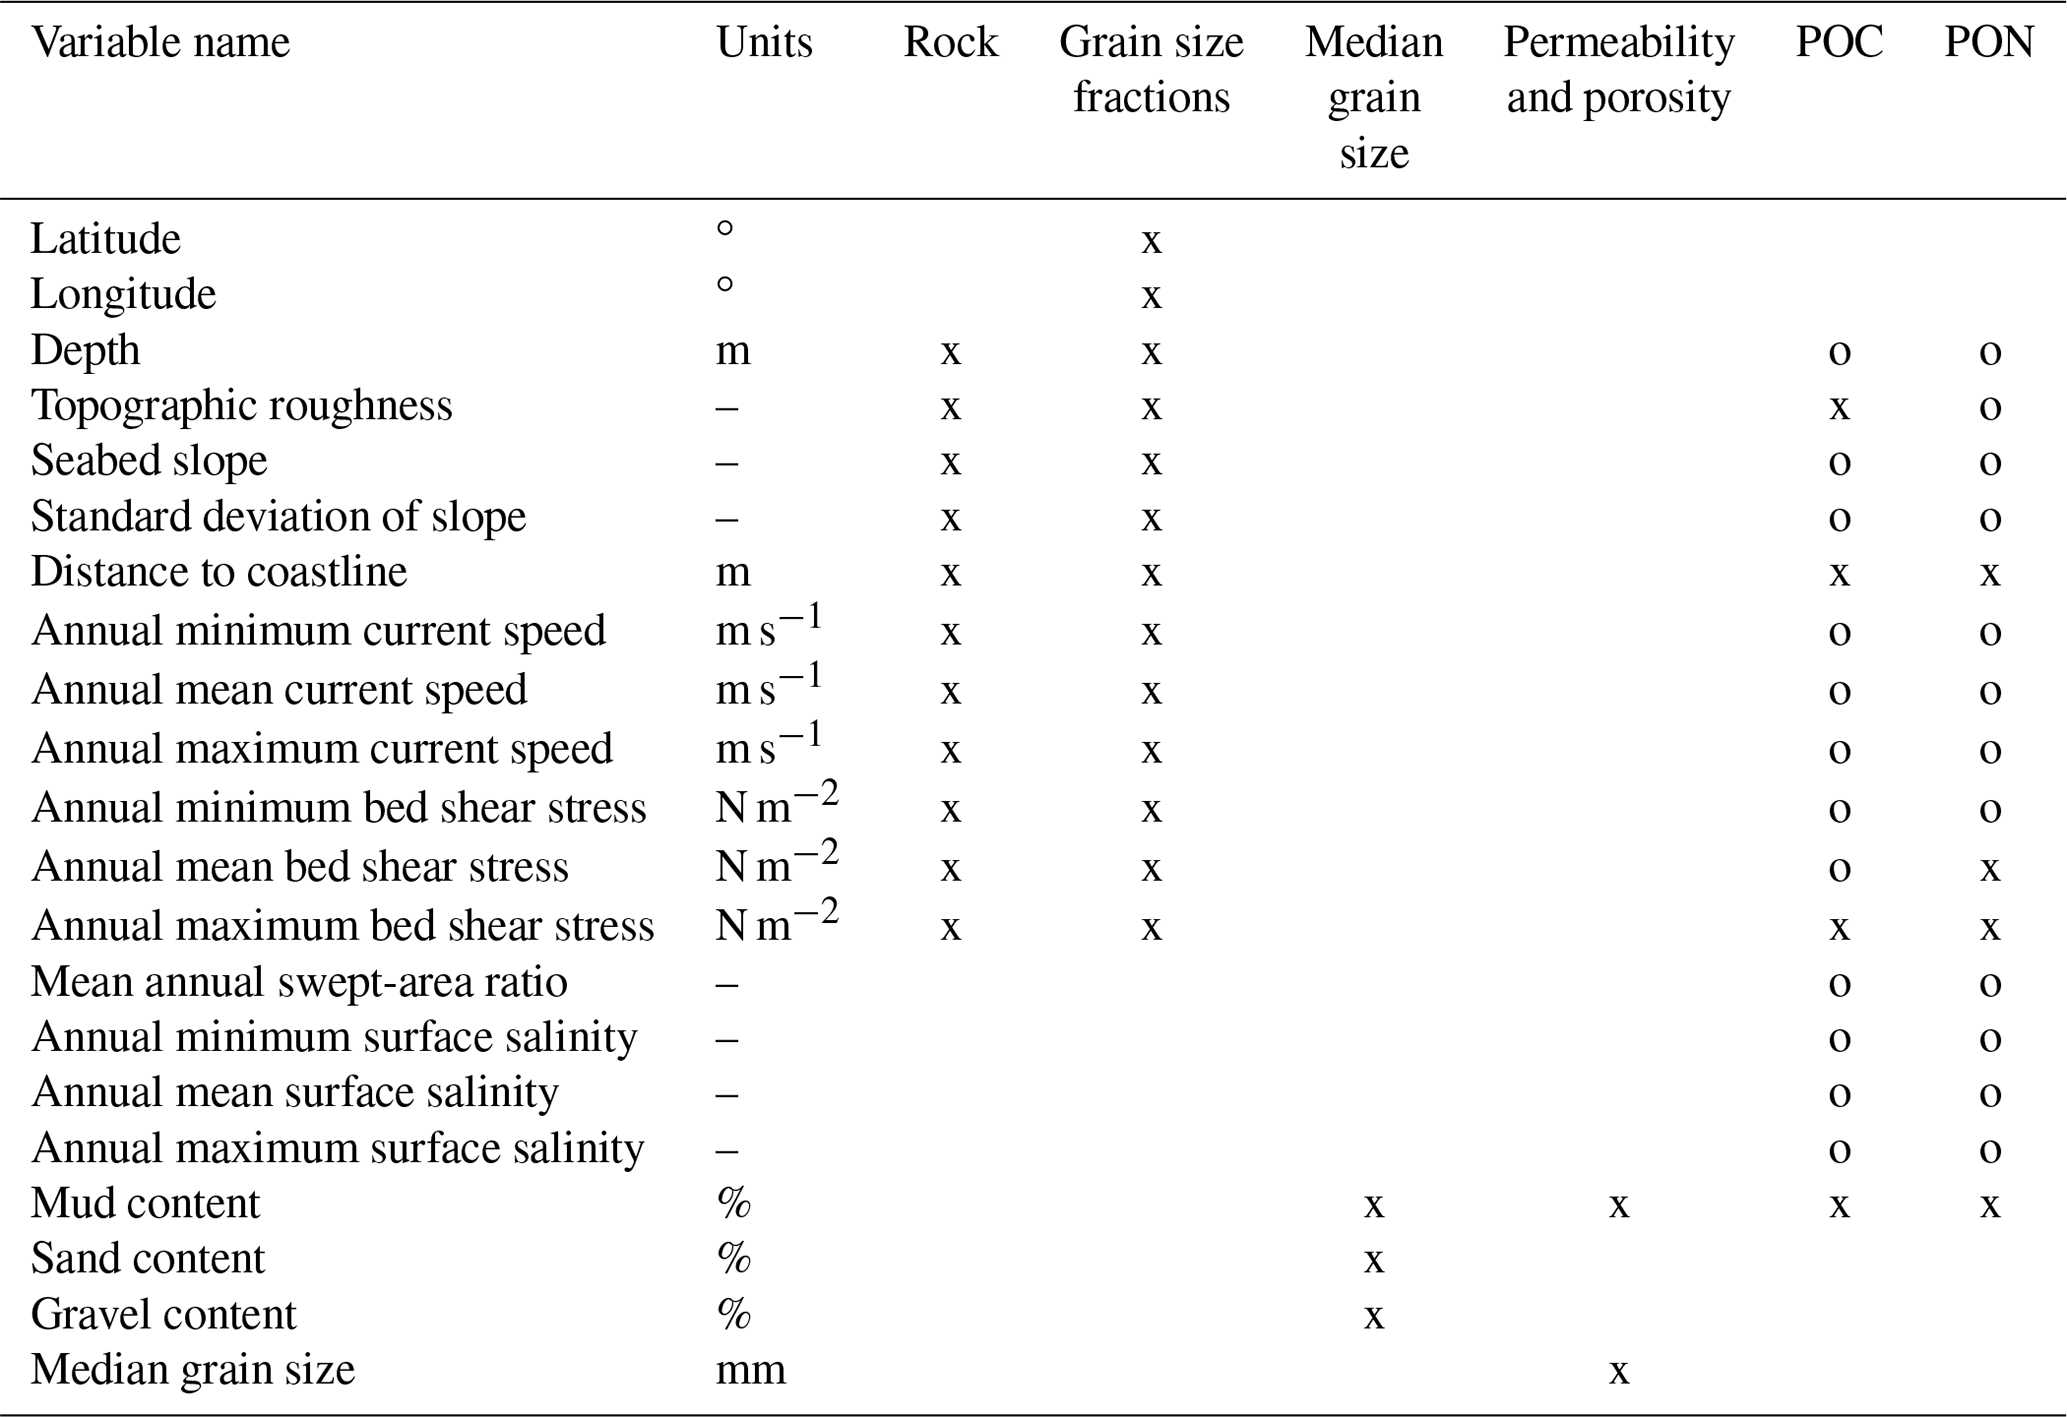
Distance to coastline is taken to be the minimum Euclidean distance in metres between a given point and any point on the coastline and was calculated using high-resolution polygons of the Scottish coast and islands and the dist2Line function from the geosphere package (v1.5-10) (Hijmans, 2019). The annual minimum, mean, and maximum bed shear stress and the annual minimum, mean, and maximum depth-averaged current speed were calculated from predicted hourly values extracted from the Firth of Clyde hydrodynamic model run for 2 consecutive years (2005 and 2006). The seabed slope, standard deviation of the slope, and topographic roughness were calculated following the methods used by Wilson et al. (2018). Seabed slope was calculated with the slope function from the SDMTools package (v1.1-221.1) (Van Der Wal et al., 2019), and the standard deviation of the slope and topographic roughness were calculated from slope and bathymetry, respectively, following the method of Cavalli et al. (2008).
These explanatory variables were mapped to an irregular grid of 39 449 points with a spatial arrangement that corresponded to the locations of velocity estimates in the FVCOM unstructured grid. This grid provided the basis for the prediction of modelled sedimentary properties whilst eliminating the need to interpolate depth-averaged current velocity and bed shear stress outputs from the hydrodynamic model to a different grid arrangement. Explanatory variables were then interpolated to sample and legacy data locations via pointwise bilinear interpolation using the akima package (Akima and Gebhardt, 2020). Given the irregular arrangement of grid points, predicted maps are visualised using Dirichlet cells generated from the packages ggvoronoi (Garrett et al., 2019) and deldir (v0.1-16) (Turner, 2019). Maps and figures are generated in R using the ggplot2 package (Wickham, 2016). Figure 5 illustrates how mapped explanatory variables and empirical data informed sedimentary models and how fitted models were then used to map out seabed sediment properties.

Figure 5Illustration of the workflow described in this chapter. Legacy and research cruise data (orange boxes) were used in conjunction with mapped environmental variables (green boxes) to fit models of seabed sediment grain size and geotechnical properties and organic carbon and nitrogen content. Full-coverage quantitative maps of these properties (blue boxes) were generated by using mapped environmental variables and sedimentary maps created earlier in the workflow as the substrate from which to generate predictions from the fitted models.
2.4.1 Rock distribution
Coverage of BGS data did not extend into the Clyde estuary and sea lochs, and a random forest binary classification model was used to predict the distribution of hard substrate in these areas. To assemble a training dataset, the irregular grid points containing the explanatory variables were classified as rock or non-rock within areas covered by BGS data. These were augmented by rock outcrop observations in the Clyde estuary digitised from Admiralty charts. The environmental variables used to predict the presence of rock substrate are given in Table 2. Model performance was assessed via spatial cross-validation with the mean square error (MSE) of the averaged classification tree predictions and the overall accuracy, sensitivity, and specificity of predictions used as performance metrics following recommendations by Lawson et al. (2014). Prediction sensitivity refers to the percentage of rock observations that were correctly classified as rock, whereas specificity refers to the percentage of non-rock observations that were correctly predicted to have no rock present. A total of 39 spatial blocks were generated, with an average of 596 observations in each block. Given the sparsity of rock observations, the sampling of training and test data was constrained so that at least one instance of rock is present in both subsets. A total of 1000 iteratively sampled training and test datasets were generated for spatial cross-validation. Further detail on the code used to implement spatial cross-validation may be found in the Supplement.
2.4.2 Sediment grain size fractions
Sediment particle size fractions were mapped in terms of the proportion of mud, sand, and gravel. As compositional data carry relative rather than absolute information, it is possible to capitalise on the fact that the whole composition information may be retrieved from n−1 components of the data (Aitchison, 2004). Following methods given by Stephens and Diesing (2015), a coupled additive log ratio transformation (Eqs. 5 and 6) was used to couple the sediment fractions and ensure that the proportions summed to 1.
This approach had two important benefits. Firstly, two, rather than three, models were needed to predict the complete compositional information of sediment grain size fractions. Secondly, it was possible to accommodate Marine Scotland data, where gravel fraction measurements were lacking, into the analysis without information loss by using mud as the denominator within the transformation. This is because spatial predictions were carried out for the separate models and only subsequently back-transformed.
Random forest models were used to predict the log ratios of sand to mud and gravel to mud from environmental variables listed in Table 2. Back-transformation of log ratios into separate sediment fractions was carried out via a multinomial logit function. Spatial cross-validation of the model was carried out to test the accuracy of back-transformed predictions of sediment mud, sand, and gravel fractions. A total of 40 spatial blocks were generated with an average of 24 samples within each block. The mean R2 metric across cross-validation iterations computed through the caret package (v6.0.86) (Kuhn, 2020) was used to assess model performance. This metric takes the following popular and robust formulation
where y is a vector of observation data, is a vector of model-generated predictions, and is the observation data mean (Kvalseth, 1985).
Produced maps were further validated against independent sediment data collected during the April and October 2017 research cruises. Bilinear interpolation was used to predict mud, sand, and gravel content at sampled stations, and the predictive performance of the map was calculated for the station-averaged observed data using R2.
2.4.3 Median grain size
A generalised additive model (GAM) of the form was used to relate the whole-sediment median grain size to sediment fractions for data from the Firth of Clyde and surrounding shelf seas. This expression outperformed other GAM formulations and random forest models. The incorporation of data external to the Firth of Clyde within this model is supported by the relative robustness among quantitative measures of grain size for sediments derived from contrasting tidal regimes and seabed depths (Aldridge et al., 2015; Bockelmann et al., 2018). The predictive accuracy of the GAM fit was assessed through leave-one-out cross-validation (LOOCV). A map of median grain size for the Firth of Clyde was predicted from the fitted GAM using the previously generated maps of sediment mud, sand, and gravel content.
2.4.4 Permeability and porosity
Measurements of sediment permeability and porosity for the Firth of Clyde were supplemented by literature data from the North Sea. This followed an initial assessment to ensure that grain size relationships with permeability and porosity for these two datasets overlapped satisfactorily; however, it is assumed North Sea measurements are a suitable approximation for unsampled higher-energy and coarser-grained Firth of Clyde sediments. The relationships between sediment permeability and median grain size for the top 10 cm of sediment were expressed via a log–log form of the equation described by Wilson et al. (2018), modified to incorporate an intercept:
Sediment porosity measurements were fitted to the logistic function given by Wilson et al. (2018):
Equations were fitted to data using the Nelder–Mead algorithm to minimise the root sum of square error (RSS).
Relationships were also defined between sediment permeability and porosity and mud content in the top 10 cm of seabed sediment using a log–log function. These linear models were fitted using maximum likelihood and a Gaussian error distribution. Maps of sediment permeability and porosity for the Firth of Clyde were then generated by applying the fitted equations to the appropriate sedimentary grain size maps.
2.4.5 Natural seabed abrasion
Following Wilson et al. (2018), sediment mobilisation by near-bed water movement was predicted by the Shields relationship. Rates of natural seabed abrasion were then expressed in terms of the annual percentage of time that sediment motion occurs (hereafter referred to as sediment mobility). The hourly near-bed shear stress (τb) and occurrence of sediment movement were calculated for each point on the unstructured grid of the Clyde using the bedshear package (Wilson and Heath, 2019). This hourly binary classification for sediment movement was then summarised to an annual proportion for each point and mapped.
2.4.6 Seabed organic matter content
The particulate organic carbon and nitrogen content of seabed sediments in the Firth of Clyde were modelled using random forests. To assess the potential influence of organic matter loading in river freshwater input on the organic carbon and nitrogen content of seabed sediments, estimated annual minimum, mean, and maximum surface salinity was extracted from the Firth of Clyde hydrodynamic model and used as a potential explanatory variable. Mean annual fishing swept-area ratio was also included as a potential explanatory variable to account for the possible winnowing effect of frequent trawling disturbance on sedimentary organic matter (Palanques et al., 2014; Pusceddu et al., 2014; Sala et al., 2021). Although random forests are generally robust to the presence of highly correlated explanatory variables, model performance may be impacted in smaller datasets (e.g. Li et al., 2011). Recursive feature elimination (RFE) is a popular method to select a subset of relevant uncorrelated variables from a large number of noisy or highly correlated variables by iteratively fitting a random forest model and removing the least important ranked variable (Gregorutti et al., 2017). Given the relatively small number of sediment organic carbon and nitrogen measurements available, a variation in recursive feature elimination (RFE) was used to improve model prediction. This was implemented as follows: spatial cross-validations were run for the full model and for single removals of each environmental variable. The variable whose removal led to the greatest reduction in mean squared error in model prediction was dropped, and the process repeated for the reduced suite of variables. This was repeated until no further minimisation of model error was achieved through further removal of environmental variables. Spatial blocking yielded 22 organic carbon blocks containing an average of 7.6 samples in each block and 22 nitrogen blocks containing an average of 5.3 samples in each block. A total of 2000 iteratively sampled training and test datasets were generated. The distribution of R2 across cross-validation iterations was highly asymptotic due to instances where R2<0 given noise in the sampled data (Kvalseth, 1985). Hence, the median R2 across iterations was used to avoid the overestimation of model misfit.
Standing stock of organic carbon and nitrogen in surficial sediments
Using the map of porosity for the Firth of Clyde, the dry bulk density of the sediment (ρd) was calculated from sediment porosity (ϕ) assuming a sediment density (ρs) of 2.65 g cm−3 (Blake and Hartge, 1986) via
The masses of organic carbon and nitrogen were then calculated as the product of the proportion by mass of the organic element in dry sediment, dry bulk density, sediment depth, and polygon area.
3.1 Rock distribution
The distribution of hard substrate in the Firth of Clyde is shown in Fig. 6. Random forest model predictions suggest that the distribution of hard substrate within the inner Firth of Clyde and sea lochs is limited and largely confined to coastlines. Spatial cross-validation of model predictive performance showed an overall accuracy of 86.5 % and a sensitivity and specificity of 50.9 % and 89.7 %, respectively. The mean square error of averaged predictions was 0.0195.
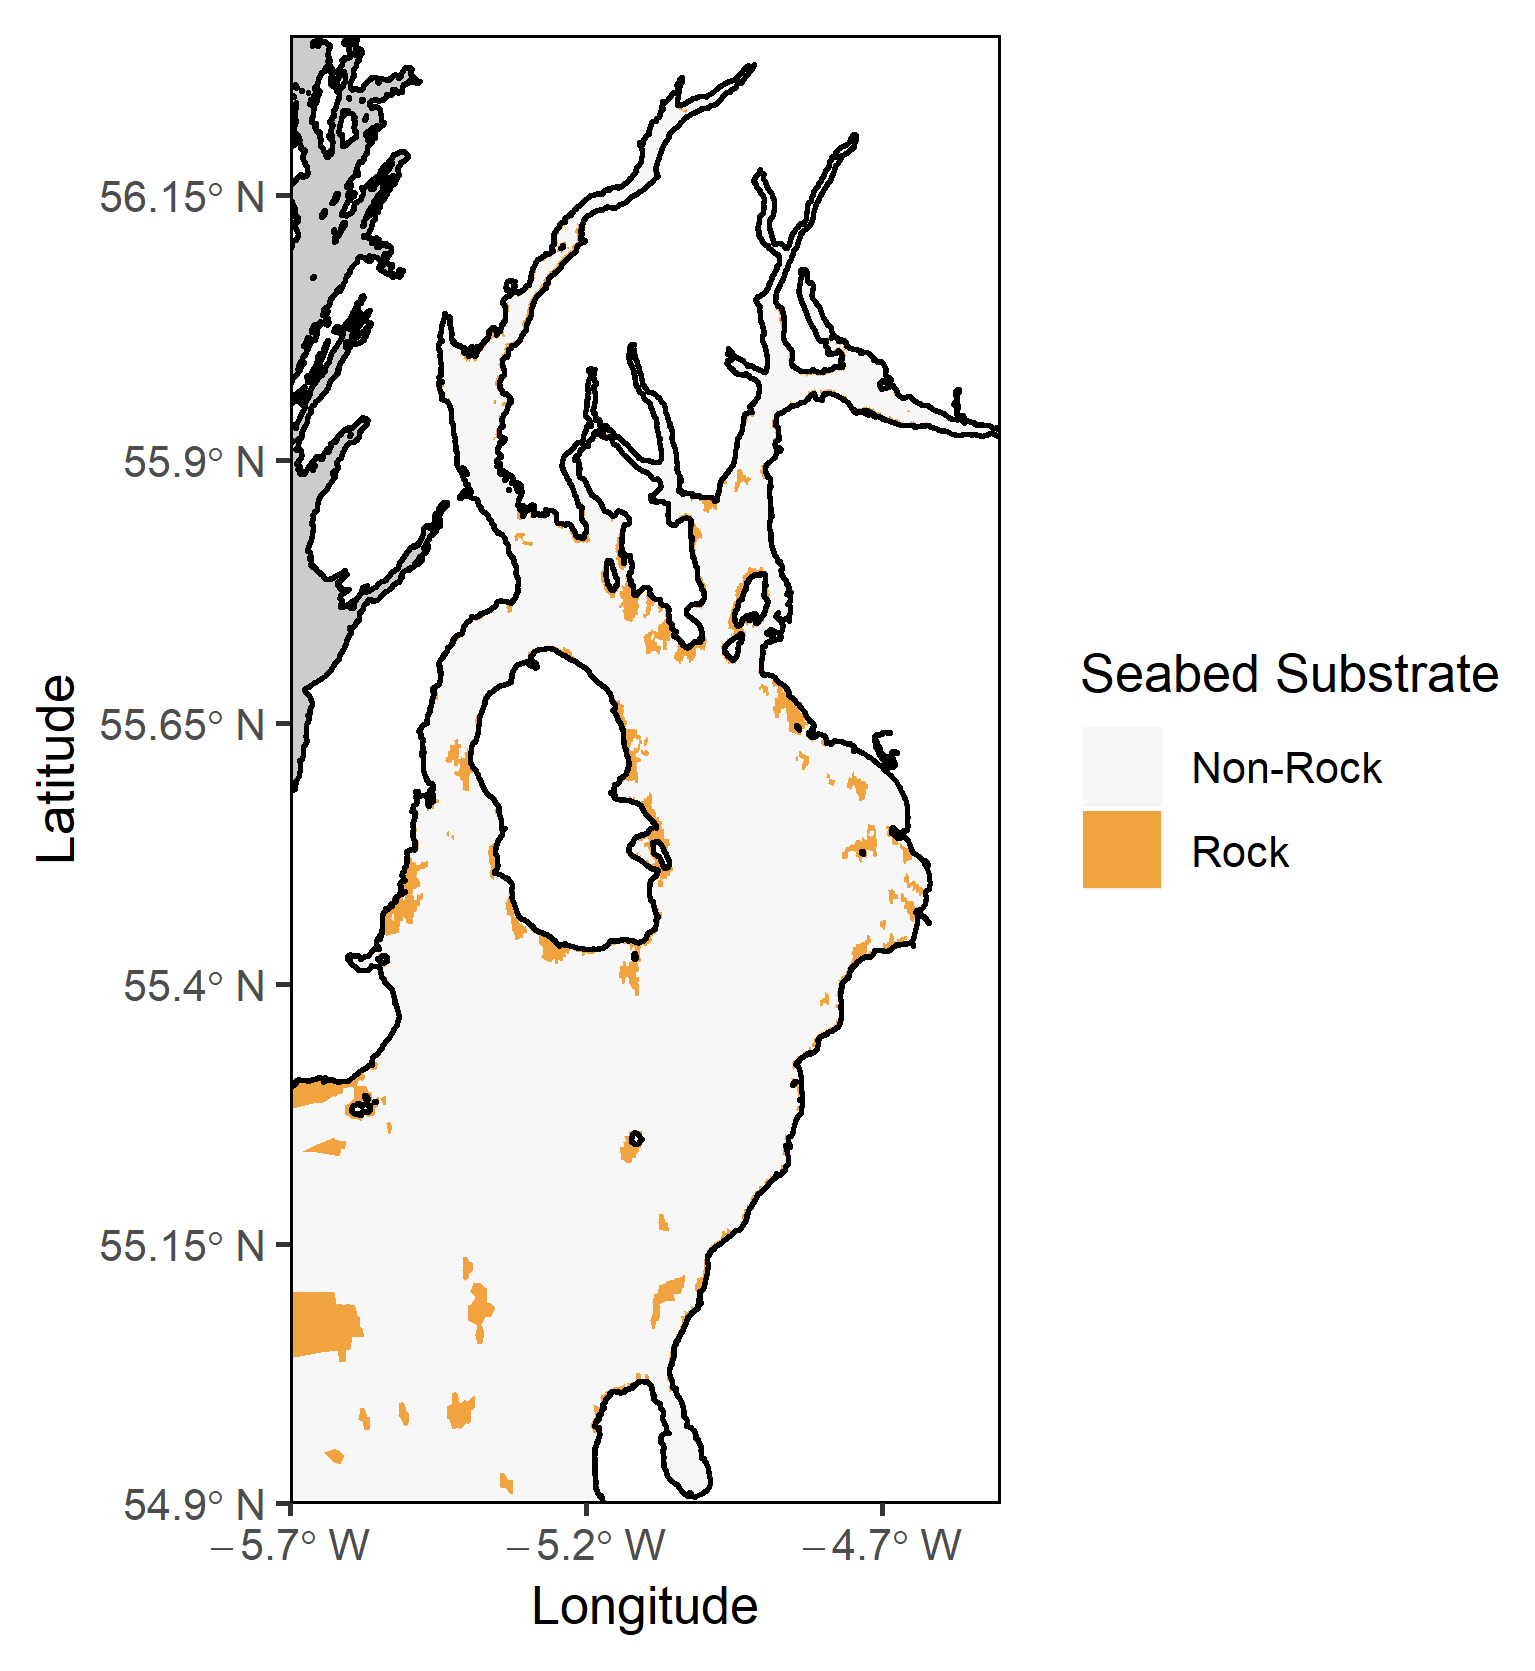
Figure 6Distribution of hard substrate in the Firth of Clyde according to BGS data layers and random forest model predictions generated for areas lacking data – the inner Firth of Clyde and sea lochs.
3.2 Sediment grain size fractions
Maps of predicted percentages of mud, sand, and gravel in the Firth of Clyde are shown in Fig. 7. Extensive areas in the outer Firth of Clyde, including the Arran Deep and Kilbrannan Sound, consist of sediments dominated by the mud fraction, with close to 100 % of particles having a diameter <63 µm. In the inner Firth of Clyde and sea lochs, the mud fraction dominates in the sediments of upper Loch Fyne, Holy Loch, and Loch Long. In contrast, sand dominates in coastal areas, especially along the Ayrshire coast, and on the Great Plateau, whereas the percentage of gravel in Clyde Sea sediments is almost universally low.
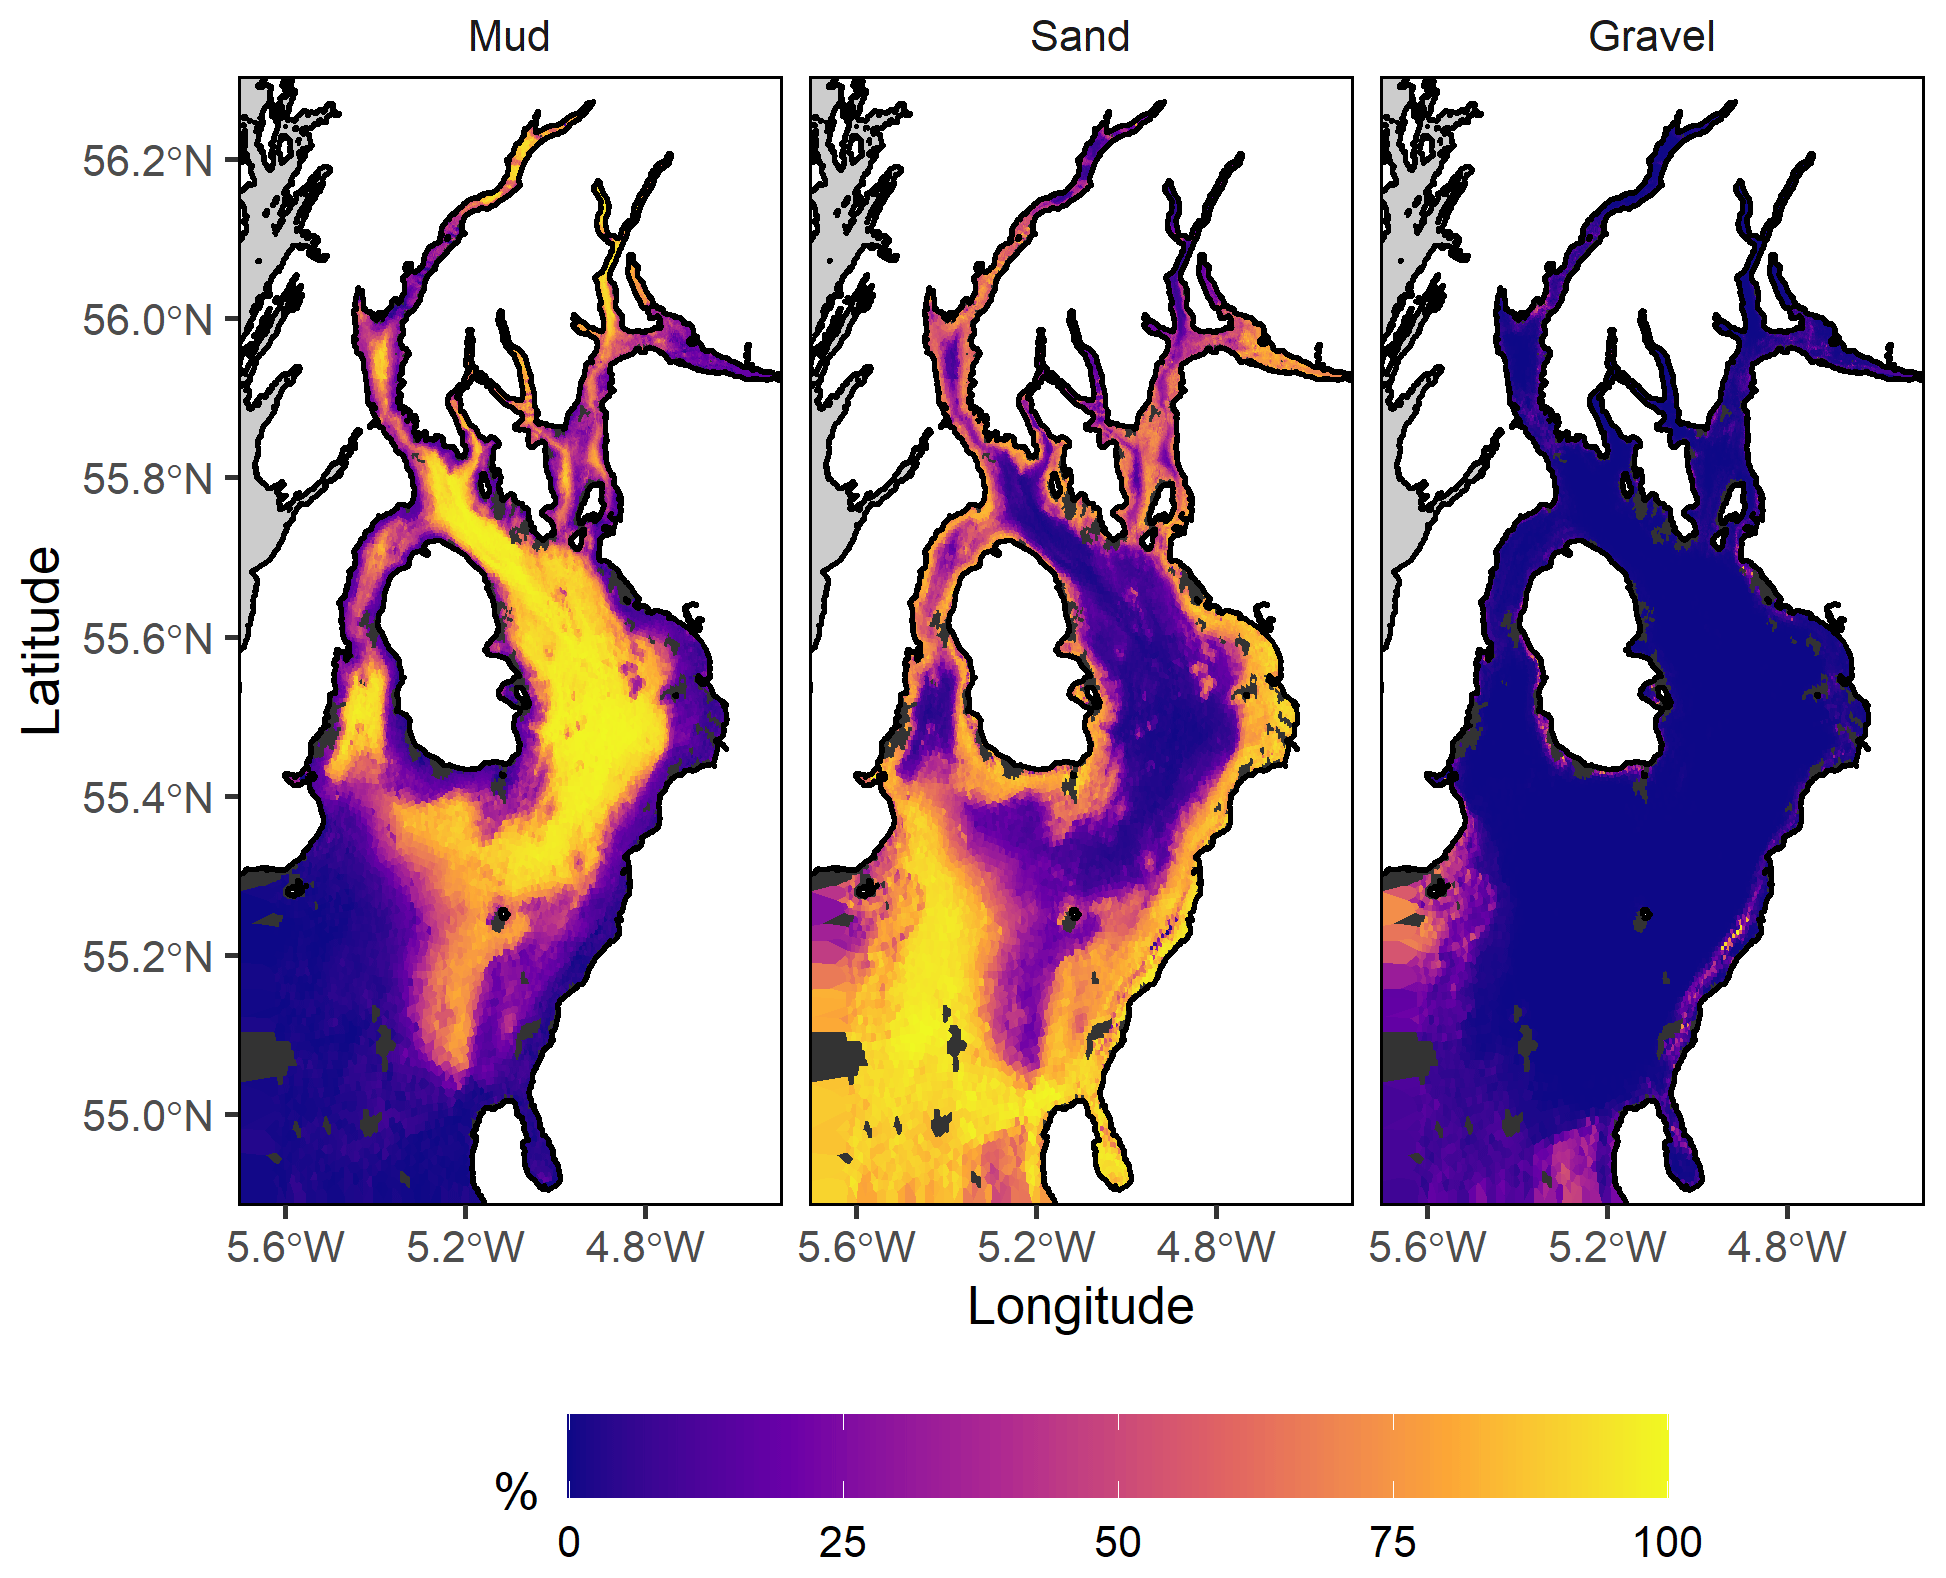
Figure 7Mapped percentages of mud, sand, and gravel within Firth of Clyde sediments predicted from random forest models.
Random forest models capture the variation in mud and sand content well. Spatial cross-validation results yield R2 values of 0.611, 0.382, and 0.321 for mud, sand, and gravel, respectively. Results from the map validation against independent data are shown in Fig. 8 and demonstrate good predictability of mud and sand percentages. R2 for mud and sand content from map validation against independent data were higher (R2 mud =0.635, R2 sand =0.611). However, prediction of gravel content is considerably poorer (R2 gravel =0.08).

Figure 8Comparison of predicted and observed percentages of (a) mud, (b) sand, and (c) gravel in Firth of Clyde seabed sediments. Observation data are recent measurements carried out in 2017 that were not used during model fitting. Predictions were generated from the sediment maps presented in Fig. 7. This is therefore an independent test of model and map predictive performance.
3.3 Median grain size
Leave-one-out cross-validation (LOOCV) of the GAM shows overall good agreement between predicted and observed measurements of sediment median grain size (Fig. 9). However, there is a mismatch between observations and predictions for sediments where the median grain size <0.02 mm. The model accounted for 90.76 % of the variance in the data.
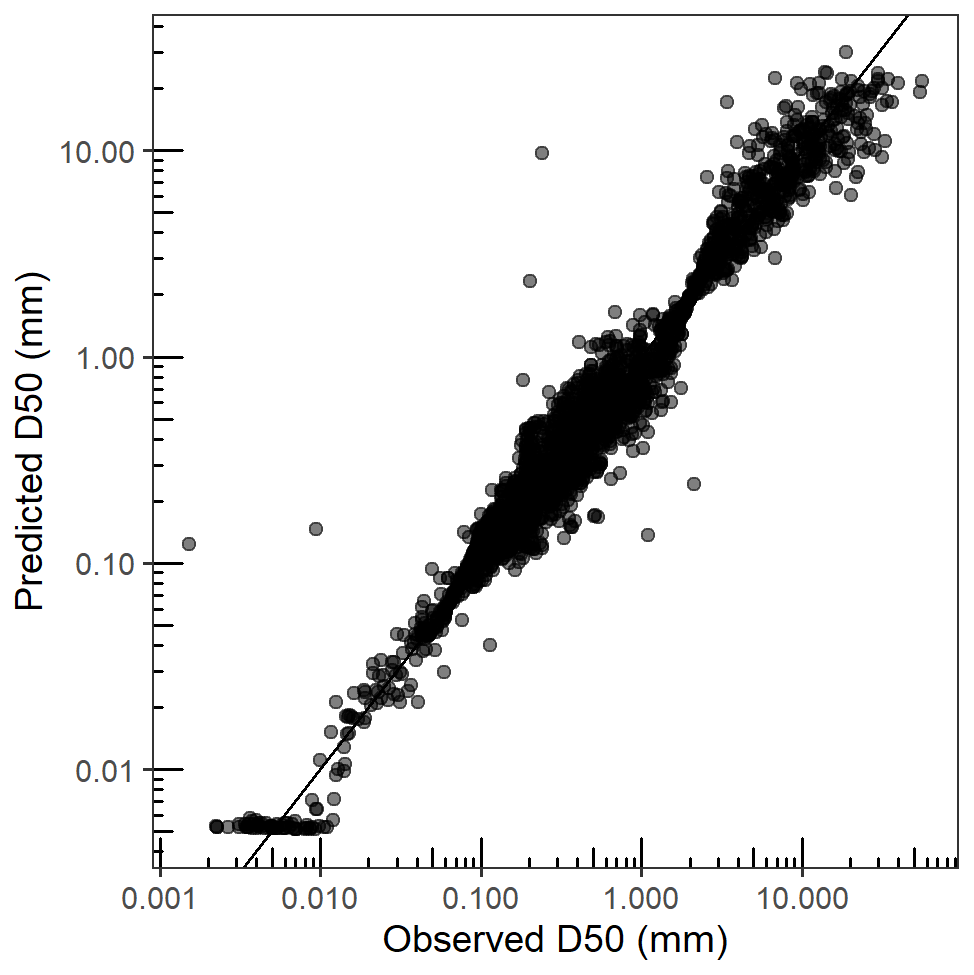
Figure 9Leave-one-out cross-validation results showing predicted and measured values of median grain size for a dataset comprising samples collected from cruises in the Firth of Clyde in April and October 2017 and supplemented with data from the North Sea, Celtic Sea, and English Channel collected by CEFAS and MSS (n=3244). Note log 10 scale.
Following spatial variation in the fractions of mud and sand, the median grain size of seabed sediments in the Firth of Clyde is smallest in the Arran Deep and Inchmarnock Water and largest in the shallow waters along the Ayrshire coast and the Great Plateau (Fig. 10).

Figure 10Mapped predictions of median grain size for seabed sediments in the Firth of Clyde.
3.4 Permeability and porosity
The combined permeability dataset suitably covered a range of sediment types ranging from very fine-grained sediment to sandy sediments. Sediment permeability in the Firth of Clyde is well predicted by both the median grain size and percentage of mud content (Fig. 11). The fitted relationships with mud and median grain size capture 82.3 % and 91.5 % of the variance in the data, respectively.
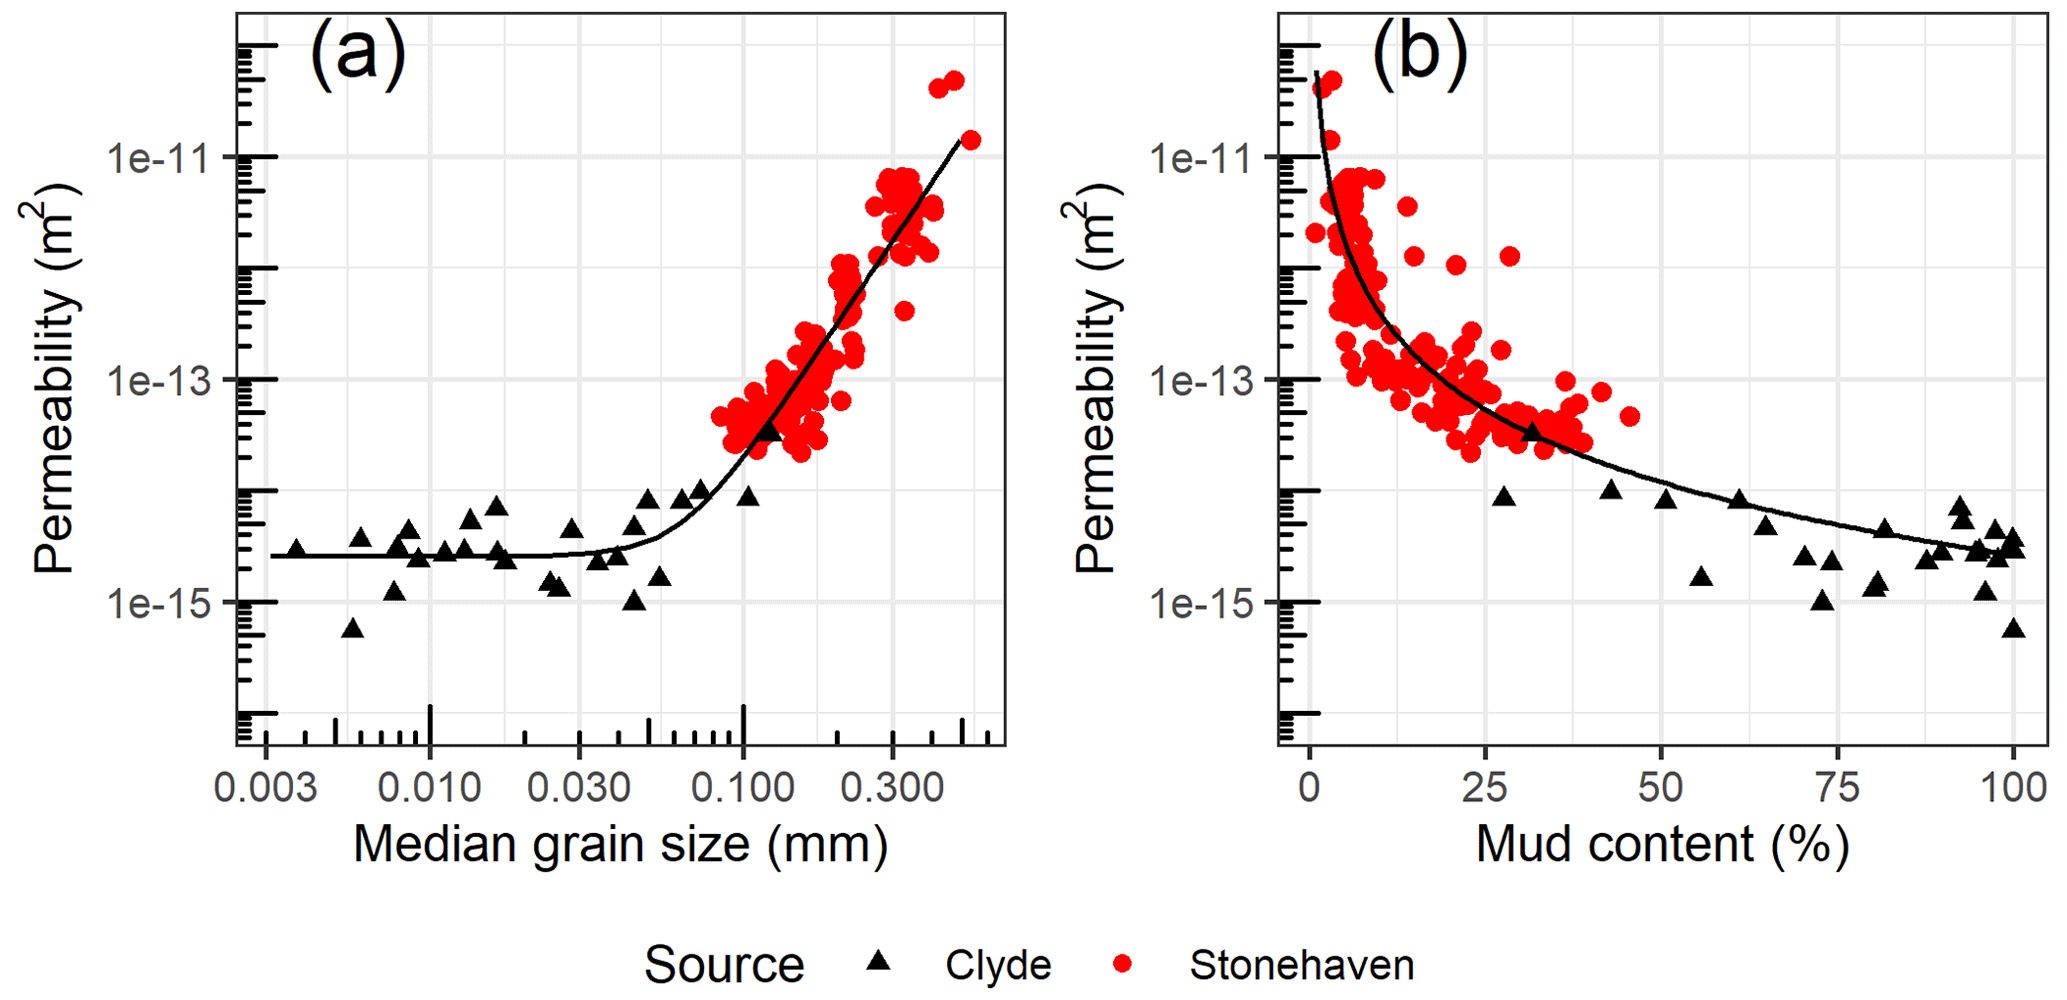
Figure 11Relationship between sediment permeability (m2) and (a) median grain size (mm) and (b) percentage of mud content for measurements from the Firth of Clyde (black triangles) and samples from the North Sea analysed by Serpetti et al. (2016) (red points). Fitted relationships for the combined data are shown by a solid line. Note log 10 scale.
The fitted sediment permeability relationships with median grain size and mud content are given by
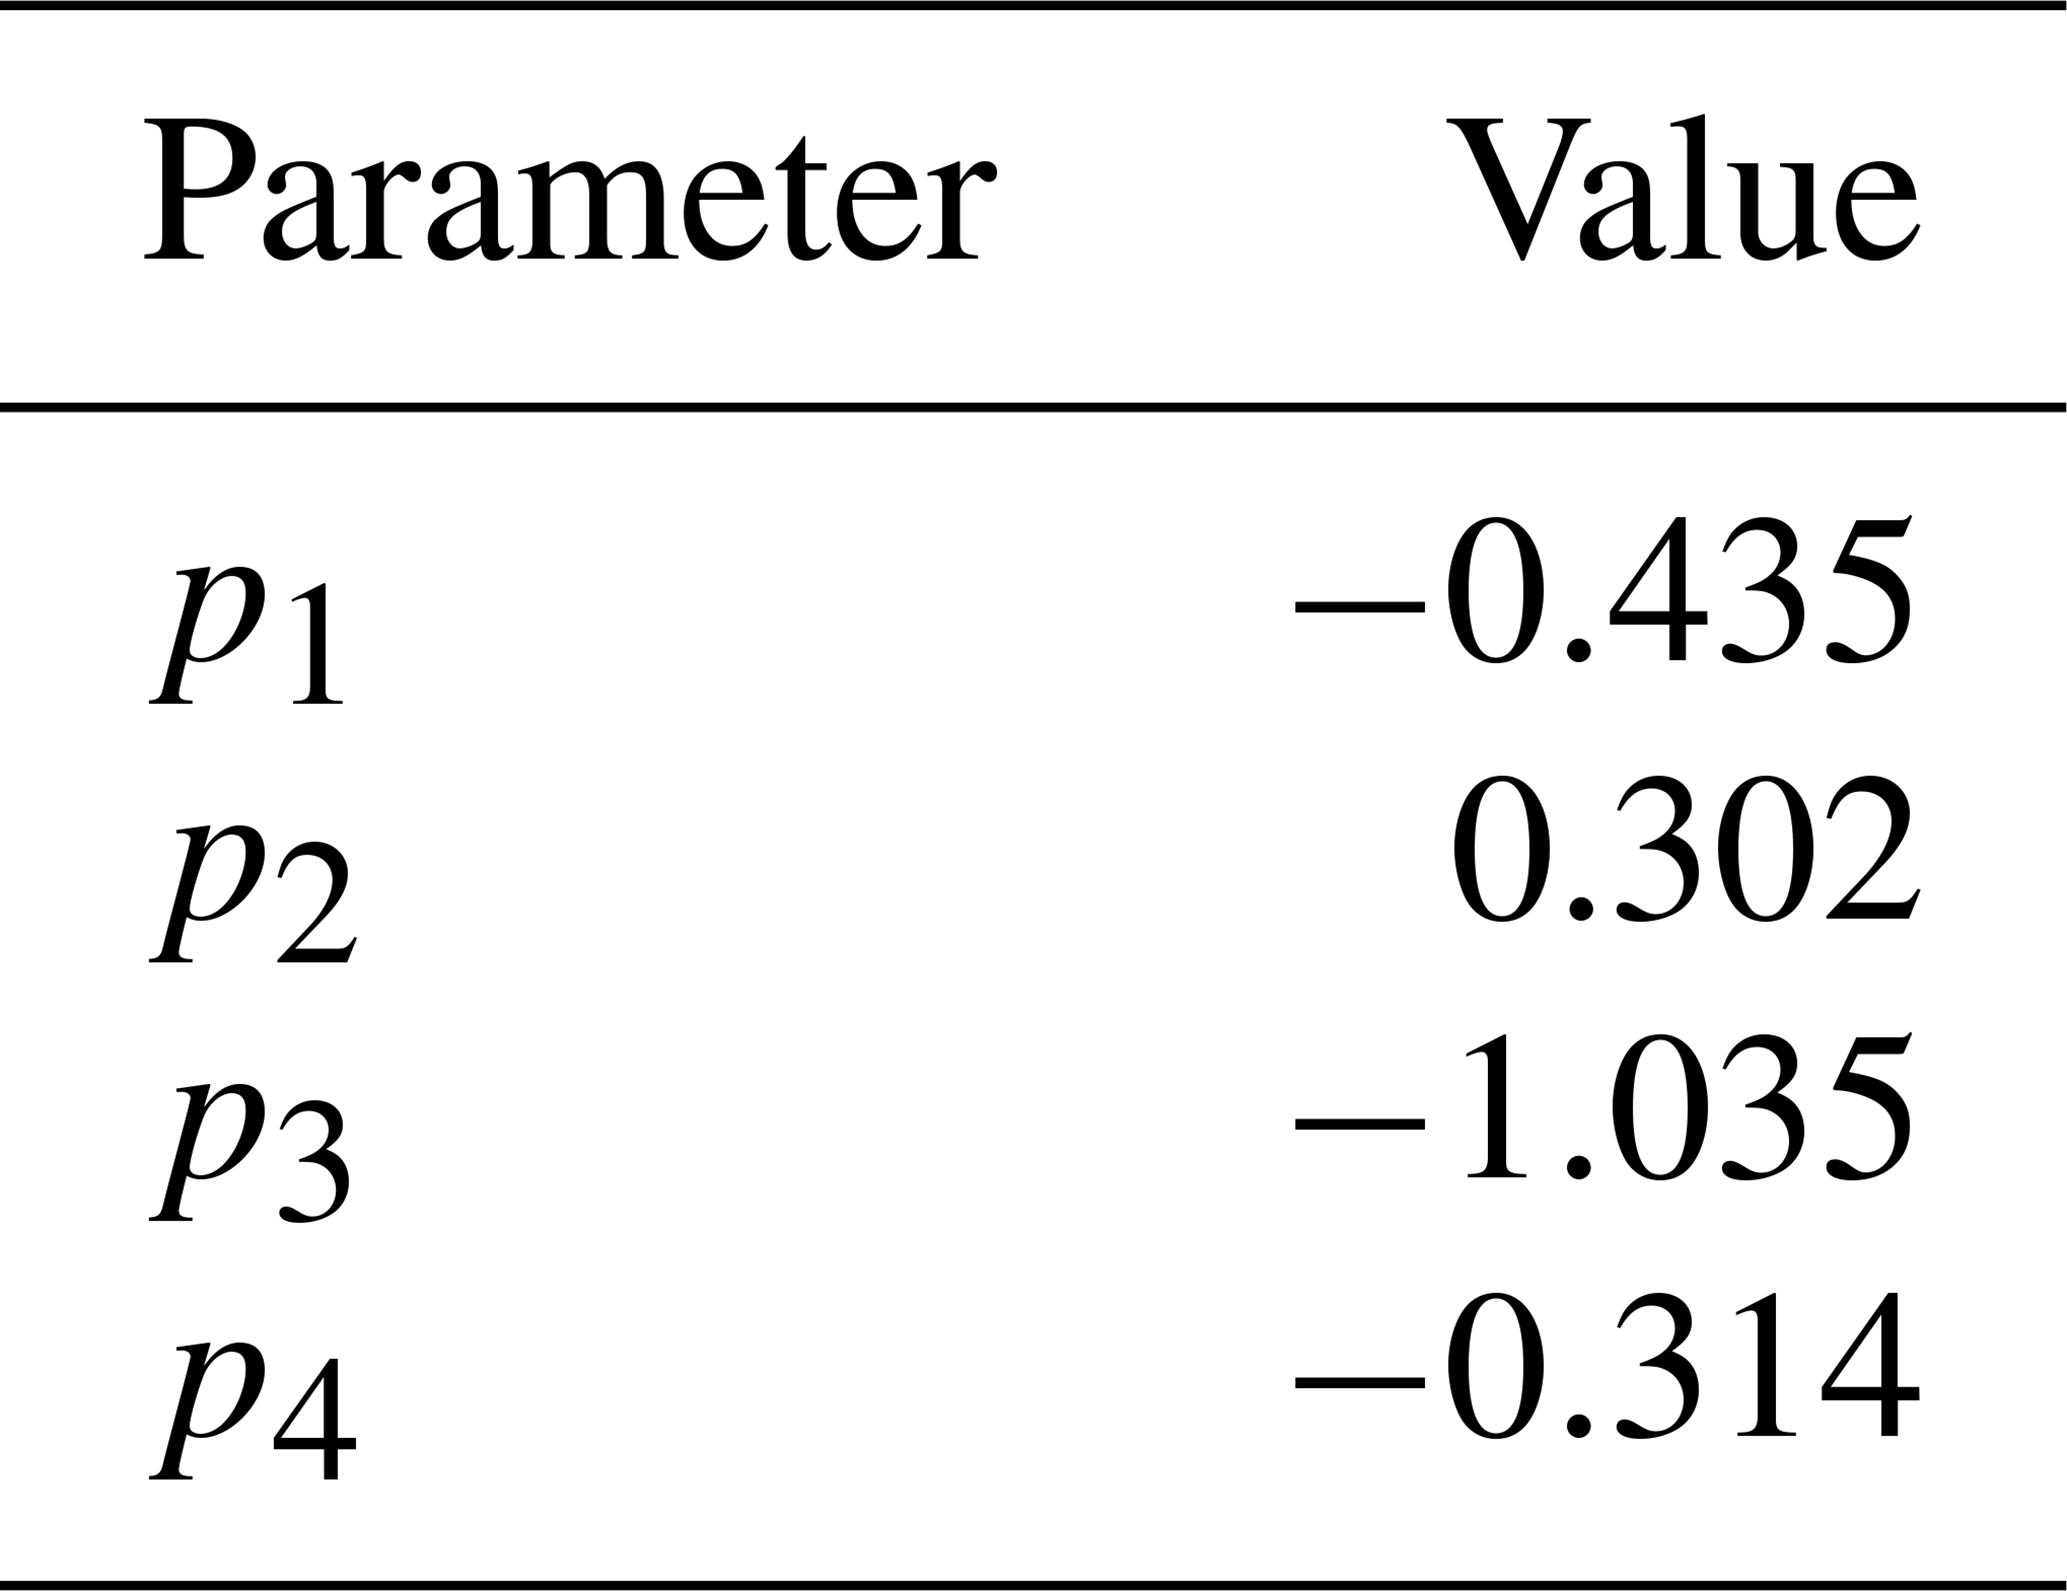
Porosity is predicted by median grain size and percentage of mud content (Fig. 12) with fitted relationships capturing 77.6 % and 72.2 % of the variance in the data, respectively. The parameters for the fitted logistic function for the relationship with median grain size in the top 10 cm of seabed sediment are shown in Table 3. The fitted porosity relationship with percentage of mud content is given by

Figure 12Relationship between sediment porosity (%) and (a) median grain size (mm) and (b) percentage of mud content for measurements for the top 10 cm seabed sediment on a log 10 scale.
Table 3Fitted parameter values for the logistic relationship between sediment porosity and median grain size in the top 10 cm of seabed sediment.
The relationship between sediment permeability and mud content, rather than median grain size, was chosen to map the distribution of seabed sediment permeability in the Firth of Clyde (Fig. 13a) because the prediction dataset is one step closer to measured data. The vast majority of the Firth of Clyde is dominated by sediments having a permeability m2. This implies that sediments are impervious, and solute exchange between the seabed and water column is diffusion-mediated (Huettel et al., 2003).
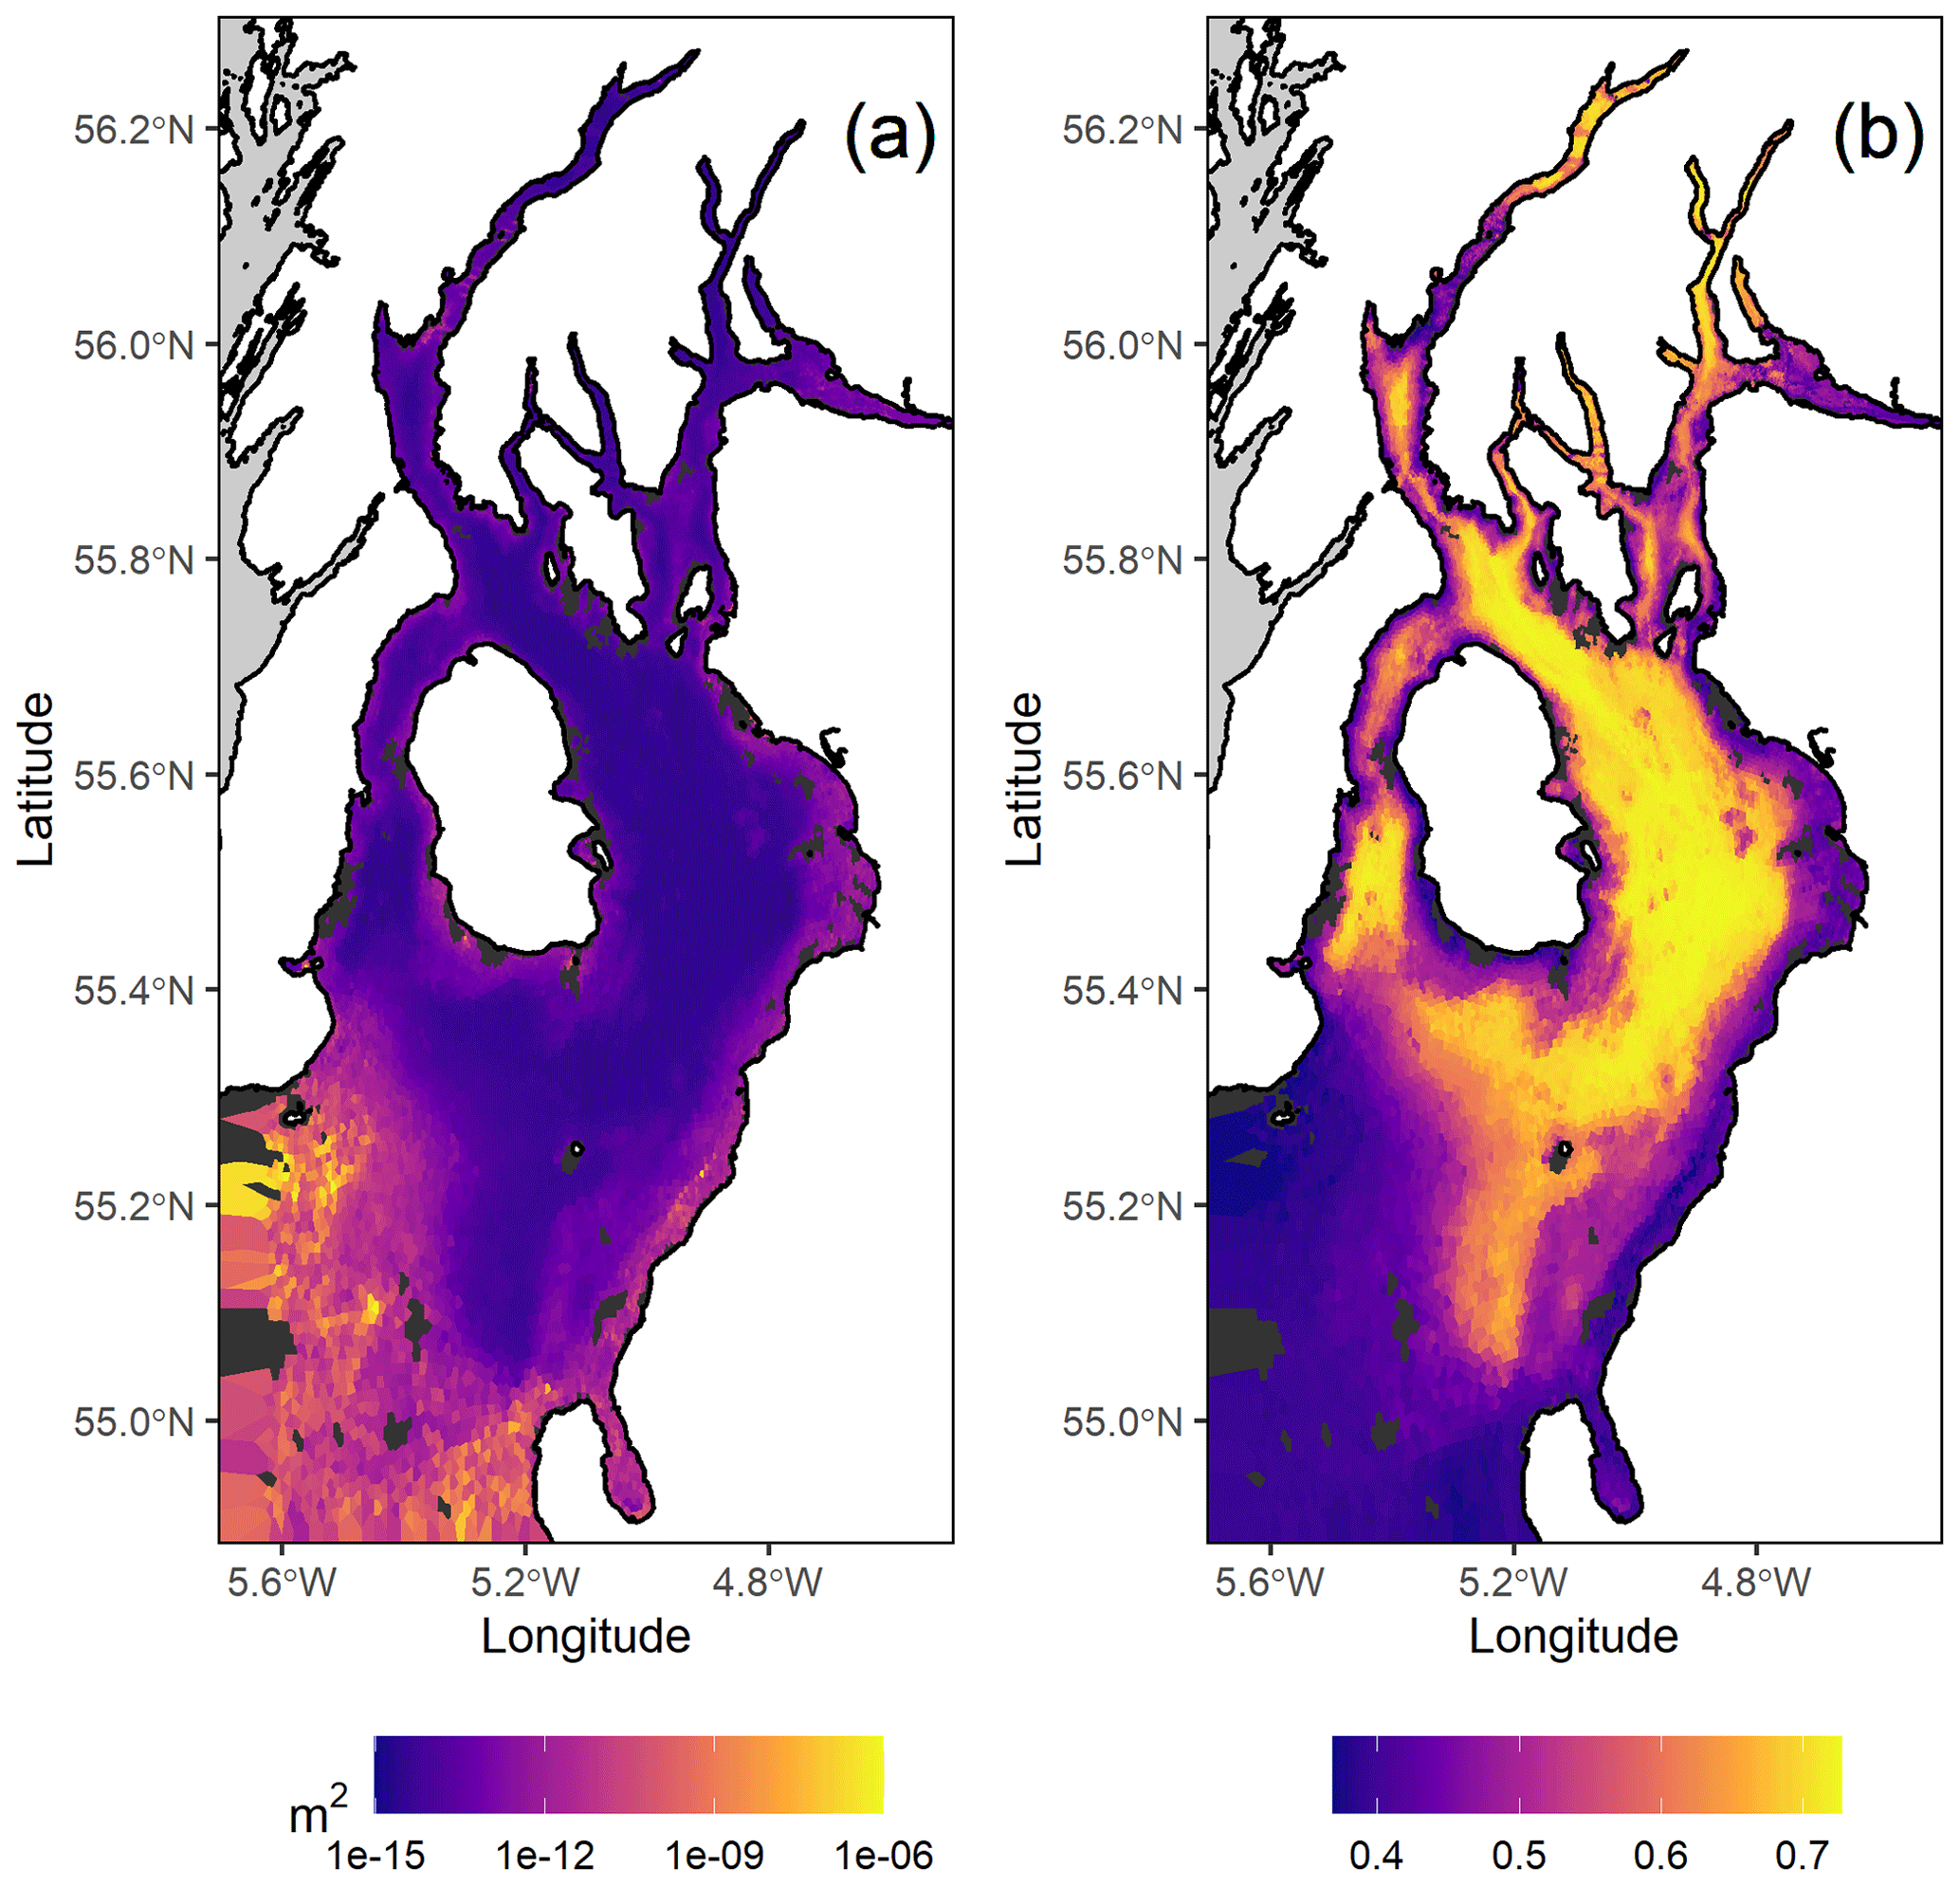
Figure 13Mapped predictions of (a) sediment permeability and (b) sediment porosity in the Firth of Clyde. Seabed consisting of hard substrate or sediments with a predicted permeability greater than m2 is shown as black areas. Permeability predictions were generated from the map of percentage mud content in seabed sediments. Porosity was predicted from the map of median grain size in the Firth of Clyde.
3.5 Natural seabed abrasion
Extensive areas of the Clyde Sea, particularly Inchmarnock Water, the inner Firth of Clyde, and Loch Fyne, appear to experience negligible annual sediment movement (Fig. 14). Sediment moves for up to 25 % of the year in some areas of the outer firth.

Figure 14Mapped predictions of (a) annual mean bed shear stress and (b) sediment mobility in terms of the annual percentage of time that sediment motion occurs in the Firth of Clyde.
3.6 Sediment organic matter content
Cross-validated RFE substantially improved model predictions for both organic carbon and nitrogen. The initial models of organic carbon and nitrogen each contained 16 predictors and had a cross-validation R2 of 0.387 and 0.561, respectively. Optimal models for particulate organic carbon and nitrogen each comprise four environmental variables, shown in Table 2, and have an R2 of 0.566 and 0.789, respectively.
Maps of predicted percentage of organic carbon and nitrogen per gram dry weight sediment are shown in Fig. 15. Although salinity was selected out of the optimal model, there remains a pattern of increased organic carbon and nitrogen enrichment in fine-grained inner firth sediments in proximity to sources of freshwater run-off.

Figure 15Maps of predicted percentage of dry weight sediment (a) organic carbon and (b) organic nitrogen content within the top 10 cm of seabed in the Firth of Clyde.
Deviations from the Redfield ratio (molar ratio ) are seen in areas close to sources of terrestrial organic matter input (inner firth, Loch Fyne, Ayrshire coast) (Fig. 16). By calculating the bulk density of the sediment, the total mass of organic carbon and nitrogen in the top 10 cm of Firth of Clyde sediments is estimated as 3.42 and 0.33 million t, respectively.
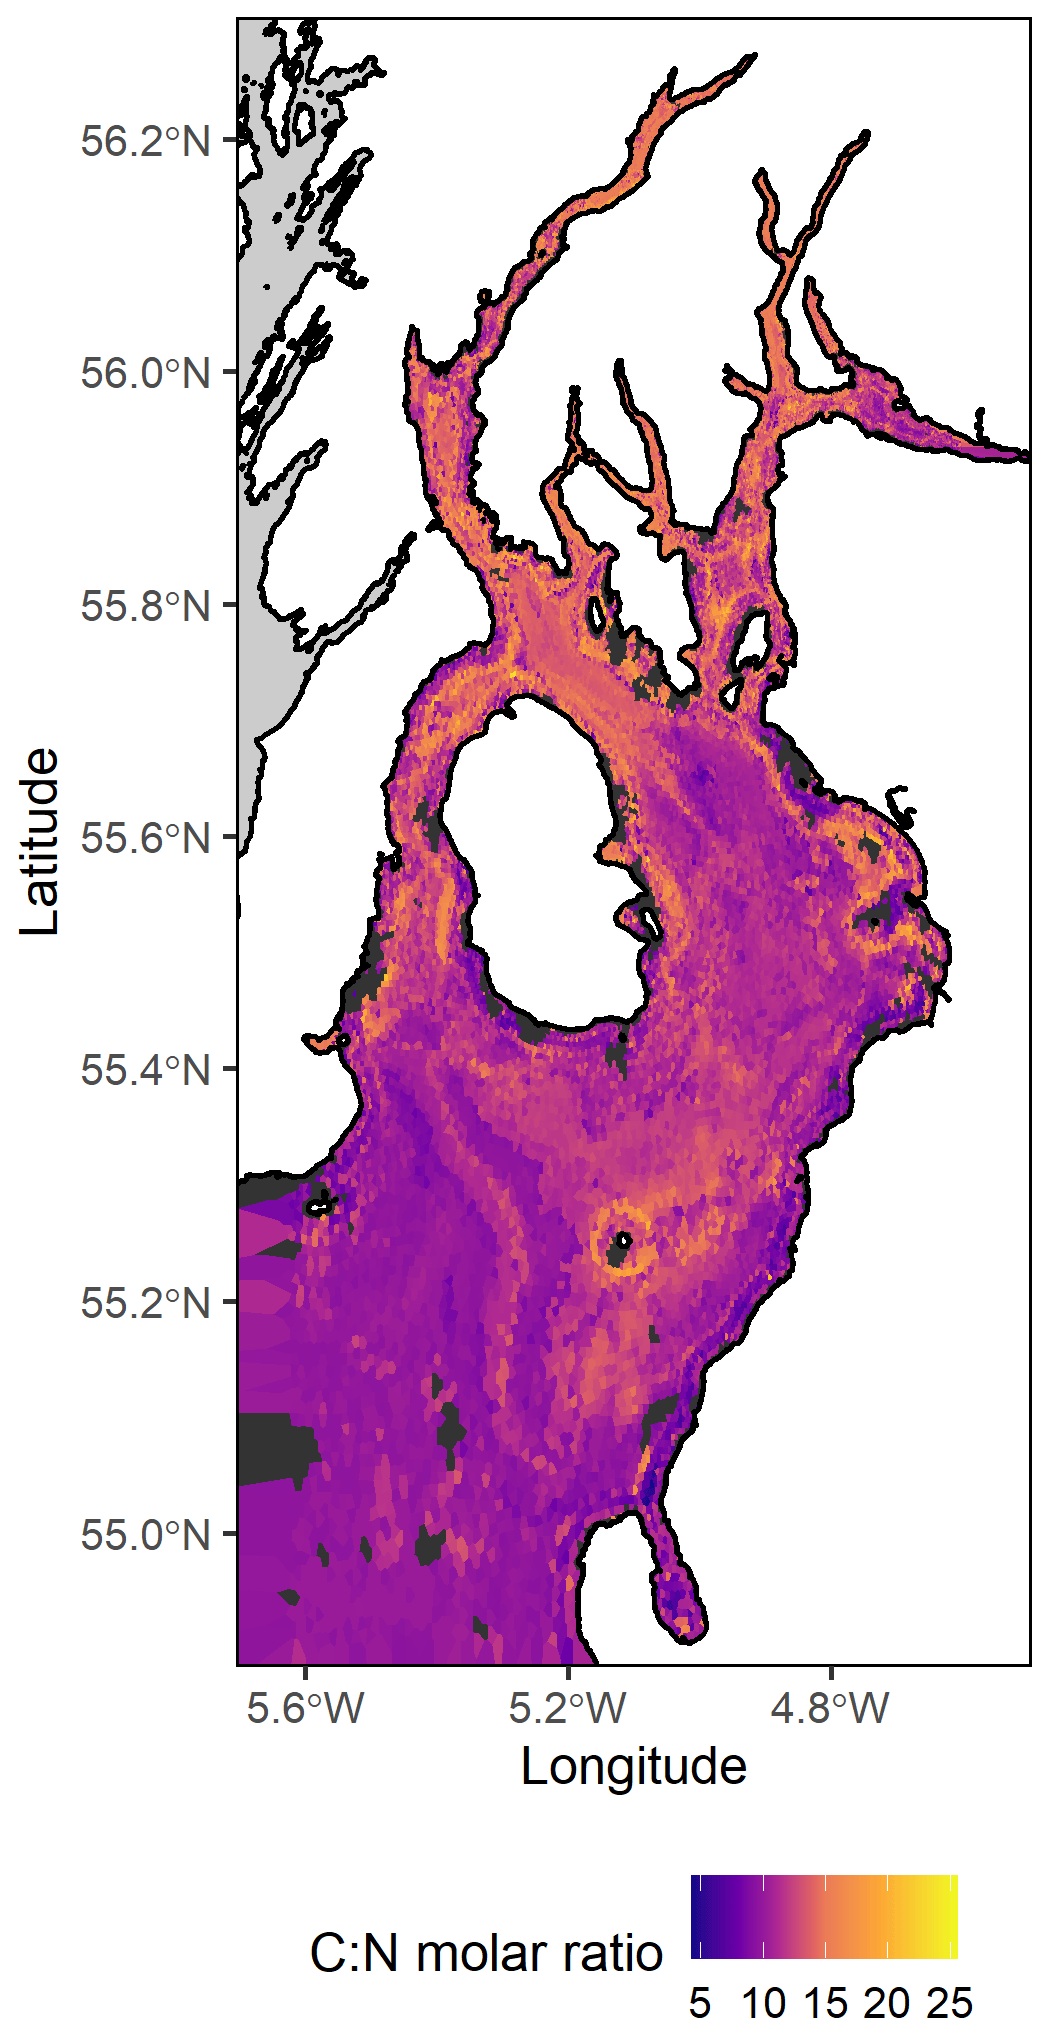
Figure 16Variation in the predicted organic carbon–nitrogen molar ratio.
Mapped data products are available in csv and netCDF format from https://doi.org/10.15129/2003faa2-ee93-4c11-bb16-48485f5f136d (Heath and Pace, 2021).
The maps of surficial sediment grain size fractions, whole-sediment median grain size, permeability, porosity, whole-sediment organic carbon and nitrogen content, and seabed natural disturbance presented in this study fill a current data gap for the Clyde. The variable spatial resolution allowed by the irregular grid arrangement suitably captures the fine-scale transition from coarser-grained sediment close to the coast to fine-grained sediments in deeper offshore waters.
Confidence in the predicted distributions of seabed mud, sand, and organic carbon and nitrogen content is high, with validation procedures showing that the maps accounted for ∼60 % of the variation in the independent data. However, the fraction of gravel in samples was low or negligible in most samples, and this is reflected in the poor confidence implied by the validation results. Conversely, mud content is a key predictor of several biogeochemical and geotechnical properties, including sediment permeability and organic carbon content, and given the abundance of muds within the Firth of Clyde, accurate predictions of sediment mud content and the discrimination of mud-rich and sandy areas are important benchmarks for these data products.
Comparison of mud content predictions generated from sediment grain size fraction maps with measurements from recently collected seabed sediment samples shows credible discrimination of mud-rich sediments from sands and muddy sands. However, maps consistently underpredict the mud content of seabed clay samples. This may be a limitation of the sample processing methodology adopted for the collection of independent validation data. These data were derived from subsamples collected from each grab (Sect. 2.3), whereas the BGS data that largely drive mud content predictions were derived from the stacked-sieve processing of the whole grab sample (Deegan et al., 1973). Nevertheless, this approach is a robust test of the performance of these maps as predictions are also impacted by mapping resolution and local-scale sediment heterogeneity. Sedimentology data from future survey efforts will help refine estimates of the predictive performance of the presented data products as well as contribute to improved iterations of seabed sediment maps for the Firth of Clyde.
The spatial distribution of organic carbon in the surficial sediments of the Clyde and the predicted molar ratios of carbon and nitrogen agree remarkably well, at a coarse scale, with patterns reported by Pearson et al. (1986). This may indicate that spatial patterns of sediment organic carbon and nitrogen are a relatively stable feature of the Clyde. The organic enriched muddy sediments in upper Loch Fyne, Loch Striven and the Kyles of Bute, the inner Clyde sea lochs, and the Inchmarnock basin coincide with areas of very low seabed disturbance. This may indicate that enrichment patterns are due to long-term organic matter deposition over eutrophic seabed. Although mud content was the most important predictor of organic carbon and nitrogen, corroborating previous work (Diesing et al., 2017; Wilson et al., 2018), this relationship was strongly dependent on other environmental variables, particularly the proximity to terrestrial areas and local bed shear stress, indicating that organic matter–sediment type relationships cannot be generalised across different regions.
Conversely, measurements of sediment permeability in the Clyde map onto median grain size relationships established for the North Sea and extend these relationships to finer-grain sediments. The updated relationships may be applied to a wide range of sediment types collected from diverse marine coastal regions. A new relationship with the percentage mud content in sediment is presented to allow the prediction of permeability in mud-rich sediments.
Contrasting with patterns found by Wilson et al. (2018) in the North Sea, the overall high mud content of Clyde marine sediments leads to large seabed areas with a predicted sediment permeability well below 10−12 m2. Despite the expectation that shallow coastal sands would have permeabilities exceeding this threshold (Serpetti et al., 2016; Wilson et al., 2008), this was only observed for limited areas of the South Ayrshire coast.
The mass of organic carbon in the surficial sediments of the Clyde was calculated to be 3.42 million t within a 3739 km2 area. This complements recent larger-scale and detailed mapping of carbon stocks in coastal and shelf sediment within the UK Exclusive Economic Zone (EEZ) by Smeaton et al. (2021) by better resolving transitions in the carbon storage characteristics of fjordic sediments and the muds of the outer firth. Smeaton et al. (2021) characterised organic carbon content for a range of sediment types within broadly delineated fjordic and open shelf areas to address underestimates in the organic carbon stock of inshore and coastal mud within previous works. Their mapped sediment organic carbon content for fjordic sea lochs of the Clyde compare well with the data products presented here. However, our work shows organic-carbon-enriched sediments in the Inchmarnock basin that are not captured by Smeaton et al. (2021) and provides a more credible transition in the carbon storage characteristics between Clyde sea loch and open firth sediments.
The frequency of seabed trawling disturbance, estimated via the mean annual swept-area ratio, was not a predictor of sediment of organic carbon or nitrogen in the Clyde. This suggests that present patterns of demersal trawling do not contribute to measurable differences in sediment organic carbon and nitrogen within the Firth of Clyde. However, this finding does not account for the potential historical large-scale redistribution of organic matter (sensu Pusceddu et al., 2014) due to transport of resuspended sediments with the onset of demersal trawling in this shallow coastal marine system. Moreover, this does not imply that sedimentary organic matter is unaffected by the periodic resuspension of seabed sediments by the passage of demersal trawl gear. More detailed geochemical studies addressing the deposition, remineralisation, and burial rates of organic matter are needed to provide a more complete assessment of the impact of trawling activity on carbon sequestration and storage in the marine sediments of the Firth of Clyde. Nevertheless, the maps presented here will contribute to these efforts. Coupled with mapped distributions of anthropogenic and natural seabed abrasion pressure, these maps are expected to be particularly useful for the assessment of seabed sensitivity to changes in disturbance regime and the maintenance of seafloor integrity.
Limitations
A key challenge in mapping Clyde sediment was the large variation in the availability of high-quality data for critical sediment properties across the range of environmental gradients represented in the region. Therefore, whole-sediment median grain size measurements from surrounding shelf seas were used to parameterise a statistical relationship between the whole-sediment median grain size and fractions of mud, sand, and gravel. This approach provided credible predictions of whole-sediment median grain size for a wide range of sediment types, but the model was insensitive to variation in median grain size <0.02 mm. This is a methodological limitation; the model depends on information from the mud–sand ratio to track the variation in median grain size, and mud-only sediments do not provide this information. However, the impact of this model mismatch for derived maps of sediment geotechnical properties is limited as the data suggested a decoupling of relationships with median grain size below 0.02 mm.
There is limited good data on the fine-scale distribution of rocky outcrops and hard substrata for coastal seabed around the UK, including the Firth of Clyde. The available data were in the form of polygons with limited information to distinguish between rocks, boulders, and rock covered by a layer of sediment. Cross-validation results suggest high overall accuracy in the discrimination of hard and soft substrata, but the coarse thematic resolution of the source data yields little information on structural complexity and heterogeneity of areas of rocky seabed that may be valuable for ecological modelling applications (Elliott et al., 2017). Although rock and gravel areas comprise a small proportion of the overall Firth of Clyde, more work is needed to refine these maps.
Random forest models performed well, capturing the critical features in the spatial distributions of properties investigated in this paper. However, random forest models may perform poorly when extrapolating predictions to new geographic areas (Misiuk et al., 2019), in part because predictions do not extrapolate beyond the range of observation data used in model fitting. Accordingly, maps of data-limited properties, such as sediment organic carbon and nitrogen, may not capture the extreme values that may occur in the understudied muds of fjordic sea lochs (Smeaton and Austin, 2019).
The maps assume that no changes in distribution of sediment properties occurred as a result of any changes in disturbance regime over time. This assumption is supported by very low tidal currents over much of the Clyde (Davies et al., 2004) and the fact that fishing pressure was not retained as a predictor of organic carbon and nitrogen concentration in Clyde sediments. Additional work is needed to define permeability and grain size relationships in coarser sediments with a median grain size greater than 0.6 mm. Hence, sediment permeability estimates greater than 10−11 m2 may be unreliable. Nevertheless, this constitutes a small fraction of the mapped area.
If the organic matter content associated with the gravel fraction (>2 mm) is negligible, the percentage of particulate organic carbon content (POC) of the whole sediment is given by
where mmud and msand are the masses of organic carbon respectively associated with the proportions of mud (pmud) and sand (psand). If the POC and mass fraction of carbon associated with mud (g C g−1) are known, then the mass of carbon associated with sand may be determined via
The mass fraction of carbon associated with sand (g C g−1 sand) was calculated for CEFAS data collected from the North Sea (n=148) and five grab samples collected from the Firth of Clyde in April and October 2017.
Figure A1 shows that there is no relationship between the mass fractions of carbon associated with sand and mud, suggesting that a single value for the mass fraction of carbon in sand may be applied to any sediment. Taking the mean carbon in sand mass fraction for the available data yields 0.000301 g C g−1 sand.

Figure A1Relationship between (a) the mass fraction of organic carbon in mud (g C g−1 mud) and in sand (g C g−1 sand) and (b) the mass fraction of organic nitrogen in mud (g N g−1 mud) and in sand (g N g−1 sand) for sediment collected from the North Sea by CEFAS and the Clyde Sea.
These formulae were also used to calculate the mass fraction of nitrogen associated with sand (g N g−1 sand) for CEFAS (n=138) and Clyde Sea (n=5) data. Similarly, no relationship between the mass fractions of nitrogen associated with sand and mud was observed (Fig. A1). The mass fraction of nitrogen in sand may potentially vary as a function of the sand content. However, noise in the data prevents parameterisation of this relationship, and hence a mean nitrogen-in-sand mass fraction is used (0.000117 g N g−1 sand).
The supplement related to this article is available online at: https://doi.org/10.5194/essd-13-5847-2021-supplement.
MP, MH, HS, DB, and DS designed the analysis. MP, DB, and HS collected samples and carried out laboratory analysis of sediments. MP and HS carried out compilation of data and modelling. MP drafted the manuscript, and all authors contributed to the writing of the manuscript.
The contact author has declared that neither they nor their co-authors have any competing interests.
Publisher’s note: Copernicus Publications remains neutral with regard to jurisdictional claims in published maps and institutional affiliations.
We thank Jamie Reid and Myles O'Reilly (SEPA) for marine sediment data for the Firth of Clyde, Dan Edwards (JNCC) for access to swept-area ratio data, and Natalia Serpetti for access to disaggregated sediment permeability and porosity measurements. We are grateful to Eric Dalgarno, Gerald McAllister, Melinda Choua, and the skippers and crews of RV Alba na mara and RV Sir John Murray for facilitating the collection and processing of samples and to Colin Abernethy and Sharon McNeill (SAMS) for help in the laboratory analysis of samples. We thank Robert Wilson for numerous insightful discussions on the analysis and mapping of coastal marine sediments. Research vessel time was provided by Marine Scotland Science. We are grateful to the two anonymous reviewers of this paper for their insightful comments and suggestions. Support from the Marine Alliance for Science and Technology for Scotland (MASTS) and NatureScot is gratefully acknowledged.
This research has been supported by NatureScot and the Marine Alliance for Science and Technology for Scotland (MASTS is funded by the Scottish Funding Council (grant reference HR09011) and contributing institutions).
This paper was edited by Jens Klump and reviewed by two anonymous referees.
Aitchison, J.: Principles of compositional data analysis, Lecture Notes-Monograph Series, 24, 73–81, 1994.
Akima, H. and Gebhardt, A.: akima: Interpolation of Irregularly and Regularly Spaced Data [code], available at: https://cran.r-project.org/package=akima (last access: 15 March 2019), 2020.
Aldridge, J. N., Parker, E. R., Bricheno, L. M., Green, S. L., and van der Molen, J.: Assessment of the physical disturbance of the northern European Continental shelf seabed by waves and currents, Cont. Shelf Res., 108, 121–140, https://doi.org/10.1016/j.csr.2015.03.004, 2015.
Avelar, S., van der Voort, T. S., and Eglinton, T. I.: Relevance of carbon stocks of marine sediments for national greenhouse gas inventories of maritime nations, Carbon Balance and Management, 12, 10, https://doi.org/10.1186/s13021-017-0077-x, 2017.
Blake, G. R. and Hartge, K. H.: Bulk density, in: Methods of Soil Analysis, Part 1 – Physical and Mineralogical Methods, edited by: Klute, A., Soil Science Society of America (SSSA)/American Society of Agronomy, Inc. (ASA)), Madison, Wisconsin, 363–382, 1986.
Blott, S. J. and Pye, K.: GRADISTAT: a grain size distribution and statistics package for the analysis of unconsolidated sediments, Earth Surf. Proc. Land., 26, 1237–1248, https://doi.org/10.1002/esp.261, 2001.
Bockelmann, F. D., Puls, W., Kleeberg, U., Müller, D., and Emeis, K. C.: Mapping mud content and median grain-size of North Sea sediments – A geostatistical approach, Mar. Geol., 397, 60–71, https://doi.org/10.1016/j.margeo.2017.11.003, 2018.
Bolam, S. G., Garcia, C., Eggleton, J., Kenny, A. J., Buhl-Mortensen, L., Gonzalez-Mirelis, G., van Kooten, T., Dinesen, G., Hansen, J., Hiddink, J. G., Sciberras, M., Smith, C., Papadopoulou, N., Gumus, A., Van Hoey, G., Eigaard, O. R., Bastardie, F., and Rijnsdorp, A. D.: Differences in biological traits composition of benthic assemblages between unimpacted habitats, Mar. Environ. Res., 126, 1–13, https://doi.org/10.1016/j.marenvres.2017.01.004, 2017.
Breiman, L.: Random Forests, Mach. Learn., 45, 5–32, https://doi.org/10.1023/A:1010933404324, 2001.
Burrows, M. T., Kamenos, N. A., Hughes, D. J., Stahl, H., Howe, J. A., and Tett, P.: Assessment of carbon budgets and potential blue carbon stores in Scotland's coastal and marine environment: Scottish Natural Heritage Commissioned Report No. 761, Scottish Natural Heritage, 90 pp., 2014.
Cavalli, M., Tarolli, P., Marchi, L., and Dalla Fontana, G.: The effectiveness of airborne LiDAR data in the recognition of channel-bed morphology, Catena, 73, 249–260, https://doi.org/10.1016/j.catena.2007.11.001, 2008.
Chesher, J. A., Deegan, C. E., Ardus, D. A., Binns, P. E., and Fannin, N. G. T.: IGS marine drilling with m. v. Whitethorn in Scottish waters, 1970–71, in: Report Institute of Geological Sciences, HMSO, London, Report No. 72/10, 25 pp., 1972.
Cowling, R. M., Egoh, B., Knight, A. T., O'Farrell, P. J., Reyers, B., Rouget, M., Roux, D. J., Welz, A., and Wilhelm-Rechman, A.: An operational model for mainstreaming ecosystem services for implementation, P. Natl. Acad. Sci. USA, 105, 9483–9488, https://doi.org/10.1073/pnas.0706559105, 2008.
Craib, J. S.: A sampler for taking short undisturbed marine cores, ICES J. Mar. Sci., 30, 34–39, https://doi.org/10.1093/icesjms/30.1.34, 1965.
Davies, A. M., Hall, P., Howarth, M. J., Knight, P. J., and Player, R. J.: Tidal currents, energy flux and bottom boundary layer thickness in the Clyde Sea and North Channel of the Irish Sea, Ocean Dynam., 54, 108–125, https://doi.org/10.1007/s10236-003-0069-0, 2004.
Deegan, C. E., Kirby, R., Rae, I., and Floyd, R.: The superficial deposits of the Firth of Clyde and its sea lochs, in: Report Institute of Geological Sciences, HMSO, London, Report No. 73/09, 42 pp., 1973.
Diesing, M., Kröger, S., Parker, R., Jenkins, C., Mason, C., and Weston, K.: Predicting the standing stock of organic carbon in surface sediments of the North–West European continental shelf, Biogeochemistry, 135, 183–200, https://doi.org/10.1007/s10533-017-0310-4, 2017.
Ehrenhauss, S., Witte, U., Janssen, F., and Huettel, M.: Decomposition of diatoms and nutrient dynamics in permeable North Sea sediments, Cont. Shelf Res., 24, 721–737, https://doi.org/10.1016/j.csr.2004.01.002, 2004.
Eigaard, O. R., Bastardie, F., Breen, M., Dinesen, G. E., Hintzen, N. T., Laffargue, P., Mortensen, L. O., Nielsen, J. R., Nilsson, H. C., O'Neill, F. G., Polet, H., Reid, D. G., Sala, A., Sköld, M., Smith, C., Sørensen, T. K., Tully, O., Zengin, M., and Rijnsdorp, A. D.: Estimating seabed pressure from demersal trawls, seines, and dredges based on gear design and dimensions, ICES J. Mar. Sci., 73, i27–i43, https://doi.org/10.1093/icesjms/fsv099, 2016.
Eigaard, O. R., Bastardie, F., Hintzen, N. T., Buhl-Mortensen, L., Buhl-Mortensen, P., Catarino, R., Dinesen, G. E., Egekvist, J., Fock, H. O., Geitner, K., Gerritsen, H. D., González, M. M., Jonsson, P., Kavadas, S., Laffargue, P., Lundy, M., Gonzalez-Mirelis, G., Nielsen, J. R., Papadopoulou, N., Posen, P. E., Pulcinella, J., Russo, T., Sala, A., Silva, C., Smith, C. J., Vanelslander, B., and Rijnsdorp, A. D.: The footprint of bottom trawling in European waters: Distribution, intensity, and seabed integrity, ICES J. Mar. Sci., 74, 847–865, https://doi.org/10.1093/icesjms/fsw194, 2017.
Elliott, S. A. M., Sabatino, A. D., Heath, M. R., Turrell, W. R., and Bailey, D. M.: Landscape effects on demersal fish revealed by field observations and predictive seabed modelling, PLoS One, 12, 1–13, https://doi.org/10.1371/journal.pone.0189011, 2017.
Fisher, P., Aumann, C., Chia, K., O'Halloran, N., and Chandra, S.: Adequacy of laser diffraction for soil particle size analysis, PLoS One, 12, 1–20, https://doi.org/10.1371/journal.pone.0176510, 2017.
Folk, R. L.: The distinction between grain size and mineral composition in sedimentary-rock nomenclature, J. Geol., 62, 344–359, 1954.
Gafeira, J., Green, S., Dove, D., Morando, A., Cooper, R., Long, D., and Gatliff, R. W.: Developing the necessary data layers for Marine Conservation Zone selection – Distribution of rock/hard substrate on the UK Continental Shelf, British Geological Survey, MB0103 Final Report, 2010.
Garrett, R. C., Nar, A., and Fisher, T. J.: ggvoronoi: Voronoi Diagrams and Heatmaps with “ggplot2”, R package version 0.8.3, CRAN [code], available at: https://cran.r-project.org/package=ggvoronoi, last access: 29 May 2019.
Gregorutti, B., Michel, B., and Saint-Pierre, P.: Correlation and variable importance in random forests, Stat. Comput., 27, 659–678, https://doi.org/10.1007/s11222-016-9646-1, 2017.
Hastie, T., Tibshirani, R., and Friedman, J.: The Elements of Statistical Learning, 2nd ed., Springer-Verlag, New York, 745 pp., https://doi.org/10.1007/b94608, 2009.
Heath, M. and Pace, M.: High resolution seabed sedimentology data for the Firth of Clyde, University of Strathclyde [data set], https://doi.org/10.15129/2003faa2-ee93-4c11-bb16-48485f5f136d, 2021.
Hiddink, J. G., Moranta, J., Balestrini, S., Sciberras, M., Cendrier, M., Bowyer, R., Kaiser, M.J., Sköld, M., Jonsson, P., Bastardie, F., and Hinz, H.: Bottom trawling affects fish condition through changes in the ratio of prey availability to density of competitors, J. Appl. Ecol., 53, 1500–1510, https://doi.org/10.1111/1365-2664.12697, 2016.
Hijmans, R. J.: geosphere: Spherical Trigonometry, R package version 1.5-10, CRAN, available at: https://cran.r-project.org/package=geosphere, last access: 29 May 2019.
Huettel, M., Røy, H., Precht, E., and Ehrenhauss, S.: Hydrodynamical impact on biogeochemical processes in aquatic sediments, Hydrobiologia, 494, 231–236, https://doi.org/10.1023/A:1025426601773, 2003.
Janssen, F., Huettel, M., and Witte, U.: Pore-water advection and solute fluxes in permeable marine sediments (II): Benthic respiration at three sandy sites with different permeabilities (German Bight, North Sea), Limnol. Oceanogr., 50, 779–792, https://doi.org/10.4319/lo.2005.50.3.0779, 2005.
Kamann, P. J., Ritzi, R. W., Dominic, D. F., and Conrad, C. M.: Porosity and permeability in sediment mixtures, Ground Water, 45, 429–438, https://doi.org/10.1111/j.1745-6584.2007.00313.x, 2007.
Klute, A. (Ed.) and Dirksen, C.: Hydraulic Conductivity and Diffusivity: Laboratory Methods, in: Methods of Soil Analysis, Part 1 – Physical and Mineralogical Methods, Soil Science Society of America (SSSA)/American Society of Agronomy, Inc. (ASA)), Madison, Wisconsin, Wisconsin, 687–734, 1986.
Knudby, A., LeDrew, E., and Brenning, A.: Predictive mapping of reef fish species richness, diversity and biomass in Zanzibar using IKONOS imagery and machine-learning techniques, Remote Sens. Environ., 114, 1230–1241, https://doi.org/10.1016/j.rse.2010.01.007, 2010.
Kuhn, M.: caret: Classification and Regression Training, CRAN [code], available at: https://cran.r-project.org/package=caret (last access: 15 March 2021), 2020.
Kvalseth, T. O.: Cautionary Note about R2, Am. Stat., 39, 279–285, 1985.
Lawson, C. R., Hodgson, J. A., Wilson, R. J., and Richards, S. A.: Prevalence, thresholds and the performance of presence-absence models, Methods Ecol. Evol., 5, 54–64, https://doi.org/10.1111/2041-210X.12123, 2014.
Lepland, A., Rybalko, A., and Lepland, A.: Seabed Sediments of the Barents Sea, Scale 1:3000000, Geological Survey of Norway (Trondheim) and SEVMORGEO (St. Petersburg) [data set], available at: http://www.mareano.no/en/maps/mareano_en.html (last access: 24 July 2020), 2014.
Li, J., Heap, A. D., Potter, A., and Daniell, J. J.: Application of machine learning methods to spatial interpolation of environmental variables, Environ. Model. Softw., 26, 1647–1659, https://doi.org/10.1016/j.envsoft.2011.07.004, 2011.
Lohse, L., Malschaert, J. F. P., Slomp, C. P., Helder, W., and Vanraaphorst, W.: Nitrogen cycling in North Sea sediments – Interaction of denitrification and nitrification in offshore and coastal areas, Mar. Ecol. Prog. Ser., 101, 283–296, https://doi.org/10.3354/meps101283, 1993.
Luisetti, T., Turner, R. K., Andrews, J. E., Jickells, T. D., Kröger, S., Diesing, M., Paltriguera, L., Johnson, M. T., Parker, E. R., Bakker, D. C. E., and Weston, K.: Quantifying and valuing carbon flows and stores in coastal and shelf ecosystems in the UK, Ecosyst. Serv., 35, 67–76, https://doi.org/10.1016/j.ecoser.2018.10.013, 2019.
Luisetti, T., Ferrini, S., Grilli, G., Jickells, T. D., Kennedy, H., Kröger, S., Lorenzoni, I., Milligan, B., van der Molen, J., Parker, R., Pryce, T., Turner, R. K., and Tyllianakis, E.: Climate action requires new accounting guidance and governance frameworks to manage carbon in shelf seas, Nat. Commun., 11, 4599, https://doi.org/10.1038/s41467-020-18242-w, 2020.
Maureaud, A., Hodapp, D., Daniël Van Denderen, P., Hillebrand, H., Gislason, H., Dencker, T. S., Beukhof, E., and Lindegren, M.: Biodiversity-ecosystem functioning relationships in fish communities: Biomass is related to evenness and the environment, not to species richness, P. Roy. Soc. B-Biol. Sci., 286, 20191189, https://doi.org/10.1098/rspb.2019.1189, 2019.
McIntyre, F., Fernandes, P. G., and Turrell, W. R.: Clyde Ecosystem Review, Scottish Marine and Freshwater Science, 3, 119 pp., 2012.
Misiuk, B., Diesing, M., Aitken, A., Brown, C. J., Edinger, E. N., and Bell, T.: A spatially explicit comparison of quantitative and categorical modelling approaches for mapping seabed sediments using random forest, Geosciences, 9, 1–34, https://doi.org/10.3390/geosciences9060254, 2019.
Mitchell, P. J., Aldridge, J., and Diesing, M.: Legacy data: How decades of seabed sampling can produce robust predictions and versatile products, Geosciences, 9, 182, https://doi.org/10.3390/geosciences9040182, 2019.
Moore, D. G. and Keller, G. H.: Marine sediments, geotechnical properties, in: Applied Geology, edited by: Finkl, C. W., Springer US, Boston, MA, 343–350, 1984.
Neumann, A., Möbius, J., Hass, H. C., Puls, W., and Friedrich, J.: Empirical model to estimate permeability of surface sediments in the German Bight (North Sea), J. Sea Res., 127, 36–45, https://doi.org/10.1016/j.seares.2016.12.002, 2017a.
Neumann, A., van Beusekom, J. E. E., Holtappels, M., and Emeis, K. C.: Nitrate consumption in sediments of the German Bight (North Sea), J. Sea Res., 127, 26–35, https://doi.org/10.1016/j.seares.2017.06.012, 2017b.
Palanques, A., Puig, P., Guillén, J., Demestre, M., and Martín, J.: Effects of bottom trawling on the Ebro continental shelf sedimentary system (NW Mediterranean), Cont. Shelf Res., 72, 83–98, https://doi.org/10.1016/j.csr.2013.10.008, 2014.
Pearson, T. H., Ansell, A. D., and Robb, L.: The Benthos of the Deeper Sediments of the Firth of Clyde, With Particular Reference to Organic Enrichment, P. Roy. Soc. Edinb. B., 90, 329–350, 1986.
Portela, J., Cristobo, J., Ríos, P., Acosta, J., Parra, S., del Rio, J. L., Tel, E., Polonio, V., Muñoz, A., Patrocinio, T., Vilela, R., Barba, M., and Marín, P.: A First Approach to Assess the Impact of Bottom Trawling Over Vulnerable Marine Ecosystems on the High Seas of the Southwest Atlantic, in: Biodiversity in Ecosystems – Linking Structure and Function, edited by: Lo, Y.-H., Blanco, J. A., and Roy, S., IntechOpen, https://doi.org/10.5772/59268, 2015.
Pusceddu, A., Bianchelli, S., Martín, J., Puig, P., Palanques, A., Masqué, P., and Danovaro, R.: Chronic and intensive bottom trawling impairs deep-sea biodiversity and ecosystem functioning,, P. Natl. Acad. Sci. USA, 111, 8861–8866, https://doi.org/10.1073/pnas.1405454111, 2014.
Qi, S., Wen, Z., Lu, C., Shu, L., Shao, J., Huang, Y., Zhang, S., and Huang, Y.: A new empirical model for estimating the hydraulic conductivity of low permeability media, Proc. IAHS, 368, 478–483, https://doi.org/10.5194/piahs-368-478-2015, 2015.
R Core Team: R: A Language and Environment for Statistical Computing, R Foundation for Statistical computing, Vienna, Austria, available at: https://www.r-project.org/, last access: 26 April 2019.
Rijnsdorp, A. D., Bastardie, F., Bolam, S. G., Buhl-Mortensen, L., Eigaard, O. R., Hamon, K. G., Hiddink, J. G., Hintzen, N. T., Ivanović, A., Kenny, A., Laffargue, P., Nielsen, J. R., O'Neill, F. G., Piet, G. J., Polet, H., Sala, A., Smith, C., van Denderen, P. D., van Kooten, T., and Zengin, M.: Towards a framework for the quantitative assessment of trawling impact on the seabed and benthic ecosystem, ICES J. Mar. Sci., 73, i127–i138, https://doi.org/10.1093/icesjms/fsv207, 2016.
Rijnsdorp, A. D., Bolam, S. G., Garcia, C., Hiddink, J. G., Hintzen, N. T., van Denderen, P. D., and van Kooten, T.: Estimating sensitivity of seabed habitats to disturbance by bottom trawling based on the longevity of benthic fauna, Ecol. Appl., 28, 1302–1312, https://doi.org/10.1002/eap.1731, 2018.
Roberts, D. R., Bahn, V., Ciuti, S., Boyce, M. S., Elith, J., Guillera-Arroita, G., Hauenstein, S., Lahoz-Monfort, J. J., Schröder, B., Thuiller, W., Warton, D. I., Wintle, B. A., Hartig, F., and Dormann, C. F.: Cross-validation strategies for data with temporal, spatial, hierarchical, or phylogenetic structure, Ecography, 40, 913–929, https://doi.org/10.1111/ecog.02881, 2017.
Ruardij, P. and Van Raaphorst, W.: Benthic nutrient regeneration in the ERSEM ecosystem model of the North Sea, Neth. J. Sea Res., 33, 453–483, https://doi.org/10.1016/0077-7579(95)90057-8, 1995.
Sabatino, A. D., O'Hara Murray, R. B., Hills, A., Speirs, D. C., and Heath, M. R.: Modelling sea level surges in the Firth of Clyde, a fjordic embayment in south-west Scotland, Nat. Hazards, 84, 1601–1623, https://doi.org/10.1007/s11069-016-2506-7, 2016.
Sala, E., Mayorga, J., Bradley, D., Cabral, R. B., Atwood, T. B., Auber, A., Cheung, W., Costello, C., Ferretti, F., Friedlander, A. M., Gaines, S. D., Garilao, C., Goodell, W., Halpern, B. S., Hinson, A., Kaschner, K., Kesner-Reyes, K., Leprieur, F., McGowan, J., Morgan, L. E., Mouillot, D., Palacios-Abrantes, J., Possingham, H. P., Rechberger, K. D., Worm, B., and Lubchenco, J.: Protecting the global ocean for biodiversity, food and climate, Nature, 592, 397–402, https://doi.org/10.1038/s41586-021-03371-z, 2021.
Schiele, K. S., Darr, A., Zettler, M. L., Friedland, R., Tauber, F., von Weber, M., and Voss, J.: Biotope map of the German Baltic Sea, Mar. Pollut. Bull., 96, 127–135, https://doi.org/10.1016/j.marpolbul.2015.05.038, 2015.
Serpetti, N., Heath, M., Armstrong, E., and Witte, U.: Blending single beam RoxAnn and multi-beam swathe QTC hydro-acoustic discrimination techniques for the Stonehaven area, Scotland, UK, J. Sea Res., 65, 442–455, https://doi.org/10.1016/j.seares.2011.04.001, 2011.
Serpetti, N., Witte, U. F. M., and Heath, M. R.: Statistical modelling of variability in sediment-water nutrient and oxygen fluxes, Front. Earth Sci., 4, 1–17, https://doi.org/10.3389/feart.2016.00065, 2016.
Shepherd, R. G.: Correlations of Permeability and Grain Size, Ground Water, 27, 633–638, https://doi.org/10.1111/j.1745-6584.1989.tb00476.x, 1989.
Silburn, B., Kröger, S., Parker, E. R., Sivyer, D. B., Hicks, N., Powell, C. F., Johnson, M., and Greenwood, N.: Benthic pH gradients across a range of shelf sea sediment types linked to sediment characteristics and seasonal variability, Biogeochemistry, 135, 69–88, https://doi.org/10.1007/s10533-017-0323-z, 2017.
Smeaton, C. and Austin, W. E. N.: Where's the Carbon: Exploring the Spatial Heterogeneity of Sedimentary Carbon in Mid-Latitude Fjords, Front. Earth Sci., 7, 1–16, https://doi.org/10.3389/feart.2019.00269, 2019.
Smeaton, C., Austin, W., and Turrell, W. R.: Re-Evaluating Scotland's Sedimentary Carbon Stocks, Scottish Marine and Freshwater Science, 11, 16 pp., https://doi.org/10.7489/12267-1, 2020.
Smeaton, C., Hunt, C. A., Turrell, W. R., and Austin, W. E. N.: Marine Sedimentary Carbon Stocks of the United Kingdom's Exclusive Economic Zone, Front. Earth Sci., 9, 1–21, https://doi.org/10.3389/feart.2021.593324, 2021.
Soulsby, R. L.: Dynamics of marine sands: A manual for practical applications, in: Dynamics of marine sands, Thomas Telford Publishing, London, UK, https://doi.org/10.1680/doms.25844, 1997.
Stephens, D. and Diesing, M.: Towards quantitative spatial models of seabed sediment composition, PLoS One, 10, e0142502, https://doi.org/10.1371/journal.pone.0142502, 2015.
Townsend, M., Thrush, S. F., Lohrer, A. M., Hewitt, J. E., Lundquist, C. J., Carbines, M., and Felsing, M.: Overcoming the challenges of data scarcity in mapping marine ecosystem service potential, Ecosyst. Serv., 8, 44–55, https://doi.org/10.1016/j.ecoser.2014.02.002, 2014.
Turner, R.: deldir: Delaunay Triangulation and Dirichlet (Voronoi) Tessellation, R package version 0.1-16, CRAN [code], available at: https://cran.r-project.org/package=deldir, last access: 29 May 2019.
Valentine, P. C.: Sediment classification and the characterization, identification, and mapping of geologic substrates for the glaciated Gulf of Maine seabed and other terrains, providing a physical framework for ecological research and seabed management, Scientific Investigations Report 2019-5073, https://doi.org/10.3133/sir20195073, 2019.
Van Der Wal, J., Falconi, L., Januchowski, S., Shoo, L., and Storlie, C.: SDMTools: Species Distribution Modelling Tools: Tools for processing data associated with species distribution modelling exercises, R package version 1.1-221.1, CRAN [code], available at: https://cran.r-project.org/package=SDMTools, last access: 29 May 2019
Wei, C. L., Rowe, G. T., Briones, E. E., Boetius, A., Soltwedel, T., Caley, M. J., Soliman, Y., Huettmann, F., Qu, F., Yu, Z., Pitcher, C. R., Haedrich, R. L., Wicksten, M. K., Rex, M. A., Baguley, J. G., Sharma, J., Danovaro, R., MacDonald, I. R., Nunnally, C. C., Deming, J. W., Montagna, P., Lévesque, M., Weslawski, J. M., Wlodarska-Kowalczuk, M., Ingole, B. S., Bett, B. J., Billett, D. S. M., Yool, A., Bluhm, B. A., Iken, K., and Narayanaswamy, B. E.: Global patterns and predictions of seafloor biomass using random forests, PLoS One, 5, e15323, https://doi.org/10.1371/journal.pone.0015323, 2010.
Wentworth, C. K.: A Scale of Grade and Class Terms for Clastic Sediments, J. Geol., 30, 377–392, https://doi.org/10.1086/622910, 1922.
Wickham, H.: ggplot2: Elegant Graphics for Data Analysis, Springer-Verlag New York [code], available at: https://ggplot2.tidyverse.org/ (last access: 29 January 2021), 2016.
Wiesner, M. G., Haake, B., and Wirth, H.: Organic facies of surface sediments in the North Sea, Org. Geochem., 15, 419–432, https://doi.org/10.1016/0146-6380(90)90169-Z, 1990.
Wilson, A. M., Huettel, M., and Klein, S.: Grain size and depositional environment as predictors of permeability in coastal marine sands, Estuar. Coast. Shelf S., 80, 193–199, https://doi.org/10.1016/j.ecss.2008.06.011, 2008.
Wilson, R. and Heath, M.: bedshear: Calculations for bed shear stress and wave orbital velocity, R package version 0.1.0, GitHub [code], available at: https://github.com/r4ecology/bedshear (last access: 11 September 2021), 2019.
Wilson, R. J., Speirs, D. C., Sabatino, A., and Heath, M. R.: A synthetic map of the north-west European Shelf sedimentary environment for applications in marine science, Earth Syst. Sci. Data, 10, 109–130, https://doi.org/10.5194/essd-10-109-2018, 2018.
Wright, M. N. and Ziegler, A.: ranger: A Fast Implementation of Random Forests for High Dimensional Data in C++ and R, J. Stat. Softw., 77, 1–17, https://doi.org/10.18637/jss.v077.i01, 2017.