the Creative Commons Attribution 4.0 License.
the Creative Commons Attribution 4.0 License.
 | 07 Dec 2021
Global balanced wind derived from SABER temperature and pressure observations and its validations
Jiyao Xu
You Yu
Paulo P. Batista
Vania F. Andrioli
Zhengkuan Liu
Chi Wang
Ziming Zou
Guozhu Li
James M. Russell III
Zonal winds in the stratosphere and mesosphere play important roles in atmospheric dynamics and aeronomy. However, the direct measurement of winds in this height range is difficult. We present a dataset of the monthly mean zonal wind in the height range of 18–100 km and at latitudes of 50∘ S–50∘ N from 2002 to 2019, derived by the gradient balance wind theory and the temperature and pressure observed by the SABER instrument. The tide alias above 80 km at the Equator is replaced by the monthly mean zonal wind measured by a meteor radar at 0.2∘ S. The dataset (named BU) is validated by comparing with the zonal wind from MERRA2 (MerU), UARP (UraU), the HWM14 empirical model (HwmU), meteor radar (MetU), and lidar (LidU) at seven stations from around 50∘ N to 29.7∘ S. At 18–70 km, BU and MerU have (i) nearly identical zero wind lines and (ii) year-to-year variations of the eastward and westward wind jets at middle and high latitudes, and (iii) the quasi-biennial oscillation (QBO) and semi-annual oscillation (SAO) especially the disrupted QBO in early 2016. The comparisons among BU, UraU, and HwmU show good agreement in general below 80 km. Above 80 km, the agreements among BU, UraU, HwmU, MetU, and LidU are good in general, except some discrepancies at limited heights and months. The BU data are archived as netCDF files and are available at https://doi.org/10.12176/01.99.00574 (Liu et al., 2021). The advantages of the global BU dataset are its large vertical extent (from the stratosphere to the lower thermosphere) and 18-year internally consistent time series (2002–2019). The BU data is useful to study the temporal variations with periods ranging from seasons to decades at 50∘ S–50∘ N. It can also be used as the background wind for atmospheric wave propagation.
- Article
(16289 KB) - Full-text XML
- BibTeX
- EndNote


Zonal mean zonal wind in the middle and upper atmosphere is critical to the propagation and dissipation (via filtering or prohibiting) of atmospheric waves (e.g., gravity waves, tides, and planetary waves) while the waves propagate against or along the zonal winds (Forbes, 1995; Fritts and Alexander, 2003). On the other hand, the waves dissipate their energy and momentum in the mean flow and accelerate or decelerate the mean wind. This changes the atmospheric thermal and wind structures and even reverses the wind direction (McLandress, 1998; Zhang and Shepherd, 2005; Watanabe and Miyahara, 2009; Liu et al., 2014; Becker and Vadas, 2018). Thus, the zonal wind climatology and the mean wind–wave interactions are important topics in atmosphere dynamics.
Ground-based observations (e.g., using radiosondes, rockets, Fabry–Pérot interferometers, radars, and lidars) have a long history of use for wind measurement. They provide horizontal winds in a limited altitude range and/or location but have wide and even full local time (LT) coverage. On the other hand, satellite observations provide global observations of winds in the middle and upper atmosphere in limited LT or height ranges. For example, the High Resolution Doppler Imager (HRDI) on the Upper Atmosphere Research Satellite (UARS) observed winds of 10–40 and 65–110 km during the daytime from 1991 to 1999 (Hays et al., 1993). The Wind Imaging Interferometer (WINDII) on the UARS observed winds of 90–120 km during both day and night from 1991 to 1997 (Zhang and Shepherd, 2005; Shepherd et al., 2012). Onboard the Thermosphere, Ionosphere, Mesosphere Energetics and Dynamics (TIMED) satellite, the TIMED Doppler Interferometer (TIDI) has observed wind of 70–115 km during the day and 80–105 km at night since 2002 (Killeen et al., 2006). The TIDI wind data are mainly used to study tides and planetary waves due to the uncertainties in absolute zero wind (Niciejewski et al., 2006; Wu et al., 2006, 2008; Gu et al., 2013). On 10 September 2019, NASA's Ionospheric Connection Explorer (ICON) was launched to study the Earth's ionosphere (Immel et al., 2018). The Michelson Interferometer for Global High-Resolution Thermospheric Imaging (MIGHTI) onboard the ICON satellite has two identical sensor units, MIGHTI-A and MIGHTI-B, which can be used to retrieve temperature at 90–115 km and line-of-sight winds and the vector winds at 90–300 km (Englert et al., 2017; Harding et al., 2017; Stevens et al., 2018). These ground-based and satellite observations and rocket soundings are useful to construct empirical wind models, such as the COSPAR International Reference Atmosphere (CIRA-86) (Fleming et al., 1990), the Horizontal Wind Model (HWM) (Drob et al., 2008, 2015; Emmert et al., 2008), and the Upper Atmosphere Research Satellite (UARS) Reference Atmosphere Project (URAP) wind climatology (Swinbank and Ortland, 2003). These observations are useful to constrain the reanalysis wind data, such as the Modern-Era Retrospective analysis for Research and Applications, version 2 (MERRA2) (Molod et al., 2015; Gelaro et al., 2017), and the European Centre for Medium-Range Weather Forecasts ERA5 (Hoffmann et al., 2019; Hersbach et al., 2020). A recent study by Ern et al. (2021) showed that both MERRA2 and ERA5 capture the semi-annual oscillation (SAO) in the stratopause and the lower mesosphere around the Equator. In the middle mesosphere, MERRA2 produces a reasonable SAO due to the assimilated Aura Microwave Limb Sounder (MLS) data (Schwartz et al., 2008; Molod et al., 2015). Above 70 km, the mesopause SAO produced by ERA5 is stronger than that of MERRA2. This is because the stronger damping of MERRA2 reduces the amplitude of the mesopause SAO. These observations and models greatly improve our knowledge of the winds in the middle and upper atmosphere.
The zonal winds provided by CIRA-86 and UARP are important in global climatology and are found at 0–120 and 0–110 km, respectively (Fleming et al., 1990; Swinbank and Ortland, 2003). The zonal and meridional winds provided by the HWM series are a function of day of the year and LT and range from the surface to the thermosphere (∼ 500 km) (Drob et al., 2008, 2015; Emmert et al., 2008). The zonal winds from these models are useful to study the seasonal variations but not for variations with periods longer than 1 year. The zonal winds provided by reanalysis data (e.g., MERRA2 and ERA5) are in a height range from the surface to ∼ 70–80 km and are useful to study variations with periods from several days to several years (Gelaro et al., 2017; Hoffmann et al., 2019; Ern et al., 2021).
At present, direct global measurement of zonal wind in the upper stratosphere and mesosphere is difficult, and the model-inherent damping in the upper model levels of MERRA2 and ERA5 is still a challenge for retrieving realistic wind in the mesosphere and lower thermosphere (MLT) region (Ern et al., 2021). A candidate is now combining the observations of temperature and pressure with balance wind theory to retrieve zonal wind in the MLT region: Smith et al. (2017) have derived the balance wind (BU) at the Equator based on the gradient wind balance theory (Randel, 1987) and observation data. The observation data are (1) the geopotential height observed by the MLS (Schwartz et al., 2008) from 2004 to 2016 and (2) the pressure and temperature measured by the Sounding of the Atmosphere Using Broadband Emission Radiometry (SABER) instrument (Russell et al., 1999) on the TIMED satellite from 2002 to 2015. They showed the SAO of zonal wind and its relation with the quasi-biennial oscillation (QBO) in the tropical upper stratosphere and mesosphere. Smith et al. (2017) noted that the BU is reasonable below ∼ 84 km but not above ∼ 84 km. This is because the aliasing of diurnal tide to mean wind is notable above 84 km (McLandress et al., 2006; Xu et al., 2009). The reason for the tidal alias is ascribed to the diurnal tide being prominent and exhibiting short-term (single-day to several-day) variations. The full diurnal cycle is composed of the data from many days (e.g., 60 d for SABER observations). Thus, the obtained values are the mean of diurnal tides over these days. However, the short-term variations of diurnal tides are still in the background and alias the derived winds based on the gradient wind balance theory.
The focus of this work is to provide a global dataset of the monthly mean zonal wind (short for BU dataset) at 18–100 km based on the gradient wind balance theory and the temperature and pressure measured by the SABER instrument. The BU dataset extends from 2002 to 2019 and from 50∘ S to 50∘ N. To overcome the unrealistic BU above 84 km over the Equator (Smith et al., 2017), we replace the BU above 80 km with the zonal wind measured by the meteor radar at Kototabang (0.20∘ S, 100.32∘ E). The validation of the BU dataset will be performed by comparing it with those from MERRA2, UARP, HWM, and meteor radar and lidar observations from around 50∘ N to 29.7∘ S.
The advantages of the global BU dataset are (1) its large vertical extent (from the stratosphere to the lower thermosphere) and (2) 18-year internally consistent time series (2002 to 2019). Thus, the BU dataset can be used to study the global variations of zonal wind at timescales ranging from seasons to decades and from the stratosphere to the lower thermosphere. These variations include SAO (Semi-Annual Oscillation), AO (Annual Oscillation), QBO, and ENSO (El Niño–Southern Oscillation, i.e., periods of 2–8 years, Baldwin and O'Sullivan, 1995). Although QBO and ENSO originate from the lower atmosphere or sea surface, their influence is global and can extend to the stratosphere or to even higher heights and latitudes (Baldwin and O'Sullivan, 1995; Baldwin et al., 2001). Moreover, the interactions among SAO, AO, QBO, and ENSO are also important in modulating global atmospheric waves and composition from the stratosphere to the lower thermosphere (e.g., Xu et al., 2009; Liu et al., 2017; Diallo et al., 2018; Ern et al., 2011, 2014, 2021; Kawatani et al., 2020).
2.1 Data description
MERRA2 is the new version of atmospheric reanalysis dataset developed by NASA's Global Modeling and Assimilation Office (Molod et al., 2015; Gelaro et al., 2017). We use the 72-level (∼ 0–75 km) assimilated meteorological fields, which have time, longitude, and latitude intervals of 3 h, 0.625∘, and 0.5∘, respectively. The MERRA2 zonal winds are interpolated to uniform vertical grids from 2 to 72 km with a step of 1 km. Then they are averaged in a latitude band of 5∘ with an overlap of 2.5∘ in each month such that the monthly zonal mean (MerU) wind can be obtained and will be used to validate the BU at 50∘ N–50∘ S.
The URAP zonal wind (UraU) is based on the winds observed by the HRDI instrument, the stratospheric assimilation data from the Met Office, and the gradient wind balance calculated from URAP temperature data from April 1992 to March 1993 (Swinbank and Ortland, 2003). The UraU mainly represents the period of 1992–1993 and can be used as a reference wind dataset in the climatology sense. The UraU covers from 1000 hPa (∼ z=0 km) to 4.6 × 10⁻⁵ hPa (∼ z=110 km) and from 80∘ S to 80∘ N with equal intervals of 4∘ (Swinbank and Ortland, 2003).
HWM14 is the latest version of HWM, which provides the global zonal and meridional winds from the surface to thermosphere (∼ 500 km) and their variations with LT and day of year (Drob et al., 2015). After setting the longitude to be 0 and changing the time from 0:00 to 23:00 LT each day, we get the hourly zonal winds from 18 to 100 km with a step of 1 km and from 50∘ S to 50∘ N with a latitude interval of 2.5∘. Following this, the daily mean zonal wind is calculated by averaging the hourly zonal winds over 1 d. Finally, we change the day numbers from 1 to 365 to get the monthly mean zonal winds, which is referred to be the HWM14 zonal wind (HwmU). We note that the monthly mean zonal wind does not depend on longitude since the stationary planetary waves and migrating tides reproduced by HWM14 can be removed on a timescale of 1 month (Drob et al., 2015).
The zonal winds measured by meteor radar and lidar are used to improve the BU over the Equator and to validate BU at middle and high latitudes. The radars' locations and their data periods are listed in Table 1. The meteor radar measure the zonal and meridional winds at 80–100 km with a vertical interval of 2 km and a temporal interval of 1 h. The zonal winds measured by these meteor radar are averaged over each calendar month to get the monthly zonal wind (MetU). The MetU spans from 53.5∘ N to 29.7∘ S and is useful to compare the BU at 80–100 km and in both the Northern Hemisphere (NH) and Southern Hemisphere (SH). The MetU at Koto Tabang (KT, 0.20∘ S) can be used to replace the tidal aliased BU over the Equator (McLandress et al., 2006; Xu et al., 2009; Smith et al., 2017). As they are affected by the weather conditions, the zonal winds measured by the Colorado State University (CSU) lidar (LidU) from 2002 to 2008 are rearranged in a composite year according to calendar month in 80–100 km with a vertical interval of 0.5 km. The LidU is compared with the BU in the climatology sense. A detailed description of the meteor radar and lidar, as well as their measurement uncertainties, can be found in the references listed in Table 1.

The BU is derived from the temperature and pressure profiles (level 2A, version 2.07) measured by the SABER instrument (Russell et al., 1999) from 2002 to 2019. These profiles cover ∼ 15–110 km and latitudes of 53∘ S–83∘ N or 83∘ S–53∘ N. The temperature accuracy is 1–3 K from 30 to 80 km and 5–10 K from 90 to 100 km (Remsberg et al., 2008). The detailed procedure for deriving BU is described in the next subsection.
2.2 Method of deriving balanced wind
Deriving BU is performed using the following two steps. The first step is to derive the zonal mean temperature and pressure. All the original profiles measured by the SABER instrument are interpolated linearly to 18–108 km with a vertical interval of 1 km. Following this, these profiles are sorted into latitude bands that have width of 5∘ with an overlap of 2.5∘ and extend from 50∘ S to 50∘ N. At each latitude band (φ) and height (z), the temperature can be expressed as T(tUT,λ) (λ is longitude). Then the zonal mean temperature in each universal time (UT) day, TZMUT(tZMLT), for the ascending and descending nodes, respectively, can be expressed as follows:
Thus, excludes the nonmigrating tides and stationary planetary waves but contains the zonal mean temperature in an LT day (, short for and migrating tides (Xu et al., 2007, 2014; Gan et al., 2014). It takes about 60 d to get a nearly complete LT coverage for the SABER measurements. Thus, and migrating tides can be calculated by the least-squares fitting in a time window of 60 d and forward 1 d. Here both the ascending and descending data are used for the fitting. The fitting function is expressed as follows:
Here, , is the frequency (in d−1) of migrating tides. An and tn are the amplitude and phase, respectively, of the migrating tides with frequency of n. is the zonal mean temperature in an LT day. In the same way, the zonal mean pressure can be obtained.
The second step is to calculate the BU from and . The zonal mean of the momentum equation in the zonal direction is used to calculate the gradient balance wind (Randel, 1987; Fleming et al., 1990; Xu et al., 2009),
Here, f=2Ωsin φ is the Coriolis factor, is the Earth rotation frequency (rad s−1), and a is the radius of the Earth. and are the BU and zonal mean density, respectively. R is the gas constant for dry air. Equation (3) has been successfully applied to the latitude bands of 70–8∘ S and 8–70∘ N to get zonal mean wind (Fleming et al., 1990; Smith et al., 2017). We restrict Eq. (3) at 10–50∘ N and 10–50∘ S due to the noncontinuous sampling of the SABER measurements poleward of 53∘ N/S. At the Equator, the solution of Eq. (3) is an indeterminate form of as φ→0 and can be solved through L'Hôpital's rule if we get continuous values of and . In fact, only the discrete values and with a latitude interval of 2.5∘ can be obtained from observations. To apply Eq. (3) at the Equator, one needs to differentiate Eq. (3) with φ. As φ→0, we have tan φ→φ, sin φ→φ. Thus, Eq. (3) can be simplified as follows (Fleming et al., 1990):
According to Fleming et al. (1990) and Smith et al. (2017), the monthly mean zonal mean wind is mainly in the range of ±75 m s−1. Thus, the term is 1 to 2 orders of magnitude smaller than and can be neglected. Thus, at the Equator can be expressed as follows (Fleming et al., 1990; Swinbank and Ortland, 2003):
Here the BU below 80 km is obtained from Eq. (5). Due to the alias of diurnal tide to the BU above 84 km at the Equator (McLandress et al., 2006; Xu et al., 2009; Smith et al., 2017), the BU in 80–100 km calculated by Eq. (5) will be replaced by the MetU at KT (0.20∘ S). Consequently, the reconstructed BU should be reliable throughout the height ranges from 18 to 100 km. The replaced BU will be described in the next subsection.
At 2.5–7.5∘ N and 2.5–7.5∘ S, the BU is estimated by a cubic spline interpolation of the BU at 10–50∘ N, 10–50∘ S and the reconstructed BU at the Equator (Smith et al., 2017).
2.3 Modification of equatorial balance wind by the wind measured by meteor radar at Koto Tabang
The MetU measured at KT (0.20∘ S) provides a unique advantage to modify the BU at the Equator such that one can get reliable BU up to 100 km. Figure 1 shows the daily mean (black) and monthly mean (red) zonal wind at 86 km measured by the meteor radar at KT station. We can see that the wind data are continuous from November 2002 to September 2017 except during some months in 2013 and 2014. To match the SABER measurements from 2002 to 2019, we have to get a continuous dataset from 2002 to 2019 through filling the missing data in 2013 and 2014 and extending the data backward to February 2002 and forward to December 2019.
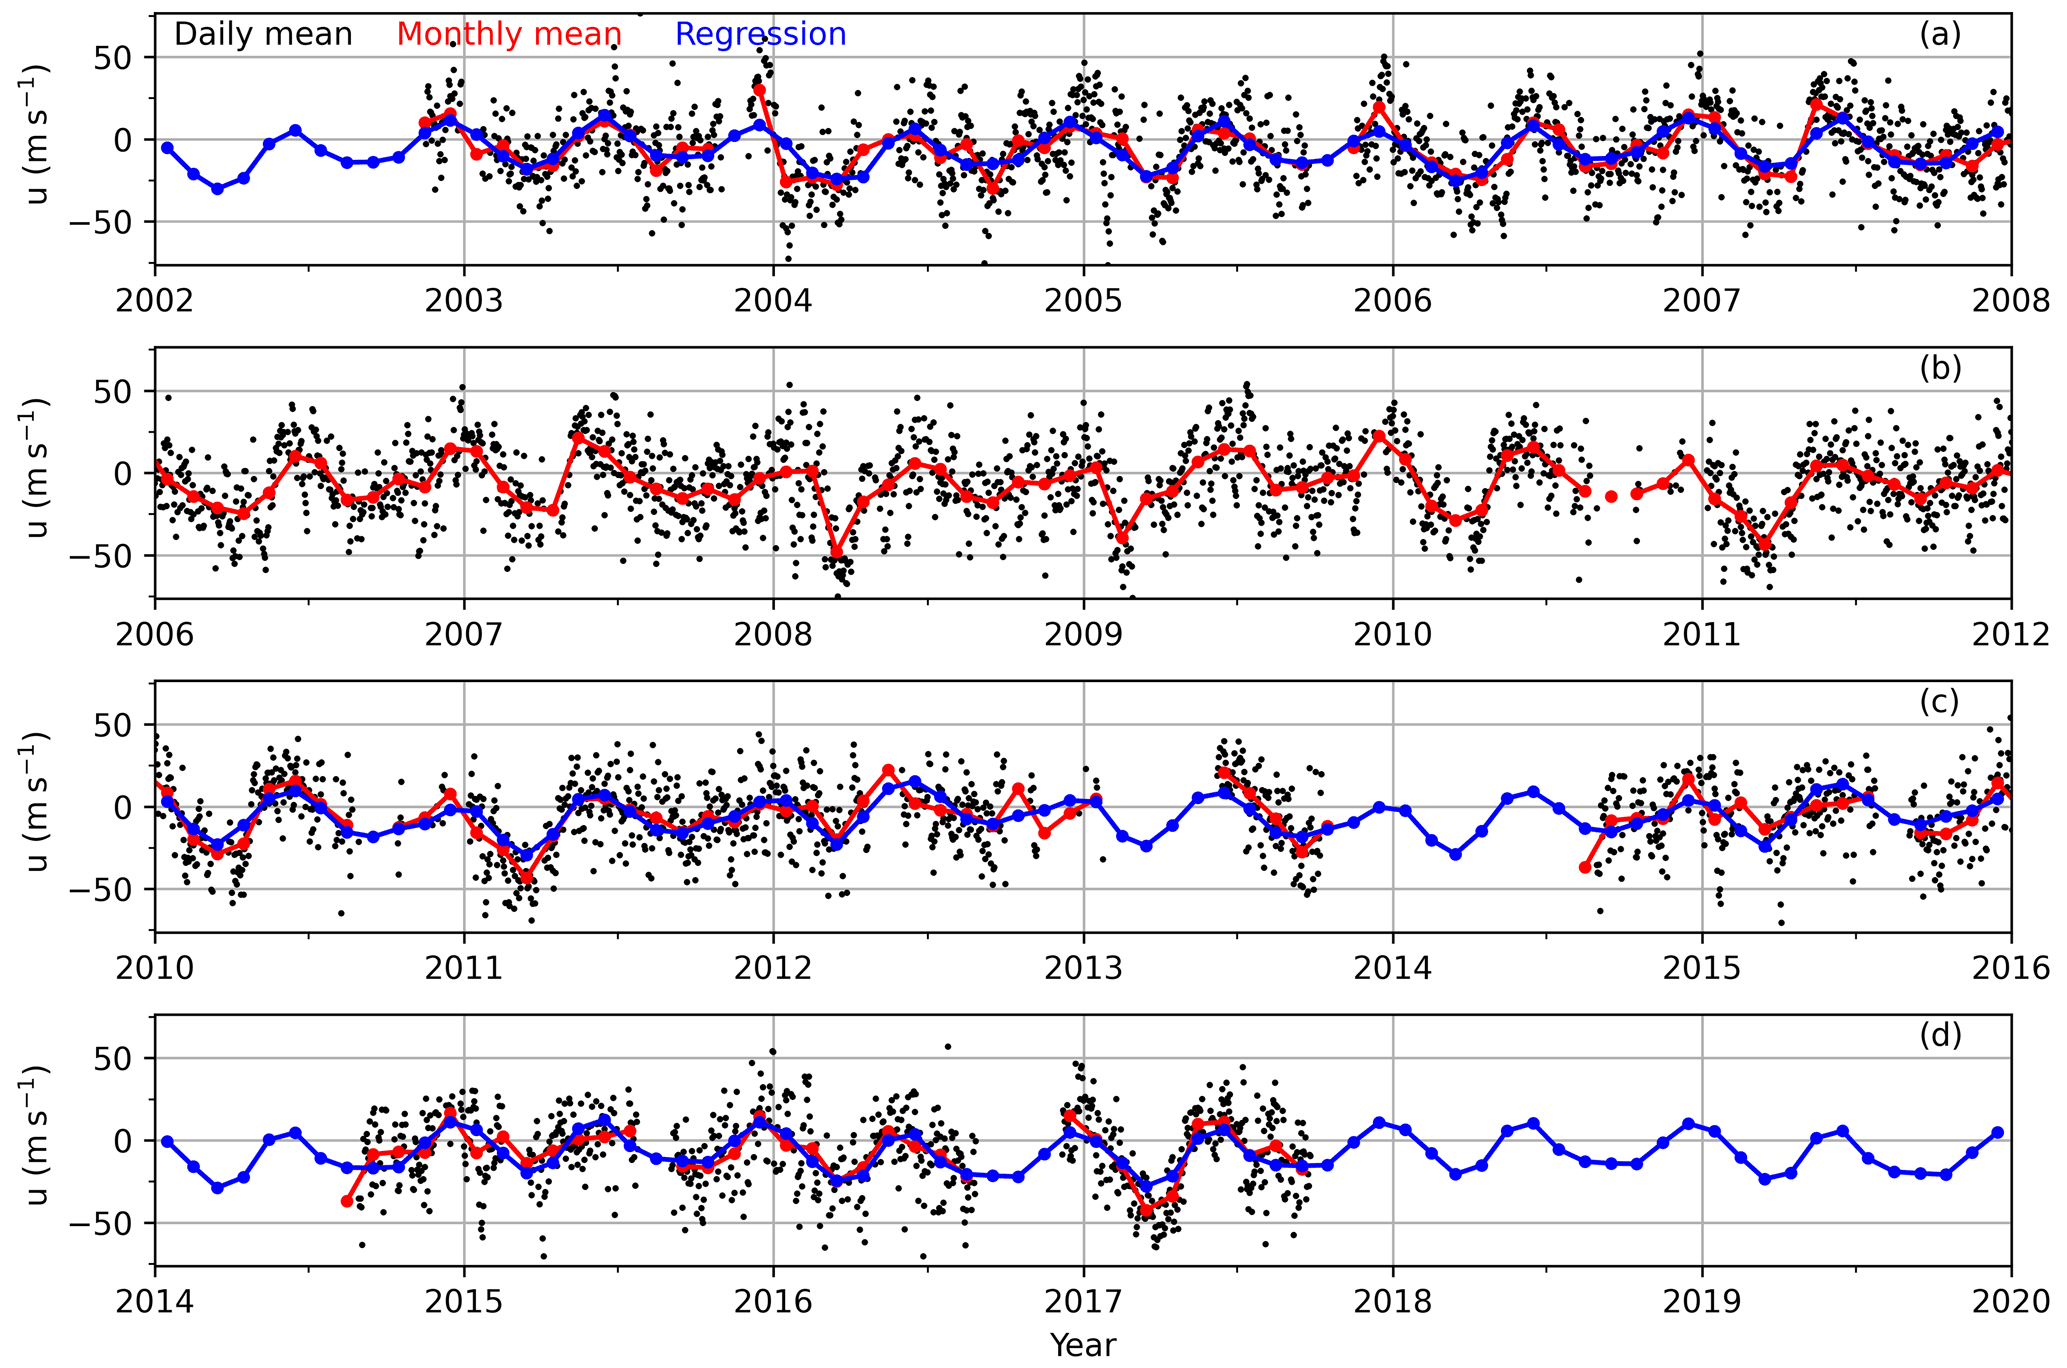
Figure 1The daily mean (black dots) and monthly mean (red line with dots) zonal winds (positive for eastward) at 86 km measured by the KT (Koto Tabang) meteor radar and their regression results (blue line with dots) from 2002 to 2019. The ticks on the x axis mark the beginning of each year.
The continuous dataset is constructed by multiple linear regression (MLR, chap. 6 of Kutner et al., 2005) through the following three steps: (i) separating the data into four segments (A: 2002–2007; B: 2006–2011; C: 2010–2015; D: 2014–2019) with an overlap of 24 months. The separation seems arbitrary but includes continuous observation in segment B, which is regarded as a reference segment and used as a predictor variable in MLR. Moreover, the separation retains just as many observations in the other three segments to improve the confidence level of MLR. The overlap of 24 months is to cover the missing observations from October 2017 to December 2019. (ii) Following this, the predictor variables of MLR are constructed. The first predictor variable is the constant of 1. Its regression coefficient represents the mean wind of each segment. The second predictor variable is the wind data in segment B. Figure 1 shows that the temporal variations of winds in segments A, C, and D are similar to that in the segment B but have slightly different oscillation amplitudes. After inspecting each segment, we see that the prominent oscillations have periods of 12 and 6 months, which are used as the third and fourth predictor variables. To reproduce more realistic regression, we also include oscillations of periods of 36, 24, 4, and 3 months as the fifth to eighth predictor variables. The predictor variables can be summarized as a constant of 1; the wind data in segment B; and oscillations with periods of 36, 24, 12, 6, 4, and 3 months. (iii) Using the predictor variables mentioned in step (ii), we perform MLR on segments A, C, and D. Following this, the missing observations are filled with MLR predictions (shown as a blue line with dots in Fig. 1).
To quantify the rationality of the MLR method, we used R2 score, which is the ratio of the variations in the observation data explained by the model and defined as follows:
Here, yi and fi are the observation data and model results with data numbers of N, respectively. The best R2 score is 1, where the predicted values are the same as the observation data. For segments A, C, and D, their R2 scores are 0.63, 0.59, and 0.65, respectively, and their available observation months are 60, 57, and 34, respectively. It should be noted that the R2 scores increase with the increasing number of predictor variables. However, the increasing number of predictor variables reduces the robustness of the model when the available observation months are short (e.g., segment C). Thus, the predictor variables chosen here are an optimal compromise between the R2 score and the robustness of the MLR model. Figure 1 shows that the MLR fittings coincide well with the observed monthly mean zonal winds when observations were available. It is reasonable to expect that the MLR predictions in the time intervals of missing observations are reliable (e.g., 2013, 2014, before November 2002, and after September 2017) and can be used to construct BU.
After applying the MLR on the zonal wind measured by the KT meteor radar at 80–100 km, we obtain a continuous dataset of MetU. This continuous dataset is composed of the observed data when they were available and predicted values when the observed data were missing. This continuous dataset is used to replace the BU calculated by Eq. (5) at 80–100 km. Combined with the BU calculated by Eq. (5) at 18–80 km and the MetU measured by the KT meteor radar at 80–100 km, we can get a reconstructed BU at 18–100 km. Figure 2 shows the BU at 18–100 km calculated by Eq. (5) at the Equator (Fig. 2a) and the reconstructed BU (Fig. 2b and c). We note that the reconstructed BU is smoothed by three-point running mean in height and time, respectively. Figure 2 shows that the BU above 80 km (Fig. 2a) is in the eastward direction during most months, which is the opposite of the replaced BU (Fig. 2b and c). This is because the BU above 80 km shown in Fig. 2a is aliased by the diurnal tide over the Equator (McLandress et al., 2006; Xu et al., 2009; Smith et al., 2017).
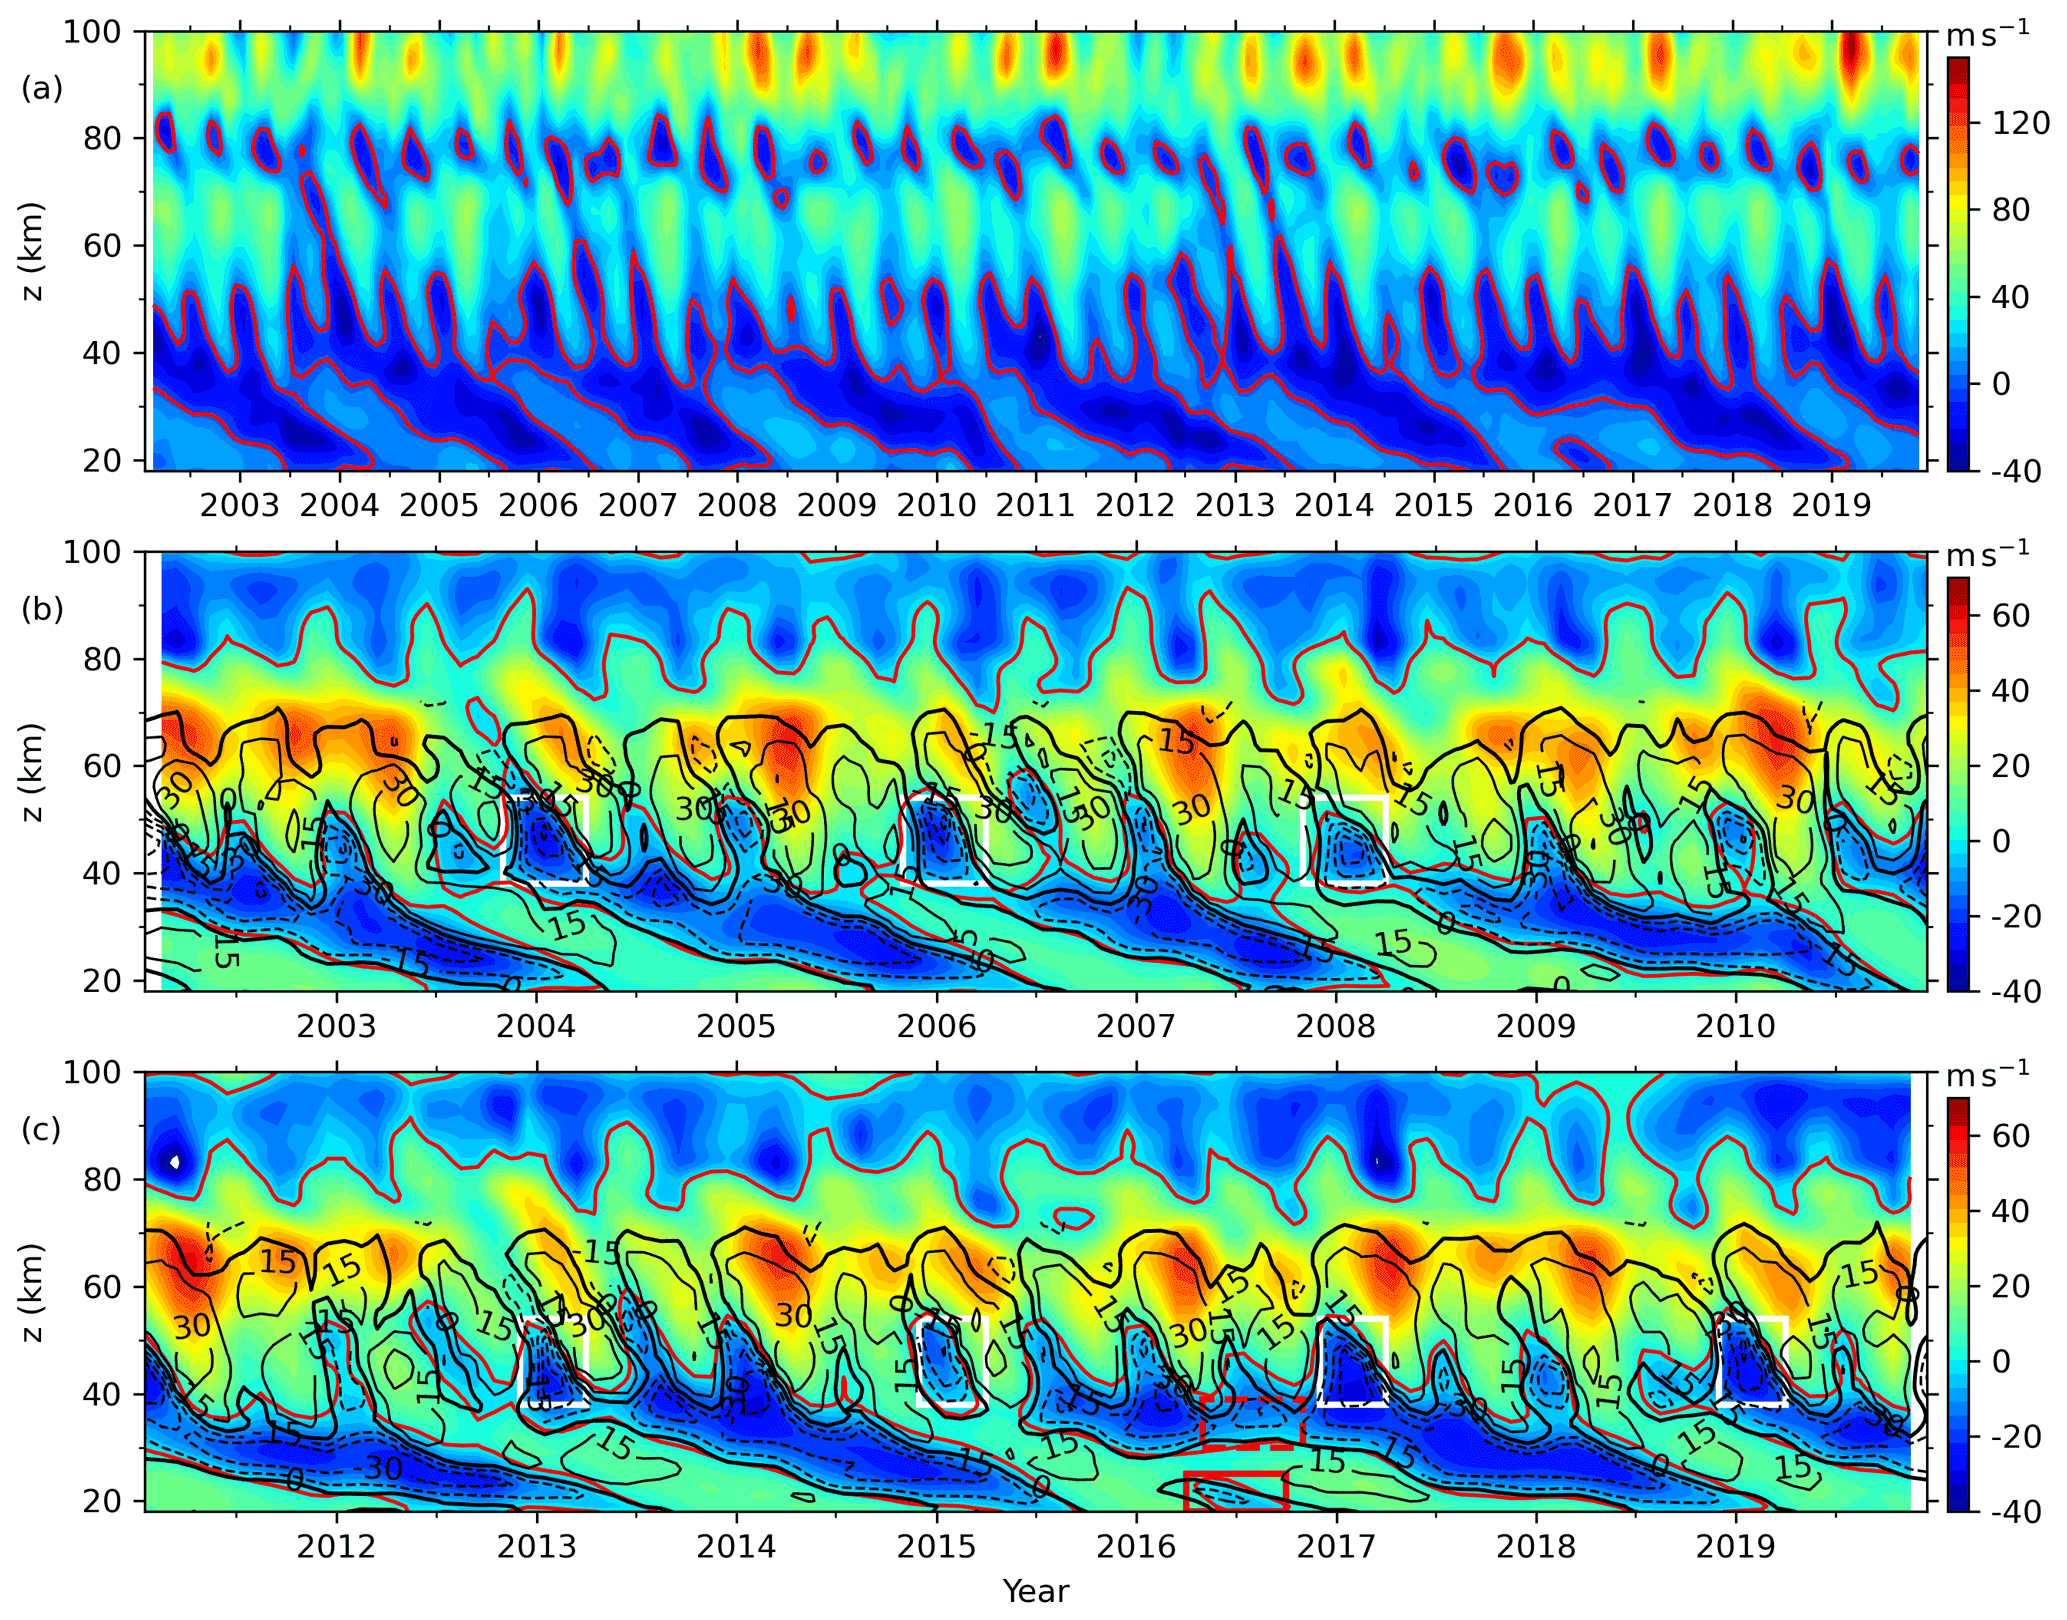
Figure 2The BU (color filled contour, positive for eastward) calculated by Eq. (4) at the Equator at 18–100 km (a: 2002–2019) and the reconstructed BU (b: 2002–2010; c: 2011–2019). The over-plotting contour lines show MerU (interval of 15 m s−1; the eastward and westward winds are represented as solid and dashed lines, respectively). The white rectangles highlight the fast westward jet during the beginning of the QBO westward phase. The red and thick black contour lines are the zero winds of BU of MerU, respectively. The solid and dashed red rectangles show the disrupted QBO in 2016. The ticks on the x axis mark the beginning of each year.
To validate the BU derived from the SABER observations and modified by meteor radar wind observations near the Equator, we will compare the BU with (i) monthly mean zonal winds from MERRA2 data (MerU), (ii) the UARP wind (UarU) and the zonal wind calculated from HWM14, and (iii) the zonal winds observed by meteor radars (MetU) at latitudes of 29.7∘ S–53.5∘ N and an Na lidar (LidU) at 40.6∘ N.
3.1 Comparisons with the wind from MERRA2
First of all, we should note that the BU data are derived from the temperature and pressure profiles measured by the SABER instrument and the zonal wind observed by a meteor at Koto Tabang (0.20∘ S). None of these data are assimilated in MERRA2. Thus, BU and MerU are independent. Figure 2b and c, and Fig. 3, and Fig. 4 compare the BU derived from SABER observations and the monthly mean zonal winds from MERRA2 data (MerU) at the Equator, the midlatitudes (30∘ N/S) and at high latitudes (50∘ N/S), respectively. To perform a more quantitative comparison, in Fig. 5 we show the wind differences between BU and MerU and their standard deviations and percentage differences. The wind difference (Δuim) at each height (i) and month (m) is calculated here by subtracting the wind of other datasets () from the BU (). At each height the percentage difference (Pi) is defined as the ratio of the standard derivations (σi) of Δuim to the peak BU.

Figure 3Time–height sections of the BU (color-filled contour, positive for eastward) and MerU (lines with contour interval of 20 m s−1, the eastward and westward winds are represented as solid and dashed lines, respectively) at 30∘ S (a, b) and 30∘ N (c, d). The red and thick black contour lines are the zero winds of BU of MerU, respectively. Different color scales are used at 30∘ S and 30∘ N. The ticks on the x axis mark the beginning of each year.
At the Equator (Fig. 2b and c), the agreements of BU and MerU are good at least below ∼ 55 km and can be described as follows. (i) At ∼ 40–55 km, the SAO is dominant in both BU and MerU and has nearly identical amplitudes and phases, as well as zero wind lines. (ii) At ∼ 35–40 km, both SAO and QBO can be seen in BU and MerU. (iii) At ∼ 20–35 km, the QBO is dominant in both BU and MerU and has nearly identical zero wind lines. (iv) Both BU and MerU reproduce the disrupted QBO in 2016; i.e., a westward jet (highlighted by a solid red rectangle) formed within the eastward phase of QBO at 18–23 km. Meanwhile the eastward wind shifts to a higher height (above 23 km) (Newman et al., 2016; Osprey et al., 2016; Diallo et al., 2018). Subsequently, the westward wind (highlighted by a red dashed rectangle) occurred in the eastward phase of QBO at ∼ 30–35 km during late 2016. (v) At ∼ 40–50 km, the fast westward jet (shown as white rectangles) seems to be an extension of the westward phase of QBO to a higher height just after the QBO changes its phase from eastward to westward. This feature can also be seen in Fig. 6 of Smith et al. (2017), which showed the BU derived from the SABER observations. The wind differences shown in Fig. 5a exhibit that BU is more westward (eastward) than MerU below ∼ 30 km during the period of QBO westward (eastward) phase. At ∼ 30–55 km, BU is more westward than MerU with peak differences of ∼ 20 m s−1. Above ∼ 55 km, the BU is more eastward than MerU with peak differences of ∼ 60 m s−1. A possible reason for the less eastward MerU is the strong damping of MERRA2 (Ern et al., 2021). The standard deviations of the wind differences (left column of Fig. 5a) are less than 7 m s−1 below ∼ 40 km and is about 10 m s−1 above ∼ 42 km. The large percentage differences (middle column of Fig. 5a) with magnitudes of ∼ 30 %–40 % occur at around 20 and 43 km. In the other height ranges, the percentage differences are ∼ 20 %.

Figure 5The wind differences between BU and MerU (right column) and their standard deviations (σ, left column) and percentage differences (P, middle column) at the Equator (a), 30∘ N/S (b, c), and 50∘ N/S (d, e). The black contour lines are the zero wind difference.
At 30∘ N/S (Fig. 3), the excellent agreements between BU and MerU can be summarized as the following three points. (i) At 30∘ S (Fig. 3a and b), the eastward jets are asymmetrical around June with peaks at a lower (higher) height during early (late) summer of most years. (ii) At 30∘ N (Fig. 3c and d), the eastward jets of both BU and MerU have two relatively weak peaks below ∼ 60 km, and with the increasing height the two peaks merge into one strong peak above ∼ 70 km during the winter of most years. (iii) Both BU and MerU have nearly identical patterns of zero wind lines and westward wind jets. The more quantitative comparisons shown in Fig. 5b and c show that the wind differences generally exhibit asymmetric AO, except for the short-term variations with periods of several months. The asymmetry means that the eastward phase of AO in the wind differences lasts a longer time than the westward phase. Comparisons between Figs. 5b and 3 show that the AO in wind difference is generally in phase with that in the zonal wind. This indicates that the BU is more eastward (westward) than MerU when the wind phase is eastward (westward). Compared to the wind differences before August 2004, the wind differences are smaller above ∼ 60 km. This might be a consequence of the improved quality of MERRA2 after assimilating the MLS data (Molod et al., 2015; Gelaro et al., 2017). The standard deviations of the wind differences (left column of Fig. 5b and c) vary from ∼ 3 to ∼ 8 m s−1 with increasing heights. The percentage difference is ∼ 10 % in the entire height range, except for ∼ 35 % at 21 km and 30∘ S.
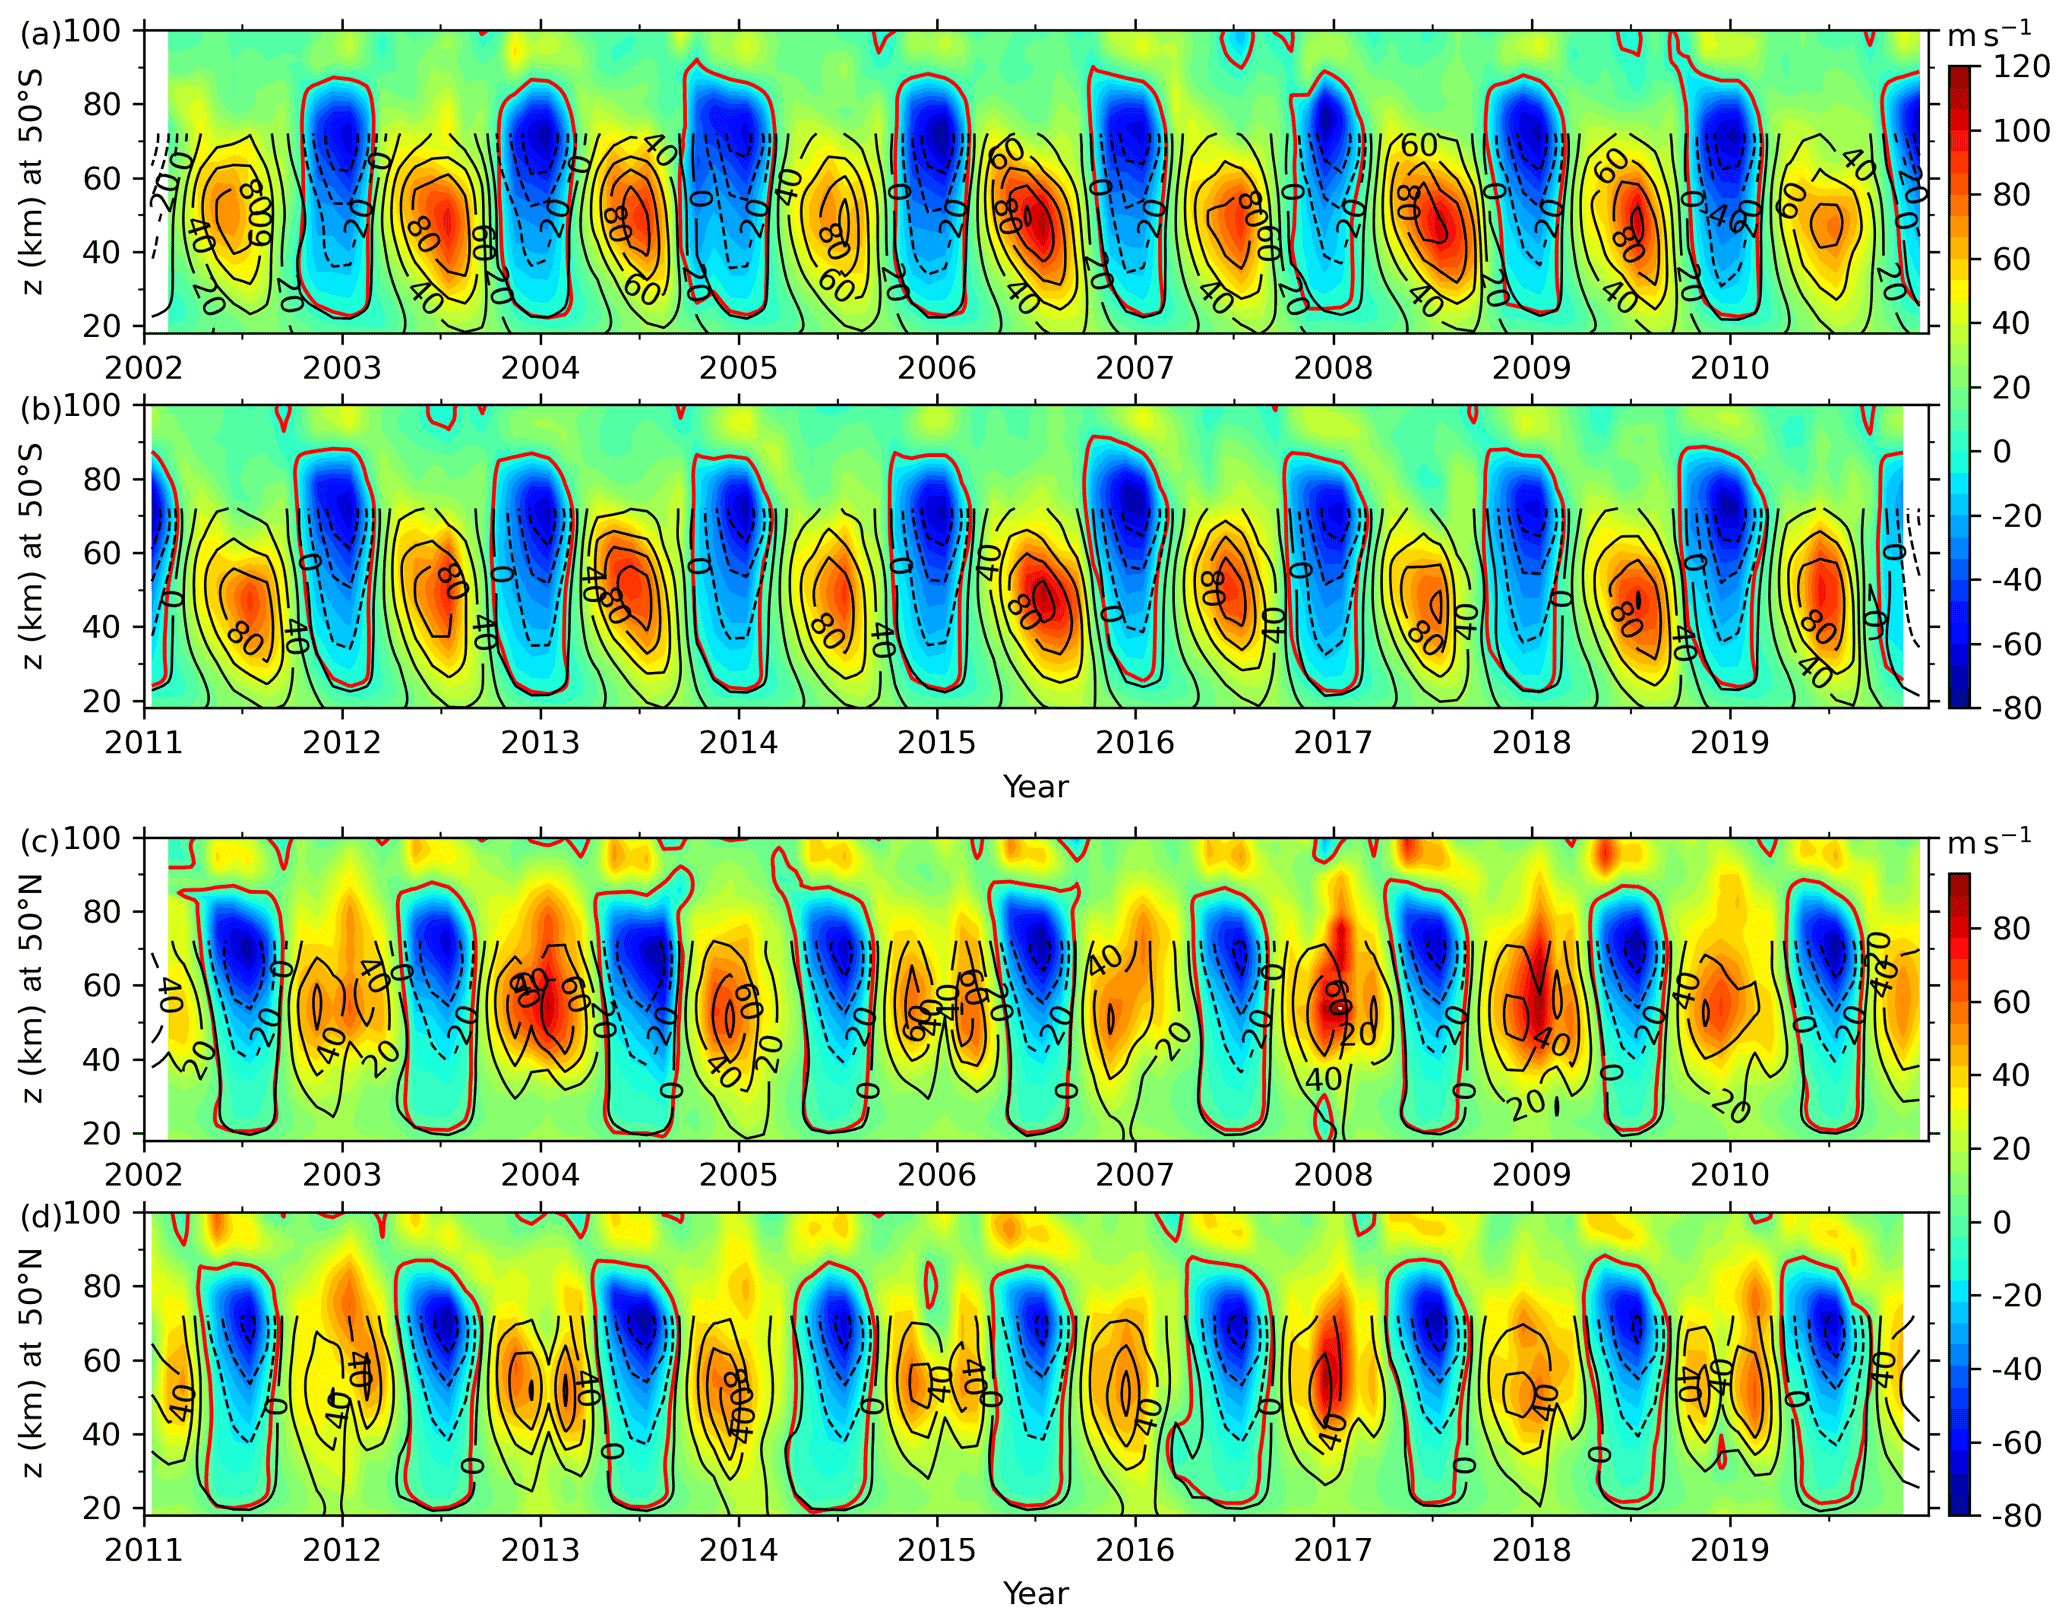
At 50∘ N/S (Fig. 4), the eastward jets of both BU and MerU are stronger at 50∘ S than those at 50∘ N below ∼ 70 km. Moreover, the westward jets of both BU and MerU reach their peaks at higher heights than those of the eastward jets. At 50∘ S, the BU and MerU agree well with each other and can be described using the following four aspects: (i) the nearly identical patterns of zero wind lines, (ii) the fastest (slowest) eastward winds during 2006 (2010), (iii) the nearly identical times (around July) and heights (∼ 50 km) of the eastward wind jets, and (iv) the nearly identical times (around January) and heights (∼ 70 km) of the westward wind jets. At 50∘ N, the good agreements between BU and MerU exhibit the four aspects mentioned above. Moreover, the double-peak structure can be seen in both BU and MerU during winter of some years (e.g., 2003, 2004, 2006, 2008, 2009, 2012, 2013, 2015, 2019). These double-peak structures caused by the sudden stratospheric warming (SSW), which reduces eastward wind during minor SSW or even reverses the eastward wind to westward during major SSW (Butler et al., 2015, 2017). From Fig. 5d and e, we see that the wind differences exhibit asymmetric AO. Here the asymmetries mean that the time interval of the eastward and westward phases are different in each hemisphere, and they are also different between 50∘ N and 50∘ S. At 50∘ S, the westward (eastward) phase lasts a longer time than the eastward (westward) phase below (above) ∼ 60 km. In contrast, the eastward phase lasts a longer time than the eastward phase at 50∘ N. The standard deviations of the wind differences (left column of Fig. 5d and e) vary from ∼ 3 to ∼ 12 m s−1 with the increasing height. The percentage difference is in the range of 10 %–17 % except for ∼ 20 % at 38 km and 50∘ N.
The above comparisons show that BU and MerU agree well with each other. At the Equator and below 55 km, BU and MerU have nearly identical zero wind lines and reproduce the QBO and SAO. Both BU and MerU reproduce the fast westward jet during the beginning of the QBO westward phase and the disrupted QBO in early 2016. At middle and high latitudes, BU and MerU have nearly identical zero wind lines in the height range of 20–70 km and reproduce the year-to-year variations of the latitude and height-dependent eastward and westward jets. Both BU and MerU reproduce the double-peak structures induced by SSW in the NH.
3.2 Comparisons with the winds from UARP and HWM14 in a composite year
To compare the UraU with BU, the UraU is interpolated to geometric height with a vertical interval of 1 km and a latitude interval of 2.5∘. Moreover, the BU is rearranged in a composite year, which is calculated by averaging the BU in the same calendar month of the years from 2002 to 2019. Figure 6 shows the latitude–height sections of BU and UraU and their differences in each month of the composite year. It shows that zero wind lines of BU and UraU are nearly identical below ∼ 85 km from 50∘ S to 50∘ N. During winter (November, December, January, February) in the NH and summer (May, June, July, August) in the SH, the eastward jet shifts from high to low latitudes with the increasing height. During summer in the NH and winter in the SH, the westward jet shifts from low to high latitudes with the increasing height. During spring (March, April) and autumn (September, October), the westward winds, which occur at low and middle latitudes and below ∼ 45 km or above ∼ 70 km, are separated by eastward winds at ∼ 45–70 km. These comparisons show the good agreement between BU and UraU below ∼ 80 km.

Figure 6Latitude–height sections of BU (color-filled contour, positive for eastward) and UraU (contour lines with interval of 10 m s−1, the eastward and westward winds are represented as solid and dashed lines, respectively) in each month (denoted in the upper-left corner of each panel) of a composite year. The thick black and red contour lines are the zero wind of UraU and BU, respectively. The same color scale is used for all months.
Above 80 km and at middle to high latitudes, both BU and UraU exhibit similar eastward jets during winter in the SH and during summer in the NH. During summer in the SH and winter in the NH, both BU and UraU exhibit decreasing eastward wind with the increasing height and even reverse to westward near 100 km. This is different from the MetU at MH (53.5∘ N) and BJ (40.3∘ N) (red lines in Fig. 8), in which the westward winds occur only around March and April. The comparisons among the BU, MetU and UraU will be shown in the next subsection.
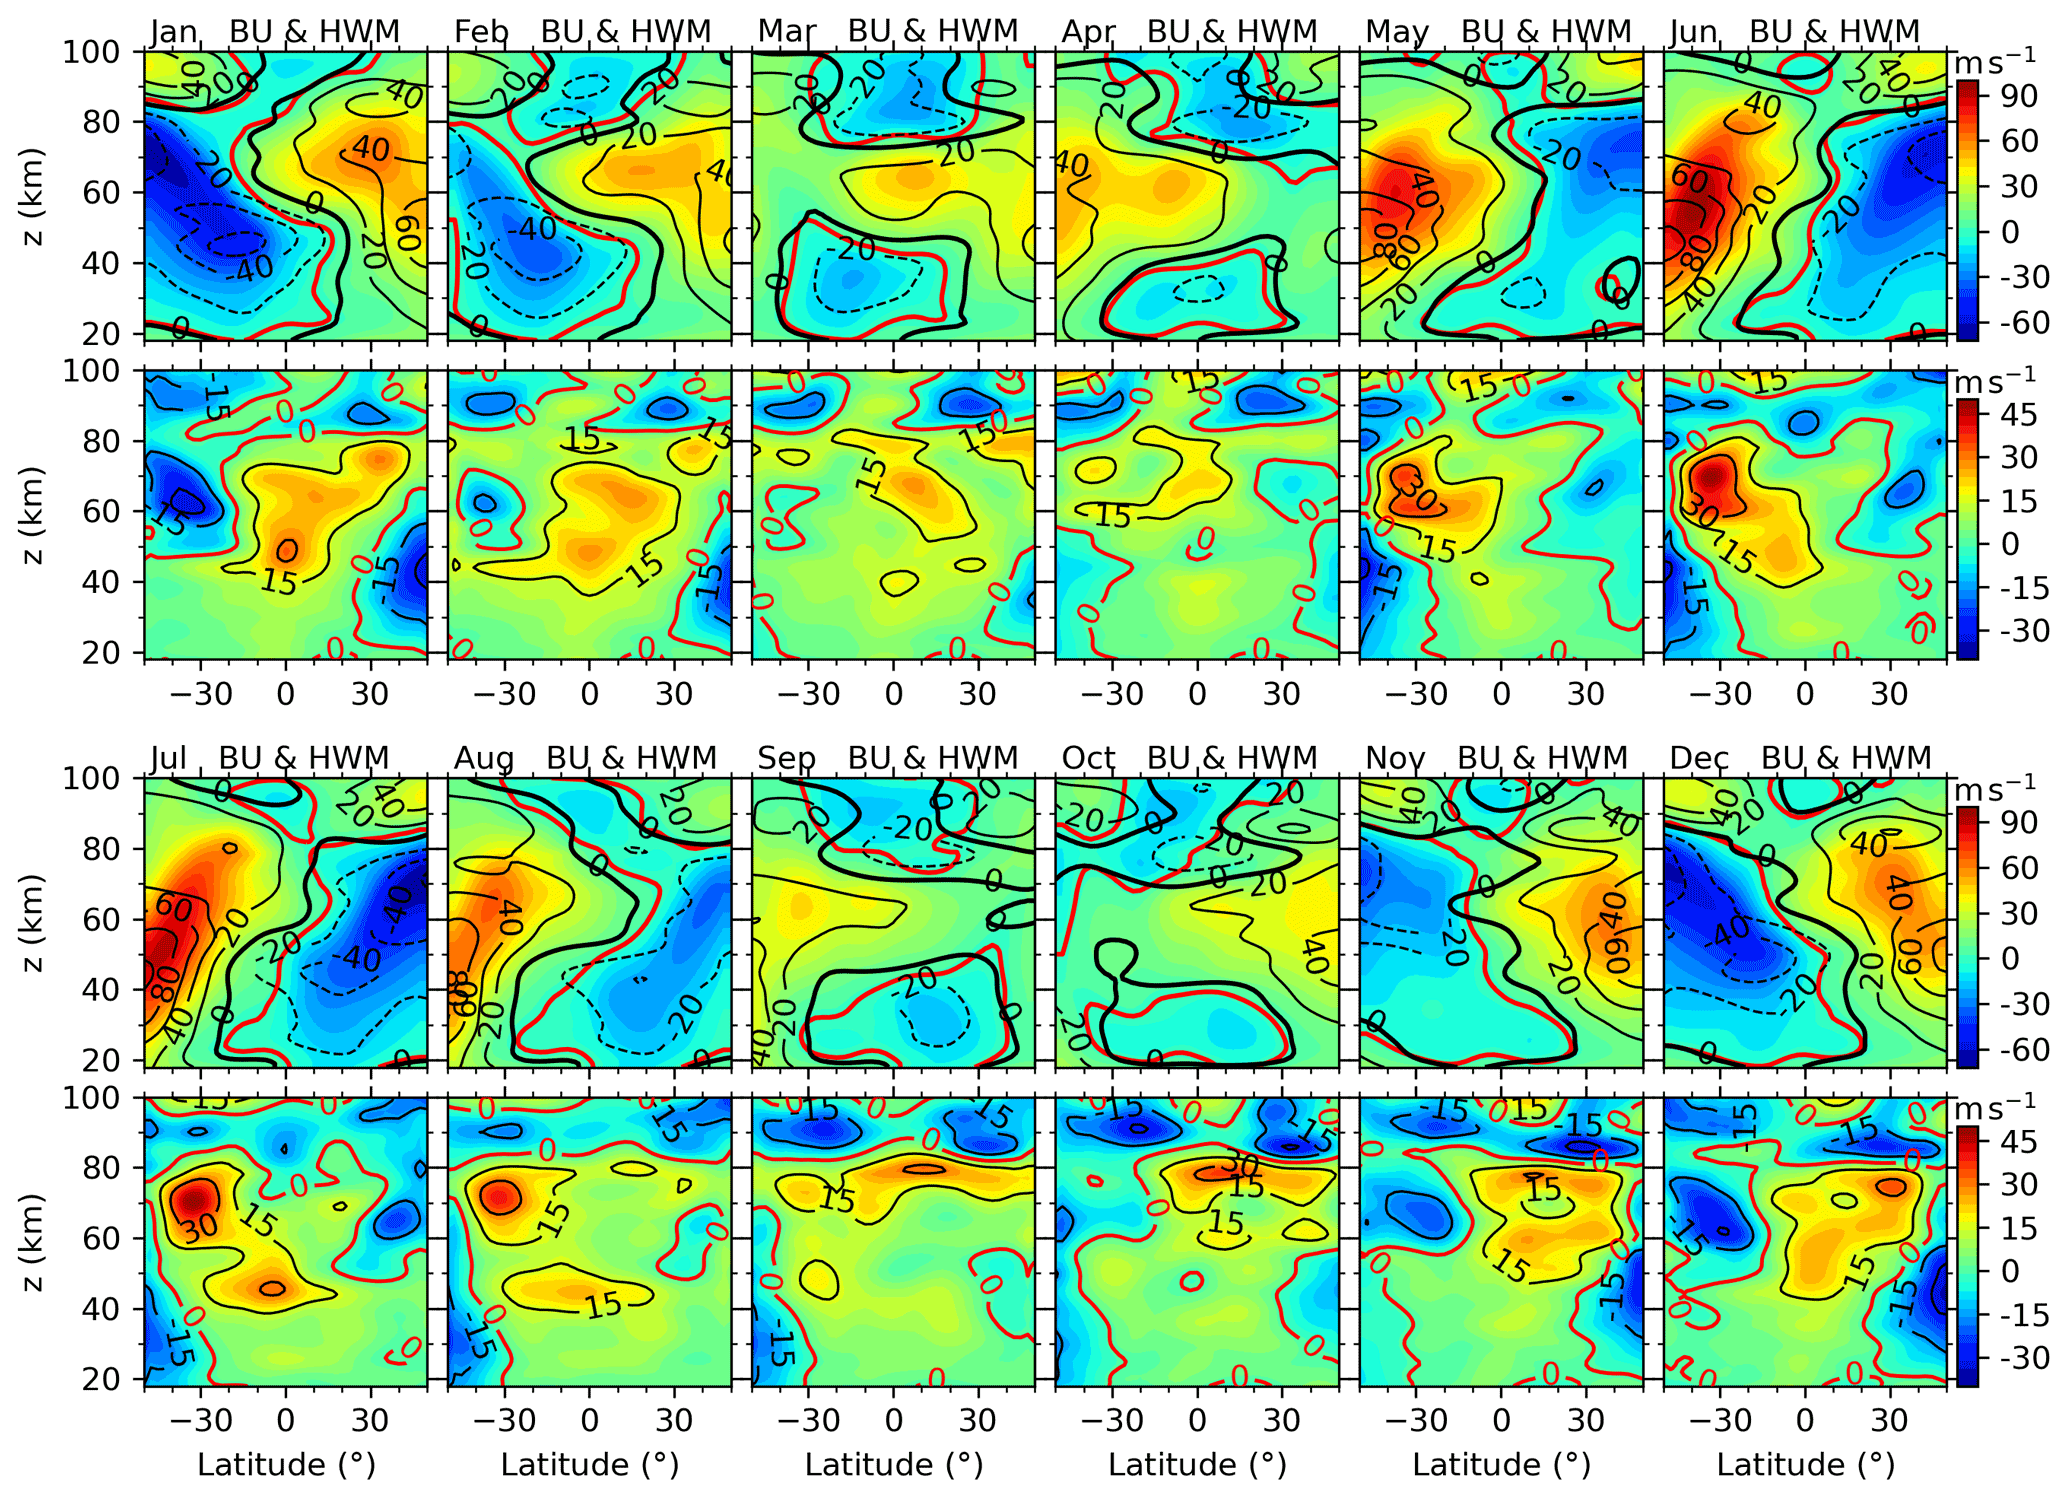
Figure 7The same as Fig. 5 but for the BU and HWM14. The thick black and red contour lines are the zero wind of HwmU and BU, respectively.
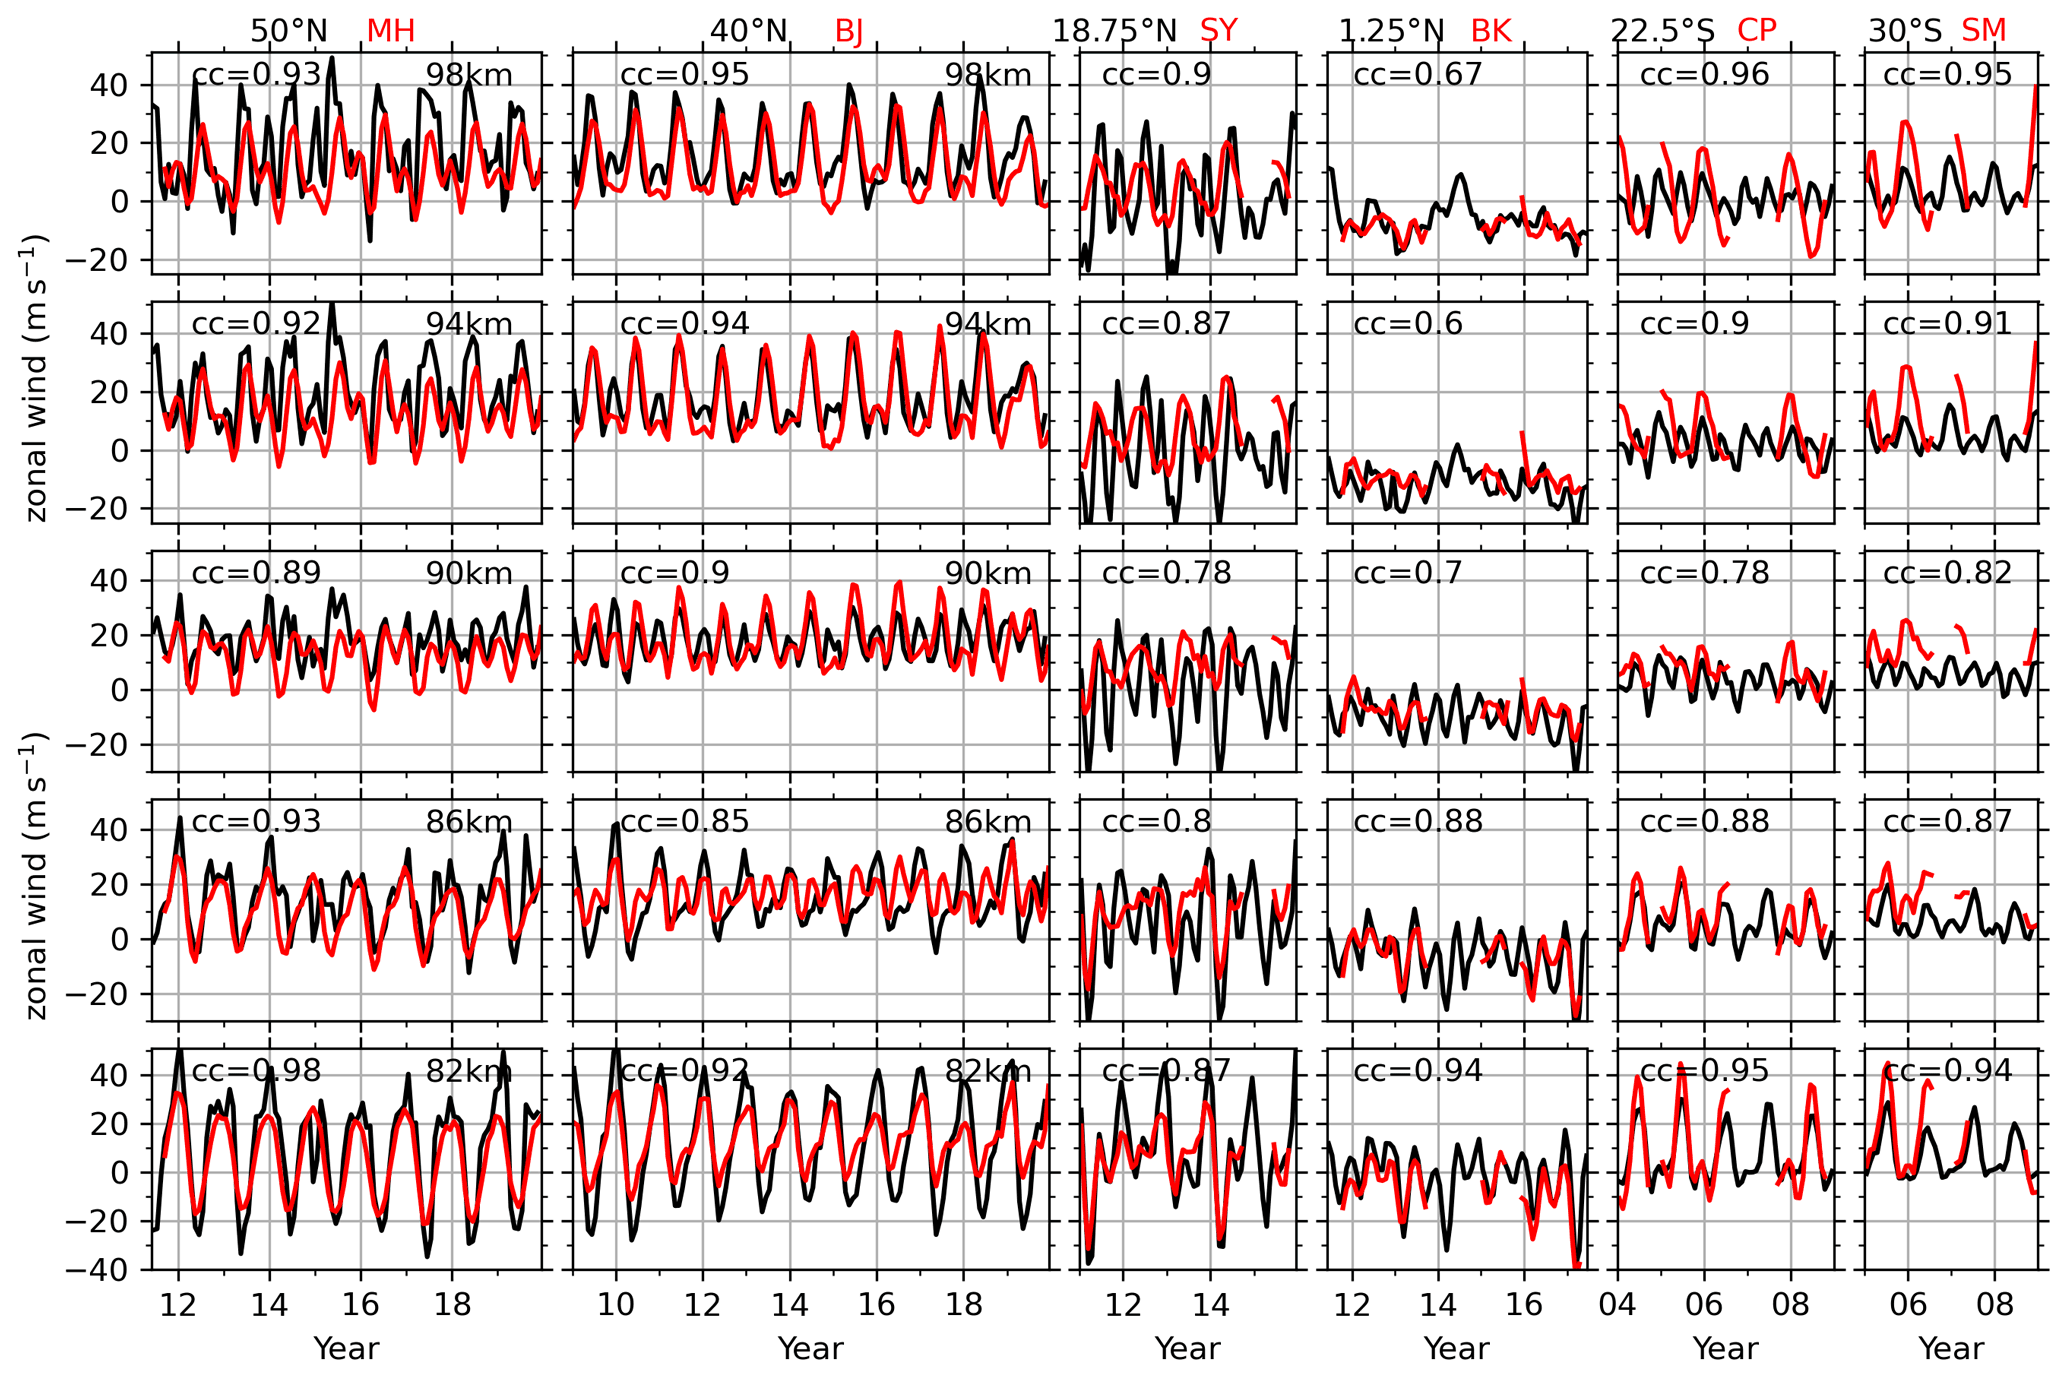
Figure 8Monthly mean zonal wind from meteor radars (red lines, positive for eastward) at (from left to right) MH (53.5∘ N), BJ (40.3∘ N), SY (18.3∘ N), BK (1.2∘ S), CP (22.7∘ S), and SM (29.7∘ S) stations and the BU (black) at a similar latitude (labeled at the top of each column) at five heights. The correlation coefficient (cc) between BU and MetU is labeled on each panel. The same y axis is used in each row. The ticks on the x axis mark the beginning of each year.
At the Equator and above 80 km, both BU and UraU exhibit westward winds but have different height and latitudinal coverages. At ∼ 90 km, the UraU is eastward throughout the composite year except during February–April. However, the BU is eastward only during June and December and westward during other months. By analyzing the zonal winds measured by the medium frequency (MF) radars at Christmas Island (2∘ N, 157∘ W), Tirunelveli (8.7∘ N, 77.8∘ E), and Pameungpeuk (7.4∘ S, 107.4∘ E) and meteor radar at Koto Tabang (0.20∘ S, 100.3∘ E) and Jakarta (6∘ S, 107∘ E), Rao et al. (2012) showed that the composite zonal winds are westward except around June, July, and December. This supports the BU derived here. Comparing between the BU calculated from Eq. (4) (Fig. 2a) and the reconstructed BU (Fig. 2b and c) above 80 km, we find that the BU calculated from Eq. (4) is eastward in general. While the reconstructed BU is largely westward and coincides with the radar observation results of Rao et al. (2012). Thus, the reliability of the BU around the Equator above 80 km is improved greatly after we combine the BU derived from the SABER observations and MetU measured by the meteor radar at KT (0.20∘ S).
Although BU and UraU exhibit general consistency in climatologic sense, there are still some differences between them. The wind differences between BU and UraU (the second and fourth rows of Fig. 6) reach eastward maxima of 30 m s−1 around the Equator and at ∼ 70–80 km during March–April and October–December. There are also westward differences with peaks larger than 15 m s−1 at ∼ 50 km and the Equator during January–April. The westward peaks of −30 m s−1 occur at around 30∘ N/S and at ∼ 85–95 km during February–May and August–October. There are also westward differences, which extend downward from ∼ 100 to ∼ 50 km in the SH during November–January and in the NH during June–July. To summarize the wind differences, the eastward (westward) differences occur around the Equator (30∘ N/S).
Now, we compare the BU and HwmU. In a same manner as Fig. 6, we show in Fig. 7 the HwmU and BU in a composite year. Below ∼ 85 km the eastward jets of BU and HwmU agree well during winter in the NH and during summer in the SH. Meanwhile, the westward jets of HwmU and BU agree well during summer in the NH and during winter in the SH. During spring and autumn and at low and middle latitudes, the westward winds below ∼ 45 km or above ∼ 70 km surround the eastward winds at ∼ 45–70 km. These comparisons show the good agreement between BU and HwmU below ∼ 80 km.
Around the Equator and at ∼ 90 km, the eastward HwmU occurs during May–July and November–December, which lasts a shorter time interval than that of the UraU. At ∼ 20–40∘ N, above the peaks of the eastward jets (at ∼ 70 km), there are weak eastward jets in UraU (HwmU) during September–November (September–December) at 80–90 km with a peak at ∼ 85 km. However, this peak is not as obvious as in BU or in the MetU at BJ (40.3∘ N) and SY (18.3∘ N) or in the LidU at CSU (40.6∘ N) shown in the next subsection.
The differences between BU and HwmU should be mentioned (the second and fourth rows of Fig. 7). Among the composite years, the eastward differences with peaks of ∼ 45 m s−1 occur at ∼ 60–80 km during May–August in the SH. This is different from the wind differences between BU and UraU, in which the eastward differences reach their peaks around the Equator. The westward differences with peaks of ∼ −30 m s−1 occur at heights of ∼ 30–50 km and latitudes of 30–50∘ N (30–50∘ S) during winter in the NH (SH). Moreover, the westward differences with peaks of ∼ −30 m s−1 occur at ∼ 55–75 km and latitudes of 30–50∘ S (30–50∘ N) during winter in the SH (NH). Above ∼ 80 km, the wind differences are westward in general throughout the composite year. This is comparable to the wind difference between BU and UraU.
3.3 Comparisons with the time series of winds measured by meter radars
Figure 8 shows the monthly mean zonal wind from meteor radars (MetU) and the BU at similar latitudes and five height levels. At MH (53.5∘ N) station, the variations of BU agree well with MetU with correlation coefficients (CCs) of 0.89–0.98. Moreover, BU and MetU exhibit similar AO and SAO above 90 km and similar AO below 86 km. The eastward peak of AO in both BU and MetU shift from below 86 km in winter to above 92 km in summer. From 2011 to 2019 and above 86 km, both BU and MetU show that the eastward wind is dominant in almost of all months except March and April, during which the MetU reversed from eastward to westward. Here we note that the BU at 50∘ N, which represents the latitude range of 47.5–52.5∘ N, is near the location of MH (53.5∘ N) station. The slight difference in latitude might contribute some discrepancies between the BU and MetU at MH (53.5∘ N) station.
At BJ (40.3∘ N) station, the variations of BU agree with MetU with CCs of 0.85–0.95. The AO and SAO of BU and MetU at BJ vary with height. Both BU and MetU show that the eastward peaks of AO shift from winter below 82 km to summer above 90 km. This is a similar situation to that at MH station. At 86 km, the AO and SAO are almost equally portioned for the MetU with peaks in both summer and winter, while the AO is dominant with eastward peaks in winter. From 2009 to 2019 and above 86 km, both BU and MetU show that the eastward wind is dominant except for some occasional periods.
At SY (18.3∘ N) station, the CCs between BU and MetU are in the range of 0.78–0.9. However, the temporal variations of BU do not coincide well with that of MetU since the BU (MetU) is dominated by both AO and SAO (AO) above 86 km. Only at 82 km do the temporal variations of BU and MetU agree well with each other. Moreover, at 82, 86, and 90 km, in addition to the AO and SAO, the QBO signal (with westward peaks in the beginning of 2011 and 2013) appears in both BU and MetU.
At BK (1.2∘ S) station, the BU and MetU agree well with each other and have CCs of more than 0.88 below 86 km. The smaller CCs above 90 km are mainly caused by the inconsistency of weak temporal variations in BU and MetU. It should be noted that the magnitudes of BU agree well with those of MetU above 90 km. Moreover, both BU and MetU exhibit similar AO and SAO from 82 to 98 km (except at 94 km).
At CP (22.7∘ S) station, the CCs between BU and MetU are in the range of 0.78–0.96. The temporal variations of BU and MetU agree well below 90 km. At 94 and 98 km, although the BU and MetU have CCs of 0.9 and 0.96, they are dominated by the SAO and AO, respectively. At SM (29.7∘ S) station, the CCs between BU and MetU are in the range of 0.82–0.95. The temporal variations of BU and MetU agree well with each other (except at 86 and 90 km). At 82, 94, and 98 km, both BU and MetU are dominated by AO, while the AO in MetU has a larger amplitude than that of BU.
A summary of the comparisons between the time series of BU and MetU is given below. At MH (53.5∘ N), BJ (40.3∘ N), BK (1.2∘ S), and SM (29.7∘ S) stations, the agreements between BU and MetU are good in general. The agreements are better at 82, 94, and 98 km than those at 86 and 90 km. At SY (18.3∘ N) station, the agreement between BU and MetU is only good at 82 km. At CP (22.7∘ S) station, the agreement between BU and MetU is good only below 90 km.
3.4 Comparisons with the Winds measured by meteor radar and lidar in a composite year
To compare BU, UraU, HwmU, and MetU above 80 km in terms of climatology, we show their monthly mean values and their differences in a composite year in Fig. 9. At 50∘ N and MH station (the first row of Fig. 9), the winds of the four datasets exhibit AO and agree well with each other below 85 km. The exception is that the BU and MetU are more westward than UraU and HwmU in summer and are less eastward than UraU and HwmU in winter. Above 86 km, the agreement is also good except that (i) the westward wind in MetU during April does not occur in BU, UraU, and HwmU; (ii) the westward wind in UraU during December does not occur in BU, HwmU, and MetU; and (iii) the SAO in BU and MetU cannot be seen in UraU and HwmU. The eastward differences of BU–MH with peaks larger than 15 m s−1 occur above ∼ 85 km and during April–June. In contrast, the eastward differences of larger than 15 m s−1 last for a longer time interval for UraU–MetU and HwmU–MetU. Moreover, the westward differences are also larger in UraU–MH and HwmU–MH than those in BU–MH.
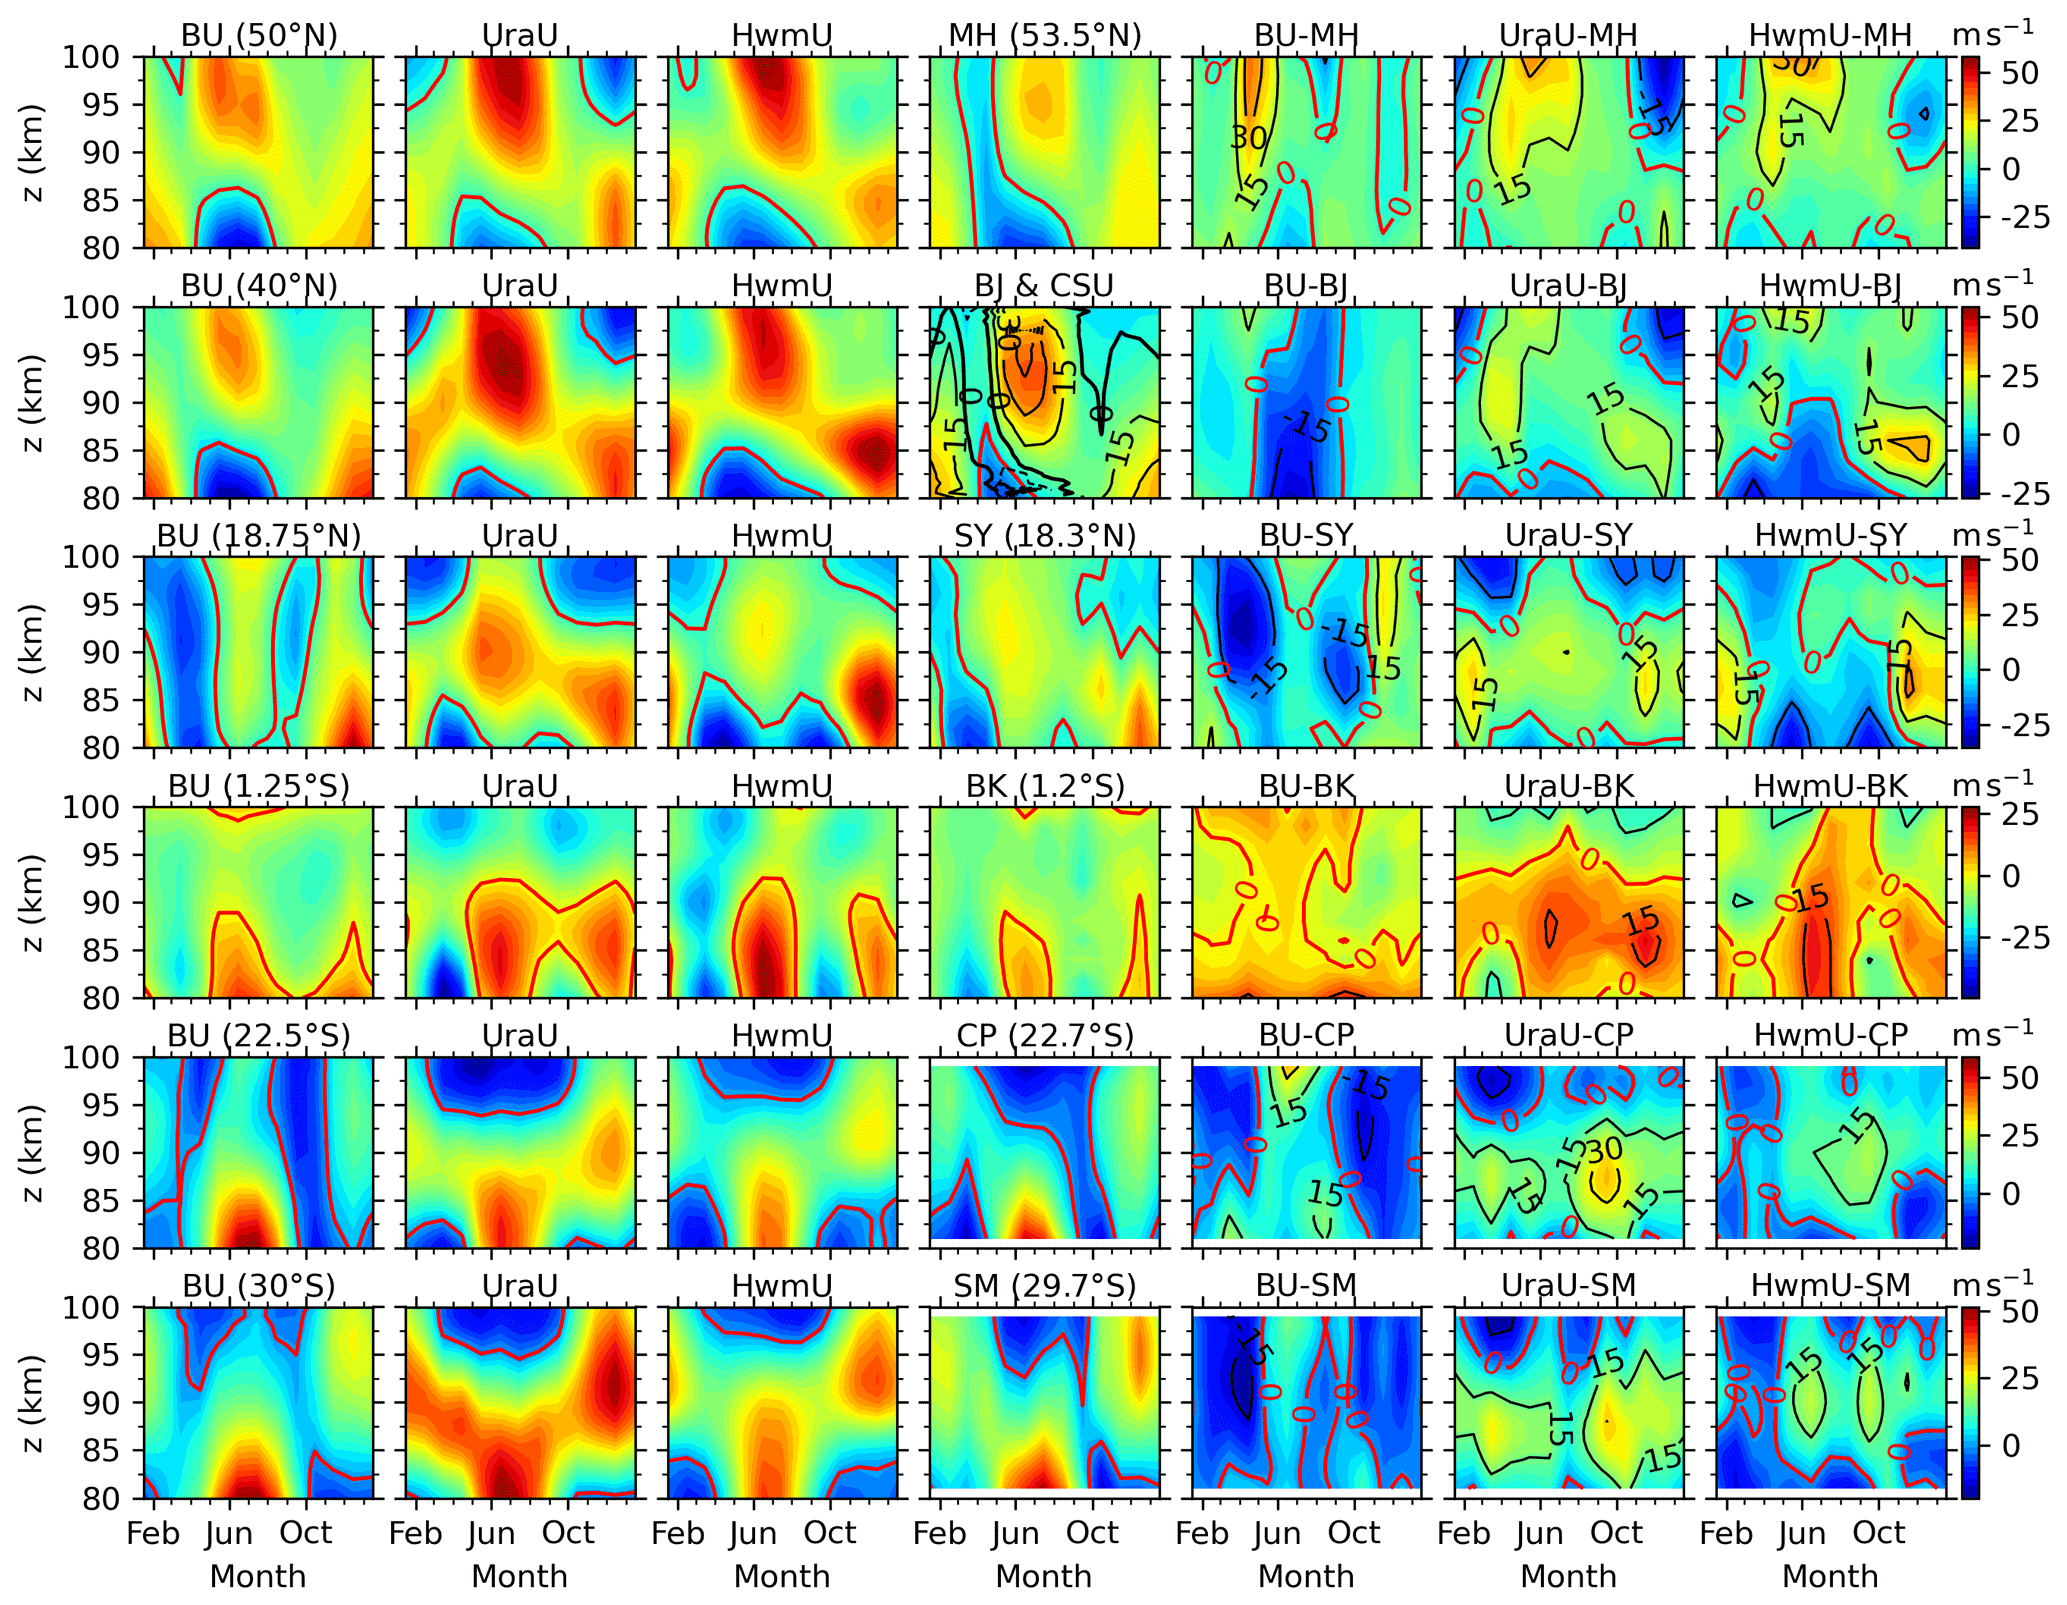
Figure 9Monthly mean zonal winds of BU, UraU, HwmU, and MetU (from the first to fourth column) and their differences (from the fifth to seventh column) at (from up to below) MH (53.5∘ N), BJ (40.3∘ N), SY (18.3∘ N), BK (1.2∘ S), CP (22.7∘ S), and SM (29.7∘ S) stations in a composite year. The red contour lines show the zero wind in each panel. The black contour lines (interval of 10 m s−1) show the zonal wind measured by the CSU lidar (LidU). The wind difference is represented by color-filled contour and highlighted by contour lines.
At 40∘ N and BJ and CSU stations (the second row of Fig. 9), the BU exhibits AO and shifts its eastward peak from below ∼ 90 km in winter to above ∼ 90 km in summer. In contrast, the AOs in MetU and LidU shift their eastward peaks from below ∼ 85 km in winter to above ∼ 85 km in summer. The difference between MetU and LidU is that the westward LidU shift from ∼ 80 km in June to ∼ 100 km in March, while the westward MetU occurs only below ∼ 85 km. The weak eastward BU and MetU extend upward from ∼ 85 km in April and October to ∼ 100 km in January and December. This is different from those of UraU and HwmU: (i) the eastward wind peaks of both UraU and HwmU are stronger than those of BU, MetU, and LidU, and (ii) the weak eastward peaks at ∼ 90 km in March and September do not appear in either BU or MetU or LidU. Thus, the BU at 40∘ N agrees with MetU and LidU better than with UraU and HwmU. The westward differences of BU–BJ with peaks less than −15 m s−1 occur below ∼ 88 km and during May–July. In contrast, the differences of UraU–BJ and HwmU–BJ are eastward with peak values of greater than 15 m s−1, which are larger than those of BU–BJ. The westward differences of BU–BJ and eastward differences of UraU–BJ and HwmU–BJ are responsible for the westward differences of BU–UraU and BU–HwmU at latitudes higher than 30∘ N (Figs. 6 and 7). When comparing the differences of BU–BJ, UraU–BJ, and HwmU–BJ, the magnitudes of the differences of BU–BJ are the smallest, although they vary with month and height.
At 18.75∘ N and SY station (the third row of Fig. 9), the westward BU at ∼ 80 km in March–May shifts upward to ∼ 100 km in January–April. This agrees with MetU, except that the westward MetU lasts for a shorter time interval. However, this is different from those of UraU and HwmU, which experience eastward wind at ∼ 87–95 km. The westward BU at ∼ 80 km in August shifts upward to ∼ 100 km in October. In contrast, this westward BU does not occur in either UraU, HwmU, or MetU. The eastward wind peaks during summer at ∼ 80–100 km can be seen in the four datasets. The height range and duration of westward differences of BU–SY are larger and longer than those of UraU–SY and HwmU–SY. The peak value of the westward differences of BU–SY is more negative than −15 m s−1. This contrasts with the eastward difference of 15 m s−1 for UraU–SY and HwmU–SY.
At 1.25∘ S and BK station (the fourth row of Fig. 9), the agreement between BU and MetU is excellent for the aspects of both seasonal and height variations. This is mainly because the BU is reconstructed by the MetU at the KT station, which is at 0.20∘ S and is very close to BK station (1.18∘ S). The UraU and HwmU exhibit similar SAO with eastward peaks during summer and winter. These eastward peaks are much stronger than those of BU and MetU, especially below ∼ 92 km. In contrast, above ∼ 92 km the UraU and HwmU are more westward than those of BU and BK. This is different from the results of Rao et al. (2012), who showed that the UraU was less westward than the MetU at KT station (0.20∘ S). A possible reason is that the 3-month running mean is performed here to construct a smooth BU at the Equator and reduce the peak magnitudes of zonal winds. The differences of BU–BK are smaller than those of UraU–BK and HwmU–BK. This might be due to the inclusion of the zonal wind measured at KT station (0.20∘ S) when we construct BU at the Equator. In contrast, the differences of UraU–BK and HwmU–BK reach their peak values of larger than 15 m s−1 in summer and winter.
At 22.5∘ S and CP station (the fifth row of Fig. 9), the agreement between BU and MetU is good below ∼ 92 km. Both of them exhibit (i) SAO with eastward peaks in summer and winter and (ii) westward winds during September–October shifting backward with height. However, this westward wind cannot be seen in either UraU or HwmU. Above ∼ 92 km, the agreement among the four datasets is good during January–March and October–December. During May–September, the eastward wind in BU cannot be seen in the other three datasets. This might be symmetrical to results at 18.75∘ N, where the eastward wind in BU during November–December cannot be seen in the other three datasets. The differences of BU–CP are eastward with peak of more negative than −15 m s−1 in summer and westward in winter with peak of larger than 15 m s−1. In contrast, the differences of UraU–CP are eastward with peak of larger than 15 m s−1 below ∼ 92 km and westward above ∼ 92 km. Among the four datasets, the differences of HwmU–CP are smallest in general. A possible reason is that the winds measured by medium-frequency radar at similar latitudes (Bribie Island at 28∘ S) have been included in the HWM14 model (Drob et al., 2008).
At 30.0∘ S and SM station (the sixth row of Fig. 9), the agreement between BU and MetU is good in general. An exception is that the BU is less eastward than the other three datasets during March–June at 82–95 km. Both BU and MetU exhibit much weaker eastward winds than UraU and HwmU during September–November at ∼ 82–95 km. During May–September and above ∼ 92 km, the eastward wind in BU cannot be seen in the other three datasets. However, the eastward wind in BU is weaker and extends over a shorter time interval compared to that at 22.5∘ S. Moreover, the eastward wind in BU is closer to the MetU than those of UraU and HwmU. The differences of BU–SM are mainly westward with a peak that is more negative than −15 m s−1 during April. In contrast, the differences of UraU–SM are eastward with peaks of larger than 15 m s−1 at ∼ 82–92 km throughout the composite year. Although the HWM14 model included the winds measured by the medium frequency radar at Adelaide (34.5∘ S) and Bribie Island at (28∘ S), there are still eastward differences with peaks of larger than 15 m s−1 during June and September.
A short summary of the comparisons among BU, UraU, HwmU, LidU, and MetU in the composite year is given below. The BU agrees with MetU and LidU better than UraU and HwmU at 50∘ N, 40∘ N, 1.25∘ S, and 30∘ S. At 18.75∘ N and 22.5∘ S, the agreement between BU and MetU is better than that among UraU, HwmU, and MetU during spring and summer since the westward winds in BU and MetU cannot be seen in UraU or HwmU. However, the agreement between BU and MetU is worse than that among UraU, HwmU, and MetU since the westward BU cannot be seen in the other three datasets in autumn. The agreement between BU and MetU at 1.25∘ S indicates that the reconstructed BU is a feasible way to get reliable zonal wind at the Equator above ∼ 80 km. The agreement between BU and MetU at 50∘ N, 40∘ N, and 30∘ S indicates that the reliability of balance wind theory can be extend up to the height of 100 km. The weaker agreement between BU and MetU at 18.75∘ N and 22.5∘ S indicates that the tidal aliasing to the mean wind might not be neglected at these latitudes.
The SABER data are downloaded from https://spdf.gsfc.nasa.gov/pub/data/timed/saber/ (last access: March 2020, SABER team, 2020). The UARP wind data were obtained from ftp://sparc-ftp1.ceda.ac.uk/sparc/ref_clim/randel/temp_wind (last access: March 2020, Swinbank and Ortland, 2003). The MERRA2 data were obtained from were obtained from http://disc.sci.gsfc.nasa.gov/mdisc (last access: March 2020, Molod et al., 2015 and Gelaro et al., 2017). The meteor radar data of MH, BJ, and SY were supported by the Chinese Meridian Project (Wang, 2010) and provided by Beijing National Observatory of Space Environment, Institute of Geology and Geophysics Chinese Academy of Sciences through the Geophysics center, National Earth System Science Data Center (http://wdc.geophys.ac.cn, last access: March 2020, Yu et al., 2015). The meteor radar data of KT and BK were provided by the Research Institute for Sustainable Humanosphere, Kyoto University (http://database.rish.kyoto-u.ac.jp/arch/iugonet, last access: March 2020, Hayashi et al., 2013). The database has been arranged by the Inter-university Upper atmosphere Global Observation NETwork (IUGONET) project (Hayashi et al., 2013). The meteor radar data at CP and SM are available upon request to Paulo Prado Batista. The CSU lidar data are available upon request to Tao Yuan. The BU data developed in this work are available at https://doi.org/10.12176/01.99.00574 (Liu et al., 2021).
Using the temperature and pressure observations by the SABER instrument over the past 18 years (2002–2019) and the balance wind theory, we derive the monthly zonal mean zonal wind (BU) at 18–100 km and at 10–50∘ N, 10–50∘ S, and at the Equator. The BU at the Equator and above 80 km is replaced by the zonal wind measured by the meteor radar at KT station (0.20∘ S). Therefore, the reconstructed BU overcomes tide aliasing at 80–100 km. Following this, cubic interpolation is applied to get BU at 7.5∘ S–7.5∘ N.
The BU is compared with the zonal winds from MERRA2 reanalysis data (MerU), UARP data (UraU), the HWM14 empirical model (HwmU), and meteor radar observations (MetU) at MH (53.5∘ N), BJ (40.3∘ N), SY (18.3∘ N), BK (1.2∘ S), CP (22.7∘ S), and SM (29.7∘ S) stations and the lidar observations (LidU) at CSU (40.6∘ N). The main conclusions can be summarized as follows.
The comparisons between BU and MerU show good consistency. At middle and high latitudes, BU and MerU have nearly identical zero wind lines in 18–70 km and year-to-year variations in the eastward and westward wind jets due to the double-peak structures caused by SSW. At the Equator and below 55 km, BU and MerU have nearly identical zero wind lines and reproduce the QBO and SAO, especially the disrupted QBO in early 2016.
The comparisons among BU, UraU, and HwmU show good agreement in general below 80 km. They have nearly identical zero wind lines and reproduce the eastward (westward) jet in the winter (summer) hemisphere. Above 80 km, the good agreement among BU, UraU, and HwmU is at the high latitudes.
The comparisons among BU, UraU, HwmU, MetU, and LidU show that the BU agrees with MetU and LidU better than UraU and HwmU at 50∘ N, 40∘ N, 1.25∘ S, and 30∘ S on the aspects of both their time series and composite year. At 18.75∘ N and 22.5∘ S, the time series of BU agrees with those of MetU only at 82 km and below 90 km, respectively. In a composite year, the BU agrees with MetU better than UraU and HwmU in spring and summer.
Based on the comparisons, we conclude that the BU derived here is reliable at 18–100 km and from 50∘ S to 50∘ N in general. The BU derived here covers a time span of 18 years and can be used to study the seasonal and interannual variations (e.g., SAO, AO, QBO, ENSO) and their global interactions from the stratosphere to the lower thermosphere. It can also serve as the background for wave propagations (e.g., gravity waves, tides, and planetary waves) and global interactions from the stratosphere to the lower thermosphere. The BU data have been archived as netCDF files and are available at National Space Science Data Center through https://doi.org/10.12176/01.99.00574 (Liu et al., 2021).
XL and JX designed the study and wrote the manuscript. JY contributed to the discussion of the results and the preparation of the manuscript. All authors discussed the results and commented on the manuscript at all stages.
The contact author has declared that neither they nor their co-authors have any competing interests.
Publisher's note: Copernicus Publications remains neutral with regard to jurisdictional claims in published maps and institutional affiliations.
This work was supported by the National Natural Science Foundation of China (41831073, 41874182, 42174196), the Natural Science Foundation of Henan (212300410011), the Open Research Project of Large Research Infrastructures of CAS “Study on the interaction between low/mid-latitude atmosphere and ionosphere based on the Chinese Meridian Project” and “the Project of Stable Support for Youth Team in Basic Research Field, CAS (YSBR-018)”. This work was also supported in part by the Specialized Research Fund and the Open Research Program of the State Key Laboratory of Space Weather.
This paper was edited by Martin Schultz and reviewed by two anonymous referees.
Abe, S., Umemura, N., Koyama, Y., Tanaka, Y., Yagi, M., Yatagai, A., Shinbori, A., Ueno, S., Sato, Y., and Kaneda, N.: Progress of the IUGONET system – Metadata database for upper atmosphere ground-based observation data, Earth Planets Space, 66, 1–7, https://doi.org/10.1186/1880-5981-66-133, 2014.
Andrioli, V. F., Clemesha, B. R., Batista, P. P., and Schuch, N. J.: Atmospheric tides and mean winds in the meteor region over Santa Maria (29.7∘ S; 53.8∘ W), J. Atmos. Sol.-Terr. Phys., 71, 1864–1876, https://doi.org/10.1016/j.jastp.2009.07.005, 2009.
Andrioli, V. F., Fritts, D. C., Batista, P. P., Clemesha, B. R., and Janches, D.: Diurnal variation in gravity wave activity at low and middle latitudes, Ann. Geophys., 31, 2123–2135, https://doi.org/10.5194/angeo-31-2123-2013, 2013.
Andrioli, V. F., Batista, P. P., Clemesha, B. R., Schuch, N. J., and Buriti, R. A.: Multi-year observations of gravity wave momentum fluxes at low and middle latitudes inferred by all-sky meteor radar, Ann. Geophys., 33, 1183–1193, https://doi.org/10.5194/angeo-33-1183-2015, 2015.
Baldwin, M. P. and O'Sullivan, D.: Stratospheric Effects of ENSO-Related Tropospheric Circulation Anomalies, J. Climate, 8, 649–667, https://doi.org/10.1175/1520-0442(1995)008<0649:SEOERT>2.0.CO;2, 1995.
Baldwin, M. P., Gray, L. J., Dunkerton, T. J., Hamilton, K., Haynes, P. H., Randel, W. J., Holton, J. R., Alexander, M. J., Hirota, I., Horinouchi, T., Jones, D. B. A., Kinnersley, J. S., Marquardt, C., Sato, K., and Takahashi, M.: The quasi-biennial oscillation, Rev. Geophys., 39, 179–229, https://doi.org/10.1029/1999RG000073, 2001.
Batista, P. P., Clemesha, B. R., Tokumoto, A. S., and Lima, L. M.: Structure of the mean winds and tides in the meteor region over Cachoeira Paulista, Brazil (22.7∘ S,45∘ W) and its comparison with models. J. Atmos. Sol.-Terr. Phys., 66, 623–636, https://doi.org/10.1016/j.jastp.2004.01.014, 2004.
Batubara, M., Suryana, R., Manik, T., and Sitompul, P.: Kototabang – West Sumatera meteor radar: System design and initial results of a large scale meteor echo, Proc. 2011 6th Int. Conf. Telecommun. Syst. Serv. Appl. TSSA 2011, 17–21, https://doi.org/10.1109/TSSA.2011.6095399, 2011.
Becker, E. and Vadas, S. L.: Secondary gravity waves in the winter mesosphere: results from a high-resolution global circulation model, J. Geophys. Res.-Atmos., 123, 2605–2627, https://doi.org/10.1002/2017JD027460, 2018.
Butler, A. H., Seidel, D. J., Hardiman, S. C., Butchart, N., Birner, T., and Match, A.: Defining sudden stratospheric warmings, B. Am. Meteorol. Soc., 96, 1913–1928, https://doi.org/10.1175/BAMS-D-13-00173.1, 2015.
Butler, A. H., Sjoberg, J. P., Seidel, D. J., and Rosenlof, K. H.: A sudden stratospheric warming compendium, Earth Syst. Sci. Data, 9, 63–76, https://doi.org/10.5194/essd-9-63-2017, 2017.
Diallo, M., Riese, M., Birner, T., Konopka, P., Müller, R., Hegglin, M. I., Santee, M. L., Baldwin, M., Legras, B., and Ploeger, F.: Response of stratospheric water vapor and ozone to the unusual timing of El Niño and the QBO disruption in 2015–2016, Atmos. Chem. Phys., 18, 13055–13073, https://doi.org/10.5194/acp-18-13055-2018, 2018.
Drob, D. P., Emmert, J. T., Crowley, G., Picone, J. M., Shepherd, G. G., Skinner, W., Hays, P., Niciejewski, R. J., Larsen, M., She, C. Y., Meriwether, J. W., Hernandez, G., Jarvis, M. J., Sipler, D. P., Tepley, C. A., O'Brien, M. S., Bowman, J. R., Wu, Q., Murayama, Y., Kawamura, S., Reid, I. M., and Vincent, R. A.: An empirical model of the Earth's horizontal wind fields: HWM07, J. Geophys. Res., 113, A12304, https://doi.org/10.1029/2008JA013668, 2008.
Drob, D. P., Emmert, J. T., Meriwether, J. W., Makela, J. J., Doornbos, E., Conde, M., Hernandez, G., Noto, J., Zawdie, K. A., McDonald, S. E., Huba, J. D., and Klenzing, J. H.: An update to the Horizontal Wind Model (HWM): The quiet time thermosphere, Earth Space Sci., 2, 301–319, https://doi.org/10.1002/2014EA000089, 2015.
Emmert, J. T., Drob, D. P., Shepherd, G. G., Hernandez, G., Jarvis, M. J., Meriwether, J. W., Niciejewski, R. J., Sipler, D. P., and Tepley, C. A.: DWM07 global empirical model of upper thermospheric storm-induced disturbance winds, J. Geophys. Res., 113, A11319, https://doi.org/10.1029/2008JA013541, 2008.
Englert, C. R., Harlander, J. M., Brown, C. M., Marr, K. D., Miller, I. J., Stump, J. E., Hancock, J., Peterson, J. Q., Kumler, J., Morrow, W. H., Mooney, T. A., Ellis, S., Mende, S. B., Harris, S. E., Stevens, M. H., Makela, J. J., Harding, B. J., and Immel, T. J.: Michelson Interferometer for Global High-Resolution Thermospheric Imaging (MIGHTI): Instrument Design and Calibration, Space Sci. Rev., 212, 553–584, https://doi.org/10.1007/s11214-017-0358-4, 2017.
Ern, M., Preusse, P., Gille, J. C., Hepplewhite, C. L., Mlynczak, M. G., Russell, J. M., and Riese, M.: Implications for atmospheric dynamics derived from global observations of gravity wave momentum flux in stratosphere and mesosphere, J. Geophys. Res.-Atmos., 116, 1–24, https://doi.org/10.1029/2011JD015821, 2011.
Ern, M., Ploeger, F., Preusse, P., Gille, J. C., Gray, L. J., Kalisch, S., Mlynczak, M. G., Russell, J. M., and Riese, M.: Interaction of gravity waves with the QBO: A satellite perspective, J. Geophys. Res.-Atmos., 119, 2329–2355, https://doi.org/10.1002/2013JD020731, 2014.
Ern, M., Diallo, M., Preusse, P., Mlynczak, M. G., Schwartz, M. J., Wu, Q., and Riese, M.: The semiannual oscillation (SAO) in the tropical middle atmosphere and its gravity wave driving in reanalyses and satellite observations, Atmos. Chem. Phys., 21, 13763–13795, https://doi.org/10.5194/acp-21-13763-2021, 2021.
Fleming, E. L., Chandra, S., Barnett, J. J., and Corney, M.: Zonal mean temperature, pressure, zonal wind and geopotential height as function of latitude, Adv. Space Res., 10, 11–59, https://doi.org/10.1016/0273-1177(90)90386-E, 1990.
Forbes, J. M.: Tidal and planetary waves, Geophys. Monogr. Ser., 87, 67–87, https://doi.org/10.1029/GM087p0067, 1995.
Fritts, D. C. and Alexander, M. J.: Gravity wave dynamics and effects in the middle atmosphere, Rev. Geophys., 41, 1–64, https://doi.org/10.1029/2001RG000106, 2003.
Gan, Q., Du, J., Ward, W. E., Beagley, S. R., Fomichev, V. I., and Zhang, S.: Climatology of the diurnal tides from eCMAM30 (1979 to 2010) and its comparison with SABER 3. Space science International CAWSES-II Symposium, Earth Planets Space, 66, 1–24, https://doi.org/10.1186/1880-5981-66-103, 2014.
Gelaro, R., McCarty, W., Suárez, M. J., Todling, R., Molod, A., Takacs, L., Randles, C. A., Darmenov, A., Bosilovich, M. G., Reichle, R., Wargan, K., Coy, L., Cullather, R., Draper, C., Akella, S., Buchard, V., Conaty, A., da Silva, A. M., Gu, W., Kim, G. K., Koster, R., Lucchesi, R., Merkova, D., Nielsen, J. E., Partyka, G., Pawson, S., Putman, W., Rienecker, M., Schubert, S. D., Sienkiewicz, M., and Zhao, B.: The modern-era retrospective analysis for research and applications, version 2 (MERRA-2) [data set], J. Climate, 30, 5419–5454, https://doi.org/10.1175/JCLI-D-16-0758.1, 2017.
Gu, S. Y., Li, T., Dou, X., Wu, Q., Mlynczak, M. G., and Russell, J. M.: Observations of Quasi-Two-Day wave by TIMED/SABER and TIMED/TIDI, J. Geophys. Res., 118, 1624–1639. https://doi.org/10.1002/jgrd.50191, 2013.
Hayashi, H., Koyama, Y., Hori, T., Tanaka, Y., Abe, S., Shinbori, A., Kagitani, M., Kouno, T., Yoshida, D., UeNo, S., Kaneda, N., Yoneda, M., Umemura, N., Tadokoro, H., and Motoba, T.: Inter-university upper atmosphere global observation network (IUGONET) [data set], Data Sci. J., 12, 179–184, https://doi.org/10.2481/dsj.WDS-030, 2013.
Hays, P. B., Abreu, V. J., Dobbs, M. E., Gell, D. A., Grassl, H. J., and Skinner, W. R.: The high-resolution doppler imager on the Upper Atmosphere Research Satellite, J. Geophys. Res., 98, 10713–10723, https://doi.org/10.1029/93JD00409, 1993.
Harding, B. J., Makela, J. J., Englert, C. R., Marr, K. D., Harlander, J. M., England, S. L., and Immel, T. J.: The MIGHTI Wind Retrieval Algorithm: Description and Verification, Space Sci. Rev., 212, 585–600, https://doi.org/10.1007/s11214-017-0359-3, 2017.
Hersbach, H., Bell, B., Berrisford, P., Hirahara, S., Horányi, A., Muñoz-Sabater, J., Nicolas, J., Peubey, C., Radu, R., Schepers, D., Simmons, A., Soci, C., Abdalla, S., Abellan, X., Balsamo, G., Bechtold, P., Biavati, G., Bidlot, J., Bonavita, M., De Chiara, G., Dahlgren, P., Dee, D., Diamantakis, M., Dragani, R., Flemming, J., Forbes, R., Fuentes, M., Geer, A., Haimberger, L., Healy, S., Hogan, R. J., Hólm, E., Janisková, M., Keeley, S., Laloyaux, P., Lopez, P., Lupu, C., Radnoti, G., de Rosnay, P., Rozum, I., Vamborg, F., Villaume, S., and Thépaut, J. N.: The ERA5 global reanalysis, Q. J. Roy. Meteor. Soc., 146, 1999–2049, https://doi.org/10.1002/qj.3803, 2020.
Hoffmann, L., Günther, G., Li, D., Stein, O., Wu, X., Griessbach, S., Heng, Y., Konopka, P., Müller, R., Vogel, B., and Wright, J. S.: From ERA-Interim to ERA5: the considerable impact of ECMWF's next-generation reanalysis on Lagrangian transport simulations, Atmos. Chem. Phys., 19, 3097–3124, https://doi.org/10.5194/acp-19-3097-2019, 2019.
Immel, T. J., England, S. L., Mende, S. B., Heelis, R. A., Englert, C. R., Edelstein, J., Frey, H. U., Korpela, E. J., Taylor, E. R., Craig, W. W., Harris, S. E., Bester, M., Bust, G. S., Crowley, G., Forbes, J. M., Gérard, J. C., Harlander, J. M., Huba, J. D., Hubert, B., Kamalabadi, F., Makela, J. J., Maute, A. I., Meier, R. R., Raftery, C., Rochus, P., Siegmund, O. H. W., Stephan, A. W., Swenson, G. R., Frey, S., Hysell, D. L., Saito, A., Rider, K. A., and Sirk, M. M.: The Ionospheric Connection Explorer Mission: Mission Goals and Design, Space Sci. Rev., 214, 1–36, 2018.
Kawatani, Y., Hirooka, T., Hamilton, K., Smith, A. K., and Fujiwara, M.: Representation of the equatorial stratopause semiannual oscillation in global atmospheric reanalyses, Atmos. Chem. Phys., 20, 9115–9133, https://doi.org/10.5194/acp-20-9115-2020, 2020.
Killeen, T. L., Wu, Q., Solomon, S. C., Ortland, D. A., Skinner, W. R., Niciejewski, R. J., and Gell, D. A.: TIMED Doppler Interferometer: Overview and recent results, J. Geophys. Res., 111, A1S010, https://doi.org/10.1029/2005JA011484, 2006.
Kutner, M. H., Nachtsheim, C. J., Neter, J., and Li, W.: Applied Linear Statistical Model (Fifth Editon), The McGraw-Hill Irwin Series: Operations and Decision Sciences, McGraw-Hill/Irwin, New York, chap. 6, 214–247, 2005.
Li, G., Ning, B., Hu, L., Chu, Y. H., Reid, I. M., and Dolman, B. K.: A comparison of lower thermospheric winds derived from range spread and specular meteor trail echoes, J. Geophys. Res., 117, A03310, https://doi.org/10.1029/2011JA016847, 2012.
Liu, H.-L., McInerney, J. M., Santos, S., Lauritzen, P. H., Taylor, M. A., and Pedatella, N. M.: Gravity waves simulated by high-resolution Whole Atmosphere Community Climate Model, Geophys. Res. Lett., 41, 9106–9112, https://doi.org/10.1002/2014GL062468, 2014.
Liu, X., Yue, J., Xu, J., Garcia, R. R., Russell, J. M., Mlynczak, M., Wu, D. L., and Nakamura, T.: Variations of global gravity waves derived from 14 years of SABER temperature observations, J. Geophys. Res., 122, 6231–6249, https://doi.org/10.1002/2017JD026604, 2017.
Liu, X., Xu, J., Yue, J., Yu, Y., Batista, P. P, Andrioli, V. F., Liu, Z., Yuan, T., Wang, C., Zou, Z., Li, G., and Russell III, J. M.: Global Balanced Wind Derived from SABER Temperature and Pressure Observations and its Validations, V1, NSSDC Space Science Article Data Repository [data set and code], https://doi.org/10.12176/01.99.00574, 2021.
Matsumoto, N., Shinbori, A., Riggin, D. M., and Tsuda, T.: Measurement of momentum flux using two meteor radars in Indonesia, Ann. Geophys., 34, 369–377, https://doi.org/10.5194/angeo-34-369-2016, 2016.
McLandress, C.: On the importance of gravity waves in the middle atmosphere and their parameterization in general circulation models, J. Atmos. Sol.-Terr. Phys., 60, 1357–1383, https://doi.org/10.1016/S1364-6826(98)00061-3, 1998.
McLandress, C., Ward, W. E., Fomichev, V. I., Semeniuk, K., Beagley, S. R., McFarlane, N. A., and Shepherd, T. G.: Large-scale dynamics of the mesosphere and lower thermosphere: An analysis using the extended Canadian Middle Atmosphere Model, J. Geophys. Res., 111, D17111, https://doi.org/10.1029/2005JD006776, 2006.
Molod, A., Takacs, L., Suarez, M., and Bacmeister, J.: Development of the GEOS-5 atmospheric general circulation model: evolution from MERRA to MERRA2 [data set], Geosci. Model Dev., 8, 1339–1356, https://doi.org/10.5194/gmd-8-1339-2015, 2015.
Newman, P. A., Coy, L., Pawson, S., and Lait, L. R.: The anomalous change in the QBO in 2015–2016. Geophys. Res. Lett., 43, 8791–8797, https://doi.org/10.1002/2016GL070373, 2016.
Niciejewski, R., Wu, Q., Skinner, W., Gell, D., Cooper, M., Marshall, A., Killeen, T., Solomon, S., and Ortland, D.: TIMED doppler interferometer on the thermosphere ionosphere mesosphere energetics and dynamics satellite: Data product overview, J. Geophys. Res., 111, A11S90, https://doi.org/10.1029/2005JA011513, 2006.
Osprey, S. M., Butchart, N., Knight, J. R., Scaife, A. A., Hamilton, K., Anstey, J. A., Schenzinger, V., and Zhang, C.: An unexpected disruption of the atmospheric quasi-biennial oscillation, Science, 353, 1424–1427, https://doi.org/10.1126/science.aah4156, 2016.
Randel, W. J.: The Evaluation of Winds from Geopotential Height Data in the Stratosphere, J. Atmos. Sci., 44, 3097–3120, https://doi.org/10.1175/1520-0469(1987)044<3097:TEOWFG>2.0.CO;2, 1987.
Rao, N. V., Tsuda, T., Gurubaran, S., Miyoshi, Y., and Fujiwara, H.: On the occurrence and variability of the terdiurnal tide in the equatorial mesosphere and lower thermosphere and a comparison with the Kyushu-GCM, J. Geophys. Res., 116, D02117, https://doi.org/10.1029/2010JD014529, 2011.
Rao, N. V., Tsuda, T., Riggin, D. M., Gurubaran, S., Reid, I. M., and Vincent, R. A.: Long-term variability of mean winds in the mesosphere and lower thermosphere at low latitudes, J. Geophys. Res., 117, A10312, https://doi.org/10.1029/2012JA017850, 2012.
Remsberg, E. E., Marshall, B. T., Garcia-Comas, M., Krueger, D., Lingenfelser, G. S., Martin-Torres, J., Mlynczak, M. G., Russell III, J. M., Smith, A. K., Zhao, Y., Brown, C., Gordley, L. L., Lopez-Gonzalez, M. J., Lopez-Puertas, M., She, C.-Y., Taylor, M. J., and Thompson, R. E.: Assessment of the quality of the version 1.07 temperature-versus-pressure profiles of the middle atmosphere from TIMED/SABER, J. Geophys. Res., 113, D17101, https://doi.org/10.1029/2008JD010013, 2008.
Russell III, J. M., Mlynczak, M. G., Gordley, L. L., Tansock, Jr., J. J., and Esplin, R. W.: Overview of the SABER experiment and preliminary calibration results, Proc. SPIE, 3756, 277–288, https://doi.org/10.1117/12.366382, 1999.
ABER team: level2a_V2_07, available at: https://spdf.gsfc.nasa.gov/pub/data/timed/saber/, last access: March 2020.
Schwartz, M. J., Lambert, A., Manney, G. L., Read, W. G., Livesey, N. J., Froidevaux, L., Ao, C. O., Bernath, P. F., Boone, C. D., Cofield, R. E., Daffer, W. H., Drouin, B. J., Fetzer, E. J., Fuller, R. A., Jarnot, R. F., Jiang, J. H., Jiang, Y. B., Knosp, B. W., Krüger, K., Li, J.-L. F., Mlynczak, M. G., Pawson, S., Russell, J. M., Santee, M. L., Snyder, W. V, Stek, P. C., Thurstans, R. P., Tompkins, A. M., Wagner, P. A., Walker, K. A., Waters, J. W., and Wu, D. L.: Validation of the Aura Microwave Limb Sounder temperature and geopotential height measurements, J. Geophys. Res., 113, D15S11, https://doi.org/10.1029/2007jd008783, 2008.
She, C. Y.: Initial full-diurnal-cycle mesopause region lidar observations: Diurnal-means and tidal perturbations of temperature and winds over Fort Collins, CO (41∘ N, 105∘ W), J. Atmos. Sol.-Terr. Phys., 66, 663–674, https://doi.org/10.1016/j.jastp.2004.01.037, 2004.
Shepherd, G. G., Thuillier, G., Cho, Y. M., Duboin, M. L., Evans, W. F. J., Gault, W. A., Hersom, C., Kendall, D. J. W., Lathuillre, C., Lowe, R. P., McDade, I. C., Rochon, Y. J., Shepherd, M. G., Solheim, B. H., Wang, D. Y., and Ward, W. E.: The wind imaging interferometer (WINDII) on the upper atmosphere research satellite: A 20 year perspective, Rev. Geophys., 50, 1–38, https://doi.org/10.1029/2012RG000390, 2012.
Smith, A. K., Garcia, R. R., Moss, A. C., and Mitchell, N. J.: The semiannual oscillation of the tropical zonal wind in the middle atmosphere derived from satellite geopotential height retrievals, J. Atmos. Sci., 74, 2413–2425, https://doi.org/10.1175/JAS-D-17-0067.1, 2017.
Stevens, M. H., Englert, C. R., Harlander, J. M., England, S. L., Marr, K. D., Brown, C. M., and Immel, T. J.: Retrieval of Lower Thermospheric Temperatures from O2 A Band Emission: The MIGHTI Experiment on ICON, Space Sci. Rev., 214, 2–9, https://doi.org/10.1007/s11214-017-0434-9, 2018.
Swinbank, R. and Ortland, D. A.: Compilation of wind data for the Upper Atmosphere Research Satellite (UARS) Reference Atmosphere Project [data set], J. Geophys. Res., 108, 4615, https://doi.org/10.1029/2002jd003135, 2003.
Wang, C.: New chains of space weather monitoring stations in China, Sp. Weather, 8, S08001, https://doi.org/10.1029/2010SW000603, 2010.
Watanabe, S. and Miyahara, S.: Quantification of the gravity wave forcing of the migrating diurnal tide in a gravity wave-resolving general circulation model, J. Geophys. Res., 114, D07110, https://doi.org/10.1029/2008JD011218, 2009.
Wu, Q., Killeen, T. L., Ortland, D. A., Solomon, S. C., Gablehouse, R. D., Johnson, R. M., Skinner, W. R., Niciejewski, R. J., and Franke, S. J.: TIMED Doppler interferometer (TIDI) observations of migrating diurnal and semidiurnal tides, J. Atmos. Sol.-Terr. Phys., 68, 408–417, https://doi.org/10.1016/j.jastp.2005.02.031, 2006.
Wu, Q., Ortland, D. A., Killeen, T. L., Roble, R. G., Hagan, M. E., Liu, H. L., Solomon, S. C., Xu, J., Skinner, W. R., and Niciejewski, R. J.: Global distribution and interannual variations of mesospheric and lower thermospheric neutral wind diurnal tide: 1. Migrating tide, J. Geophys. Res. 113, A05308, https://doi.org/10.1029/2007JA012542, 2008.
Xiong, J., Wan, W., Ding, F., Liu, L., Ning, B., and Niu, X.: Coupling between mesosphere and ionosphere over Beijing through semidiurnal tides during the 2009 sudden stratospheric warming, J. Geophys. Res.-Space, 118, 2511–2521, https://doi.org/10.1002/jgra.50280, 2013.
Xu, J., Smith, A. K., Yuan, W., Liu, H. L., Wu, Q., Mlynczak, M. G., and Russell, I. M.: Global structure and long-term variations of zonal mean temperature observed by TIMED/SABER, J. Geophys. Res.-Atmos., 112, D24106, https://doi.org/10.1029/2007JD008546, 2007.
Xu, J., Smith, A. K., Liu, H. L., Yuan, W., Wu, Q., Jiang, G., Mlynczak, M. G., Russell, J. M., and Franke, S. J.: Seasonal and quasi-biennial variations in the migrating diurnal tide observed by Thermosphere, Ionosphere, Mesosphere, Energetics and Dynamics (TIMED), J. Geophys. Res.-Atmos., 114, 1–16, https://doi.org/10.1029/2008jd011298, 2009.
Xu, J., Smith, A. K., Liu, M., Liu, X., Gao, H., Jiang, G., and Yuan, W.: Evidence for nonmigrating tides produced by the interaction between tides and stationary planetary waves in the stratosphere and lower mesosphere, J. Geophys. Res.-Atmos., 119, 471–489, https://doi.org/10.1002/2013JD020150, 2014.
Yu, Y., Wan, W., Ning, B., Liu, L., Wang, Z., Hu, L., and Ren, Z.: Tidal wind mapping from observations of a meteor radar chain in December 2011, J. Geophys. Res.-Space, 118, 2321–2332, https://doi.org/10.1029/2012JA017976, 2013.
Yu, Y., Wan, W., Ren, Z., Xiong, B., Zhang, Y., Hu, L., Ning, B., and Liu, L.: Seasonal variations of MLT tides revealed by a meteor radar chain based on Hough mode decomposition [data set], J. Geophys. Res.-Space, 120, 7030–7048, https://doi.org/10.1002/2015JA021276, 2015.
Yuan, T., She, C. Y., Krueger, D. A., Sassi, F., Garcia, R., Roble, R. G., Liu, H. L., and Schmidt, H.: Climatology of mesopause region temperature, zonal wind, and meridional wind over Fort Collins, Colorado (41∘ N, 105∘ W), and comparison with model simulations, J. Geophys. Res.-Atmos., 113, D03105, https://doi.org/10.1029/2007JD008697, 2008.
Zhang, S. P. and Shepherd, G. G.: Variations of the mean winds and diurnal tides in the mesosphere and lower thermosphere observed by WINDII from 1992 to 1996, Geophys. Res. Lett., 32, L14111, https://doi.org/10.1029/2005GL023293, 2005.