the Creative Commons Attribution 4.0 License.
the Creative Commons Attribution 4.0 License.
 | 06 Dec 2021
The Plankton Lifeform Extraction Tool: a digital tool to increase the discoverability and usability of plankton time-series data
Kevin Paxman
Carolyn A. Graves
Mathew Arnold
Luis Felipe Artigas
Angus Atkinson
Anaïs Aubert
Malcolm Baptie
Beth Bear
Jacob Bedford
Michael Best
Eileen Bresnan
Rachel Brittain
Derek Broughton
Alexandre Budria
Kathryn Cook
Michelle Devlin
George Graham
Nick Halliday
Pierre Hélaouët
Marie Johansen
David G. Johns
Margarita Machairopoulou
April McKinney
Adam Mellor
Alex Milligan
Sophie Pitois
Isabelle Rombouts
Cordula Scherer
Paul Tett
Claire Widdicombe
Abigail McQuatters-Gollop
Plankton form the base of the marine food web and are sensitive indicators of environmental change. Plankton time series are therefore an essential part of monitoring progress towards global biodiversity goals, such as the Convention on Biological Diversity Aichi Targets, and for informing ecosystem-based policy, such as the EU Marine Strategy Framework Directive. Multiple plankton monitoring programmes exist in Europe, but differences in sampling and analysis methods prevent the integration of their data, constraining their utility over large spatio-temporal scales. The Plankton Lifeform Extraction Tool brings together disparate European plankton datasets into a central database from which it extracts abundance time series of plankton functional groups, called “lifeforms”, according to shared biological traits. This tool has been designed to make complex plankton datasets accessible and meaningful for policy, public interest, and scientific discovery. It allows examination of large-scale shifts in lifeform abundance or distribution (for example, holoplankton being partially replaced by meroplankton), providing clues to how the marine environment is changing. The lifeform method enables datasets with different plankton sampling and taxonomic analysis methodologies to be used together to provide insights into the response to multiple stressors and robust policy evidence for decision making. Lifeform time series generated with the Plankton Lifeform Extraction Tool currently inform plankton and food web indicators for the UK's Marine Strategy, the EU's Marine Strategy Framework Directive, and for the Convention for the Protection of the Marine Environment of the North-East Atlantic (OSPAR) biodiversity assessments. The Plankton Lifeform Extraction Tool currently integrates 155 000 samples, containing over 44 million plankton records, from nine different plankton datasets within UK and European seas, collected between 1924 and 2017. Additional datasets can be added, and time series can be updated. The Plankton Lifeform Extraction Tool is hosted by The Archive for Marine Species and Habitats Data (DASSH) at https://www.dassh.ac.uk/lifeforms/ (last access: 22 November 2021, Ostle et al., 2021). The lifeform outputs are linked to specific, DOI-ed, versions of the Plankton Lifeform Traits Master List and each underlying dataset.
- Article
(13654 KB) - Full-text XML
- BibTeX
- EndNote


Plankton form the foundation of the marine food web, help to regulate ocean chemistry, and provide approximately half of the world's oxygen (Capuzzo et al., 2018; Falkowski, 2012). Globally, plankton communities are undergoing significant changes in distribution (Reid et al., 2016), community composition (Beaugrand et al., 2002), phenology (Edwards and Richardson, 2004), and productivity (Kulk et al., 2020). These changes vary in space and time, reflecting both direct and locally acute anthropogenic pressure on the marine environment, such as nutrient loading, and wider-scale climate-driven changes in ocean chemistry and temperature (Beaugrand et al., 2010; Bedford et al., 2020a).
Plankton have short life cycles, drift freely in the ocean and have wide distributions. For these reasons they are considered to be particularly sensitive indicators to climate change (Richardson, 2008). Changes in the composition and abundance of plankton can have negative impacts on industries such as fisheries and aquaculture (Richardson et al., 2009; Schmidt et al., 2020). As the base of the food web, they are a key element of the ecosystem approach to marine management (Morishita, 2008). Monitoring plankton communities over wide spatial and long temporal scales can help tease apart the prevailing footprint of climate change on marine ecosystems from other, more localized pressures, for example, pollution, nutrient loading, and fishing (Bedford et al., 2020b). Consequently, plankton time series play an increasingly important role in decision-making and provision of advice. Plankton indicators contribute to the delivery of global, regional, and national policy drivers such as the Convention on Biological Diversity's Aichi Targets (Chiba et al., 2018), the regional Convention for the Protection of the Marine Environment of the North-East Atlantic (OSPAR) (OSPAR, 2017), and biodiversity state in the European Union's Marine Strategy Framework Directive (MSFD) and the UK Marine Strategy (McQuatters-Gollop et al., 2019).
To map changes in ocean colour, Earth observation (EO) satellite tools provide unparalleled spatial coverage, and now offer the prospect of 20 years of ocean colour data, with increasingly resolved information, for example on trends of specific size fractions of chlorophyll (Schmidt et al., 2020). However, the EO techniques are still not yet sufficiently developed to obtain information on changes in abundance of the key component planktonic functional groups, particularly for the zooplankton. Additionally, some taxonomic datasets now have up to 90 years of data which provide a critical perspective in assessing long-term change and which is unparalleled by satellites. We therefore need to maintain direct monitoring approaches for a holistic view of the plankton, and northwest European waters are particularly well-blessed with these time series.
Although there are a number of programmes that monitor plankton in northwest European waters, they operate at different spatial scales, from fixed-point sampling stations to long-distance continuously sampled ship transects (O'Brien et al., 2017). Furthermore, European plankton surveys employ different sampling methods, enumerate specimens at a variety of taxonomic levels, and employ different counting regimes (Raybaud et al., 2011). These methodological differences and the lack of direct comparability between datasets has meant that the tools to use all available datasets together to produce a comprehensive assessment have only recently been developed (Bedford et al., 2020a; McQuatters-Gollop et al., 2019). While most datasets are regularly submitted to appropriate data repositories (e.g. the Ocean Biodiversity Information System, OBIS; the British Oceanographic Data Centre, BODC; or the PANGAEA data publisher for earth and environmental science) and some are available through institutional websites or data centres, the aggregation of plankton data into functional groups (or “lifeforms”, e.g. diatoms, dinoflagellates, holoplankton, meroplankton) has not yet been linked to traceable dataset versions or been possible to apply in an accessible, transparent, and centralized way. Accordingly, understanding of plankton change across multiple spatial and temporal scales has been limited. The International Group of Marine Ecological Time Series (IGMETS, https://igmets.net, last access: 22 November 2021; O'Brien et al., 2017) represents valuable progress towards this goal: it provides a global-scale compilation of pelagic time series, with a tool to summarize visualizations of trends across a variety of temporal and spatial scales. However, this initiative summarizes time trends of highly aggregated variables (e.g. total zooplankton) for multiple sites. Trajectories of the key component plankton functional groups are not described, and the underlying data products are not made available to users for further analysis. Aggregating these disparate plankton datasets increases the spatial–temporal scope of analysis, increases their robustness, and provides decision makers with more scientifically robust evidence.
Building on previous work (Gowen et al., 2011; Scherer et al., 2014; Tett et al., 2008, 2013), an indicator of shifts in plankton structure based on time series of broad plankton functional groups, called “lifeforms”, has been developed for use in policy assessments (McQuatters-Gollop et al., 2019). The term “lifeform” is derived from work carried out by Margalef (1978), to distinguish between diatoms and dinoflagellates based on traits related to survival in specific hydrodynamic conditions. Lifeforms differ slightly from the term “plankton functional type” (PFT), in that PFTs are often used to describe plankton based on their ecosystem function and not on their traits. This indicator enables plankton datasets with different sample collection and analysis routines to be used congruently to investigate changes in pelagic habitat functioning. By using these pre-defined lifeforms to group plankton taxa, the new Plankton Lifeform Extraction Tool (PLET), hosted by the Archive for Marine Species and Habitats Data (DASSH, https://www.dassh.ac.uk, last access: 22 November 2021), brings together disparate plankton datasets, increasing their accessibility and promoting compliance with the FAIR data principles (Wilkinson et al., 2016). The PLET enables the user to investigate multiple datasets to assess changes in plankton ecology at multiple spatio-temporal scales using a consistent plankton indicator for the first time. As time series grow in length and/or spatial distribution, and new plankton time series are established, additional plankton taxa and datasets can be added to the PLET in order to improve future biodiversity assessments. The tool is a key step towards transparent and standardized assessment, allowing the integration of information from multiple datasets at multiple spatial and temporal scales.
In its current form, the PLET integrates 155 000 samples containing over 44 million plankton records from nine different data providers around the UK and European seas, collected between 1924 and 2017 (Table 1). There are a number of plankton trait datasets and plankton compilation efforts that are complementary to the PLET with the potential to feed into future versions of the tool, such as the nutrient utilization trait dataset (Edwards et al., 2015), the Baltic Sea phytoplankton trait dataset (Klais et al., 2017), and the French lake phytoplankton trait database (Laplace-Treyture et al., 2021). While these are highly valuable resources, the authors are not aware of a platform to bring such information together and disseminate it in a consistent format. The design of PLET allows for this lifeform extraction and dissemination, with the aim to incorporate further plankton trait datasets in future versions. Flexibility of the PLET design allows existing time series to be updated and new time series to be added, continuing the expansion of integrated datasets beyond the UK, where policy reporting motivated its initial development. Plankton time series have been collected both along transects and at fixed-point stations (Fig. 1). These datasets, which underpin the PLET lifeform outputs, enumerate plankton in taxon groupings (see the Plankton Lifeform Traits Master List, UK Pelagic Habitats Expert Group, 2020; https://www.dassh.ac.uk/doitool/data/1709, last access: 22 November 2021).
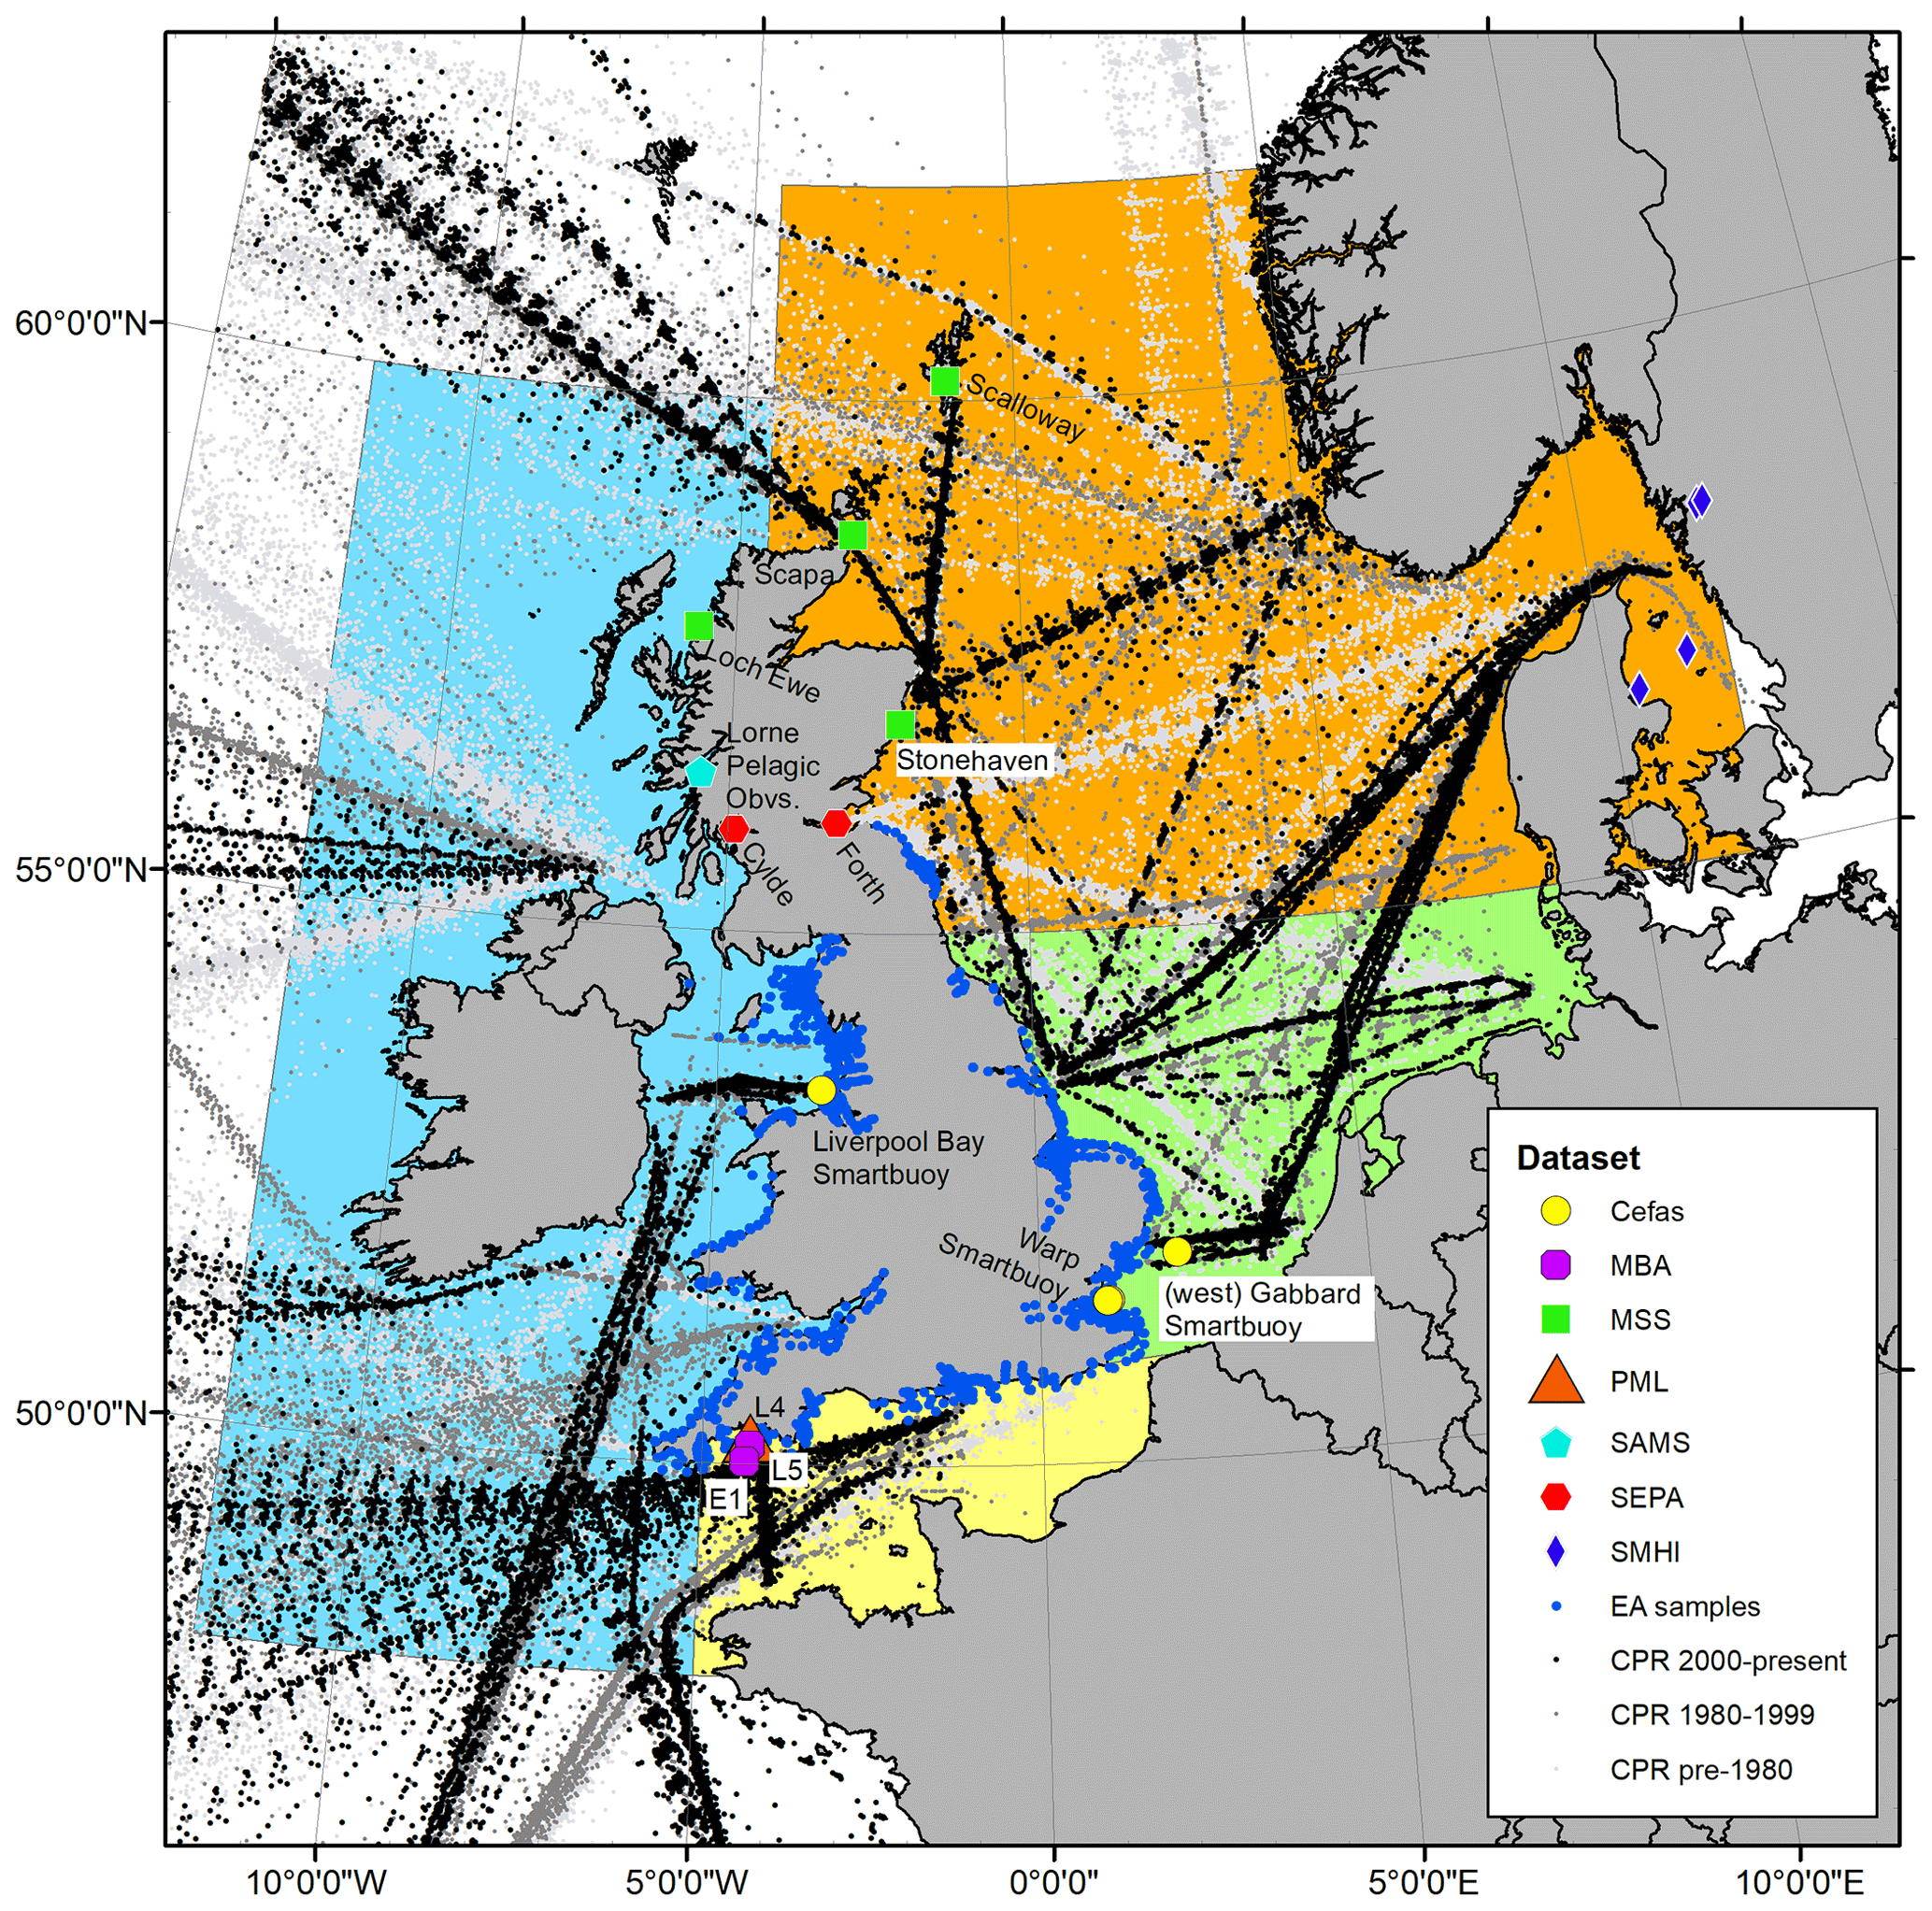
Figure 1Spatial coverage of plankton measurements currently integrated with the PLET tool for lifeform extraction. See data provider and station information in Table 1; individual station names are given next to the symbols, while symbols designate data providers as shown in the legend. The sampling transects for the CPR are coloured by date sampled, with pre-1980 in light grey, 1980–1999 in darker grey, and the most recent 2000 onward in black. Coloured regions indicate how data are summarized for presentation of lifeform outputs in Sect. 6: blue: Celtic Seas; red: northern North Sea; green: southern North Sea; light yellow: English Channel.
Table 1Plankton data currently held in PLET and used to produce the aggregated lifeform outputs. For un-aggregated plankton data, contact information and institute-specific data holdings (where available) are given for each data institute. Most of these time series are ongoing, and many sample at higher temporal resolution than the monthly average data held in PLET. Prospective users for these higher-resolution versions of the respective time series are encouraged to consult with the contact people listed below.
2.1 Plankton sampling and analysis methodology
All individual datasets that have been added to the PLET have been pre-processed to ensure suitability for extraction of monthly-aggregated lifeform data products. Pre-processing was the responsibility of the individual data providers. Examples of pre-processing required are (i) the exclusion of instances of “double counting” where, for example, a taxon is included in both higher and lower taxonomic groupings within the same dataset and (ii) the removal of taxa that have not been looked for (recorded) over the entire time period to avoid apparent changes in lifeform abundance due to methodological changes. When new datasets are submitted to the PLET the data providers supply AphiaIDs of all of the taxa within their dataset. Following the pre-processing of the data by the data providers, the data manager of PLET and the manager of the Plankton Lifeform Traits Master List does a check of the submitted AphiaIDs to highlight any missing taxa. Any taxa that are not included within the Plankton Lifeform Traits Master List are checked for compatibility with the lifeforms, and their traits are added in discussion with an expert group and the data providers.
Existing datasets were gathered through a data call issued by OSPAR in 2016. The purpose of the data call was to gather plankton datasets to use for assessment and reporting for the European Union's and individual Member States' Marine Strategy Framework Directive initial biodiversity assessment in 2017 (https://oap.ospar.org/en/ospar-assessments/intermediate-assessment-2017/biodiversity-status/habitats/changes-phytoplankton-and-zooplankton-communities/,last access: 22 November 2021). A simple data submission template was developed as part of this process and is now available on the PLET website for wider use. To make data submission as simple and easy as possible, the template allows data holders to submit the datasets in either list (long) or matrix (wide) formats. A data archiving and access permission agreement form is also available from the PLET website, which allows data holders to specify their preferred level of data access, such as full access to raw data or access to lifeform data products only.
All plankton records currently included have been identified using light microscopy. For simplicity we use the term “phytoplankton” to mean protist cells, mindful that these include a spectrum of auto-, mixo-, and heterotrophic forms (Flynn et al., 2013). This terminology is used to differentiate from “zooplankton”, which are the metazoans usually counted from net haul samples. For quality assurance, analysts participate in NMBAQC (the Northeast Atlantic Marine Biological Analytical Quality Control Scheme) and the International Phytoplankton Intercomparison external identification ring trials, although these do not cover the full length of some of the historical datasets. Field abundance, in individuals per unit volume, is calculated as sample abundance multiplied by subsample factor, divided by the sampled water volume. Concentrations of phytoplankton identified by light microscopy are typically expressed as numbers (cells) per millilitre, and those of zooplankton are typically expressed as numbers (individuals) per cubic metre.
2.1.1 Continuous Plankton Recorder Survey (Marine Biological Association)
The Continuous Plankton Recorder (CPR) is a marine sampler that is towed behind volunteer ships of opportunity at speeds of up to ∼ 20 knots and samples at a depth of ∼ 7 m below the surface. Plankton have been sampled on routes crossing the North Atlantic and NW European shelf seas using a consistent methodology since 1958.
The CPR unit is a metal casing in the shape of a ∼ 1 m torpedo that houses a roll of silk which automatically rotates using a geared propeller system. The seawater enters the front aperture where plankton and small particles are captured onto the rotating silk, which has a mesh size of 270 µm. This silk is stored in 4 % buffered formalin to preserve the sample until microscopic analysis at the laboratory in Plymouth. The silk is cut into pre-defined sections that represent one sample and equate to 10 nmi of tow. Phytoplankton and zooplankton are identified and counted at different stages of the microscopic analysis: semi-quantitative count of phytoplankton across 20 fields of view per sample, quantitative count of all zooplankton > = 2 mm (these are picked off the silk for identification), and semi-quantitative traverse count of all zooplankton < 2 mm.
For a more in-depth description of the sampling methodology, please refer to Richardson et al. (2006). CPR monthly abundance counts from 1958 to 2017 are available from the following open-access data portal: https://data.cprsurvey.org/datacatalog/ (last access: 22 November 2021).
2.1.2 Western Channel Observatory (Marine Biological Association and Plymouth Marine Laboratory)
The Marine Biological Association (MBA) and Plymouth Marine Laboratory (PML) jointly sample at three offshore stations in the western English Channel as part of their Western Channel Observatory (https://westernchannelobservatory.org.uk, last access: 22 November 2021). These stations are termed L4 (50.25∘ N, 4.3∘ W; approx. 55 m water depth) 13 km southwest of Plymouth, which can be regarded as a coastal station, albeit in transitionally stratified water; L5 (50.18∘ N, 4.3∘ W; approx. 58 m depth) positioned between coastal and offshore waters; and E1 (50.03∘ N, 4.37∘ W; approx. 70 m depth) 40 km offshore in seasonally stratified water. Sampling at these historical sites began in 1924 with interruptions between 1940–1945 and 1987–2001. Sampling frequency has varied between weekly and fortnightly; current sampling is weekly at station L4 and, weather-permitting, fortnightly at L5 and E1.
The phytoplankton and zooplankton time series at L4 are provided by PML. Sampling for phytoplankton began in 1992 and for mesozooplankton in 1988. Detailed phytoplankton taxonomic microscope counts are from water samples collected at 10 m depth. These samples are preserved in 2 % acid Lugol's iodine solution and enumerated for all taxa larger than approximately 2 µm using the Utermöhl (1958) technique, usually settling 50 mL (Widdicombe et al., 2010). Mesozooplankton are collected each week in two replicate 0–50 m vertical hauls with a WP2 net (0.57 m diameter, 200 µm mesh size). Each of these are analysed in two aliquots, the first being a Stempel pipette – derived small subsample for enumeration of the more numerous taxa and the second larger fraction, often one-half to one-eighth, analysed for the larger or rarer taxa.
Weekly densities are calculated as the average of the two separate net hauls. Environmental conditions and the mesozooplankton sampling and analysis methods are described in detail in Atkinson et al. (2015).
Macroplankton and larval fish sampling at the Western Channel Observatory (WCO) sites is carried out by the MBA. Although net design and methods of deployment have changed on several occasions, care has been taken to ensure that sampling characteristics have not altered appreciably. The 1 m2 Young Fish Trawl (YFT), fitted with a 700 µm knitted mesh, is hauled for 20 min in an oblique profile to an ideal depth of ∼ 5 m above the seabed. Depth and temperature profiles are occasionally recorded, and the volume of filtered water is calculated using flow data recorded by a flowmeter fitted across the net mouth. The samples are preserved in 4 % buffered formalin and analysed as soon as possible after collection using a WILD M5 binocular microscope. Results are standardized to the number of individuals per 4000 m3 in order to mitigate historical changes in sampling gear and deployment.
A comprehensive summary of these macroplankton sampling methods and analysis is given in Southward et al. (2004) and references therein.
2.1.3 SmartBuoys (Centre for Environment Fisheries and Aquaculture Science)
Water samples for phytoplankton analysis are collected from several of the Centre of Environment Fisheries and Aquaculture Science (Cefas) “SmartBuoy” moorings using automated water samplers mounted at 1 m below the surface. Time series at approximately monthly resolution from four buoy stations are available: dowsing off the Humber estuary (51.53∘ N, 1.05∘ E, sampled 2000–present), Gabbard–West Gabbard off the Thames estuary (51.95∘ N, 2.11∘ E, sampled 2001–present), Warp in the outer Thames estuary (51.52∘ N, 1.028∘ E, sampled 2001–2012), and Liverpool Bay (53.53∘ N, 3.35∘ W, sampled 2002–present).
Water samplers are pre-programmed to collect 150 mL samples on an approximately weekly cycle into sample bags pre-spiked with acidified Lugol's iodine solution. Phytoplankton samples are returned for analysis at Cefas every 1–3 months, where they are decanted into 175 mL glass jars and topped up with acidified Lugol's iodine. A minimum of one sample per month is selected for analysis from each deployment location where sample availability allows. Samples are analysed at Cefas using the Utermöhl (1958) technique under inverted Olympus microscopes within 1 year of collection. Species are identified and enumerated to the lowest possible taxonomic level, and counts are recorded in cells per litre.
More detailed methodology is available in Weston et al. (2008) and Greenwood (2019). Plankton and environmental parameters from the SmartBuoy monitoring programme are available from the Cefas Data Hub: https://www.cefas.co.uk/data-and-publications/smartbuoys/ (last access: 22 November 2021).
2.1.4 England's estuarine and coastal waters (Environment Agency)
The Environment Agency (EA) and its predecessors have been collecting phytoplankton on targeted campaigns since the 1990s; however since the inception of EU Water Framework Directive (WFD; EU, 2000) monitoring in 2006, Environment Agency routine phytoplankton samples have been collected from sites in near-shore WFD waterbodies from boats, or occasionally jetties or bridges in estuaries (Devlin et al., 2012).
Sampling in WFD transitional and coastal waters typically consists of one sample per calendar month from three to five sites per water body. Ideally, samples should be 28–31 d apart throughout the year. There must be at least a 14 d interval between sampling occasions at each site. Phytoplankton samples are taken in the mixed surface layer usually between 1–2 m below the water surface using a standard NIO/Niskin-style water sampler, avoiding the surface film and without disturbing bottom sediments. In coastal or non-turbid waters > 5 m depth, the diurnal vertical migration of phytoplankton with light availability is accommodated by collection during daylight hours. However, for some samples, the use of integrated depth sampling using a Lund-type tube system negated the need to constrain the sampling window to daylight hours. Samples are collected in 250 mL clear PET bottles filled to approximately 90 %, leaving sufficient headspace to allow for preservation and homogenization. Samples are preserved with acidified Lugol's iodine and stored in the dark, ideally at a temperature of 3∘ C ± 2∘ C for no longer than 6 months. Samples are analysed using the Utermöhl (1958) method under inverted microscopes. Analysis was conducted at Cefas until 2013, then at both Cefas and an external laboratory from 2013 onwards. Some samples are analysed by multiple analysts to check for comparability of results.
2.1.5 The Scottish Coastal Observatory (Marine Scotland Science)
Marine Scotland Science (MSS) routinely samples the plankton in Scottish waters as part of the Scottish Coastal Observatory. Weekly phytoplankton samples have been collected from Stonehaven (56.96∘ N, 2.11∘ W) since 1997, Scapa (Orkney Islands; 58.74∘ N, 2.97∘ W) since 2001, Loch Ewe (57.84∘ N, 5.65∘ W) since 2023, and Scalloway (Shetland Islands, 60.18∘ N, 1.28∘ W) since 2001. Meso-zooplankton have been sampled, also weekly, at Stonehaven since 1999 and Loch Ewe since 2002.
Phytoplankton samples are collected using a 10 m integrated tube sampler. A 1 L subsample is preserved with 0.5 % acidic Lugol's iodine and returned to the MSS Marine Laboratory. Phytoplankton samples are analysed using a modified Utermöhl (1958) technique. Phytoplankton samples are analysed using an inverted Zeiss Axiovert microscope. The presence or absence of all cells in the chamber is recorded, and fields of view across a transect are counted at ×200 magnification. Phytoplankton are identified to the lowest taxonomic level possible; however due to the limitations of light microscopy and Lugol's fixative in some instances a genus-level identification or “unidentified” category is assigned.
Zooplankton samples are collected using 40 cm diameter bongo nets fitted with 200 µm mesh and filtering cod ends. The nets are hauled vertically from near bottom (45 m at Stonehaven and 35 m at Loch Ewe) to the surface at a speed of 1 m s−1. The samples are immediately fixed in 4 % borax-buffered formaldehyde for later analysis in the laboratory. Zooplankton samples are analysed in the laboratory using a Zeiss Stemi SV-11 stereomicroscope. Larger zooplankton categories (such as Calanus spp., chaetognaths, jellyfish, euphausiids) are identified and enumerated from the whole sample. The remaining zooplankton categories are identified and enumerated from a series of subsamples (of variable volumes depending on concentration of animals but a minimum 2.5 % of the whole sample) so that at least 100 animals of the most common taxa are recorded. Most taxa are identified to the lowest taxonomic level possible, whilst other animals are recorded at the class or phylum level.
More detailed methodology is available in Bresnan et al. (2016). Phytoplankton monthly densities from Stonehaven, Loch Ewe, Scapa, and Scalloway and zooplankton weekly densities from Stonehaven and Loch Ewe are available from https://data.marine.gov.scot/search/type/dataset (last access: 22 November 2021).
2.1.6 Scotland coastal stations (Scottish Environment Protection Agency)
The Scottish Environment Protection Agency (SEPA) collects plankton samples at two near-shore stations (Forth: 56.03∘ N, 3.18∘ W; Clyde: 55.95∘ N, 4.89∘ W). Monthly samples for phytoplankton have been collected since 2007 and for zooplankton since 2014.
Phytoplankton samples are collected using an integrated tube column water sampler with a foot valve and closure tap, which is lowered open to 10 m depth. The closure tap is then moved to the closed position, and the sampler is retrieved. The foot valve is opened and the contents of the sampler are emptied into a rinsed bucket. A 250 mL sample bottle prefilled with 2.5 mL of 5 % Lugol's iodine solution is gently submerged to fill with water from the bucket. The sample bottle is gently inverted to mix the preservative and stored in the dark in a refrigerator at 4 ∘C. Samples of phytoplankton are removed from cold storage and left to acclimatize at room temperature for 24 h, after which they are gently inverted 100 times to re-suspend settled cells and a volume of sample, typically 50 mL, poured into a sample tube and left to settle for 24 h. After this time, 40 mL of supernatant is drawn off slowly and discarded. The remaining 10 mL of sample is then gently inverted 100 times before being carefully poured into a 10 mL Utermöhl (1958) counting chamber. This is then left to settle for a further 24 h before being analysed on an inverted microscope (Leica DM IRB or Leica DMI4000B – Wetzlar, Germany, or Zeiss Axiovert S100 – Jena, Germany). The chamber plate is scanned to assess rough composition of the sample and to determine if settled cells are randomly distributed. Depending on the cell type, size, and density, cell counts are made of the whole counting chamber, a number of transects of the widest point, or a number of random fields of view. At least 400 cells are counted when employing transect or field-of-view counting strategies. Field abundance in cells per litre is calculated by multiplying sample count by microscope subsample factor and 1000 divided by settled volume.
Zooplankton samples are taken with a 27 cm diameter net fitted with a 200 µm mesh with a non-filtering 1 L cod end. A Hydro-bios (Kiel-Altenholz, Germany) digital flowmeter with a back run stop is fitted to the mouth of the net in order to determine the volume hauled, and therefore abundance in individuals per cubic metre. The net is deployed vertically from near-bottom to the surface at approximately 0.5 m s−1. Upon recovery, the net is rinsed with seawater and the contents of the cod ends are transferred into a sample bottle and preserved in 4 % borax-buffered formaldehyde. These samples are gently rinsed through a 63 µm wire mesh sieve for microscopic analysis using Leica (Wetzlar, Germany) M165C microscopes. Abundance is determined by counting any zooplankton larger than stage IV Calanus (including and from copepodite stage V) in the full sample and enumerating all other zooplankton in a subsample taken using a Folsom or Motoda splitter or a plunge sampler as appropriate to achieve an acceptable density of zooplankton, being no fewer than 100 of the most abundant taxa.
2.1.7 Lorne Pelagic Observatory (Scottish Association of Marine Science)
Phytoplankton samples have been collected weekly at the Lorne Pelagic Observatory (56.48∘ N, 5.5∘ W) since 1970 by the Scottish Association of Marine Science (SAMS). Water samples for microplankton (i.e. phytoplankton and pelagic micro-heterotrophs) are taken with water bottles and in some cases with a 10 m integrating hose. They are preserved with 0.5 % acidic Lugol's iodine and volumes of 10 to 50 mL sedimented for counting using the Utermöhl (1958) technique and Wild and Zeiss inverted microscopes equipped with phase contrast. Depending on abundance and organism size, a variety of counting patterns are used, ranging from examination of the whole base of the sedimentation chamber at low power to narrow transects or a few fields at high power.
2.1.8 Swedish west coast (Swedish Meteorological and Hydrological Institute)
The Swedish Meteorological and Hydrological Institute (SMHI) samples both phytoplankton and zooplankton at four stations on the Swedish west coast. Phytoplankton are sampled as an integrated sample using a hose (0–10 m) and preserved in acidic Lugol's iodine; alkaline Lugol's iodine is used for counts of coccolithophores. A total of 25 mL of each sample is analysed using the Utermöhl (1958) method. The samples are stored in the dark and at room temperature prior to analyses. Zooplankton are sampled with a WP2 net (100 µm mesh size), and an integrated sample is taken from 0–25 m. Samples are preserved in formalin and stored in the dark prior to analyses. The subsample volume used when counting depends on the concentration of copepods in the sample to enable statistically sound data. Data are available from https://sharkweb.smhi.se/hamta-data/ (last access: 22 November 2021).
2.2 Spatio-temporal data distribution
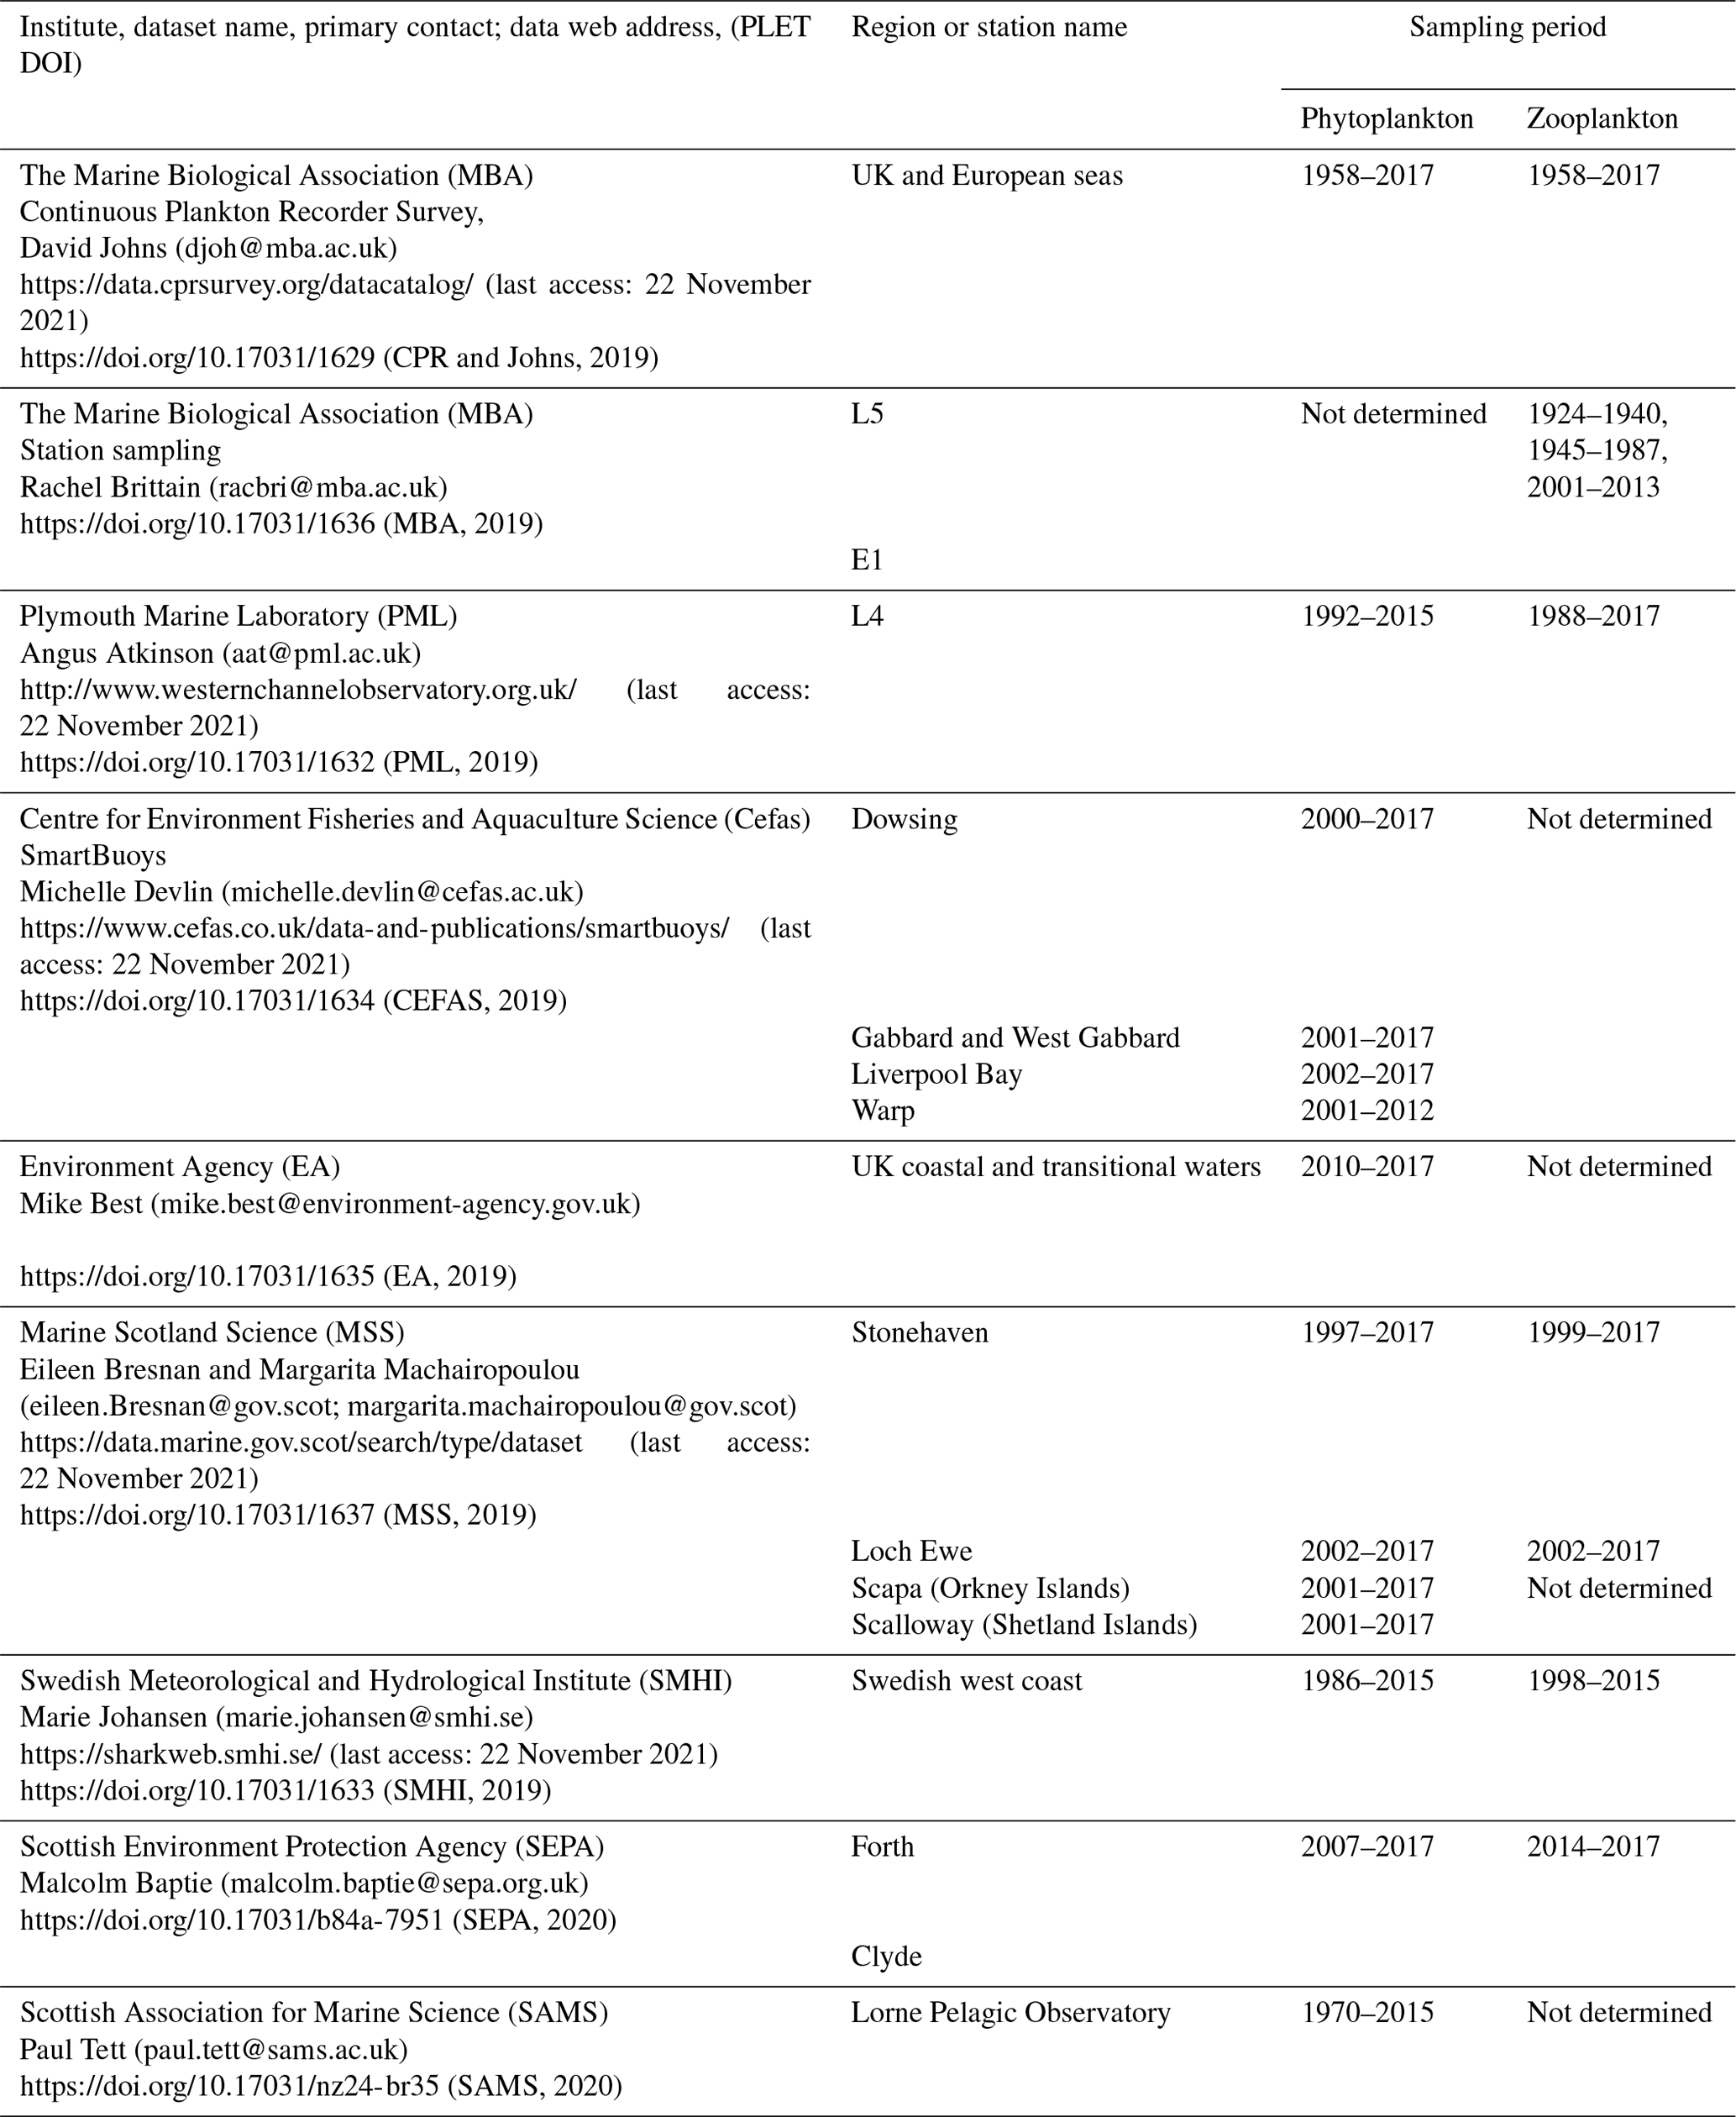
The plankton datasets currently available for lifeform extraction by the PLET have variable spatial and temporal extents, summarized herein into the four regions shown in Fig. 1. Within each region, the availability of plankton data over time differs between datasets (Fig. 2). Due to their high spatial coverage, the CPR and EA datasets contain the largest numbers of samples available for any month, within each region. The number of samples at fixed-point sampling stations shows variations in sampling frequency; in some cases this has changed over the course of the time series (for example, in the Celtic Seas both Cefas SmartBuoy and the SAMS dataset).
While sampling is typically carried out weekly or monthly in order to capture the seasonal cycle of the plankton community structure and rapid changes associated with plankton bloom events, several datasets include sampling gaps and changes in sampling intensity for a variety of reasons (Fig. 3). For example, the EA dataset sampling frequency (and spatial distribution of samples) increased alongside the implementation of the Water Framework Directive (EU, 2000) in 2007, while the SAMS time series stopped between 1982 and 1999. Missing months in the Cefas SmartBuoy time series largely indicate failures of the automated sampling system, or sample loss related to logistical delays in buoy servicing. Ongoing sampling of all time series are at risk of additional reductions in sampling frequency and quality related to funding (McQuatters-Gollop et al., 2017; Zingone et al., 2015).
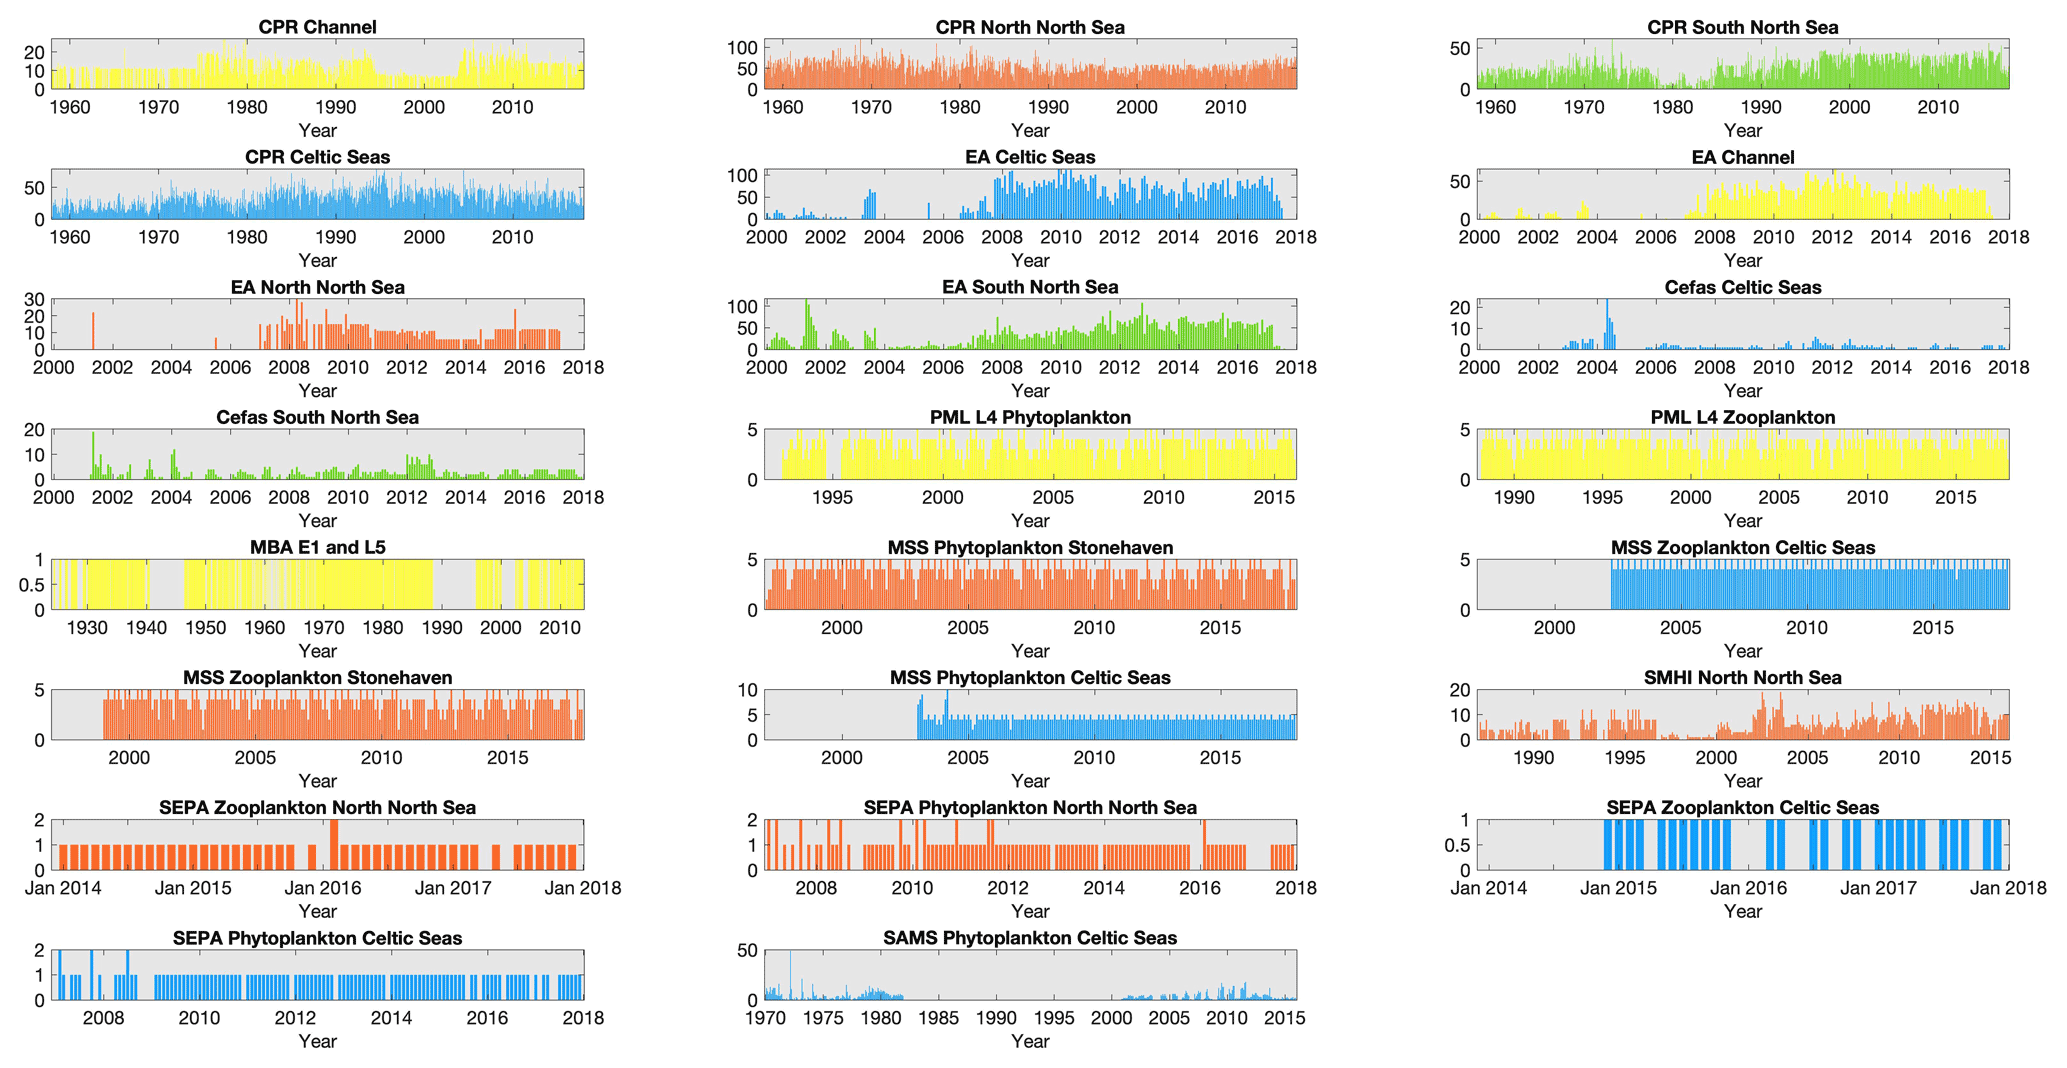
Figure 2Sampling effort of each dataset within each region: number of sampling time points collected per month for each dataset within each of the regions defined in Fig. 1, except for MSS stations in the northern North Sea where only Stonehaven is shown as an example of the three MSS stations in that region. Note that axis limits are not fixed between panels. Bar colour indicates spatial region (see Fig. 1); blue: Celtic Seas; red: northern North Sea; green: southern North Sea; light yellow: English Channel.
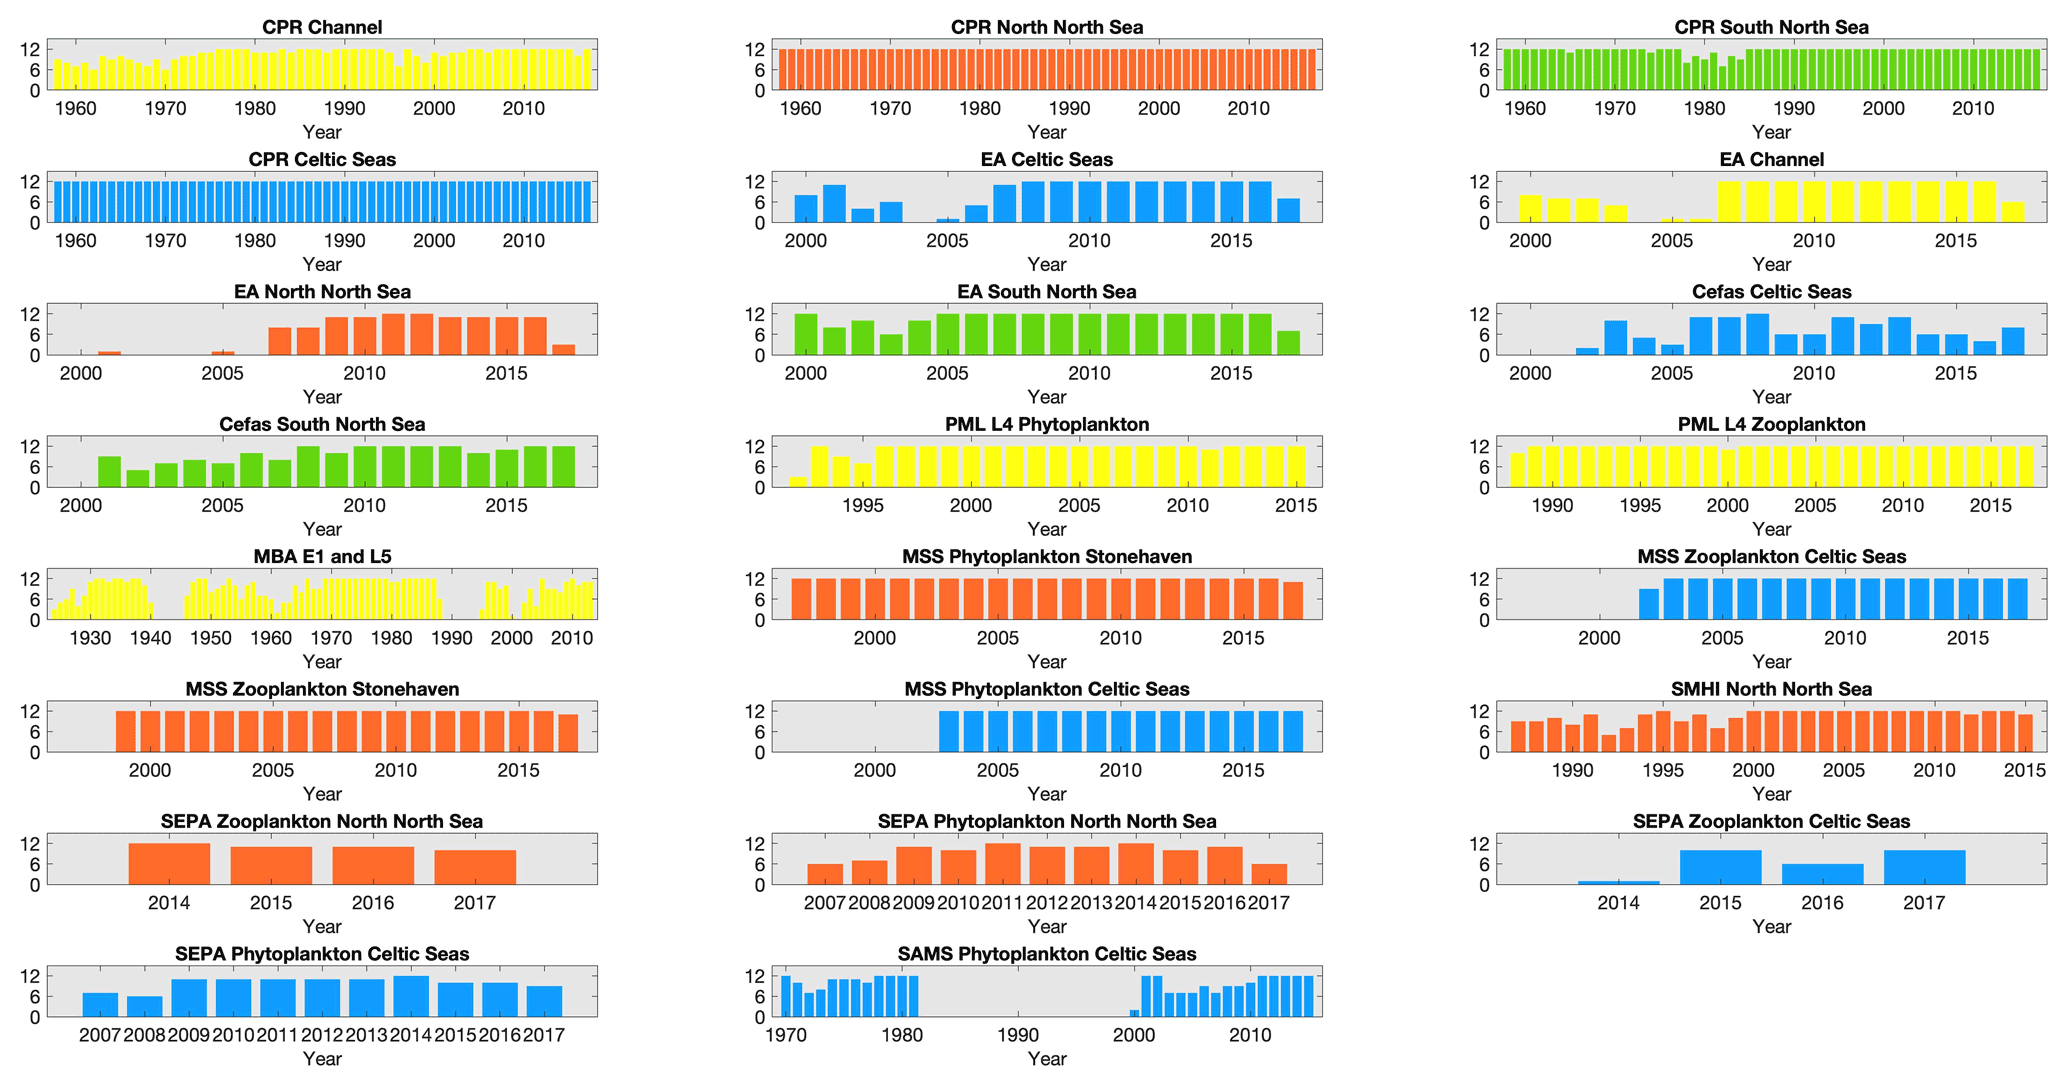
Figure 3Number of months sampled per year for each dataset within each region: number of months sampled within each year, for each dataset within each of the regions defined in Fig. 1, except for MSS stations in the northern North Sea where only Stonehaven is shown as an example of the three MSS stations in that region. Widths of the bars indicate the total time-series length. Bar colour indicates spatial region (see Fig. 1); blue: Celtic Seas; red: northern North Sea; green: southern North Sea; light yellow: English Channel.
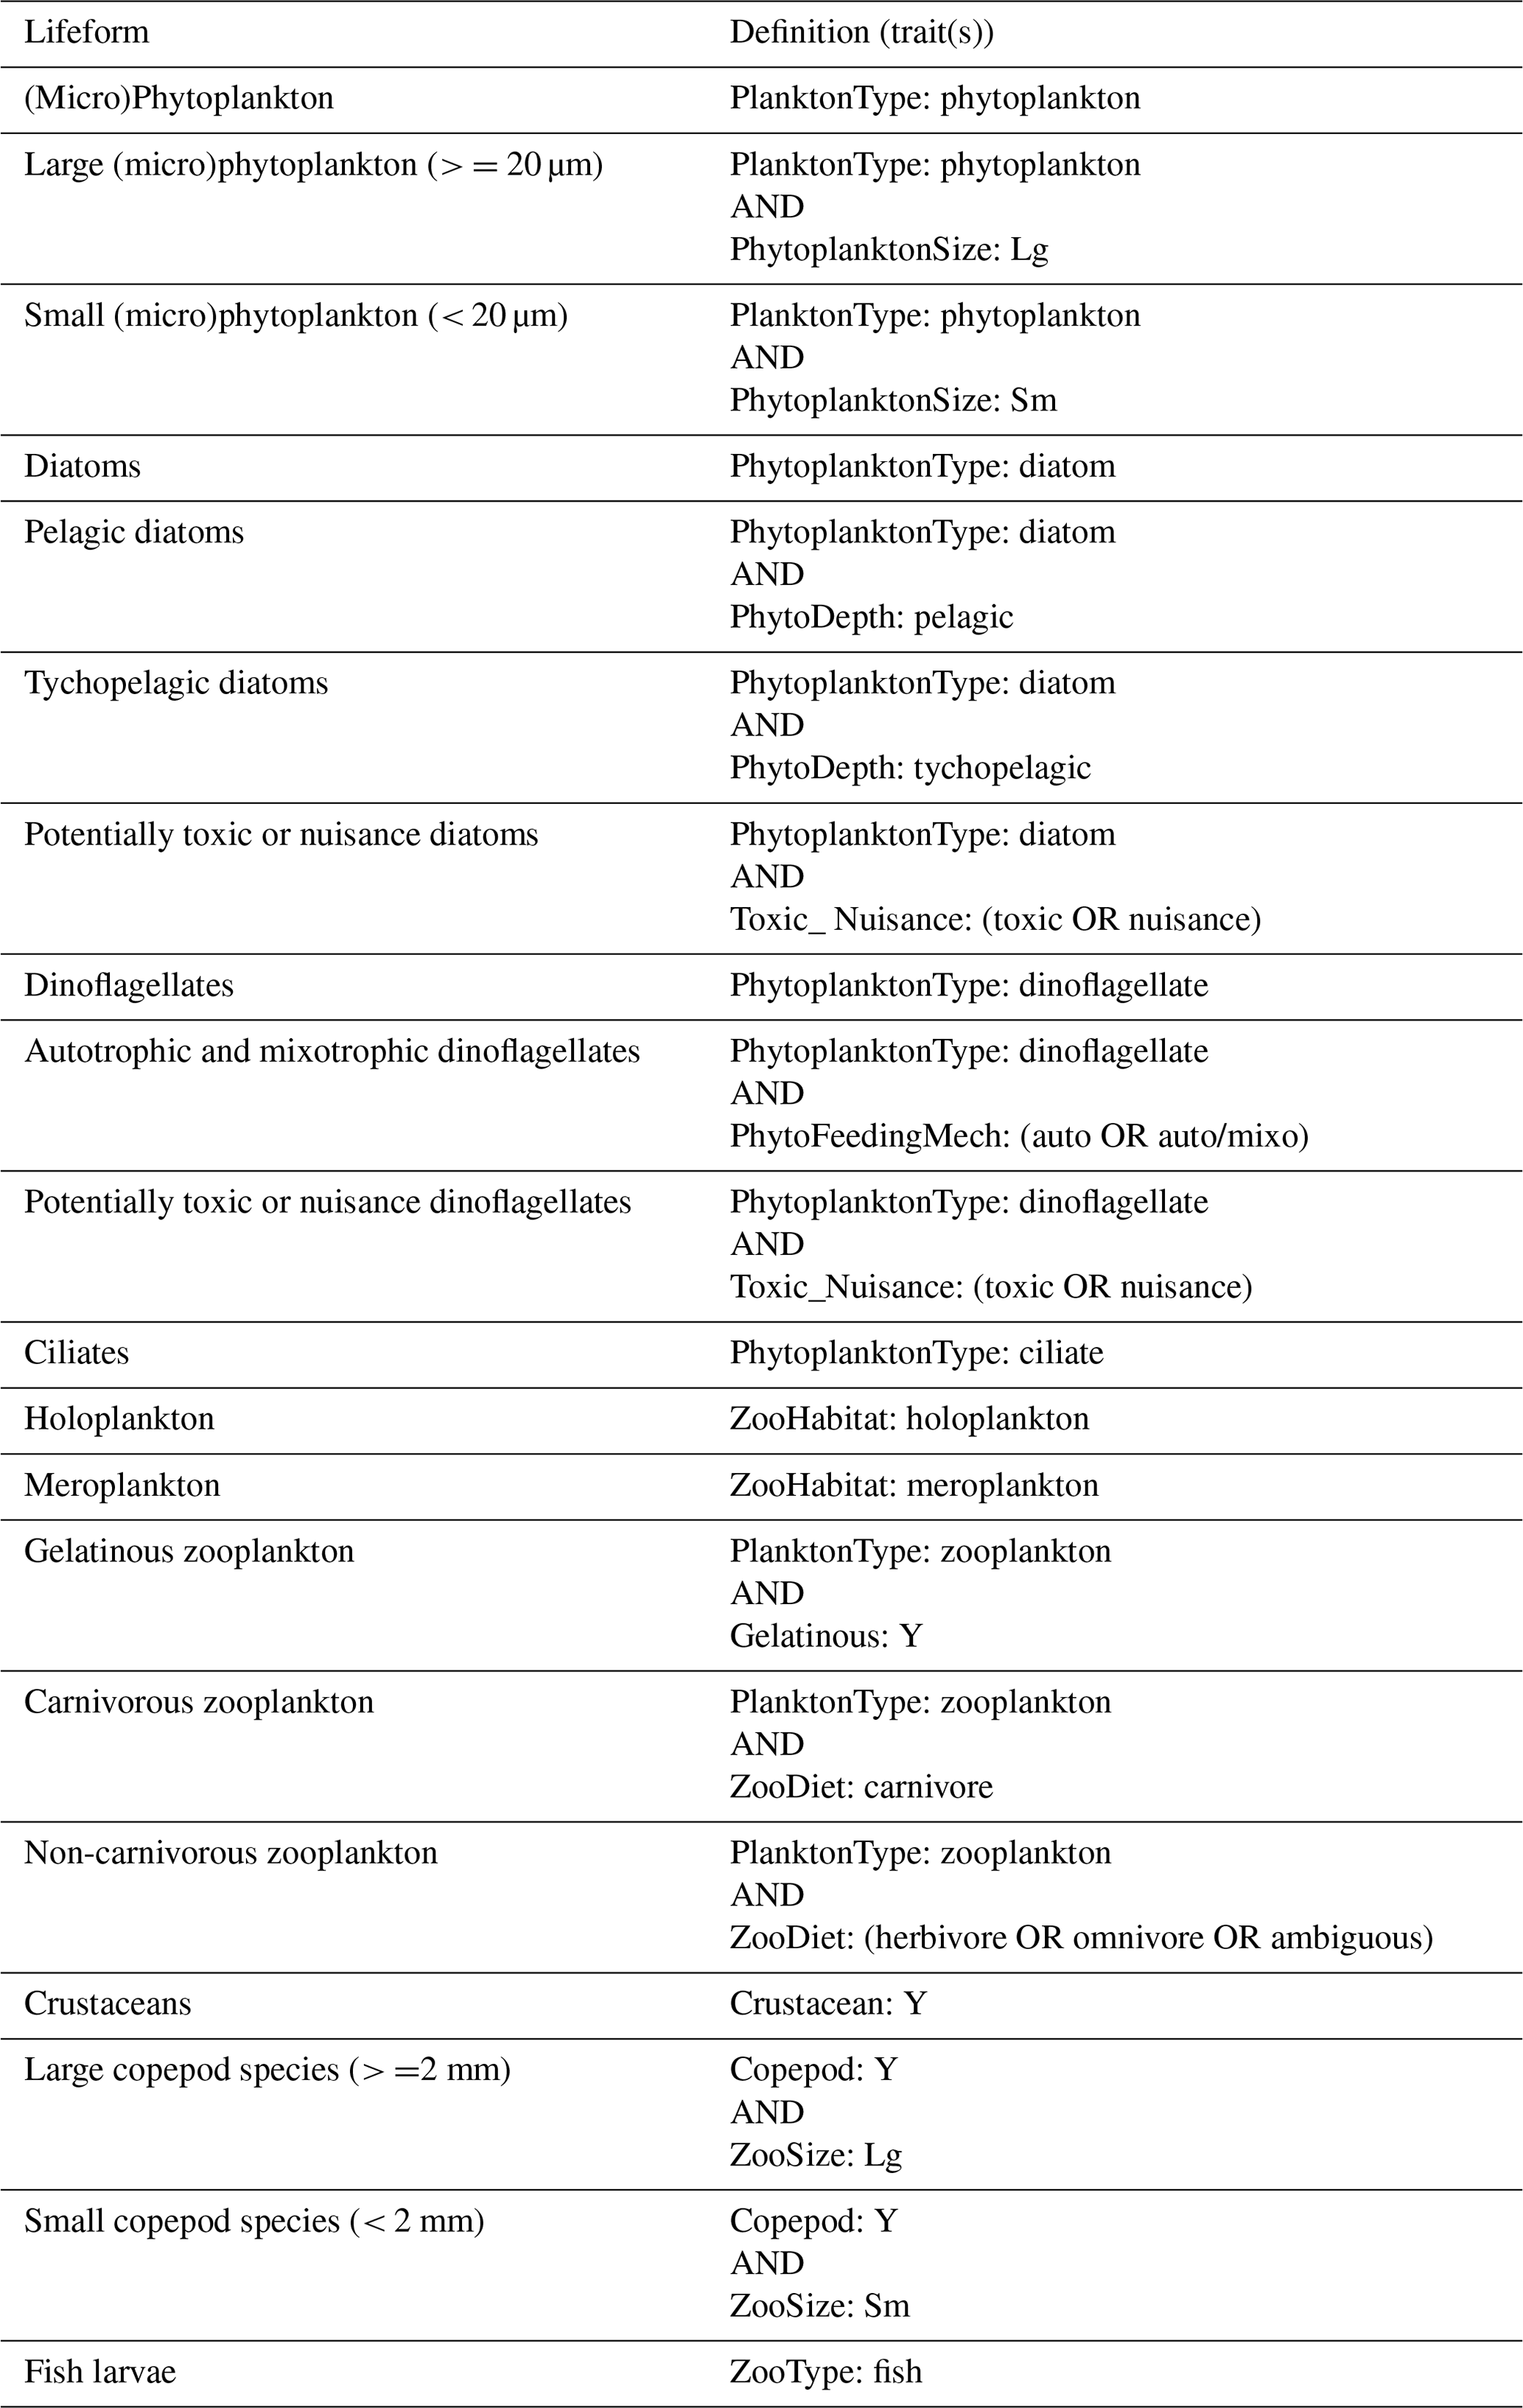
The PLET uses a trait look-up table to aggregate plankton taxa into lifeforms. The lifeforms have been pre-defined using biological traits to represent groups of plankton which perform similar ecological functional roles (McQuatters-Gollop et al., 2019; Scherer et al., 2014). Details of each lifeform, and lifeform pairings with ecological relevance for assessment, are given in Table 2. It should be noted that these traits have been developed for marine taxa only (see list of included taxon groups in UK Pelagic Habitats Expert Group, 2020; https://www.dassh.ac.uk/doitool/data/1709, last access: 22 November 2021, and traits in Table A1), with the goal of simplifying plankton datasets for use in assessments; they are not intended as a fully comprehensive list of plankton traits.
The trait look-up table (Plankton Lifeform Traits Master List (UK Pelagic Habitats Expert Group, 2020) was developed by using a combination of extensive literature synthesis and expert opinion. The World Register of Marine Species (WoRMS Editorial Board, 2020) AphiaIDs are used to link the taxa to their associated traits. Confidence in the lifeforms extracted is assigned based on a combination of the ability to identify each of the taxa it comprises reliably by light microscopy and the ability to assign traits to each taxon (Table 3). The confidence associated with each lifeform is described in Table 4. Only lifeforms with a “high” confidence rating are provided in the PLET outputs. In some cases, confidence assignment reflects the limitations of identification by light microscopy by nature of the datasets around which the table was developed. Similarly, the size-based lifeforms (as currently defined and used) reflect the size limitations of sampling and identification of the currently included datasets. For example, the lifeform “small phytoplankton”, defined as phytoplankton with size < 20 µm, is more appropriately termed “small micro-phytoplankton” because while the lower size limit of identification by routine light microscopy will include some large nanophytoplankton, it excludes pico-plankton and the smaller nano-phytoplankton.
Table 2List of lifeforms and their ecological importance. The definitions of the lifeforms (see also McQuatters-Gollop et al., 2019) based on the trait look-up table are given in Table B1.

* Modified from McQuatters-Gollop et al. (2019).
Table 3Lifeform confidence assignment matrix, where “high”, “medium”, and “low” are based on the ability to identify and assign traits for the constituent taxa groups of a lifeform.
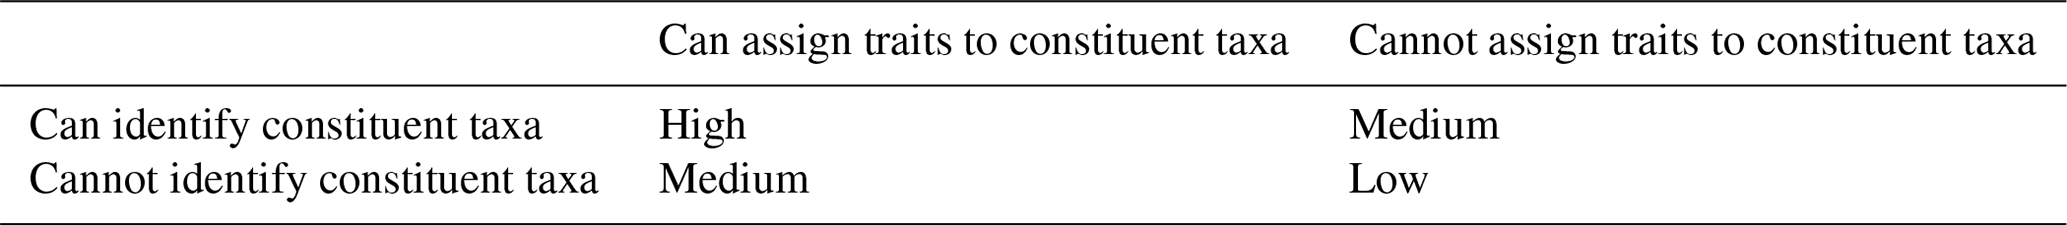
Table 4Lifeform confidences based on ability to identify and assign traits, applying rationale in Table 3. Only lifeforms with a “high” confidence rating are provided in the PLET outputs.

The PLET is accessed through a web-based user interface (see Fig. 4). To generate custom plankton lifeform outputs, users select time-series start and end dates, a spatial area, and a dataset. Because of methodological differences in sampling and analysis, it is not appropriate to produce average lifeforms across the multiple datasets, as such all sample locations within the selected spatial area for any dataset are aggregated into a single lifeform data product, but stations from different datasets are never aggregated. The resulting data product, monthly averaged aggregated lifeform abundance, is generated either within the web browser or for download in .csv or .json format. The output data include the number of individual samples from which each monthly average was derived, as well as a list of component taxon groupings. Blank output component taxon groupings indicate that the originally submitted sample data did not include information in the (optional) “taxon name” field.
The PLET also has a simple API (application programming interface), which provides the option of bypassing the web page interface and sending queries to the tool using the URL only. The base URL is https://www.dassh.ac.uk/lifeforms/cgi-bin/get_form.py. The parameters are startdate (YYYY-MM-DD), enddate (YYYY-MM-DD), north (northern edge of bounding box, in decimal degrees), south (southern edge of bounding box, in decimal degrees), east (eastern edge of bounding box, in decimal degrees), west (western edge of bounding box, in decimal degrees), dataset (currently CPR, L4_phyto, L4_zoo, SMHI, CEFAS_SmartBuoy, EA_ PHYTO_2000-2017, MBA_E1_L5, MSS_phyto, MSS_zoo, SEPA_Zooplankton, SEPA_Phytoplankton or SAMS-LPO), and format (csv, json, or pretty). For example, to retrieve results from the CPR dataset for May 1975 between 50 and 60∘ of latitude and −5 and 5∘ of longitude, and return in CSV format, the URL request is https://www.dassh.ac.uk/lifeforms/cgi-bin/get_form.py?startdate=1975-05-01&enddate=1975-05-30&north=60&south=50&east=5&west=-5&dataset=CPR&format=CSV (last access: 22 November 2021). Sending such URL commands via Curl or similar tools allows the PLET to be used programmatically if desired.
There are a number of options for defining the spatial domain of the lifeform data product. A rectangular extent can be manually defined by the northern, southern, western, and eastern edges of a rectangular bounding box, by simply drawing a rectangle on the interactive map display which shows sample locations for each dataset. Similarly, a polygon-shaped extent can be manually defined in “well-known text” (WKT) format or through the interactive map. A query specifying spatial extent by polygon instead of bounding box can be constructed for the API by designating the parameter wkt instead of north, south, east, and west. A more complex area, for example a formal assessment region, can be used by uploading a shapefile to the tool.
All integrated datasets are listed within the web interface, with full metadata. The trait look-up table can also be accessed and downloaded. To facilitate submission of new and updated plankton data, templates for data submission are also provided.
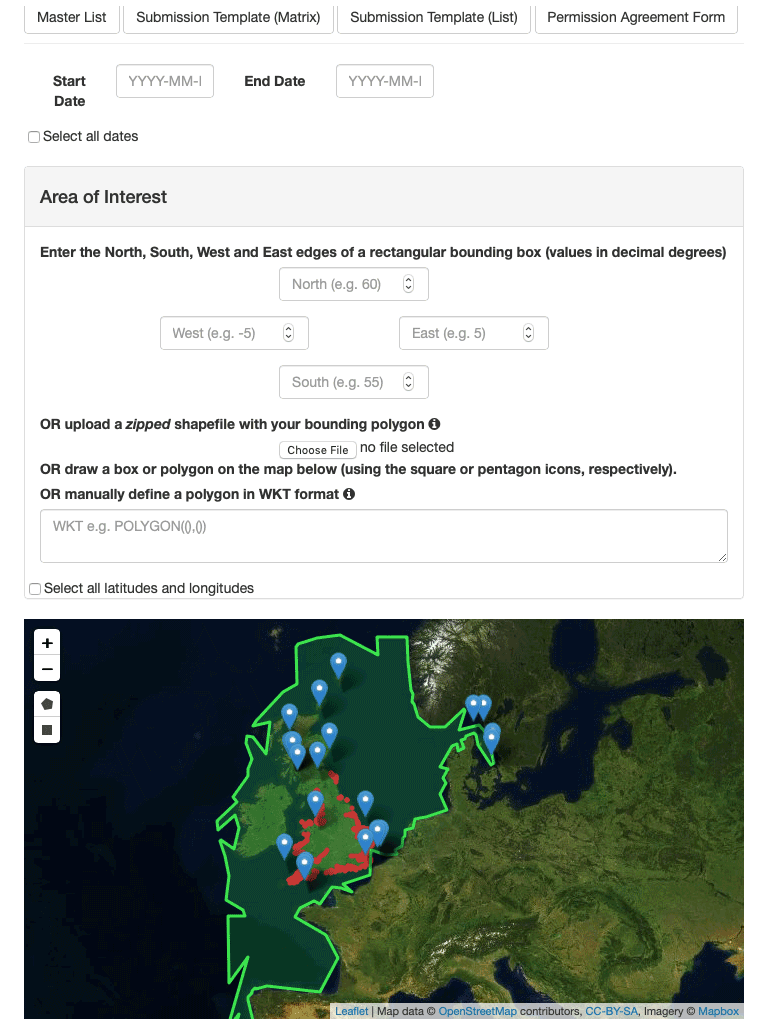
Figure 4The Plankton Lifeform Extraction Tool. Screenshot of the Plankton Lifeform Extraction Tool (v1).
The spatial and temporal patterns of plankton lifeforms, based on the data currently held in PLET, are summarized to highlight seasonal patterns in Fig. 5 (phytoplankton) and Fig. 6 (zooplankton) and inter-annual patterns in Figs. 7 and 8. In order to facilitate visualization across the different lifeforms and datasets, where absolute lifeform abundances are extremely variable, within-lifeform and dataset changes are shown as standardized z scores that indicate the difference from the overall time-series mean values (Glover et al., 2005).
Plankton abundance peaks in spring and summer are associated with nearly all plankton lifeforms, across all datasets. However, the timing, duration, and intensity of these peaks differ between lifeforms and datasets (see Figs. 5 and 6), in some cases partly because of spatial aggregation of the data. In the CPR dataset, which samples furthest offshore, seasonal zooplankton lifeform abundance peaks last longer than those of the phytoplankton lifeforms. The EA datasets, which represent estuarine and coastal waters, include much shorter seasonal phytoplankton lifeform abundance peaks than the CPR for the corresponding regions, and differences in bloom timing are also evident, highlighting the small-scale spatial variability in plankton abundance. This is further evidenced in the comparison between seasonal patterns in PML's L4 station in the English Channel and both the EA and CPR data aggregation for the same larger region. This heterogeneity demonstrates the added value of integrating datasets to achieve a representative description of plankton community seasonal succession within even a relatively localized sea area, particularly where different programmes sample different subsets of the plankton community (in this case the fragile dinoflagellates are less well preserved by CPR compared to PML and EA sampling). Comparing across larger spatial scales, differences in seasonal patterns between English and Scottish waters are likely influenced by the latitudinal gradients (Fanjul et al., 2017, 2019; Uriarte et al., 2021) as well as local hydrographic conditions (e.g. Atlantic inflow). The Swedish stations, located in the Kattegat, show the most divergent lifeform seasonality compared to the other datasets, notably in the timing of abundance peaks (e.g. the absence of April plankton blooms) which likely reflect their distinct oceanographic setting and the influence of Baltic Sea outflow waters.
Interannual trends in lifeform abundance can be related to changes in pressures within the marine system (Bedford et al., 2020a; McQuatters-Gollop et al., 2019). Given the strong seasonal variability, summarizing plankton abundance to compare across years is non-trivial. Representative data coverage, typically at least monthly, is needed to ensure that inter-annual differences are not due to missing samples. For example, the WFD eutrophication assessment procedure (Greenwood, 2019) requires phytoplankton data for at least 9 months of every year assessed. The plankton lifeform index (Tett et al., 2007, 2008), by looking at changes from a reference envelope defined by 3–5 years of adequate data (i.e. at least monthly sampling), is robust against missing samples (months) so long as these are not biased to particular times of the year. The Pelagic Habitat Expert Group has recommended at least monthly sampling to adequately take account of seasonal changes in the balance of plankton lifeforms, while noting that higher temporal resolution would provide greater confidence that all transient bloom events (which may last less than a month) were observed. Given the tool's robustness against data loss, annual assessments can be made reliably when 1 to 3 months have been lost, so long as there is no persistent bias in lost months over several years.
Despite missing months being an important consideration for annual aggregation (in some datasets in particular; see Fig. 4), the interannual trends in phytoplankton (Fig. 7) and zooplankton (Fig. 8) lifeforms show considerable changes in lifeform abundance among years in all datasets and regions. The longest time series (MBA L5 and E1 since 1924, CPR since 1960, and SAMS phytoplankton since 1970) capture decreases over several years followed by subsequent increases, which caution against over-interpretation of the shorter time series. For example, there have been decreases in all zooplankton lifeforms at the MSS Celtic Seas station since 2013 that cannot be seen in the nearby SEPA Celtic Seas station, which only has observations from 2014 onwards; while both in the Celtic Seas area, these two sites are characterized by very different hydrographical settings. The importance of considering both short- and long-term changes in plankton lifeforms is discussed in detail in Bedford et al. (2020b).
Bringing diverse datasets together to extend both spatial and temporal coverage is a key tool for distinguishing small-scale, short-term fluctuations from larger-scale longer-term changes. For example, Bedford et al. (2020a) identified regional-scale trends in lifeform changes (increasing diatom abundance in the northern North Sea and increasing mesozooplankton abundance across almost the whole northwest European shelf) using time-series data from five different UK plankton surveys and linked some of these changes to changing sea surface temperature. Assessment of the status of the marine pelagic habitat (McQuatters-Gollop et al., 2019) requires linking changes to pressures (Scherer et al., 2016), which relies on high-temporal- and high-spatial-resolution, good-quality observations, such as climate (Bedford et al., 2020a) and eutrophication (Gowen et al., 2015; Greenwood, 2019).
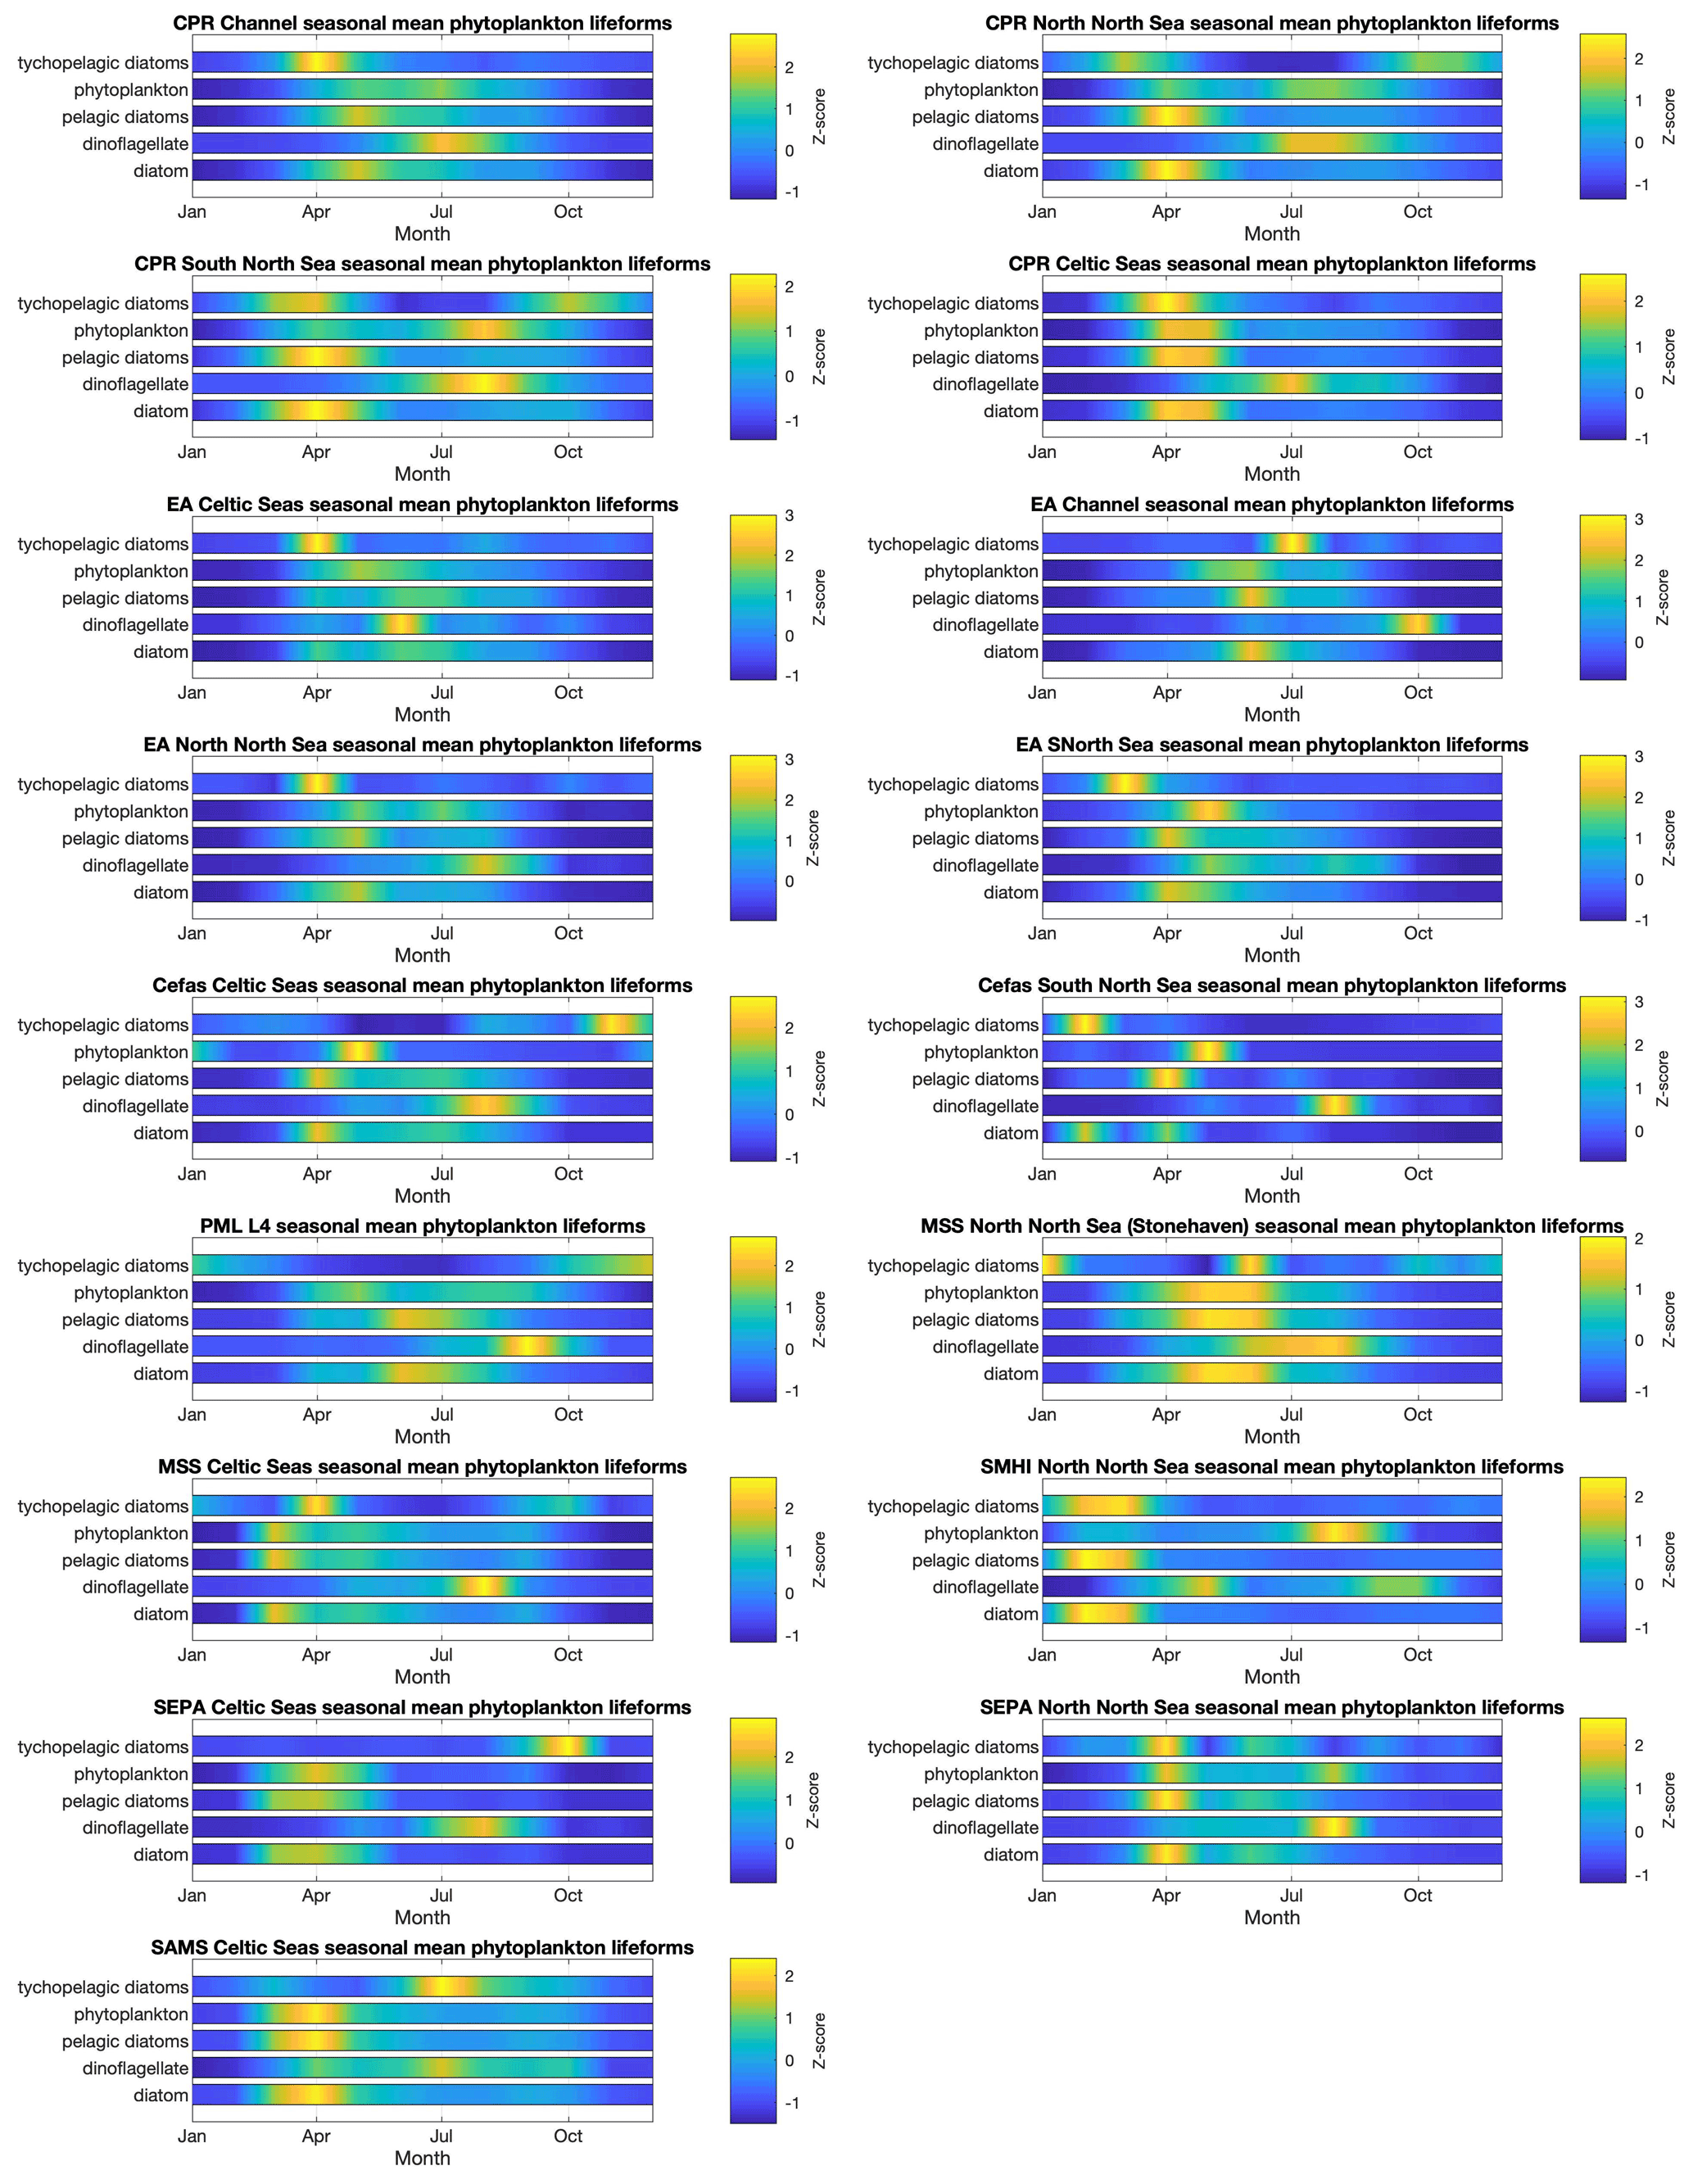
Figure 5Phytoplankton lifeform monthly means, by data provider and region. Colour indicates lifeform abundance relative to the long-term mean of each lifeform within each region and dataset as standardized z score (Glover et al., 2005): scores of zero are equal to the long-term mean, positive scores (in green/yellow) signify values above the long-term mean, and negative scores signify values below the long-term mean (in blue). Only those lifeforms that have been assigned a confidence level of “high” are shown (see Tables 2 and 3). Regions are defined in Fig. 1.
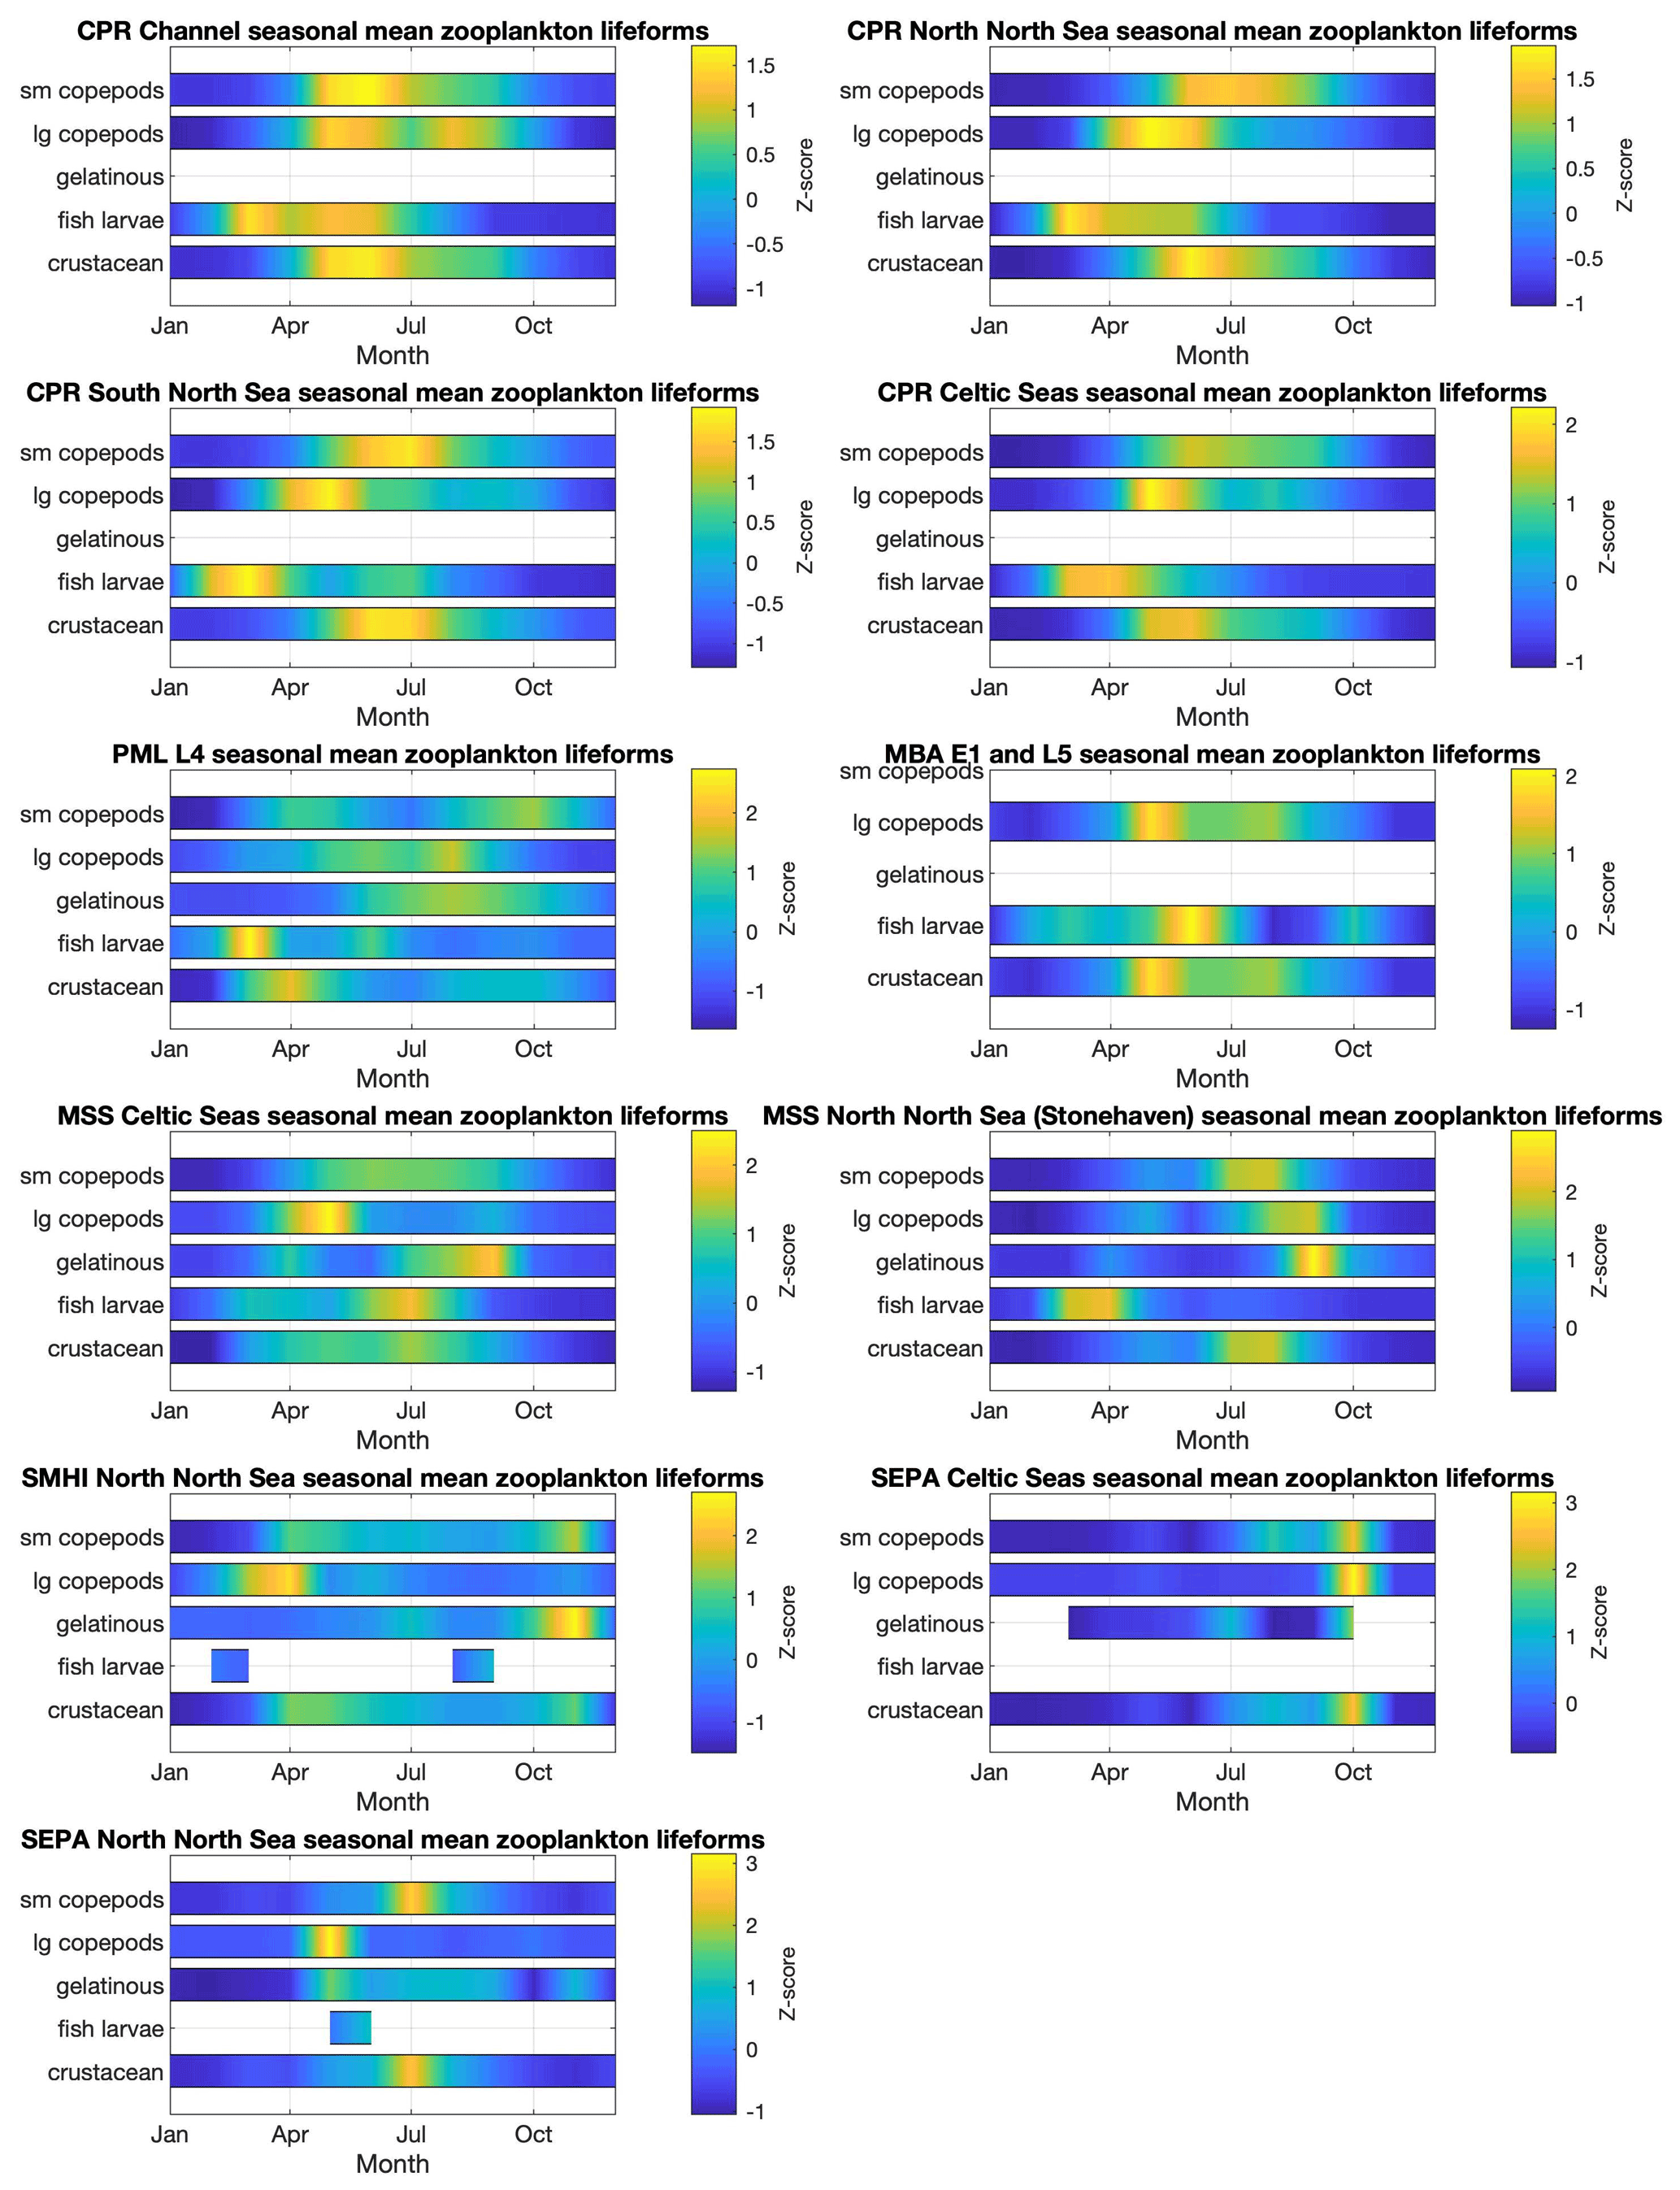
Figure 6Zooplankton lifeform monthly means, by data provider and region. Colour indicates lifeform abundance relative to the long-term mean of each lifeform within each region and dataset as standardized z score Glover et al., 2005): scores of zero are equal to the long-term mean, positive scores (in green/yellow) signify values above the long-term mean, and negative scores signify values below the long-term mean (in blue). Only those lifeforms that have been assigned a confidence level of “high” are shown (see Tables 2 and 3). Regions are defined in Fig. 1.

Figure 7Phytoplankton lifeform annual means, by data provider and region. Colour indicates lifeform abundance relative to the long-term mean of each lifeform within each region and dataset as standardized z score (Glover et al., 2005): scores of zero are equal to the long-term mean, positive scores (in green/yellow) signify values above the long-term mean, and negative scores signify values below the long-term mean (in blue). Only those lifeforms that have been assigned a confidence level of “high” are shown (see Tables 2 and 3). Regions are defined in Fig. 1.
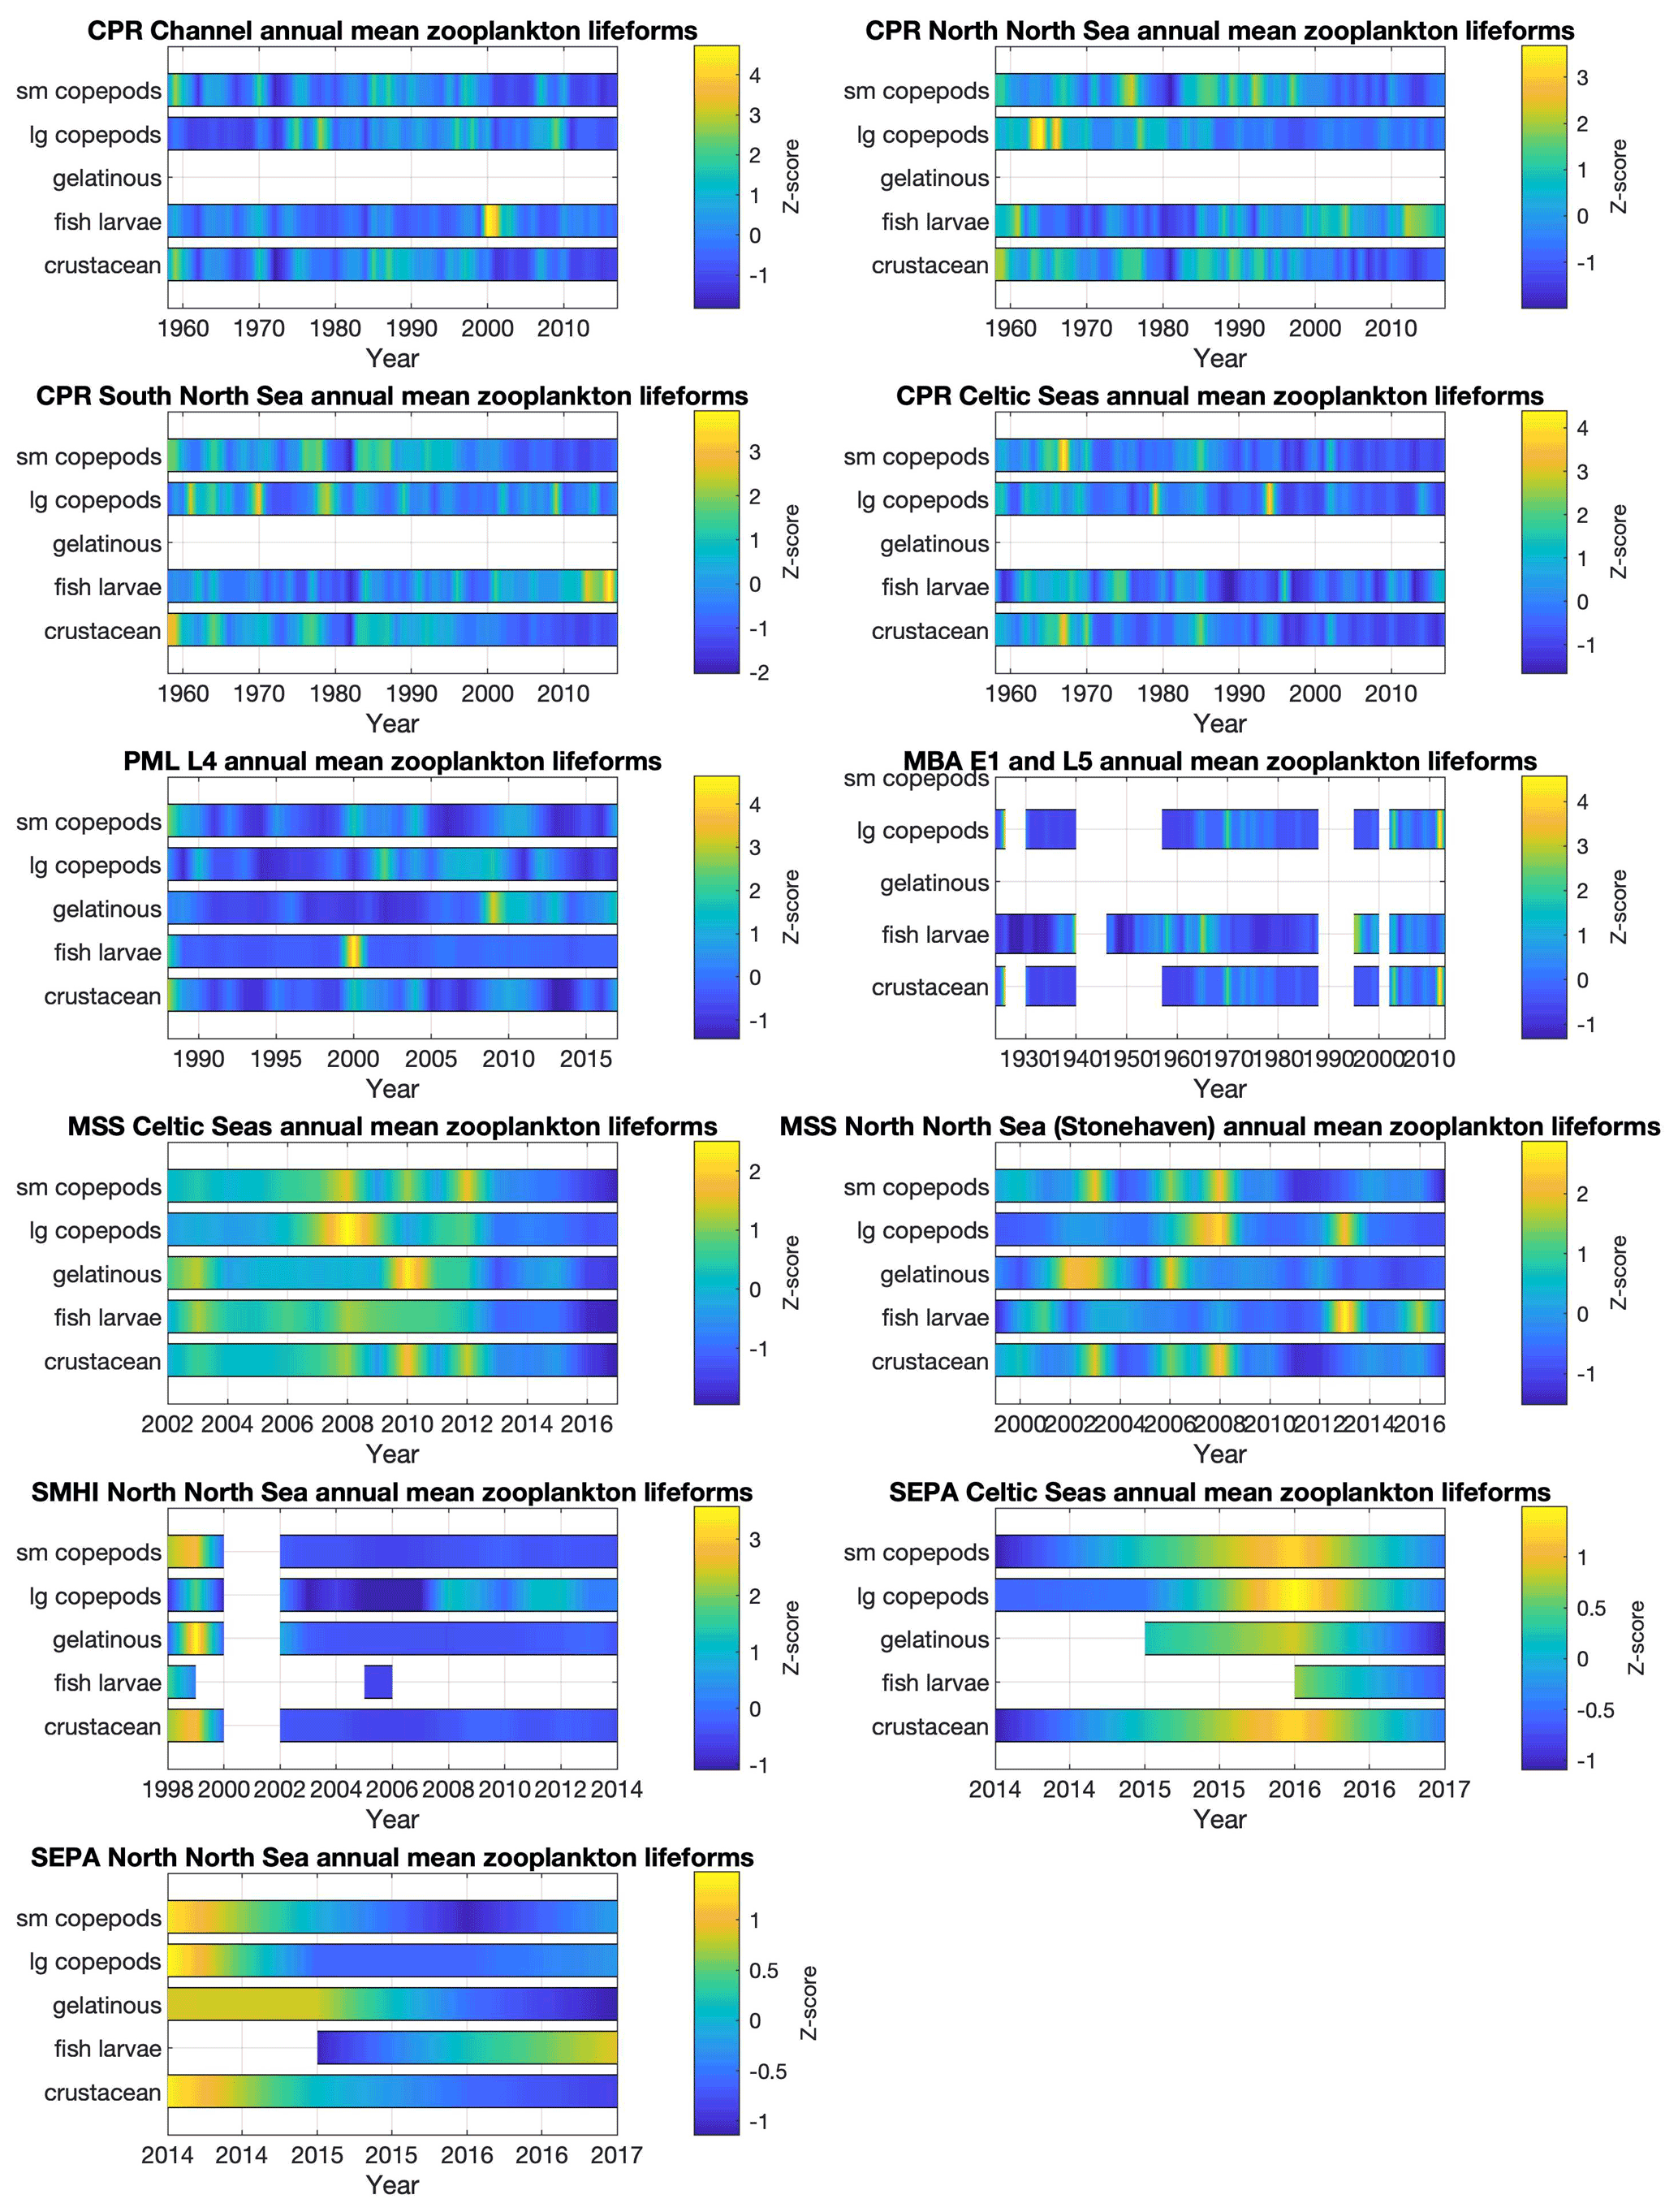
Figure 8Zooplankton lifeform annual means, by data provider and region. Colour indicates lifeform abundance relative to the long-term mean of each lifeform within each region and dataset as standardized z score (Glover et al., 2005): scores of zero are equal to the long-term mean, positive scores (in green/yellow) signify values above the long-term mean, and negative scores signify values below the long-term mean (in blue). Only those lifeforms that have been assigned a confidence level of “high” are shown (see Tables 2 and 3). Regions are defined in Fig. 1.
The Plankton Lifeform Extraction Tool is hosted by the Archive for Marine Species and Habitats Data (DASSH), which is accredited as the UK Node of the Ocean Biodiversity Information System (OBIS) and through the Marine Environmental Data and Information Network (MEDIN), the UK partnership of organizations committed to improving access to UK marine data, and core-funded by the Department for the Environment, Food and Rural Affairs (Defra) and the Scottish government. Lifeform data products can be generated at https://www.dassh.ac.uk/lifeforms/ (last access: 22 November 2021, Ostle et al., 2021).
The PLET's lifeform data products are generated by applying the Plankton Lifeform Traits Master List trait look-up table (UK Pelagic Habitats Expert Group, 2020; https://doi.org/10.17031/1709) to standardized-format versions of the integrated plankton datasets (see Table 1 for details; CPR and Johns, 2019; MBA, 2019; PML, 2019; CEFAS, 2019; EA, 2019; MSS, 2019; SMHI, 2019; SEPA, 2020; SAMS, 2020). These time series may be updated in the future to include ongoing plankton monitoring, and more datasets may be added. Versions of several of these datasets are also available through other data repositories (e.g. institute-specific websites provided in Table 1, or the Ocean Biodiversity Information System, OBIS). However, PLET provides the first centralized database for all time series feeding into UK Marine Strategy and OSPAR biodiversity lifeform-based assessments and importantly a format and structure compatible with extraction of lifeform time series. By attaching DOIs to the underlying dataset versions held within PLET and the trait list, the tool provides full transparency and reproducibility for the generated lifeform outputs. Users of these datasets are encouraged to appropriately cite the data sources by means of their DOIs as well as this data paper, so that usage can be more easily traced. Doing so provides evidence of data uptake, enhancing the possibility of continued funding for valuable time series and for plankton indicator development.
Large-scale trends in the abundance of individual species are challenging to compare across multiple time series due to difficulties in sampling and in counting at the species level, particularly at the limits of the geographic range of a species. Conversely, trends in bulk indices such as total zooplankton biomass and abundance or total chlorophyll a concentration can miss important underlying details. Our method to aggregate at the level of functional groups (lifeforms) provides a tractable approach to reveal meaningful information at an intermediate level of organization that is still ecologically relevant.
While the main available UK plankton time series are included here as well as Swedish data from the southeastern North Sea, further extending the geographical and temporal extent of plankton time series held in the PLET will improve robustness of evidence underpinning pelagic habitat assessment. As a transparent and accessible source of diverse plankton datasets, the PLET also facilitates exploration of associated research questions in an integrated way. Observations of changes in size-based plankton lifeform abundances (Greenwood et al., 2019; McQuatters-Gollop et al., 2019; Bedford et al., 2020a), alongside methodological developments in measuring the complete plankton size spectrum (Atkinson et al., 2021), provide an improved ability to understand what is driving changes in plankton size and species composition across the full spatial–temporal scales of the component datasets (Schmidt et al., 2020). Data from different data sources are not aggregated within PLET in order to maintain the scientific robustness of the outputs and incorporate a range of methodologies (units, scale, fixed-point, transect, etc.). The data are outputted in a unified way from PLET to encourage comparison and interpretation of the changes in the plankton, if the user wishes to combine the outputs within a specified area and time period, a normalization technique can be applied; however care needs to be taken to ensure compatibility and coverage do not bias the combined results. For example, due to the differing taxonomic resolution and sampling methods across the various component time series, we do not recommend simple comparisons of indices of species richness or diversity. There is also the flexibility to improve confidence in low-confidence groupings and to potentially incorporate new types of plankton data into the tool in the future, such as the use of flow cytometry data.
Time-series datasets are critical for identifying and assessing changes in the marine environment. Given the expense and effort which goes into producing and maintaining these invaluable datasets, tools that make them more widely available, transparent, and accessible to the broader user community are needed. The PLET provides a centralized, easily accessible source for version-controlled time-series data and metadata and is an essential component of a robust assessment process as well as a tool to support the research, which is needed to underpin assessment. This includes exploring new ecologically relevant lifeform groupings and improving the understanding of lifeforms currently designated as medium and low confidence and which will in turn feed back into the process of assessing the health of the marine environment.
The PLET is not a static resource; it is designed to readily accept additional datasets and be updated to support future assessments as the assessment procedure continues to evolve. This is a critical step towards using multiple datasets collected with diverse methods to populate and assess a common indicator, allowing the assessment of pelagic ecosystems at regional scales. As the tool is expanded with additional datasets, its ability to detect change in plankton communities will increase, and the policy evidence it provides will continue to become more robust, providing decision makers with critical information to inform management measures. As pelagic habitat assessments continue to improve and adapt to the changing policy landscape (Boyes and Elliott, 2016) and to evolving plankton data availability, the PLET's flexibility will allow it to continue to underpin assessment.
Table A1Relevant trait in lifeform traits list. The trait list reflects the lifeforms and types of plankton data in the datasets used to date in lifeform-based assessment. The list is a living document, whose status reflects ongoing efforts to refine and improve the lifeform approach as well as a necessary compromise between focusing on traits which inform the lifeforms currently used for assessments and including additional information and traits where these are known and readily available. Trait groups for the plankton type “Protozoa” have recently been added to the trait list but are not shown here as they are not finalized and not used in any of the current lifeforms. The inclusion of “protozoa” and “ciliates” (which are protozoa) designation under “phytoplankton type” is to ensure these key taxa are captured in lifeforms. One important example is the abundant group “Flagellates” which has “Plankton type: phytoplankton” to allow assignment of the phytoplankton trait groups, despite including both phototrophic and heterotrophic taxa and thus Phytoplankton type: protozoa. In the trait list: spaces between words are omitted, e.g. “Plankton type” is written as “PlanktonType”, and zooplankton is often abbreviated as “Zoo”. For all trait categories, “Y” is yes (trait applies) and “N”: no (trait does not apply). The following definitions apply to all columns (trait categories) of the list, with additional details given in the table where relevant: (1) “Ambiguous”: taxa cannot be reliably assigned to any one category for this trait, mostly because taxa within this group can fall under more than one trait category (e.g. taxa categories which include individuals of both “large” and “small” size classes); (2) “[blank]”: trait is not used for this plankton type (e.g. “PhytoHabitat” is blank for all zooplankton taxon groups); (3) “n/a”: (not applicable) trait is used for this plankton type but not relevant for this taxon (e.g. the line “fish larvae” has a “ZooHabitat” of NA because they are neither meroplankton nor holoplankton; the line is intended to only contribute to the “fish larvae” lifeform); (4) “NYA”: (not yet assigned) trait is used for this plankton type but is not yet assigned (e.g. phytoplankton which have not been assigned “tychopelagic”, “pelagic”, or “ambiguous” under “PhytoDepth”.
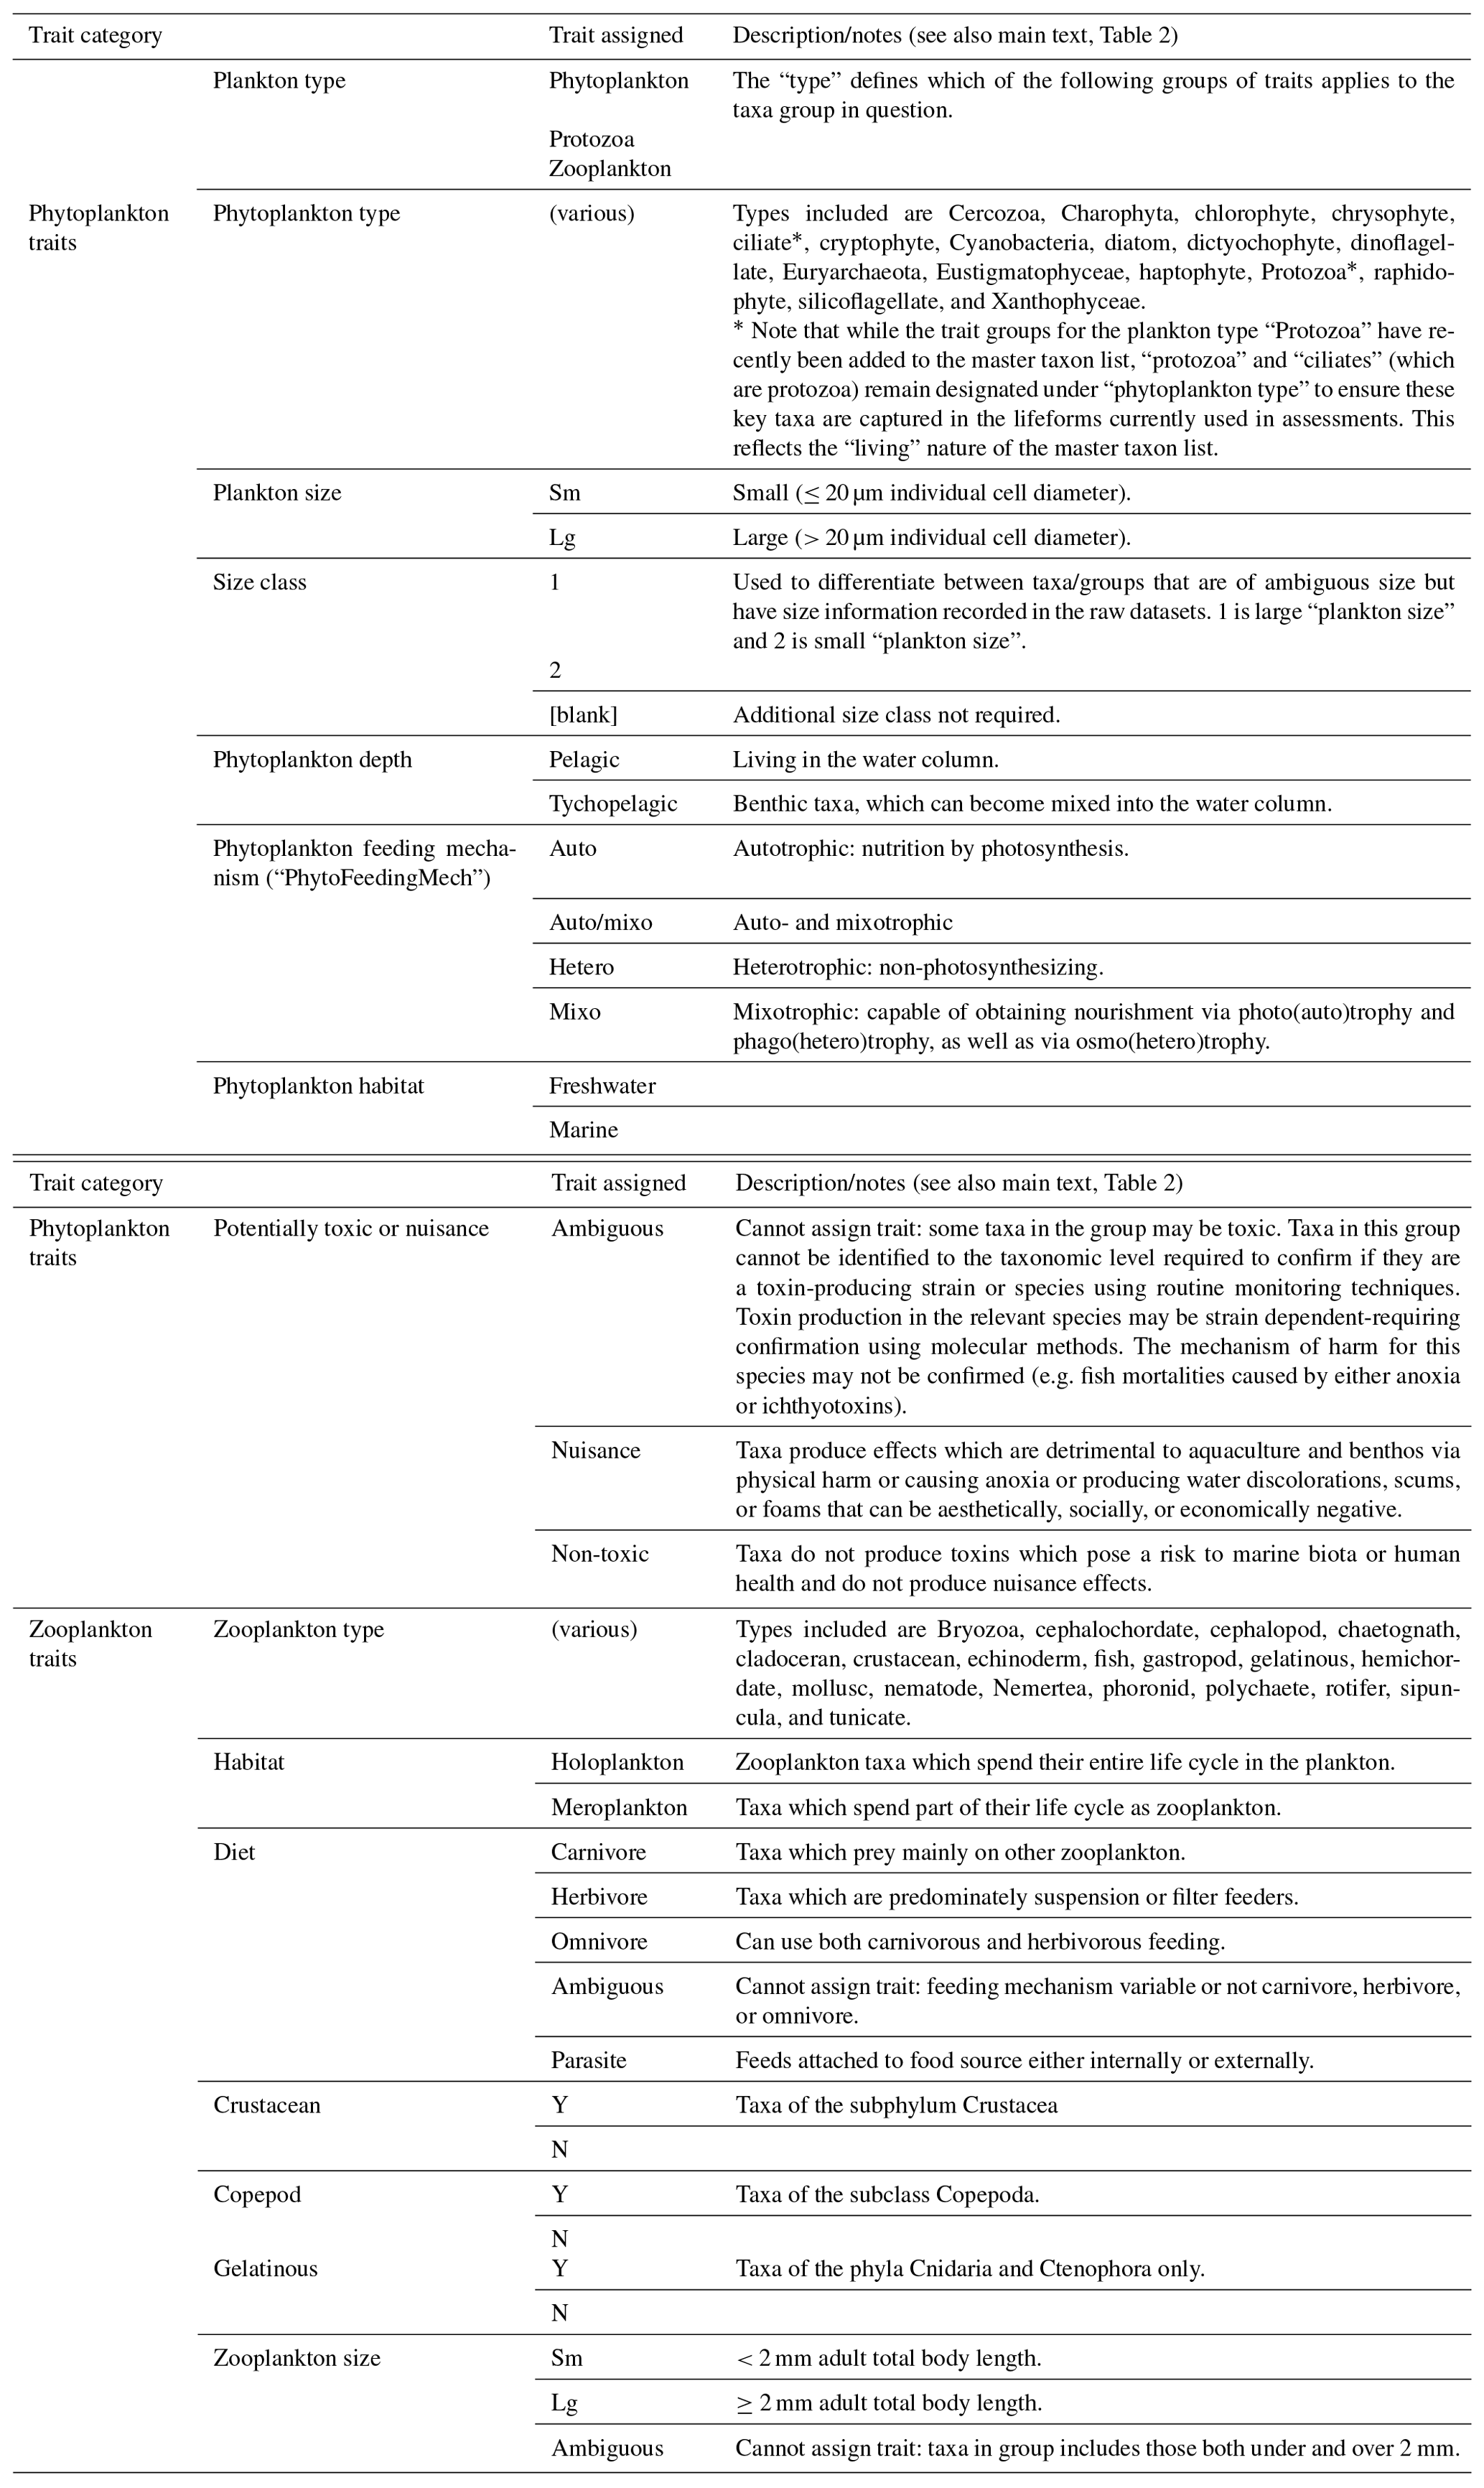
Table B1Definitions of lifeforms by trait as defined in the trait list. See Table 2 for descriptions of traits used.
AMG co-ordinated the project. All authors developed the plankton lifeform trait master list and provided input on the lifeform traits and groupings. CO and GG designed the Plankton Lifeform Extraction Tool (PLET) and wrote the initial code. KP developed the PLET and performed the maintenance of the site, with support from DL and DB. DGJ, CO, AA, CW, RB, MB, MD, CG, BB, EB, KC, MM, MJ, and PT provided datasets. CO, CG, and AMG prepared the manuscript with contributions from all co-authors.
The contact author has declared that neither they nor their co-authors have any competing interests.
Publisher's note: Copernicus Publications remains neutral with regard to jurisdictional claims in published maps and institutional affiliations.
We are greatly indebted to the crews and scientists for collecting the component samples over the last 100 years, to the large number of taxonomic analysts for processing the samples, and to those individuals who strived to keep plankton time series going under difficult circumstances.
Funding that supports this work and the data collected has come from the European Commission, European Union (EU) grant no. 11.0661/2015/712630/SUB/ENVC.2 OSPAR; UK Natural Environment Research Council (grant nos. NE/R002738/1 and NE/M007855/1); EMFF, Climate Linked Atlantic Sector Science (grant no. NE/R015953/1), Department for Environment, Food and Rural Affairs, UK Government (grant nos. ME-5308 and ME-414135), NSF USA OCE-1657887, DFO CA F5955150026/001/HAL, Natural Environment Research Council UK (grant no. NC-R8/H12/100); Horizon 2020 (MISSION ATLANTIC (grant no. 862428)); iCPR (grant no. SBFF-2019-36526), IMR Norway; DTU Aqua Denmark; and the French Ministry of Environment, Energy, and the Sea (MEEM). Recent funding for the development of PLET and the Pelagic Habitats Indicator has been provided by HBDSEG/Defra and MMO/EMFF. The MSS Scottish Coastal Observatory data and analyses are funded and maintained by the Scottish Government Schedules of Service (grant nos. ST05a and ST02H), MSS Stonehaven Samplers, North Atlantic Fisheries College, Shetland, Orkney Islands Harbour Council, and Isle Ewe Shellfish.
This paper was edited by David Carlson and reviewed by Todd OBrien and Aleksandra Lewandowska.
Atkinson, A., Harmer, R. A., Widdicombe, C. E., McEvoy, A. J., Smyth, T. J., Cummings, D. G., Somerfield, P. J., Maud, J. L., and McConville, K.: Questioning the role of phenology shifts and trophic mismatching in a planktonic food web, Prog. Oceanogr., 137, 498–512, https://doi.org/10.1016/j.pocean.2015.04.023, 2015.
Atkinson, A., Lilley, M. K. S., Hirst, A. G., McEvoy, A. J., Tarran, G. A., Widdicombe, C., Fileman, E. S., Woodward, E. M. S., Schmidt, K., Smyth, T. J., and Somerfield, P. J.: Increasing nutrient stress reduces the efficiency of energy transfer through planktonic size spectra, Limnol. Oceanogr., 66, 422–437, https://doi.org/10.1002/lno.11613, 2021.
Beaugrand, G., Reid, P. C., Ibañez, F., Lindley, J. A., and Edwards, M.: Reorganization of North Atlantic marine copepod biodiversity and climate, Supplementary Material, Science, 296, 1692–1694, https://doi.org/10.1126/science.1071329, 2002.
Beaugrand, G., Edwards, M., and Legendre, L.: Marine biodiversity, ecosystem functioning, and carbon cycles, P. Natl. Acad. Sci. USA, 107, 10120–10124, https://doi.org/10.1073/pnas.0913855107, 2010.
Bedford, J., Ostle, C., Johns, D. G., Atkinson, A., Best, M., Bresnan, E., Machairopoulou, M., Graves, C. A., Devlin, M., Milligan, A., Pitois, S., Mellor, A., Tett, P., and Mcquatters-gollop, A.: Lifeform indicators reveal large-scale shifts in plankton across the North-West European shelf, Glob. Change Biol., 2019, 1–16, https://doi.org/10.1111/gcb.15066, 2020a.
Bedford, J., Ostle, C., Johns, D. G., Budria, A., and Mcquatters-gollop, A.: The influence of temporal scale selection on pelagic habitat biodiversity indicators, Ecol. Indic., 114, 106311, https://doi.org/10.1016/j.ecolind.2020.106311, 2020b.
Boyes, S. J. and Elliott, M.: Brexit: The marine governance horrendogram just got more horrendous!, Mar. Pollut. Bull., 111, 41–44, https://doi.org/10.1016/j.marpolbul.2016.08.020, 2016.
Bresnan, E., Cook, K., Hindson, J., Hughes, S., Lacaze, J.-P., Walsham, P., Webster, L., and Turrell W. R.: The Scottish Coastal Observatory 1997–2013, Part 2: Description of Scotland's Coastal Waters, Scottish Mar. Freshw. Sci. Rep., 7, 278 pp., 2016.
Capuzzo, E., Lynam, C. P., Barry, J., Stephens, D., Forster, R. M., Greenwood, N., McQuatters-Gollop, A., Silva, T., van Leeuwen, S. M., and Engelhard, G. H.: A decline in primary production in the North Sea over 25 years, associated with reductions in zooplankton abundance and fish stock recruitment, Glob. Change Biol., 24, e352–e364, https://doi.org/10.1111/gcb.13916, 2018.
CEFAS: 2000 to date North, Irish & Celtic Seas Centre for Environment, Fisheries and Aquaculture Science Smartbuoy Marine Monitoring, The Archive for Marine Species and Habitats Data (DASSH) [data set], https://doi.org/10.17031/1634, 2019.
Chiba, S., Batten, S., Martin, C. S., Ivory, S., Miloslavich, P., and Weatherdon, L. V: Zooplankton monitoring to contribute towards addressing global biodiversity conservation challenges, J. Plankton Res., 40, 509–518, https://doi.org/10.1093/plankt/fby030, 2018.
Cibic, T., Comici, C., Bussani, A., and Del Negro, P.: Benthic diatom response to changing environmental conditions, Estuar. Coast. Shelf S., 115, 158–169, https://doi.org/10.1016/j.ecss.2012.03.033, 2012.
CPR and Johns, D. G.: Continuous Plankton Recorder Survey (CPR Survey), The Marine Biological Association of the UK, CPR Survey [data set], https://doi.org/10.17031/1629, 2019.
Daufresne, M., Lengfellner, K., and Sommer, U.: Global warming benefits the small in aquatic ecosystems, P. Natl. Acad. Sci. USA, 106, 12788–12793, https://doi.org/10.1073/pnas.0902080106, 2009.
Devlin, M., Barry, J., Painting, S., and Best, M.: Extending the phytoplankton tool kit for the UK Water Framework Directive: Indicators of phytoplankton community structure, Hydrobiologia, 633, 151–168, https://doi.org/10.1007/s10750-009-9879-5, 2009.
Devlin, M., Best, M., Bresnan, E., Scanlan, C., and Baptie, M.: Water Framework Directive: The development and status of phytoplankton tools for ecological assessment of coastal and transitional waters, Water Framework Directive – United Kingdom Technical Advisory Group (WFD-UKTAG), 94 pp., 2012.
EA: Phytoplankton Dataset provided by the Environment Agency (EA) 2000–2017, The Archive for Marine Species and Habitats Data (DASSH) [data set], https://doi.org/10.17031/1635, 2019.
Edwards, K. F., Klausmeier, C. A., and Litchman, E.: Nutrient utilization traits of phytoplankton, Ecology, 96, 2311–2311, https://doi.org/10.1890/14-2252.1, 2015.
Edwards, M. and Richardson, A. J.: Impact of climate change on marine pelagic phenology and trophic mismatch, Nature, 430, 881–884, https://doi.org/10.1038/nature02808, 2004.
EU: Directive 2000/60/EC of the European Parliament and of the Council of 23 October 2000 establishing a framework for community action in the field of water policy, Off. J. Eur. Commun., 327, 1–72, 2000.
Falkowski, P.: Ocean Science: The power of plankton, Nature, 483, S17–S20, https://doi.org/10.1038/483S17a, 2012.
Fanjul, A., Villate, F., Uriarte, I., Iriarte, A., Atkinson, A., and Cook, K.: Zooplankton variability at four monitoring sites of the Northeast Atlantic Shelves differing in latitude and trophic status, J. Plankton Res., 39, 891–909, https://doi.org/10.1093/plankt/fbx054, 2017.
Fanjul, A., Iriarte, A., Villate, F., Uriarte, I., Artiach, M., Atkinson, A., and Cook, K.: Latitude, distance offshore and local environmental features as modulators of zooplankton assemblages across the NE Atlantic Shelves Province, J. Plankton Res., 41, 293–308, https://doi.org/10.1093/plankt/fbz015, 2019.
Flynn, K. J., Stoecker, D. K., Mitra, A., Raven, J. A., Glibert, P. M., Hansen, P. J., Granéli, E., and Burkholder, J. M.: Misuse of the phytoplankton-zooplankton dichotomy: The need to assign organisms as mixotrophs within plankton functional types, J. Plankton Res., 35, 3–11, https://doi.org/10.1093/plankt/fbs062, 2013.
Flynn, K. J., Mitra, A., Anestis, K., Anschütz, A. A., Calbet, A., Ferreira, G. D., Gypens, N., Hansen, P. J., John, U., Martin, J. L., Mansour, J. S., Maselli, M., Medić, N., Norlin, A., Not, F., Pitta, P., Romano, F., Saiz, E., Schneider, L. K., Stolte, W., and Traboni, C.: Mixotrophic protists and a new paradigm for marine ecology: Where does plankton research go now?, J. Plankton Res., 41, 375–391, https://doi.org/10.1093/plankt/fbz026, 2019.
Glover, D., Jenkins, W., and Doney, S.: Modeling methods for marine science, Cambridge University Press, 2005.
Gowen, R. J., Mcquatters-gollop, A., Tett, P., Best, M., Bresnan, E., Castellani, C., Cook, K., Forster, R. M., Scherer, C., and Mckinney, A.: The Development of UK Pelagic (Plankton) Indicators and Targets for the MSFD, Ecosystems, 2011, 1–41, https://doi.org/10.13140/RG.2.1.5181.1920, 2011.
Gowen, R. J., Tett, P., and Smayda, T. J.: Phytoplankton and the balance of nature: An opinion, Estuar. Coast. Shelf S., 113, 317–323, https://doi.org/10.1016/j.ecss.2012.08.009, 2012.
Gowen, R. J., Collos, Y., Tett, P., Scherer, C., Bec, B., Abadie, E., Allen, M., and O'Brien, T.: Response of diatom and dinoflagellate lifeforms to reduced phosphorus loading: A case study in the Thau lagoon, France, Estuar. Coast. Shelf S., 162, 45–52, https://doi.org/10.1016/j.ecss.2015.03.033, 2015.
Grattepanche, J. D., Breton, E., Brylinski, J. M., Lecuyer, E., and Christaki, U.: Succession of primary producers and micrograzers in a coastal ecosystem dominated by Phaeocystis globosa blooms, J. Plankton Res., 33, 37–50, https://doi.org/10.1093/plankt/fbq097, 2011.
Greenwood, N.: Utilizing eutrophication assessment directives from transitional to marine systems in the Thames estuary and Liverpool Bay, UK, Front. Mar. Sci., 6, 116, https://doi.org/10.3389/fmars.2019.00116, 2019.
Hallegraeff, G., Enevoldsen, H., and Zingone, A.: Global harmful algal bloom status reporting, Harmful Algae, 102, 101992, https://doi.org/10.1016/j.hal.2021.101992, 2021.
Hinder, S. L., Hays, G. C., Edwards, M., Roberts, E. C., Walne, A. W., and Gravenor, M. B.: Changes in marine dinoflagellate and diatom abundance under climate change, Nat. Clim. Change, 2, 271–275, https://doi.org/10.1038/nclimate1388, 2012.
Kirby, R. R., Beaugrand, G., and Lindley, J. A.: Climate-induced effects on the meroplankton and the benthic-pelagic ecology of the North Sea, Limnol. Oceanogr., 53, 1805–1815, https://doi.org/10.4319/lo.2008.53.5.1805, 2008.
Klais, R., Norros, V., Lehtinen, S., Tamminen, T., and Olli, K.: Community assembly and drivers of phytoplankton functional structure, Funct. Ecol., 31, 760–767, https://doi.org/10.1111/1365-2435.12784, 2017.
Kulk, G., Platt, T., Dingle, J., Jackson, T., Jönsson, B. F., Bouman, H. A., Babin, M., Brewin, R. J. W., Doblin, M., Estrada, M., Figueiras, F. G., Furuya, K., González-Benítez, N., Gudfinnsson, H. G., Gudmundsson, K., Huang, B., Isada, T., Kovač, Ž., Lutz, V. A., Marañón, E., Raman, M., Richardson, K., Rozema, P. D., van de Poll, W. H., Segura, V., Tilstone, G. H., Uitz, J., van Dongen-Vogels, V., Yoshikawa, T., and Sathyendranath, S.: Primary production, an index of climate change in the ocean: Satellite-based estimates over two decades, Remote Sens., 12, 826, https://doi.org/10.3390/rs12050826, 2020.
Laplace-Treyture, C., Derot, J., Prévost, E., Le Mat, A., and Jamoneau, A.: Phytoplankton morpho-functional trait dataset from French water-bodies, Sci. Data, 8, 1–9, https://doi.org/10.1038/s41597-021-00814-0, 2021.
Margalef, R.: Life-forms of phytoplankton as survival alternatives in an unstable environment, Oceanol. Acta, 1, 493–509, 1978.
MBA: 1924–2013 MBA L4 and E1 Young Fish Survey, The Archive for Marine Species and Habitats Data (DASSH) [data set], https://doi.org/10.17031/1636, 2019.
McQuatters-Gollop, A., Johns, D. G., Bresnan, E., Skinner, J., Rombouts, I., Stern, R., Aubert, A., Johansen, M., Bedford, J., and Knights, A.: From microscope to management: The critical value of plankton taxonomy to marine policy and biodiversity conservation, Mar. Policy, 83, 1–10, https://doi.org/10.1016/j.marpol.2017.05.022, 2017.
McQuatters-Gollop, A., Atkinson, A., Aubert, A., Bedford, J., Best, M., Bresnan, E., Cook, K., Devlin, M., Gowen, R., and Johns, D. G.: Plankton lifeforms as a biodiversity indicator for regional-scale assessment of pelagic habitats for policy, Ecol. Indic., 101, 913–925, 2019.
Morishita, J.: What is the ecosystem approach for fisheries management?, Mar. Policy, 32, 19–26, https://doi.org/10.1016/j.marpol.2007.04.004, 2008.
MSS: Phyto and zooplankton records provided by Marine Science Scotland (MSS) from Loch Ewe, Scalloway, Scapa and Stonehaven. The Archive for Marine Species and Habitats Data (DASSH) [data set], https://doi.org/10.17031/1637, 2019.
O'Brien, T. D., Lorenzoni, L., Isensee, K., and Valdés, L.: What are Marine Ecological Time Series telling us about the ocean? A status report. IOC-UNESCO, IOC, OC-UNESCO, IOC, July, 297, available at: http://igmets.net/report (last access: 22 November 2021), 2017.
OSPAR: Changes in Phytoplankton and Zooplankton Communities, Intermediate Assessment 2017, available at: https://oap.ospar.org/en/ospar-assessments/intermediate-assessment-2017/biodiversity-status/habitats/changes-phytoplankton-and-zooplankton-communities/ (last access: 22 November 2021), 2017.
Ostle, C., Paxman, K., Graves, C. A., Arnold, M.,, Artigas, F. L., Atkinson, A., Aubert, A., Baptie, M., Bear, B., Bedford, J., Best, M., Bresnan, E., Brittain, R., Broughton, D., Budria, A., Cook, K., Devlin, M., Graham, G., Halliday, N., Hélaouët, P., Johansen, M., Johns, D. G., Lear, D., Machairopoulou, M., McKinney, A., Mellor, A., Milligan, A., Pitois, S., Rombouts, I., Scherer, C., Tett, P., Widdicombe, C., and McQuatters-Gollop, A.: Plankton Lifeform Extraction Tool, DASSH [data set], available at: https://www.dassh.ac.uk/lifeforms/, last access: 22 November 2021.
PML: 1992 – Ongoing Plymouth Marine Laboratory (PML) Zooplankton and Phytoplankton data collected at L4, The Archive for Marine Species and Habitats Data (DASSH) [data set], https://doi.org/10.17031/1632, 2019.
Raybaud, V., Heroin, D., Raud, T., J.-M. B., Stemmann, L., and Sautour, B.: Census and analysis of zooplankton metadata of the French coasts since 1955, J. Oceanogr. Res. Data, 4, 11–37, 2011.
Reid, P. C., Hari, R. E., Beaugrand, G., Livingstone, D. M., Marty, C., Straile, D., Barichivich, J., Goberville, E., Adrian, R., Aono, Y., Brown, R., Foster, J., Groisman, P., Hélaouët, P., Hsu, H. H., Kirby, R., Knight, J., Kraberg, A., Li, J., Lo, T. T., Myneni, R. B., North, R. P., Pounds, J. A., Sparks, T., Stübi, R., Tian, Y., Wiltshire, K. H., Xiao, D., and Zhu, Z.: Global impacts of the 1980s regime shift, Glob. Change Biol., 22, 682–703, https://doi.org/10.1111/gcb.13106, 2016.
Richardson, A. J.: In hot water: zooplankton and climate change, Ices J. Mar. Sci., 65, 279–295, 2008.
Richardson, A. J., Walne, A. W., and John, A. W. G.: Using continuous plankton recorder data, Prog. Oceanogr., 68, 27–74, https://doi.org/10.1016/j.pocean.2005.09.011, 2006.
Richardson, A. J., Bakun, A., Hays, G. C., and Gibbons, M. J.: The jellyfish joyride: causes, consequences and management responses to a more gelatinous future, Trends Ecol. Evol., 24, 312–322, https://doi.org/10.1016/j.tree.2009.01.010, 2009.
SAMS: Plankton dataset provided by Scottish Association for Marine Science (SAMS) from the Lorn Pelagic Observatory (LPO), The Archive for Marine Species and Habitats Data (DASSH) [data set], https://doi.org/10.17031/nz24-br35, 2020.
Scherer, C.: Developing and testing an index of change in microplankton community structure in temperate shelf seas, Edinburgh Napier University, ISNI: 0000 0004 2721 3014, 2012.
Scherer, C., Gowen, R. J., Tett, P., Atkinson, A., Baptie, M., Best, M., Bresnan, E., Cook, K., Forster, R., Keeble, S., and Mcquatters-gollop, A.: Development of a UK Integrated Plankton Monitoring Programme – A final report of the Lifeform and State Space project Prepared for The Department of Environment, Food and Rural Affairs, December, London, UK, https://doi.org/10.13140RG.2.1.1511.1765, 2014.
Scherer, C., Gowen, R. J., and Tett, P.: Assessing the State of the Pelagic Habitat: A Case Study of Plankton and Its Environment in the Western Irish Sea, Front. Mar. Sci., 3, 236, https://doi.org/10.3389/fmars.2016.00236, 2016.
Schmidt, K., Birchill, A. J., Atkinson, A., Brewin, R. J. W., Clark, J. R., Hickman, A. E., Johns, D. G., Lohan, M. C., Milne, A., Pardo, S., Polimene, L., Smyth, T. J., Tarran, G. A., Widdicombe, C. E., Woodward, E. M. S., and Ussher, S. J.: Increasing picocyanobacteria success in shelf waters contributes to long-term food web degradation, Glob. Change Biol., 26, 5574–5587, https://doi.org/10.1111/gcb.15161, 2020.
SEPA: Photo- and Zooplankton dataset provided by Scottish Environment Protection Agency (SEPA) collected from the Forth and Clyde, The Archive for Marine Species and Habitats Data (DASSH) [data set], https://doi.org/10.17031/b84a-7951, 2020.
SMHI: 1987–2015 Swedish Meteorological and Hydrological Institute (SMHI) Plankton Swedish West Coast, The Archive for Marine Species and Habitats Data (DASSH) [data set], https://doi.org/10.17031/1633, 2019.
Southward, A. J., Langmead, O., Hardman-Mountford, N. J., Aiken, J., Boalch, G. T., Dando, P. R., Genner, M. J., Joint, I., Kendall, M. A., Halliday, N. C., Harris, R. P., Leaper, R., Mieszkowska, N., Pingree, R. D., Richardson, A. J., Sims, D. W., Smith, T., Walne, A. W., and Hawkins, S. J.: Long-term oceanographic and ecological research in the western English Channel, Adv. Mar. Biol., 47, 1–105, https://doi.org/10.1016/S0065-2881(04)47001-1, 2004.
Tett, P., Gowen, R., Mills, D., Fernandes, T., Gilpin, L., Huxham, M., Kennington, K., Read, P., Service, M., Wilkinson, M., and Malcolm, S.: Defining and detecting undesirable disturbance in the context of marine eutrophication, Mar. Pollut. Bull., 55, 282–297, https://doi.org/10.1016/j.marpolbul.2006.08.028, 2007.
Tett, P., Carreira, C., Mills, D. K., Van Leeuwen, S., Foden, J., Bresnan, E., and Gowen, R. J.: Use of a Phytoplankton Community Index to assess the health of coastal waters, ICES J. Mar. Sci., 65, 1475–1482, https://doi.org/10.1093/icesjms/fsn161, 2008.
Tett, P., Gowen, R., Painting, S., Elliott, M., Foster, R., Mills, D., Bresnan, E., Capuzzo, E., Fernandes, T., Foden, J., Geider, R., Gilpin, L., Huxham, M., McQuatters-Gollop, A., Malcolm, S., Saux-Picart, S., Platt, T., Racault, M.-F., and Sathyendranath, M.: A framework for understanding marine ecosystem health, Mar. Ecol. Prog. Ser., 494, 1–27, https://doi.org/10.335410.3354/meps10539, 2013.
UK Pelagic Habitats Expert Group: Plankton lifeform traits master list (v4), The Archive for Marine Species and Habitats Data (DASSH) [data set], https://doi.org/10.17031/1709, 2020.
Uriarte, I., Villate, F., Iriarte, A., Fanjul, Á., Atkinson, A., and Cook, K.: Opposite phenological responses of zooplankton to climate along a latitudinal gradient through the European Shelf, ICES J. Mar. Sci., 78, 2643, https://doi.org/10.1093/icesjms/fsab008, 2021.
Utermöhl, H.: Zurvervollkommnung der quantitativen Phytoplankton Methodik, Mittl. Int. Verein Theor. Angew. Limnol., 9, 1–38, 1958.
Wasmund, N., Kownacka, J., Göbel, J., Jaanus, A., Johansen, M., Jurgensone, I., Lehtinen, S., and Powilleit, M.: The diatom/dinoflagellate index as an indicator of ecosystem changes in the Baltic Sea 1. principle and handling instruction, Front. Mar. Sci., 4, 153, https://doi.org/10.3389/FMARS.2017.00022, 2017.
Wells, M. L., Karlson, B., Wulff, A., Kudela, R., Trick, C., Asnaghi, V., Berdalet, E., Cochlan, W., Davidson, K., De Rijcke, M., Dutkiewicz, S., Hallegraeff, G., Flynn, K. J., Legrand, C., Paerl, H., Silke, J., Suikkanen, S., Thompson, P., and Trainer, V. L.: Future HAB science: Directions and challenges in a changing climate, Harmful Algae, 91, 101632, https://doi.org/10.1016/j.hal.2019.101632, 2020.
Weston, K., Greenwood, N., Fernand, L., Pearce, D. J., and Sivyer, D. B.: Environmental controls on phytoplankton community composition in the Thames plume, UK, J. Sea Res., 60, 246–254, https://doi.org/10.1016/j.seares.2008.09.003, 2008.
Widdicombe, C. E., Eloire, D., Harbour, D., Harris, R. P., and Somerfield, P. J.: Long-term phytoplankton community dynamics in the Western English Channel, J. Plankton Res., 32, 643–655, 2010.
Wilkinson, M., Dumontier, M., and Aalbersberg, I.: The FAIR Guiding Principles for scientific data management and stewardship, Sci. Data, 3, 1–9, 2016.
WoRMS Editorial Board: World Register of Marine Species, https://doi.org/10.14284/170, 2020.
Zingone, A., Harrison, P. J., Kraberg, A., Lehtinen, S., McQuatters-Gollop, A., O'Brien, T., Sun, J., and Jakobsen, H. H.: Increasing the quality, comparability and accessibility of phytoplankton species composition time-series data, Estuar. Coast. Shelf S., 162, 151–160, https://doi.org/10.1016/j.ecss.2015.05.024, 2015.
lifeforms, according to shared biological traits. This tool has been designed to make complex plankton datasets accessible and meaningful for policy, public interest, and scientific discovery.