the Creative Commons Attribution 4.0 License.
the Creative Commons Attribution 4.0 License.
 | 25 Nov 2021
The Southern Ocean Radiolarian (SO-RAD) dataset: a new compilation of modern radiolarian census data
Kelly-Anne Lawler
Giuseppe Cortese
Matthieu Civel-Mazens
Helen Bostock
Xavier Crosta
Amy Leventer
Vikki Lowe
John Rogers
Leanne K. Armand
Radiolarians (holoplanktonic protozoa) preserved in marine sediments are commonly used as palaeoclimate proxies for reconstructing past Southern Ocean environments. Generating reconstructions of past climate based on microfossil abundances, such as radiolarians, requires a spatially and environmentally comprehensive reference dataset of modern census counts. The Southern Ocean Radiolarian (SO-RAD) dataset includes census counts for 238 radiolarian taxa from 228 surface sediment samples located in the Atlantic, Indian, and southwest Pacific sectors of the Southern Ocean. This compilation is the largest radiolarian census dataset derived from surface sediment samples in the Southern Ocean. The SO-RAD dataset may be used as a reference dataset for palaeoceanographic reconstructions, or for studying modern radiolarian biogeography and species diversity. As well as describing the data collection and collation, we include recommendations and guidelines for cleaning and subsetting the data for users unfamiliar with the procedures typically used by the radiolarian community. The SO-RAD dataset is available to download from https://doi.org/10.1594/PANGAEA.929903 (Lawler et al., 2021).
- Article
(3854 KB) - Full-text XML
-
Supplement
(111 KB) - BibTeX
- EndNote


The Southern Ocean is an important part of the global climate system as a major hub of oceanic circulation and nutrient redistribution. Future changes to its physical, chemical, and biological properties will therefore have global climate implications. Palaeoceanographic reconstructions of the Southern Ocean reveal its response to past climate and how it might respond to future climate change. Marine microfossils are commonly used as climate proxies to obtain such reconstructions (Yasuhara et al., 2020). Plankton distribution and abundance are related to the oceanic conditions prevalent in the water masses where these organisms live. After death, their skeletons settle to the ocean floor, becoming part of the sedimentary record. In the Southern Ocean, two main siliceous microfossil groups, diatoms and radiolarians, have been used to determine past environmental conditions such as ocean temperature (Cortese and Abelmann, 2002; Esper and Gersonde, 2014b; Panitz et al., 2015) and sea-ice coverage (Bianchi and Gersonde, 2004; Crosta et al., 2004; Gersonde et al., 2005; Esper and Gersonde, 2014a; Ferry et al., 2015).
Radiolarians are unicellular, eukaryotic marine microzooplankton, generally ranging in size from 30–300 µm, that inhabit all depths throughout the world's oceans (Lazarus, 2005). Belonging to the supergroup Rhizaria, Radiolaria consist of 600–800 extant species in five orders: Acantharia, Taxopodia, and the polycystine orders Collodaria, Nassellaria, and Spumellaria (Suzuki and Not, 2015; Boltovskoy et al., 2017). Radiolarians belonging to the polycystine orders are the most likely to be found in marine sediments and are therefore the focus of most micropaleontological studies (Lazarus, 2005; Suzuki and Not, 2015). Radiolaria feed on diatoms, other small algae, and bacteria, and some also have photosynthetic algal symbionts (Lazarus, 2005; Boltovskoy et al., 2017). Little is known about the radiolarian life cycle as they are notoriously difficult to culture (Lazarus, 2005; Suzuki and Not, 2015). In the Southern Ocean, radiolarian productivity is highest (up to 90 % of annual flux) during the austral summer (Abelmann and Gersonde, 1991; Abelmann, 1992). Unlike diatoms, radiolarians do not reach maximum biomass in Southern Ocean surface waters, but rather they peak between 100–400 m water depth south of 45∘ S (Abelmann and Gowing, 1997; Boltovskoy, 2017). Lazarus et al. (2021) provide an extensive and up-to-date review on radiolarian biology as well as their distribution in both the water column and sediments.
Siliceous microfossils, particularly diatoms, are useful for paleoclimate reconstructions at high latitudes and in deep-sea regions where carbonate microfossils are generally not well preserved (Crosta et al., 2005; Gersonde et al., 2005). After diatoms, radiolarians are the second largest source of biogenic silica in marine sediments (Anderson, 2019). Fossil radiolarians have long been used as a palaeo-proxy for Southern Ocean sea-surface temperature (Lozano and Hays, 1976; Cortese and Abelmann, 2002; Cortese et al., 2007; Rogers and De Deckker, 2011; Panitz et al., 2015) and, more recently, have been used for reconstructing subsurface ocean temperature (Hernández-Almeida et al., 2020; Civel-Mazens et al., 2021a, b). Such palaeoceanographic reconstructions rely on a spatially and environmentally comprehensive radiolarian reference dataset.
In this paper we present, for the first time, the Southern Ocean Radiolarian (SO-RAD) dataset consisting of census data for 238 radiolarian taxa from 228 surface sediment samples. We illustrate the spatial and environmental coverage of the dataset, briefly describe the distribution and abundance of taxa, and discuss how the dataset might be cleaned and/or split into subsets prior to analysis. The SO-RAD dataset can be used as a reference dataset for palaeoceanographic reconstructions and to explore new parameters for estimation, as stand-alone data to assist studies in the biogeography and diversity of modern Southern Ocean radiolarian species, or for the development of new statistical methods in microfossil analysis.
2.1 Southern Ocean Radiolarian dataset
The Southern Ocean Radiolarian (SO-RAD) dataset includes census counts for 238 taxa/taxonomic groups from 228 surface sediment samples located in the Atlantic, Indian, and southwest Pacific sectors of the Southern Ocean (Fig. 1). This compilation is the largest dataset available for radiolarian-based palaeoenvironmental reconstructions constrained to the Southern Ocean. Sector-specific datasets have been previously published as follows: Atlantic sector (Abelmann et al., 1999; Cortese and Abelmann, 2002), southwest Pacific sector (Cortese and Prebble, 2015), and Indian sector (Rogers and De Deckker, 2007). These existing data, after a recount of the Indian sector sites to ensure taxonomic consistency, have been compiled as one dataset, which additionally includes new census data from 26 previously unpublished sites in the Ross Sea and the Indian sector of the Southern Ocean. Sediment coring in the Southern Ocean, particularly in areas close to the ice edge where sea-ice coverage varies from season to season, is expensive and difficult to plan. The SO-RAD dataset is, thus, the result of cooperative international partnerships based on decades of oceanographic voyages undertaken by scientists from many institutions and nations. In a compilation such as the SO-RAD dataset, sample locations are not chosen according to uniform spatial coverage criteria, but rather dictated by the availability of, and access to, radiolarian-bearing surface sediment samples.
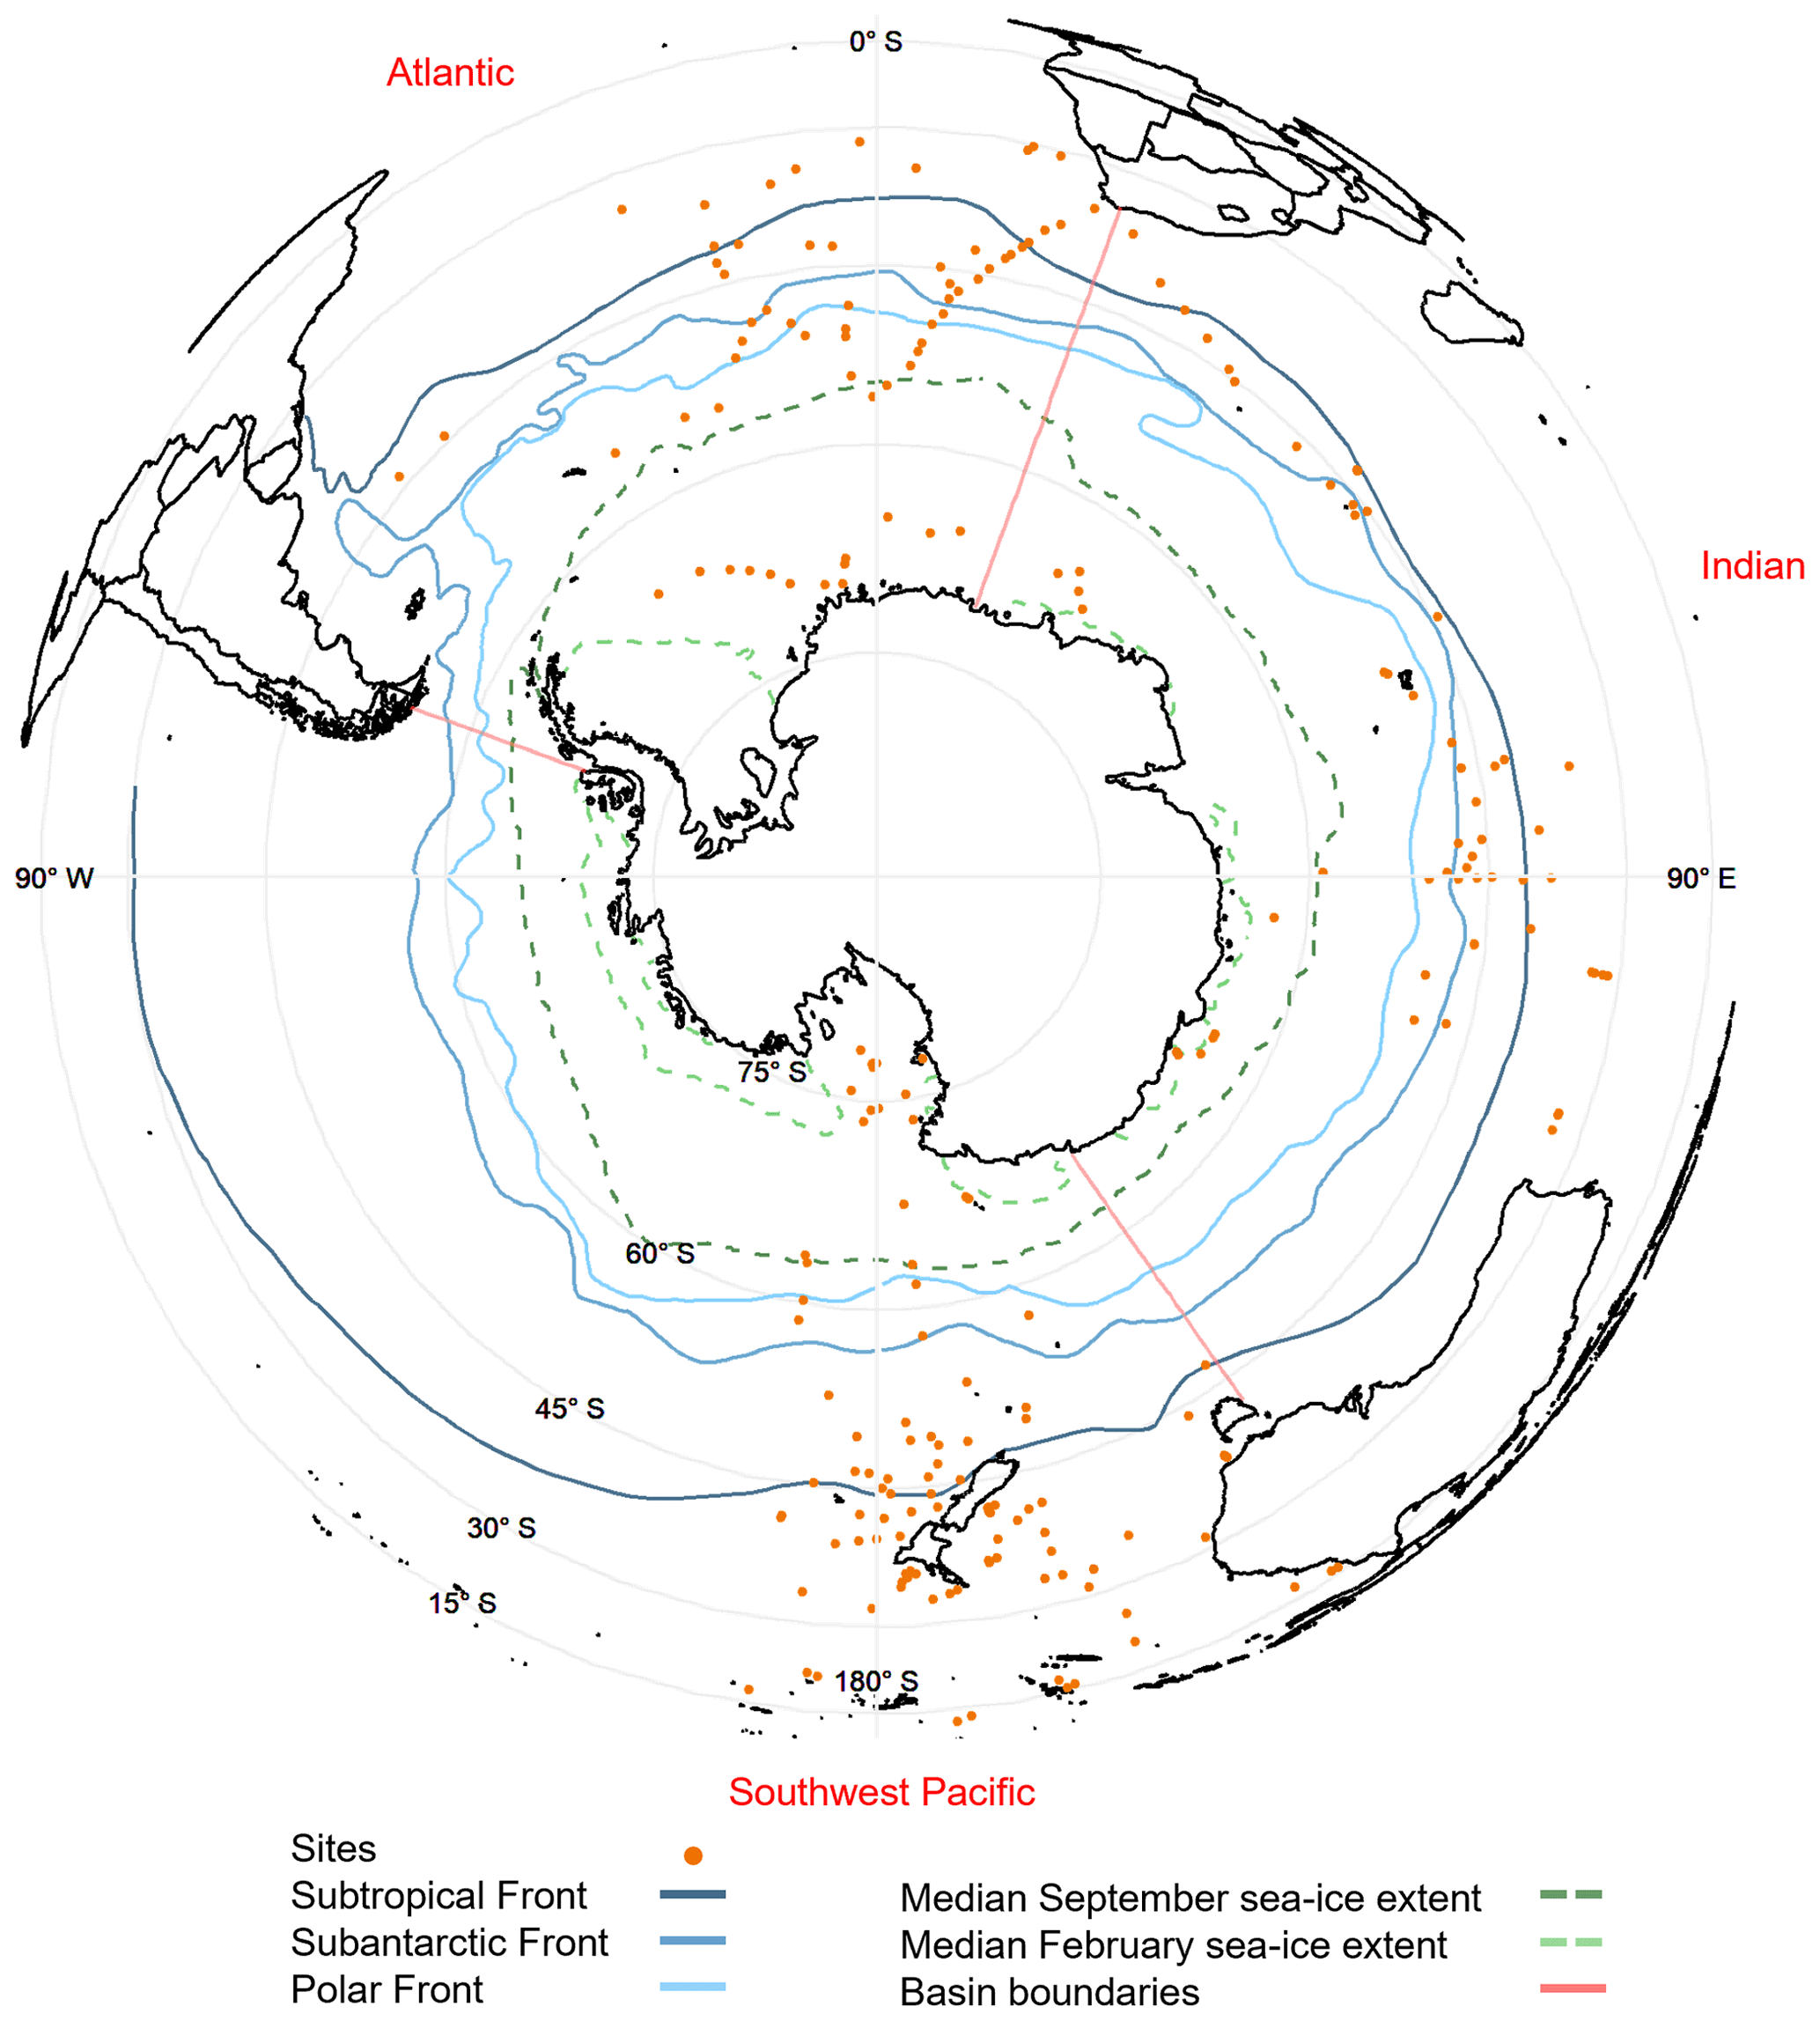
Figure 1Surface sediment sites included in the SO-RAD database shown with (a) Southern Ocean frontal boundaries (Orsi et al., 1995) and ocean basin boundaries (WOCE Data Products Committee, 2002) and (b) the 1981–2010 median sea-ice extent for February (dashed line) and September (solid line) (Fetterer et al., 2017).
2.1.1 Census sources and handling protocols
In bringing together census data for this global dataset from various sources, the following data limitations and handling procedures are detailed.
Census data from the Atlantic sector include radiolarian counts from 64 sites. Data from 44 sites were published by Abelmann et al. (1999), and 20 sites were subsequently added and published in Cortese and Abelmann (2002). Sites from Abelmann et al. (1999) and Cortese and Abelmann (2002) do not include the full counts of all taxa observed at each site; rather they include only a selection of the taxa observed. Taxa were excluded from these sites prior to their original publication based on criteria outlined in Abelmann et al. (1999) such as their relative abundances (i.e. excluding rare taxa, with the threshold set at 2 %), depth preferences, and clarity of identification. These sites have been included in the dataset, despite containing counts for only a percentage of the taxa observed, because they contain valuable information about species useful for palaeo-reconstructions and for single-species studies.
Radiolarian census data from 87 sites located in the southwest Pacific sector published by Cortese and Prebble (2015) contained full census counts and required no further treatment.
The Indian Ocean sector includes census data from 41 sites first published by Rogers and De Deckker (2007). The slides from these sites were recounted to ensure consistency with the taxonomy of the SO-RAD compilation presented here (described in further detail in Sect. 2.1.3). Also located in the Indian Ocean sector are census data from four sites from Abelmann et al. (1999) and six from Cortese and Abelmann (2002).
We also include radiolarian census data from 26 previously unpublished sites. These include counts from 14 archive samples from sites in the Ross Sea, retrieved during multiple expeditions by the National Institute of Water and Atmospheric Research (NIWA) and its predecessor New Zealand Oceanographic Institute; five sites near the Sabrina Coast, East Antarctica (three retrieved during the 2017 RV Investigator voyage IN2017-V01 (Armand et al., 2018), two during the 2014 RVIB Nathaniel B. Palmer voyage NBP-1402 (Leventer and Science Party, 2014)); one previously unpublished site in the southwest Pacific sector; and a total of six samples retrieved during the MD185 INDIEN-SUD1 (Mazaud and Michel, 2011), MD189 INDIEN-SUD2 (Mazaud and Michel, 2012), and MD218 CROTALE (Crosta, 2019) voyages.
2.1.2 Slide preparation and microscopy
In general, radiolarian slides were prepared using a similar method as described in Cortese and Prebble (2015). Sediment samples were dried, weighed, placed in beakers with 100 mL of distilled water, and heated to 60–70 ∘C on a hotplate. Organic matter was removed by adding a mixture of diluted hydrogen peroxide (ca. 20 % concentration) and sodium hexametaphosphate (Calgon™) and left to react for around 1 h. To remove carbonate, 10 % hydrochloric acid was added to the beaker. On completion of the reaction, usually within ca. 30 min, the content of the beaker was washed through a sieve. The residue was placed in a beaker or storage bottle with distilled water and stirred into suspension, and a pipette was used to place a few drops of it on a coverslip. After the cover slip had dried on a hotplate, it was mounted on a slide by using Canada balsam or Norland™ Optical Adhesive (NOA61) as a mounting medium. Finally, the mounted slide was placed either on a hotplate again for ca. 10–20 min to allow the Canada balsam to harden or under ultraviolet light for the NOA61 to cure.
Note that the specific chemical separation steps may differ between authors, as may the mesh size used. A mesh size of 40–45 µm has been used with the exception of Rogers and De Deckker (2007), who used a 63 µm mesh size. For detailed methods on slide preparation for previously published data, refer to the references listed in Sect. 2.1.1.
Radiolarian census counts were determined using transmitted-light microscopy at 100–400× magnification. The number of individuals counted per site ranges from 44 to 706, with a median of 381.
2.1.3 Taxonomy
Species identification is mainly based on the taxonomic concepts of Petrushevskaya (1967, 1971), Nigrini and Moore (1979), and Boltovskoy (1998). This was supplemented by consulting Lazarus et al. (2015), the online dataset at https://www.radiolaria.org/ (last access: 27 September 2019) with a final check on currently valid taxonomic concepts according to the World Register of Marine Species (WoRMS Editorial Board, 2020). Some naming adjustments were made to taxa in the previously published datasets where more recent, accepted names were available (Sect. S1 in the Supplement). If individuals could not be identified at the species level, they were assigned to a higher rank taxonomic group e.g., from genus level identifications to those identified only as belonging to the Nassellaria or Spumellaria orders.
A total of 238 radiolarian taxa have been recognised. Radiolarian taxa identified in SO-RAD are from the super-class Polycystinea, which is divided into three orders, Nassellaria, Spumellaria, and Collodaria. When present, phaeodarian species were identified, counted, and recorded. The binomial names for each of the taxa included in the SO-RAD dataset are listed in Sect. S2.
2.2 Complementary data
To spatially categorise the dataset, each site was assigned to one of four zones: the Antarctic Zone (AZ; south of the Antarctic Polar Front), Polar Frontal Zone (PFZ; between the Polar Front and the Subantarctic Front), Subantarctic Zone (SAZ; between the Subantarctic Front and the Subtropical Front), or Subtropical Zone (STZ; north of the Subtropical Front), based on frontal boundaries delineated by Orsi et al. (1995). Sites were also assigned to one of three sectors, the Atlantic, Indian, or southwest Pacific, based on the longitudinal boundaries used by the World Ocean Circulation Experiment (WOCE Data Products Committee, 2002).
To illustrate the environmental coverage of the dataset, austral summer (January–March) observations of temperature (∘C), salinity (psu), and dissolved oxygen (µmol kg−1), silicate (µmol kg−1), nitrate (µmol kg−1), and phosphate (µmol kg−1) were extracted from the World Ocean Atlas 2018 (Locarnini et al., 2018; Garcia et al., 2019a, b; Zweng et al., 2019) using Ocean Data View software (Schlitzer, 2020). These data represent a collation of gridded data from 1955–2017, and, given that radiolarian abundances are highest below the surface, we elected to use data reported at 100 m depth. Future users of the dataset should select the environmental variables, water depths, and data source that best suit their needs. The median sea-ice extent boundaries from 1981–2010 representing minimum (February) and maximum (September) sea-ice extents were retrieved from the National Snow and Ice Data Center repository (Fetterer et al., 2017). These monthly sea-ice extent boundaries are based on >15 % sea-ice concentration.
2.3 Structure of the SO-RAD dataset
The SO-RAD dataset consists of 228 rows (plus header rows) and 251 columns (Table 1). Each row contains data for one site from which a surface sediment sample was obtained. Columns 1–13 contain information relating to the site or sample, while columns 14–251 are the radiolarian taxa observed (one taxon per column). The SO-RAD dataset is available to download from https://doi.org/10.1594/PANGAEA.929903 (Lawler et al., 2021).
2.4 Software
All figures and summary statistics in this paper were generated using R statistical software (R core team, 2020) and the packages mapproj (McIlroy, 2020), maps (Becker, 2018), orsifronts (Sumner, 2015), rgdal (Bivand et al., 2020), and tidyverse (Wickham et al., 2019).
3.1 Spatial distribution of data
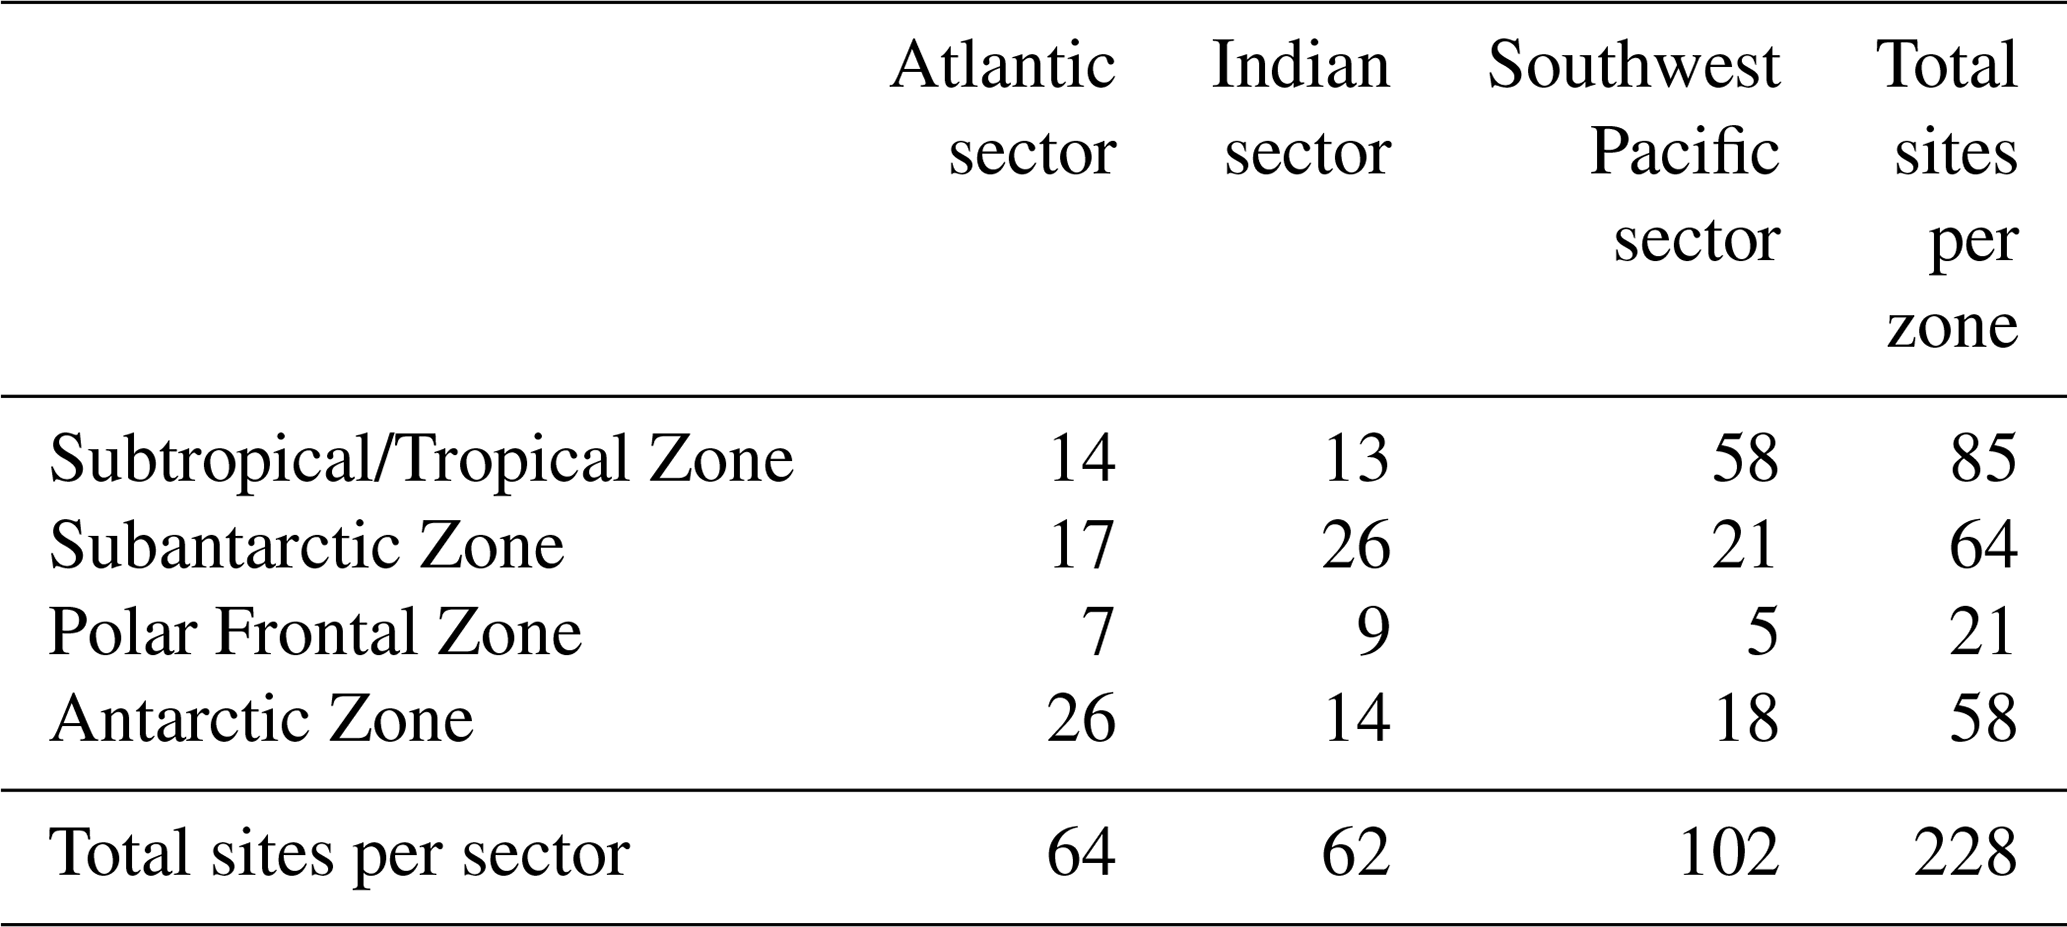
The SO-RAD dataset is the most comprehensive Southern Ocean radiolarian surface sediment dataset available. However, the spatial coverage is still uneven with, for example, more Antarctic Zone sites in the Atlantic sector than in the Indian and southwest Pacific sectors and more Subtropical Zone sites in the southwest Pacific sector (Table 2). The latter sector has better overall coverage than the Atlantic and Indian sectors; nevertheless there is a paucity of sites from the Pacific Ocean east of the Ross Sea. Sites represent locations covering a large water depth gradient, from the Antarctic continental shelf (235 m b.s.l.) to the abyssal plain (5883 m b.s.l.).
Table 2Number of sites located in each zone and sector of the Southern Ocean.
3.2 Environmental distribution/coverage of data
Sites included in the SO-RAD dataset are representative of a broad range of environmental conditions. Temperature values range from −1.8 to 26.4 ∘C, salinity from 33.8 to 35.7 psu, and dissolved oxygen from 180.3 to 337.9 µmol kg−1. The SO-RAD dataset also includes sites representing a large range of nutrient concentrations: nitrate (0.1–31.4 µmol kg−1), phosphate (0.1–2.2 µmol kg−1), and silicate (0.6–89.3 µmol kg−1) (Figs. 2 and 3). Forty-three sites lie on, or within, the median September sea-ice extent boundary; however no sites lie within the median February sea-ice extent boundary. Some sites that are slightly north of the median September sea-ice extent boundary may be affected by sea ice in certain years.
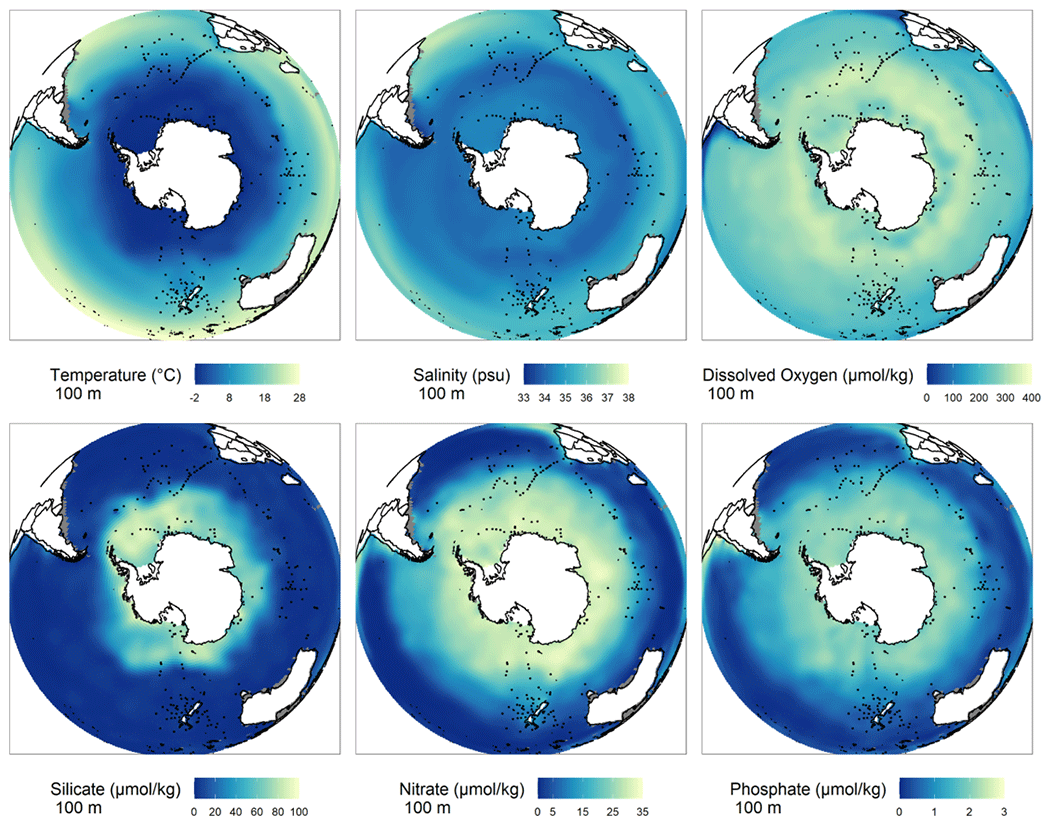
Figure 2Locations of sites (black dots) and the six environmental variables at 100 m water depth used to demonstrate the environmental coverage of the SO-RAD dataset (data source: Locarnini et al., 2018; Garcia et al., 2019a, b; Zweng et al., 2019).
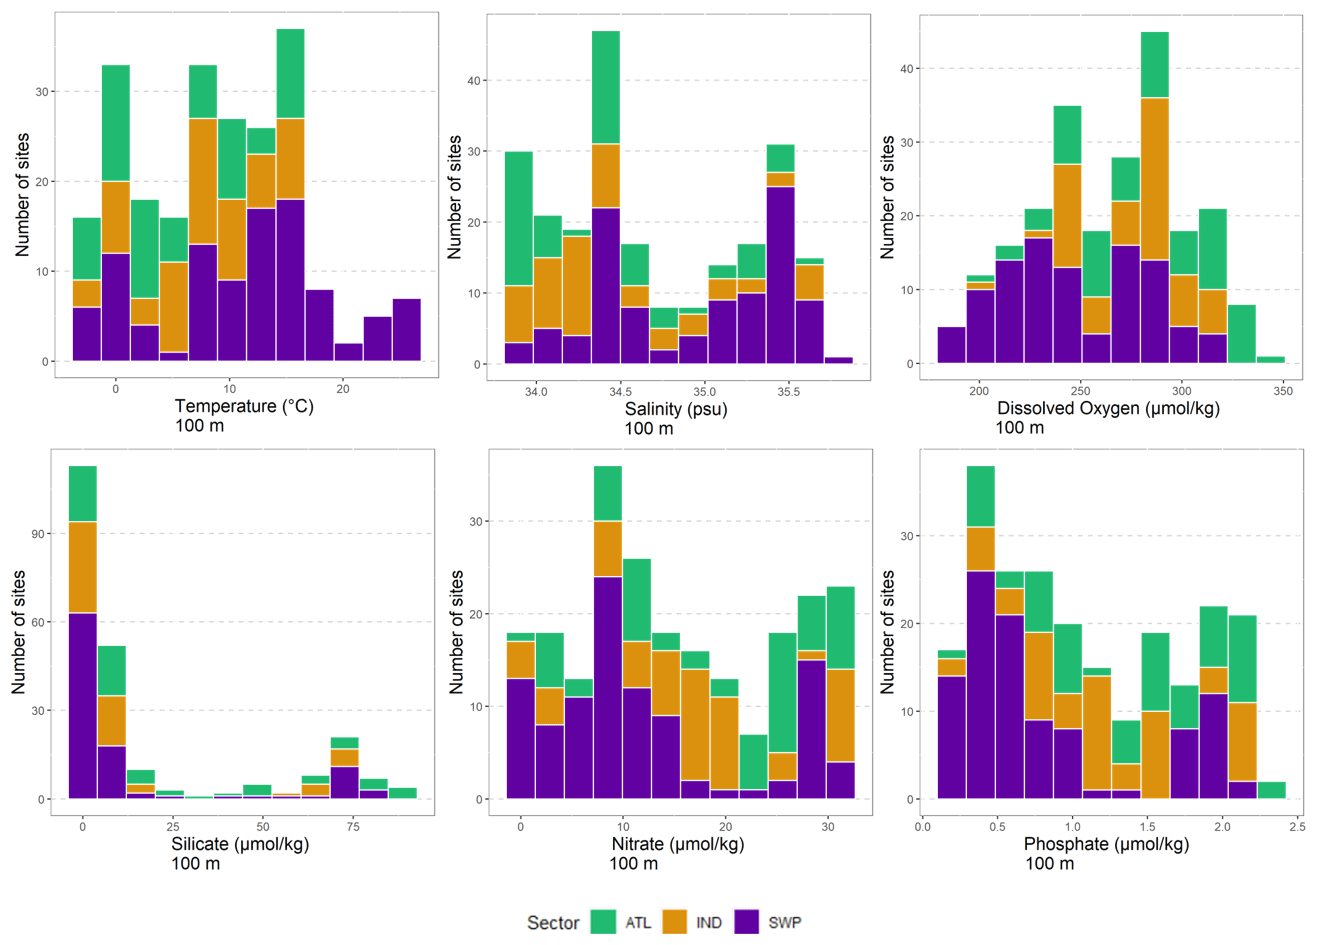
Figure 3Distribution of sites across observed environmental variables at 100 m water depth (Locarnini et al., 2018; Garcia et al., 2019a, b; Zweng et al., 2019) identified by sector – Atlantic Ocean sector (ATL, green), Indian Ocean sector (IND, orange), and southwest Pacific sector (SWP, purple).
3.3 Radiolarian distribution and abundance
The SO-RAD dataset documents 238 identified taxa characterised by subspecies/species level identifications through to individuals identified only as belonging to the Nassellaria or Spumellaria orders.
Radiolarian species (i.e. not including taxa of genus level and above or taxa that had not been formally described) with the highest average relative abundances were Antarctissa denticulata and Antarctissa strelkovi. These were the only species with average relative abundances >10 %. The Antarctissa genus (consisting of A. denticulata, A. strelkovi, and Antarctissa spp.) is the most abundant radiolarian genus in the Southern Ocean and was observed at 146 sites. It has a relative abundance of >40 % at several sites in the SO-RAD dataset (n=29), with some sites in the Ross Sea consisting of >80 % Antarctissa species.
Other well-distributed and abundant species were Tetrapyle octacantha/stenozona (average relative abundance =4.3 %, observed at 161 sites), Cenosphaera cristata (3.75 %, 123 sites), Cycladophora bicornis (3.72 %, 165 sites), Lithomelissa setosa (3.52 %, 77 sites), Lithomelissa sp. A (3.4 %, 95 sites), Phorticium clevei (3.24 %, 129 sites), and Lithelius minor (3.19 %, 170 sites) (Fig. 4). Only one other species, Sphaerozoum punctatum (3.28 %), had an average relative abundance >3 %; however it was observed at only nine sites.
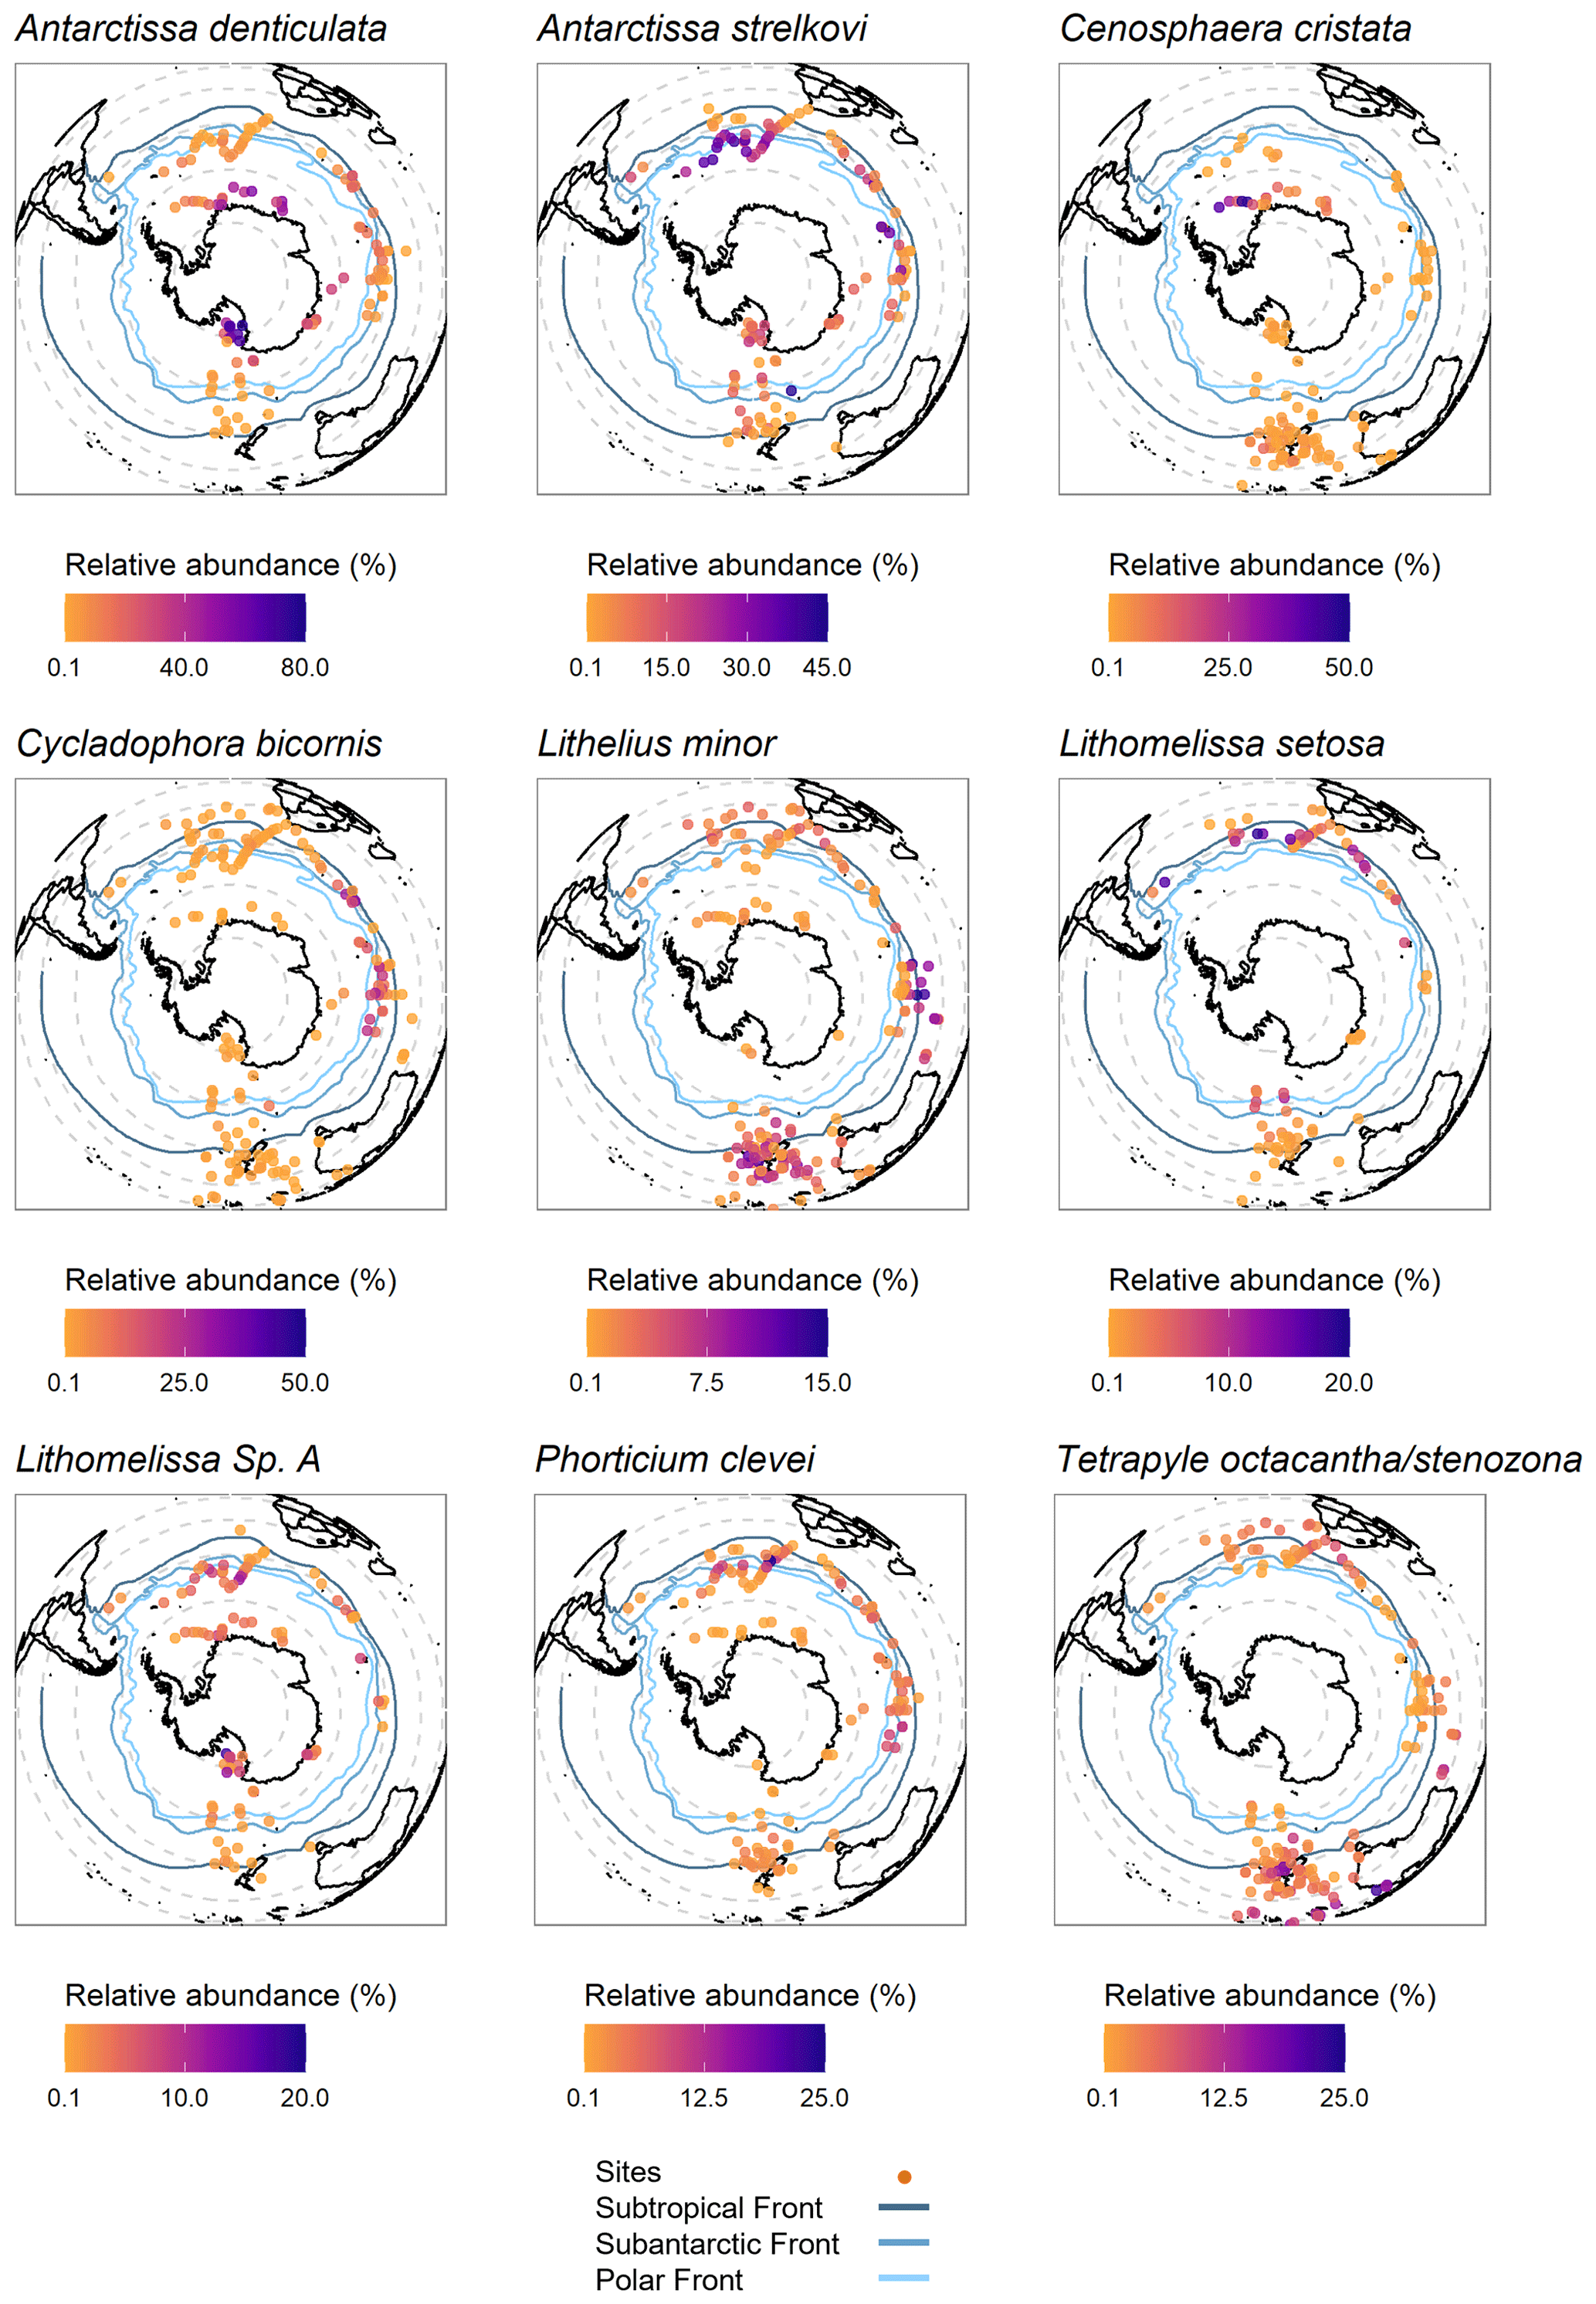
Figure 4Distribution maps for the nine most abundant and widely distributed radiolarian taxa. Ocean front boundaries from Orsi et al. (1995).
Thirty-eight taxa were found at more than 100 sites. Spongopyle osculosa was the most widely distributed species having been observed at 200 sites.
There were 71 taxa (30 % of the total number of taxa) in the SO-RAD dataset considered to be “rare”; i.e. they had a maximum relative abundance <1 % and/or were observed at only one site. If the maximum relative abundance threshold for a rare categorisation was increased to <2 %, then 123 taxa (52 %) would be considered rare.
While the SO-RAD dataset is predominantly a Southern Ocean dataset, there are several sites located considerably north of the Subtropical Front (the northern boundary of the Southern Ocean). One of the anticipated uses of the SO-RAD dataset is as a reference dataset for radiolarian-based palaeoenvironmental reconstructions from sediment cores retrieved from the Southern Ocean and subtropical Southern Hemisphere. One of the key requirements of a reference dataset is that it should cover a wide range of environmental conditions. It has been demonstrated elsewhere that radiolarian assemblages from temperate latitudes, such as offshore New Zealand, show large and distinct changes over glacial and interglacial periods (e.g., Lüer et al., 2009). The broad coverage of the SO-RAD modern reference dataset facilitates identification of future faunal shifts and imparts robustness to the environmental variable estimates derived from them. In a broader sense, the large spatial and environmental coverage of this dataset can aid in refining palaeoenvironmental reconstructions using radiolarian assemblages from periods that were substantially cooler or warmer than the present. The SO-RAD database is a valuable resource for exploring how physical, biological, and chemical characteristics of the Southern Ocean influence modern radiolarian biogeography, ecology, and species diversity. This ecological information and species diversity may provide key insights into the past palaeoceanography. The SO-RAD dataset also holds potential for the exploration of sea-ice coverage and concentration as a causal mechanism underlying the abundance patterns for some of the species occurring in the seasonally ice-covered zone. It may be possible to establish surface-dwelling radiolarian species as sea-ice proxies, as routinely done for diatom species, such as Fragilariopsis curta/cylindrus and F. obliquecostata (Gersonde and Zielinski, 2000; Armand et al., 2005), and in diatom-based transfer functions (Crosta et al., 1998; Esper and Gersonde, 2014a; Ferry et al., 2015). Radiolarian species inhabiting sub-surface and intermediate depths may also be affected by sea-ice-related changes deep in the water column, such as salinity and stratification changes due to brine rejection during sea-ice formation, and act as a palaeo-indicator of past sea-ice presence. This should be explored in the future.
4.1 General limitations of microfossil reference datasets
When constructing any reference dataset based on surface sediment samples, there are possible sources of error and assumptions that apply. Reproducibility of species abundance data can be affected by differing taxonomic concepts held by the analysts. We have minimised this potential source of error by including counts by radiolarists who regularly collaborate on taxonomic concepts. Furthermore, the vast majority of the samples included here have been counted by only one of us (Giuseppe Cortese). As more samples are added to the SO-RAD dataset, only samples for which quality control of the census data is possible will be included in the database in an effort to minimise this source of error.
The species-level taxonomy of all microfossil groups has been based on phenotype/morphology, and not on molecular biology. Identification can be difficult when there are only minor differences in morphology between species, or where there are fragments of an individual, or additionally, where a juvenile specimen has been encountered. In such instances individual radiolarians have been assigned to higher-rank taxonomic categories, i.e. genus or family rather than species or subspecies.
When using surface sediment samples as a modern analogue record, it is assumed that the fossil assemblages found within those sediments are representative of modern assemblages that live in the water column above. This is problematic for two reasons. The first is that the coring device can affect the quality/age of the surface sediment sample. For example, using a multi-corer allows for easier observation, and intact retrieval of, the surface sediment–bottom water interface (Barnett et al., 1986). With other coring devices it is not possible to observe if the uppermost sediment layer is the true surface sediment sample, or if the top of the coring device was buried beneath the surface. This means the “core top” sample may be from several centimetres below the surface and is not the most recently deposited sediment. Some of these sediment samples have been radiocarbon dated using planktic foraminifera in the same samples (Cortese and Prebble, 2015), but this is not possible with all samples, particularly those that have no carbonate present. Secondly, even when the sediment sample is truly from the surface, the transportation or reworking of sediment, or preferential dissolution of species, means that the assemblages observed in the sediment may not be truly representative of the assemblages that lived in the water column above.
4.2 Cleaning and subsetting the SO-RAD dataset based on sites
Where possible, we have presented census counts in their complete form to cater for a variety of analyses as well as the development of novel techniques for radiolarian data analysis. We have opted not to present a “reconstruction ready” dataset as we believe the full dataset is useful for more than just palaeoenvironmental reconstructions. However, for most analyses the dataset would not be used in its raw form. Here we offer practical suggestions for preparing and producing a subset from this dataset based on practices utilised by radiolarists in the past.
4.2.1 Quality control of sites
Users of the dataset may wish to extract a subset of sites from the SO-RAD dataset for quality control reasons. For example, placing a lower bound on the total number of individuals counted per site may depend on which species are of interest to the user. In general, lower total counts are sufficient when only the dominant species will be used in the analysis, while higher total counts are needed when a user is interested in species comprising as little as 1 % of the population. For example, there is a 30 % probability of failing to observe a species that comprises 1 % of the population when counting 100 individuals but, by increasing the count to 300 individuals, this probability is reduced to less than 1 % (Fatela and Taborda, 2002).
Sites in the Atlantic sector, as well as some in the Indian sector, did not have full census counts available, and therefore a percentage of the assemblage is recorded as “Other radiolarians”. Rules for the exclusion of species at these sites can be found in Abelmann et al. (1999).
The coring apparatus used to retrieve a core can affect the quality of the sample collected, as well as its age. In most studies, the latter is usually assumed to be modern, but this can only be confirmed by radiocarbon dating of each surface sediment sample. Of the sites included in the SO-RAD dataset, the only radiocarbon-dated samples are those reported in Cortese and Prebble (2015). Where known, the apparatus used to retrieve the core has been listed in the “Sample method” column to facilitate the extraction of a data subset based on this variable.
4.2.2 Ensuring spatial–environmental coverage is suitable
Palaeoenvironmental reconstructions require a reference dataset that provides appropriate spatial and environmental coverage. Reference sites may be included based on regional needs, e.g., by sub-setting the data based on latitudinal and/or longitudinal boundaries, based on sector or oceanographic zone, or based on certain values of the environmental variable of interest.
4.3 Cleaning and sub-setting the SO-RAD dataset based on taxa
Here we outline some practices to consider when refining the SO-RAD dataset for use as a reference dataset in palaeoceanographic reconstructions. These include selecting only taxa that can be clearly identified and with clear taxonomic descriptions, selecting appropriate taxa for the depth level of the reconstruction, grouping species/subspecies with similar environmental affinities into higher-order groupings, and removing rare species.
4.3.1 Removing questionable taxonomic groupings
If the focus of a study is on environmental reconstructions, the signal-to-noise ratio in radiolarian census data can be increased by removing broad, often higher-order, counting categories having no clear taxonomic boundaries/definitions, and hence questionable environmental significance. The inclusion of unidentifiable individuals in higher-order taxonomic groupings in the SO-RAD dataset ensures the correct calculation of species relative abundances; however these taxa are not useful for analyses that rely on genus- or species-level data and might be removed.
Broad, higher-order categories that can be taken into consideration for removal from the SO-RAD dataset prior to analysis include the indeterminate Nassellaria and Spumellaria taxonomic groups, along with taxa including, but not necessarily limited to, Litheliidae/Pyloniidae, Spongotrochus/Spongopyle sp., Trissocyclidae, and the Zygocircus productus group.
Some Phaeodarea taxa have been included in the census counts. Studies focusing only on polycystine radiolarians should remove the phaeodarians Lirella melo and all species belonging to the Euphysetta and Protocystis genera.
4.3.2 Grouping taxa
Radiolarian reference datasets often contain taxonomic groupings made up of species/subspecies grouped at the genus level, or of unrelated species with the same environmental affinities that may be routinely confused for one another during the counting procedure (e.g., Cortese and Prebble, 2015; Matsuzaki and Itaki, 2017). Grouping species is especially relevant for less abundant taxa, and for those with a particularly complex taxonomy. Grouping species and/or subspecies that have similar distributions according to water column and modern sediment sampling can increase the statistical weight (and thus their chances of inclusion in a working reference dataset) of rare species that are known to carry a strong environmental signal. For example, Collosphaeridae is a taxonomic group that can be composed of several to tens of species that are most abundant at low latitudes (Cortese and Prebble, 2015; Biard et al., 2016). At high latitudes, their presence alone, even in very small numbers, may be indicative of warmer-than-usual conditions. It is, therefore, useful to group these rare species so that their signal is not lost when removing rare species prior to analysis. Grouping species, while obviously leading to the loss of species-level information, also increases inter-comparability of results between different researchers/teams, as higher-level categories are generally more accommodating and less prone to identification mistakes based on fine skeletal differences. Recommended groupings are listed in Sect. S3 and are adapted from Cortese and Prebble (2015).
4.3.3 Removing rare taxa
Previous radiolarian-based palaeoenvironmental reconstructions and biogeographical studies have removed rare taxa using one, or both, of the following methods: (1) removing species observed at fewer than a certain number of sites (e.g., Abelmann et al., 1999; Boltovskoy and Correa, 2016) and/or (2) removing species based on their low abundances (e.g. <1 %). In the latter situation, species were removed from previous datasets when their maximum relative abundance did not exceed 1 % (Boltovskoy, 1987; Cortese and Prebble, 2015) or 2 % (Lozano and Hays, 1976; Abelmann et al., 1999) or had fewer than a certain number of individuals (Rogers and De Deckker, 2007). Conversely, some studies (e.g. Hernández-Almeida et al., 2020) elect not to remove rare species.
4.3.4 Removing taxa that do not inhabit the depth being reconstructed
As radiolarians are present throughout the water column, a surface sediment sample contains a collection of taxa that, while living, do not inhabit the same depth but eventually end up in the same surface sediment sample. It is possible to limit the reference dataset to taxa that are known to live at the depth for which a specific environmental variable is being reconstructed. Examples of studies where the authors have used a subset of taxa based on their vertical distributions include Abelmann et al. (1999), Cortese and Abelmann (2002), and Matsuzaki and Itaki (2017).
4.4 Update strategy and future plans for the SO-RAD dataset
There are noticeable gaps in the spatial coverage of the SO-RAD dataset, in particular the area between the Ross Sea and the Antarctic Peninsula, comprising a vast part of the high-latitude south Pacific Ocean, and between Australia and the Antarctic continent in the Indian Ocean. The intention of the authors is that the SO-RAD dataset will constantly evolve as more surface sediment samples, collected during upcoming oceanographic expeditions, become available for census counts.
The SO-RAD dataset is available to download from https://doi.org/10.1594/PANGAEA.929903 (Lawler et al., 2021).
The SO-RAD dataset contains census data for 238 radiolarian taxa from 228 Southern Ocean sites. The dataset is the most comprehensive Southern Ocean radiolarian census dataset to date. We have provided a detailed description of the methods used to build the dataset, along with an overview of the spatial and taxonomic coverage of the data. The SO-RAD dataset may be used as a reference dataset for palaeoenvironmental reconstructions, or in studies of modern radiolarian biogeography, ecology, and species diversity.
KAL was responsible for the data curation (along with GC), formal analysis, investigation (along with GC and MCM), data visualisation, and preparation of the original draft. GC conceptualised and acquired funding for this study. Resources (access to samples) were provided by GC, HB, XC, AL, JR, and LKA. GC and LKA supervised this project. All authors contributed to the review and editing of the manuscript.
The contact author has declared that neither they nor their co-authors have any competing interests.
Publisher’s note: Copernicus Publications remains neutral with regard to jurisdictional claims in published maps and institutional affiliations.
A series of national and international core repositories provided the surface sample material used in this study. These include the core repository at the National Institute of Water and Atmospheric Research (NIWA, New Zealand); three of IODP’s (International Ocean Discovery Program) core repository centres: Kochi Core Center (jointly managed by Kochi University and JAMSTEC, the Japan Agency for Marine-Earth Science and Technology), the IODPWest Coast repository at Scripps Institution of Oceanography, and the IODP Gulf Coast Repository at Texas A&M University; the Oregon State University Marine Geology Repository located at the College of Earth, Ocean, and Atmospheric Sciences; the Woods Hole Oceanographic Institution core repository; the French EPOC and LSCE core repositories; the Alfred Wegener Institute for Polar and Marine Research (AWI) core facility in Bremerhaven; and the IfM/GEOMAR core repository in Kiel. The help of these repositories, and the funding agencies providing support to them, is hereby greatly appreciated. The authors wish to thank the crews and scientists that collected the sediment core material used in this project, as well as Sonja Penafiel-Bermudez (GNS, Lower Hutt), Ute Bock (AWI, Bremerhaven), and Natalie Kozlowski (Colgate University) for preparing the microscopic slides.
Samples not previously published were collected through the listed missions and supported by the following research support bodies.
For Sabrina Coast material, we thank the Marine National Facility (MNF) IN2017-V01 scientific party led by the chief scientists Leanne K. Armand and Philip E. O'Brien, CSIRO MNF support staff, and ASP crew members led by the captain Michael Watson on board the RV Investigator. We also thank the scientific party, ASC support staff, and ECO crew on RV/IB Nathaniel B. Palmer cruise NBP1402.
Ross Sea material was supplied from the NIWA surface sediment and core repository and has been collected on numerous research voyages by NIWA and its predecessor NZOI since the 1950s. The samples have been collected by a range of different researchers on research voyages on a number of different vessels, funded by the New Zealand government through various funding programmes over the last 70 years.
We thank Alain Mazaud and Elisabeth Michel for providing access to cores MD11-3353 and MD12-3396CQ. We are also grateful to the crews and scientists on board R/V Marion Dufresne II during the MD185 and MD189 INDIEN-SUD 1 and 2 and MD218 CROTALE (https://doi.org/10.17600/18000886) expeditions. We thank the Institut Polaire Français, the Flotte Océanographique Française, and the EquipEx CLIMCOR (ANR-11-EQPX-0009-CLIMCOR) for their logistical and technical support.
We thank Demetrio Boltovskoy and the one anonymous reviewer for taking the time to provide comments that enabled us to improve and refine the paper.
This research was supported by the New Zealand Ministry of Business, Innovation and Employment through the Antarctic Science Platform (ANTA1801) and the Global Change through Time Programme (GCT SSIF, contract C05X1702) as well as through an IdEx (Initiative d’Excellence de l’Université de Bordeaux) visiting professorship grant (GC).
Kelly-Anne Lawler and Vikki Lowe are each supported by an Australian Research Training Program (RTP) scholarship.
Voyage IN2017-V01 was supported by the Australian government’s Australian Antarctic Science Grant Program (AAS no. 4333) and the Australian Research Council (grant no: DP170100557).
Voyage NBP1402 was supported by NSF Antarctic Integrated Systems Science Program (grant nos. 1143834, 1143836, 1143837, 1143843 and 1313826).
This paper was edited by Thomas Blunier and reviewed by Demetrio Boltovskoy and one anonymous referee.
Abelmann, A.: Radiolarian flux in Antarctic waters (Drake Passage, Powell Basin, Bransfield Strait), Polar Biol., 12, 357–372, https://doi.org/10.1007/BF00243107, 1992.
Abelmann, A. and Gersonde, R.: Biosiliceous particle flux in the Southern Ocean, Mar. Chem., 35, 503–536, https://doi.org/10.1016/S0304-4203(09)90040-8, 1991.
Abelmann, A. and Gowing, M. M.: Spatial distribution pattern of living polycystine radiolarian taxa – baseline study for paleoenvironmental reconstructions in the Southern Ocean (Atlantic sector), Mar. Micropaleontol., 30, 3–28, 1997.
Abelmann, A., Brathauer, U., Gersonde, R., Sieger, R., and Zielinski, U.: Radiolarian-based transfer function for the estimation of sea surface temperatures in the Southern Ocean (Atlantic Sector), Paleoceanography, 14, 410–421, https://doi.org/10.1029/1998PA900024, 1999.
Anderson, O. R.: Protozoa, Radiolarians, in: Encyclopedia of Ocean Sciences: A Derivative of the Encyclopedia of Ocean Sciences, Elsevier Science & Technology, 4, 651–655, 2019.
Armand, L. K., Crosta, X., Romero, O., and Pichon, J.-J.: The biogeography of major diatom taxa in Southern Ocean sediments 1. Sea ice related species, Palaeogeogr. Palaeocl., 223, 93–126, https://doi.org/10.1016/j.palaeo.2005.02.015, 2005.
Armand, L. K., O'Brien, P. E., and On-board Scientific Party: Interactions of the Totten Glacier with the Southern Ocean through multiple glacial cycles (IN2017-V01): Post-survey report, Research School of Earth Sciences, Australian National University, Canberra, https://doi.org/10.4225/13/5acea64c48693, 2018.
Barnett, P. R. O., Watson, J., and Connelly, D.: A multiple corer for taking virtually undisturbed samples from shelf, bathyal and abyssal sediments, P. Roy. Soc. Edinb. B-Bi., 88, 304–305, https://doi.org/10.1017/S0269727000014846, 1986.
Becker, R. A., Wilks, A. R., Brownrigg, R., Minka, T. P., and Deckmyn, A.: maps: Draw Geographical Maps, available at: https://CRAN.R-project.org/package=maps (last access: 24 June 2020), 2018.
Bianchi, C. and Gersonde, R.: Climate evolution at the last deglaciation: the role of the Southern Ocean, Earth Planet. Sc. Lett., 228, 407–424, https://doi.org/10.1016/j.epsl.2004.10.003, 2004.
Biard, T., Stemmann, L., Picheral, M., Mayot, N., Vandromme, P., Hauss, H., Gorsky, G., Guidi, L., Kiko, R., and Not, F.: In situ imaging reveals the biomass of giant protists in the global ocean, Nature, 532, 504–507, https://doi.org/10.1038/nature17652, 2016.
Bivand, R., Keitt, T., and Rowlingson, B.: rgdal: Bindings for the “Geospatial” Data Abstraction Library, available at: https://CRAN.R-project.org/package=rgdal, last access: 27 October 2020.
Boltovskoy, D.: Sedimentary Record of Radiolarian Biogeography in the Equatorial to Antarctic Western Pacific Ocean, Micropaleontology, 33, 267–281, https://doi.org/10.2307/1485643, 1987.
Boltovskoy, D.: Classification and distribution of South Atlantic Recent polycystine Radiolaria, Palaeontol. Electron., 1, 1.2.6A, https://doi.org/10.26879/98006, 1998.
Boltovskoy, D.: Vertical distribution patterns of Radiolaria Polycystina (Protista) in the World Ocean: living ranges, isothermal submersion and settling shells, J. Plankton Res., 39, 330–349, https://doi.org/10.1093/plankt/fbx003, 2017.
Boltovskoy, D. and Correa, N.: Biogeography of Radiolaria Polycystina (Protista) in the World Ocean, Prog. Oceanogr., 149, 82–105, https://doi.org/10.1016/j.pocean.2016.09.006, 2016.
Boltovskoy, D., Anderson, O. R., and Correa, N. M.: Radiolaria and Phaeodaria, in: Handbook of the Protists, edited by: Archibald, J. M., Simpson, A. G. B., Slamovits, C. H., Margulis, L., Melkonian, M., Chapman, D. J., and Corliss, J. O., Springer International Publishing, Cham, 1–33, https://doi.org/10.1007/978-3-319-32669-6_19-2, 2017.
Civel-Mazens, M., Crosta, X., Cortese, G., Michel, E., Mazaud, A., Ther, O., Ikehara, M., and Itaki, T.: Antarctic Polar Front migrations in the Kerguelen Plateau region, Southern Ocean, over the past 360 kyrs, Global Planet. Change, 202, 103526, https://doi.org/10.1016/j.gloplacha.2021.103526, 2021a.
Civel-Mazens, M., Crosta, X., Cortese, G., Michel, E., Mazaud, A., Ther, O., Ikehara, M., and Itaki, T.: Impact of the Agulhas Return Current on the oceanography of the Kerguelen Plateau region, Southern Ocean, over the last 40 kyrs, Quaternary Sci. Rev., 251, 106711, https://doi.org/10.1016/j.quascirev.2020.106711, 2021b.
Cortese, G. and Abelmann, A.: Radiolarian-based paleotemperatures during the last 160 kyr at ODP Site 1089 (Southern Ocean, Atlantic Sector), Palaeogeogr. Palaeocl., 182, 259–286, https://doi.org/10.1016/S0031-0182(01)00499-0, 2002.
Cortese, G. and Prebble, J.: A radiolarian-based modern analogue dataset for palaeoenvironmental reconstructions in the southwest Pacific, Mar. Micropaleontol., 118, 34–49, https://doi.org/10.1016/j.marmicro.2015.05.002, 2015.
Cortese, G., Abelmann, A., and Gersonde, R.: The last five glacial-interglacial transitions: A high-resolution 450,000-year record from the subantarctic Atlantic, Paleoceanography, 22, PA4203, https://doi.org/10.1029/2007PA001457, 2007.
Crosta, X.: MD 218/CROTALE cruise, RV Marion Dufresne, Online Voyage Report, https://doi.org/10.17600/18000886, 2019.
Crosta, X., Pichon, J.-J., and Burckle, L. H.: Application of modern analog technique to marine Antarctic diatoms: Reconstruction of maximum sea-ice extent at the last glacial maximum, Paleoceanography, 13, 284–297, https://doi.org/10.1029/98PA00339, 1998.
Crosta, X., Sturm, A., Armand, L., and Pichon, J.-J.: Late Quaternary sea ice history in the Indian sector of the Southern Ocean as recorded by diatom assemblages, Mar. Micropaleontol., 50, 209–223, https://doi.org/10.1016/S0377-8398(03)00072-0, 2004.
Crosta, X., Romero, O., Armand, L. K., and Pichon, J.-J.: The biogeography of major diatom taxa in Southern Ocean sediments: 2. Open ocean related species, Palaeogeogr. Palaeocl., 223, 66–92, https://doi.org/10.1016/j.palaeo.2005.03.028, 2005.
Esper, O. and Gersonde, R.: New tools for the reconstruction of Pleistocene Antarctic sea ice, Palaeogeogr. Palaeocl., 399, 260–283, https://doi.org/10.1016/j.palaeo.2014.01.019, 2014a.
Esper, O. and Gersonde, R.: Quaternary surface water temperature estimations: New diatom transfer functions for the Southern Ocean, Palaeogeogr. Palaeocl., 414, 1–19, https://doi.org/10.1016/j.palaeo.2014.08.008, 2014b.
Fatela, F. and Taborda, R.: Confidence limits of species proportions in microfossil assemblages, Mar. Micropaleontol., 45, 169–174, https://doi.org/10.1016/S0377-8398(02)00021-X, 2002.
Ferry, A. J., Crosta, X., Quilty, P. G., Fink, D., Howard, W., and Armand, L. K.: First records of winter sea ice concentration in the southwest Pacific sector of the Southern Ocean, Paleoceanography, 30, 1525–1539, https://doi.org/10.1002/2014PA002764, 2015.
Fetterer, F., Knowles, K., Meier, W. N., Savoie, M., and Windnagel, A. K.: Sea Ice Index, Version 3, NSIDC (National Snow and Ice Data Center) [data set], Boulder, Colorado USA, https://doi.org/10.7265/N5K072F8, 2017.
Garcia, H., Weathers, K., Paver, C., Smolyar, I., Boyer, T., Locarnini, M., Zweng, M., Mishonov, A., Baranova, O., and Seidov, D.: World Ocean Atlas 2018, Volume 4: Dissolved Inorganic Nutrients (phosphate, nitrate and nitrate+ nitrite, silicate), edited by: Mishonov, A., NOAA Atlas NESDIS 84, 35 pp., 2019a.
Garcia, H., Weathers, K., Paver, C., Smolyar, I., Boyer, T., Locarnini, M., Zweng, M., Mishonov, A., Baranova, O., and Seidov, D.: World Ocean Atlas 2018, Volume 3: Dissolved Oxygen, Apparent Oxygen Utilization, and Dissolved Oxygen Saturation, edited by: Mishonov, A., NOAA Atlas NESDIS 83, 38 pp., 2019b.
Gersonde, R. and Zielinski, U.: The reconstruction of late Quaternary Antarctic sea-ice distribution–the use of diatoms as a proxy for sea-ice, Palaeogeogr. Palaeocl., 162, 263–286, https://doi.org/10.1016/S0031-0182(00)00131-0, 2000.
Gersonde, R., Crosta, X., Abelmann, A., and Armand, L.: Sea-surface temperature and sea ice distribution of the Southern Ocean at the EPILOG Last Glacial Maximum–a circum-Antarctic view based on siliceous microfossil records, 24, 869–896, https://doi.org/10.1016/j.quascirev.2004.07.015, 2005.
Hernández-Almeida, I., Boltovskoy, D., Kruglikova, S. B., and Cortese, G.: A new radiolarian transfer function for the Pacific Ocean and application to fossil records: Assessing potential and limitations for the last glacial-interglacial cycle, Global Planet. Change, 190, 103186, https://doi.org/10.1016/j.gloplacha.2020.103186, 2020.
Lawler, K.-A., Cortese, G., Civel-Mazens, M., Bostock, H., Crosta, X., Leventer, A., Lowe, V., Rogers, J., and Armand, L. K.: Southern Ocean RADiolarian dataset (SO-RAD), PANGAEA [data set], https://doi.org/10.1594/PANGAEA.929903, 2021.
Lazarus, D.: A brief review of radiolarian research, Palaeontol. Z., 79, 183–200, https://doi.org/10.1007/BF03021761, 2005.
Lazarus, D., Suzuki, N., Caulet, J.-P., Nigrini, C., Goll, I., Goll, R., Dolven, J. K., Diver, P., and Sanfilippo, A.: An evaluated list of Cenozic-Recent radiolarian species names (Polycystinea), based on those used in the DSDP, ODP and IODP deep-sea drilling programs, Zootaxa, 3999, 301–333, https://doi.org/10.11646/zootaxa.3999.3.1, 2015.
Lazarus, D., Suzuki, N., Ishitani, Y., and Takahashi, K.: Paleobiology of the Polycystine Radiolaria, Wiley Blackwell, Hoboken, NJ, 2021.
Leventer, A., Domack, E., Gulick, S., Huber, B., Orsi, A., Shevenell, A., and Scientific Party: Sabrina Coast marine record of cryosphere–ocean dynamics, United States Antarctic Program, Hamilton, NY, 467 pp., available at: https://www.marine-geo.org/tools/entry/NBP1402#documents (last access: 13 September 2019), 2014.
Locarnini, M., Mishonov, A., Baranova, O., Boyer, T., Zweng, M., Garcia, H., Seidov, D., Weathers, K., Paver, C., and Smolyar, I.: World ocean atlas 2018, Volume 1: Temperature, edited by: Mishonov, A., NOAA Atlas NESDIS 81, 52 pp., 2018.
Lozano, J. A. and Hays, J. D.: Relationship of Radiolarian Assemblages to Sediment Types and Physical Oceanography in the Atlantic and Western Indian Ocean Sectors of the Antarctic Ocean, in: Geol. Soc. Am. Mem., 145, 303–336, https://doi.org/10.1130/MEM145-p303, 1976.
Lüer, V., Cortese, G., Neil, H. L., Hollis, C. J., and Willems, H.: Radiolarian-based sea surface temperatures and paleoceanographic changes during the Late Pleistocene–Holocene in the subantarctic southwest Pacific, Mar. Micropaleontol., 70, 151–165, https://doi.org/10.1016/j.marmicro.2008.12.002, 2009.
Matsuzaki, K. M. and Itaki, T.: New northwest Pacific radiolarian data as a tool to estimate past sea surface and intermediate water temperatures, Paleoceanography, 32, 218–245, https://doi.org/10.1002/2017PA003087, 2017.
Mazaud, A. and Michel, E.: MD 185/Indien Sud-2 Cruise Report, RV Marion Dufresne, Online Voyage Report, https://doi.org/10.17600/11200030, 2011.
Mazaud, A. and Michel, E.: MD 189/Indien Sud-2 Cruise Report, RV Marion Dufresne, Online Voyage Report, https://doi.org/10.17600/12200010, 2012.
McIlroy, D.: mapproj: Map Projections, available at: https://CRAN.R-project.org/package=mapproj, last access: 24 June 2020.
Nigrini, C. and Moore, T. C. J.: A guide to modern Radiolaria, Cushman Foundation for Foraminiferal Research, Washington, D.C., 1979.
Orsi, A. H., Whitworth, T., and Nowlin, W. D.: On the meridional extent and fronts of the Antarctic Circumpolar Current, Deep-Sea Res. Pt. I, 42, 641–673, https://doi.org/10.1016/0967-0637(95)00021-W, 1995.
Panitz, S., Cortese, G., Neil, H. L., and Diekmann, B.: A radiolarian-based palaeoclimate history of Core Y9 (Northeast of Campbell Plateau, New Zealand) for the last 160 kyr, Mar. Micropaleontol., 116, 1–14, https://doi.org/10.1016/j.marmicro.2014.12.003, 2015.
Petrushevskaya, M. G.: Radiolyarii otryadov Spumellaria i Nassellaria antarkticheskoi oblasti (Antarctic Spumelline and Nasselline radiolarians). Issledovaniya Fauny Morei 4(12), Resultaty Biologicheskikh Issledovanii Sovetskoi Antarkticheskoi Ekspeditsii 1955–1958, Zoologicheskii Institut Academiya Nauk SSSR, 3, 1–186, 1967.
Petrushevskaya, M. G.: Radiolyarii nassellaria v Planktone Mirovogo Okeana. Issledovaniya Fauny Morei 9(17), Nauka, Leningrad, Russia, 1–294, 1971.
R Core Team: R: A Language and Environment for Statistical Computing, R Foundation for Statistical Computing, Vienna, Austria, available at: https://www.r-project.org/, last access: 24 June 2020.
Rogers, J. and De Deckker, P.: Radiolaria as a reflection of environmental conditions in the eastern and southern sectors of the Indian Ocean: A new statistical approach, Mar. Micropaleontol., 65, 137–162, https://doi.org/10.1016/j.marmicro.2007.07.001, 2007.
Rogers, J. and De Deckker, P.: Environmental reconstructions of the upper 500 m of the southern Indian Ocean over the last 40 ka using Radiolarian (Protista) proxies, Quaternary Sci. Rev., 30, 876–886, https://doi.org/10.1016/j.quascirev.2011.01.006, 2011.
Schlitzer, R.: Ocean Data View, available at: https://odv.awi.de, last access: 5 April 2020.
Sumner, M. D.: orsifronts, available at: https://CRAN.R-project.org/package=orsifronts (last access: 24 June 2020), 2015.
Suzuki, N. and Not, F.: Biology and Ecology of Radiolaria, in: Marine Protists: Diversity and Dynamics, edited by: Ohtsuka, S., Suzaki, T., Horiguchi, T., Suzuki, N., and Not, F., Springer Japan, Tokyo, 179–222, https://doi.org/10.1007/978-4-431-55130-0_8, 2015.
Wickham, H., Averick, M., Bryan, J., Chang, W., McGowan, L., François, R., Grolemund, G., Hayes, A., Henry, L., Hester, J., Kuhn, M., Pedersen, T., Miller, E., Bache, S., Müller, K., Ooms, J., Robinson, D., Seidel, D., Spinu, V., Takahashi, K., Vaughan, D., Wilke, C., Woo, K., and Yutani, H.: Welcome to the Tidyverse, Journal of Open Source Software, 4, 1686, https://doi.org/10.21105/joss.01686, 2019.
WOCE Data Products Committee: WOCE Data Products Committee, 2002, WOCE International Project Office, Southampton, UK, 2002.
WoRMS Editorial Board: WoRMS – World Register of Marine Species, VLIZ, available at: http://www.marinespecies.org/ (last access: 27 September 2019), 2020.
Yasuhara, M., Huang, H.-H., Hull, P., Rillo, M., Condamine, F., Tittensor, D., Kučera, M., Costello, M., Finnegan, S., O'Dea, A., Hong, Y., Bonebrake, T., McKenzie, R., Doi, H., Wei, C.-L., Kubota, Y., and Saupe, E.: Time Machine Biology: Cross-Timescale Integration of Ecology, Evolution, and Oceanography, Oceanography, 33, 16–28, https://doi.org/10.5670/oceanog.2020.225, 2020.
Zweng, M., Seidov, D., Boyer, T., Locarnini, M., Garcia, H., Mishonov, A., Baranova, O., Weathers, K., Paver, C., and Smolyar, I.: World ocean atlas 2018, Volume 2: Salinity, edited by: Mishonov, A., NOAA Atlas NESDIS 82, 50 pp., 2019.