the Creative Commons Attribution 4.0 License.
the Creative Commons Attribution 4.0 License.
 | 17 Nov 2021
Patterns of nitrogen and phosphorus pools in terrestrial ecosystems in China
Yi-Wei Zhang
Yanpei Guo
Zhiyao Tang
Yuhao Feng
Xinrong Zhu
Wenting Xu
Yongfei Bai
Guoyi Zhou
Zongqiang Xie
Jingyun Fang
Recent increases in atmospheric carbon dioxide (CO2) and temperature relieve their limitations on terrestrial ecosystem productivity, while nutrient availability constrains the increasing plant photosynthesis more intensively. Nitrogen (N) and phosphorus (P) are critical for plant physiological activities and consequently regulate ecosystem productivity. Here, for the first time, we mapped N and P densities and concentrations of leaves, woody stems, roots, litter, and soil in forest, shrubland, and grassland ecosystems across China based on an intensive investigation at 4868 sites, covering species composition, biomass, and nutrient concentrations of different tissues of living plants, litter, and soil. Forest, shrubland, and grassland ecosystems in China stored 6803.6 Tg N, with 6635.2 Tg N (97.5 %) fixed in soil (to a depth of 1 m) and 27.7 (0.4 %), 57.8 (0.8 %), 71.2 (1 %), and 11.7 Tg N (0.2 %) in leaves, stems, roots, and litter, respectively. The forest, shrubland, and grassland ecosystems in China stored 2806.0 Tg P, with 2786.1 Tg P (99.3 %) fixed in soil (to a depth of 1 m) and 2.7 (0.1 %), 9.4 (0.3 %), 6.7 (0.2 %), and 1.0 Tg P (< 0.1 %) in leaves, stems, roots, and litter, respectively. Our estimation showed that N pools were low in northern China, except in the Changbai Mountains, Mount Tianshan, and Mount Alta, while relatively higher values existed in the eastern Qinghai–Tibetan Plateau and Yunnan. P densities in vegetation were higher towards the southern and north-eastern part of China, while soil P density was higher towards the northern and western part of China. The estimated N and P density and concentration datasets, “Patterns of nitrogen and phosphorus pools in terrestrial ecosystems in China” (https://doi.org/10.5061/dryad.6hdr7sqzx), are available from the Dryad digital repository (Zhang et al., 2021). These patterns of N and P densities could potentially improve existing earth system models and large-scale research on ecosystem nutrients.
- Article
(16335 KB) - Full-text XML
-
Supplement
(1803 KB) - BibTeX
- EndNote


Nitrogen (N) and phosphorus (P) play fundamental roles in plant physiological activities and functioning, such as photosynthesis, resource utilization, and reproductive behaviours (Fernández-Martínez et al., 2019; Lovelock et al., 2004; Raaimakers et al., 1995), ultimately regulating plant growth and carbon (C) sequestration efficiency (Terrer et al., 2019; Sun et al., 2017). Under the background of global warming, the limiting factors for the plant growth, such as carbon dioxide (CO2) and temperature, are becoming less restrictive for terrestrial ecosystem productivity (Norby et al., 2009; Fatichi et al., 2019), while nutrient availability tends to constrain the increasing plant photosynthesis more intensively (Cleveland et al., 2013; Du et al., 2020). As the key nutrients for plant growth, N and P independently or jointly limit biomass production (Elser et al., 2007; Finzi et al., 2007; Hou et al., 2020). N influences CO2 assimilation in various ways (Vitousek and Howarth, 1991; Campany et al., 2017). For example, N is a critical element in chlorophyll (Field, 1983), and plant metabolic rates are also regulated by N content (Elser et al., 2010). P is crucial in RNA and DNA construction, and its content is associated with water uptake and transport (Carvajal et al., 1996; Cheeseman and Lovelock, 2004) as well as energy transfer and exchange (Achat et al., 2009). P shortage could lower photosynthetic C-assimilation rates (Lovelock et al., 2006).
In spite of the key importance of N and P for plants, knowledge on the patterns of their storage in terrestrial ecosystems is limited. With additional CO2 entering the atmosphere, more N could be allocated to plant growth and soil organic matter (SOM) accumulation, which may lead to less available mineral N for plant uptake (Luo et al., 2004). Direct and indirect evidence shows that N limits productivity in temperate and boreal areas (Bonan, 1990; Miller, 1981; Vitousek, 1982). P originates from bedrock weathering and litter decomposition in terrestrial ecosystems, and it experiences long-term biogeochemical processes before it is available to plants (Föllmi, 1996), which consequently makes P a more predominant limiting factor to ecosystem productivity (Reed et al., 2015). Additionally, P decomposition rates are constrained by limited soil labile P storage, especially in tropical forests, where soil P limitation is extreme (Fisher et al., 2012).
Ecosystem models based on Amazon forest free air CO2 enrichment (FACE) experiments consistently showed that biomass C positively responded to simulated elevated CO2, but the models incorporating N and P availability showed lower plant growth than those that did not (Wieder et al., 2015). Moreover, a recent study suggested that the inclusion of N and P availability into the earth system models (ESMs) remarkably improved the estimation accuracy of C cycles over previous models (Fleischer et al., 2019). Hence, understanding and predicting the patterns and mechanisms of global C dynamics require good characterization of N and P conditions.
N and P pools in ecosystems consist of several components that cast different influences on ecosystem C storages and fluxes. For example, N and P in plants directly affect C sequestration (Thomas et al., 2010), but their activities differ among organs (Elser et al., 2003; Parks et al., 2000); the soil pools are the source of plant nutrition, and the litter pools act as a transit link that returns nutrients from plants to soil (McGrath et al., 2000). Thus, an accurate estimation of ecosystem N and P pools involves calculating specific nutrient densities in all these components.
Terrestrial ecosystems in China play a considerable part in the continental and global C cycles. Satellite data verified that China contributed to one-fourth of the global net increase in leaf area from 2000 to 2017 (Chen et al., 2019). The total C pool in terrestrial ecosystems in China is 79.2 Pg C, and this number is still growing because of the nationwide ecological restoration and construction, which accounted for 56 % of the total C sequestration in the restoration area in China from 2001 to 2010 (Lu et al., 2018). N and/or P limitations are ubiquitous in natural ecosystems in China (Augusto et al., 2017; Du et al., 2020; Elser et al., 2007; LeBauer and Treseder, 2008; Hou et al., 2020). Understanding the distribution and allocation of N and P in ecosystems is of great significance for a precise projection of the C cycle in China. Although there are a few studies on the spatial patterns of soil nutrient storages in China (Shangguan et al., 2013; Xu et al., 2020; Yang et al., 2007; Zhang et al., 2005), a thorough study on the distribution of N and P pools of all the ecosystems is still lacking as vegetation (living or dead biomass) composes the most active part of the nutrient stocks.
To fill this knowledge gap, here we identified N and P density patterns in China based on an intensive field investigation, covering all components of the entire ecosystem, including different plant organs, litter, and soil. The present study aims to provide high-resolution maps of nutrient densities in different ecosystem components and to answer the following questions.
-
How much N and P is stored in different components, i.e. leaf, stem, root, litter, and soil, of terrestrial ecosystems in China?
-
How are N and P pools in different components spatially distributed in China?
2.1 Field sampling and nutrient density calculation
Forest, shrublands, and grasslands constitute major vegetation type groups in China. Focusing primarily on these three groups, a nationwide, methodologically consistent field investigation was conducted in June and September 2011–2015.
In total, 4868 sites, including 3022 forest, 1123 shrubland, and 723 grassland sites, were investigated (Fig. S1a in the Supplement). At each site, one 20×50 m2 plot was set for forests, three replicated 5×5 m2 plots were set for shrublands, and ten 1× 1 m2 plots were established for grasslands. Species composition and abundance were investigated in plots. Height (for trees, shrubs, and herbs), diameter at breast height (DBH; at height 130 cm) (for trees), basal diameter (for shrubs), and crown width (for shrubs and herbs) were measured for all plant individuals in the plots (X. Tang et al., 2018).
Leaves, stems (woody stems), and roots (without distinguishing coarse and fine roots) were sampled for the top five dominant tree and shrub species, and above- and belowground parts were sampled for dominant herb species. Soil was sampled to a depth of 1 m or to bedrock at depths of 0–10, 10–20, 20–30, 30–50, and 50–100 cm, with at least five replications per site to measure nutrient concentrations and bulk density after removing roots and gravels. Litter was sampled in at least three 1×1 m2 quadrats per site (for detailed survey protocol, see X. Tang et al., 2018).
All samples were transported to the laboratory, dried, and measured. N concentrations of all samples were measured by a C–N analyser (PE-2400 II; Perkin-Elmer, Boston, USA), while P concentrations were measured using the molybdate–ascorbic acid method after H2SO4–H2O2 digestion (Jones Jr., 2001). For the three organs, the community-level N or P density was the cumulative sum of the products of the corresponding biomass density (i.e. biomass per area, Mg ha−1) and community-level concentrations for each co-occurring species, as shown by Eq. (1).
N (P) represents the community-level N or P density (Mg ha−1); n is the total number of plant species at one site; Bi is the biomass density of a specific organ of the ith plant species in that site, where the plant organ biomass was estimated by allometric equations or harvesting; θi represents the N or P concentration (g kg−1) of the same organ of the ith plant species at that site. Allometric equation methods were adapted to trees and some shrubs (tree-like shrubs and xeric shrubs) for biomass estimation, while the biomass of grass-like shrubs and herbs was obtained by direct harvesting. Litter N or P density was litter biomass density (by harvesting) multiplied by litter N or P concentration of each sampling site. The soil N or P density was calculated to a depth of 1 m. Soil N or P concentration and bulk density were measured at different depths (0–10, 10–20, 20–30, 30–50, and 50–100 cm) to determine the community-level soil N or P density using Eq. (2):
where SND(SPD) is the total N or P density of the soil within the top 1 m (Mg ha−1), n is the total number of soil layers (ranging from one to five) at one site, δi is the volume percentage of gravel with a diameter > 2 mm, ρi is the bulk density (g cm−3), Ci is the soil N or P concentration (g kg−1), and Ti is the depth (cm) of the ith layer. For detailed calculations of species biomass and community-level concentrations at each site, please refer to previous studies (X. Tang et al. 2018; Z. Tang et al. 2018).
2.2 Climatic and vegetation data
The daily meteorological observation data from 2400 meteorological stations across China were averaged over the 2011–2015 period to generate a spatial interpolation dataset of mean annual temperature (MAT) and precipitation (MAP) using a smooth spline function (McVicar et al., 2007) with a spatial resolution of 1 km. MAT and MAP of each site were extracted from this dataset.
Elevation was extracted from GTOPO30 with a spatial resolution of 30 arc seconds (https://www.usgs.gov/centers/eros/science/, last access date: 29 October 2021). The mean enhanced vegetation index (EVI) from June to September during the 2011–2015 period was calculated based on MOD13A3 data with a resolution of 1 km (https://lpdaac.usgs.gov/products/mod13a3v006/ last access date: 29 October 2021).
The ranges of these variables of our field sites (EVI: 0.03–0.7; elevation: −137–5797 m; MAP: 19.8–2316.3 mm; MAT: −5.2–26.0 ∘C) could generally cover the ranges of corresponding variables in the focused vegetation types across China (99 % ranges of EVI: 0.03–0.6; of elevation: 24–5628 m; of MAP: 50.6–2956.5 mm; of MAT:−6.6–22.8 ∘C).
Based on the level II vegetation classification of ChinaCover (Land Cover Atlas of the People's Republic of China Editorial Board, 2017), we classified the vegetation type groups into the following 13 vegetation types: five forest types, i.e. evergreen broadleaf forests, deciduous broadleaf forests, evergreen needle-leaf forests, deciduous needle-leaf forests, and broadleaf and needle-leaf mixed forests; four shrubland types, i.e. evergreen broadleaf shrublands, deciduous broadleaf shrublands, evergreen needle-leaf shrublands, and sparse shrublands; and four grassland types, i.e. meadows, steppes, tussocks, and sparse grasslands.
2.3 Prediction the nationwide nutrient pools and distribution patterns
We used random forests to predict the nutrient densities and concentrations across China. The predictors included MAT, MAP, longitude, latitude, elevation, EVI, and vegetation types (as dummy variables). We established one random forest model for N or P in each component (three plant organs, litter, and five soil layers), respectively. In each model, six variables were randomly sampled at each split, and 500 trees were grown. Larger values of these parameters did not increase validation R2 obviously. Model prediction was repeated 100 times to obtain the average results. When modelling the nutrient densities in woody stems, we excluded the four grassland types. All densities were log-transformed based on e, and explanatory variables were transformed using the following equation to ensure they were in the same range before modelling.
where xi means the ith value of the environmental variables x, and max(x) and min(x) represent the maximum and minimum values of x, respectively. We estimated the relative importance of predictors using the increase in node purity for the splitting variable, which was measured by the reduction in residual sum of squares. The same procedures were repeated for the prediction of N and P concentrations in different components across China. The spatial pattern of the N:P ratio was calculated from the predicted N and P density datasets of the corresponding component.
The vegetation N or P density was the sum of all plant organs, the soil N or P density was the sum of all soil layers, and the ecosystem N or P density was the sum of all components. The soil depth data across China were obtained from Shangguan et al. (2017). The N and P pools in 13 vegetation types were estimated, respectively. The N and P pools were calculated from the predicted nationwide densities. The predicted N and P densities were in 1 km spatial resolution, so the nutrient stock is the density multiplied by the grid area (1 km2) for each grid. The nutrient pools of a given vegetation type equal the sum of stocks of the grids belonging to that type.
2.4 Model validation and uncertainty
To evaluate the model performance, we calculated the linear relationship between the observed validation data (10 % of the dataset by random sampling) and predicted data that were estimated based on training data (90 % of the dataset by random sampling) 100 times with the models for every component. We then calculated means of validation R2, slopes, and intercepts of the 100 relationships. We also calculated the standard deviations (SDs) of the 100 predictions of each component in each map grid to show the uncertainty in the models.
All statistical analyses were performed using R 3.6.1 (R Core Team, 2019); random forests were built using the randomForest package (Liaw and Wiener, 2002).
3.1 Allocation of nutrients among ecosystem components
The mean N and P densities varied among forest, shrubland, and grassland sites and among different tissues (Figs. 1 and 2) according to the measured data. On average, leaves and woody stems in forests stored more N than those in shrublands (0.1±0.1 (mean ± SD) Mg N ha−1 vs. 10−2 Mg N ha−1 for leaves and 0.3 ± 0.6 Mg N ha−1 vs. Mg N ha−1 for woody stems). Similarly, P densities were higher in leaves and woody stems for forests than for shrublands ( 10−2 Mg P ha−1 vs. Mg P ha−1 for leaves and Mg P ha−1 vs. Mg P ha−1 for woody stems). The root N and P densities for forests (0.1±0.2 Mg N ha−1 and Mg P ha−1) and grasslands (0.2±0.2 Mg N ha−1 and Mg P ha−1) were remarkably higher than for shrublands ( Mg N ha−1 and Mg P ha−1).
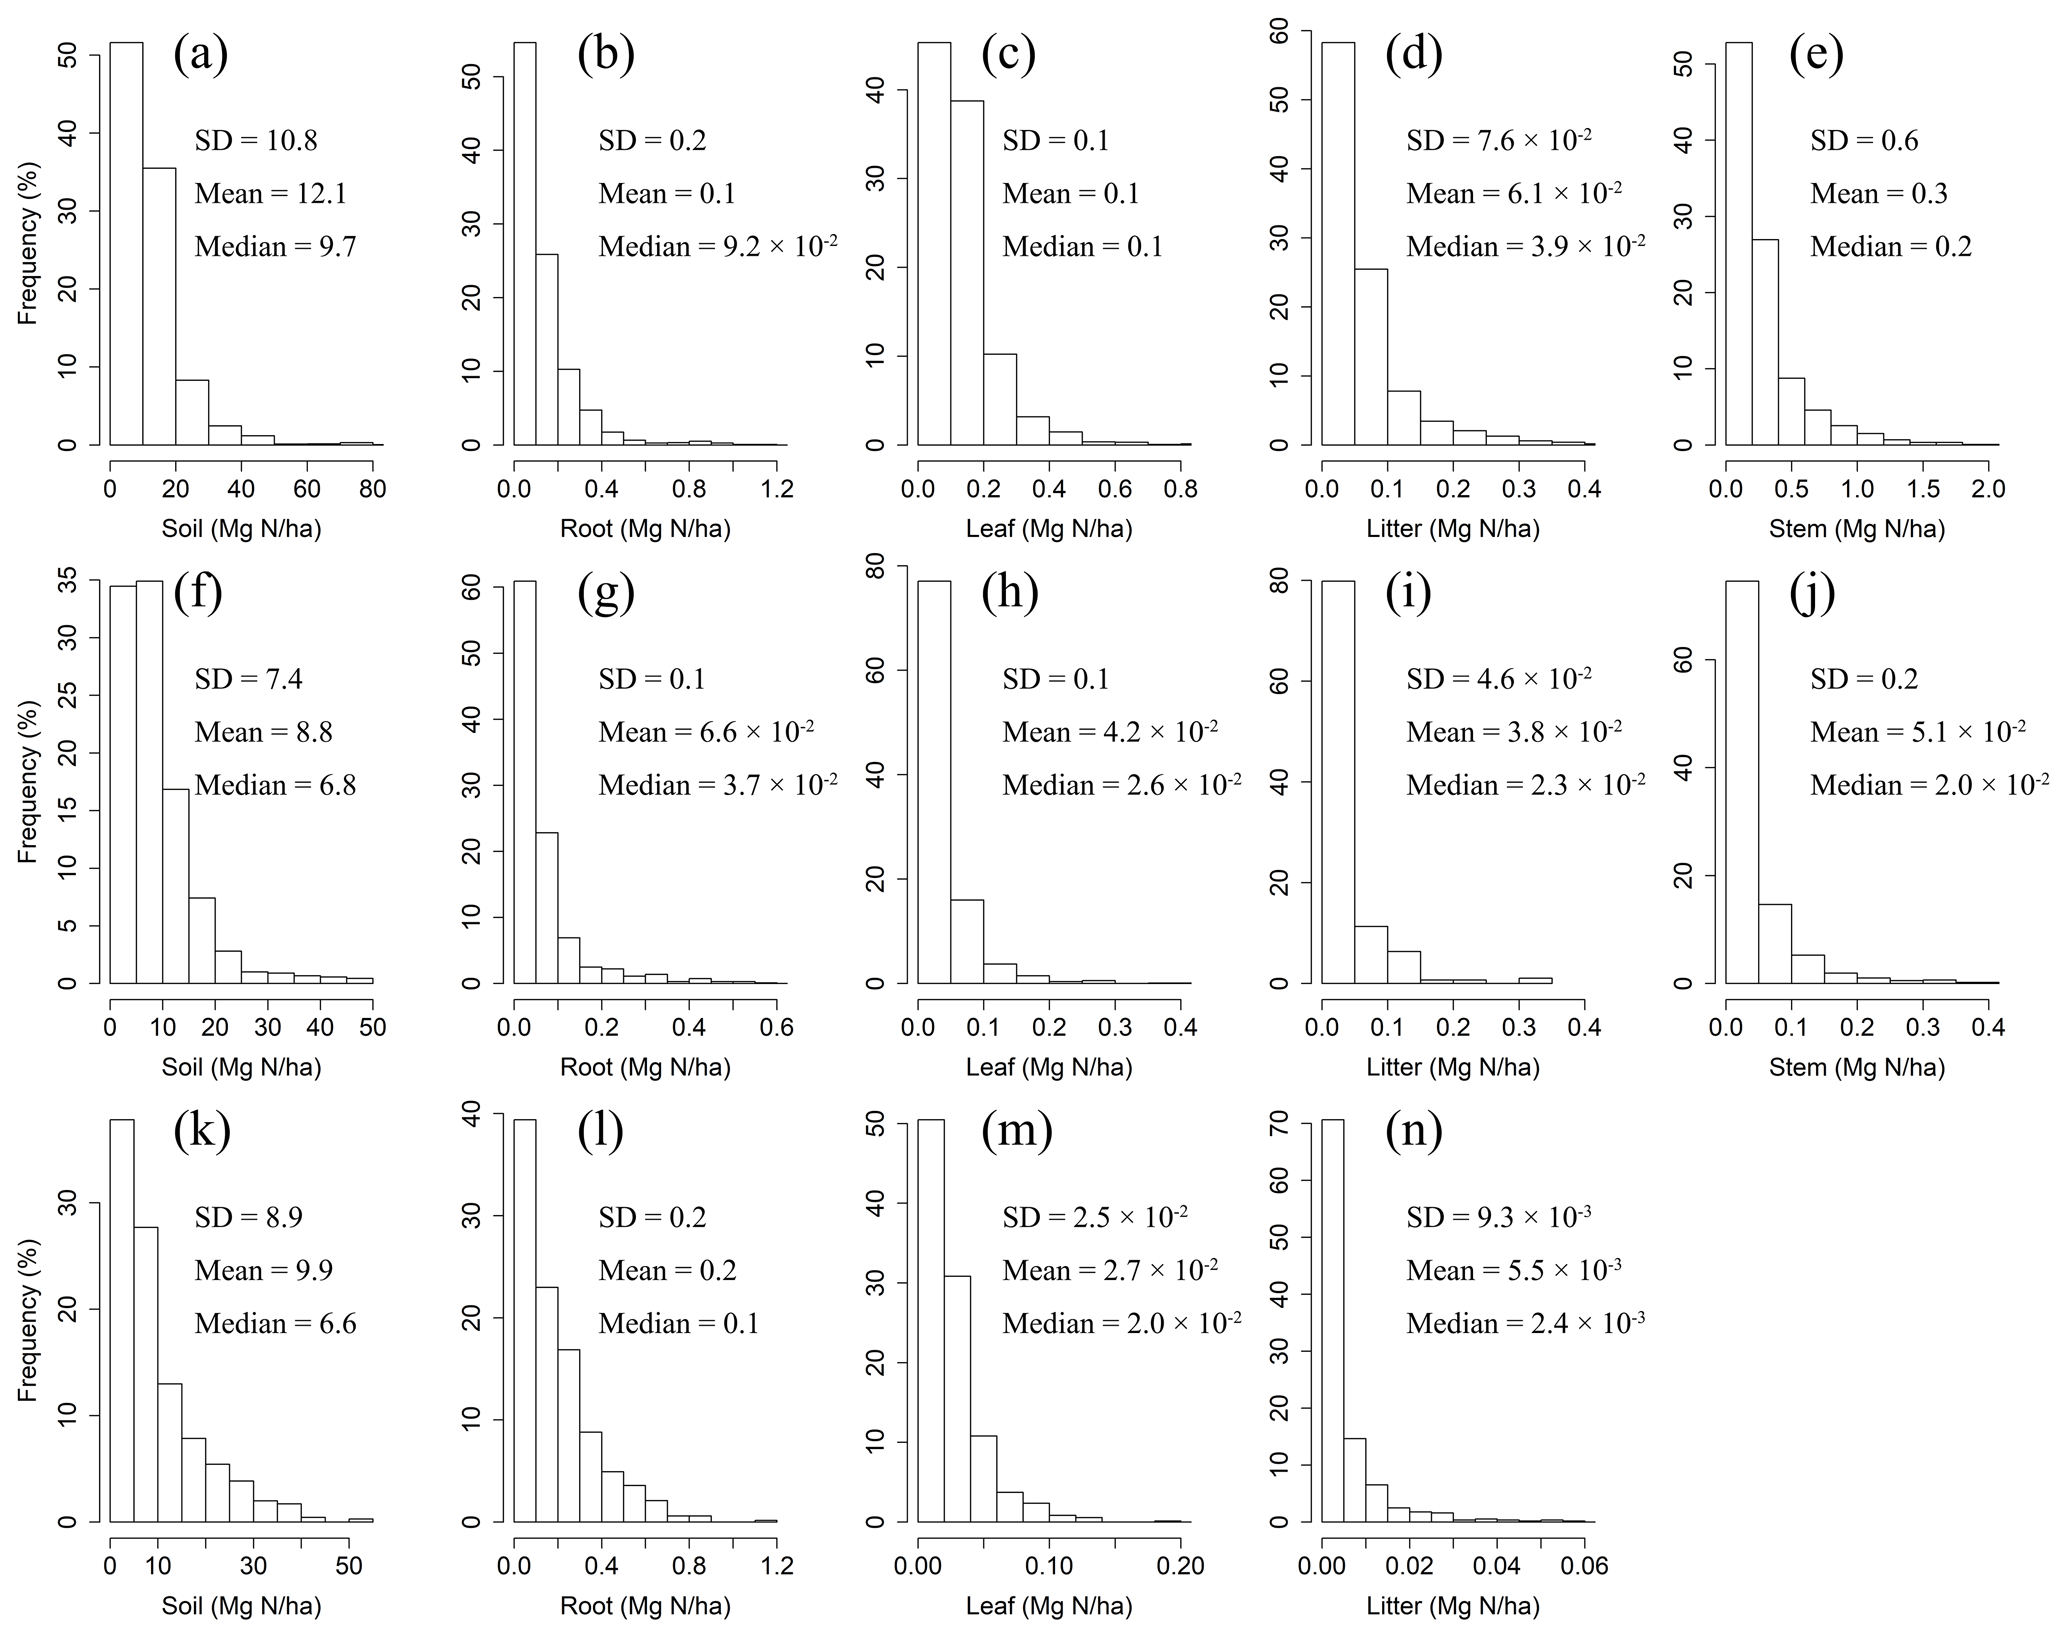
Figure 1Frequency distributions of N densities in soil, roots, leaves, litter, and woody stems in forests (a–e), shrublands (f–j), and grasslands (k–n) in China.
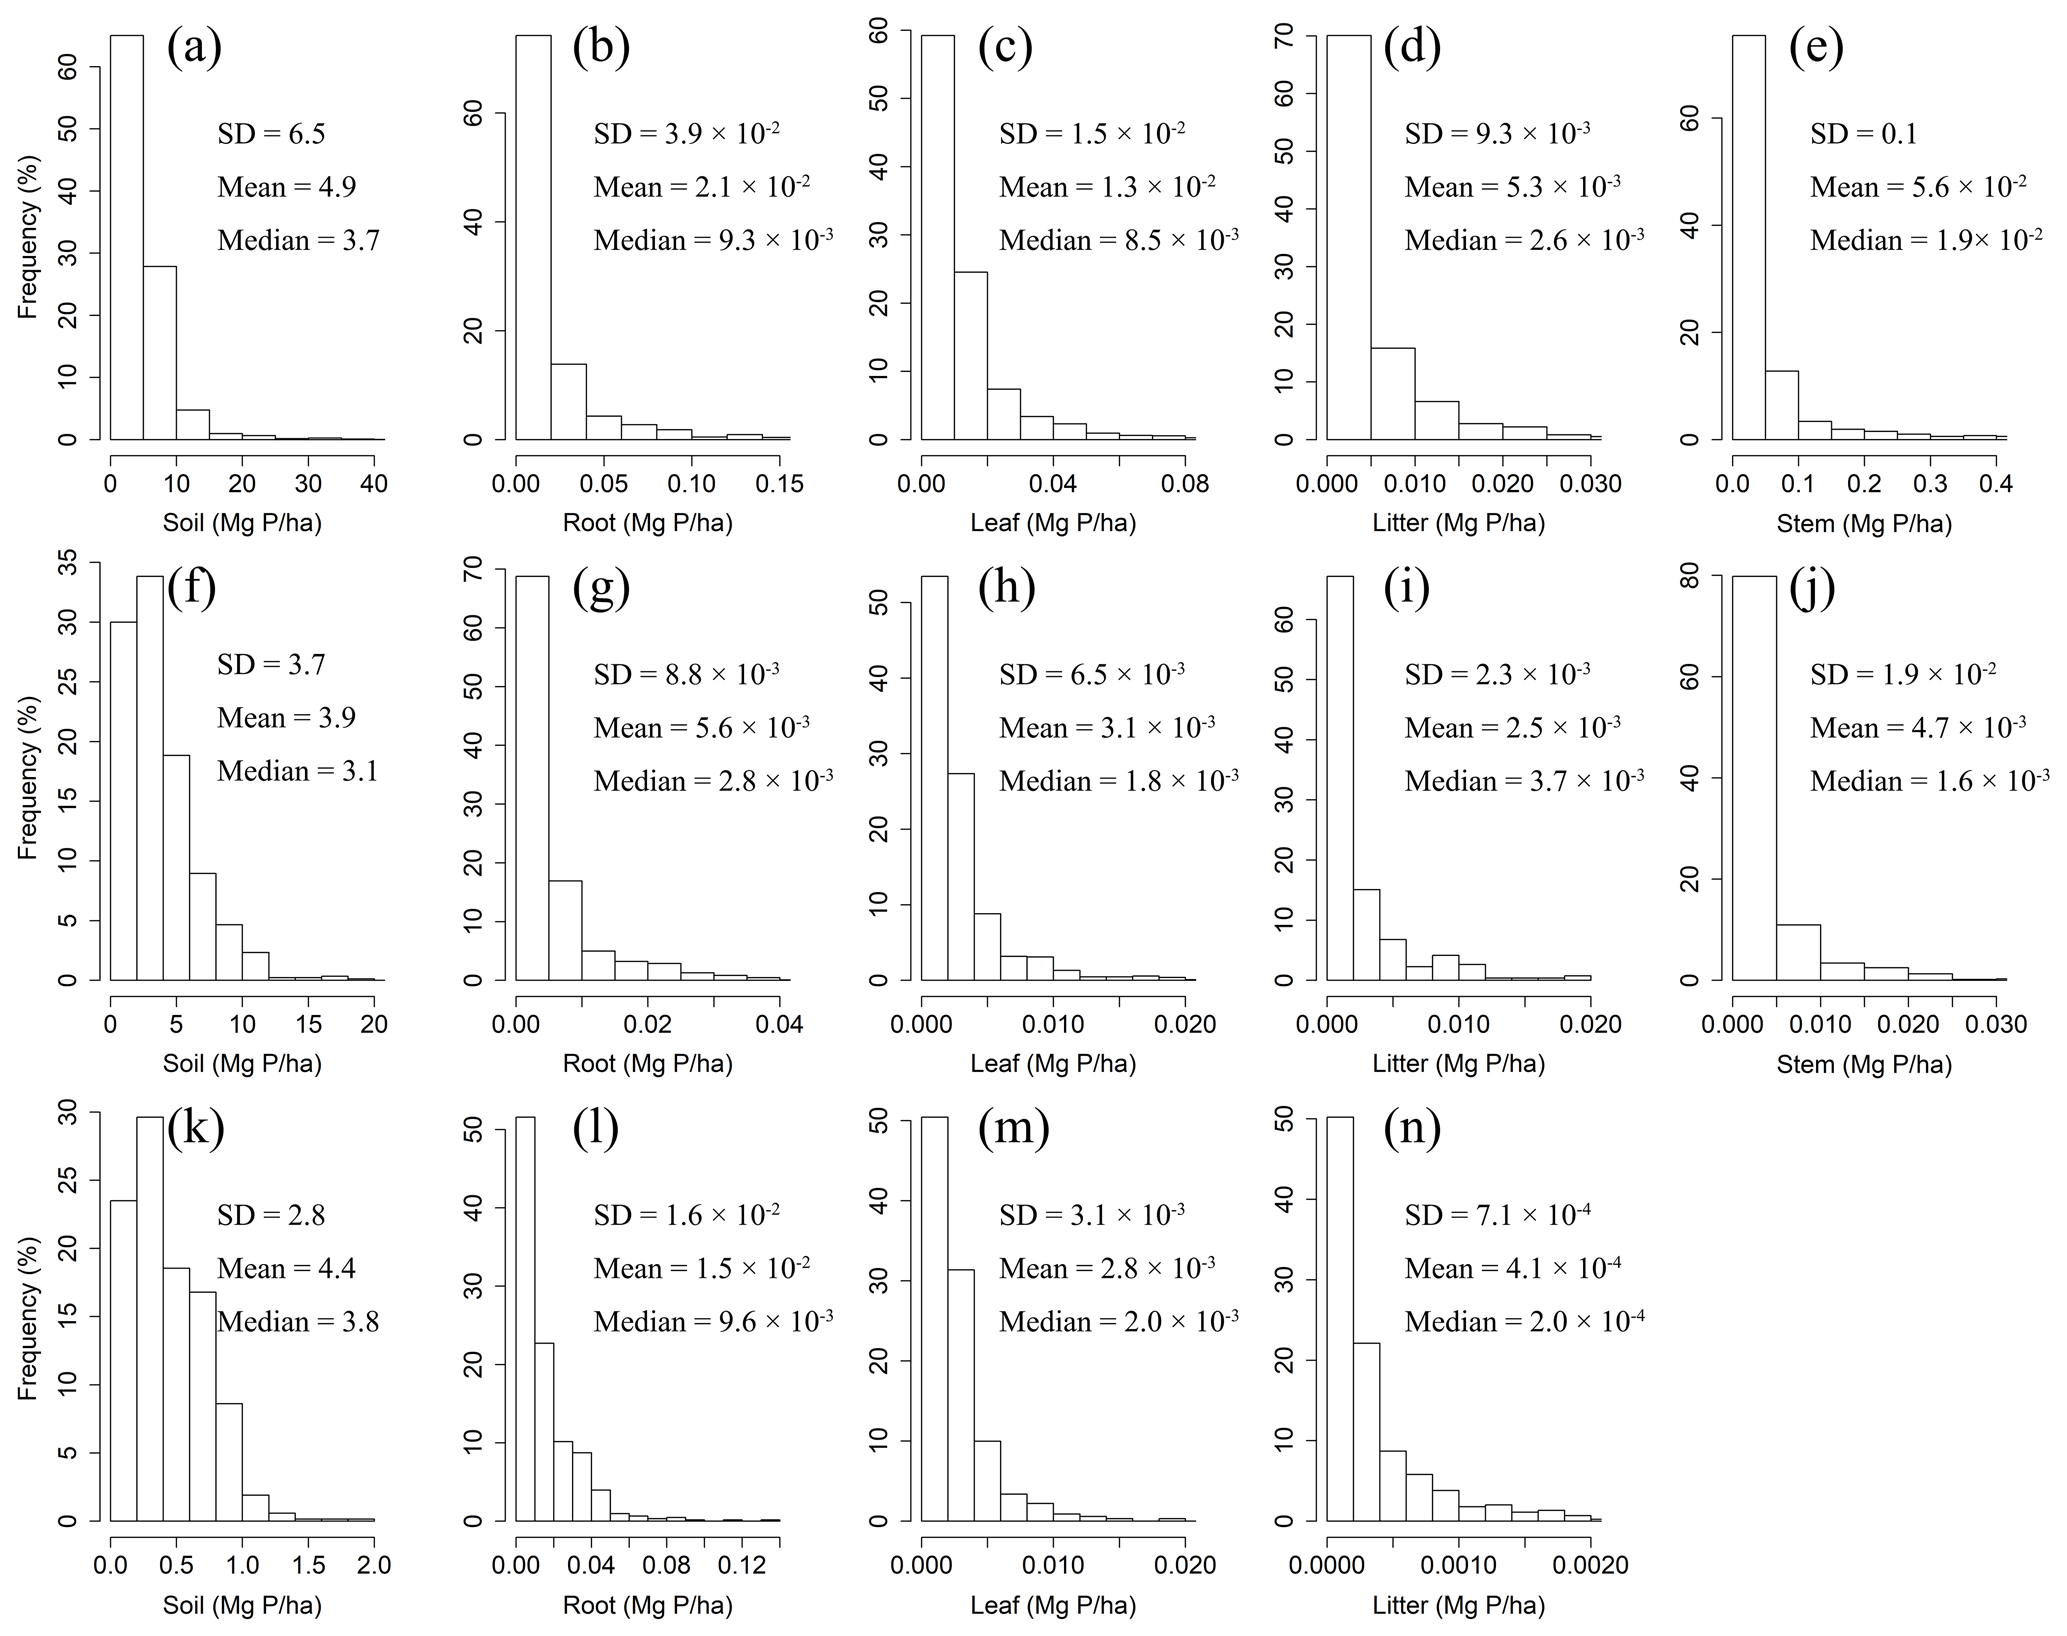
Figure 2Frequency distributions of P densities in soil, roots, leaves, litter, and woody stems in forests (a–e), shrublands (f–j), and grasslands (k–n) in China.
The mean litter N densities for forest, shrubland, and grassland sites were Mg N ha−1, 10−2 Mg N ha−1, and Mg N ha−1, respectively. The mean litter P densities for forest, shrubland, and grassland sites were Mg P ha−1, Mg P ha−1, and Mg P ha−1, respectively.
The mean soil N densities for forest, shrubland, and grassland sites were 12.1±10.8 Mg N ha−1, 8.8±7.4 Mg N ha−1, and 9.9±8.9 Mg N ha−1, respectively. The mean soil P densities were 4.9±6.5 Mg P ha−1 for forest sites, 3.9±3.7 Mg P ha−1 for shrubland sites, and 4.4±2.8 Mg P ha−1 for grassland sites.
Belowground vegetation N and P densities were higher than aboveground in grasslands and sparse shrublands. By contrast, this condition was reversed in forests and the other three shrubland types (Fig. 3). Among various forest types, deciduous broadleaf forests and deciduous needle-leaf forests held the highest aboveground N and P densities, respectively. Evergreen needle-leaf forests held the lowest vegetation N density, and evergreen broadleaf forests had the lowest P density. For grassland types, meadows held higher N and P densities in belowground biomass than the other three grassland types, whereas these four grasslands types had relatively approximate nutrient densities in aboveground biomass. Shrublands possessed the lowest vegetation N and P densities among three vegetation groups. Sparse shrublands had the lowest vegetation nutrient densities and soil N density but the highest soil P density among the four shrubland types.
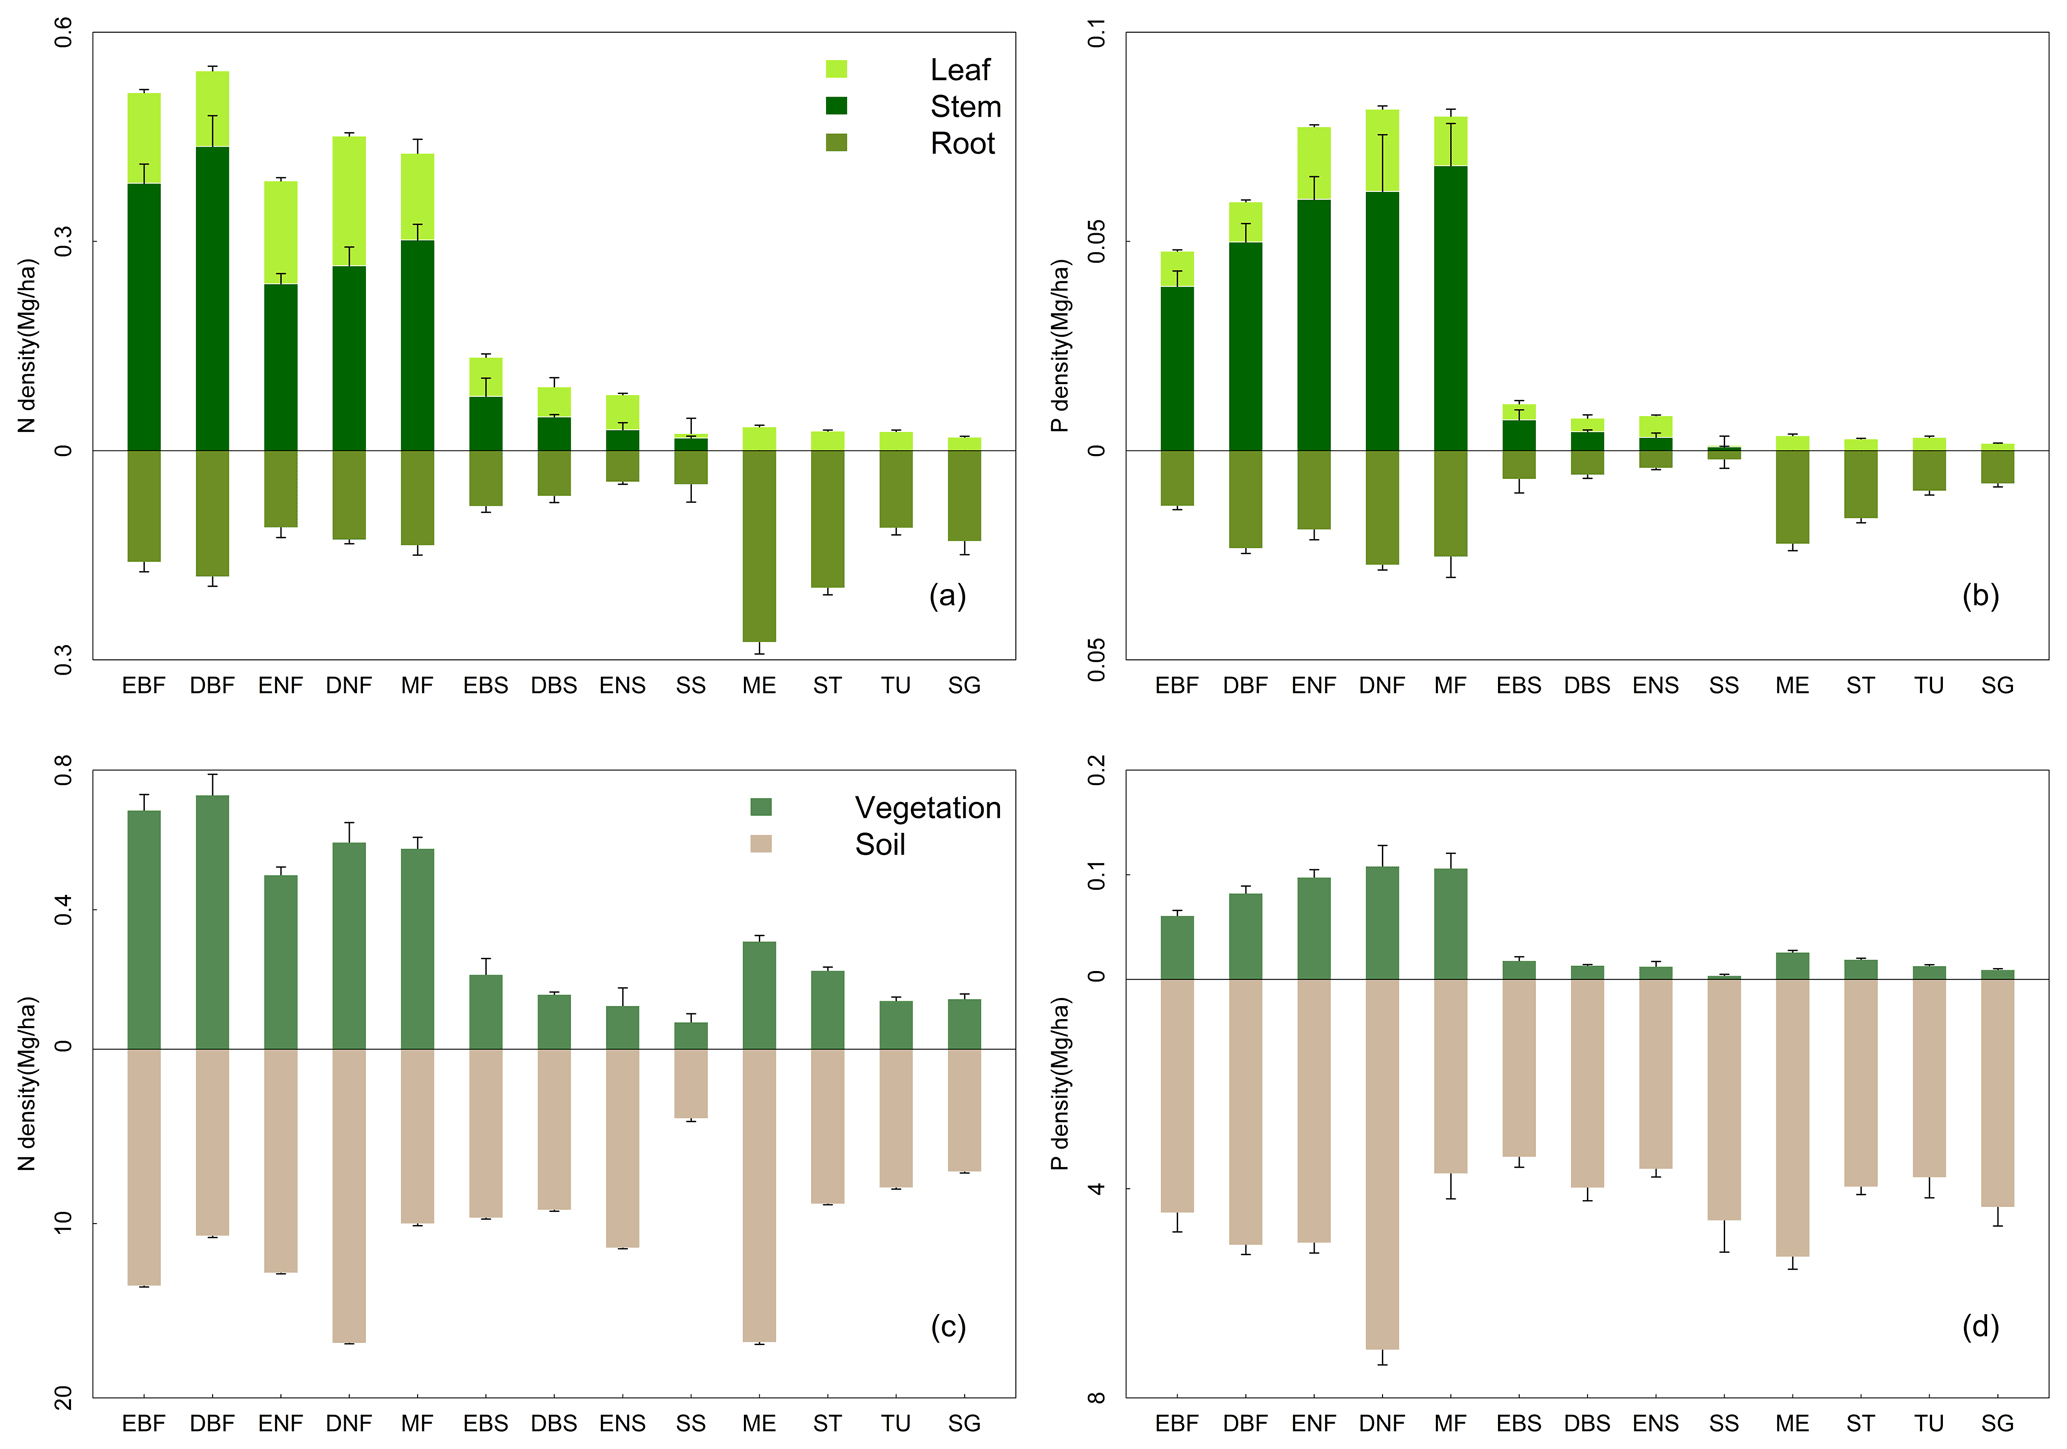
Figure 3N and P density allocations among leaf, stem, and root (a, b) and between vegetation and soil (c, d) in 13 vegetation types. See Table 1 for abbreviations. The error bar represents standard error. Notice that the y axes above and below zero are disproportionate.
3.2 Mapping of N and P densities in China's terrestrial ecosystems
All models of the N and P densities of different components performed well, with the validation R2 ranging from 0.55 to 0.78 for plant organs and litter (Fig. 4) and from 0.47 to 0.62 for soil layers (Fig. 5). As for the concentration models, the validation R2 varied from 0.45 to 0.63 for plant organs and litter (Fig. S2) and from 0.53 to 0.70 for soil layers (Fig. S3). Prediction results of 100 repetitions were quite stable, as shown by SDs of the predictions close to zero in all components (Figs. S4 and S5).
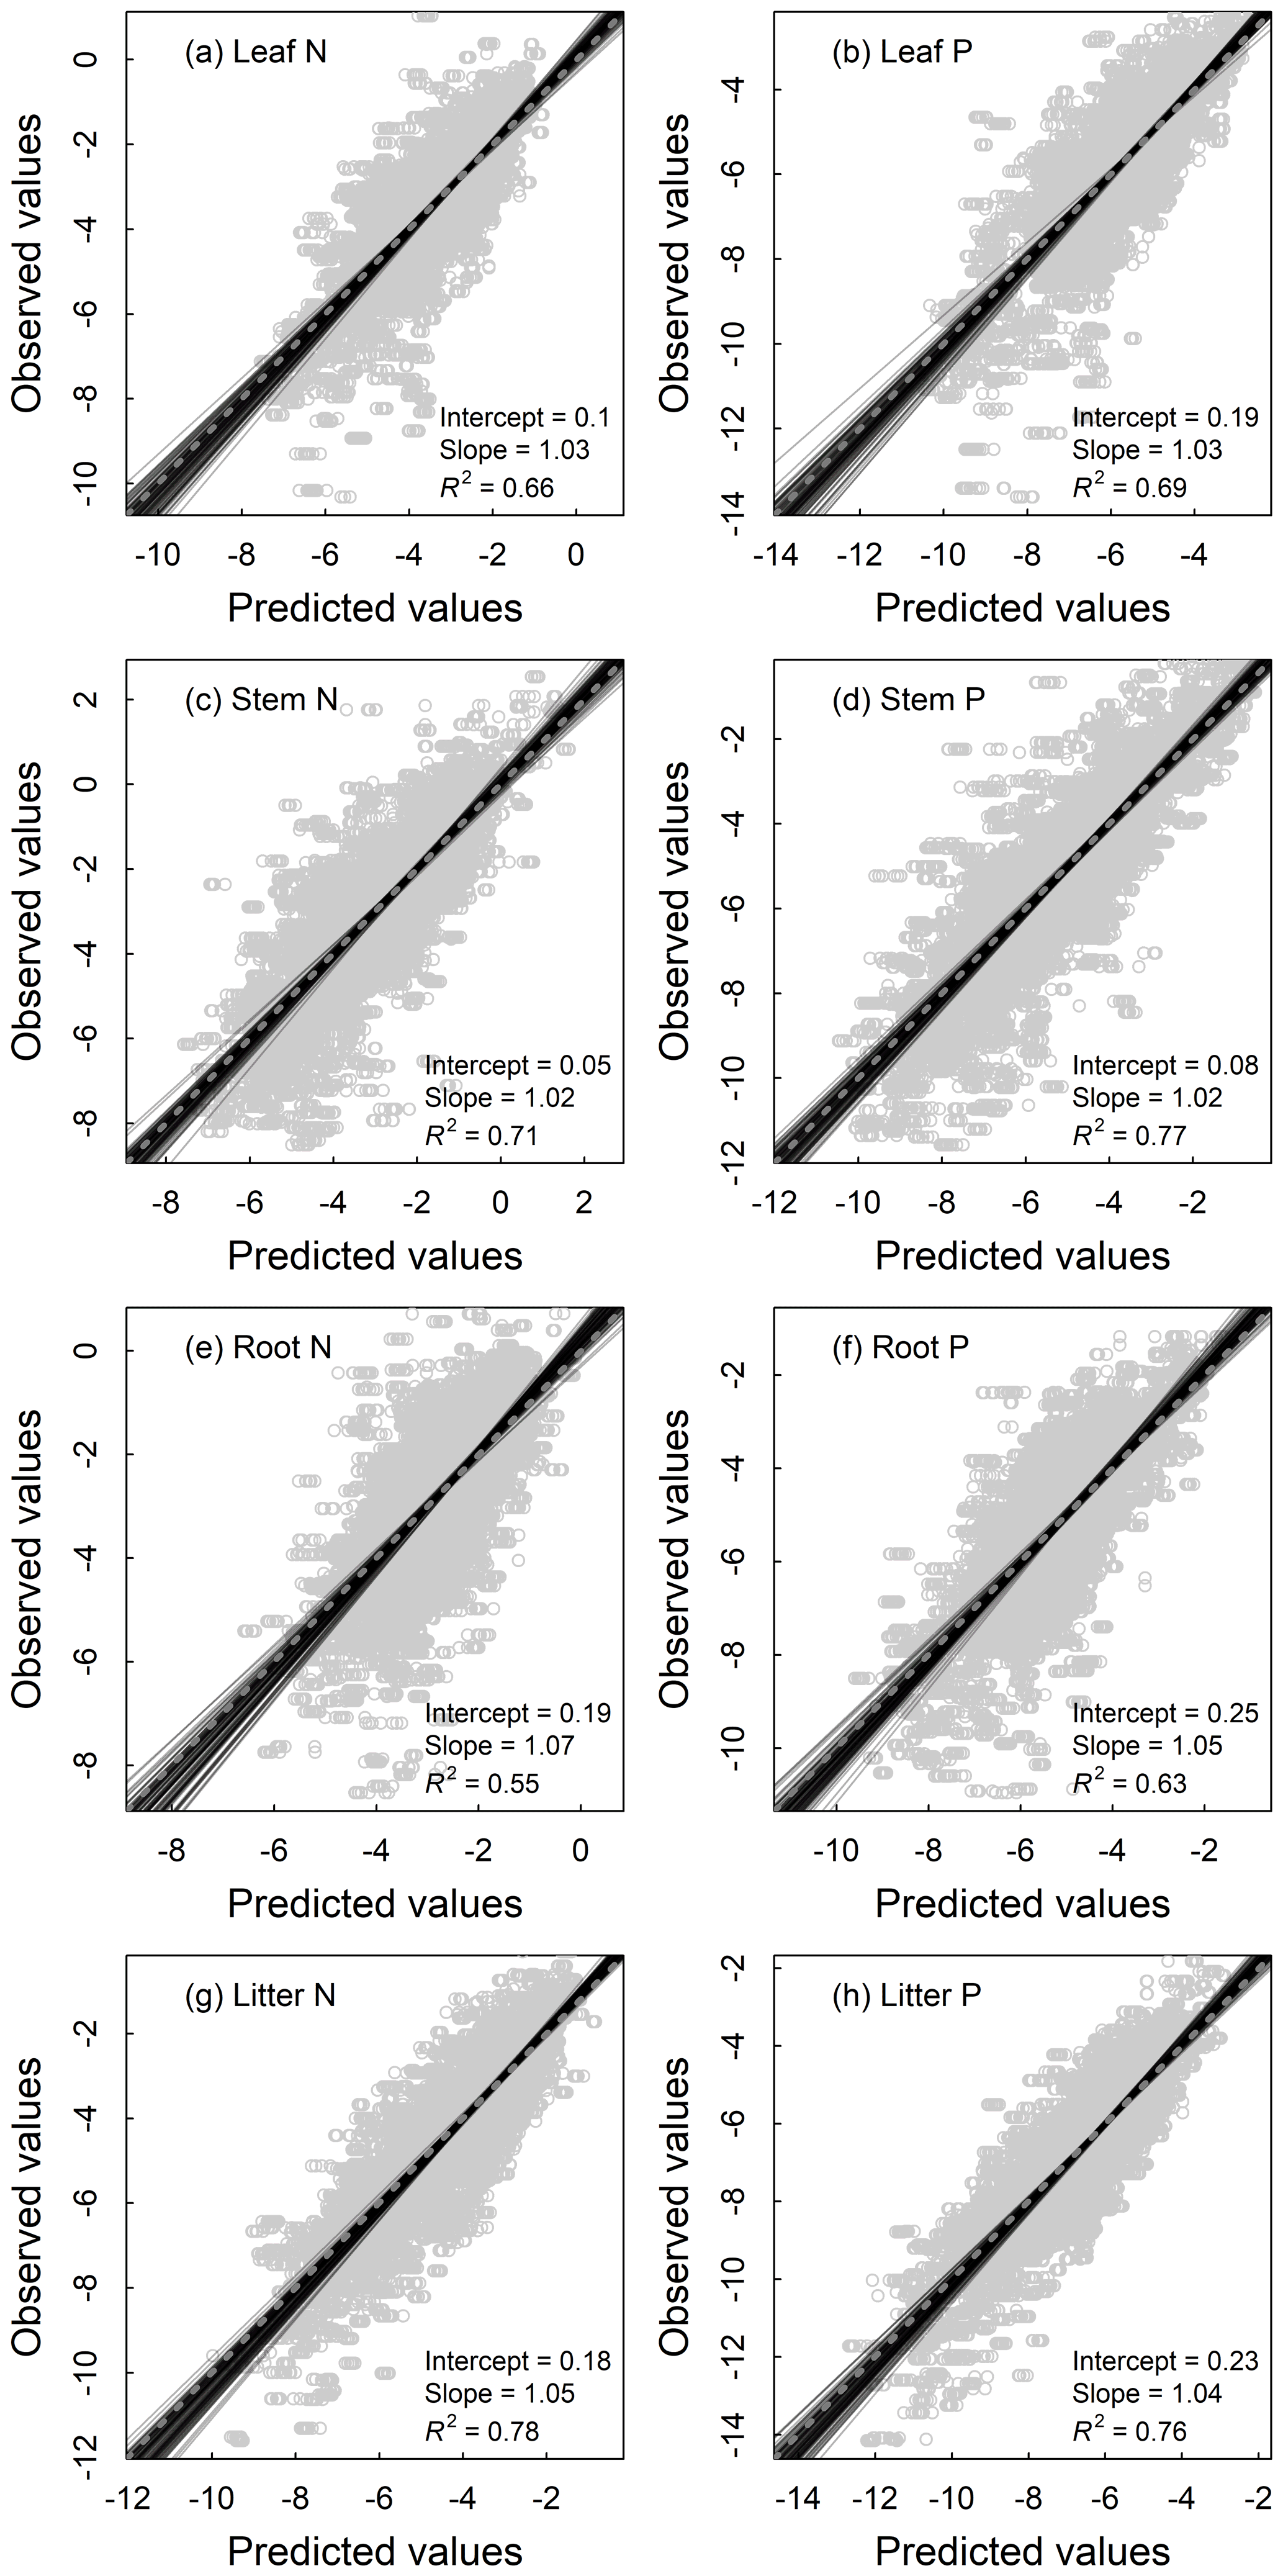
Figure 4Fitting performance of random forest models for nutrient densities of leaves (a, b), woody stems (c, d), roots (e, f), and litter (g, h) of terrestrial ecosystems in China based on 100 replications with the 10 % validation data. Solid lines represent all the fitting lines, and the displayed parameters stand for the average conditions. The dashed line denotes the 1:1 line.
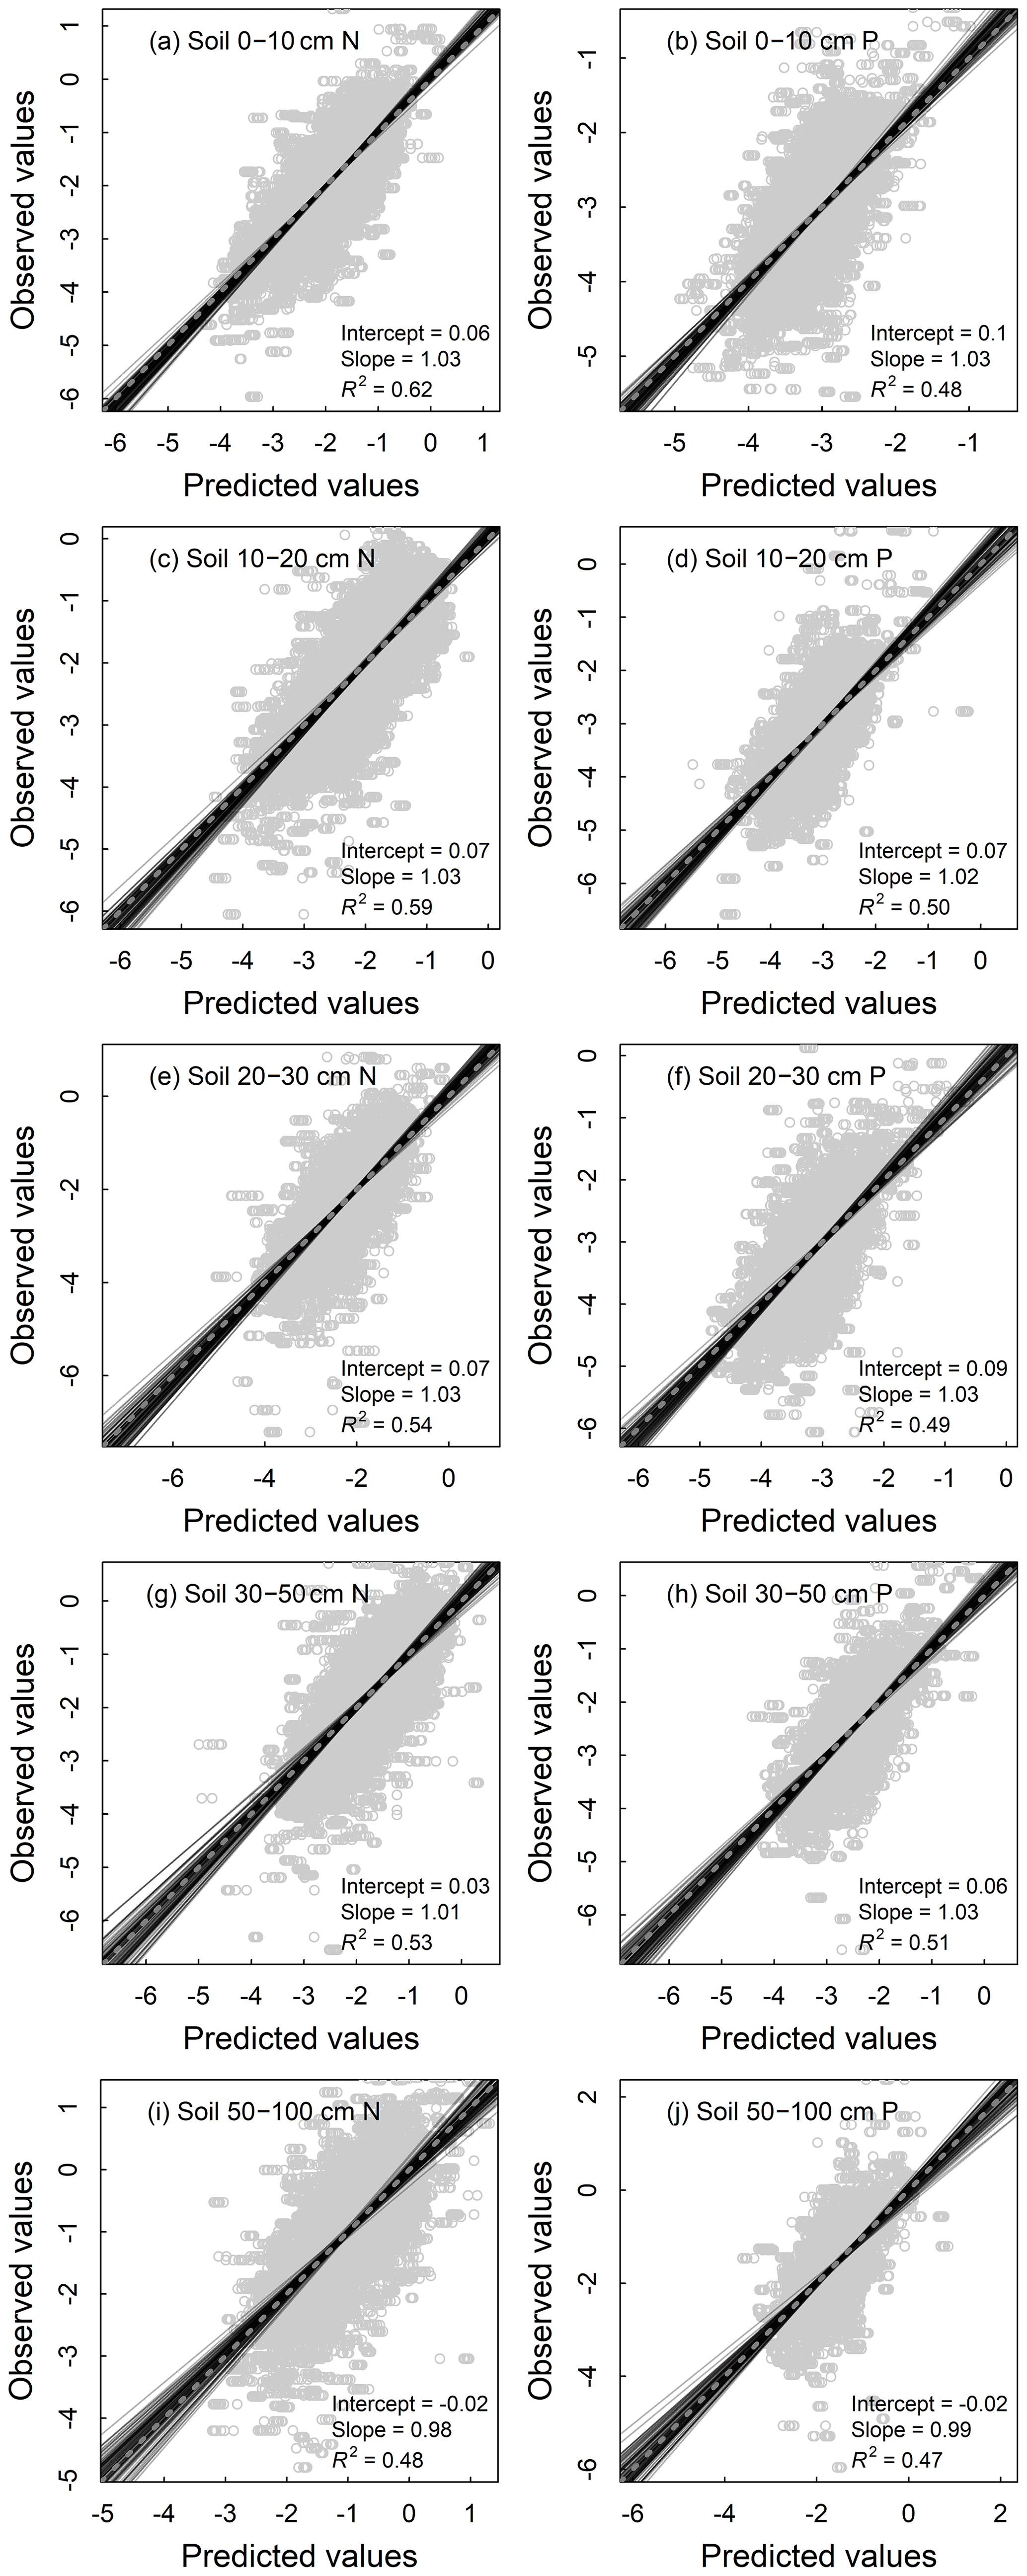
Figure 5Fitting performance of random forest models for nutrient densities of 0–10 cm (a, b), 10–20 cm (c, d), 20–30 cm (e, f), 30–50 cm (g, h), and 50–100 cm (i, j) soil layers of terrestrial ecosystems in China based on 100 replications with the 10 % validation data. Solid lines represent all the fitting lines, and the displayed parameters stand for the average conditions. The dashed line denotes the 1:1 line.
Leaf N density was high in southern and eastern China but low in northern and western China. It was especially high in the Changbai Mountains, southern Tibet, and the south-eastern coastal areas (Fig. 6a; see Fig. S1b for the topographic map of China), while it was low in northern Xinjiang and northern Inner Mongolia. The woody stem and litter N densities showed similar patterns to that of the leaves (Fig. 6c and g), whereas root N density was high in Mount Tianshan, Mount Alta, the Qinghai–Tibetan Plateau, the north-eastern mountainous area, and eastern Inner Mongolia (Fig. 6e). The vegetation N density was relatively higher in eastern China, the eastern Qinghai–Tibetan Plateau, Mount Tianshan, and Mount Alta (Fig. 7a). The soil and ecosystem N densities were low in northern China except the Changbai Mountains, Mount Tianshan, and Mount Alta but high in the eastern Qinghai–Tibetan Plateau and Yunnan Province (Fig. 7c and e).

Figure 6Predicted spatial patterns of N and P densities with a resolution of 1 km in leaves (a, b), woody stems (c, d), roots (e, f), and litter (g, h) of terrestrial ecosystems in China.
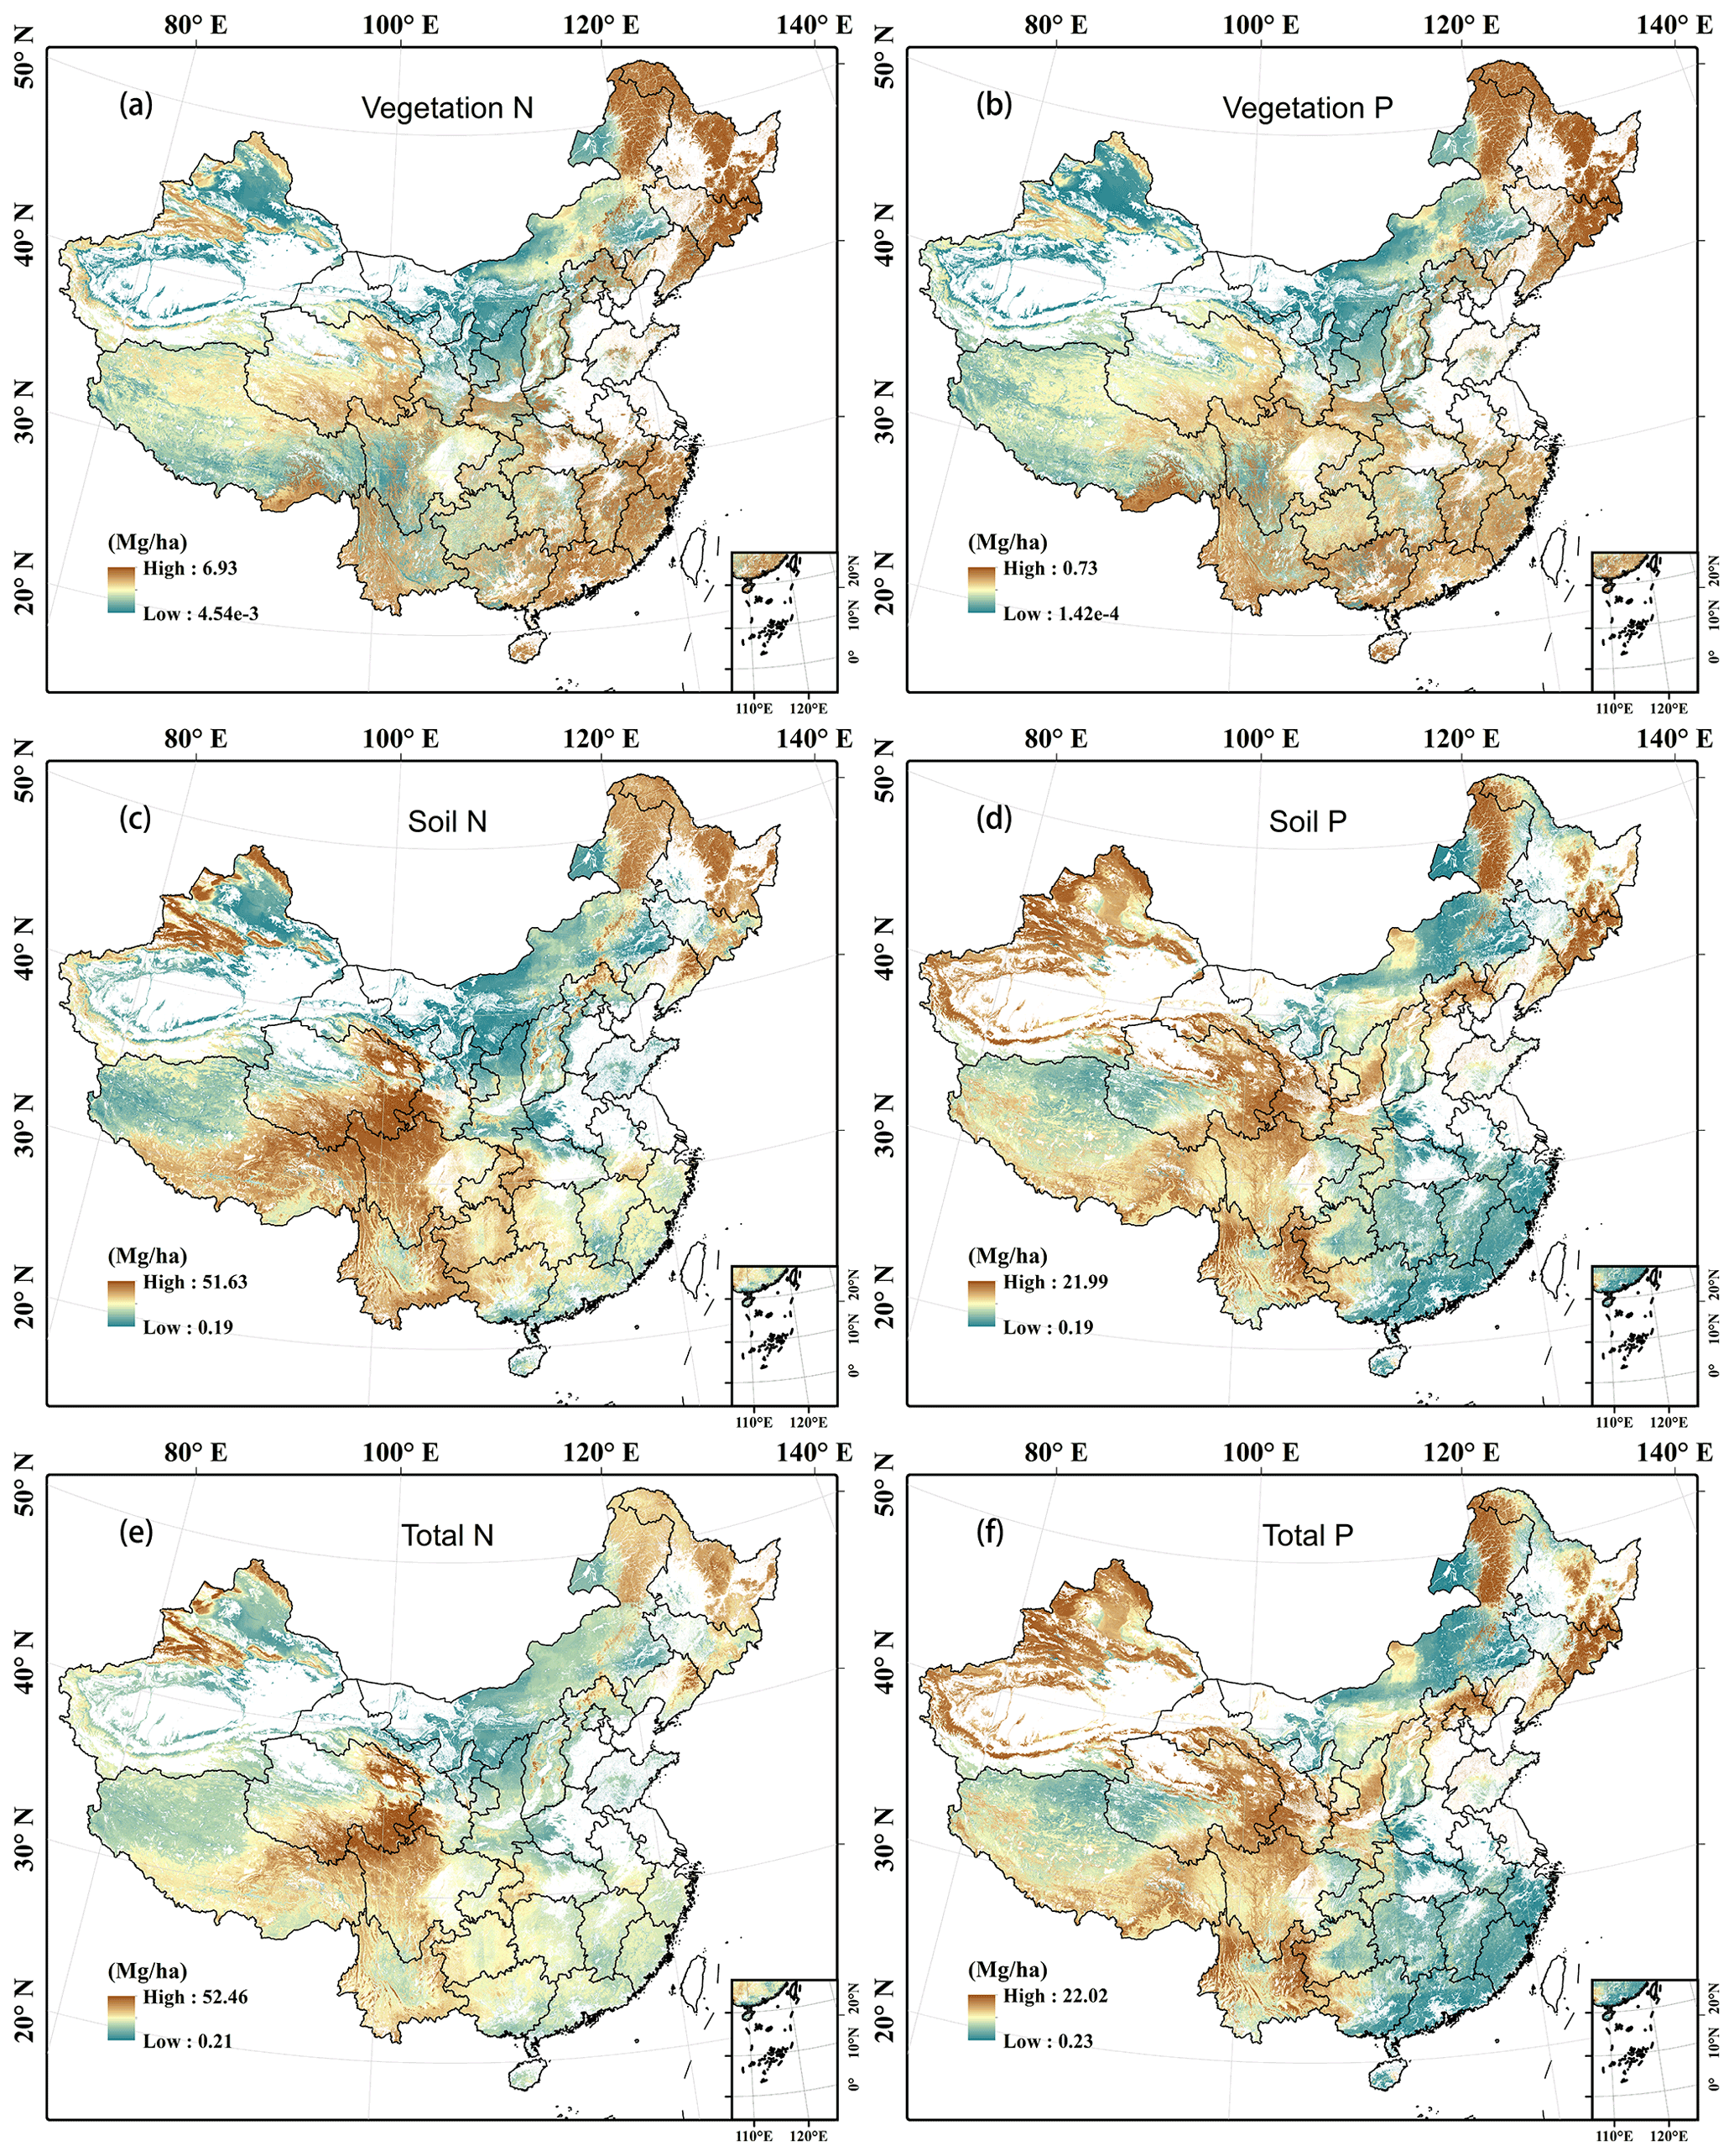
Figure 7Predicted spatial patterns of N and P densities with a resolution of 1 km in vegetation (a, b: the sum of leaves, stems, and roots), soil (c, d: the sum of five layers), and ecosystems (e, f: the sum of vegetation, litter, and soil) of terrestrial ecosystems in China.
The P densities in leaves, woody stems, roots, litter, and the whole vegetation showed similar patterns to the N densities in the corresponding components, respectively (Figs. 6b, d, f, and h and Fig. 7b). However, soil and ecosystem P densities were high in western and northern China but low in eastern and southern China (Fig. 7d and f).
The N and P concentrations in plant organs and litter were generally higher in northern and western mountain regions, but larger values of the former often occur in the north-western part of China, while those of the latter often occur in the north-eastern part of China (Fig. S6a–h). The spatial patterns of soil nutrient concentrations at different depths were consistent with those of soil nutrient densities (Fig. S6i–r).
The N:P ratio of plant organs and litter showed similar distribution patterns, with higher values occurring in south-eastern and north-western China and the Qinghai–Tibetan Plateau (Fig. S7a–d). Soil N:P ratio was higher in north-eastern and southern China but lower in north-western China (Fig. S7e).
3.3 N and P pools in China's terrestrial ecosystems
In total, the terrestrial ecosystems in China stored 6803.6 Tg N, with 2634.9, 873.0, and 3295.8 Tg N stored in the forests, shrublands, and grasslands, respectively (Table 1). Vegetation, litter, and soil stored 156.7 (2.3 %), 11.7 (0.2 %), and 6635.2 Tg N (97.5 %), respectively (Table 1).
Table 1N and P stocks of vegetation, litter, soil, and total ecosystem in forests, shrublands, and grasslands in China.
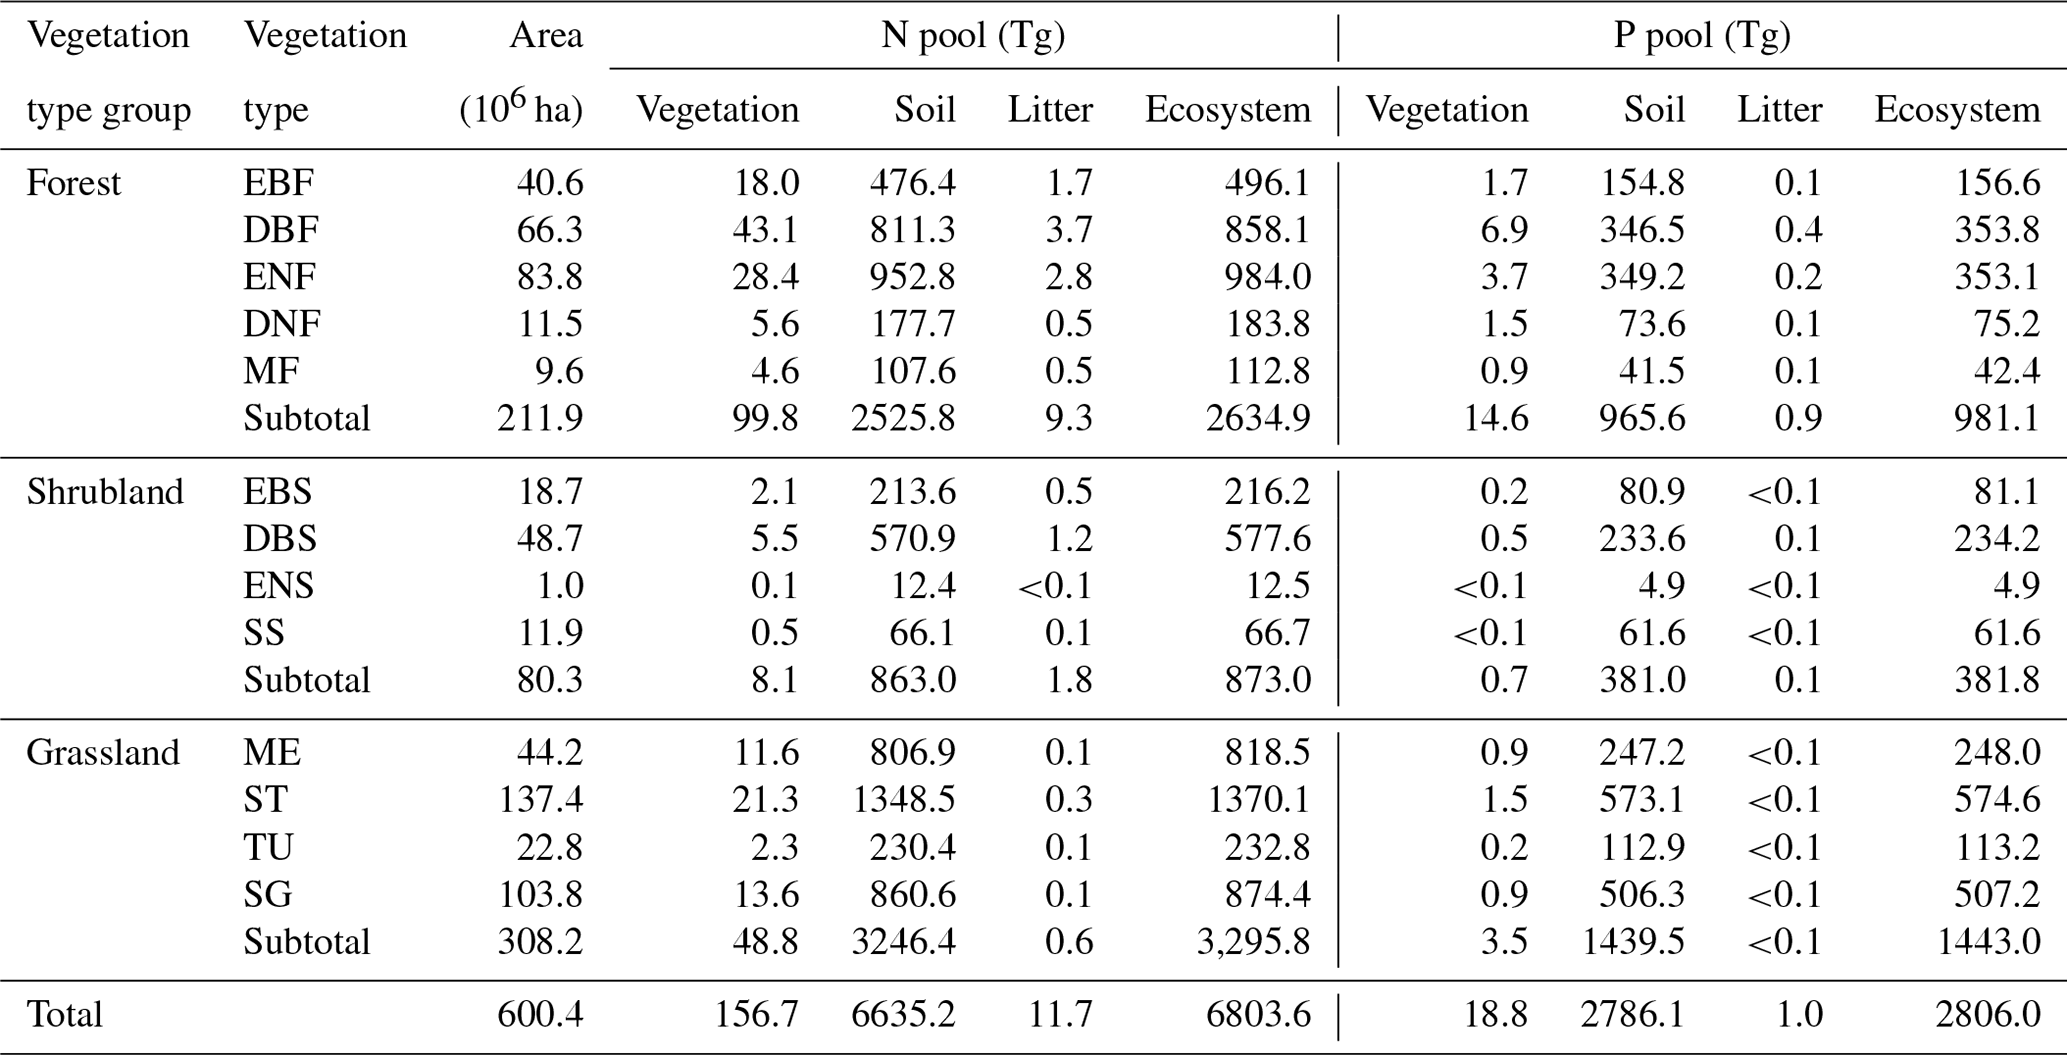
EBF, evergreen broadleaf forest; DBF, deciduous broadleaf forest; ENF, evergreen needle-leaf forest; DNF, deciduous needle-leaf forest; MF, broadleaf and needle-leaf mixed forest; EBS, evergreen broadleaf shrubland; DBS, deciduous broadleaf shrubland; ENS, evergreen needle-leaf shrubland; SS, sparse shrubland; ME, meadow; ST, steppe; TU, tussock; and SG, sparse grassland.
China's terrestrial ecosystems stored 2806.0 Tg P, with 981.1, 381.8, and 1443.0 Tg P stored in the forest, shrublands, and grasslands, respectively. Vegetation, litter, and soil accounted for 18.8 (0.7 %), 1.0 (<0.1 %), and 2786.1 Tg P (99.3 %), respectively (Table 1).
Meanwhile, N and P stocks among plant organs showed different allocation patterns (Table 2). Compared with the other two vegetation type groups, forests allocated the majority of N and P to the stem pool (55.5 Tg N and 9.2 Tg P), followed by the root pool (23.4 Tg N and 3.3 Tg P) and leaf pool (21.0 Tg N and 2.1 Tg P). However, the root pools in shrublands and grasslands held the most N and P (3.8 Tg N and 0.3 Tg P for shrublands, 44.1 Tg N and 3.1 Tg P for grasslands) (Table 2).
Table 2N and P stocks of plant organs (leaf, stem, and root) in forests, shrublands, and grasslands in China.
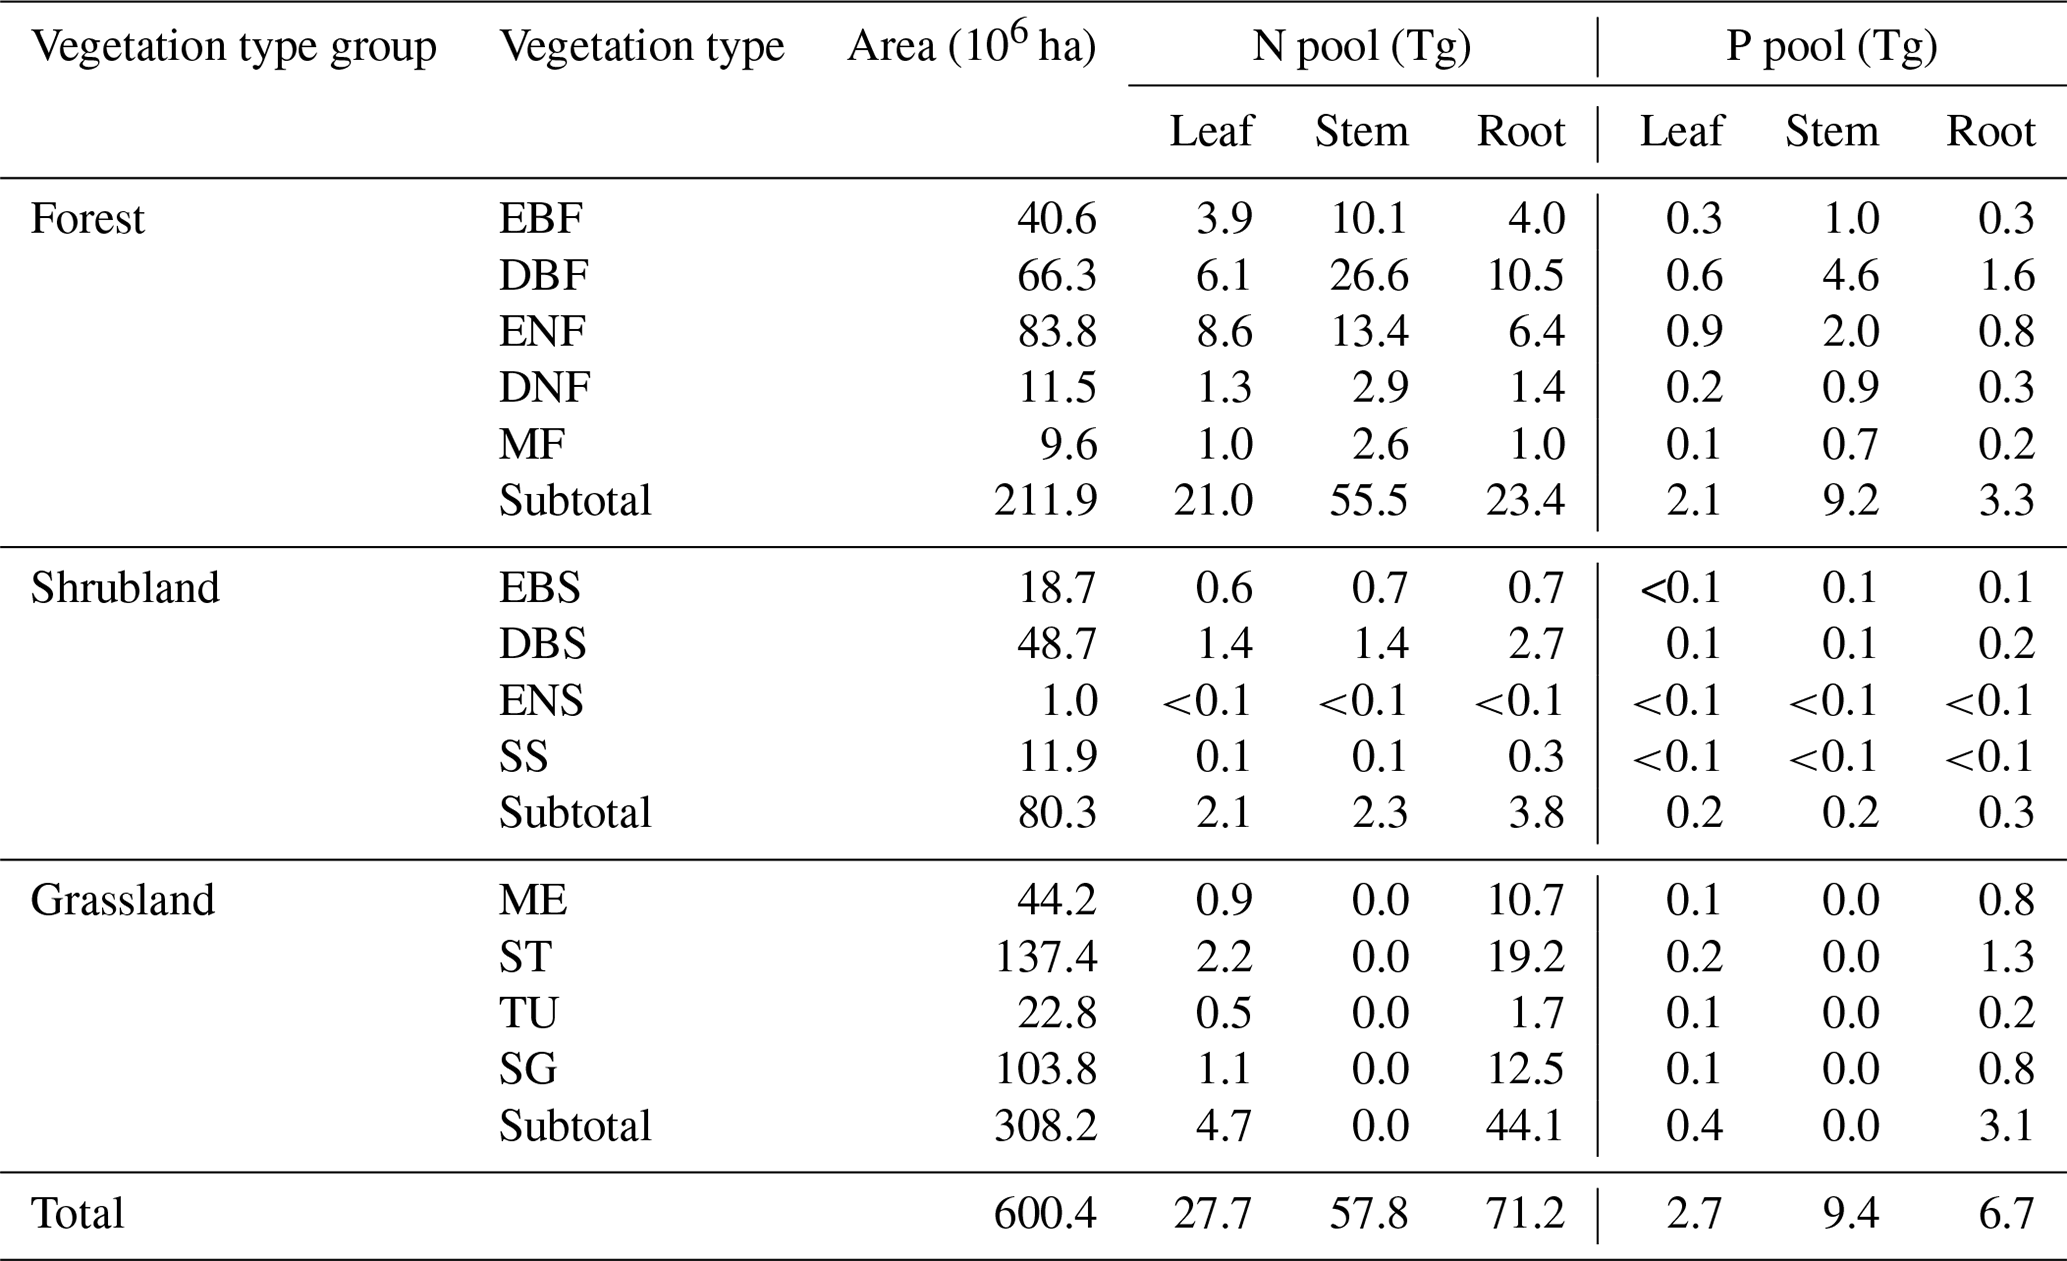
See Table 1 for abbreviations.
Among the four grassland types, steppes had the largest N and P stocks (1370.1 Tg N and 574.6 Tg P), taking the ecosystem as a whole. Deciduous broadleaf shrublands had the largest N and P stocks considering the whole ecosystem (577.6 Tg N and 234.2 Tg P) as well as vegetation (5.5 Tg N and 0.5 Tg P) compared with the other three shrubland types. The largest ecosystem N and P stocks across all five forest types appeared in evergreen needle-leaf forests (984.0 Tg N) and deciduous broadleaf forest (353.8 Tg P) (Table 1).
The datasets of N and P densities and concentration of different ecosystem components, “Patterns of nitrogen and phosphorus pools in terrestrial ecosystems in China”, are available from the Dryad digital repository along with the geographic coordinates of field sites and layer files of environmental factors for prediction (https://doi.org/10.5061/dryad.6hdr7sqzx) (Zhang et al., 2021).
5.1 Performance of density models
The accuracy of the density models varied among different components. Models for soil showed relatively poorer accuracy than models for plant organs and litter (Figs. 4 and 5), partly because the soil N and P were largely influenced by geological conditions, soil age, and parent material (Buol and Eswaran, 1999; Doetterl et al., 2015), which were not included in our analysis because of the limited data availability. This can be evidenced by the decreasing validation R2 of the models for soil N and P concentrations as well as N densities with soil depths (Figs. 5 and S3). The models preformed best for the stem N and P because woody stems occupied the most biomass in the forest and shrublands (stem biomass and vegetation biomass accounted for 68 % and 48 % of vegetation biomass for forest and shrublands, respectively). Climate variables could affect vegetation growth and biomass accumulation, and the variation in stem biomass could be the most direct reflection (Kirilenko and Sedjo, 2007; Jozsa and Powell, 1987; Poudel et al., 2011).
It is also noteworthy that the values of the validation R2 of the density models were higher than those of the concentration models for plant organs and litter (Figs. 4 and S2), which was opposite for soil layers (Figs. 5 and S3). They might reflect that biomass was more constrained by the selected factors in this study than nutrient concentrations in vegetation, while bulk density was less affected than nutrient concentrations in soil.
5.2 Nutrient pools in terrestrial ecosystems in China
Previous research has estimated N and P stocks in soil across China. For example, Shangguan et al. (2013) estimated that the storage of soil total N and P in the upper 1 m of soil in China were 6.6 and 4.5 Pg. Yang et al. (2007) estimated China's average density of soil N at a depth of 1 m, which was 0.84 kg m−2, and the soil N stock was 7.4 Pg. Zhang et al. (2005) investigated the soil total P pool at a depth of 50 cm in China and concluded that the soil stock was 3.5 Pg, with the total P density of soil 8.3×10² g m−3. Our estimation of the soil N pool in China (6.6 Pg) agreed with Shangguan et al. (2013), but the estimated soil P pool (2.8 Pg) was lower than the results of the aforementioned studies. The mean soil N:P ratio in our study (2.5 for the predicted outcome and 2.1 for the sampling sites) was lower than the result of Tian et al. (2010), 5.2, while the spatial patterns in both studies are similar. Other than the research focusing on soil, Xu et al. (2020) estimated China's N storage by calculating the mean N densities of vegetation and soil from different ecoregions and reported that there was 10.43 Pg N in China's ecosystems, 10.14 Pg N in the top 1 m of soil and 0.29 Pg N in vegetation, both higher than our results (6.6 Pg N in soil and 0.16 Pg N in vegetation).
5.3 Potential driving factors of the N and P densities in various components
The distribution and allocation of N and P pools in ecosystems were largely determined by vegetation types and climate. The difference in the spatial patterns of nutrient pools could reflect the spatial variation in local vegetation. For example, it is obvious that the regions covered by forests tend to have higher aboveground nutrient densities than those covered by other types, while the regions covered by sparse shrublands tend to have the lowest nutrient densities (Fig. 3). Despite its decisive influences on vegetation types, climate also greatly impacts the nutrient utilization strategies of vegetation (Kirilenko and Sedjo, 2007; Poudel et al., 2011). For example, in south-eastern China, with higher precipitation and temperature, forests tend to allot more nutrients to organs related to growth, such as leaves that perform photosynthesis and stems that are related to resource transport and light competition (Zhang et al., 2018). These influences were reflected in our models (Figs. S8–S11). In the models of densities for plant organs and litter, vegetation types and climate variables showed higher relative importance. Heat and water are usually limited in the plateau and desert regions in western China, where shrublands and grasslands are dominant vegetation type groups. More nutrients are allocated to root systems by dominant plants in such stressful habitats to acquire resources from soil (Eziz et al., 2017; Kramer-Walter and Laughlin, 2017). Spatial variables, longitude and latitude, also held high importance, especially in the models for soil nutrients. On the one hand, it may result from their tight links with climate conditions. On the other hand, it may imply the influence of spatial correlation on nutrient pools. The effects of elevation and spatial variables were obvious from the prediction maps. There were relatively larger values of soil nutrient densities in the plateau and mountainous area in western China, possibly because of the lower rates of decomposition, mineralization, and nutrient input as well as less leaching loss in high-altitude regions (Bonito et al., 2003; Vincent et al., 2014). However, the distribution patterns of soil nutrient densities in eastern China were generally consistent with the soil substrate age hypothesis that the younger and less leached soil in temperate regions tends to be more N-limited but less P-limited than the elder and more leached soil in tropical and subtropical regions (Reich and Oleksyn, 2004; Vitousek et al., 2010; Walker and Syers, 1976). Additionally, such patterns reflect that the factors not investigated in this study, such as soil age and parent material, could contribute to the patterns of nutrient pools, which should be considered in future research as potential drivers (Augusto et al., 2017; Porder and Chadwick, 2009).
5.4 Potential applications of the data
An atmospheric CO2 enrichment trend was undoubtable, but how this procedure will develop is still unclear (Fatichi et al., 2019). A number of previous studies proved that global carbon cycle models would produce remarkable bias if the coupled nutrient cycle is overlooked (Fleischer et al., 2019; Hungate et al., 2003; Thornton et al., 2007). However, high-resolution and accurate ecosystem nutrient datasets were unattainable and hard to be modelled without an enormous field investigation basis. This study relied on nationwide field survey data, providing comprehensive N and P density datasets of different ecosystem components. Based on the present dataset, enhancement could be made in various ecosystem research aspects.
First and foremost, the dataset could facilitate the improvement in the prediction of large-scale terrestrial C budget, thereby allowing us to better understand patterns and mechanisms of the C cycle as well as the future trend of climate change (Le Quéré et al., 2018). Numerous projections of future C sequestration overestimated the amount of C fixed by vegetation due to the neglect of nutrient limitation (Houghton et al., 2001; Cramer et al., 2001). Global C cycling models coupled with the nutrient cycle may make more accurate predictions of carbon dynamics. Moreover, our dataset illustrated N and P densities of major ecosystem components and vegetation types at a high spatial resolution for the first time, which could help identify C and nutrient allocation patterns from the tissue level to the community level, especially for vegetation organs which still lack large-scale nutrient datasets.
In addition, large-scale N and P pool spatial patterns could provide the data references for vegetation research using remote sensing (Jetz et al., 2016). Vegetation nutrient densities were important traits but hard to be extracted and detected remotely. With the development of hyperspectral remote sensing technology and the theory of spectral diversity, foliar nutrient traits can be successfully predicted (Skidmore et al., 2010; Wang et al., 2019). However, previous studies still focused on finer-scale patterns and were constrained by the lack of large-scale field datasets for uncertainty assessment (Singh et al., 2015). Our nationwide nutrient dataset offers an opportunity to enlarge the generality of remote sensing models and algorithms at large scales.
The supplement related to this article is available online at: https://doi.org/10.5194/essd-13-5337-2021-supplement.
ZT designed the research. YWZ, YG, YF, and XZ analysed the data. WX, YB, GZ, ZX, and ZT organized the field investigation. YWZ, YG, and ZT wrote the manuscript, and all authors contributed substantially to revisions.
The contact author has declared that neither they nor their co-authors have any competing interests.
Publisher’s note: Copernicus Publications remains neutral with regard to jurisdictional claims in published maps and institutional affiliations.
We thank members of the terrestrial ecosystem carbon projects for helping to collect the original field data.
This research has been supported by the National Key Research and Development Program of China (grant no. 2019YFA0606602), the National Natural Science Foundation of China (grant nos. 32025025, 31770489, and 31988102), and the Strategic Priority Research Programme of the Chinese Academy of Sciences (grant no. XDA05050000).
This paper was edited by David Carlson and reviewed by Enqing Hou and one anonymous referee.
Achat, D. L., Bakker, M. R., and Morel, C.: Process-based assessment of phosphorus availability in a low phosphorus sorbing forest soil using isotopic dilution methods, Soil Sci. Soc. Am. J., 73, 2131–2142, 2009.
Augusto, L., Achat, D. L., Jonard, M., Vidal, D., and Ringeval, B.: Soil parent material-A major driver of plant nutrient limitations in terrestrial ecosystems, Glob. Chang Biol., 23, 3808–3824, https://doi.org/10.1111/gcb.13691, 2017.
Bonan, G. B.: Carbon and nitrogen cycling in North American boreal forests, Biogeochemistry, 10, 1–28, https://doi.org/10.1007/BF00000889, 1990.
Bonito, G. M., Coleman, D. C., Haines, B. L., and Cabrera, M. L.: Can nitrogen budgets explain differences in soil nitrogen mineralization rates of forest stands along an elevation gradient?, Forest Ecol. Manag., 176, 563–574, https://doi.org/10.1016/S0378-1127(02)00234-7, 2003.
Buol, S. W. and Eswaran, H.: Oxisols, in: Advances in Agronomy, vol. 68, edited by: Sparks, D. L., Academic Press, New York, USA, 151–195, https://doi.org/10.1016/S0065-2113(08)60845-7, 1999.
Campany, C. E., Medlyn, B. E., and Duursma, R. A.: Reduced growth due to belowground sink limitation is not fully explained by reduced photosynthesis, Tree Physiol., 37, 1042–1054, https://doi.org/10.1093/treephys/tpx038, 2017.
Carvajal, M., Cooke, D. T., and Clarkson, D. T.: Responses of wheat plants to nutrient deprivation may involve the regulation of water-channel function, Planta, 199, 372–381, https://doi.org/10.1007/BF00195729, 1996.
Cheeseman, J. M. and Lovelock, C. E.: Photosynthetic characteristics of dwarf and fringe Rhizophora mangle L. in a Belizean mangrove, Plant Cell Environ., 27, 769–780, https://doi.org/10.1111/j.1365-3040.2004.01181.x, 2004.
Chen, C., Park, T., Wang, X., Piao, S., Xu, B., Chaturvedi, R. K., Fuchs, R., Brovkin, V., Ciais, P., Fensholt, R., Tømmervik, H., Bala, G., Zhu, Z., Nemani, R. R., and Myneni, R. B.: China and India lead in greening of the world through land-use management, Nat. Sustain., 2, 122–129, https://doi.org/10.1038/s41893-019-0220-7, 2019.
Cleveland, C. C., Houlton, B. Z., Smith, W. K., Marklein, A. R., Reed, S. C., Parton, W., Grosso, S. J. D., and Running, S. W.: Patterns of new versus recycled primary production in the terrestrial biosphere, P. Natl. Acad. Sci. USA, 110, 12733–12737, https://doi.org/10.1073/pnas.1302768110, 2013.
Cramer, W., Bondeau, A., Woodward, F. I., Prentice, I. C., Betts, R. A., Brovkin, V., Cox, P. M., Fisher, V., Foley, J. A., Friend, A. D., Kucharik, C., Lomas, M. R., Ramankutty, N., Sitch, S., Smith, B., White, A., and Young-Molling, C.: Global response of terrestrial ecosystem structure and function to CO2 and climate change: results from six dynamic global vegetation models, Glob. Change Biol., 7, 357–373, https://doi.org/10.1046/j.1365-2486.2001.00383.x, 2001.
Doetterl, S., Stevens, A., Six, J., Merckx, R., Van Oost, K., Casanova Pinto, M., Casanova-Katny, A., Muñoz, C., Boudin, M., Zagal Venegas, E., and Boeckx, P.: Soil carbon storage controlled by interactions between geochemistry and climate, Nat. Geosci., 8, 780–783, https://doi.org/10.1038/ngeo2516, 2015.
Du, E., Terrer, C., Pellegrini, A. F. A., Ahlström, A., van Lissa, C. J., Zhao, X., Xia, N., Wu, X., and Jackson, R. B.: Global patterns of terrestrial nitrogen and phosphorus limitation, Nat. Geosci., 221–226, https://doi.org/10.1038/s41561-019-0530-4, 2020.
Elser, J. J., Acharya, K., Kyle, M., Cotner, J., Makino, W., Markow, T., Watts, T., Hobbie, S., Fagan, W., Schade, J., Hood, J., and Sterner, R. W.: Growth rate–stoichiometry couplings in diverse biota, Ecol. Lett., 6, 936–943, https://doi.org/10.1046/j.1461-0248.2003.00518.x, 2003.
Elser, J. J., Bracken, M. E. S., Cleland, E. E., Gruner, D. S., Harpole, W. S., Hillebrand, H., Ngai, J. T., Seabloom, E. W., Shurin, J. B., and Smith, J. E.: Global analysis of nitrogen and phosphorus limitation of primary producers in freshwater, marine and terrestrial ecosystems, Ecol. Lett., 10, 1135–1142, https://doi.org/10.1111/j.1461-0248.2007.01113.x, 2007.
Elser, J. J., Fagan, W. F., Kerkhoff, A. J., Swenson, N. G., and Enquist, B. J.: Biological stoichiometry of plant production: metabolism, scaling and ecological response to global change, in: Tansley review, New Phytol., 186, 593–608, https://doi.org/10.1111/j.1469-8137.2010.03214.x, 2010.
Eziz, A., Yan, Z., Tian, D., Han, W., Tang, Z., and Fang, J.: Drought effect on plant biomass allocation: a meta-analysis, Ecol. Evol., 7, 11002–11010, https://doi.org/10.1002/ece3.3630, 2017.
Fatichi, S., Pappas, C., Zscheischler, J., and Leuzinger, S.: Modelling carbon sources and sinks in terrestrial vegetation, New Phytol., 221, 652–668, https://doi.org/10.1111/nph.15451, 2019.
Fernández-Martínez, M., Pearse, I., Sardans, J., Sayol, F., Koenig, W. D., LaMontagne, J. M., Bogdziewicz, M., Collalti, A., Hacket-Pain, A., Vacchiano, G., Espelta, J. M., Peñuelas, J., and Janssens, I. A.: Nutrient scarcity as a selective pressure for mast seeding, Nat. Plants, 5, 1222–1228, https://doi.org/10.1038/s41477-019-0549-y, 2019.
Field, C.: Allocating leaf nitrogen for the maximization of carbon gain: Leaf age as a control on the allocation program, Oecologia, 56, 341–347, https://doi.org/10.1007/BF00379710, 1983.
Finzi, A. C., Norby, R. J., Calfapietra, C., Gallet-Budynek, A., Gielen, B., Holmes, W. E., Hoosbeek, M. R., Iversen, C. M., Jackson, R. B., Kubiske, M. E., Ledford, J., Liberloo, M., Oren, R., Polle, A., Pritchard, S., Zak, D. R., Schlesinger, W. H., and Ceulemans, R.: Increases in nitrogen uptake rather than nitrogen-use efficiency support higher rates of temperate forest productivity under elevated CO2, P. Natl. Acad. Sci. USA, 104, 14014–14019, https://doi.org/10.1073/pnas.0706518104, 2007.
Fisher, J. B., Badgley, G., and Blyth, E.: Global nutrient limitation in terrestrial vegetation, Glob. Biogeochem. Cycle, 26, GB3007, https://doi.org/10.1029/2011GB004252, 2012.
Fleischer, K., Rammig, A., De Kauwe, M. G., Walker, A. P., Domingues, T. F., Fuchslueger, L., Garcia, S., Goll, D. S., Grandis, A., Jiang, M., Haverd, V., Hofhansl, F., Holm, J. A., Kruijt, B., Leung, F., Medlyn, B. E., Mercado, L. M., Norby, R. J., Pak, B., von Randow, C., Quesada, C. A., Schaap, K. J., Valverde-Barrantes, O. J., Wang, Y.-P., Yang, X., Zaehle, S., Zhu, Q., and Lapola, D. M.: Amazon forest response to CO2 fertilization dependent on plant phosphorus acquisition, Nat. Geosci., 12, 736–741, https://doi.org/10.1038/s41561-019-0404-9, 2019.
Föllmi, K. B.: The phosphorus cycle, phosphogenesis and marine phosphate-rich deposits, Earth-Sci. Rev., 40, 55–124, https://doi.org/10.1016/0012-8252(95)00049-6, 1996.
Hou, E., Luo, Y., Kuang, Y., Chen, C., Lu, X., Jiang, L., Luo, X., and Wen, D.: Global meta-analysis shows pervasive phosphorus limitation of aboveground plant production in natural terrestrial ecosystems, Nat. Commun., 11, 637, https://doi.org/10.1038/s41467-020-14492-w, 2020.
Houghton, J. T., Ding, Y., Griggs, D. J., Noguer, M., van der Linden, P. J., Dai, X., Maskell, K., and Johnson, C. A. (Eds.): Climate Change 2001: The Scientific Basis, Cambridge University Press, Cambridge, UK, 2001.
Hungate, B. A., Dukes, J. S., Shaw, M. R., Luo, Y., and Field, C. B.: Nitrogen and climate change, Science, 302, 1512–1513, https://doi.org/10.1126/science.1091390, 2003.
Jetz, W., Cavender-Bares, J., Pavlick, R., Schimel, D., Davis, F. W., Asner, G. P., Guralnick, R., Kattge, J., Latimer, A. M., Moorcroft, P., Schaepman, M. E., Schildhauer, M. P., Schneider, F. D., Schrodt, F., Stahl, U., and Ustin, S. L.: Monitoring plant functional diversity from space, Nat. Plants, 2, 16024, https://doi.org/10.1038/nplants.2016.24, 2016.
Jones Jr., J. B.: Laboratory guide for conducting soil tests and plant analysis, CRC press, Boca Raton, US, 76–77, https://doi.org/10.1201/9781420025293, ISBN: 9780429132117, 2001.
Jozsa, L. A. and Powell, J. M.: Some climatic aspects of biomass productivity of white spruce stem wood, Can. J. For. Res., 17, 1075–1079, https://doi.org/10.1139/x87-165, 1987.
Kirilenko, A. P. and Sedjo, R. A.: Climate change impacts on forestry, P. Natl. Acad. Sci. USA, 104, 19697–19702, https://doi.org/10.1073/pnas.0701424104, 2007.
Kramer-Walter, K. R. and Laughlin, D. C.: Root nutrient concentration and biomass allocation are more plastic than morphological traits in response to nutrient limitation, Plant Soil, 416, 539–550, https://doi.org/10.1007/s11104-017-3234-9, 2017.
Land Cover Atlas of the People's Republic of China Editorial Board: Land Cover Atlas of the People's Republic of China (1:1000000), China Map Publishing House, Beijing, China, 2017.
LeBauer, D. S. and Treseder, K. K.: Nitrogen limitation of net primary productivity in terrestrial ecosystems is globally distributed, Ecology, 89, 371–379, https://doi.org/10.1890/06-2057.1, 2008.
Le Quéré, C., Andrew, R. M., Friedlingstein, P., Sitch, S., Pongratz, J., Manning, A. C., Korsbakken, J. I., Peters, G. P., Canadell, J. G., Jackson, R. B., Boden, T. A., Tans, P. P., Andrews, O. D., Arora, V. K., Bakker, D. C. E., Barbero, L., Becker, M., Betts, R. A., Bopp, L., Chevallier, F., Chini, L. P., Ciais, P., Cosca, C. E., Cross, J., Currie, K., Gasser, T., Harris, I., Hauck, J., Haverd, V., Houghton, R. A., Hunt, C. W., Hurtt, G., Ilyina, T., Jain, A. K., Kato, E., Kautz, M., Keeling, R. F., Klein Goldewijk, K., Körtzinger, A., Landschützer, P., Lefèvre, N., Lenton, A., Lienert, S., Lima, I., Lombardozzi, D., Metzl, N., Millero, F., Monteiro, P. M. S., Munro, D. R., Nabel, J. E. M. S., Nakaoka, S., Nojiri, Y., Padin, X. A., Peregon, A., Pfeil, B., Pierrot, D., Poulter, B., Rehder, G., Reimer, J., Rödenbeck, C., Schwinger, J., Séférian, R., Skjelvan, I., Stocker, B. D., Tian, H., Tilbrook, B., Tubiello, F. N., van der Laan-Luijkx, I. T., van der Werf, G. R., van Heuven, S., Viovy, N., Vuichard, N., Walker, A. P., Watson, A. J., Wiltshire, A. J., Zaehle, S., and Zhu, D.: Global Carbon Budget 2017, Earth Syst. Sci. Data, 10, 405–448, https://doi.org/10.5194/essd-10-405-2018, 2018.
Liaw, A. and Wiener, M.: Classification and regression by randomForest, R News, 2, 18–22, 2002.
Lovelock, C. E., Feller, I. C., Mckee, K. L., Engelbrecht, B. M. J., and Ball, M. C.: The effect of nutrient enrichment on growth, photosynthesis and hydraulic conductance of dwarf mangroves in Panama, Funct. Ecol., 18, 25–33, https://doi.org/10.1046/j.0269-8463.2004.00805.x, 2004.
Lovelock, C. E., Feller, I. C., Ball, M. C., Engelbrecht, B. M. J., and Ewe, M. L.: Differences in plant function in phosphorus- and nitrogen-limited mangrove ecosystems, New Phytol., 172, 514–522, https://doi.org/10.1111/j.1469-8137.2006.01851.x, 2006.
Lu, F., Hu, H., Sun, W., Zhu, J., Liu, G., Zhou, W., Zhang, Q., Shi, P., Liu, X., Wu, X., Zhang, L., Wei, X., Dai, L., Zhang, K., Sun, Y., Xue, S., Zhang, W., Xiong, D., Deng, L., Liu, B., Zhou, L., Zhang, C., Zheng, X., Cao, J., Huang, Y., He, N., Zhou, G., Bai, Y., Xie, Z., Tang, Z., Wu, B., Fang, J., Liu, G., and Yu, G.: Effects of national ecological restoration projects on carbon sequestration in China from 2001 to 2010, P. Natl. Acad. Sci. USA, 115, 4039–4044, https://doi.org/10.1073/pnas.1700294115, 2018.
Luo, Y., Su, B., Currie, W. S., Dukes, J. S., Finzi, A., Hartwig, U., Hungate, B., McMurtrie, R. E., Oren, R., Parton, W. J., Pataki, D. E., Shaw, R. M., Zak, D. R., and Field, C. B.: Progressive nitrogen limitation of ecosystem responses to rising atmospheric carbon dioxide, BioScience, 54, 731–739, https://doi.org/10.1641/0006-3568(2004)054[0731:PNLOER]2.0.CO;2, 2004.
McGrath, D. A., Comerford, N. B., and Duryea, M. L.: Litter dynamics and monthly fluctuations in soil phosphorus availability in an Amazonian agroforest, For. Ecol. Manage., 131, 167–181, https://doi.org/10.1016/S0378-1127(99)00207-8, 2000.
McVicar, T. R., Van Niel, T. G., Li, L., Hutchinson, M. F., Mu, X., and Liu, Z.: Spatially distributing monthly reference evapotranspiration and pan evaporation considering topographic influences, J. Hydrol., 338, 196–220, https://doi.org/10.1016/j.jhydrol.2007.02.018, 2007.
Miller, H. G.: Forest Fertilization: Some Guiding Concepts, Forestry, 54, 157–167, https://doi.org/10.1093/forestry/54.2.157, 1981.
Norby, R. J., Warren, J. M., Iversen, C. M., Medlyn, B. E., and McMurtrie, R. E.: CO2 enhancement of forest productivity constrained by limited nitrogen availability, P. Natl. Acad. Sci. USA, 107, 19368–19373, https://doi.org//10.1073/pnas.1006463107, 2010.
Parks, S. E., Haigh, A. M., and Cresswell, G. C.: Stem tissue phosphorus as an index of the phosphorus status of Banksia ericifolia L. f., Plant Soil, 227, 59–65, https://doi.org/10.1023/A:1026563926187, 2000.
Porder, S. and Chadwick, O. A.: Climate and soil-age constraints on nutrient uplift and retention by plants, Ecology, 90, 623–636, https://doi.org/10.1890/07-1739.1, 2009.
Poudel, B. C., Sathre, R., Gustavsson, L., Bergh, J., Lundström, A., and Hyvönen, R.: Effects of climate change on biomass production and substitution in north-central Sweden, Biomass Bioenerg., 35, 4340–4355, https://doi.org/10.1016/j.biombioe.2011.08.005, 2011.
Raaimakers, D., Boot, R. G. A., Dijkstra, P., Pot, S., and Pons, T.: Photosynthetic rates in relation to leaf phosphorus content in pioneer versus climax tropical rainforest trees, Oecologia, 102, 120–125, 1995.
R Core Team: R: A language and environment for statistical computing, Vienna, 2019.
Reed, S. C., Yang, X., and Thornton, P. E.: Incorporating phosphorus cycling into global modeling efforts: a worthwhile, tractable endeavor, New Phytol., 208, 324–329, https://doi.org/10.1111/nph.13521, 2015.
Reich, P. B. and Oleksyn, J.: Global patterns of plant leaf N and P in relation to temperature and latitude, P. Natl. Acad. Sci. USA, 101, 11001–11006, https://doi.org/10.1073/pnas.0403588101, 2004.
Shangguan, W., Dai, Y., Liu, B., Zhu, A., Duan, Q., Wu, L., Ji, D., Ye, A., Yuan, H., Zhang, Q., Chen, D., Chen, M., Chu, J., Dou, Y., Guo, J., Li, H., Li, J., Liang, L., Liang, X., Liu, H., Liu, S., Miao, C., and Zhang, Y.: A China data set of soil properties for land surface modeling, J. Adv. Model. Earth Syst., 5, 212–224, https://doi.org/10.1002/jame.20026, 2013.
Shangguan, W., Hengl, T., Mendes de Jesus, J., Yuan, H., and Dai, Y.: Mapping the global depth to bedrock for land surface modeling, J. Adv. Model. Earth Syst., 9, 65–88, https://doi.org/10.1002/2016MS000686, 2017.
Singh, A., Serbin, S. P., McNeil, B. E., Kingdon, C. C., and Townsend, P. A.: Imaging spectroscopy algorithms for mapping canopy foliar chemical and morphological traits and their uncertainties, Ecol. Appl., 25, 2180–2197, https://doi.org/10.1890/14-2098.1, 2015.
Skidmore, A. K., Ferwerda, J. G., Mutanga, O., Van Wieren, S. E., Peel, M., Grant, R. C., Prins, H. H. T., Balcik, F. B., and Venus, V.: Forage quality of savannas – simultaneously mapping foliar protein and polyphenols for trees and grass using hyperspectral imagery, Remote Sens. Environ., 114, 64–72, https://doi.org/10.1016/j.rse.2009.08.010, 2010.
Sun, Y., Peng, S., Goll, D. S., Ciais, P., Guenet, B., Guimberteau, M., Hinsinger, P., Janssens, I. A., Peñuelas, J., Piao, S., Poulter, B., Violette, A., Yang, X., Yin, Y., and Zeng, H.: Diagnosing phosphorus limitations in natural terrestrial ecosystems in carbon cycle models, Earth Future, 5, 730–749, https://doi.org/10.1002/2016EF000472, 2017.
Tang, X., Zhao, X., Bai, Y., Tang, Z., Wang, W., Zhao, Y., Wan, H., Xie, Z., Shi, X., Wu, B., Wang, G., Yan, J., Ma, K., Du, S., Li, S., Han, S., Ma, Y., Hu, H., He, N., Yang, Y., Han, W., He, H., Yu, G., Fang, J., and Zhou, G.: Carbon pools in China's terrestrial ecosystems: New estimates based on an intensive field survey, P. Natl. Acad. Sci. USA, 115, 4021–4026, https://doi.org/10.1073/pnas.1700291115, 2018.
Tang, Z., Xu, W., Zhou, G., Bai, Y., Li, J., Tang, X., Chen, D., Liu, Q., Ma, W., Xiong, G., He, H., He, N., Guo, Y., Guo, Q., Zhu, J., Han, W., Hu, H., Fang, J., and Xie, Z.: Patterns of plant carbon, nitrogen, and phosphorus concentration in relation to productivity in China's terrestrial ecosystems, P. Natl. Acad. Sci. USA., 115, 4033–4038, https://doi.org/10.1073/pnas.1700295114, 2018.
Terrer, C., Jackson, R. B., Prentice, I. C., Keenan, T. F., Kaiser, C., Vicca, S., Fisher, J. B., Reich, P. B., Stocker, B. D., Hungate, B. A., Peñuelas, J., McCallum, I., Soudzilovskaia, N. A., Cernusak, L. A., Talhelm, A. F., Van Sundert, K., Piao, S., Newton, P. C. D., Hovenden, M. J., Blumenthal, D. M., Liu, Y. Y., Müller, C., Winter, K., Field, C. B., Viechtbauer, W., Van Lissa, C. J., Hoosbeek, M. R., Watanabe, M., Koike, T., Leshyk, V. O., Polley, H. W., and Franklin, O.: Nitrogen and phosphorus constrain the CO2 fertilization of global plant biomass, Nat. Clim. Chang., 9, 684–689, https://doi.org/10.1038/s41558-019-0545-2, 2019.
Thomas, R. Q., Canham, C. D., Weathers, K. C., and Goodale, C. L.: Increased tree carbon storage in response to nitrogen deposition in the US, Nat. Geosci., 3, 13–17, https://doi.org/10.1038/ngeo721, 2010.
Thornton, P. E., Lamarque, J.-F., Rosenbloom, N. A., and Mahowald, N. M.: Influence of carbon-nitrogen cycle coupling on land model response to CO2 fertilization and climate variability, Glob. Biogeochem. Cycle, 21, GB4018, https://doi.org/10.1029/2006GB002868, 2007.
Tian, H., Chen, G., Zhang, C., Melillo, J. M., and Hall, C. A. S.: Pattern and variation of ratios in China’s soils: a synthesis of observational data, Biogeochemistry, 98, 139–151, https://doi.org/10.1007/s10533-009-9382-0, 2010.
Vincent, A. G., Sundqvist, M. K., Wardle, D. A., and Giesler, R.: Bioavailable soil phosphorus decreases with increasing elevation in a subarctic tundra landscape, Plos One, 9, e92942, https://doi.org/10.1371/journal.pone.0092942, 2014.
Vitousek, P.: Nutrient cycling and nutrient use efficiency, Am. Nat., 119, 553–572, https://doi.org/10.1086/283931, 1982.
Vitousek, P. M. and Howarth, R. W.: Nitrogen limitation on land and in the sea: How can it occur?, Biogeochemistry, 13, 87–115, https://doi.org/10.1007/BF00002772, 1991.
Vitousek, P. M., Porder, S., Houlton, B. Z., and Chadwick, O. A.: Terrestrial phosphorus limitation: mechanisms, implications, and nitrogen–phosphorus interactions, Ecol. Appl., 20, 5–15, https://doi.org/10.1890/08-0127.1, 2010.
Walker, T. W. and Syers, J. K.: The fate of phosphorus during pedogenesis, Geoderma, 15, 1–19, https://doi.org/10.1016/0016-7061(76)90066-5, 1976.
Wang, Z., Townsend, P. A., Schweiger, A. K., Couture, J. J., Singh, A., Hobbie, S. E., and Cavender-Bares, J.: Mapping foliar functional traits and their uncertainties across three years in a grassland experiment, Remote Sens. Environ., 221, 405–416, https://doi.org/10.1016/j.rse.2018.11.016, 2019.
Wieder, W. R., Cleveland, C. C., Smith, W. K., and Todd-Brown, K.: Future productivity and carbon storage limited by terrestrial nutrient availability, Nat. Geosci., 8, 441–444, https://doi.org/10.1038/ngeo2413, 2015.
Xu, L., He, N., and Yu, G.: Nitrogen storage in China's terrestrial ecosystems, Sci. Total Environ., 709, 136201, https://doi.org/10.1016/j.scitotenv.2019.136201, 2020.
Yang, Y.-H., Ma, W.-H., Mohammat, A., and Fang, J.-Y.: Storage, patterns and controls of soil nitrogen in China, Pedosphere, 17, 776–785, https://doi.org/10.1016/S1002-0160(07)60093-9, 2007.
Zhang, C., Tian, H., Liu, J., Wang, S., Liu, M., Pan, S., and Shi, X.: Pools and distributions of soil phosphorus in China, Glob. Biogeochem. Cycle, 19, GB1020, https://doi.org/10.1029/2004GB002296, 2005.
Zhang, J., Zhao, N., Liu, C., Yang, H., Li, M., Yu, G., Wilcox, K., Yu, Q., and He, N.: stoichiometry in China's forests: From organs to ecosystems, Funct. Ecol., 32, 50–60, https://doi.org/10.1111/1365-2435.12979, 2018.
Zhang, Y.-W., Guo, Y., Tang, Z., Feng, Y., Zhu, X., Xu, W., Bai, Y., Zhou, G., Xie, Z., and Fang, J.: Patterns of nitrogen and phosphorus pools in terrestrial ecosystems in China, Dryad [data set], https://doi.org/10.5061/dryad.6hdr7sqzx, 2021.