the Creative Commons Attribution 4.0 License.
the Creative Commons Attribution 4.0 License.
 | 16 Feb 2021
Global maps of Forel–Ule index, hue angle and Secchi disk depth derived from 21 years of monthly ESA Ocean Colour Climate Change Initiative data
Jaime Pitarch
Marco Bellacicco
Salvatore Marullo
Hendrik J. van der Woerd
We document the development and public release of a new dataset (1997–2018), consisting of global maps of the Forel–Ule index, hue angle and Secchi disk depth. Source data come from the European Space Agency (ESA) Ocean Colour (OC) Climate Change Initiative (CCI), which is providing merged multi-sensor data from the mid-resolution sensors in operation at a specific time from 1997 to the present day. Multi-sensor satellite datasets are advantageous tools for ecological studies because they increase the probabilities of cloud-free data over a given region as data from multiple satellites whose overpass times differ by a few hours are combined. Moreover, data-merging from heritage and present satellites can expand the duration of the time series indefinitely, which allows the calculation of significant trends. Additionally, data are remapped consistently and analysis-ready for scientists. Also, the products described in this article have the exclusive advantage of being linkable to in situ historic observations and thus enabling the construction of very long time series. Monthly data are presented at a spatial resolution of ∼4 km at the Equator and are available at PANGAEA (https://doi.org/10.1594/PANGAEA.904266; Pitarch et al., 2019a). Two smaller and easier-to-handle test datasets have been produced from the former: a global dataset at 1∘ spatial resolution and another one for the North Atlantic at 0.25∘ resolution. The computer code for the generation of the Forel–Ule index, hue angle and Secchi disk depth from a given remote-sensing reflectance is also shared at https://doi.org/10.5281/zenodo.4439646 (Pitarch et al., 2021) and can be easily set in loop mode for batch calculations.
- Article
(16385 KB) - Full-text XML
- BibTeX
- EndNote


Single-sensor satellite datasets are not long enough to provide significant evidence of climatic trends that become manifest over fluctuations, so the multi-sensor approach has been fostered since the last decade (IOCCG, 2007). In Europe, the European Space Agency (ESA) Climate Change Initiative (CCI) was created to address the United Nations Framework Convention on Climate Change requirements on a systematic monitoring of the global climate system. The Global Climate Observing System (GCOS) defined a number of essential climate variables (ECVs), which are physical, chemical or biological variables that critically contribute to the characterization of Earth's climate. Ocean Colour (OC) is one of the ECVs, and the OC-CCI is devoted to producing a time series of consistent measurements encompassing water-leaving radiance in the visible domain, derived chlorophyll and inherent optical properties based on merged data from the MEdium Resolution Imaging Spectrometer (MERIS) (2002–2012), the Moderate Resolution Imaging Spectroradiometer (MODIS) (2002–present), the Sea-Viewing Wide Field-of-View Sensor (SeaWiFS) (1997–2010) and the Visible Infrared Imaging Radiometer Suite (VIIRS) (2012–present) sensors (Jackson et al., 2019).
While the chlorophyll concentration has historically been the most studied variable from ocean colour observations, more variables can be derived with confidence that can provide further insights, such as inherent optical properties or the diffuse attenuation coefficient (Kd(λ); m−1). Algorithm developers can also download the remote-sensing reflectance (Rrs(λ); sr−1) at ftp://ftp.oceancolor.org/ (last access: 9 September 2019) and derive any other geophysical property themselves.
In the last decade, two historic optical variables have received renewed attention: the Secchi disk depth (zSD; m) and the Forel–Ule (FU; unitless) index. These two are the oldest oceanographic variables that are directly related to ocean colour, recorded for many decades before the advent of satellites (Boyce et al., 2012) and publicly available globally (NOAA, 2018). The Secchi disk is a white disk that is lowered from above the water surface and tracked visually until it goes out of sight. The depth when it ceases to be visible provides a reading of water transparency (Wernand, 2010). The zSD is influenced by the underwater light attenuation, which in turn depends on the light absorption and scattering caused by the varying concentrations of dissolved and suspended substances in the water. The zSD observation also depends on the disk design and environmental factors that need to be understood (Pitarch, 2020). The popularity and simplicity of this practice allowed its generalized use in oceanic surveys during the last century, although its use significantly declined in the last decades. Currently, the method is experiencing a revival due to recent efforts to derive this quantity from remote-sensing data (Lee et al., 2015).
The FU scale was developed as a set of standard colours that would allow visual water colour indexing (Wernand and Van Der Woerd, 2010). As with zSD, the colour of natural waters is also influenced by the substances in the water, present in different concentrations, which constitutes the basis for ocean colour science. The popularity of the FU scale has had a similar history as the Secchi disk and has evolved from being widely adopted, then mostly abandoned and recently revived, aided by the link to remote-sensing data (Wernand et al., 2013).
The hue angle is a popular quantity in the field of image colour analysis. It is used as an intermediate quantity in the process of deriving FU from any light spectrum (Wernand et al., 2013), and it can be regarded as the continuous companion of the FU scale. Specific algorithms have been developed for the spectral characteristics of various ocean colour sensors (Van Der Woerd and Wernand, 2015, 2018). In terms of in situ sampling, this quantity cannot be estimated visually, only radiometrically, although red–green–blue (RGB) images have proven good for this sake, thus enabling the use of digital cameras for citizen science (Ceccaroni et al., 2020).
Pitarch et al. (2019b) made an analysis of global seasonal variability in these parameters using the climatological ESA-OC-CCI data, including some cross-relationships and ranges of variability.
Despite the demonstrated usefulness of these optical parameters in marine physics and biogeochemistry, no public dataset of them exists thus far, so scientists need to calculate them from Rrs privately, which, other than creating redundant efforts, may be discouraging for non-experts. This gap is filled in the present article with the provision of the monthly series from 1997 to 2018 of Secchi disk depth, hue angle and Forel–Ule index at ∼4 km resolution.
2.1 Ingested data
The source product for all derived variables presented in this dataset is the merged multi-sensor OC-CCI v4.2 Rrs, which is the primary quantity used for ocean colour studies, containing only spectral information related to the colour of the water while having all interfering factors ideally removed in the atmospheric correction and normalization calculations. Rrs is provided at a monthly frequency and projected on a rectangular grid of 2.5 arcmin for both latitude and longitude, which corresponds to about 4 km at the Equator, decreasing poleward. For more specific details, one can read the product user guide (Jackson et al., 2019). Numeric precision is single (32-bit floating-point values), except time, which is a 32-bit signed integer. Every downloaded data file contains a map of estimated bias in Rrs, which we add to generate the unbiased Rrs estimate. This bias compensation, which users need to perform themselves, has proven to enhance the quality of retrievals of Rrs-derived geophysical products like optical particle backscattering (Pitarch et al., 2020). Every generated file of Secchi disk depth, hue angle and Forel–Ule index keeps the same format as the corresponding source Rrs file.
2.2 The Forel–Ule index and hue angle algorithms
The hue angle (α; ∘) is a continuous numerical variable that expresses the colour of a light spectrum in a single number. In natural waters, α ranges from about 40∘ in brown waters to about 235∘ in deep-blue oceanic waters. As the α definition involves three spectral integrals across the continuous spectral range, some kind of adaptation needs to be done when applying it to satellite data that are provided only at a small number of wavelengths. Full technical details about α determination from multispectral Rrs are published (Van Der Woerd and Wernand, 2015, 2018; Pitarch et al., 2019b).
The FU scale was optically characterized as a canonical set of points (x, y) in the Commission Internationale de l'Éclairage (CIE) space (Novoa et al., 2013). Because α is the polar angle of the (x, y) coordinates, the α of all canonical FU points can be calculated. Thus, given an Rrs spectrum, its α can be calculated, and subsequently, an FU index can be assigned to it by choosing the nearest FU index in α units. In fact, FU can be seen as a discrete version of α and can be used to cluster water masses in terms of their colour. However, it was found that the FU scale lacks resolution and dynamic range for the most oligotrophic oceanic waters (Pitarch et al., 2019b). Vast regions of the ocean remain saturated all year round at FU=1. For this reason, a new lower end FU=0 was proposed in order to introduce more differentiation within the bluest waters. This dataset includes that addition.
2.3 The Secchi disk depth algorithm
We apply the state-of-the-art algorithm for the remote estimation of the Secchi disk depth (zSD) by Lee et al. (2015). According to the underlying theory, zSD essentially depends on the spectral minimum of the diffuse attenuation coefficient (Kd), which is analytically modelled as a function of the absorption (a) and optical backscattering coefficient (bb) (Lee et al., 2013). The latter two are retrieved with the QAAv6 algorithm (Lee et al., 2002), including a correction for Raman scattering after Lee et al. (2013). It has been shown that such a step improves the match of the retrieved bb against reference data (Pitarch et al., 2020). Solar zenith angle, which is also needed for Kd, is set equal to 0 to be consistent with the reflectance normalization in the OC-CCI dataset.
The processing is applied on a pixel basis from every source netCDF Rrs file. A sample code that applies the former algorithms to generate the hue angle, Forel–Ule index and Secchi disk depth from a given Rrs can be downloaded from https://doi.org/10.5281/zenodo.4439646 and cited (Pitarch et al., 2021). This code can be easily set in loop mode and parallelized as well as linked to a netCDF file generator code, which is how the files of this dataset were produced.
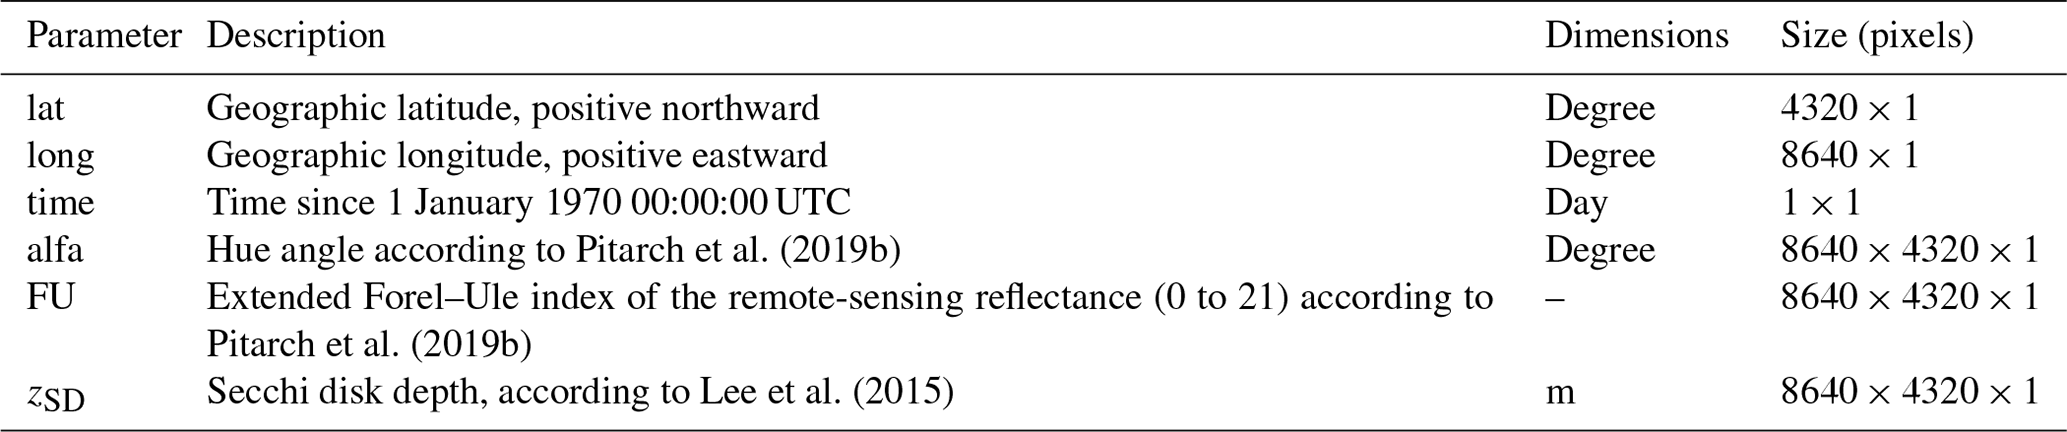
The format of the product file is the same, and the spatial and temporal variables are directly copied from the source file. The hue angle, the Forel–Ule index and the Secchi disk depth are added. Content of each file is summarized in Table 1. Every netCDF file has the naming ESACCI-OC-L3S-MERGED-1M_MONTHLY_4km_GEO_PML_Hue_FU_SD-yyyymm-fv4.0.nc, where yyyy is a four-character string for the year, and mm is a two-character string for the month.
From this product, two smaller, reduced-resolution products were generated:
-
a global dataset at 1∘ spatial resolution, more than enough to detect spatial features for global analyses;
-
a North Atlantic (0–60∘ N, −80 to 0∘ E) dataset at 0.25∘ resolution that can be used to study regional trends in this region at an increased resolution yet keeping the computational cost reasonably low.
In the remote-sensing community, validation is mostly known as a comparison to in situ reference data. Assuming errorless reference data, uncertainties are then due to the atmospheric correction and the applied water quality algorithms, though in situ data also contain uncertainties that are seldom considered.
Monthly OC-CCI products cannot be used for matchup to in situ data as matchups are intended for instantaneous data, with time coincidence between the satellite and the in situ readings recommended to be within a few hours. Understanding this requirement in a broad sense, daily satellite data, also provided within OC-CCI, may be acceptable. Therefore, uncertainties can be assessed using daily data, knowing that uncertainties present in the monthly aggregates will be smaller as the temporal averaging will dampen random noise by a factor equal to the square root of the number of observations at every pixel for every month, and, in fact, reduced noise can be seen in the produced monthly images, where speckle noise looks rather low. Systematic biases will remain after averaging, though.
Ideally, uncertainties would be provided at pixel level for every product map, but such information could only be given after an uncertainty differentiation across the product dynamic range, using a large and high-quality in situ dataset that spans the broadest dynamic range, followed by a clustering into spectral classes (Jackson et al., 2019). In fact, such a stringent requirement means that, for some products like backscattering, uncertainties cannot be provided as maps. As the satellite variables derived in this article are also affected by a lack of open and quality-controlled in situ data, uncertainties are provided as bulk estimates.
4.1 Remote-sensing reflectance
The OC-CCI's product user guide (PUG) (Jackson et al., 2019) documents uncertainty assessment of satellite OC-CCI Rrs by comparing it to a large in situ Rrs database that merges in situ Rrs from many different sources with very disparate instrumentation and quality standards (Valente et al., 2019) without an uncertainty budget assessment. Usage of this entire database can artificially increase the error statistics when compared to satellite data. For this reason, in a previous publication (Table 3 in Pitarch et al., 2020) we compared daily OC-CCI reflectances to Valente's database as well as to two other internal databases. Uncertainties were the lowest when OC-CCI daily products were compared to an internal database “CNR”, collected using strict NASA protocols and uncertainties traceable to National Institute of Standards and Technology (NIST) standards. Relative RMSEs were within 20 %, with biases not significantly different from 0, except for the band at 412 nm. At 670 nm, errors were much higher in relative terms due to the low value of Rrs(670), but they remained low in absolute units (sr−1). These RMSEs include uncertainties present in the in situ Rrs as well, which may range between 5 % and 10 % (Zibordi et al., 2019), so an educated guess of a spectral average of 7.5 % was subtracted in quadrature from them to isolate the errors in the satellite data.
These remaining uncertainty estimates need to be propagated by the Secchi disk depth, hue angle and Forel–Ule index algorithms. To assess this matter, three example Rrs spectra were taken, representing ultra-oligotrophic, oligotrophic and eutrophic waters. Their respective Secchi disk depth, hue angle and Forel–Ule index were calculated. Posteriorly, a Monte Carlo analysis was made by adding the Rrs uncertainties as Gaussian-independent noise. This was repeated 10 000 times, and the histograms (Fig. 1) and related statistics (Table 2) of the resulting Secchi disk depth, hue angle and Forel–Ule index were retrieved. It is shown that, for the Secchi disk depth, biases have a spread of about σ=22 % around the errorless value, with a negligible mean bias, increasing towards more turbid waters. The hue angle experiences a spread of about σ=1 %, also with a negligible bias, though this result has to be interpreted keeping in mind the high average value and the low dynamic range of the hue angle. Statistics of the FU are much harder to interpret due to the strongly discrete nature of this variable, but essentially FU oscillates between the central value and the adjacent ones, in proportions that depend on the distances to these in hue angle terms.
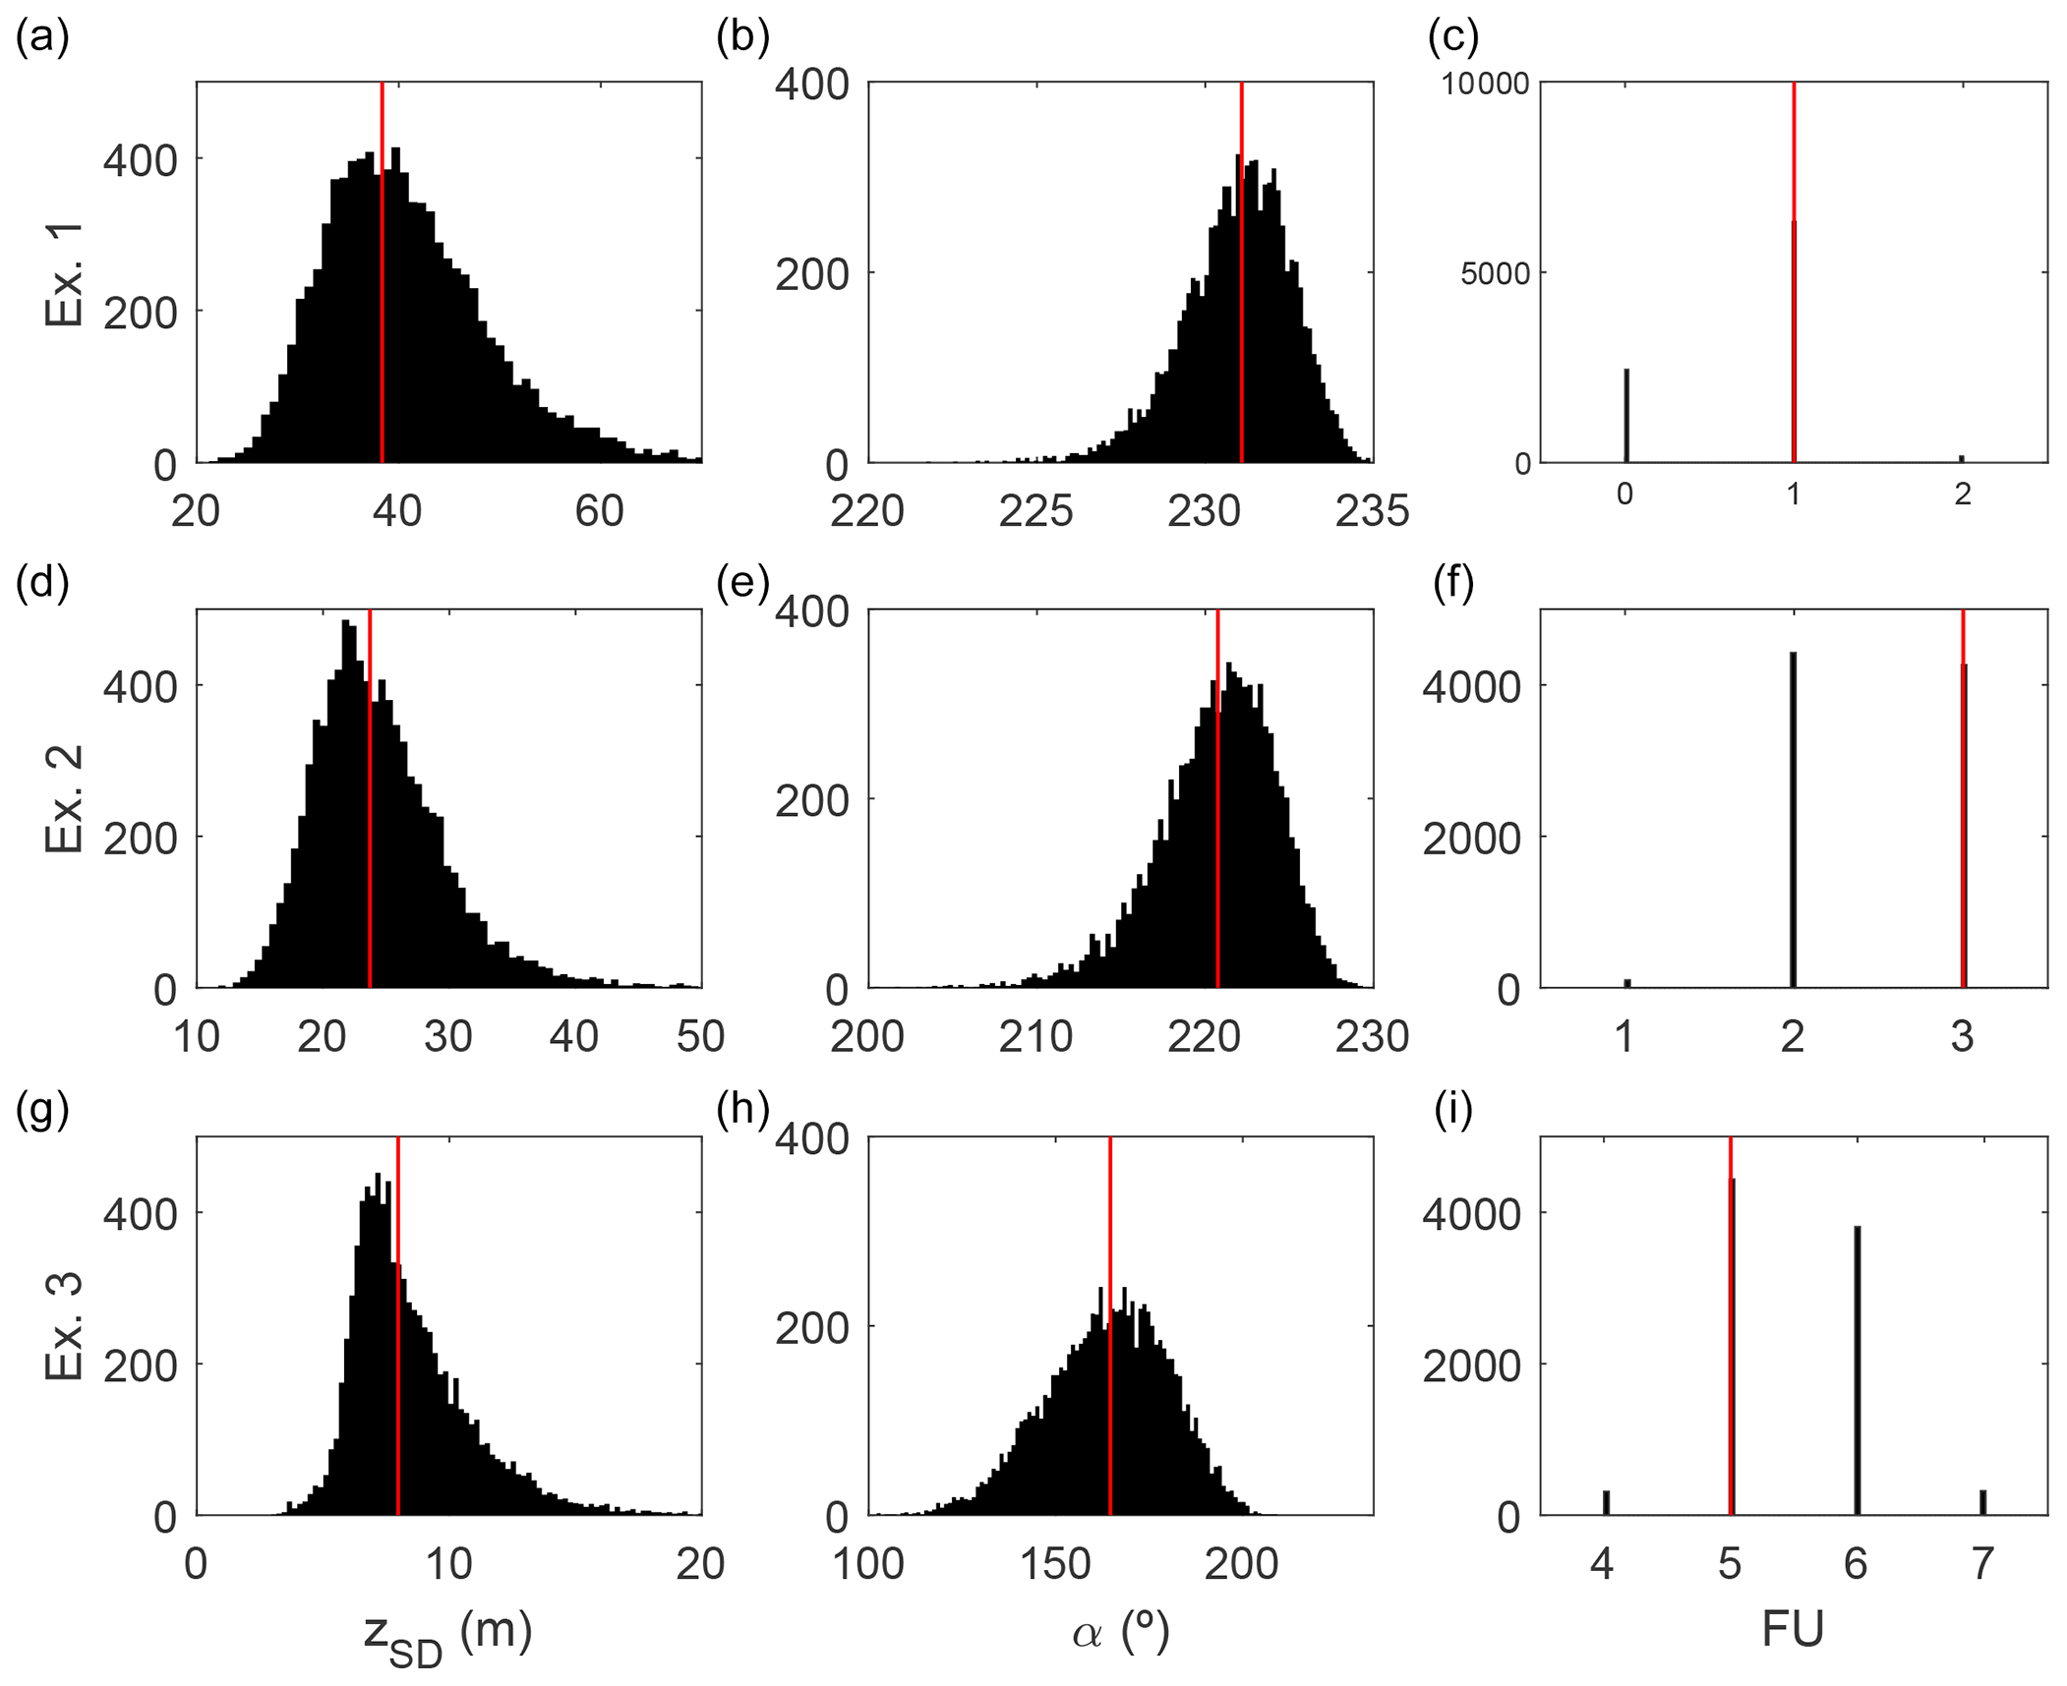
Figure 1Monte Carlo simulation of error propagation from OC-CCI Rrs to Secchi disk depth, hue angle and Forel–Ule index. Panels (a)–(c) show the results of 10 000 simulations (black bars) for ultra-oligotrophic waters compared to the reference spectrum results (red line). Panels (d)–(f) show the results for an oligotrophic water spectrum, and (g–i) depict the results for a eutrophic water spectrum.
Table 2Biases and standard deviation (σ) of the errors caused by random additive Gaussian perturbations to three given remote-sensing reflectances from which the Secchi disk depth, the hue angle and the Forel–Ule index are derived. The “exact values” correspond to the red vertical lines in Fig. 1.

A third uncertainty source is the remote algorithm itself with respect to the actual in situ value. Since the algorithms were published elsewhere, this article does not validate them further. Here, we simply summarize statistical findings on their accuracy in each of the next three sub-sections.
4.2 Secchi disk depth
The Secchi disk depth algorithm was validated by Lee et al. (2015). The zsd derived from in situ Rrs compared well to actual measurements with a Secchi disk, with a mean absolute percent difference (MAPD) of ∼19 %. The linear regression slope between in situ and remote estimation deviated marginally from the 1:1 line. Unfortunately, most of their data were not open to external users, and the MAPD is a statistical parameter different from rms or standard deviation. However, a quick numerical verification with Gaussian noise (not shown) reveals that the ratio between the relative RMSE and MAPD for unbiased estimates is very stable at about ∼1.25. Therefore, Lee's MAPD=18.2 % equals RMSE=22.8 %. From this uncertainty, one must subtract the part due to the in situ radiometry. Unfortunately, in Lee's data, radiometric uncertainties are not traced, so an educated guess of an average 10 % RMSE is made here. This guess is subtracted in quadrature from the above 22.8 %, which results in an uncertainty of ∼20 % for Secchi disk depth model estimations with respect to in situ data. Overall, adding in quadrature the uncertainties due to the satellite radiometry, we may conclude that Secchi disk depth derived from daily OC-CCI data has an uncertainty of ∼32 % when compared to in situ data.
4.3 Hue angle
Uncertainties in the α product are derived from the approximation of the spectral integrals involved in the algorithm from a limited set (six here) of satellite bands (Van Der Woerd and Wernand, 2015, 2018; Pitarch et al., 2019b). These uncertainties vary with the water type because the few available spectral bands may be enough to capture all the optical information in simple case 1 waters but not in optically complex waters. In fact, for case 1 waters, in relative terms, this amounts to less than 0.1 %, while in optically complex waters, it can amount to up to 3 %. We can therefore conclude that, for satellite α estimations, the uncertainty is almost totally caused by the satellite radiometry, which ranges from less than 1 % to about 11 % as water shifts from very clear to turbid. This may also be an upper bound because we have assumed spectrally independent Gaussian noise at every satellite band, but errors in an atmospheric correction may have some spectral correlation. As a consequence of this, satellite-derived hue angle (and FU) seem to be particularly robust to uncertainties in satellite Rrs after atmospheric correction (Wang et al., 2018).
4.4 Forel–Ule index
In situ FU readings are different depending on whether a submerged Secchi disk is used to obtain a visual estimate of the colour over its surface or whether the estimate is obtained by looking at the water only. Essentially, an underwater white object reflects light that, after propagating back across the water column, is observed from above with a hue angle that is lower than that of the surrounding water. These differences are significant, and the amount of this bias depends on the colour of the water effect itself, which was previously shown after radiative-transfer simulations (Pitarch, 2017) and recently shown experimentally (Nie et al., 2020). In addition, in situ FU can either be estimated visually or derived mathematically from an Rrs that has been measured in situ. The equivalence of both must not be taken for granted, and their relation has not been studied yet. In summary, there are several methodological concerns that affect the definition of reference FU measurements for comparison to satellite estimations.
In the interim, we choose to define reference FU measurements as those originating from in situ hyperspectral Rrs, of which the hue angle has been calculated by integration and FU by discretization. In such a case, the uncertainties are only those related to the satellite radiometry. The error is bounded within ±1 in almost all cases.
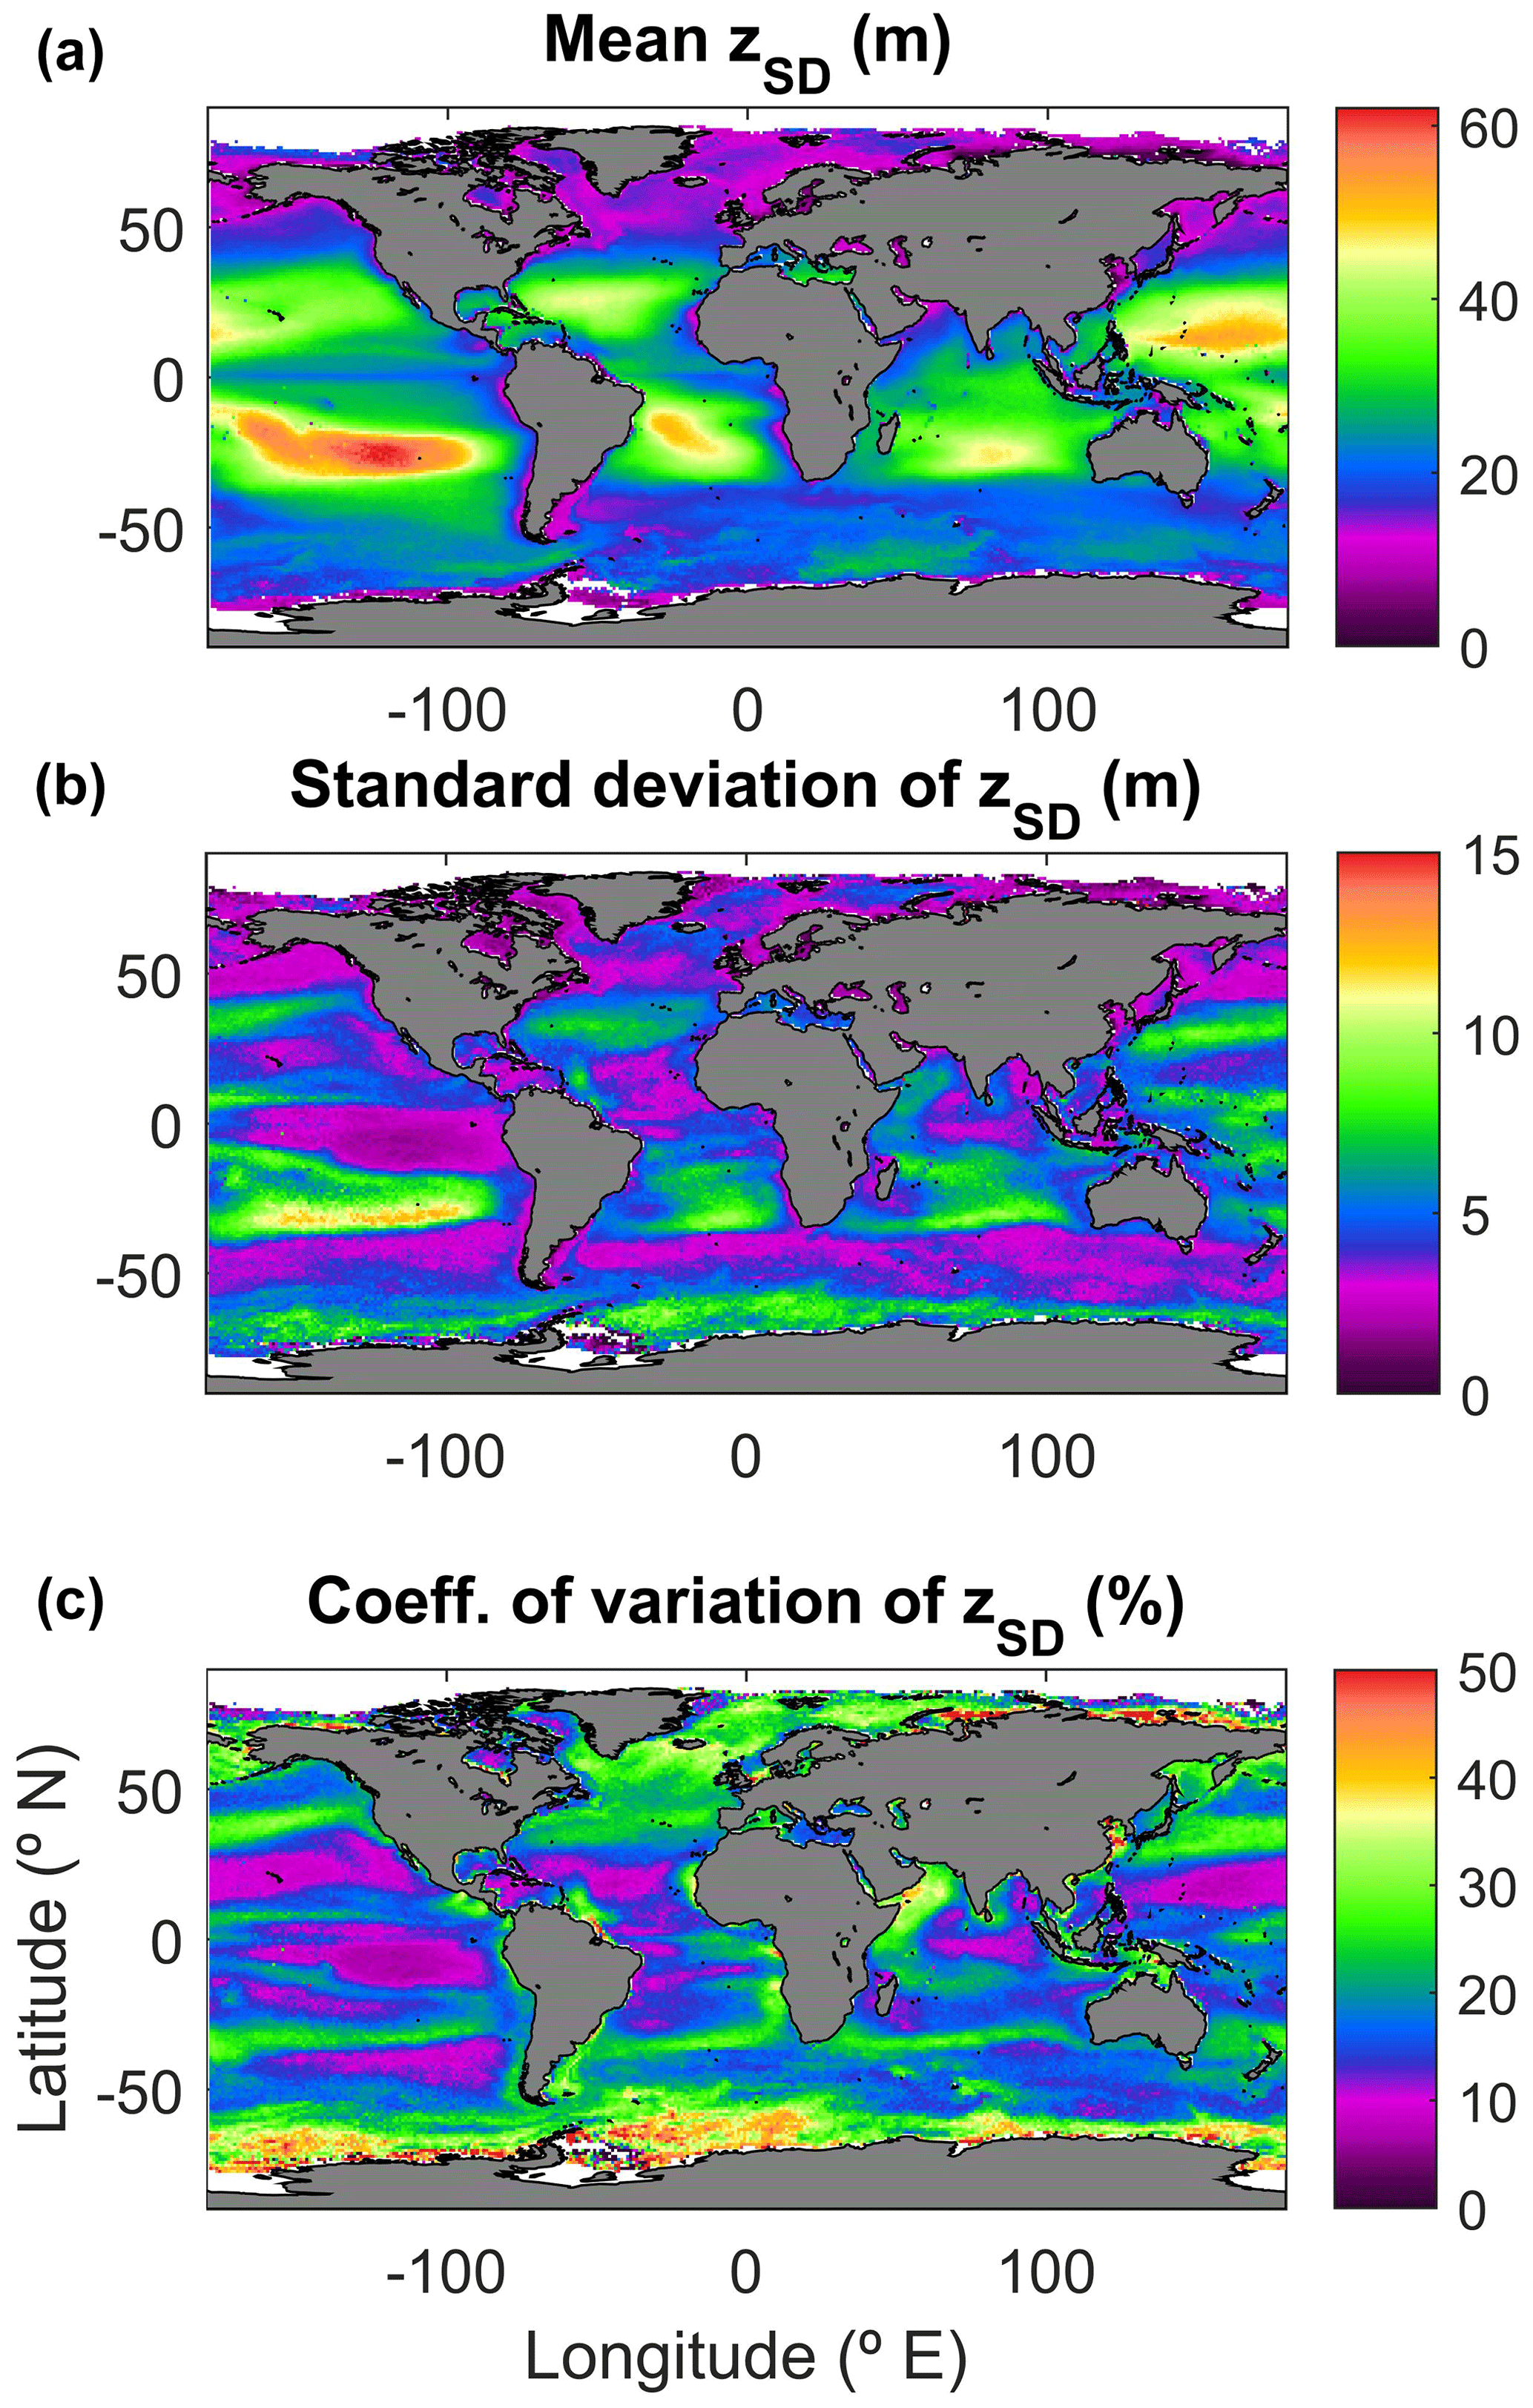
Figure 2Global maps of the Secchi disk depth (zSD) in the period 1997–2018. (a) Series mean. (b) Standard deviation. (c) Coefficient of variation.
In order to provide the reader with a feeling of the global variability covered by these parameters, some basic statistics are demonstrated in this section. These results were produced using the reduced-resolution global product at 1∘. At every pixel, the 256 values (21 years and 4 months of data) were combined, and the arithmetic mean, standard deviation and coefficient of variation were calculated. Figure 2 shows the results for the zSD time series. The mean map shows a global pattern that is similar when deriving other parameters like the surface chlorophyll-a concentration. In the oligotrophic gyres, there is high transparency induced by low concentration of phytoplankton cells, as also highlighted by the zSD. For example, the South Pacific subtropical gyre reaches a mean of ∼60 m in its most transparent core. The standard deviation of zSD shows interesting patterns. It is mostly driven by the seasonal variability, and it is highest in the gyre boundaries, showing the seasonal expanding and shrinking of the subtropical gyres, though they might also include the long-term effect of gyre expansion (Polovina et al., 2008). Other peaks of variability are zones affected by seasonal blooms like off Iceland or the Antarctica coast. This latter feature is most accentuated in the coefficient of variation.
The hue angle (α) shows a pattern similar to zSD (Fig. 3), though with a marked non-linearity. Global values cover the range ∼50–235∘, though 85 % of the world's oceans are blue with . The standard deviation is very low in the oligotrophic areas, reflecting the fact that the human eye has little sensitivity to variations in colour when these happen at the lower spectral end of the visible range. On the other hand, variability is mostly highlighted in zones of green waters like mesotrophic and eutrophic areas as well as turbid shelf seas and coastal zones.
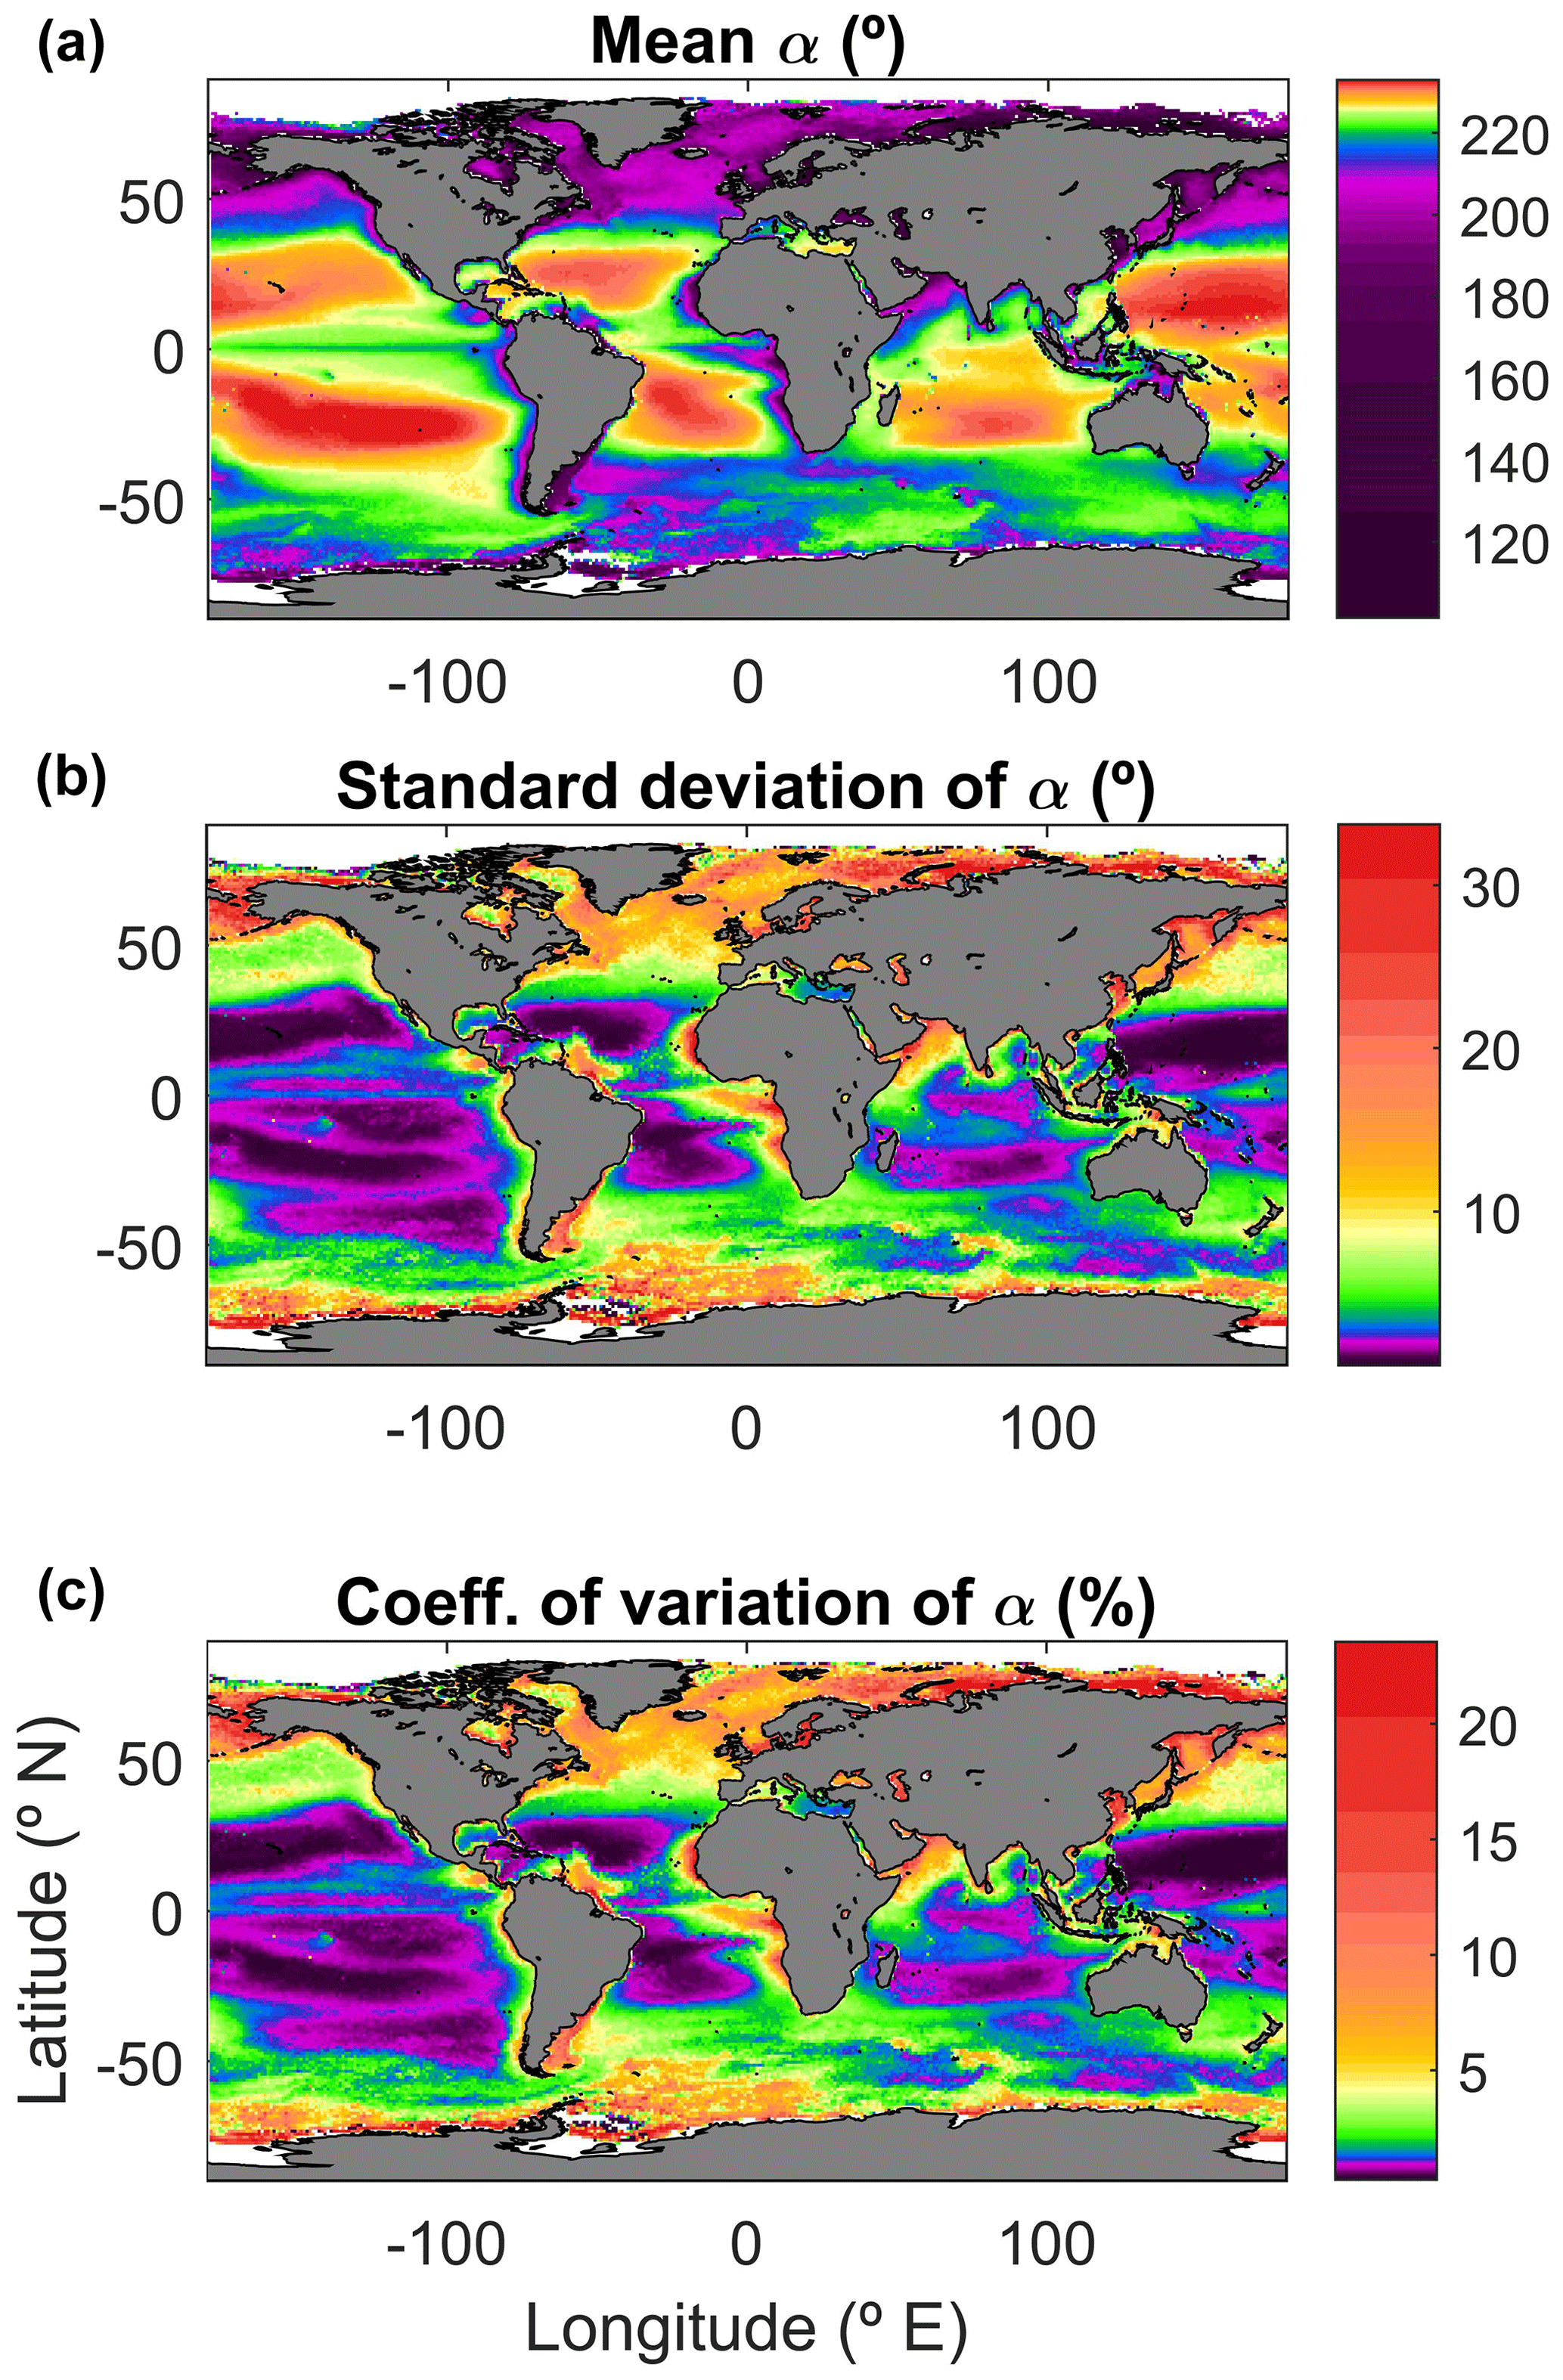
Figure 3Global maps of the hue angle (α) in the period 1997–2018. (a) Series mean. (b) Standard deviation. (c) Coefficient of variation.
The Forel–Ule index mean value (Fig. 4) reflects the known global patterns. Despite ranging the scale from 0 to 21, 99 % of the data are within FU≤8, keeping the upper rest of the FU scale for very turbid coastal areas or highly humic waters. Note that, despite the fractional results due to statistics, FU are integers. As shown for the hue angle, FU shows very little variation for the oligotrophic and low-latitude areas, reaching the widest dynamic range in coastal and high-latitude blooming seas.
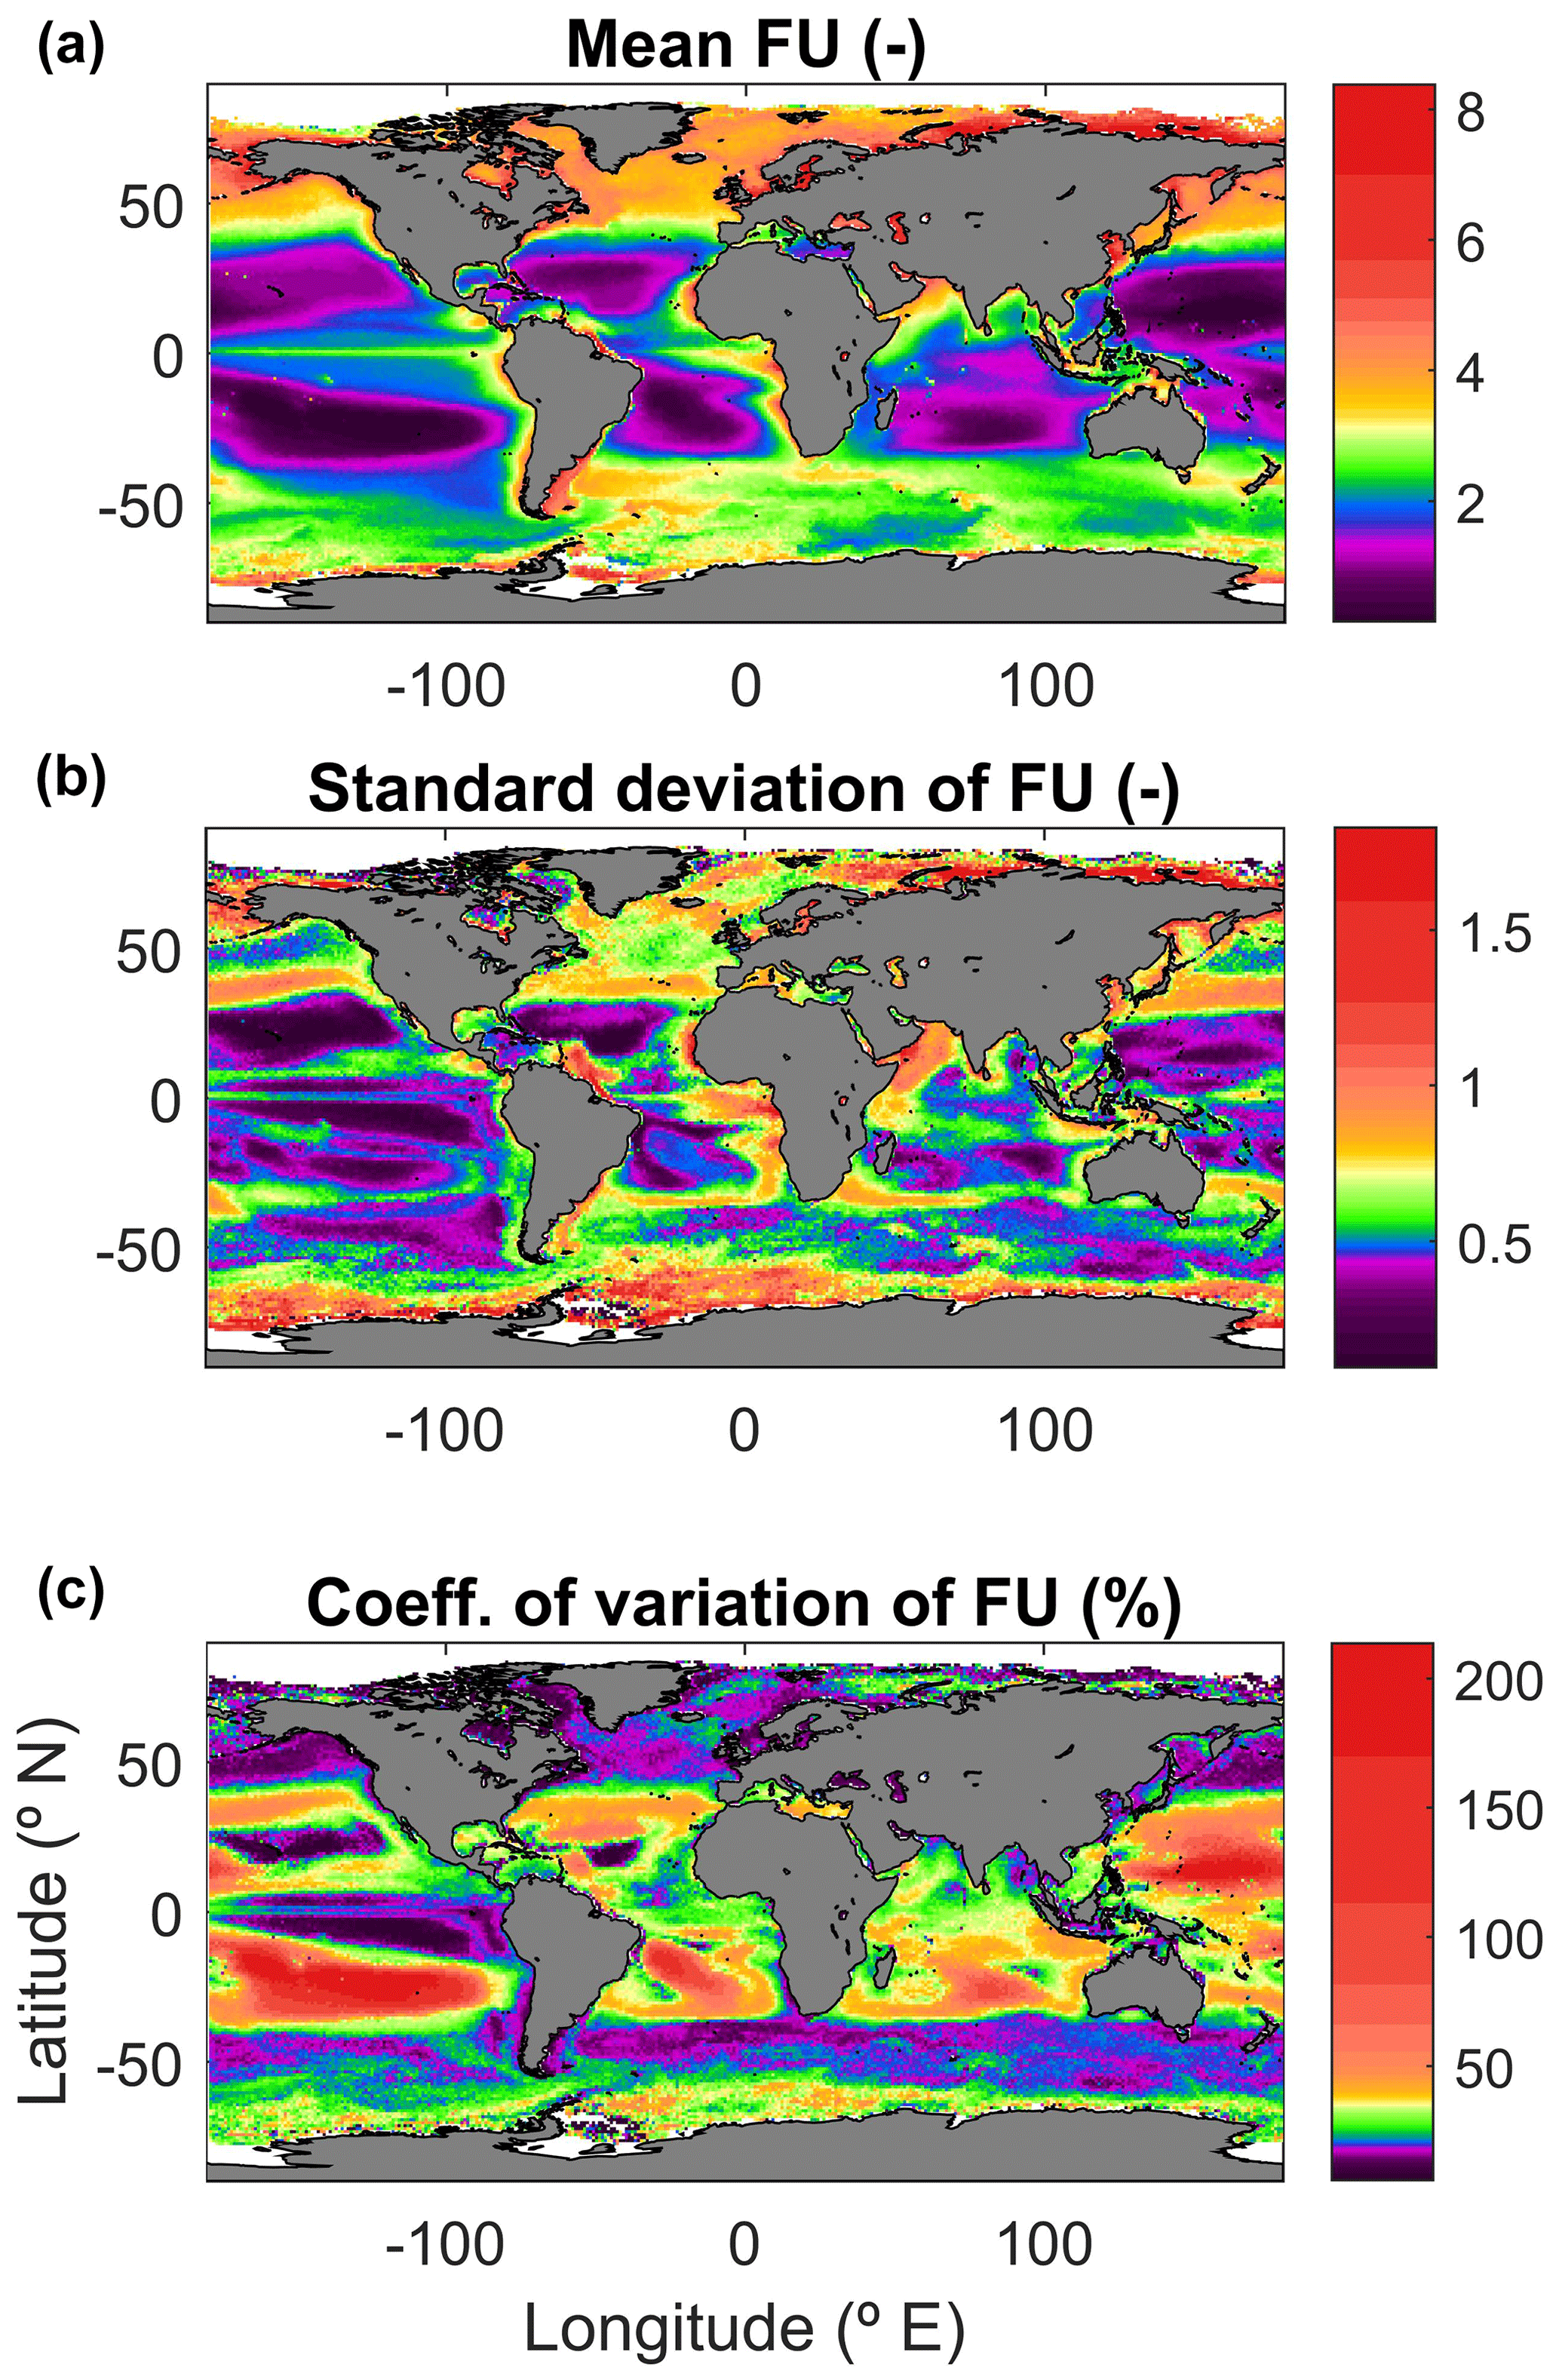
Figure 4Global maps of the Forel–Ule (FU) index in the period 1997–2018. (a) Series mean. (b) Standard deviation. (c) Coefficient of variation.
This section provides an example of application that shows the unique possibilities of long-term satellite data: the calculation of pixel-wise oceanic trends. Here, we used the lower-spatial-resolution product at 0.25∘, covering the Atlantic Ocean north of the Equator. This section reports a trend analysis of the area for the Secchi disk depth and the hue angle. Seasonal decomposition was made pixel-wise with the publicly available BEAST code (Zhao et al., 2019). The Sen's slope (Sen, 1968) of the de-seasonalized signal was calculated, and the result was tested for significance at 95 % (Mann, 1945; Kendall, 1975). In Fig. 5, the upper two panels only show the statistically significant trend signals for zSD and α, calculated for the period 1997–2018. A positive (negative) trend in zSD means that a Secchi disk will disappear from sight at a larger (shallower) depth, corresponding to a transparency increase (decrease). A positive (negative) trend in α indicates a blue (red) shift, normally corresponding to a reduction (increase) in the surface chlorophyll-a concentration (Pitarch et al., 2019b). In the lowest panel of Fig. 5, the signs (positive or negative) of the trends are combined to yield four classes; a combination of positive zSD sign and negative hue angle sign is given by the code (). Again, no colour indicates no significant trend in both indexes.
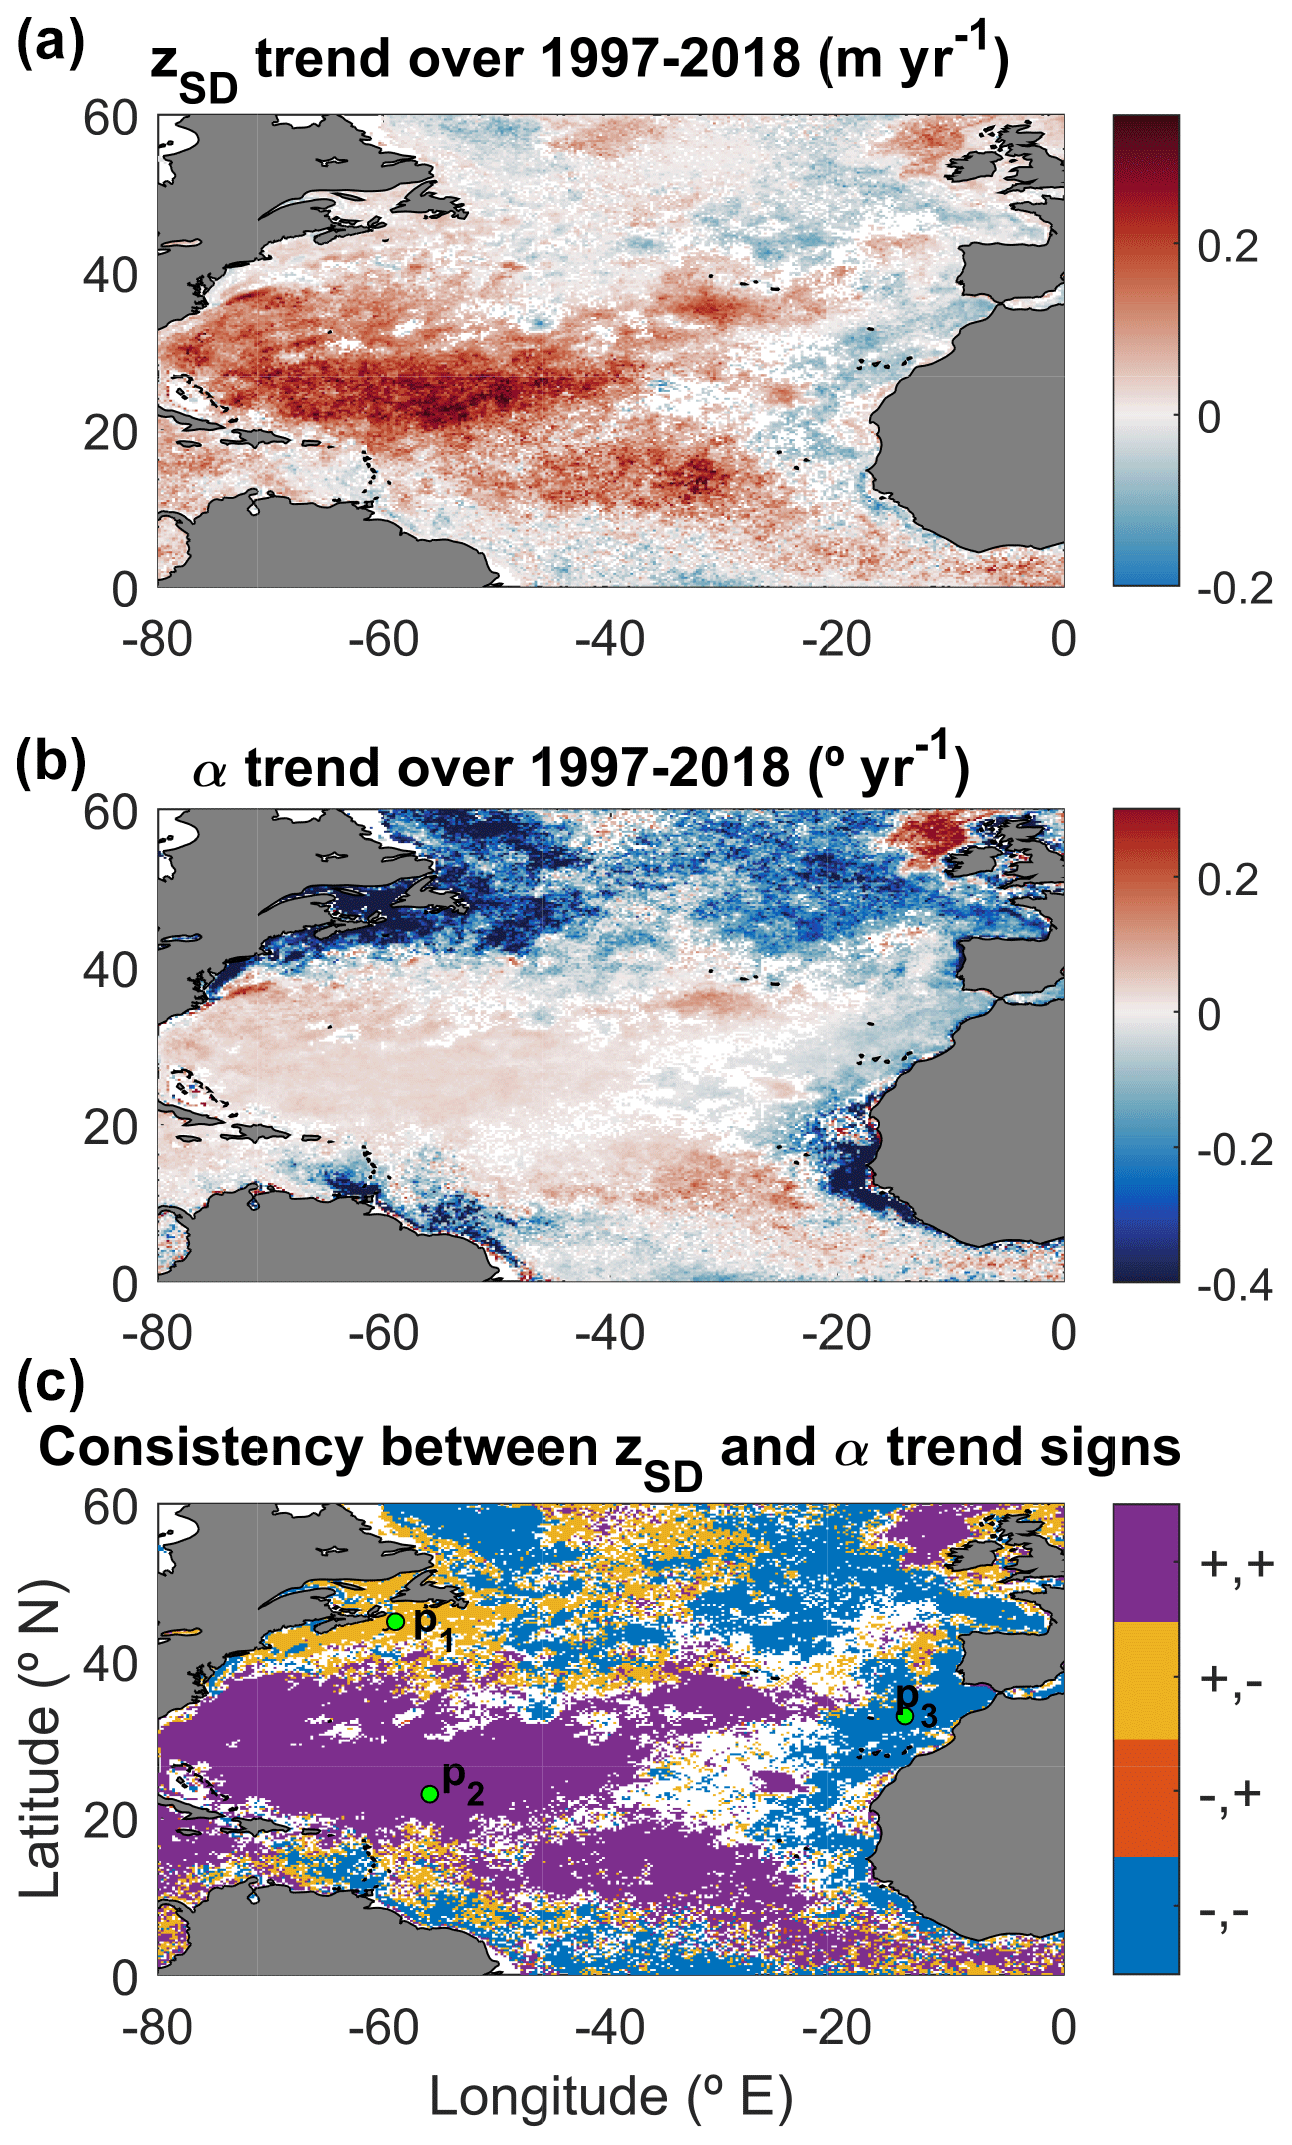
Figure 5(a) Linear slope of Secchi disk depth (zSD) trend at pixel scale for the North Atlantic. (b) Same as before but for the hue angle (α). (c) Signs of both linear slopes.
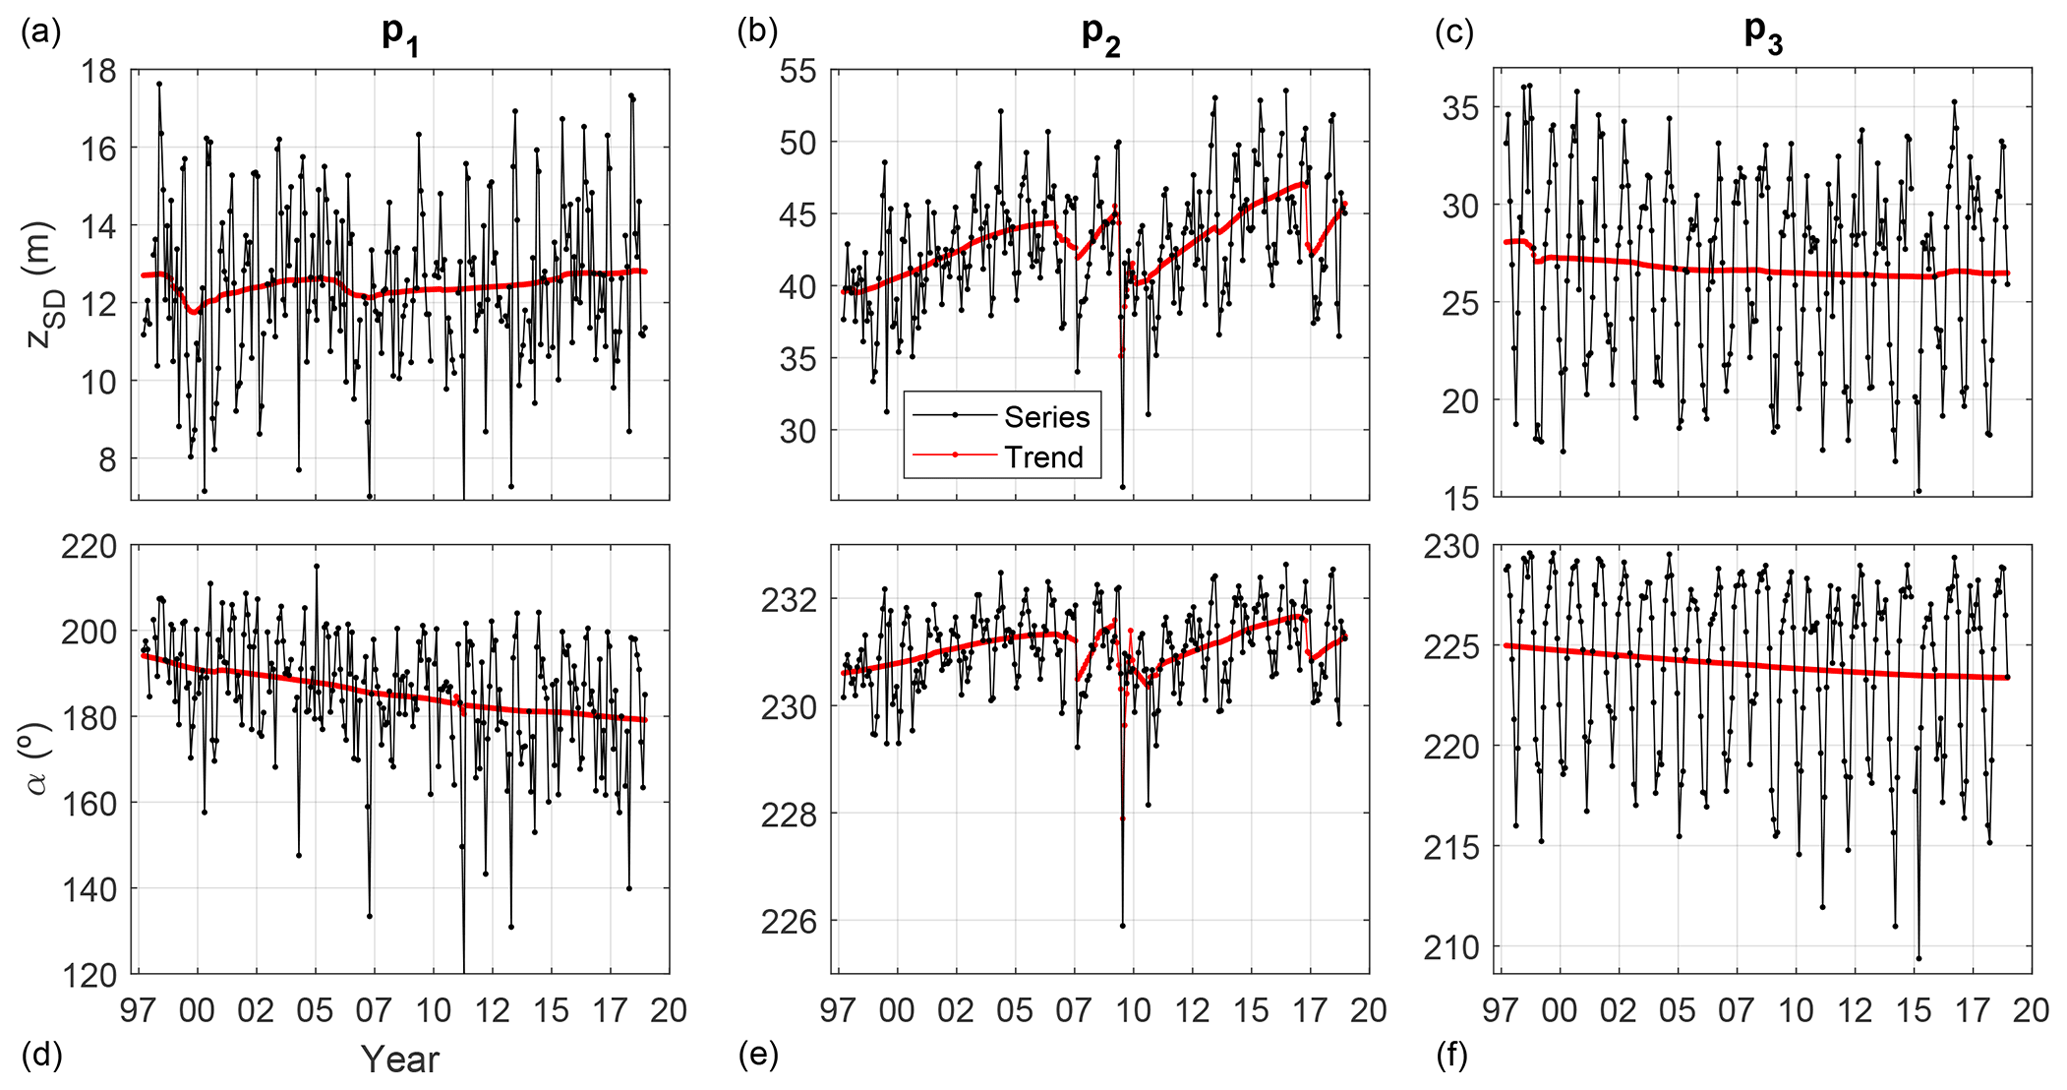
Figure 6Time series of Secchi disk depth (a–c) and hue angle (d–f) at three points in the North Atlantic Ocean. Red lines show the de-seasonalized signal.
The North Atlantic trend maps (Fig. 5) show that the subtropical gyre is gaining transparency and getting bluer and bluer. On the other hand, mesotrophic, more northern waters outside the gyre as well as coastal waters are experiencing totally different dynamics. In general, there is a loss of transparency and a red shift. Some areas where trends are very small have apparent opposite trends in zSD and α, which highlights the fact that these two quantities do not completely contain the same information, and it will deserve some future research. In Fig. 6, the complexity in the spatial and temporal behaviour is detailed for three points, their position indicated on the lower map of Fig. 5. We anticipate that the study of these variations at various spatial scales and their relation to potential physical and environmental drivers like sea surface temperature, ocean heat content, nutrients, mixed-layer depth, coastal currents and river outflow will be explored.
The 256 full-resolution netCDF files constituting the global time series at monthly frequency and 4 km resolution are publicly available through the following link: https://doi.org/10.1594/PANGAEA.904266 (Pitarch et al., 2019a). The repository also contains two sub-products of much smaller size that can be quickly downloaded and easily handled locally: (1) a downgraded global dataset at 1∘ for latitude and longitude and (2) a downgraded dataset at 0.25∘ for latitude and longitude, for the North Atlantic Ocean.
The computer code for the generation of the Forel–Ule index, hue angle and Secchi disk depth from a given remote-sensing reflectance is available at https://doi.org/10.5281/zenodo.4439646 (Pitarch et al., 2021).
We have derived a consistently calibrated 21-year-long dataset of monthly Secchi disk depth, hue angle and Forel–Ule index over the global oceans at ∼4 km spatial resolution at the Equator. The algorithms employed for this release have been recently published and are at the state of the art, and their application is not restricted to any specific water type. Best-effort validation statistics have been provided based on current evidence. Global-average maps have shown meaningful patterns that are consistent with the general understanding of the ocean dynamics. A small example of trend estimation has also been provided to illustrate one of the main areas of research that can be addressed with this dataset.
This dataset has been directly derived from the OC-CCI dataset and, as such, shares its advantages and limitations. Main advantages are the careful sensor inter-calibration to avoid spurious trends, the constant revision of the methodology in search of improved quality and the warranted continuation of the time series for the next years. Limitations are the exclusion of high-latitude areas due to high solar zenith angle, which causes problems in the OC-CCI processing, and the uneven monthly binning depending on cloud cover. These issues could be solved in a future release, which could use daily source data with an application of a gap-filling procedure.
With this release, we hope to eliminate redundant efforts within the community to estimate water transparency and colour from satellite measurements. Depending on the reception and user needs, future releases using other temporal and spatial resolutions could be made.
The Secchi disk depth and the Forel–Ule index time series could be further enlarged backwards by linking them to the archived in situ data that go back to the year 1890 (Boyce et al., 2012). However, even in the absence of historic data, 21 years of satellite data are already a valuable dataset that may provide new insights into the ocean's variability in relation to climate change and constitute valuable information to train and validate mechanistic oceanic models.
JP conceived the manuscript, produced the dataset and associated results, and wrote the first draft of the manuscript, following advice by MB and SM. MB, HJvdW and SM made revisions to the draft. JP revised the manuscript, assisted by the co-authors.
The authors declare that they have no conflict of interest.
The Ocean Colour Climate Change Initiative project is thanked for providing the source data to elaborate the products described in this article. The Copernicus editorial support team members Katja Gänger, Lorena Grabowski, Svenja Lange, Sarah Buchmann and Anna Wenzel, Janin Wucherpfennig, Anja Kesting and Justin Jardine are thanked for their assistance during the article processing.
Jaime Pitarch acknowledges financial support by the Ministry for Science and Culture of Lower Saxony, Germany, in the framework of the “Coastal Ocean Darkening” project (VWZN3175) and by the Copernicus Climate Change Service, Quality Assessment of ECV Products (C3S_511). Marco Bellacicco is supported by the ESA Living Planet Fellowship project PHYSIOGLOB: Assessing the inter-annual physiological response of phytoplankton to global warming using long-term satellite observations, 2018–2020.
This paper was edited by Giuseppe M. R. Manzella and reviewed by two anonymous referees.
Boyce, D. G., Lewis, M., and Worm, B.: Integrating global chlorophyll data from 1890 to 2010, Limnol. Oceanogr.-Meth., 10, 840–852, https://doi.org/10.4319/lom.2012.10.840, 2012.
Ceccaroni, L., Piera, J., Wernand, M. R., Zielinski, O., Busch, J. A., Woerd, H. J. v. d., Bardaji, R., Friedrichs, A., Novoa, S., Thijsse, P., Velickovski, F., Blaas, M., and Dubsky, K.: Citclops: A next-generation sensor system for the monitoring of natural waters and a citizens' observatory for the assessment of ecosystems' status, PLOS ONE, 15, e0230084, https://doi.org/10.1371/journal.pone.0230084, 2020.
IOCCG: Ocean-colour data merging, Reports of the International Ocean-Colour Coordinating Group, edited by: Gregg, W. W., International Ocean-Colour Coordinating Group, Dartmouth, Canada, No. 6, 2007.
Jackson, T., Chuprin, A., Sathyendranath, S., Grant, M., Zühlke, M., Dingle, J., Storm, T., Boettcher, M., and Fomferra, N.: Ocean Colour Climate Change Initiative (OC_CCI)–Interim Phase, Product User Guide, D3.4 PUG, 2019.
Kendall, M.: Rank correlation methods, 2nd impression, Charles Griffin and Company Ltd. London and High Wycombe, 1975.
Lee, Z., Carder, K. L., and Arnone, R. A.: Deriving inherent optical properties from water color: a multiband quasi-analytical algorithm for optically deep waters, Appl. Optics, 41, 5755–5772, https://doi.org/10.1364/AO.41.005755, 2002.
Lee, Z., Hu, C., Shang, S., Du, K., Lewis, M., Arnone, R., and Brewin, R.: Penetration of UV-visible solar radiation in the global oceans: Insights from ocean color remote sensing, J. Geophys. Res.-Oceans, 118, 4241–4255, https://doi.org/10.1002/jgrc.20308, 2013.
Lee, Z., Shang, S., Hu, C., Du, K., Weidemann, A., Hou, W., Lin, J., and Lin, G.: Secchi disk depth: A new theory and mechanistic model for underwater visibility, Remote Sens. Environ., 169, 139–149, https://doi.org/10.1016/j.rse.2015.08.002, 2015.
Mann, H. B.: Nonparametric Tests Against Trend, Econometrica, 13, 245–259, https://doi.org/10.2307/1907187, 1945.
Nie, Y., Guo, J., Sun, B., and Lv, X.: An evaluation of apparent color of seawater based on the in-situ and satellite-derived Forel-Ule color scale, Estuar. Coast. Shelf S., 246, 107032, https://doi.org/10.1016/j.ecss.2020.107032, 2020.
NOAA (National Oceanic and Atmospheric Administration): Secchi disk and water color observations, available at: https://www.nodc.noaa.gov/OC5/WOD/secchi-data-format.html, last access: 24 October 2018.
Novoa, S., Wernand, M. R., and van der Woerd, H. J.: The Forel-Ule scale revisited spectrally: preparation protocol, transmission measurements and chromaticity, J. Eur. Opt. Soc.-Rapid, 8, 13057, https://doi.org/10.2971/jeos.2013.13057, 2013.
Pitarch, J.: Biases in ocean color over a Secchi disk, Opt. Express, 25, A1124–A1131, https://doi.org/10.1364/OE.25.0A1124, 2017.
Pitarch, J.: A review of Secchi's contribution to marine optics and the foundation of Secchi disk science, Oceanography, 33, 26–37, https://doi.org/10.5670/oceanog.2020.301, 2020.
Pitarch, J., Van Der Woerd, H. J., Brewin, R. J. W., and Zielinski, O.: Twenty years of monthly global maps of Hue angle, Forel-Ule and Secchi disk depth, based on ESA-OC-CCI data, PANGAEA, https://doi.org/10.1594/PANGAEA.904266, 2019a.
Pitarch, J., Van Der Woerd, H. J., Brewin, R. J. W., and Zielinski, O.: Optical properties of Forel-Ule water types deduced from 15 years of global satellite ocean color observations, Remote Sens. Environ., 231, 111249, https://doi.org/10.1016/j.rse.2019.111249, 2019b.
Pitarch, J., Bellacicco, M., Organelli, E., Volpe, G., Colella, S., Vellucci, V., and Marullo, S.: Retrieval of Particulate Backscattering Using Field and Satellite Radiometry: Assessment of the QAA Algorithm, Remote Sens.-Basel, 12, 77, https://doi.org/10.3390/rs12010077, 2020.
Pitarch, J., Bellacicco, M., and Marullo, S.: hue-FU-secchi, Zenodo, https://doi.org/10.5281/zenodo.4439646, 2021.
Polovina, J. J., Howell, E. A., and Abecassis, M.: Ocean's least productive waters are expanding, Geophys. Res. Lett., 35, L03618, https://doi.org/10.1029/2007gl031745, 2008.
Sen, P. K.: Estimates of the Regression Coefficient Based on Kendall's Tau, J. Am. Stat. Assoc., 63, 1379–1389, https://doi.org/10.1080/01621459.1968.10480934, 1968.
Valente, A., Sathyendranath, S., Brotas, V., Groom, S., Grant, M., Taberner, M., Antoine, D., Arnone, R., Balch, W. M., Barker, K., Barlow, R., Bélanger, S., Berthon, J.-F., Beşiktepe, Ş., Borsheim, Y., Bracher, A., Brando, V., Canuti, E., Chavez, F., Cianca, A., Claustre, H., Clementson, L., Crout, R., Frouin, R., García-Soto, C., Gibb, S. W., Gould, R., Hooker, S. B., Kahru, M., Kampel, M., Klein, H., Kratzer, S., Kudela, R., Ledesma, J., Loisel, H., Matrai, P., McKee, D., Mitchell, B. G., Moisan, T., Muller-Karger, F., O'Dowd, L., Ondrusek, M., Platt, T., Poulton, A. J., Repecaud, M., Schroeder, T., Smyth, T., Smythe-Wright, D., Sosik, H. M., Twardowski, M., Vellucci, V., Voss, K., Werdell, J., Wernand, M., Wright, S., and Zibordi, G.: A compilation of global bio-optical in situ data for ocean-colour satellite applications – version two, Earth Syst. Sci. Data, 11, 1037–1068, https://doi.org/10.5194/essd-11-1037-2019, 2019.
Van Der Woerd, H. J. and Wernand, M. R.: True Colour Classification of Natural Waters with Medium-Spectral Resolution Satellites: SeaWiFS, MODIS, MERIS and OLCI, Sensors, 15, 25663–25680, https://doi.org/10.3390/s151025663, 2015.
Van Der Woerd, H. J. and Wernand, M. R.: Hue-Angle Product for Low to Medium Spatial Resolution Optical Satellite Sensors, Remote Sens.-Basel, 10, 180, https://doi.org/10.3390/rs10020180, 2018.
Wang, S., Li, J., Zhang, B., Spyrakos, E., Tyler, A. N., Shen, Q., Zhang, F., Kuster, T., Lehmann, M. K., Wu, Y., and Peng, D.: Trophic state assessment of global inland waters using a MODIS-derived Forel-Ule index, Remote Sens. Environ., 217, 444–460, https://doi.org/10.1016/j.rse.2018.08.026, 2018.
Wernand, M. R.: On the history of the Secchi disc, J. Eur. Opt. Soc.-Rapid, 5, 10013s, https://doi.org/10.2971/jeos.2010.10013s, 2010.
Wernand, M. R. and Van Der Woerd, H. J.: Spectral analysis of the Forel-Ule Ocean colour comparator scale, J. Eur. Opt. Soc.-Rapid, 5, 10014s, https://doi.org/10.2971/jeos.2010.10014s, 2010.
Wernand, M. R., Hommersom, A., and van der Woerd, H. J.: MERIS-based ocean colour classification with the discrete Forel-Ule scale, Ocean Sci., 9, 477–487, https://doi.org/10.5194/os-9-477-2013, 2013.
Zhao, K., Wulder, M. A., Hu, T., Bright, R., Wu, Q., Qin, H., Li, Y., Toman, E., Mallick, B., Zhang, X., and Brown, M.: Detecting change-point, trend, and seasonality in satellite time series data to track abrupt changes and nonlinear dynamics: A Bayesian ensemble algorithm, Remote Sens. Environ., 232, 111181, https://doi.org/10.1016/j.rse.2019.04.034, 2019.
Zibordi, G., Voss, K. J., Johnson, B. C., and Mueller, J. L.: In Situ Optical Radiometry, Dartmouth, NS, Canada, 2019.
Secchi disk depthand the
Forel–Ule indexand derive them from satellite observations. Our time series is 21 years long and has global coverage.