the Creative Commons Attribution 4.0 License.
the Creative Commons Attribution 4.0 License.
 | 01 Oct 2021
GIS dataset: geomorphological record of terrestrial-terminating ice streams, southern sector of the Baltic Ice Stream Complex, last Scandinavian Ice Sheet, Poland
Jakub Z. Kalita
Marek W. Ewertowski
Chris D. Clark
Stephen J. Livingstone
Leszek Kasprzak
Here we present a comprehensive dataset of glacial geomorphological features covering an area of 65 000 km2 in central west Poland, located along the southern sector of the last Scandinavian Ice Sheet, within the limits of the Baltic Ice Stream Complex. The GIS dataset is based on mapping from a 0.4 m high-resolution digital elevation model derived from airborne light detection and ranging data. Ten landform types have been mapped: mega-scale glacial lineations, drumlins, marginal features (moraine chains, abrupt margins, edges of ice-contact fans), ribbed moraines, tunnel valleys, eskers, geometrical ridge networks, and hill–hole pairs. The map comprises 5461 individual landforms or landform parts, which are available as vector layers in GeoPackage format at https://doi.org/10.5281/zenodo.4570570 (Szuman et al., 2021a). These features constitute a valuable data source for reconstructing and modelling the last Scandinavian Ice Sheet extent and dynamics from the Middle Weichselian Scandinavian Ice Sheet advance, 50–30 ka, through the Last Glacial Maximum, 25–21 ka, and Young Baltic advances, 18–15 ka. The presented data are particularly useful for modellers, geomorphologists, and glaciologists.
- Article
(60353 KB) - Full-text XML
- BibTeX
- EndNote


Present-day ice sheet mass loss is a key driver of global average sea-level rise (Rignot et al., 2019). A key challenge is to quantify the sensitivity of ice sheets to climate change to improve future predictions of ice sheet mass loss and sea-level rise. However, the observational timescale for contemporary ice sheets is short (decades), and it is a challenge to access their beds, contrary to the footprint of their palaeo-analogues (Stokes and Clark, 2001). Geomorphological studies on glacial landforms provide opportunity to elucidate processes at the ice–bed interface that are responsible for their formation and crucial for understanding and modelling ice sheets (e.g. Stokes, 2018). Reconstructions of the configuration and evolution of palaeo-ice sheets through glacial cycles therefore provide a critical long-term constraint for testing and calibrating ice sheet models (e.g. Hughes, 2009; Stokes et al., 2015, and the references therein; Patton et al., 2016a, 2017; Ely et al., 2019a).
Geomorphological mapping is a powerful tool for reconstructing the glacial history of formerly glaciated areas (Clark, 1997; Kleman et al., 1997; Kjær et al., 2003), especially where in situ dating results (e.g. optically stimulated luminescence, cosmogenic nuclide dating, 14C dating) are too sparse to reproduce highly dynamic ice sheet behaviour. Additionally, geomorphological mapping is widely used for shedding light on glacial processes and the evolution of landforms and for reconstructing ice sheet dynamics (e.g. Lukas, 2006; Kleman et al., 2008, 2010; Ó Cofaigh et al., 2008; Hughes, 2009; King et al., 2009; Spagnolo et al., 2014; Ely et al., 2016; Evans et al., 2016; Jamieson et al., 2016; Chandler et al., 2018). A difficulty in acquiring accurate information on glacial landforms lies in the degradation of their original forms by postglacial processes, including water erosion, aeolian activity, permafrost, or slope processes and human activity (Spagnolo et al., 2014). The results of ice sheet modelling are increasingly compared with or improved by incorporating geomorphological and geological field data (Stokes and Tarasov, 2010; Patton et al., 2017), and tools that quantify the level of agreement between empirical data and modelling results have been developed to aid such comparisons (e.g. Napieralski et al., 2006, 2007; Ely et al., 2019b).
The widespread presence of cross-cutting lineations has enabled reconstructions of the last Scandinavian Ice Sheet (SIS) growth and decay and relative switches in ice flow and the identification of ice streams (Kleman et al., 1997; Punkari, 1997; Boulton et al., 2001). The Baltic Ice Stream Complex (BISC) was one of the most prominent of the SIS ice streams. Typically, results from empirical and numerically modelled reconstructions (Kleman et al., 1997; Punkari, 1997; Houmark-Nielsen, 2010; Patton et al., 2016a, 2017) show the BISC as a vast area of highly dynamic, fast-flowing ice discharging towards the southern margin of the SIS in northern Europe. However, sparse geochronological and geomorphic data constraining the southern-regional-margin reconstructions of the BISC can lead to ambiguities in understanding its behaviour, which have resulted in millennial-scale time differences between alternate ice sheet reconstructions (cf. Hughes et al., 2016; Stroeven et al., 2016). Our new mapping dataset could potentially be used to characterise the behaviour of the BISC and improve assimilation of regional reconstructions, improving our understanding of SIS evolution.
The specific role of ice streams in ice sheet mass balance is somewhat controversial. They are responsible for ∼ 90 % of the discharge of the Antarctic Ice Sheet (Bamber et al., 2000; Gardner et al., 2018; Ringot et al., 2019) with Pine Island and Thwaites ice streams contributing 32 % of the discharge (Bamber and Dawson, 2020). Dynamic variations such as ice stream slowdown or stagnation can lead to a positive mass balance; for example, slowdown of the Whillans Ice Stream caused a switch to a positive mass balance of Siple Coast ice streams (Joughin and Tulaczyk, 2002). Flow instabilities within ice sheets can lead to rapid ice discharges, with the Hudson Strait Ice Stream of the Laurentide Ice Sheet, for example, undergoing catastrophic purge events of accelerated ice discharge in response to positive basal thermal conditions, which led to increased meltwater production and thawing of soft subglacial sediments (MacAyeal, 1993; Rahmstorf, 2002). When considered across wider temporal and spatial scales, ice streams can be thought of as drainage networks, and for the Laurentide Ice Sheet these networks have been shown to scale fairly predictably with ice sheet volume (Stokes et al., 2016).
In this paper we use a new high-resolution digital elevation model to produce a comprehensive, high-quality, geospatial dataset containing updated and newly discovered glacial landforms along the Polish southern sector of the SIS. These data can be used to reconstruct basal conditions, the pattern and style of retreat, and ice flow dynamics during previous glaciations. It can also be easily integrated with data from other areas of the SIS to improve palaeo-glaciological reconstructions. This area is of particular interest as it was at the southernmost limit of the BISC, which was highly active during the last glaciation and a key control governing SIS drainage and collapse (Patton et al., 2017). These data can be used as a valuable source of information on the behaviour of terrestrially terminating ice streams that have no contemporary analogues.
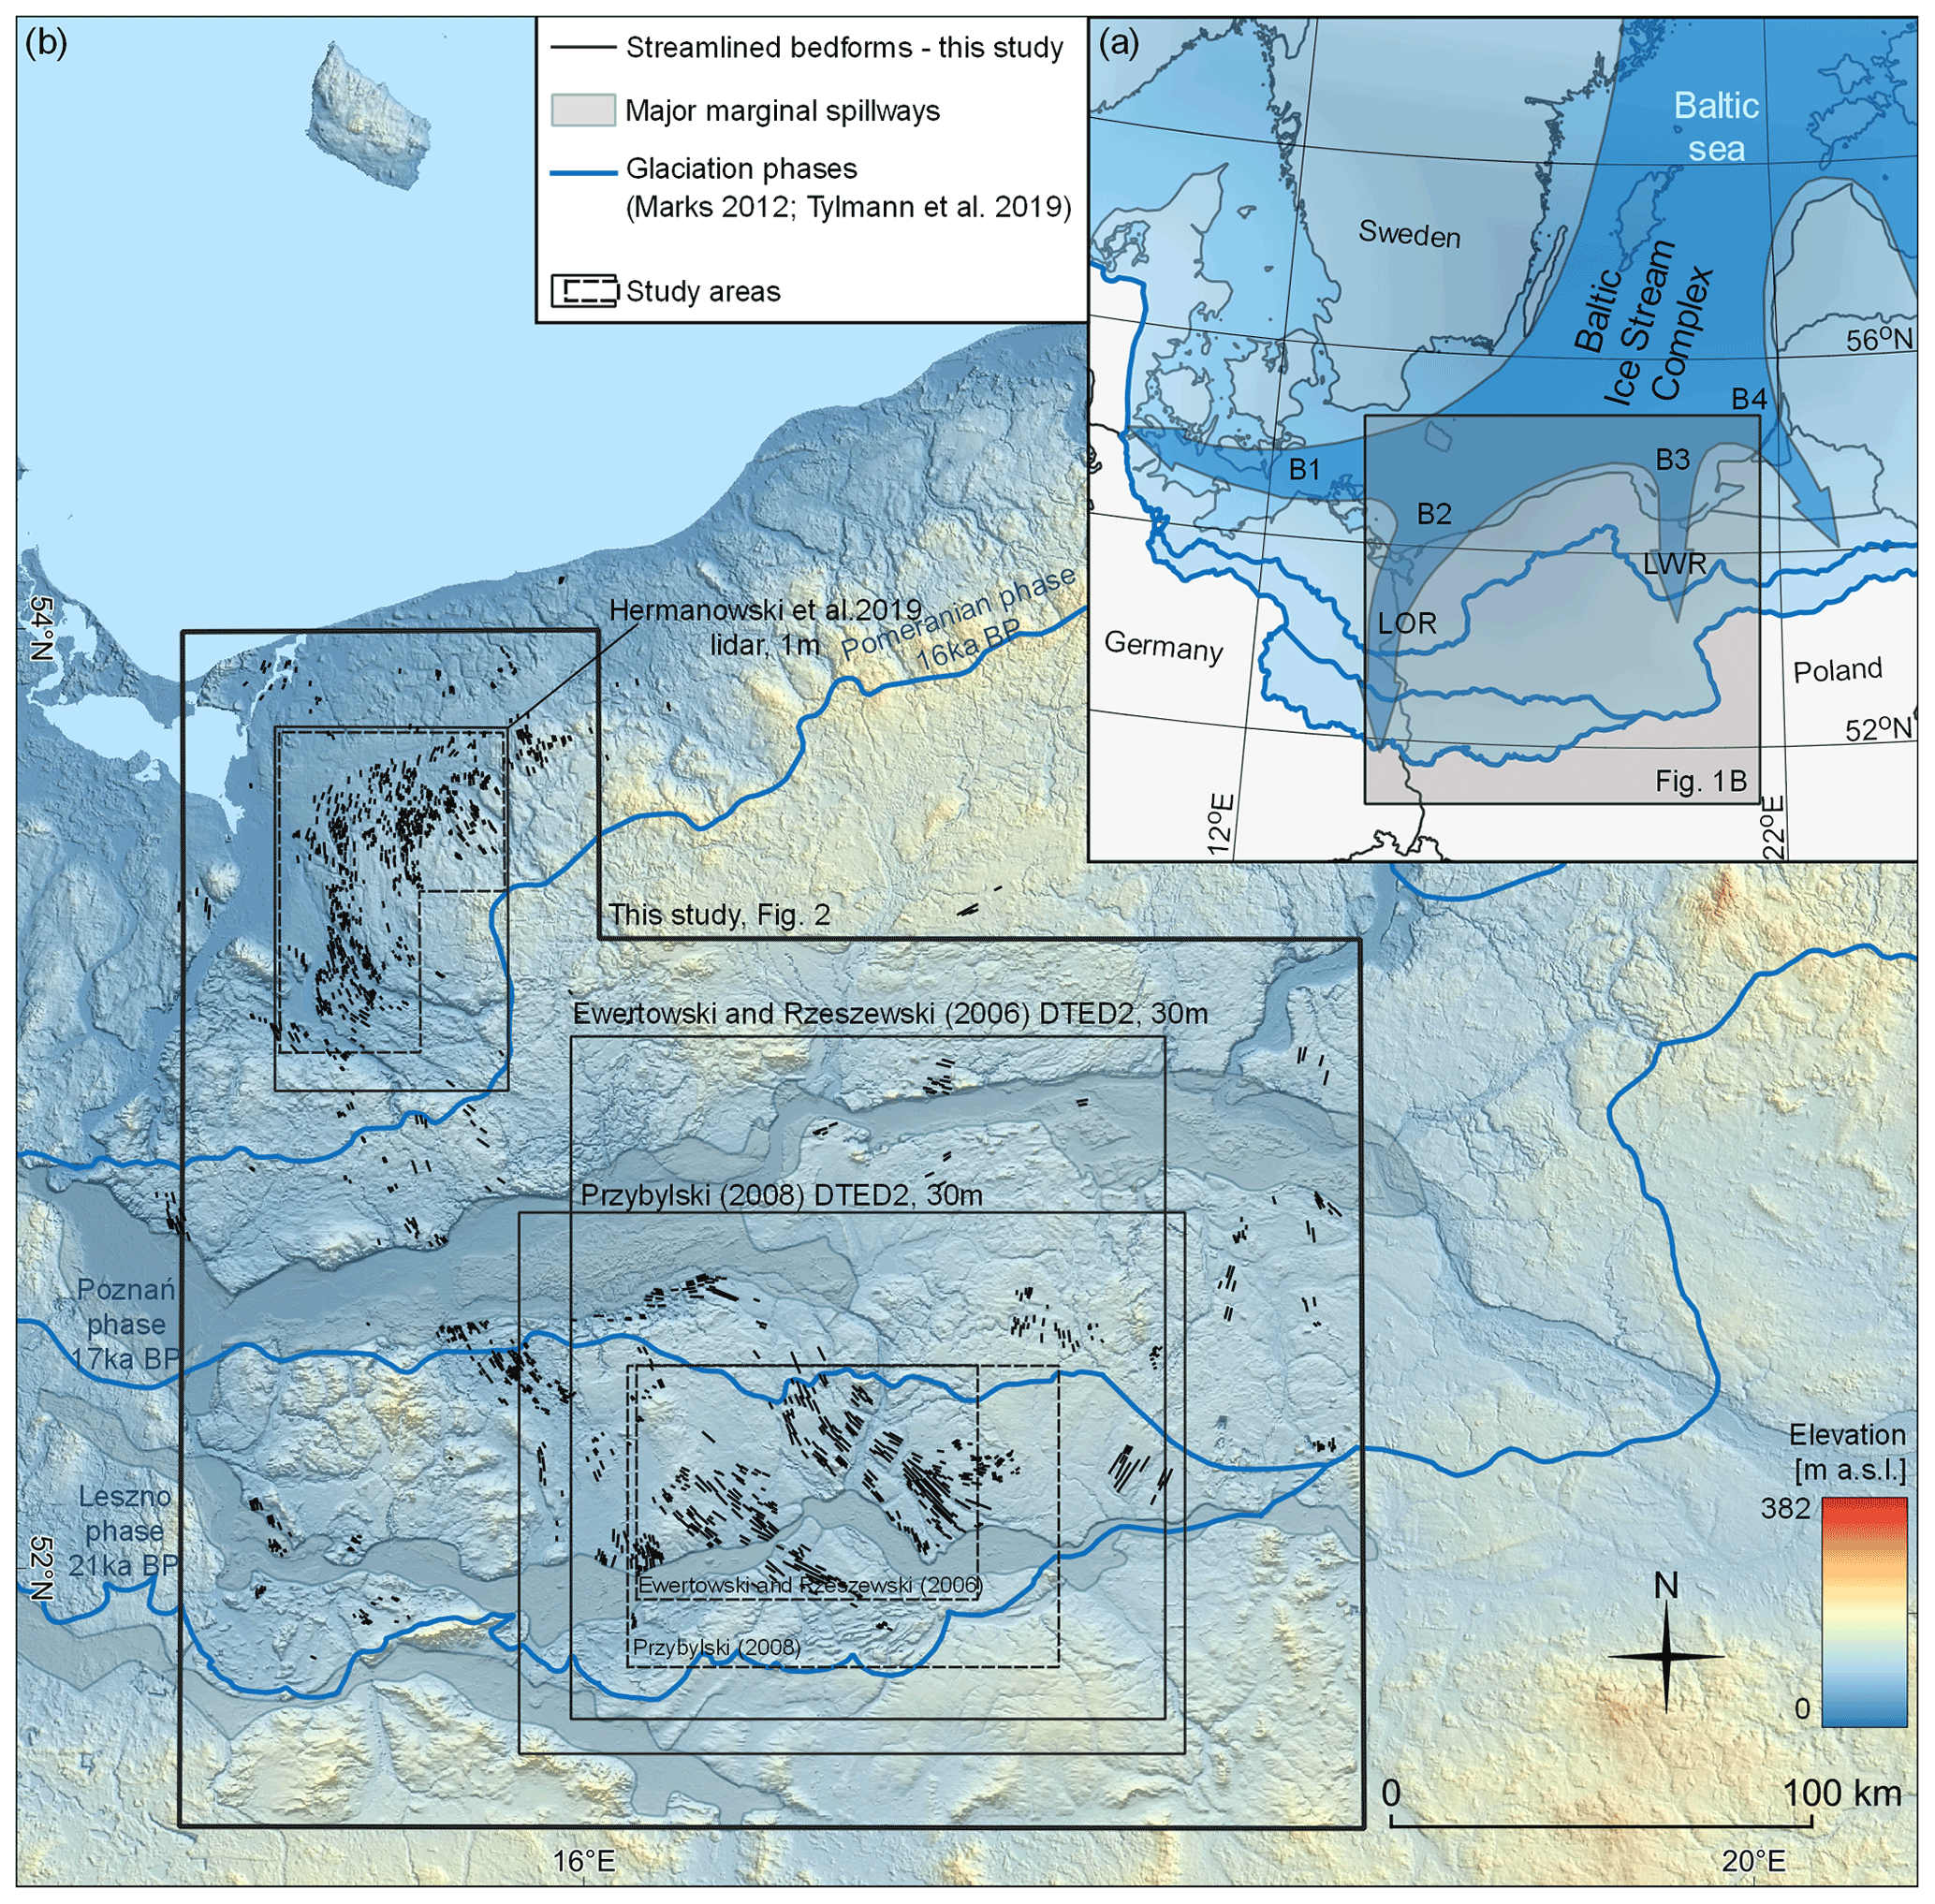
Figure 1(a) An overview of the Baltic Ice Stream Complex, southern sector of the SIS, with B1–B4 ice streams after Punkari (1997). (b) Study area including the extent of previous studies (boxes) that have mapped streamlined bedforms and major marginal spillways. Streamlined bedforms are from this study. Dashed lines indicate a bounding envelope for streamlined bedforms detected during previous studies. The difference between bounding envelopes for studies with overlapping areas indicates that a DEM pixel size of 30 m produces ambiguity in the detection of streamlined bedforms near the local LGM.
The southern sector of the SIS was drained by the so-called BISC (Boulton et al., 2001, 2004; Kalm, 2012), which comprised several branches of fast-flowing ice across the central European plains (see Punkari, 1997; Boulton et al., 2001; Stokes and Clark, 2001). The region of central west Poland was glaciated (1) during the Middle Weichselian ca. 30–50 ka (Wysota et al., 2009, and the references therein; Houmark-Nielsen, 2010; Hughes et al., 2016), (2) during the Late Weichselian local Last Glacial Maximum (LGM) that took place between 25 and 21 ka (Tylmann et al., 2019), and (3) partly during two Young Baltic advances after 18 ka (Kjær et al., 2003; Stroeven et al., 2016). The southernmost position of the SIS margin, in central west Poland, was slightly south of 52∘ N (Fig. 1) and was attained during the local LGM (Leszno/Brandenburg Phase). The Young Baltic advances are shown to be correlated with the Poznań/Frankfurt Phase and the Pomeranian Phase (Stroeven et al., 2016). The retreat of the ice sheet northwards across the Baltic Sea occurred at about 16.5 ka (Stroeven et al., 2016).
The study area covers ca. 65 000 km2 of central west Poland. This region was occupied by ice streams flowing from the north-west (from the Lower Odra region – LOR) and north-east (Lower Wisła region – LWR; the Wisła is also known as the Vistula in English), corresponding to the B2 and B3 ice streams, respectively, of Punkari (1997) (Fig. 1). The earliest studies focused on glacial landform mapping across the study area were based on geomorphological field mapping by the Prussian Geological Survey at the end of the 19th and beginning of the 20th centuries (e.g. Berendt and Keilhack, 1894; Korn, 1912; Assmann and Dammer, 1916; Woldstedt, 1935). Further studies comprised geomorphological field mapping and analogue topographic map analysis (Krygowski, 1947, 1963; Kozarski, 1959, 1962, 1978, 1995; Galon, 1961; Bartkowski, 1962, 1963, 1964, 1967, 1968, 1969, 1972; Karczewski, 1963, 1971; Stankowski, 1968; Karczewski et al., 1980; Liedtke, 1981; Rotnicki and Borówka, 1989, 1994). The first remote mapping attempts were based on digital elevation models (DEMs) with a resolution of 30 m and topographic maps with scales of 1:50 000 and 1:10 000 (Ewertowski and Rzeszewski, 2006; Przybylski, 2008). Streamlined bedforms along the Stargard drumlin field, in the north-western portion of the study area, along the LOR, were investigated by Keilhack (1897), Karczewski (1976), and more recently Hermanowski et al. (2019) (see Fig. 1b).
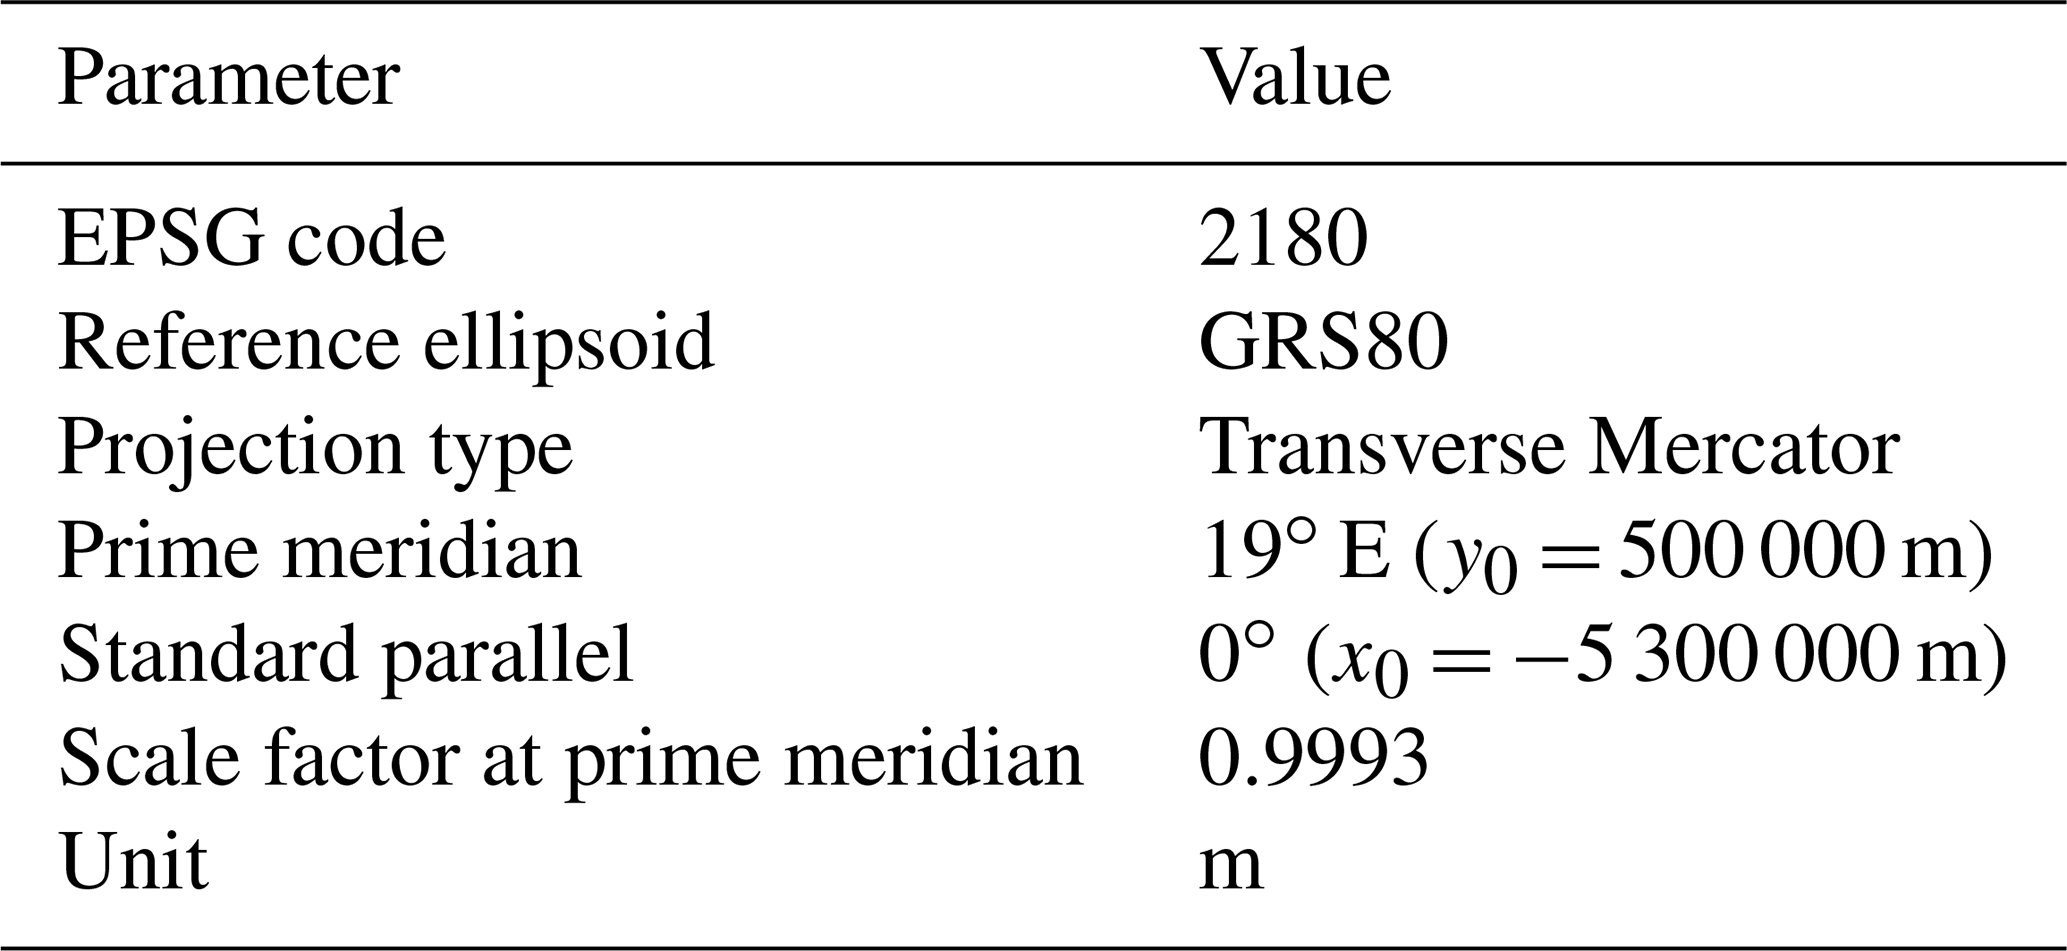
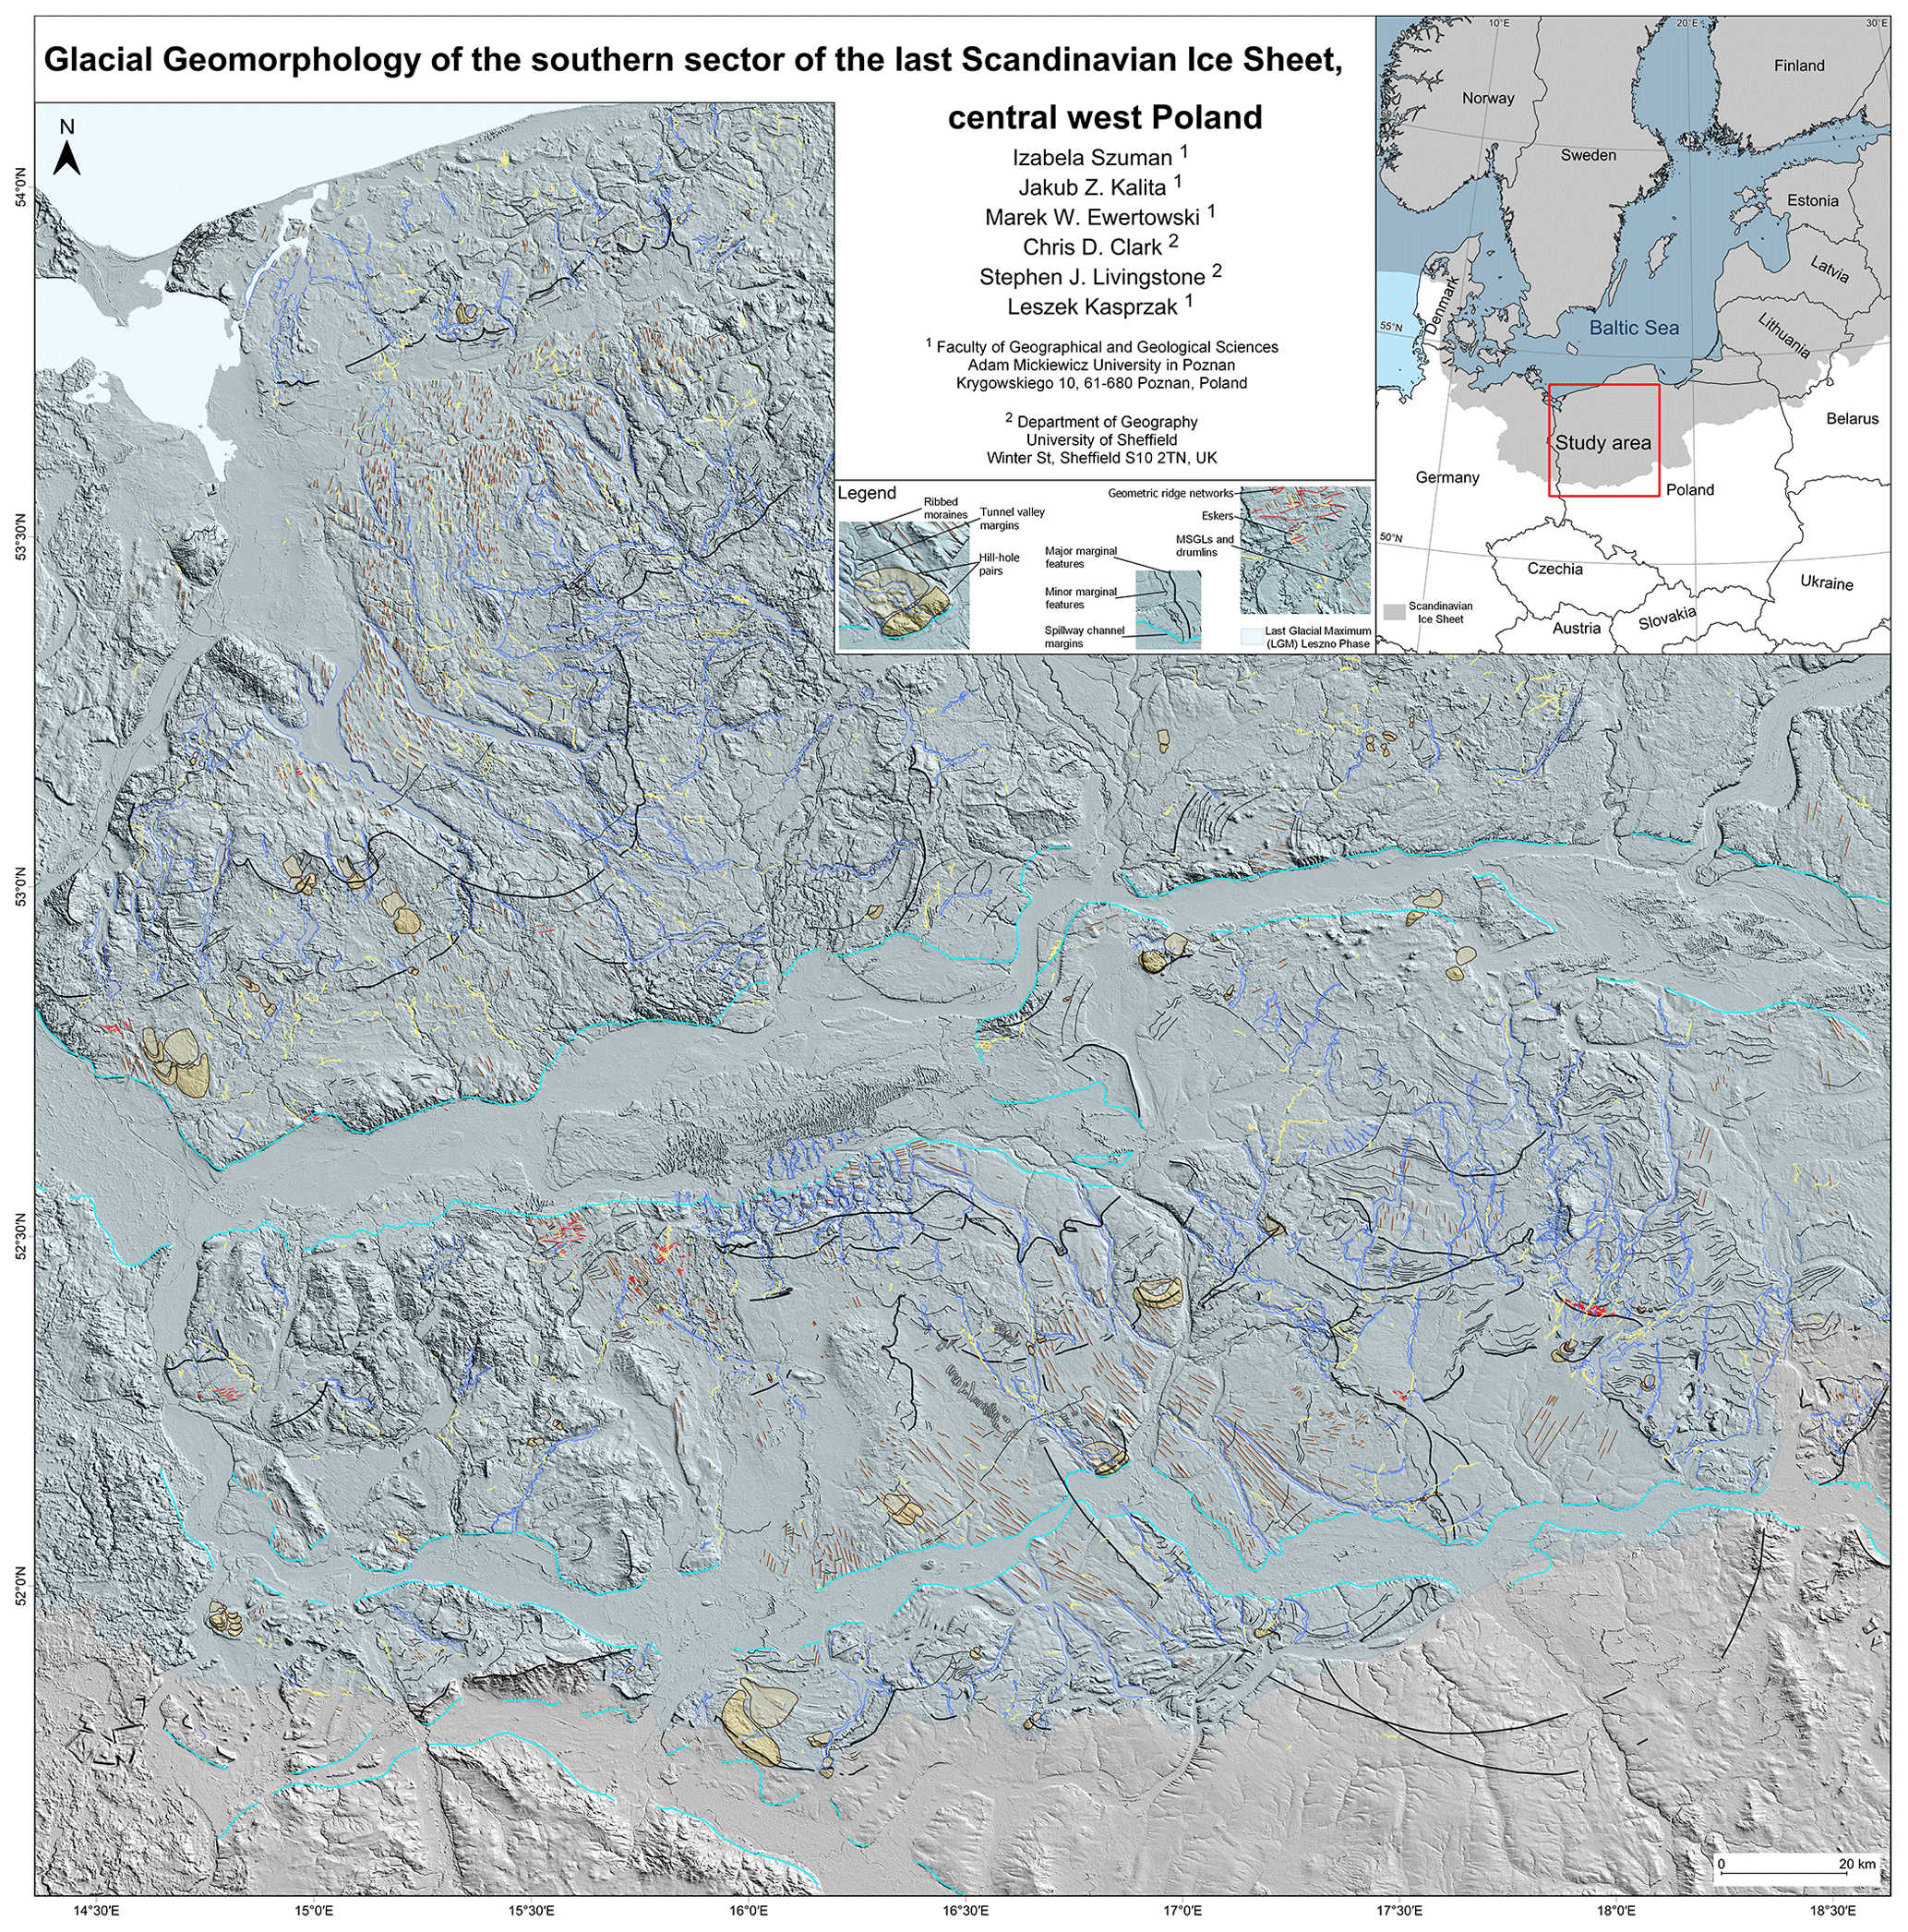
Figure 2Glacial geomorphology of the southern sector of the last Scandinavian Ice Sheet, central west Poland. This is designed to be viewed at a scale of 1:500 000 and will need downloading from the Supplementary material (Fig. S1 at https://doi.org/10.5281/zenodo.4570570) to identify all features (see Szuman et al., 2021a).
We used high-resolution lidar point cloud data (GUGiK, 2017) to generate a DEM with a 0.4 m ground sampling distance (GSD) across an area of about 250 km × 300 km. Raw lidar data were distributed in square tiles of 1 km × 1 km, with an average survey point (pt) density of between 4 and 6 pt m−2. Several highly urbanised complexes were covered by 0.5 km × 0.5 km tiles with a density of 15–20 pt m−2. The terrain coordinate system was EPSG:2180 (Table 1). The original dataset comprised about 65 000 raw data files and therefore required scripting to optimise the DEM generation process.
The original data files were filtered leaving only points classified as a part of ground surface. Since the bottleneck for pre-processing was disk storage transfer, each file was compressed using the LASzip algorithm (Isenburg, 2013), reducing the storage size of the files by 7 %–25 %. Both operations were performed as a single step using the las2las procedure of the LAStools library (Hug et al., 2004). The DEM was generated using the PDAL library (PDAL Contributors, 2018), assigning terrain height values based on Shepard's inverse distance weighting algorithm (Shepard, 1968), with an empirically adjusted radius of 4 m based on their density.
Further raster processing steps were performed using the GDAL library (Warmerdam, 2008). Merging (gdal_merge) resulted in more than 200 tiles of
16 km × 16 km. Hillshade models were dynamically generated in Quantum GIS (https://qgis.org, last access: 23 February 2021) using multidirectional sun azimuths from 0 to 90∘ and from 270 to 360∘ with increments of
45∘, a sun altitude of 45∘, and a variable vertical exaggeration factor from 15 to 45 (estimated empirically for each subregion to
emphasise small landforms). Such an approach aimed to improve landform recognition (Smith and Clark, 2005), enabling more accurate detection of
landforms of different orientation compared to investigations limited to only two orthogonal directions.
A second raster dataset was produced by de-trending the DEM data. Mean elevation was derived using a bilinear resampling algorithm across a
2 km × 2 km window (gdal_translate), and this was subtracted from the original terrain elevation
(gdal_calc). The de-trended images enabled glacial landforms on slopes to be better distinguished. Such an approach was not valid in the
vicinity of meltwater valleys where steep slopes resulted in underestimation of the mean value used in the subtraction and thus disturbed the results.
The mapping process was based on semi-transparent hillshade images superimposed on the DEM and de-trended model. The DEM and de-trended and hillshaded
raster files were enhanced with pyramids (gdaladdo) to facilitate map browsing over such a large area. Three operators independently mapped
the study area to minimise the risk of landform misinterpretation. The differences were discussed and features removed if no agreement was reached
(the number of such cases was marginal considering the dataset size) or included in the case of consensus. The resultant dataset is a minimalistic
version, comprising only landforms recognised and verified by all three operators. Additional validation of uncertain bedforms was performed using raw
point clouds and ground truthing.
We classified the glacial landforms into eight groups: (i) streamlined bedforms, comprising mega-scale glacial lineations (MSGLs) and drumlins; (ii) major and (iii) minor ice-marginal features, both including moraine ridges, abrupt margins, and edges of ice-contact fans, with major marginal landforms marking terminal positions of ice streams or the main recessional phases and minor marginal landforms comprising sequences of moraine ridges, delicate isolated crests, and abrupt margins delineating subsequent positions of the receding ice streams; (iv) ribbed moraines; (v) tunnel valleys; (vi) eskers; (vii) geometrical ridge networks; and (viii) hill–hole pairs.
The coordinate system of the resulting dataset was based on the coordinate system of the original point cloud dataset (Table 1). The projection zone width of 10∘, designed to comply with the territory of Poland, resulted in the scale factor at the prime meridian producing length distortions of up to 70 cm km−1 at the E border of the study area. In the worst-case scenario, measurement of streamlined bedforms at the borders of the study area and oriented longitudinally resulted in an elongation error of 0.07 %. Taking into consideration overall uncertainty in the dataset (see Sect. 5), such error is irrelevant for analyses focused on the distribution and morphological characteristics of glacial landforms (Clark et al., 2009; Spagnolo et al., 2014; Ely et al., 2016) or tying numerical modelling with their morphology (Jamieson et al., 2016).


Figure 4Dimensions of mapped MSGLs, drumlins, and ribbed moraines on top of a subglacial bedform continuum presented by Ely et al. (2016) as ellipsoidal geomorphological clusters.
In this study, we have produced a GIS dataset of glacial features, focused on landforms that provide information on ice dynamics. The dataset is available at https://doi.org/10.5281/zenodo.4570570 (Szuman et al., 2021a) and contains 5461 features in GeoPackage format (http://www.geopackage.org/, last access: 23 February 2021). The glacial geomorphology map prepared from the dataset is presented in Fig. 2 and available via the Supplementary data. A full morphological description and interpretation of the landforms is presented elsewhere (Szuman et al., 2021b); here, we outline the general characteristics of landforms included in the dataset (Figs. 3 and 4).
4.1 Streamlined bedforms – MSGLs and drumlins
MSGLs have a linear topographic expression that can be sustained for over 40 km in length (Clark, 1993), with typical lengths of between about 1 and 9 km, widths between 90 and 720 m, and spacing between 140 and 960 m (Spagnolo et al., 2014). MSGLs are one of the key geomorphological criteria for identifying former ice streams (Stokes and Clark, 2001), often occur with less elongated drumlins, and have a convergent pattern of flow in the ice stream onset zone and fan-shaped divergence pattern near the margin (Stokes and Clark, 1999). A typical drumlin is a smooth, streamlined hill resembling the bowl of a spoon aligned longitudinally to the ice movement direction (cf. Clark et al., 2009). Drumlin lengths are typically between 100 and 1000 m with widths typically 3 times smaller (Clark et al., 2009). Even though drumlins and MSGLs are often treated separately, considering their shape and size, they form a morphological continuum of subglacial lineations (Stokes et al., 2013; Ely et al., 2016) and therefore possibly share a similar origin (see also Stokes, 2018).
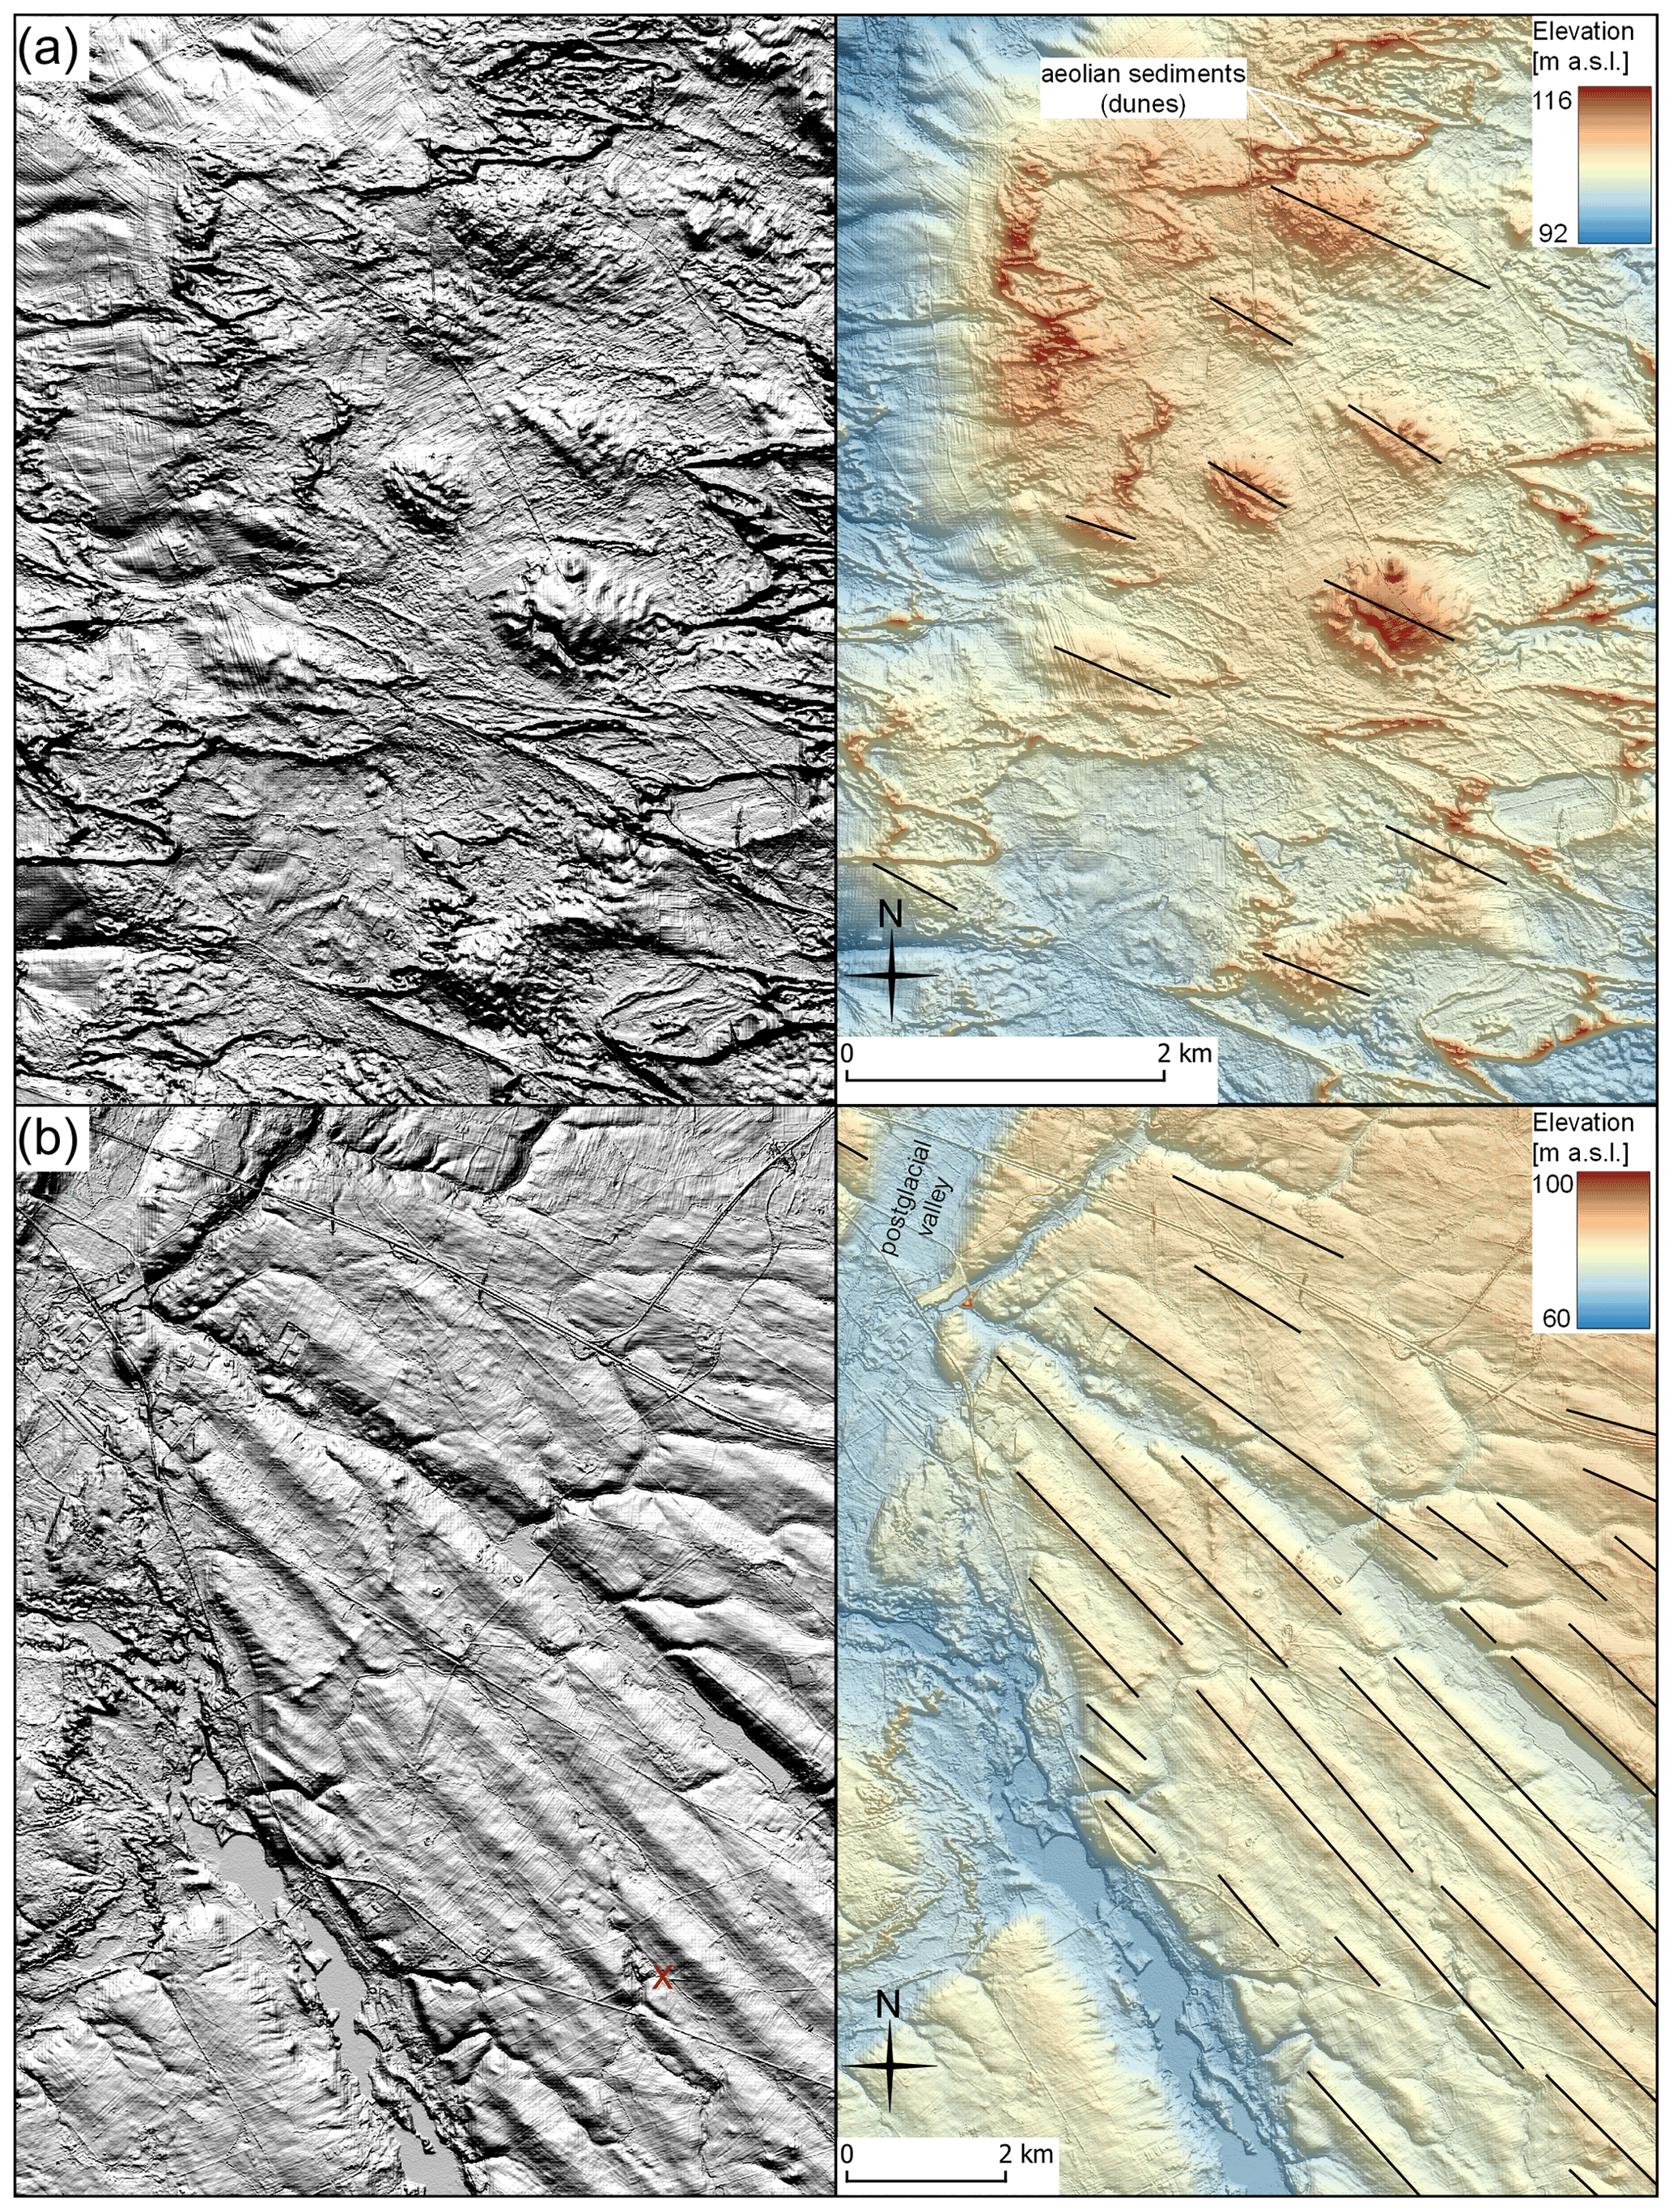
Figure 5Plain hillshade model (left) and DEM superimposed on hillshade model (right) with mapped (a) drumlins and (b) MSGLs as polylines along their crests. Where discontinuities in landforms (e.g. indicated with red X in b – hillshade) were interpreted as arising from postglacial activity from the action of water erosion, aeolian processes, or anthropogenic activity, the shape of the original landform was mapped.
We mapped MSGLs and drumlins along their crests (Fig. 5; cf. Spagnolo et al., 2014; Ely et al., 2016). In the study area we identified 1712 MSGLs and drumlins with lengths of up to 10 km, widths between 50 and 800 m, and elongation ratios of up to 1:60 (Fig. 3). They are mostly found in two areas: the Stargard drumlin field in the NE of the study area and the central part of the area between the Poznań and Leszno phases (Fig. 1). Due to their association with high ice flow velocity (Jamieson et al., 2016), they were one of the key elements in the identification of 17 palaeo-ice streams (see Szuman et al., 2021b).
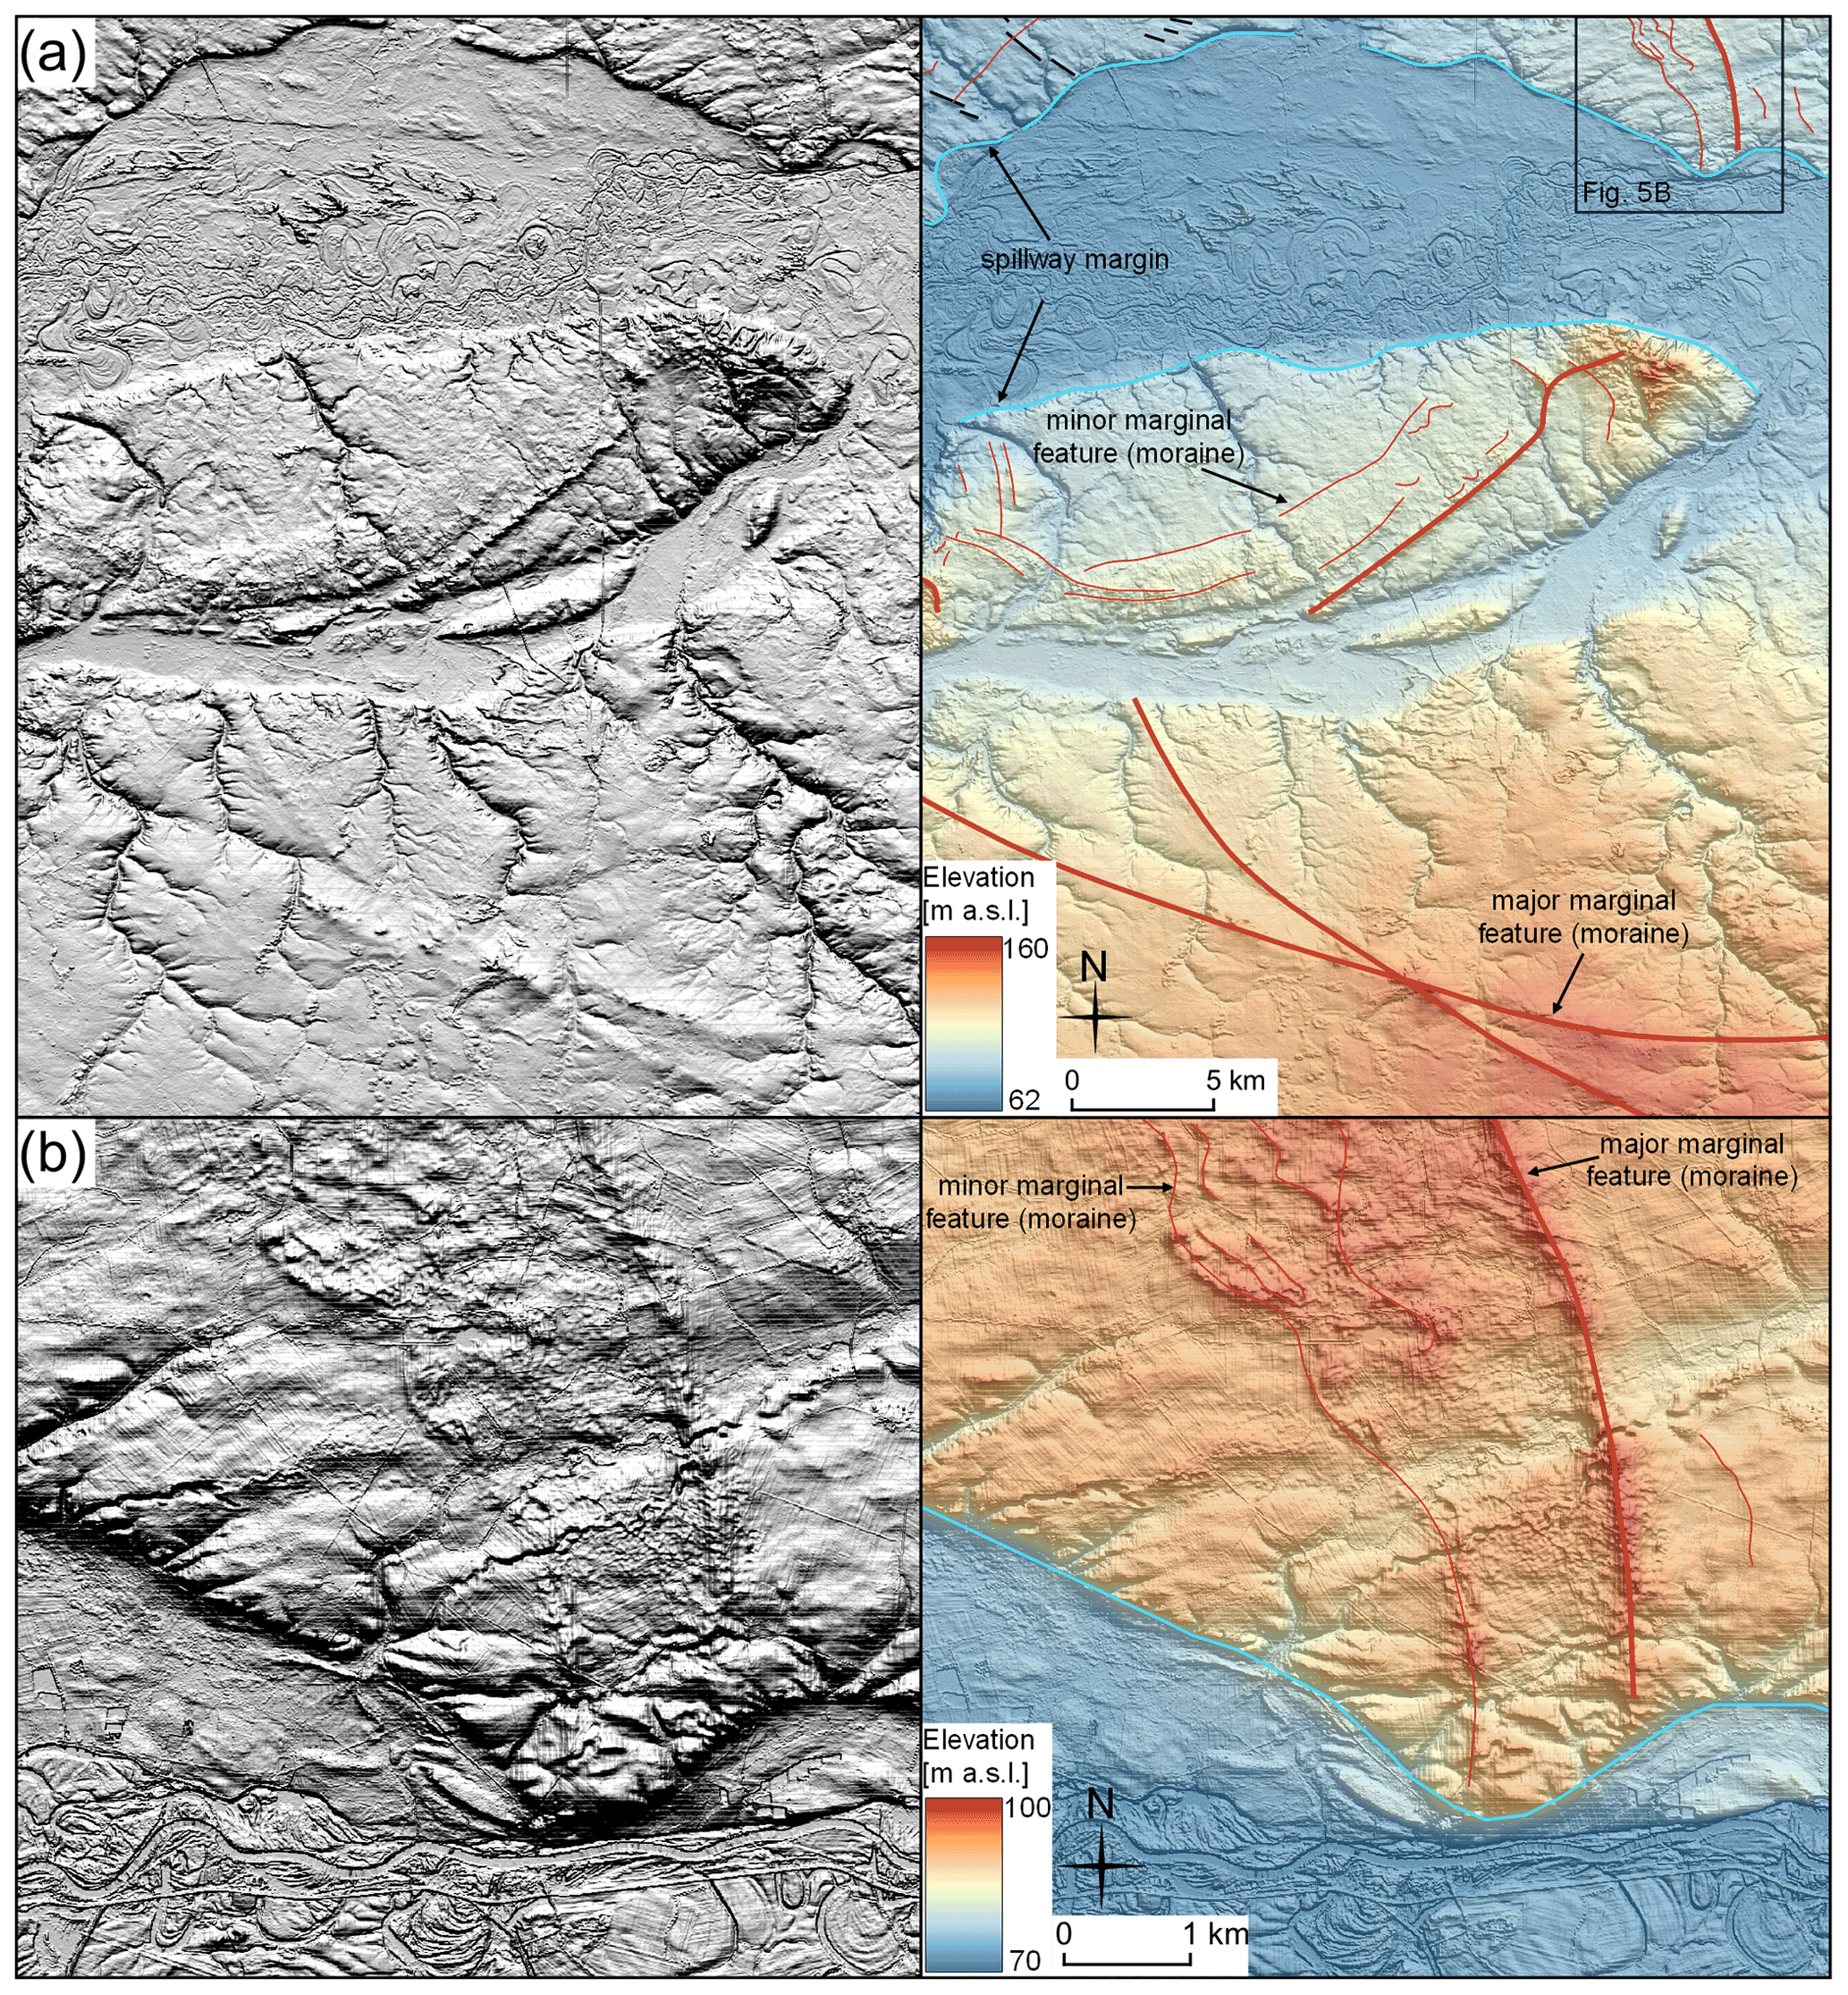
Figure 6Examples of marginal features as a hillshade model (left) and DEM superimposed on hillshade model (right). (a) Cross-cutting of major marginal moraines. (b) Close-up on minor marginal moraines. Notice the prominent ice-marginal spillway disturbing the continuity of other glacial forms.
4.2 Major and minor marginal features
The marginal position of ice streams was identified from (i) moraine ridges, (ii) abrupt margins, and (iii) edges of ice-contact fans. Moraine ridges are accumulations of glacial material formed at the overall receding ice margin during standstill or re-advance (e.g. Barr and Lovell, 2014). In our study, an abrupt margin relates to lateral or terminal margins of the former ice streams marked by distinct change in topography, i.e. a switch from streamlined terrain to ribbed moraine (e.g. Vérité et al., 2020; Szuman et al., 2021b), or a steep-sloped topographic step, formed at an ice-contact face or ice stream lateral margin (Patton et al., 2016b; Alley et al., 2019), without any distinctive moraine chains. Ice-contact fans are cones of glacial and glaciofluvial sediments formed at the ice margin (Benn and Evans, 2010). They are asymmetrical, comprising a gentle distal slope and steep proximal slope with a steep edge. Marginal landforms were classified as major or minor. Major marginal landforms are typically associated with the terminal moraines of ice streams, abrupt margins, main stillstands, or distinct lateral moraines (Fig. 6a). In the study area, the remnants of terminal moraines constitute either clear or vestigial arcuate ridges sporadically exceeding 10 m in amplitude and 2 km in width and are sometimes associated with lineation flowsets. Minor marginal landforms represent recessional moraines and cupola hills with amplitudes of up to several metres and widths typically below 400 m (Fig. 6b). Limited sedimentological investigations prohibited a more detailed genetic classification.
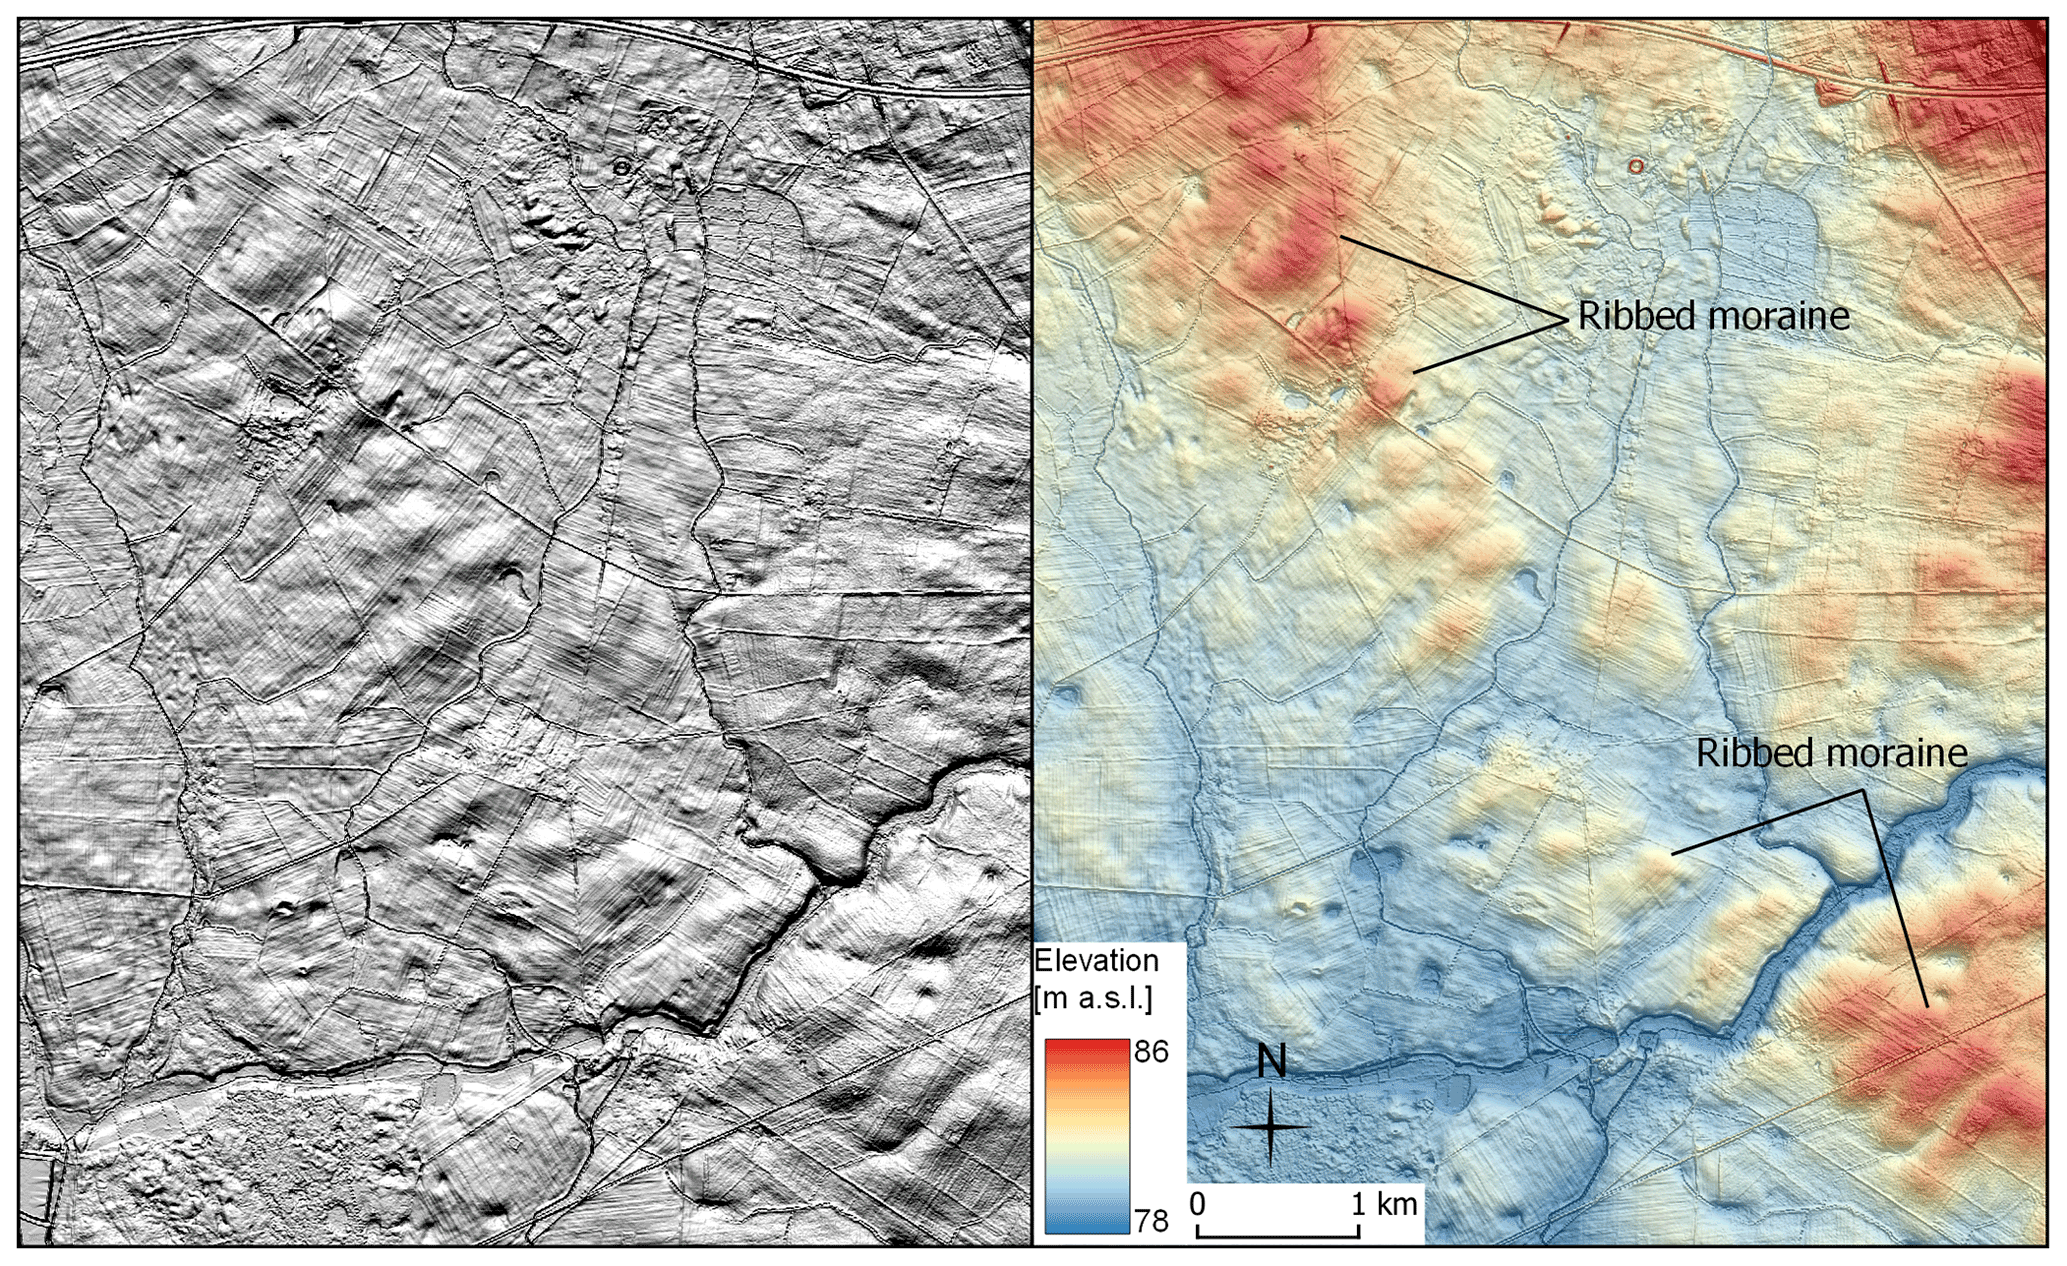
Figure 7Examples of ribbed moraine as plain hillshade model (left) and DEM superimposed on hillshade model (right).
4.3 Ribbed moraines
Ribbed moraines are parallel-spaced ridges, oriented transverse to the ice flow direction (Dunlop and Clark, 2006). They constitute sets formed subglacially in association with reduced ice flow velocities and are typically found up-ice of drumlins and MSGLs (Ely et al., 2016), at ice stream shear margins (Vérité et al., 2020; Szuman et al., 2021b) or superimposed on streamlined bedforms (Stokes et al., 2008). In the study area, ribbed moraines form three elongated ribbons parallel to the inferred ice flow direction located at the sides of areas interpreted as being occupied by ice streams (Szuman et al., 2021b). The ribbed moraine ridges in the study area are up to about 400 m wide and 2 km long, with amplitudes of about 2 m (Fig. 7), and occupy areas up to 20 km long.
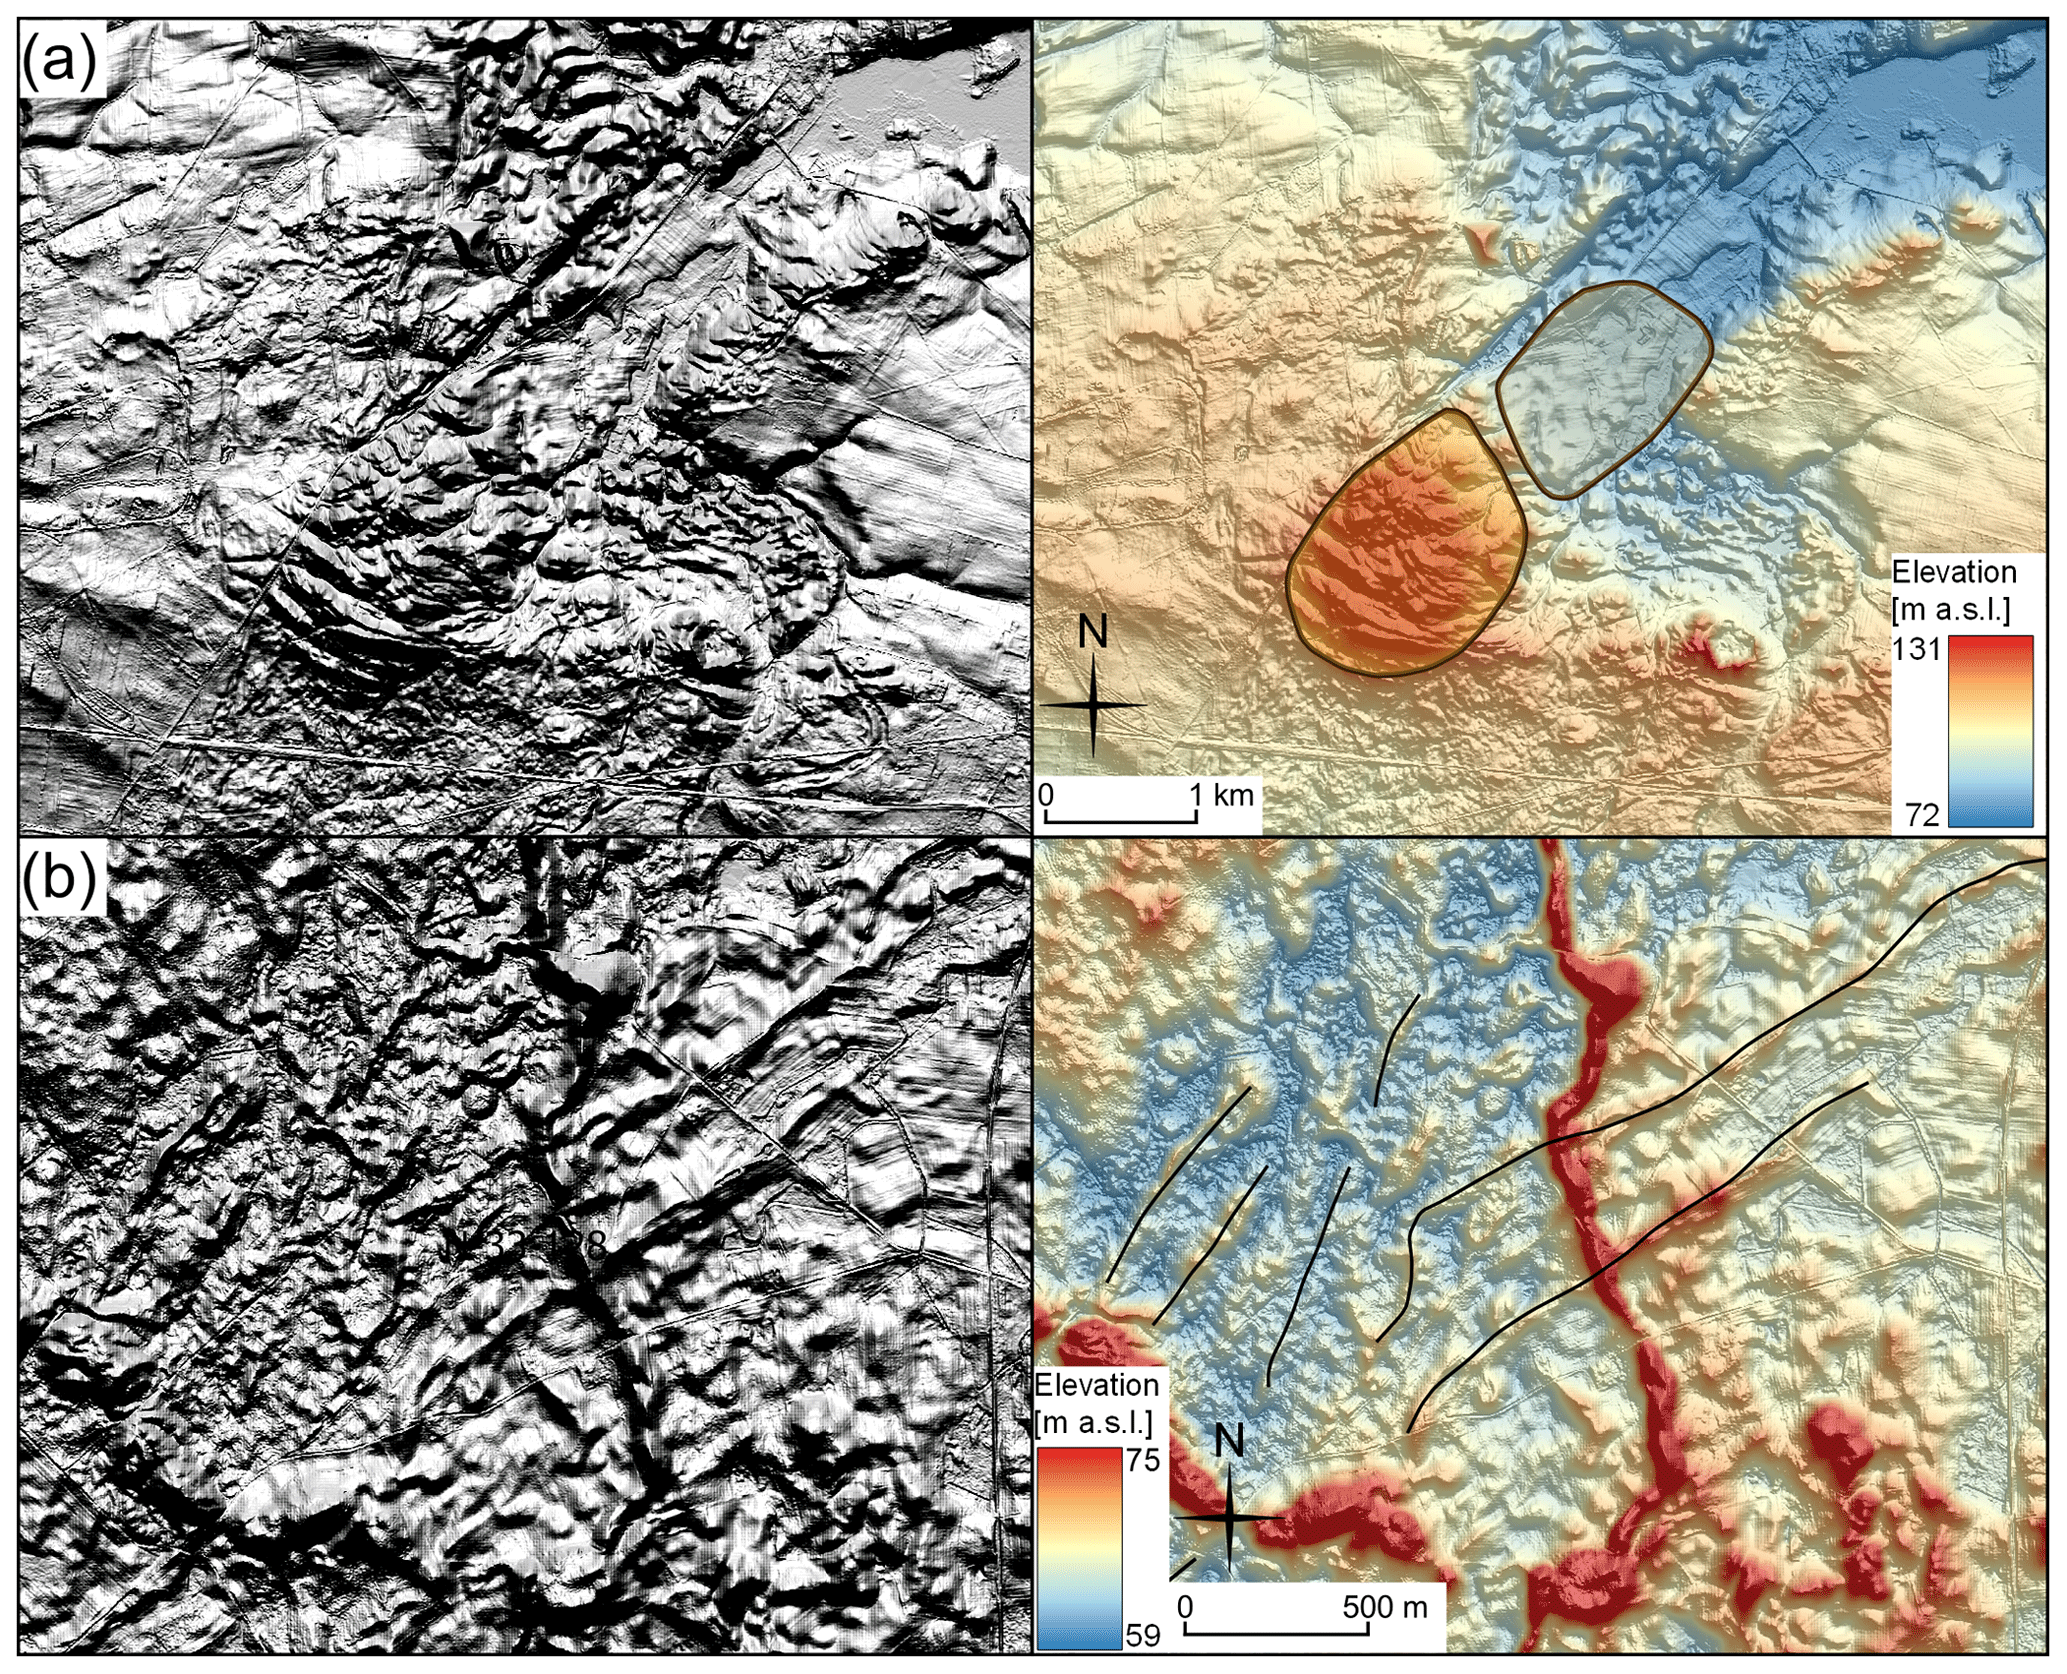
Figure 8Examples of (a) hill–hole-pair and (b) geometrical ridge network, as plain hillshade model (left) and DEM superimposed on hillshade model (right).
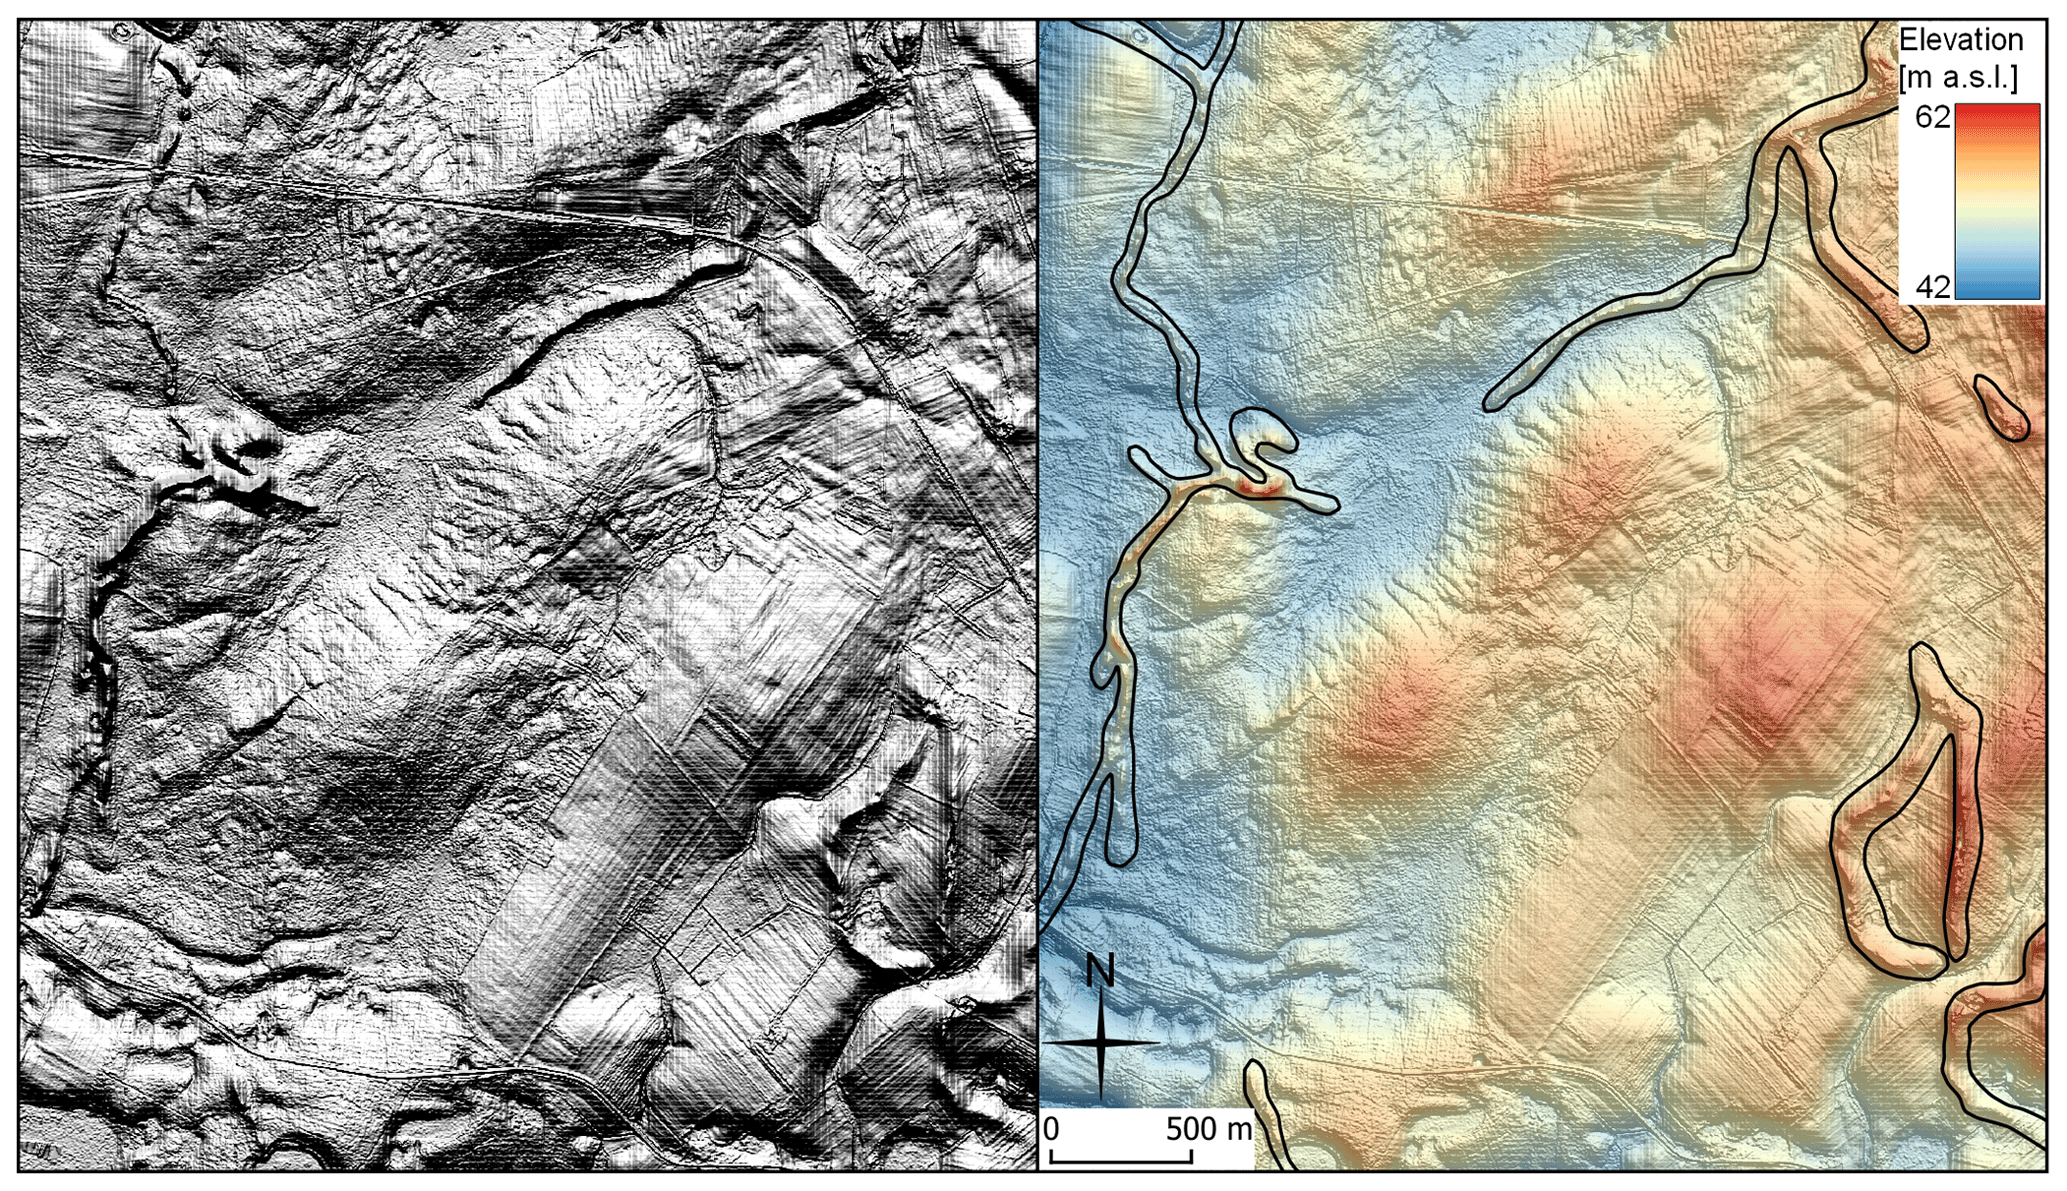
Figure 9Examples of eskers, along a drumlin field, as plain hillshade model (left) and DEM superimposed on hillshade model (right).
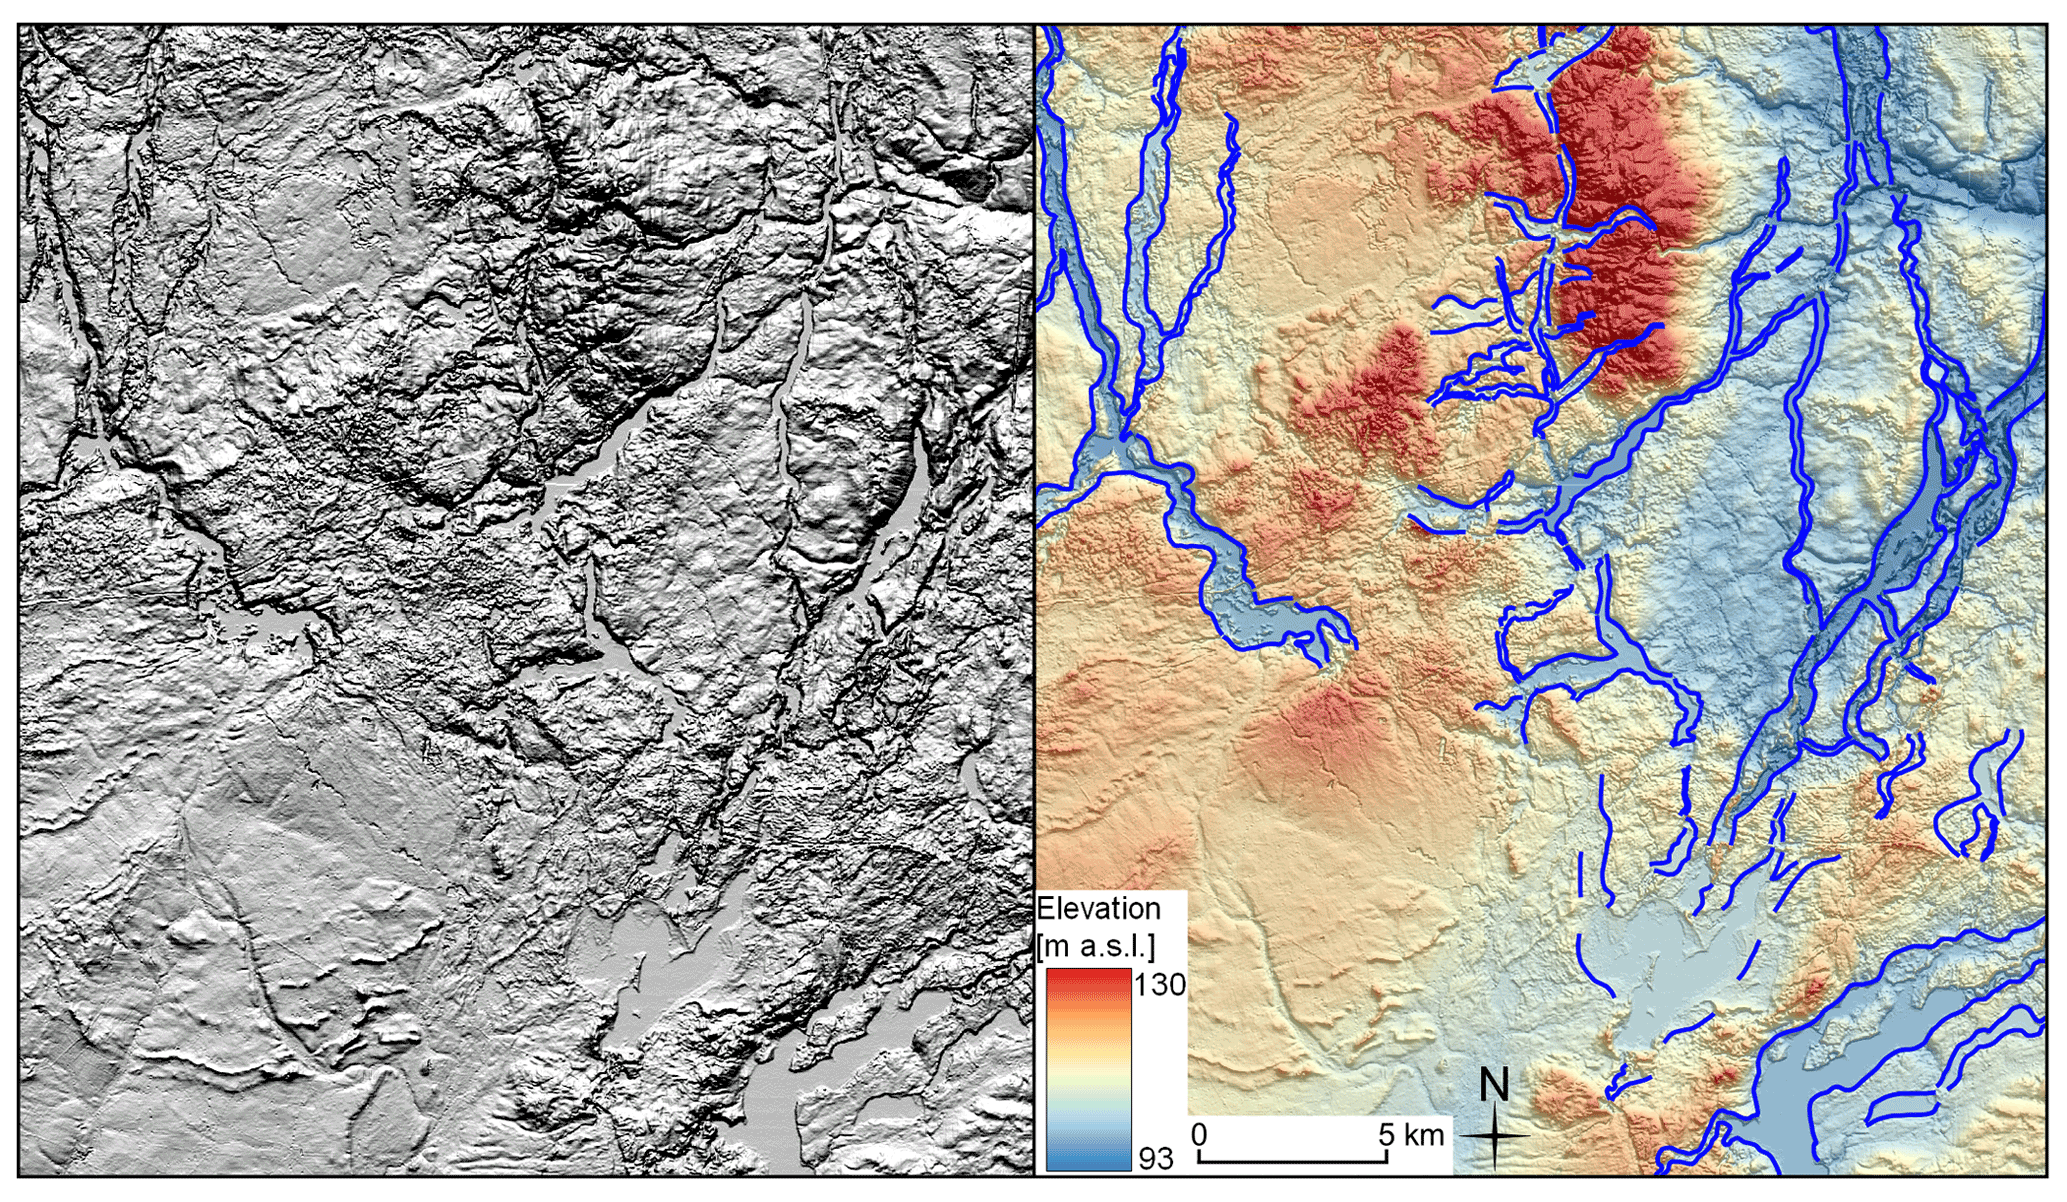
Figure 10Examples of tunnel valleys as plain hillshade model (left) and DEM superimposed on hillshade model (right).
4.4 Hill–hole pairs
A hill–hole pair (Fig. 8a) comprises an ice-thrusted hill, concave up-glacier, located a short distance downstream of a depression of similar size and shape (Bluemle and Clayton, 1984; Benn and Evans, 2010). Hill–hole pairs are interpreted as forming at the thin margin of advancing glaciers by the plucking of large blocks of material from their frozen bed (Moran et al., 1980). Basal freezing induces compressive subglacial stresses leading to glaciotectonism (Moran et al., 1980; Rise et al., 2016). We identified about 50 such features with relief of up to 50 m and typical widths between 1 and 4 and up to 15 km. They are typically associated with ice stream margins and often occur near the terminal parts of tunnel valleys (see Livingstone and Clark, 2016).
4.5 Geometrical ridge network
The term geometrical ridge network is a non-genetic description of glacial landforms with an organised ridge pattern, either sub-parallel to each other (e.g. Rea and Evans, 2011) or cross-cutting at acute angles (e.g. Bennett et al., 1996), typically inherited from ice structures. They are thought to originate from (i) squeezing of subglacial sediments into basal crevasses (Evans and Rea, 1999; Evans et al., 2008, 2014), (ii) sediments melting out from thrust planes and longitudinal foliation (Bennett et al., 1996; Glasser et al., 1998), or (iii) infilling of supraglacial crevasses with debris. For the features to be preserved, they require ice flow cessation and stagnation (e.g. Evans et al., 2016). Their preservation potential is low, so they are rare in glaciated areas compared to other landforms. We identified 214 linear ridges with lengths of up to 3 km, amplitudes of up to 10 m, and spacing of up to 1 km developed transversely to the ice flow direction. In the study area, they can be found in superimposition with MSGLs or eskers (Fig. 8b for the latter).
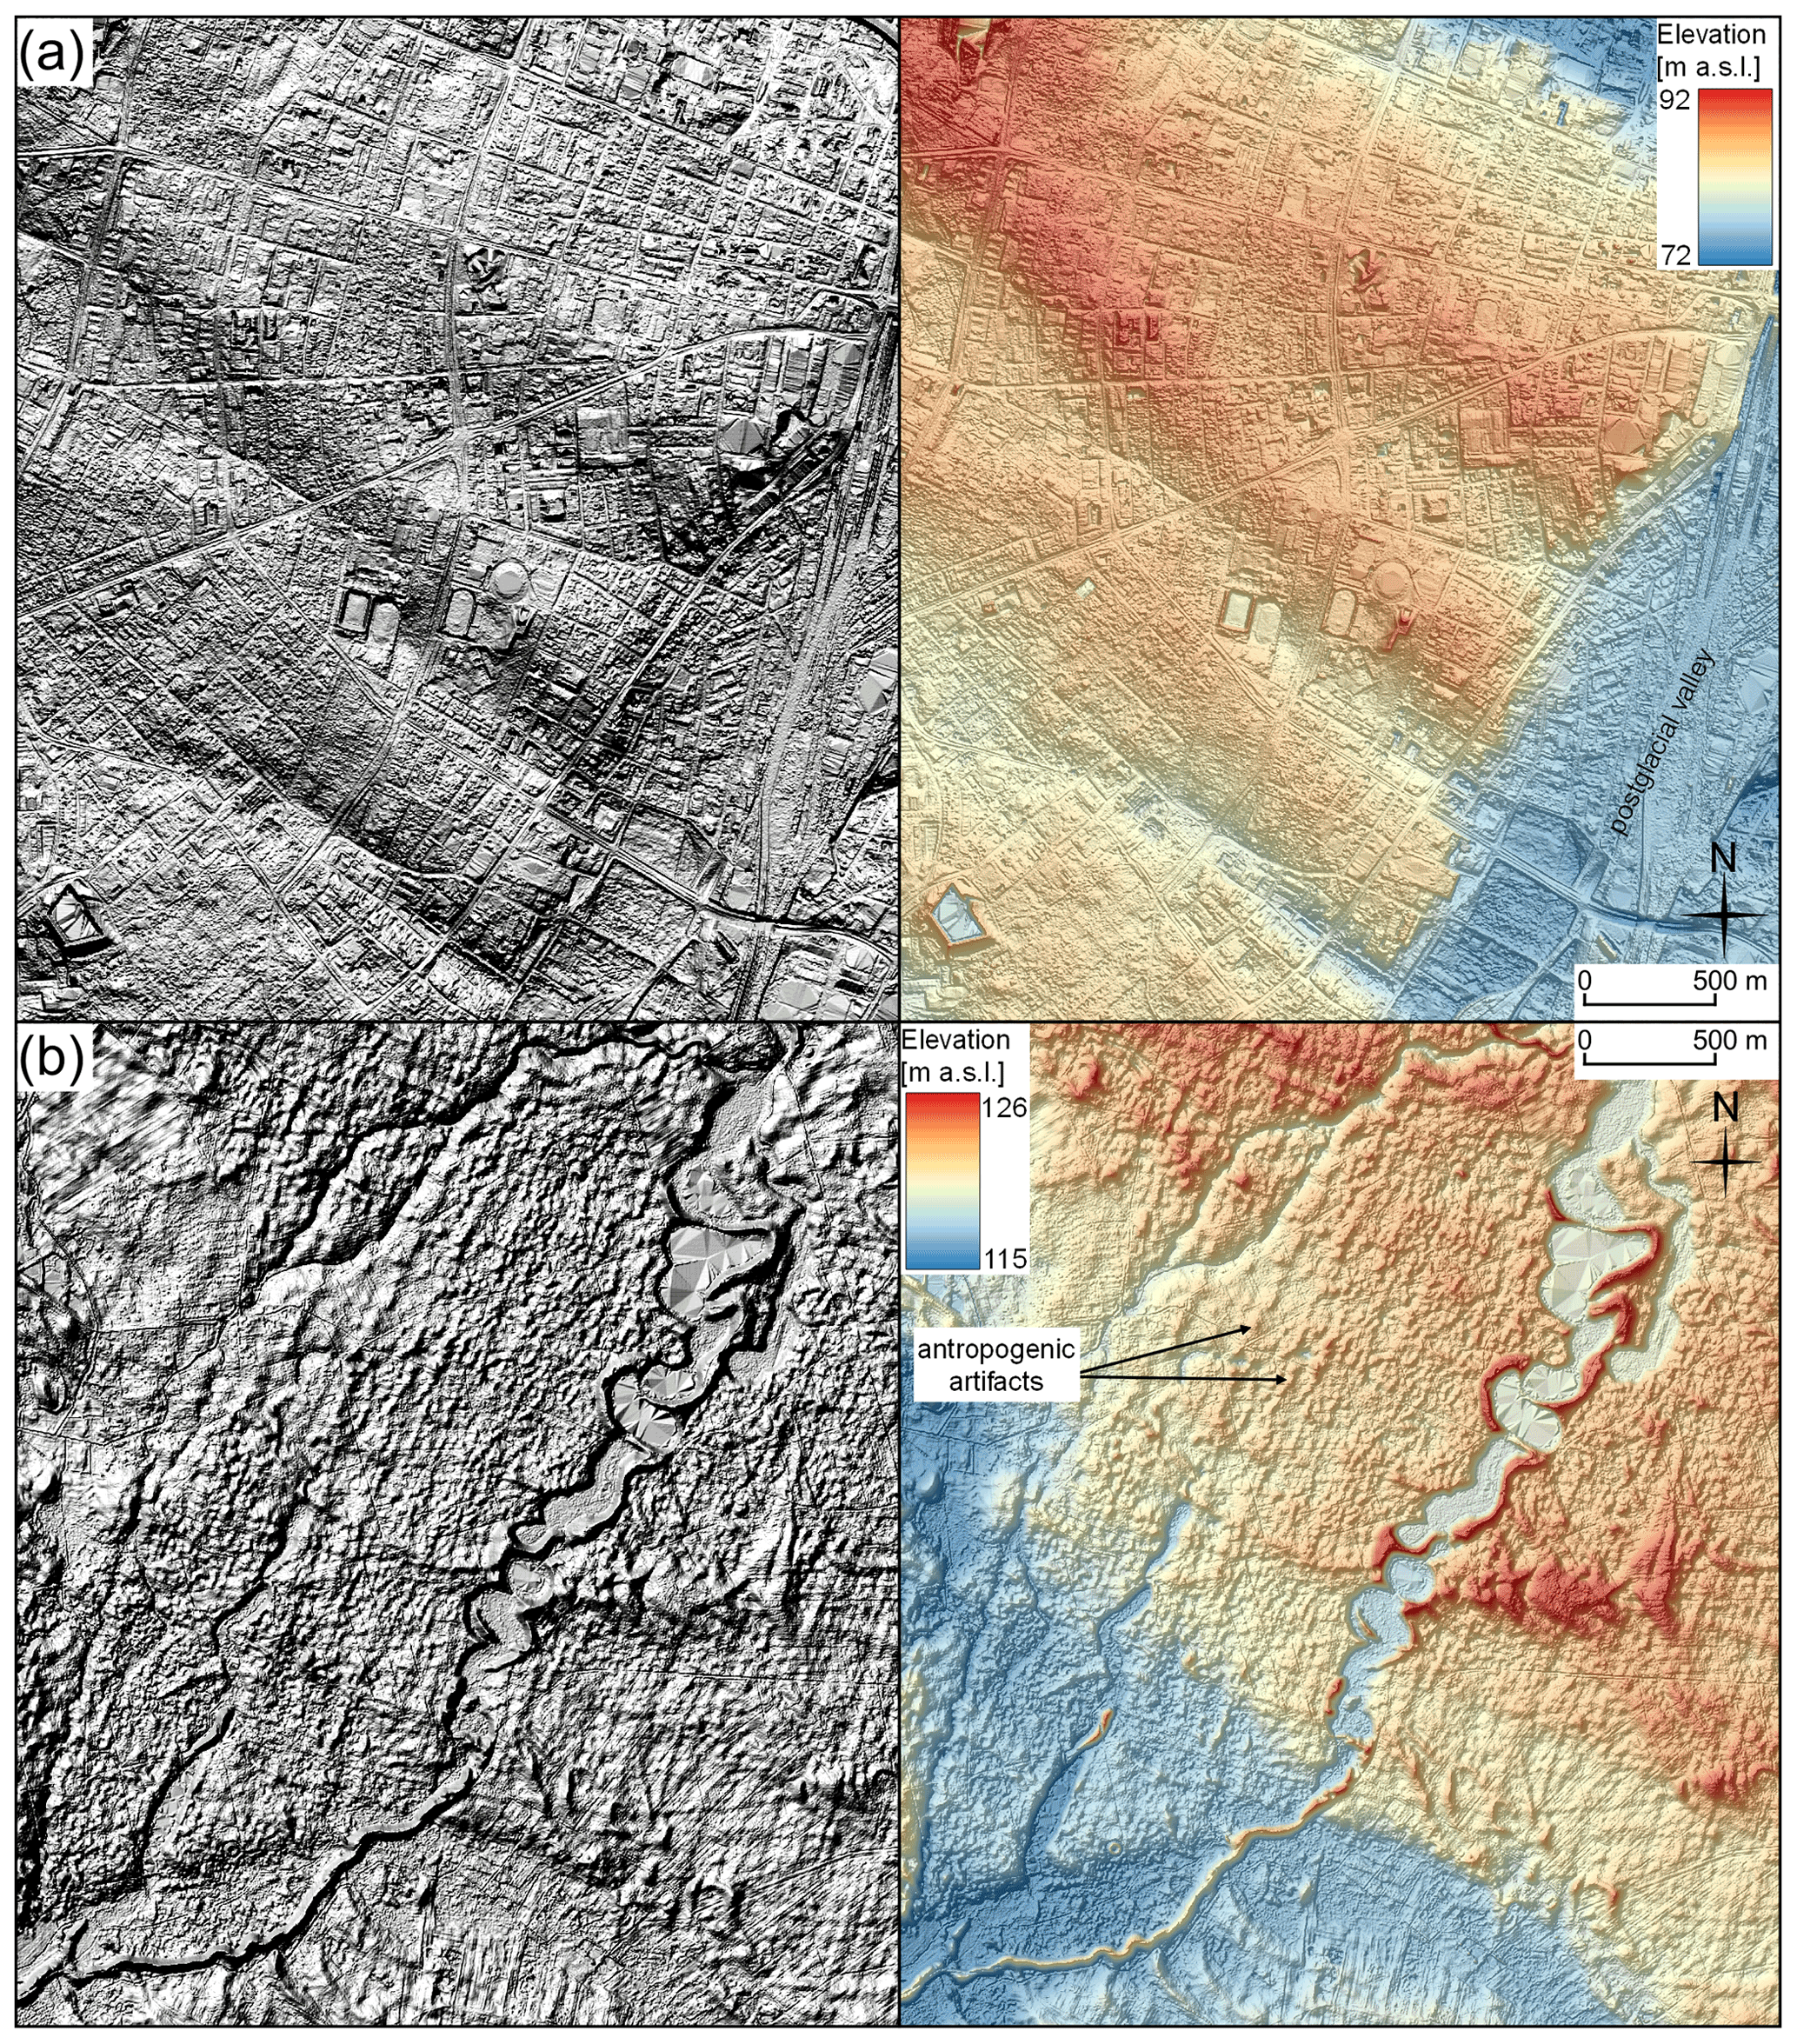
Figure 11(a) Highly urbanised area on top of MSGLs interrupted by postglacial valley. Notice that the scale difference of the imprint for both groups results in small degradation potential. (b) There is an impression of delicate streamlined bedforms, which are in fact of anthropogenic origin. Ground truthing showed that they are forestry artefacts.
4.6 Eskers
Eskers are sinusoidal ridges, usually oriented parallel to the ice flow and composed of glaciofluvial sands and gravels (Benn and Evans, 2010) deposited typically by meltwater in subglacial channels and less often in englacial and supraglacial channels (Hebrand and Åmark, 1989). They are often interpreted to form time-transgressively, close to a retreating margin (Kleman and Borgström, 1996; Storrar et al., 2014a, b; Livingstone et al., 2020). In our study, round-, sharp-, and flat-crested eskers (see Perkins et al., 2016) are present. They constitute either single- or multiple-crested forms, sporadically forming dendritic networks of ridges (e.g. Fig. 9). The eskers in the study area are relatively short, rarely exceeding lengths of 10 km in comparison to eskers described from the bed of the Laurentide Ice Sheet (Storrar et al., 2014b). They are especially abundant in the northern part of the study area, related to the Pomeranian Phase (Fig. 2), but occur less frequently near the LGM margin.
4.7 Tunnel valleys
Tunnel valleys are formed subglacially due to meltwater erosion either as a result of outburst floods or by a gradual or steady-state mechanism (Ó Cofaigh, 1996; Livingstone and Clark, 2016). The subglacial water flow is driven by gradients in hydraulic potential (function of the bed and ice elevation) (Shreve, 1972), resulting in orientations typically parallel to the glacier flow (Kehew et al., 2012). Tunnel valleys are often associated with eskers, terminate near former ice margins, and have undulating long profiles (Kehew et al., 2012). We identified 456 tunnel valleys in the study area (Fig. 10). The main tunnel valleys have a quasi-regular spacing of about 5 and 10 km across the margins of the main glaciation phases (Figs. 1 and 2), with most of them occurring across the Poznań and Pomeranian margins. They often exceed 20 km in length, which is high (cf. Ottesen et al., 2020). However, their typical width below 2 km is conformant with counterparts of the Scandinavian Ice Sheet (cf. Jørgensen and Sandersen, 2006).
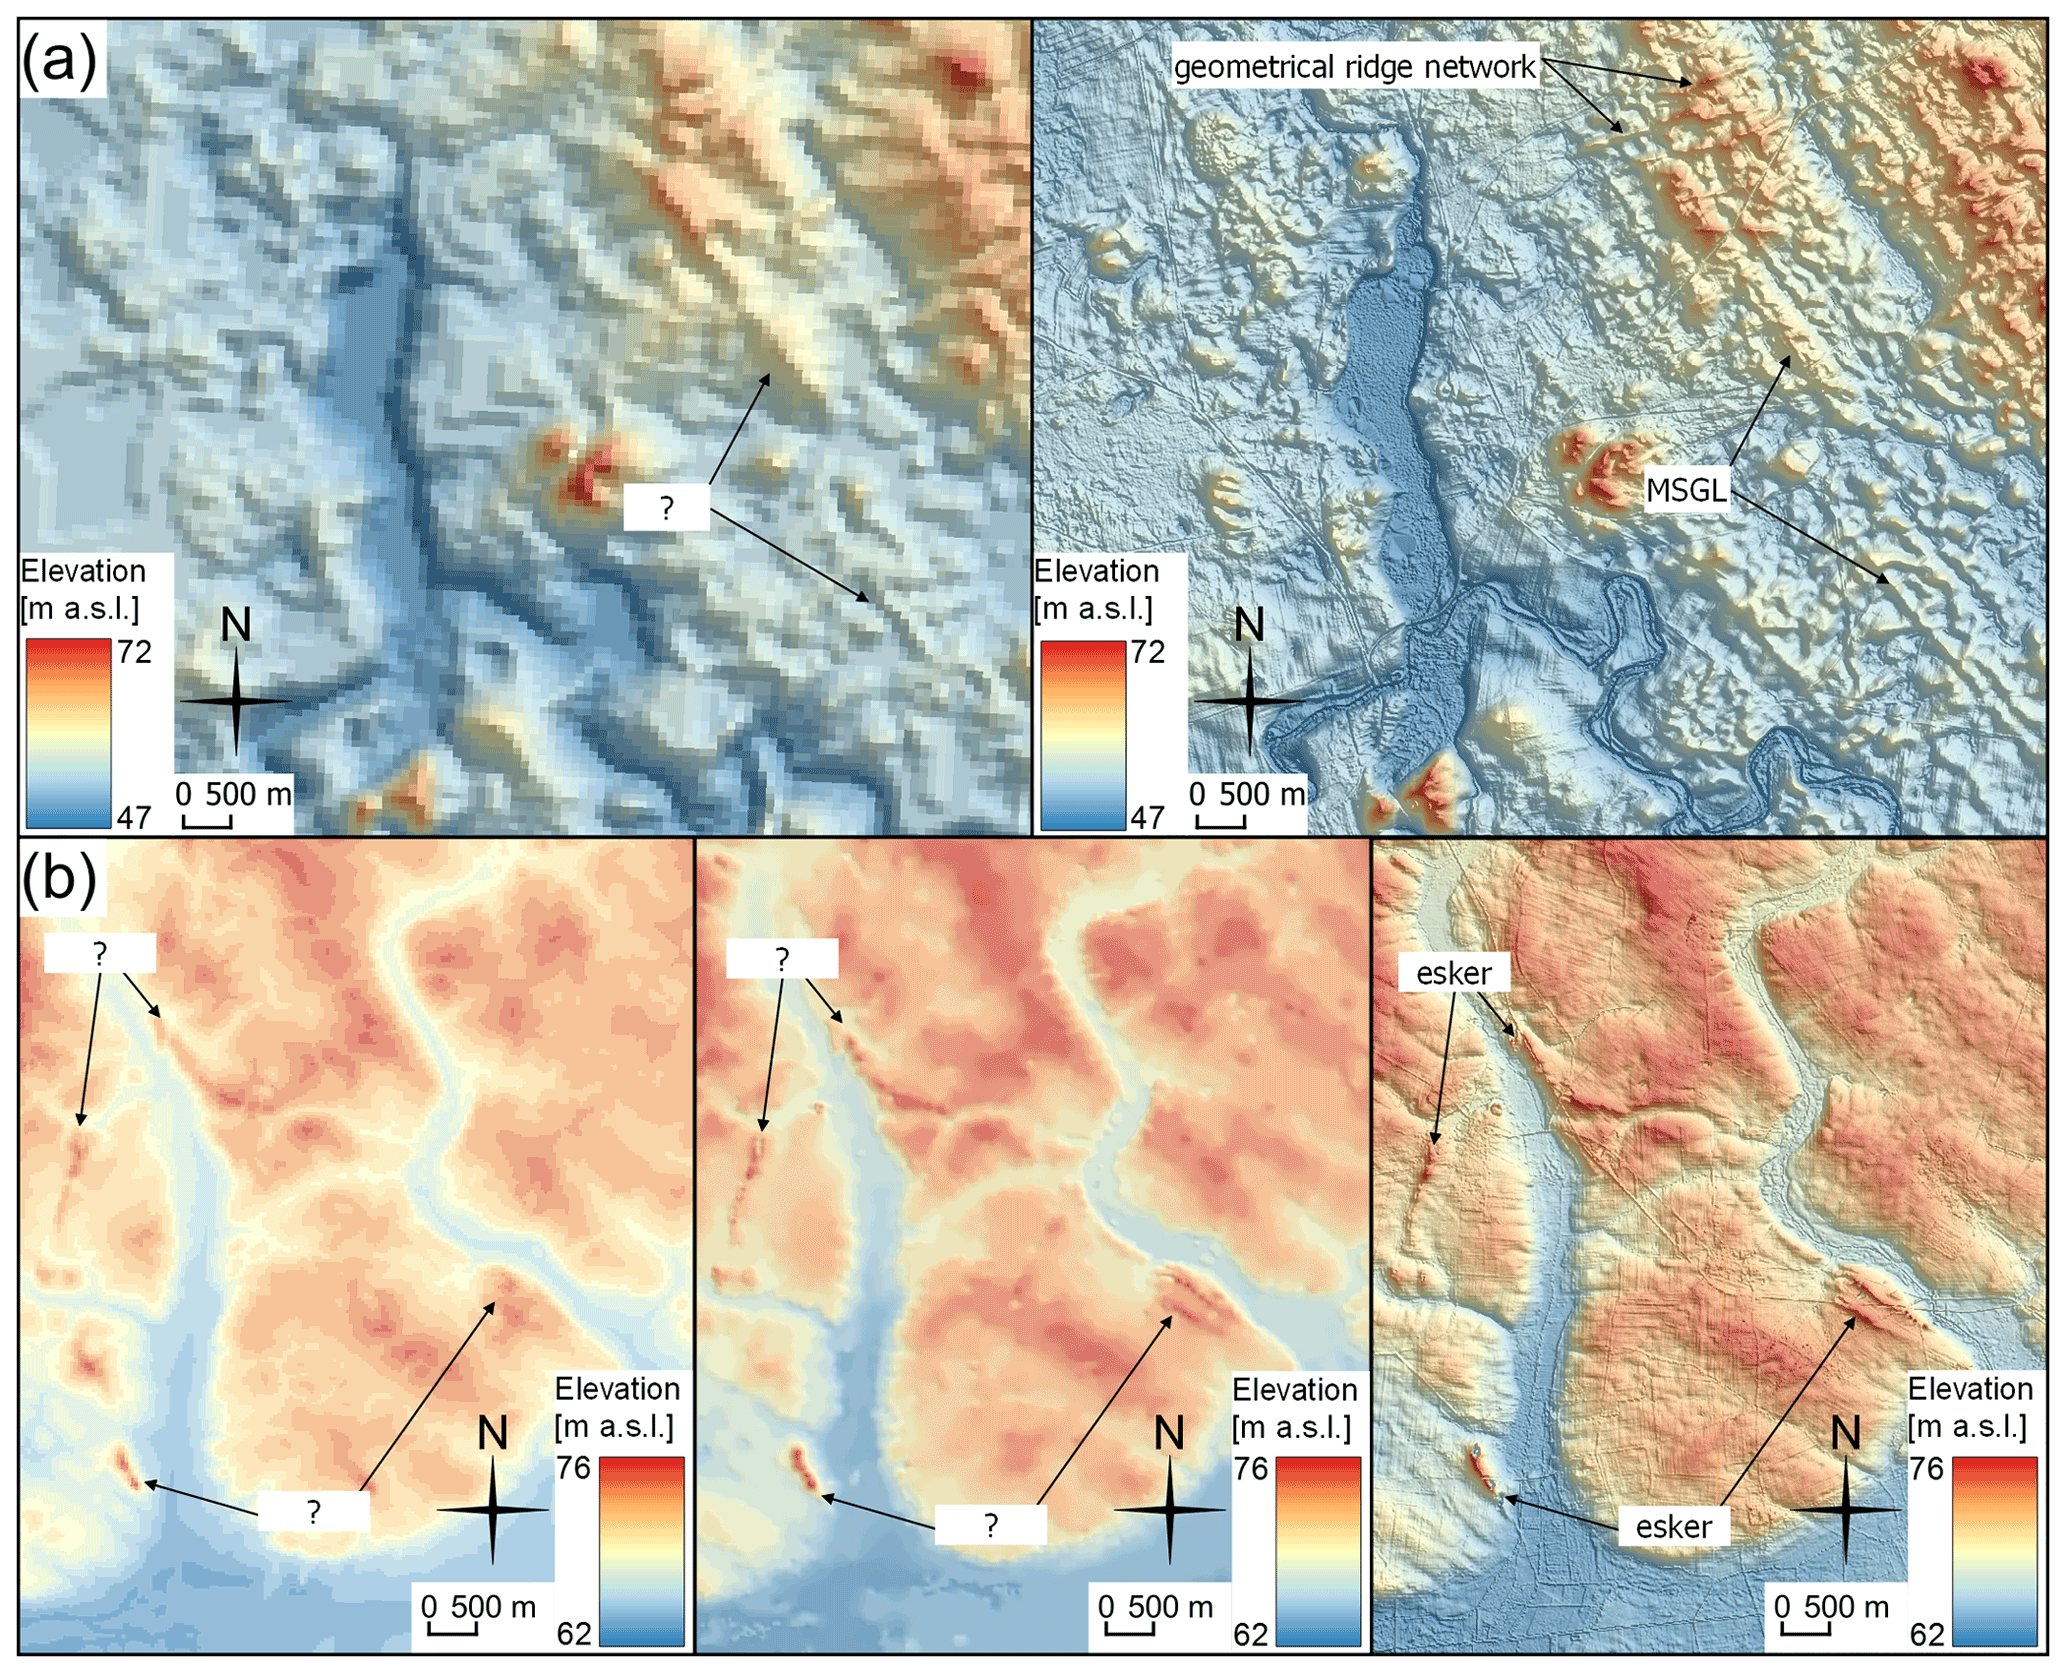
Figure 12(a) Examples of delicate MSGLs and geometric ridge networks using digital terrain elevation data 2 (DTED2) 30 m (left) and lidar-based 0.4 m DEM. (b) Examples of eskers near the LGM margin using DTED2 30 m (left), 1:10 000 contour-derived 5 m DEM (middle) and lidar-based 0.4 m DEM (right). Notice how the higher-resolution model improves landform identification and interpretation.
As noted by Spagnolo et al. (2014), increasing the scale of the DEM enabled more accurate recognition of low relief and fragmented forms. It also improved the identification of the bounding break of slopes of streamlined bedforms, enabling more accurate geomorphological parametrisation (Clark et al., 2009). As shown by Napieralski and Nalepa (2010), decreasing the grid cell size from 10 to 1 m does not improve the identification of drumlins. However, it does improve the identification and geomorphological interpretation of smaller landforms, such as geometrical ridge networks, small eskers, minor moraines, and narrow MSGLs (Figs. 1 and 12). As the resolution of the DEM model applied in this study (grid cell size of 0.4 m) far exceeds the dimensions of the indicated forms, no additional uncertainty due to model quality is introduced (cf. Hättestrand and Clark, 2006). The uncertainty in the resultant data lies in the degradation of the forms and misinterpretation during the mapping process. To minimise misinterpretations, we only added a feature to the final dataset if it was indicated by three independent operators.
Subglacial forms in some parts of the study area are degraded by large-scale human activity (forestry, farming, urbanisation; cf. Przybylski, 2008; Spagnolo et al., 2016), which obscures the glacial geomorphological record (Fig. 11a). The scale difference between the degrading effect and the original form is the main factor determining the degradation potential.
Smaller streamlined bedforms, such as some MSGLs with expected widths and spacing below 100 m, reach the scale of anthropogenic terrain modifications, potentially leading to single cases of misinterpretation. For example, field verification showed that some landforms initially interpreted as MSGLs were in fact old forestry roads (Fig. 11b). Many landforms are partly or fully covered by aeolian sediments (dunes, Fig. 5a) that hampered landform interpretation. The continuity of many of the mapped bedforms in our dataset is broken by water erosion (Fig. 5b). In particular, two prominent E–W-oriented spillways cross inferred paths of streamlined bedform fields (Figs. 1 and 6). The classification of ridges along large hummocky areas was also problematic as delicate landforms have been partly buried (Fig. 2; cf. Hättestrand and Clark, 2006).
Since the interpretation of postglacially degraded forms is challenging, they are often excluded from analyses (e.g. Spagnolo et al., 2014). In our dataset, the original shape of the forms was approximated and extrapolated where possible based on a comparison between terrain profiles and profiles expected for a particular form. Taking into consideration the general level of degradation, such an approach increases the number of complete objects in the resultant dataset.
The dataset can be accessed at https://doi.org/10.5281/zenodo.4570570 (Szuman et al., 2021a). The dataset can be visualised and manipulated in any geographic information system software package capable of handling common spatial vector data formats.
Compared to previous mapping efforts based on low-resolution data (30–100 m GSD), we used a 0.4 m lidar DEM that allowed for much more detailed mapping. This has resulted in the identification of completely new sets of landforms. We have mapped 5461 glacial landforms or landform parts in the southern sector of the last Scandinavian Ice Sheet. Despite some degradation of landforms, the study area represents one of the few regions in onshore Europe with well-preserved assemblages of MSGLs (Spagnolo et al., 2016). These data constitute a valuable source for reconstructing ice dynamics and constraining modelling of the southern sector of the last Scandinavian Ice Sheet, which drained the large Baltic Ice Stream Complex and was rich in terrestrially terminating ice streams (see Szuman et al., 2021b). In addition, the southernmost sector of the Scandinavian Ice Sheet responded sensitively to climate changes (Kozarski, 1962; Patton et al., 2016a; cf. Stroeven et al., 2016) and therefore provides an analogue for modelling the future response of the Greenland and Antarctic ice sheets. The produced dataset is useful for researchers working on ice stream dynamics, the response of ice to climatic changes, and subglacial landform formation. These data allow comparison between subglacial landforms between localities, including both formerly glaciated and modern glaciated areas occupied by ice streams.
IS, MWE, and LK conceived the project. IS led the project and wrote the initial version of the manuscript, which was subsequently improved by the contribution of all co-authors. IS, JZK, and MWE mapped the landforms. All co-authors contributed to the interpretation of problematic areas.
The authors declare that they have no conflict of interest.
Publisher's note: Copernicus Publications remains neutral with regard to jurisdictional claims in published maps and institutional affiliations.
This research has been supported by the Polish National Science Centre (NCN) (grant no. 2015/17/D/ST10/01975), and Chris Clark and Stephen Livingstone were supported by the European Research Council, H2020 (PalGlac (grant no. 787263)).
This paper was edited by Alessio Rovere and reviewed by Clare Boston and one anonymous referee.
Alley, R. B., Cuffey, K. M., and Zoet, L. K.: Glacial erosion: status and outlook, Ann. Glaciol., 60, 1–13, https://doi.org/10.1017/aog.2019.38, 2019.
Assmann, P. and Dammer, B.: Geologische Karte von Preussen und benachbarten Bundesstaaten, Blatt Gross Gay, 1:25 000, Königliche Preussische Geologische Landesanstalt, Berlin, 1916.
Bamber, J. L. and Dawson, G. J.: Complex evolving patterns of mass loss from Antarctica's largest glacier, Nat. Geosci., 13, 127–131, https://doi.org/10.1038/s41561-019-0527-z, 2020.
Bamber, J. L., Vaughan, D. G., and Joughin, I.: Widespread Complex Flow in the Interior of the Antarctic Ice Sheet, Science, 287, 1248, https://doi.org/10.1126/science.287.5456.1248, 2000.
Barr, I. D. and Lovell, H.: A review of topographic controls on moraine distribution, Geomorphology, 226, 44–64, https://doi.org/10.1016/j.geomorph.2014.07.030, 2014.
Bartkowski, T.: Próba kartograficznego ujęcia geomorfologii okolic Buka, Szamotułi Skoków, Prace Komisji Geograficzno–Geologicznej, 3, 1–50, 1962 (in Polish).
Bartkowski, T.: Deglacjacja arealna – zasadniczy typdeglacjacji na obszarach niżowych, Prace Komisji Geograficzno-Geologicznej, 70, 338–347, 1963 (in Polish).
Bartkowski, T.: O formach rozcięcia marginalnego i niektorych formach strefy marginalnej na Nizinie Wielkopolskiej (cz. II), Badania Fizjograficzne nad Polską Zachodnią, 13, 7–76, 1964 (in Polish).
Bartkowski, T.: O formach strefy marginalnej na Nizinie Wielkopolskiej, Prace Komisji Geograficzno-Geologicznej, 7, 1–260, 1967 (in Polish).
Bartkowski, T.: Kemy na obszarze Niziny Wielkopolskiej a deglacjacja, Badania Fizjograficzne nad Polską Zachodnią, 21, 7–77, 1968 (in Polish).
Bartkowski, T.: Deglacjacja strefowa deglacjacją normalną na obszarach niżowych, na wybranych przykładach z Polski Zachodniej, Badania Fizjograficzne nad Polską Zachodnią, 23A, 7–34, 1969 (in Polish).
Bartkowski, T.: Strefa marginalna stadiału pomorskiego w aspekcie deglacjacji strefowej (na wybranych przykładach z Pojezierzy Drawskiego i Miastkowskiego na Pomorzu), Badania Fizjograficzne nad Polską Zachodnią, 26A, 7–60, 1972 (in Polish).
Benn, D. I. and Evans, D. J. A.: Glaciers and glaciation, Hodder Education, London, 2010.
Bennett, M. R., Hambrey, M. J., Huddart, D., and Ghienne, J. F.: The formation of a geometrical ridge network by the surge-type glacier Kongsvegen, Svalbard, J. Quaternary Sci., 11, 437–449, https://doi.org/10.1002/(SICI)1099-1417(199611/12)11:6<437::AID-JQS269>3.0.CO;2-J, 1996.
Berendt, G. and Keilhack, K.: Endmoränen in der Provinz Posen, Jb. D. Kön. Preuss. Geol. Landesanst., 13, 235–237, 1894 (in German).
Bluemle, J. P. and Clayton, L. E. E.: Large-scale glacial thrusting and related processes in North Dakota, Boreas, 13, 279–299, https://doi.org/10.1111/j.1502-3885.1984.tb01124.x, 1984.
Boulton, G. S., Dongelmans, P., Punkari, M., and Broadgate, M.: Palaeoglaciology of an ice sheet through a glacial cycle:: the European ice sheet through the Weichselian, Quaternary Sci. Rev., 20, 591–625, https://doi.org/10.1016/S0277-3791(00)00160-8, 2001.
Boulton, G. S., Dongelmans, P., Punkari, M., and Broadgate, M.: Evidence of European ice sheet fluctuation during the last glacial cycle, in: Developments in Quaternary Sciences, edited by: Ehlers, J. and Gibbard, P. L., Elsevier, Amsterdam, the Netherlands, 441–460, 2004.
Chandler, B. M. P., Lovell, H., Boston, C. M., Lukas, S., Barr, I. D., Benediktsson, Í. Ö., Benn, D. I., Clark, C. D., Darvill, C. M., Evans, D. J. A., Ewertowski, M. W., Loibl, D., Margold, M., Otto, J.-C., Roberts, D. H., Stokes, C. R., Storrar, R. D., and Stroeven, A. P.: Glacial geomorphological mapping: A review of approaches and frameworks for best practice, Earth-Sci. Rev., 185, 806–846, https://doi.org/10.1016/j.earscirev.2018.07.015, 2018.
Clark, C. D.: Mega-scale glacial lineations and cross-cutting ice-flow landforms, Earth Surf. Proc. Land., 18, 1–29, https://doi.org/10.1002/esp.3290180102, 1993.
Clark, C. D.: Reconstructing the evolutionary dynamics of former ice sheets using multi-temporal evidence, remote sensing and GIS, Quaternary Sci. Rev., 16, 1067–1092, https://doi.org/10.1016/S0277-3791(97)00037-1, 1997.
Clark, C. D., Spagnolo, M., Hughs, A. L. C., Greenwood, S. L., Stokes, C. R., Dunlop, P., and Ng, F.: A re-examination of drumlin morphology; width, length, height, elongation, and asymmetry, INQUA VII International Drumlin Symposium, Westport, Ireland, 23–26 April 2009, 2009.
Dunlop, P. and Clark, C. D.: The morphological characteristics of ribbed moraine, Quaternary Sci. Rev., 25, 1668–1691, https://doi.org/10.1016/j.quascirev.2006.01.002, 2006.
Ely, J. C., Clark, C. D., Spagnolo, M., Stokes, C. R., Greenwood, S. L., Hughes, A. L. C., Dunlop, P., and Hess, D.: Do subglacial bedforms comprise a size and shape continuum?, Geomorphology, 257, 108–119, https://doi.org/10.1016/j.geomorph.2016.01.001, 2016.
Ely, J. C., Clark, C. D., Hindmarsh, R. C. A., Hughes, A. L. C., Greenwood, S. L., Bradley, S. L., Gasson, E., Gregoire, L., Gandy, N., Stokes, C. R., and Small, D.: Recent progress on combining geomorphological and geochronological data with ice sheet modelling, demonstrated using the last British–Irish Ice Sheet, J. Quaternary Sci., 36, 946–960, https://doi.org/10.1002/jqs.3098, 2019a.
Ely, J. C., Clark, C. D., Small, D., and Hindmarsh, R. C. A.: ATAT 1.1, the Automated Timing Accordance Tool for comparing ice-sheet model output with geochronological data, Geosci. Model Dev., 12, 933–953, https://doi.org/10.5194/gmd-12-933-2019, 2019b.
Evans, D. J. A. and Rea, B. R.: Geomorphology and sedimentology of surging glaciers: a land-systems approach, Ann. Glaciol., 28, 75–82, https://doi.org/10.3189/172756499781821823, 1999.
Evans, D. J. A., Clark, C. D., and Rea, B. R.: Landform and sediment imprints of fast glacier flow in the southwest Laurentide Ice Sheet, J. Quaternary Sci., 23, 249–272, https://doi.org/10.1002/jqs.1141, 2008.
Evans, D. J. A., Young, N. J. P., and Ó Cofaigh, C.: Glacial geomorphology of terrestrial-terminating fast flow lobes/ice stream margins in the southwest Laurentide Ice Sheet, Geomorphology, 204, 86–113, https://doi.org/10.1016/j.geomorph.2013.07.031, 2014.
Evans, D. J. A., Storrar, R. D., and Rea, B. R.: Crevasse-squeeze ridge corridors: Diagnostic features of late-stage palaeo-ice stream activity, Geomorphology, 258, 40–50, https://doi.org/10.1016/j.geomorph.2016.01.017, 2016.
Ewertowski, M. and Rzeszewski, M.: Using DEM to recognize possible minor stays of Vistulian (Weichselian) ice–sheet margin in the Wielkopolska Lowland, Quaestiones Geographicae, 25A, 7–21, 2006.
Galon, R.: Morphology of the Noteć–Warta (or Toruń–Everswalde) ice marginal streamway, Wydawnictwa Geologiczne, Warsaw, 1961.
Gardner, A. S., Moholdt, G., Scambos, T., Fahnstock, M., Ligtenberg, S., van den Broeke, M., and Nilsson, J.: Increased West Antarctic and unchanged East Antarctic ice discharge over the last 7 years, The Cryosphere, 12, 521–547, https://doi.org/10.5194/tc-12-521-2018, 2018.
Glasser, N. F., Hambrey, M. J., Crawford, K. R., Bennett, M. R., and Huddart, D.: The structural glaciology of Kongsvegen, Svalbard, and its role in landform genesis, J. Glaciol., 44, 136–148, https://doi.org/10.3189/S0022143000002422, 1998.
Hättestrand, C. and Clark, C. D.: The glacial geomorphology of Kola Peninsula and adjacent areas in the Murmansk Region, Russia, J. Maps, 2, 30–42, https://doi.org/10.4113/jom.2006.41, 2006.
Hebrand, M. and Åmark, M.: Esker formation and glacier dynamics in eastern Skane and adjacent areas, southern Sweden, Boreas, 18, 67–81, https://doi.org/10.1111/j.1502-3885.1989.tb00372.x, 1989.
Hermanowski, P., Piotrowski, J. A., and Szuman, I.: An erosional origin for drumlins of NW Poland, Earth Surf. Proc. Land., 44, 2030–2050, https://doi.org/10.1002/esp.4630, 2019.
Houmark-Nielsen, M.: Extent, age and dynamics of Marine Isotope Stage 3 glaciations in the southwestern Baltic Basin, Boreas, 39, 343–359, https://doi.org/10.1111/j.1502-3885.2009.00136.x, 2010.
Hug, C., Krzystek, P., and Fuchs, W.: Advanced LiDAR data orocessing with LasTools, ISPRS Congress, Istanbul, 2004,.
Hughes, A. L. C., Gyllencreutz, R., Lohne, Ø. S., Mangerud, J., and Svendsen, J. I.: The last Eurasian ice sheets – a chronological database and time-slice reconstruction, DATED-1, Boreas, 45, 1–45, https://doi.org/10.1111/bor.12142, 2016.
Hughes, T.: Modeling ice sheets from the bottom up, Quaternary Sci. Rev., 28, 1831–1849, https://doi.org/10.1016/j.quascirev.2009.06.004, 2009.
Isenburg, M.: LASzip: lossless compression of Lidar data, Photogramm. Eng. Rem. S., 79, 209–217, https://doi.org/10.14358/PERS.79.2.209, 2013.
Jamieson, S. S. R., Stokes, C. R., Livingstone, S. J., Vieli, A., Ó Cofaigh, C., Hillenbrand, C.-D., and Spagnolo, M.: Subglacial processes on an Antarctic ice stream bed. 2: Can modelled ice dynamics explain the morphology of mega-scale glacial lineations?, J. Glaciol., 62, 285–298, https://doi.org/10.1017/jog.2016.19, 2016.
Jørgensen, F. and Sandersen, P. B. E.: Buried and open tunnel valleys in Denmark – erosion beneath multiple ice sheets, Quaternary Sci. Rev., 25, 1339–1363, https://doi.org/10.1016/j.quascirev.2005.11.006, 2006.
Joughin, I. and Tulaczyk, S.: Positive Mass Balance of the Ross Ice Streams, West Antarctica, Science, 295, 476, https://doi.org/10.1126/science.1066875, 2002.
Kalm, V.: Ice-flow pattern and extent of the last Scandinavian Ice Sheet southeast of the Baltic Sea, Quaternary Sci. Rev., 44, 51–59, https://doi.org/10.1016/j.quascirev.2010.01.019, 2012.
Karczewski, A.: Morfologia, struktura i tekstura moreny dennej na obszarze Polski zachodniej, Prace Komisji Geograficzno-Geologicznej, 4, 1–111, 1963 (in Polish).
Karczewski, A.: Zmienność litologiczna i strukturalna kemow Pomorza Zachodniego a zagadnienie ich klasyfikacji, Prace Komisji Geograficzno-Geologicznej, 11, 1–57, 1971 (in Polish).
Karczewski, A.: Morphometric features of drumlins in western Pomerania, Quaestiones Geographicae, 3, 35–42, 1976.
Karczewski, A., Kozarski, S., and Rotnicki, K.: Przeglądowa Mapa Geomorfologiczna Polski, arkusz Poznań, 1:500 000, Instytut Geografii i Przestrzennego Zagospodarowania PAN, Kraków, 1980 (in Polish).
Kehew, A. E., Piotrowski, J. A., and Jørgensen, F.: Tunnel valleys: Concepts and controversies — A review, Earth-Sci. Rev., 113, 33–58, https://doi.org/10.1016/j.earscirev.2012.02.002, 2012.
Keilhack, K.: Abhandlungen der Königlich Preussischen Geologischen Landesanstalt: neue Folge 1897 H. 26, Im Vertrieb der Simon Schropp'schen Hof-Landkartenhandlung, Berlin, 1897 (in German).
King, E. C., Hindmarsh, R. C. A., and Stokes, C. R.: Formation of mega-scale glacial lineations observed beneath a West Antarctic ice stream, Nat. Geosci., 2, 585, https://doi.org/10.1038/ngeo581, 2009.
Kjær, K. H., Houmark-Nielsen, M., and Richardt, N.: Ice-flow patterns and dispersal of erratics at the southwestern margin of the last Scandinavian Ice Sheet: signature of palaeo-ice streams, Boreas, 32, 130–148, https://doi.org/10.1111/j.1502-3885.2003.tb01434.x, 2003.
Kleman, J. and Borgström, I.: Reconstruction of palaeo-ice sheets: the use of geomorphological data, Earth Surf. Proc. Land., 21, 893–909, https://doi.org/10.1002/(sici)1096-9837(199610)21:10<893::Aid-esp620>3.0.Co;2-u, 1996.
Kleman, J., Hättestrand, C., Borgström, I., and Stroeven, A.: Fennoscandian palaeoglaciology reconstructed using a glacial geological inversion model, J. Glaciol., 43, 283–299, https://doi.org/10.3189/S0022143000003233, 1997.
Kleman, J., Stroeven, A. P., and Lundqvist, J.: Patterns of Quaternary ice sheet erosion and deposition in Fennoscandia and a theoretical framework for explanation, Geomorphology, 97, 73–90, https://doi.org/10.1016/j.geomorph.2007.02.049, 2008.
Kleman, J., Jansson, K., De Angelis, H., Stroeven, A. P., Hättestrand, C., Alm, G., and Glasser, N.: North American Ice Sheet build-up during the last glacial cycle, 115–21 kyr, Quaternary Sci. Rev., 29, 2036–2051, https://doi.org/10.1016/j.quascirev.2010.04.021, 2010.
Korn, J.: Die Mittel-Posensche Endmorane und die damit verbundenen Oser, Jb. d. Kgl. Preuss. Geol. Landesanst., 33, 478–518, 1912 (in German).
Kozarski, S.: O genezie chodzieskiej moreny czołowej, Badania Fizjograficzne nad Polską Zachodnią, 5, 45–72, 1959 (in Polish).
Kozarski, S.: Recesja ostatniego la̧dolodu z północnej czȩści Wysoczyzny Gnieźnieńskiej a kształtowanie siȩ Pradoliny Noteci–Warty, Państwowe Wydawnictwo Naukowe, Poznań, 154 pp., 1962 (in Polish).
Kozarski, S.: Lithologie und Genese der Endmoränen im Gebiet der skandinavischen Vereisungen, Schriftenrheie für Geologische Wissenschaften, 9, 179–200, 1978 (in German).
Kozarski, S.: Deglacjacja polnocno-zachodniej Polski: warunki srodowiska i transformacja geosystemu [ok. 20 KA–10 KA BP], Dokumentacja Geograficzna, 1, 1–82, 1995 (in Polish).
Krygowski, B.: Przeglądowa mapa geologiczna Polski, arkusz C 2, 1:300 000, Państwowy Instytut Geologiczny, Poznań, 1947 (in Polish).
Krygowski, B.: Mapa Geomorfologiczna Niziny Wielkopolsko-Kujawskiej, Adam Mickiewicz University, Poznań, 1963 (in Polish).
Liedtke, H.: Die nordischen Vereisungen in Mitteleuropa, Zentralausschuß für Dt. Landeskunde, Trier 1981 (in German).
Livingstone, S. J. and Clark, C. D.: Morphological properties of tunnel valleys of the southern sector of the Laurentide Ice Sheet and implications for their formation, Earth Surf. Dynam., 4, 567–589, https://doi.org/10.5194/esurf-4-567-2016, 2016.
Livingstone, S. J., Lewington, E. L. M., Clark, C. D., Storrar, R. D., Sole, A. J., McMartin, I., Dewald, N., and Ng, F.: A quasi-annual record of time-transgressive esker formation: implications for ice-sheet reconstruction and subglacial hydrology, The Cryosphere, 14, 1989–2004, https://doi.org/10.5194/tc-14-1989-2020, 2020.
Lukas, S.: Morphostratigraphic principles in glacier reconstruction – a perspective from the British Younger Dryas, Prog. Phys. Geog., 30, 719–736, https://doi.org/10.1177/0309133306071955, 2006.
Marks, L.: Timing of the Late Vistulian (Weichselian) glacial phases in Poland, Quaternary Sci. Rev., 44, 81–88, https://doi.org/10.1016/j.quascirev.2010.08.008, 2012.
MacAyeal, D. R.: Binge/purge oscillations of the Laurentide Ice Sheet as a cause of the North Atlantic's Heinrich events, Paleoceanography, 8, 775–784, https://doi.org/10.1029/93PA02200, 1993.
Moran, S. R., Clayton, L., Hooke, R. L., Fenton, M. M., and Andriashek, L. D.: Glacier-Bed Landforms of The Prairie Region of North America, J. Glaciol., 25, 457–476, https://doi.org/10.3189/S0022143000015306, 1980.
Napieralski, J. and Nalepa, N.: The application of control charts to determine the effect of grid cell size on landform morphometry, Comput. Geosci., 36, 222–230, https://doi.org/10.1016/j.cageo.2009.06.003, 2010.
Napieralski, J., Li, Y., and Harbor, J.: Comparing predicted and observed spatial boundaries of geologic phenomena: Automated Proximity and Conformity Analysis applied to ice sheet reconstructions, Comput. Geosci., 32, 124–134, https://doi.org/10.1016/j.cageo.2005.05.011, 2006.
Napieralski, J., Harbor, J., and Li, Y.: Glacial geomorphology and geographic information systems, Earth-Sci. Rev., 85, 1–22, https://doi.org/10.1016/j.earscirev.2007.06.003, 2007.
Ottesen, D., Stewart, M., Brönner, M., and Batchelor, C. L.: Tunnel valleys of the central and northern North Sea (56∘ N to 62∘ N): Distribution and characteristics, Mar. Geol., 425, 106199, https://doi.org/10.1016/j.margeo.2020.106199, 2020.
Ó Cofaigh, C.: Tunnel valley genesis, Prog. Phys. Geog., 20, 1–19, https://doi.org/10.1177/030913339602000101, 1996.
Ó Cofaigh, C., Dowdeswell, J. A., Evans, J., and Larter, R. D.: Geological constraints on Antarctic palaeo-ice-stream retreat, Earth Surf. Proc. Land., 33, 513–525, https://doi.org/10.1002/esp.1669, 2008.
Patton, H., Hubbard, A., Andreassen, K., Winsborrow, M., and Stroeven, A. P.: The build-up, configuration, and dynamical sensitivity of the Eurasian ice-sheet complex to Late Weichselian climatic and oceanic forcing, Quaternary Sci. Rev., 153, 97–121, https://doi.org/10.1016/j.quascirev.2016.10.009, 2016a.
Patton, H., Swift, D. A., Clark, C. D., Livingstone, S. J., and Cook, S. J.: Distribution and characteristics of overdeepenings beneath the Greenland and Antarctic ice sheets: Implications for overdeepening origin and evolution, Quaternary Sci. Rev., 148, 128–145, https://doi.org/10.1016/j.quascirev.2016.07.012, 2016b.
Patton, H., Hubbard, A., Andreassen, K., Auriac, A., Whitehouse, P. L., Stroeven, A. P., Shackleton, C., Winsborrow, M., Heyman, J., and Hall, A. M.: Deglaciation of the Eurasian ice sheet complex, Quaternary Sci. Rev., 169, 148–172, https://doi.org/10.1016/j.quascirev.2017.05.019, 2017.
PDAL Contributors: PDAL Point Data Abstraction Library, https://doi.org/10.5281/zenodo.2556738, 2018.
Perkins, A. J., Brennand, T. A., and Burke, M. J.: Towards a morphogenetic classification of eskers: Implications for modelling ice sheet hydrology, Quaternary Sci. Rev., 134, 19–38, https://doi.org/10.1016/j.quascirev.2015.12.015, 2016.
Przybylski, B.: Geomorphic traces of a Weichselian ice stream in the Wielkopolska Lowland, western Poland, Boreas, 37, 286–296, https://doi.org/10.1111/j.1502-3885.2007.00023.x, 2008.
Punkari, M.: Glacial and glaciofluvial deposits in the interlobate areas of the Scandinavian ice sheet, Quaternary Sci. Rev., 16, 741–753, https://doi.org/10.1016/S0277-3791(97)00020-6, 1997.
Rahmstorf, S.: Ocean circulation and climate during the past 120,000 years, Nature, 419, 207–214, https://doi.org/10.1038/nature01090, 2002.
Rea, B. R. and Evans, D. J. A.: An assessment of surge-induced crevassing and the formation of crevasse squeeze ridges, J. Geophys. Res.-Earth, 116, F04005, https://doi.org/10.1029/2011jf001970, 2011.
Rignot, E., Mouginot, J., Scheuchl, B., van den Broeke, M., van Wessem, M. J., and Morlighem, M.: Four decades of Antarctic Ice Sheet mass balance from 1979–2017, P. Natl. Acad. Sci. USA, 116, 1095, https://doi.org/10.1073/pnas.1812883116, 2019.
Rise, L., Bellec, V. K., Ottesen, D., Bøe, R., and Thorsnes, T.: Hill–hole pairs on the Norwegian continental shelf, Geological Society, London, Memoirs, 46, 203, https://doi.org/10.1144/M46.42, 2016.
Rotnicki, K. and Borówka, R. K.: Osady gornego plenivistulianu w dolinie dolnej Prosny pod Macewem a wiek maksymalnego zasięgu ostatniego zlodowacenia podczas fazy leszczyńskiej, Badania Fizjograficzne nad Polską Zachodnią, 40A, 5–20, 1989 (in Polish).
Rotnicki, K. and Borówka, R. K.: Stratigraphy, palaeogeography and dating of the North Polish Stage, in: Changes of the Polish Coastal Zone, edited by: Rotnicki, K., Adam Mickiewicz University, Poznań, 1994.
Shepard, D.: A two-dimensional interpolation function for irregularly-spaced data, Proceedings of the 1968 23rd ACM national conference, USA, 27–29 August 1968, 517–524, 1968.
Shreve, R. L.: Movement of Water in Glaciers, J. Glaciol., 11, 205–214, https://doi.org/10.3189/S002214300002219X, 1972.
Smith, M. J. and Clark, C. D.: Methods for the visualization of digital elevation models for landform mapping, Earth Surf. Proc. Land., 30, 885–900, https://doi.org/10.1002/esp.1210, 2005.
Spagnolo, M., Clark, C. D., Ely, J. C., Stokes, C. R., Anderson, J. B., Andreassen, K., Graham, A. G. C., and King, E. C.: Size, shape and spatial arrangement of mega-scale glacial lineations from a large and diverse dataset, Earth Surf. Proc. Land., 39, 1432–1448, https://doi.org/10.1002/esp.3532, 2014.
Spagnolo, M., Phillips, E., Piotrowski, J. A., Rea, B. R., Clark, C. D., Stokes, C. R., Carr, S. J., Ely, J. C., Ribolini, A., Wysota, W., and Szuman, I.: Ice stream motion facilitated by a shallow-deforming and accreting bed, Nat. Commun., 7, 10723, https://doi.org/10.1038/ncomms10723, 2016.
Stankowski, W.: Geneza Wału Lwówecko–Rakoniewickiego oraz jego obrzeżenia w świetle badań geomorfologicznych i sedymentologicznych, Polska Akademia Nauk, Poznań, Poland, 8, 1–94, 1968 (in Polish).
Stokes, C. R.: Geomorphology under ice streams: Moving from form to process, Earth Surf. Proc. Land., 43, 85–123, https://doi.org/10.1002/esp.4259, 2018.
Stokes, C. R. and Clark, C. D.: Geomorphological criteria for identifying Pleistocene ice streams, Ann. Glaciol., 28, 67–74, https://doi.org/10.3189/172756499781821625, 1999.
Stokes, C. R. and Clark, C. D.: Palaeo-ice streams, Quaternary Sci. Rev., 20, 1437–1457, https://doi.org/10.1016/S0277-3791(01)00003-8, 2001.
Stokes, C. R. and Tarasov, L.: Ice streaming in the Laurentide ice sheet: a first comparison between data-calibrated numerical model output and geological evidence, Geophys. Res. Lett., 37, L01501, https://doi.org/10.1029/2009GL040990, 2010.
Stokes, C. R., Lian, O. B., Tulaczyk, S., and Clark, C. D.: Superimposition of ribbed moraines on a palaeo-ice-stream bed: implications for ice stream dynamics and shutdown, Earth Surf. Proc. Land., 33, 593–609, https://doi.org/10.1002/esp.1671, 2008.
Stokes, C. R., Spagnolo, M., Clark, C. D., Ó Cofaigh, C., Lian, O. B., and Dunstone, R. B.: Formation of mega-scale glacial lineations on the Dubawnt Lake Ice Stream bed: 1. size, shape and spacing from a large remote sensing dataset, Quaternary Sci. Rev., 77, 190–209, https://doi.org/10.1016/j.quascirev.2013.06.003, 2013.
Stokes, C. R., Tarasov, L., Blomdin, R., Cronin, T. M., Fisher, T. G., Gyllencreutz, R., Hättestrand, C., Heyman, J., Hindmarsh, R. C. A., Hughes, A. L. C., Jakobsson, M., Kirchner, N., Livingstone, S. J., Margold, M., Murton, J. B., Noormets, R., Peltier, W. R., Peteet, D. M., Piper, D. J. W., Preusser, F., Renssen, H., Roberts, D. H., Roche, D. M., Saint-Ange, F., Stroeven, A. P., and Teller, J. T.: On the reconstruction of palaeo-ice sheets: Recent advances and future challenges, Quaternary Sci. Rev., 125, 15–49, https://doi.org/10.1016/j.quascirev.2015.07.016, 2015.
Stokes, C. R., Margold, M., Clark, C. D., and Tarasov, L.: Ice stream activity scaled to ice sheet volume during Laurentide Ice Sheet deglaciation, Nature, 530, 322–326, https://doi.org/10.1038/nature16947, 2016.
Storrar, R. D., Stokes, C. R., and Evans, D. J. A.: Increased channelization of subglacial drainage during deglaciation of the Laurentide Ice Sheet, Geology, 42, 239–242, https://doi.org/10.1130/G35092.1, 2014a.
Storrar, R. D., Stokes, C. R., and Evans, D. J. A.: Morphometry and pattern of a large sample (> 20,000) of Canadian eskers and implications for subglacial drainage beneath ice sheets, Quaternary Sci. Rev., 105, 1–25, https://doi.org/10.1016/j.quascirev.2014.09.013, 2014b.
Stroeven, A. P., Hättestrand, C., Kleman, J., Heyman, J., Fabel, D., Fredin, O., Goodfellow, B. W., Harbor, J. M., Jansen, J. D., Olsen, L., Caffee, M. W., Fink, D., Lundqvist, J., Rosqvist, G. C., Strömberg, B., and Jansson, K. N.: Deglaciation of Fennoscandia, Quaternary Sci. Rev., 147, 91–121, https://doi.org/10.1016/j.quascirev.2015.09.016, 2016.
Szuman, I., Kalita, J. Z., Ewertowski, M., Livingstone, S. J., Clark, C. D. and Kasprzak, L.: LiDAR-based glacial geomorphological dataset, southern sector of Baltic Ice Stream Complex, last Scandinavian Ice Sheet, Poland, Zenodo [data set], https://doi.org/10.5281/zenodo.4570570, 2021a.
Szuman, I., Kalita, J. Z., Ewertowski, M. W., Clark, C. D., and Livingstone, S. J.: Dynamics of the last Scandinavian Ice Sheet's southernmost sector revealed by the pattern of ice streams, Boreas, 50, 764–780, https://doi.org/10.1111/bor.12512, 2021b.
Tylmann, K., Rinterknecht, V. R., Woźniak, P. P., Bourlès, D., Schimmelpfennig, I., Guillou, V., and Team, A.: The Local Last Glacial Maximum of the southern Scandinavian Ice Sheet front: Cosmogenic nuclide dating of erratics in northern Poland, Quaternary Sci. Rev., 219, 36–46, https://doi.org/10.1016/j.quascirev.2019.07.004, 2019.
Vérité, J., Ravier, É., Bourgeois, O., Pochat, S., Lelandais, T., Mourgues, R., Clark, C. D., Bessin, P., Peigné, D., and Atkinson, N.: Formation of ribbed bedforms below shear margins and lobes of palaeo-ice streams, The Cryosphere, 15, 2889–2916, https://doi.org/10.5194/tc-15-2889-2021, 2021.
Warmerdam, F.: The Geospatial Data Abstraction Library, in: Open Source Approaches in Spatial Data Handling, edited by: Hall, G. B. and Leahy, M. G., Springer Berlin Heidelberg, Berlin, Heidelberg, 87–104, 2008.
Woldstedt, P.: Geologisch-morphologische Ubersichtskarte des Norddeutschen Vereisungsgebietes 1:1 500 000, Preuss. Geol. Landesanst., Berlin, 1935 (in German).
Wysota, W., Molewski, P., and Sokołowski, R. J.: Record of the Vistula ice lobe advances in the Late Weichselian glacial sequence in north-central Poland, Quatern. Int., 207, 26–41, https://doi.org/10.1016/j.quaint.2008.12.015, 2009.