the Creative Commons Attribution 4.0 License.
the Creative Commons Attribution 4.0 License.
A 15-year circum-Antarctic iceberg calving dataset derived from continuous satellite observations
Mengzhen Qi
Jiping Liu
Xiao Cheng
Yijing Lin
Qiyang Feng
Qiang Shen
Zhitong Yu
Iceberg calving is the main process that facilitates the dynamic mass loss of ice sheets into the ocean, which accounts for approximately half of the mass loss of the Antarctic ice sheet. Fine-scale calving variability observations can help reveal the calving mechanisms and identify the principal processes that influence how the changing climate affects global sea level through the ice shelf buttressing effect on the Antarctic ice sheet. Iceberg calving from entire ice shelves for short time intervals or from specific ice shelves for long time intervals has been monitored before, but there is still a lack of consistent, long-term, and high-precision records on independent calving events for all of the Antarctic ice shelves. In this study, a 15-year annual iceberg calving product measuring every independent calving event larger than 1 km2 over all of the Antarctic ice shelves that occurred from August 2005 to August 2020 was developed based on 16 years of continuous satellite observations. First, the expansion of the ice shelf frontal coastline was simulated according to ice velocity; following this, the calved areas, which are considered to be the differences between the simulated coastline, were manually delineated, and the actual coastline was derived from the corresponding satellite imagery, based on multisource optical and synthetic aperture radar (SAR) images. The product provides detailed information on each calving event, including the associated year of occurrence, area, size, average thickness, mass, recurrence interval, and measurement uncertainties. A total of 1975 annual calving events larger than 1 km2 were detected on the Antarctic ice shelves from August 2005 to August 2020. The average annual calved area was measured as 3549.1 km2 with an uncertainty value of 14.3 km2, and the average calving rate was measured as 770.3 Gt yr−1 with an uncertainty value of 29.5 Gt yr−1. The number of calving events, calved area, and calved mass fluctuated moderately during the first decade, followed by a dramatic increase from 2015/2016 to 2019/2020. During the dataset period, large ice shelves, such as the Ronne–Filchner and Ross ice shelves, advanced with low calving frequency, whereas small- and medium-sized ice shelves retreated and calved more frequently. Iceberg calving of ice shelves is most prevalent in West Antarctica, followed by the Antarctic Peninsula and Wilkes Land in East Antarctica. The annual iceberg calving event dataset of Antarctic ice shelves provides consistent and precise calving observations with the longest time coverage. The dataset provides multidimensional variables for each independent calving event that can be used to study detailed spatial–temporal variations in Antarctic iceberg calving. The dataset can also be used to study ice sheet mass balance, calving mechanisms, and responses of iceberg calving to climate change. The dataset, entitled “Annual iceberg calving dataset of the Antarctic ice shelves (2005–2020)”, is shared via the National Tibetan Plateau Data Center: https://doi.org/10.11888/Glacio.tpdc.271250 (Qi et al., 2021). In addition, the average annual calving rate of 18.4±6.7 Gt yr−1 for calving events smaller than 1 km2 of the Antarctic ice shelves and the calving rate of 166.7±15.2 Gt yr−1 for the marine-terminating glaciers were estimated.
- Article
(6679 KB) - Full-text XML
- BibTeX
- EndNote
The ice shelves surrounding Antarctica's coastline play an important role in the stability of the Antarctic ice sheet and its mass balance. Iceberg calving is a process whereby the ice from a glacier or ice shelf frontal edge is stripped away and enters the ocean. Iceberg calving accounts for approximately half of the net mass loss of all Antarctic ice shelves (Rignot et al., 2013; Depoorter et al., 2013). Enhanced iceberg calving can indirectly lead to ice shelf instability, which accelerates the outflow of tributary glaciers into the ocean, causing sea level rise (Berthier et al., 2012; Furst et al., 2016; Rignot et al., 2004). In-depth studies of the calving process are essential to accurately predict the impact of future climate change on ice shelves/sheets and sea levels.
Model simulations and remote sensing observations are two major tools used to study iceberg calving. The former focus on simulating the dynamic process of a calving front in response to atmospheric and oceanic forcings and stress within ice sheets. Different models are used to understand the evolution of and changes in ice shelves (Hill et al., 2018; Lovell et al., 2017; Luckman et al., 2015; Miles et al., 2017). The latter focus on the monitoring and quantitative assessment of calved areas using remotely sensed data, which can be assimilated into ice sheet models to further improve the accuracy of model simulations (Massom et al., 2018; Pattyn and Morlighem, 2020).
Research on remotely sensed iceberg calving monitoring can be classified as having three main focuses: (1) observations of specific ice shelves or glaciers with high spatial resolution data, e.g., long-term monitoring of the Pine Island Glacier, Mertz Glacier Tongue, and Amery Ice Shelf (Bindschadler, 2002; Massom et al., 2015; Zhao et al., 2014); (2) observations made of larger regions with lower spatial and temporal resolution data, e.g., calving monitoring along the Antarctic Peninsula and Ross Sea coast (Cook et al., 2005; Cook and Vaughan, 2010; Fountain et al., 2017); and (3) circum-Antarctic calving front observations of specific years based on satellite image mosaics of the Antarctic coastline (Liu and Jezek, 2004; Liu et al., 2015; Scambos et al., 2007; Yu et al., 2019). The first two types of studies achieve the precise monitoring of calving events in specific ice shelves or small areas, whereas the third type quantitatively assesses iceberg calving at the continental scale. Liu et al. (2015) extracted 579 independent calving events for 6 years from the Envisat (Environmental Satellite) Advanced Synthetic Aperture Radar (ASAR) circum-Antarctic mosaic. The authors obtained comprehensive, detailed iceberg calving observations at different scales through image matching and feature tracking, which made it possible to investigate calving patterns and mechanisms. Their work laid the foundation for the subsequent exploration of the physical triggers of small and large calving events (Medrzycka et al., 2016) and revealed the “self-organized critical systems” of glaciers and ice sheets at different calving scales (Åström et al., 2014).
The long-term and high-precision remote sensing observation of circum-Antarctic independent calving events not only describes the spatial and temporal features of iceberg calving but also provides fundamental data for further investigating calving mechanisms and estimating ice shelf mass balance in response to climate change. In this study, we identify annual calving events through the combination of a velocity-based ice shelf front edge simulation and semiautomatic annual iceberg calving extraction. We further acquire the calved-area outline, location, year of occurrence, area, thickness, volume, mass, and recurrence interval of each calving event. Building on this, we develop a circum-Antarctic iceberg calving dataset. The dataset spans from August 2005 to August 2020. Using this product, we analyze the spatial and temporal characteristics of iceberg calving for the last 15 years.
2.1 Satellite imagery
Considering the relatively low calving frequencies measured in August of each year (Liu et al., 2013) and the time limitations of available satellite images, we define the annual calving recurrence interval as running from August of the current year to August of the following year. We know that it is difficult to create such a circum-Antarctic iceberg calving dataset based on a single satellite platform. To continuously monitor Antarctic iceberg calving for 2005 to 2020, multisource remotely sensed data are used in this study. We prioritize using SAR (synthetic aperture radar) images for early August each year given that their quality is minimally affected by polar nights and cloudy days. For periods and areas for which SAR data are not available, optical images for close dates are used instead. Satellite images used in the development of this product include Wide Swath Mode (WSM) images from Envisat ASAR for 2005 to 2011 (downloaded from http://eogrid.esrin.esa.int/browse, last access: 11 September 2021); MODIS (Moderate-resolution Imaging Spectroradiometer) 250 m Calibrated Radiances product images (MODIS Characterization Support Team, 2017) for 2012 to 2014 (downloaded from https://worldview.earthdata.nasa.gov/, last access: 11 September 2021); the synthetic images of Landsat 8 OLI (Operational Land Imager) for bands 4 (630–680 nm), 3 (525–600 nm), and 2 (450–515 nm) for 2013 to 2020 (downloaded from https://www.usgs.gov/, last access: 11 September 2021); and the Extra Wide Swath (EW) mode images of Sentinel-1 SAR for 2015 to 2020 (downloaded from https://www.esa.int/ESA, last access: 11 September 2021). Detailed descriptions of these data are given in Table 1.
2.2 Supplementary datasets
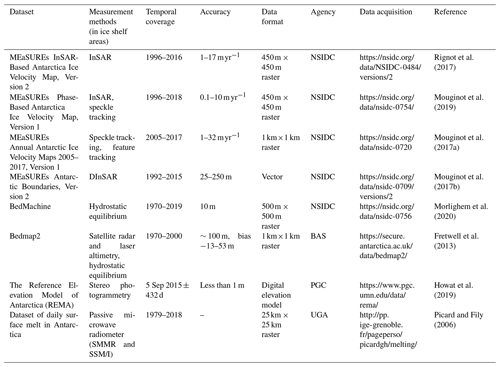
Additional remote sensing data were also used to facilitate product development and analyses. MEaSUREs InSAR-Based Antarctica Ice Velocity Map, Version 2 (where InSAR stands for interferometric synthetic aperture radar Rignot et al., 2011; Mouginot et al., 2012), is used to simulate the expansion of the ice shelf frontal edge and locate calved areas. MEaSUREs Phase-Based Antarctica Ice Velocity Map, Version 1 (Mouginot et al., 2019), and MEaSUREs Annual Antarctic Ice Velocity Maps 2005–2017, Version 1 (Mouginot et al., 2017a), are used for calving mass calculation for marine-terminated glaciers. MEaSUREs Antarctic Boundaries, Version 2 (Rignot et al., 2013), is used for the ice shelf delineation and spatial analysis of the calving distribution. Two ice thickness datasets, Bedmap2 and BedMachine (Morlighem et al., 2020; Fretwell et al., 2013), are used for calving thickness extraction and calving mass calculation for both calving from ice shelves and marine-terminated glaciers. The Reference Elevation Model of Antarctica (REMA; Howat et al., 2019) is used for the uncertainty evaluation of the extracted thickness. The Antarctic daily surface melt dataset (Picard and Fily, 2006) is used to analyze the response of iceberg calving to ice sheet surface melting.
Detailed descriptions of each remote sensing product used are presented in Table 2.
Table 2List of other remote sensing products used in the development of a circum-Antarctic iceberg calving product for 2005–2020. Last access date for all URLs is 11 September 2021.
Abbreviations: NSIDC denotes the National Snow and Ice Data Center, BAS denotes the British Antarctic Survey, PGC denotes the Polar Geospatial Center at the University of Minnesota, and UGA denotes the Université Grenoble Alpes.
3.1 Processes of direct observation of an annual independent calving event
An annual calving event occurs when an independent calved area has an outline that does not overlap or is spatially adjacent to other calving events occurring in the same year (even if it occurs on the same ice shelf), namely the topology requires nonoverlapping and nonadjacent annual calved-area polygons for the specific year. Data generation involves the following three steps: preprocessing the data, extracting iceberg calving, and acquiring attributes (Fig. 1). Each of these steps is discussed in the following sections. Moreover, the consistency of multisource satellite imagery used in monitoring annual iceberg calving has been validated.
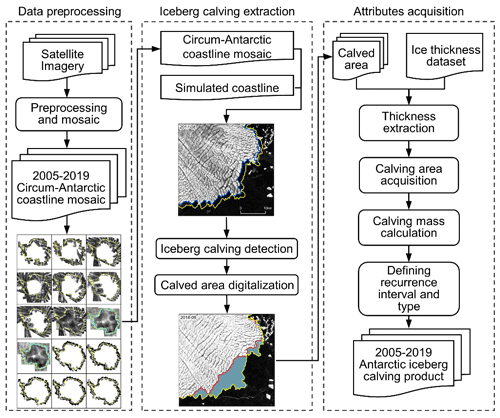
Figure 1Outline of our methodology. Satellite images are preprocessed to obtain the annual mosaic of the Antarctic coastline. Based on the circum-Antarctic coastline mosaic and corresponding simulated coastline, we extracted calved areas. We then acquired attributes such as thickness, area, volume, mass, and recurrence interval to produce an annual iceberg calving product for the Antarctic ice shelves.
3.2 Data preprocessing of the remotely sensed image
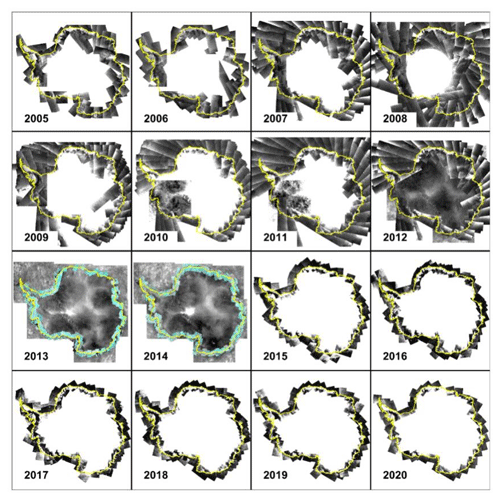
Data preprocessing involves geocoding, geometric correction, and mosaic generation. SAR images for the first 3 d of each month of August are used preferentially to generate the circum-Antarctic coastline mosaic for the periods of 2005–2011 and 2015–2020. For 2012–2014, data vacancies were filled with images of the same sensors from close dates. For the mosaic for 2012, we used MODIS images for September combined with SAR images for April to facilitate detection. For 2013 and 2014, which are without SAR images, we chose both MODIS and Landsat 8 OLI circum-Antarctic coastline mosaics to extract iceberg calving. To reduce errors due to different imaging times, we overlaid the satellite image strictly by time order, namely images taken on a date closer to 1 August should be on the upper layer. The preprocessing results of the remotely sensed data are shown in Fig. 2 and provide good coverage of the Antarctic coastline and the frontal edges of ice shelves.
3.3 Iceberg calving extraction of independent calving events
To create the annual iceberg calving dataset for the Antarctic ice shelves, we simulated the expansion of the ice shelf frontal edge and detected the calved areas based on satellite images. It is worth mentioning again that our iceberg calving extraction only included calving from ice shelves but did not include marine-terminating glaciers, and the boundaries of ice shelves are referenced from MEaSUREs Antarctic Boundaries, Version 2, released by NSIDC. We first manually digitalized the ice shelf frontal line in August 2005, 2010, and 2015 as the input benchmark coastline. The following steps were then iterated for the extraction of each annual calving cycle with the methodology divided into two overarching tasks: velocity-based ice shelf front edge simulation and semiautomatic annual iceberg calving extraction (Qi et al., 2020).
3.3.1 Velocity-based ice shelf front edge simulation
We converted the vertices of the input coastline to obtain the set of coastline feature points for a specific year. Based on the velocity at the position of each coastline point, we calculated the movement of feature points over the duration of the given year. By lining up the moved feature points sequentially, a new coastline was derived, namely the simulated coastline of the next year, as shown using the yellow lines in Fig. 3.
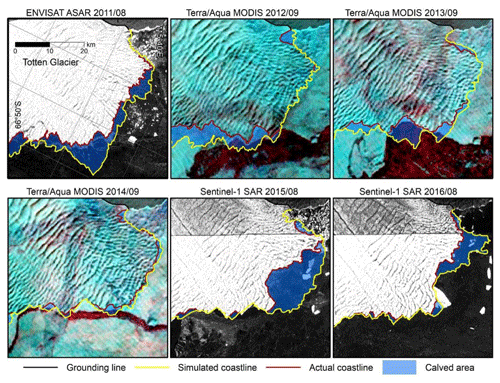
Figure 3Schematic of the calved-area extraction method displaying different sources of satellite imagery used for annual iceberg calving extraction for 2011–2016. Red lines represent the actual coastlines, yellow lines represent the simulated coastlines, and blue areas represent the extracted calved areas.
Additionally, we conducted a controlled experiment on the impact of different ice velocity products while simulating the next-year coastline. Fifty points on the high-flowing Pine Island Glacier were randomly selected as samples. We simulate their 11-year movement using both the average ice velocity map (Rignot et al., 2017) and MEaSUREs Annual Antarctic Ice Velocity Maps for 2005–2017 (Mouginot et al., 2017a). The results show that, over the 11 years, the cumulative error between points moved under different ice velocity products by 0.15 to 14.45 km with an average value of 3.96 km and a standard deviation of 4.09 km. We assume that errors introduced by using the average ice velocity map to simulate the ice shelf frontal edge of different years are acceptable.
For the non-calving area, theoretically, the simulated coastline should fit the real coastline shown in a remotely sensed image well; however, due to the geographical bias of images and errors of the ice velocity product, some deviations between the directly obtained simulated coastline and actual coastline may occur. Therefore, before extraction, we first checked and rectified the simulated coastline to ensure that it fits the actual coastline in non-calving areas. After manual correction, the extraction results were found to be of good accuracy.
3.3.2 Iceberg calving extraction
We manually rectified the simulated coastline to ensure that, after rectifying, it fit the real coastline shown in the corresponding satellite images. Then, we obtained the actual coastline for the next year, which is shown using the red line in Fig. 3. We extracted the enclosed area between the simulated coastline and the actual coastline to acquire the calved area (the blue area in Fig. 3). After extracting for one annual calving cycle, we checked topological relations at the continental scale for this year. We ensured that calved-area polygons did not intersect with each other and then obtained vectors for each calved area for the given year.
This iceberg calving extraction method employs a simple process and broad applications. The actual coastline modified from last year's extraction can be used as the input coastline of the next year's extraction; thus, we can provide time-continuous iceberg calving monitoring and effectively avoid repetition and omission errors. Additionally, the semiautomatic operation offers incomparable precision and efficiency, greatly reducing the post-processing workload.
3.4 Attribute acquisition of independent calving events
For individual calving events, attributes include the area, calving scale, average thickness, mass, calving recurrence interval, and uncertainties of relevant parameters. Therefore, the acquisition of calved area and calved mass, uncertainties, and recurrence intervals are discussed in the following sections.
3.4.1 Calved area and calved mass
After acquiring vectors of the calved-area polygons, we calculated their areas under polar projection. These values were then divided into four different scales: small-scale (1–10 km2), medium-scale (10–100 km2), large-scale (100–1000 km2), and extra-large-scale values (>1000 km2). We further obtained the average thickness of each calved area from the Antarctic ice thickness products (Bedmap2 and BedMachine). First, we masked out the ice shelf zone thickness in Bedmap2 and BedMachine. Second, we extracted the average thickness of each calving event from the masked ice thickness through step 1. We then checked the average thickness of all calving events. For missed and abnormal values (results show that they only account for a small proportion of the total), we moved the polygon backward along the ice flow to the calving front where there is thickness data coverage. After that, we re-extracted the average thickness of those calving events to make sure they are given appropriate thickness.
Based on area and thickness, the calving mass (C) was calculated from Eq. (1):
where Ac stands for the calving area and represents the average thickness of the calved area. The standard value of ice density was used for the calculation.
3.4.2 Uncertainty assessment
The uncertainties involved in the calculation of calving mass based on Eq. (1) include errors of calving area measurement, thickness extraction, and ice density. The uncertainty of the calving area is determined by the accuracy of the extraction method. Thickness uncertainty should be theoretically affected by top surface elevation measurements and firn depth correction; in reality, there are also uncertainties in thickness changes with time, according to hydrostatic equilibrium assumptions, and in the offsets in locations during extraction. In this section, we evaluate the main uncertainties encountered during the development of the annual iceberg calving dataset.
Calving area uncertainty
Calving area uncertainty is mainly determined by the spatial location biases of calved-area outlines, which are related to both the original image resolution and the perimeter of the calved area. The equivalent perimeter width extracted by this method based on 75 m resolution images is 0.005 km (Qi et al., 2020); therefore, the uncertainty of the calving area (UA) can be calculated from Eq. (2):
where l represents the perimeter of each calving event (in km).
Thickness uncertainty
The ice shelf thickness dataset used in this product is derived from the hydrostatic equilibrium (Morlighem et al., 2020), which is written as Eq. (3):
where H denotes ice shelf thickness; s is the top surface elevation, namely the height of the snow top; δ is firn depth correction; and is the density of seawater.
Therefore, thickness uncertainty () can be evaluated from Eq. (4):
where and sc represent the average thickness and average surface elevation of the calved area, respectively; is the uncertainty of the calved-area surface elevation; Uδ is the uncertainty of firn depth correction; and and represent the uncertainty of ice and seawater density, respectively.
For the calculations, 917 kg m−3 is used for ρice, 1027 kg m−3 is used for ρw, and their uncertainties and are valued at 5 kg m−3 (Griggs et al., 2011). sc was obtained from REMA with typical elevation errors of less than 1 m (Howat et al., 2019). Firn depth correction and its uncertainty were calculated from the RACMO2/ANT regional climate model with a ratio accounting for 8 % of the uncertainty (Pritchard et al., 2012).
Calving mass uncertainty
The calving mass of our dataset is derived from three components unrelated to and independent of each other. Thus, we used synthetic standard uncertainty to evaluate its accuracy. The mass deviation of a single calving event (Uc) is calculated as shown in Eq. (5), and the mass deviation for the year cycle () can be calculated from Eq. (6):
where C and Ac are the mass and area of individual calving events, respectively; N is the number of years; and n is the total frequency of calving events that occurred in N years.
3.4.3 Recurrence interval
Calving recurrence means that a calving event with the same spatial scale reoccurs at the same calving front (Liu et al., 2015), which is usually thought to be part of the natural cycle of advance and retreat of ice shelves. The recurrence interval of a calving event, a measurement of the natural calving cycle, is defined as the year interval between the two recurrence calving events. To acquire this attribute, we performed the following work. First, we got the perimeter of each calving polygon through the “Calculate Geometry” function in ArcMap. Based on that, we calculated the average perimeter of all calving events at the same scale for 15 years. We defined the buffer radii as half of the average perimeters at different scales rounded upwards to the nearest integer. The specific values used for this dataset are shown in Table 3.
Following this, we used the “Feature to Point” function in ArcMap to get the center points of each individual calving polygon. For an input polygon, the location of the output point will be determined as its center of gravity. We then build buffers for each calving center point based on the radii calculated in the previous steps. For each calving event, we count the number of calving center points with the same scale that falls into its buffer. For buffers that fall into more than two points, the calving recurrence interval is defined as the total number of years (15) divided by the exact number of calving center points falling within. For buffers with only one point, the calving recurrence interval is defined as the greater value of time intervals between these calving events and boundary years (2005 or 2020).
3.5 Consistency validation of multisource satellite imagery
As mentioned above, a single satellite platform cannot accommodate long-time-series observations of circum-Antarctic calving events. Thus, multisource remotely sensed data are used in this study. To check whether the results derived from different sensors are similar, especially for the results derived from optical sensors and SAR, we performed the following verification.
For the year for which we have both SAR and optical images, we extracted circum-Antarctic annual iceberg calving using the same method based on different sources of remotely sensed imagery. We chose to repeat the calving extraction for 2016/2017 through Terra/Aqua MODIS imagery and to compare it to the contemporaneous extraction results for our dataset derived from Sentinel-1 SAR imagery. We define area differences as the calving area obtained from MODIS subtracted from that obtained from SAR, and we define the calving perimeter as the calved-area perimeter obtained from SAR. We then analyze the area differences of the same calving events and calculate error-equivalent perimeter widths by dividing the area differences by the calving perimeter.
3.6 Estimation of the less than 1 km2 calving from the Antarctic ice shelves
3.6.1 Estimation method
Considering the huge workload and relatively small calving area contributing to the total calving area, we estimated the annual calving area and mass of the less than 1 km2 calving of Antarctic ice shelves using the following equations:
where an a value of 0.22 is the ratio of the total area between the 0.1–1 km2 calving and 1–10 km2 calving estimated by Qi et al. (2020); and are the calved area of the less than 1 km2 calving and 1–10 km2 calving, respectively; and and are the calved mass of the less than 1 km2 calving and 1–10 km2 calving, respectively. We retained the preceding three items in the expansion of the tiny calving (with an area less than 1 km2) estimation equation.
3.6.2 Uncertainty assessment
The area uncertainty and the mass uncertainty of the less than 1 km2 calving are calculated as follows:
where Δa of 0.05 is the standard deviation of a estimated by Qi et al. (2020); and and are the calculated uncertainties of 1–10 km2 calving.
3.7 Estimation of the calving from the marine-terminating glaciers
3.7.1 Estimation method
The calving rate of the marine-terminating glaciers is equal to the ice flux along their grounding lines. Ice flux comprises the flux gate width multiplied by ice velocity and ice thickness at the grounding line. The ice velocity and the ice thickness vary considerably from grounding line positions. Therefore, the grounding line is normally discretized to calculate the ice flux of each flux gate. The calving rate Cmarine-terminating of the marine-terminating glaciers is then calculated as follows:
where Hi is the equivalent ice thickness of the flux gate i, Vi is the ice velocity along the ice flow direction, Li is the fluxgate width along the ice flow direction, and ρice is the density of ice (917 kg m−3).
3.7.2 Uncertainty assessment
The calving mass uncertainty of the marine-terminating glaciers is calculated as follows:
where UH and UV stand for the uncertainties of ice thickness and ice velocity, respectively. For the calculations, 100 m is used for UH (Rignot et al., 2008; Rignot, 2011), and 17 m yr−1 is used for UV (Mouginot et al., 2017a); a value of 917 kg m−3 is used for ρice, and 5 kg m−3 is used for its uncertainty (Griggs et al., 2011).
4.1 Consistency of multisource satellite imagery
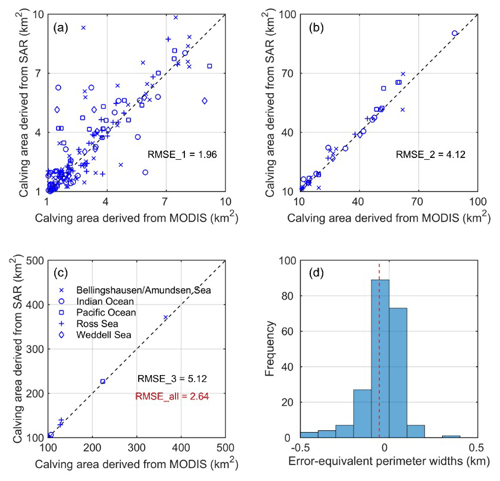
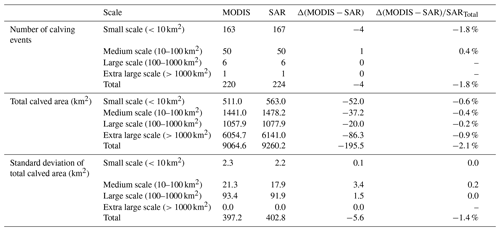
We extracted a total of 220 calving events from MODIS for 2016/2017 covering a total area of 9064.6 km2. As shown in Table 4, both the total number of calving events and the total calved area are slightly lower than values derived from SAR imagery. The numbers of calving events at different scales extracted from the two sources of satellite images are similar. The frequency error mainly originates from small-scale calving, although it accounts for a small percentage of the total area. The calved area derived from MODIS at all four scales is underestimated compared with that from SAR, which might be a result of lower image quality for cloudy areas.
Table 4Frequency and area distribution of different-scale calving events derived from MODIS and SAR for 2016/2017.
The area of individual calving events extracted by MODIS is generally smaller. As the calving scale increases, errors caused by different data sources account for a lower percentage of the total calved area (Fig. 4a, b, c). The error-equivalent perimeter widths generally exhibit a normal distribution with a standard deviation of 0.15 km and a mean value of −0.06 km (Fig. 4d). Based on this, the errors introduced by multisource satellite data are acceptable.
4.2 Attribute uncertainties of independent calving events
We assessed the accuracy of the calved area, the calved-area thickness, and the calved mass attributes using Eqs. (2) and (4)–(6).
The maximum area measurement uncertainty of a single calving event represented in this dataset was calculated as 30.7 km2 with an annual average calved-area uncertainty value of 14.3 km2 and a standard deviation of 5.1 km2. The calved-area uncertainty is mainly determined by the perimeter of each single calving event. In the case of the same area, a long and narrow calving area has higher uncertainty than a square calving area. Thickness uncertainty is mainly attributed to firn depth correction. For individual calving events, thickness uncertainty ranges from 1.0 to 67.7 m with a mean value of 18.5 m and a standard deviation of 9.1 m. The calved mass uncertainty is mainly determined by thickness uncertainty with a mean value of 29.5 Gt and a standard deviation of 23.6 Gt for 15 years, and its annual percentage fluctuates from 1.9 % to 6.0 % each year.
5.1 Number, calved area, and calved mass of independent calving events
We identify 1975 annual calving events covering areas larger than 1 km2 occurring in the circum-Antarctic ice shelves from August 2005 to August 2020. The annual average number of calving events, the calved area, and the calved mass are 131.7 times, 3549.1±14.3 km2, and 770.3±29.5 Gt, respectively. The number of calving events, calved area, and calved mass show high levels of year-to-year variability (Table 5), highlighting the need for longer records to determine long-term changes in ice shelves.
Table 5Annual distribution of the number of calving events, calved area, and calved mass for August 2005 to August 2020.
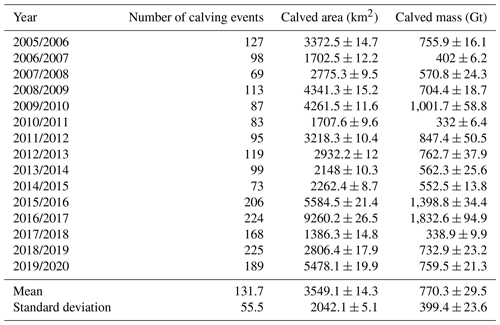
The number of calving events seemed to be stable for the period from 2005/2006 to 2015/2016, fluctuating from 69 to 127, but it increased substantially in 2015/2016 and fluctuated from 168 to 225 for the period from 2015/2016 to 2019/2020 (Fig. 5a). The total calved area was anomalously low in 2006/2007 compared with other years. It then increased in the following 3 years – especially in 2008/2009 and 2009/2010, during which two extra-large calving events occurred in the Wilkins Ice Shelf and Mertz Ice Shelf. The total calved area then decreased again in 2010/2011 and fluctuated in 2010/2011–2014/2015. In 2016/2017, the total calved area increased considerably to a maximum of 9262.0 km2 over the 15 years, during which an extra-large disintegration of the Larsen C Ice Shelf occurred. Following this, we find the most dramatic reduction in 2017/2018, with a total calved area of 1386.3 km2 reducing to a minimum during the observation cycle. In 2018/2019, the total calved area rose slightly to a level close to that of 2005/2006–2015/2016; in 2019/2020, mainly contributed by the extra-large calving of Amery Ice Shelf in September 2019, the calved mass reached the third-highest level of the 15-year observation period. For annual calving mass, the maximum value appeared in 2016/2017 at 1832.6 Gt, and the minimum value was recorded at 332.0 Gt in 2010/2011. This fluctuating trend of calved mass is generally consistent with that of the calved area.
5.2 Calved area and calved mass of the less than 1 km2 calving from the Antarctic ice shelves and the calving mass from the marine-terminating glaciers
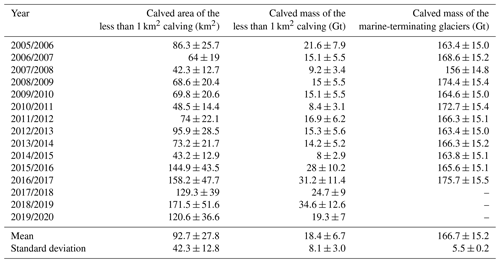
We assessed the annual calved area and calved mass of the less than 1 km2 calving from the Antarctic ice shelves and the annual calving mass from the marine-terminating glaciers (Table 6). We indirectly estimated an average calved area of 92.7±27.8 km2 and an average calved mass of 18.4±6.7 Gt yr−1 of the less than 1 km2 calving from the Antarctic ice shelves. We also took the calved mass of the marine-terminating glaciers into consideration by calculating the ice flux along grounding lines, which is about 166.7±15.2 Gt yr−1. Therefore, the annual average calving rate of whole Antarctica is 955.4±51.4 Gt yr−1.
5.3 Calving scale of independent calving events
The annual distributions of the number, total calved area, and total calved mass of calving events greater than 1 km2 at different scales are shown in Fig. 5a–c. Over the 15 years, the cumulative numbers of calving events of small-, medium-, large- and extra-large-scale events accounted for 72.6 %, 23.5 %, 3.5 %, and 0.3 %, respectively, and frequencies increased exponentially as the scale decreased. The cumulative calved areas of the four abovementioned different sizes accounted for 9.3 %, 25.3 %, 34.7 %, and 30.6 %, respectively. The distribution of calved mass is similar to that of the calved area.
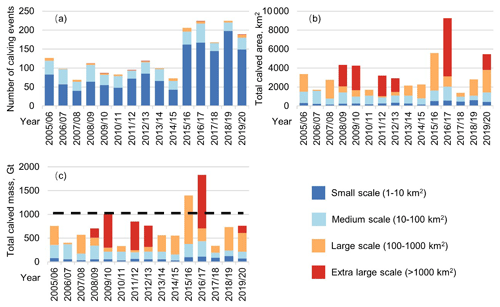
Figure 5Temporal distribution of annual calving events at different scales of Antarctic ice shelves from August 2005 to August 2020. Panels (a–c) present the annual number of calving events, calved area, and calved mass at four scales, respectively. Horizontal dashed lines in panel (c) denote the 1026 Gt yr−1 “steady-state” calving flux of ice shelves reported by Liu et al. (2015).
The number of small-scale calving events accounts for a large percentage of total calving, especially in 2015/2016–2019/2020. The interannual variations in the number of small-scale calving events show obviously moderate variations. However, the area and mass of small-scale calving remain relatively stable and low. As the calving scale increases, interannual variations in frequency become less significant; in contrast, interannual variations in area and mass become increasingly volatile. In some years, the number of calving events increased but calved area and mass remained stable or even decreased because more small-scale calving events made a limited contribution to the total calved mass and area. Thus, further studies must be conducted at different scales.
5.4 Calving recurrence interval of independent calving events
The recurrence interval of calving provides additional qualitative information about the calving feature (Liu et al., 2015) and determines the suitable observation period for identifying the non-steady-state behavior of an ice shelf. For example, following the previous calving in 1963/1964, the rift-opening calving of the Amery Ice Shelf reoccurred in 2019, detaching along the preexisting rifts that had been there for decades (Li et al., 2020). Observational records spanning many decades would be needed to determine its non-steady-state behavior. In contrast, more frequent disintegration calving events are mainly caused by rapid basal crevasse propagation, which is difficult to observe (Liu et al., 2015). The calving front retreat associated with these frequent calving events can be robustly identified over a short observation period due to the shorter recurrence intervals. In other words, the calving events with shorter recurrence intervals are more sensitive to current climate change.
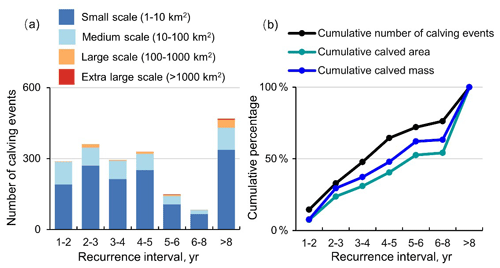
Figure 6Distribution of calving events with different recurrence intervals. Panel (a) shows the cumulative number of calving events at different scales. Panel (b) shows the cumulative percentages of the cumulative number of calving events, the cumulative calved area, and the cumulative calved mass.
Figure 6a shows that there is no obvious relationship between the calving recurrence interval and calving scale. Two extra-large-scale (>1000 km2) calving events reoccurred on the Thwaite Glacier during our observed period, indicating its distinct retreat, while four other extra-large-scale events from the Larsen C, Wilkins, Totten, and Amery Ice shelves did not reoccur. Figure 6b shows that 76 % of the total number of calving events reoccurred during the observed period (i.e., their recurrence intervals of calving are less than 8 years), which suggests that the annual calving number is likely to be an indicator of the response of calving to climate change. Nearly half of the calved area was contributed by calving events with recurrence intervals longer than 8 years (i.e., calving only occurred once during the observed period), which suggests that the annual calved area is not suitable for identifying the non-steady-state behavior of some temporarily inactive ice shelves with a longer calving interval.
5.5 Spatial distribution of independent calving events
Figure 7 shows the spatial distribution of annual calving events at different scales from 2005/2006 to 2019/2020. Small- and medium-scale calving widely appeared in the Antarctic Peninsula, in West Antarctica, and on Wilkes Land in East Antarctica with interannual variations mainly found in Queen Maud Land in East Antarctica from 2011/2012 to 2015/2016. In 2011/2012–2015/2016, small-scale calving events were largely distributed in West Antarctica and sparsely occurred in East Antarctica. Large-scale calving events appeared quite randomly, usually in medium-sized ice shelf regions of the Antarctica Peninsula and West Antarctica. Extra-large-scale calving events only occurred twice in the Antarctica Peninsula, twice in West Antarctica, and twice in East Antarctica.
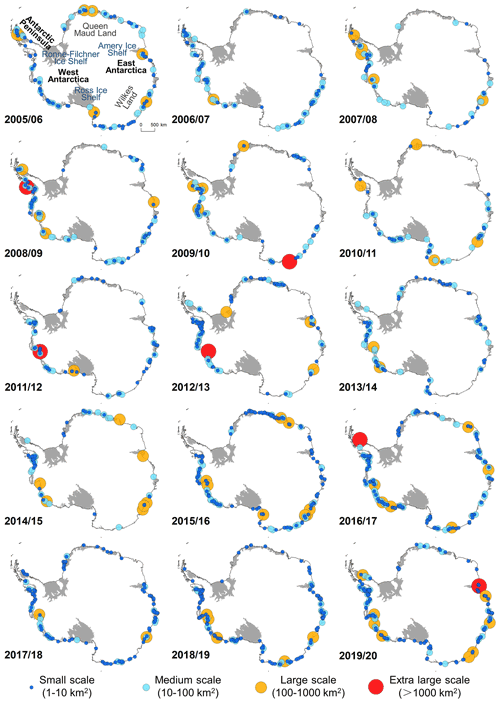
Figure 7Spatial distribution of annual calving events at different scales from August 2005 to August 2020.
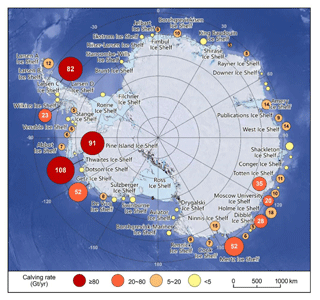
Figure 8Spatial distribution of average calving rate (Gt yr−1) of Antarctic ice shelves from August 2005 to August 2020.
Figure 8 shows the average calving rates of the different Antarctic ice shelves from August 2005 to August 2020. We find that the calving mass of Antarctica is mainly affected by the iceberg calving of small ice shelves rather than that of larger ice shelves. Of these, the cumulative calving masses of two major ice shelves, the Ronne–Filchner Ice Shelf and the Ross Ice Shelf, are negligible over the 15-year observation cycle. The Amery Ice Shelf and the Larsen C Ice Shelf in the Antarctic Peninsula, the third- and the fourth-largest ice shelves in Antarctica, had a very low calving rate except for the extra-large disintegration events that occurred in September 2019 and July 2017, respectively. Additionally, some large ice shelves in Queen Maud Land show a low calving mass, while there were a few calving events along the entire coastline in some years (Fig. 7).
In contrast, small- and medium-sized ice shelves, widely found along the circum-Antarctic coastline, exhibit a higher calving rate (Gt yr−1). Among them, the Thwaites Ice Shelf, Pine Island Ice Shelf, and Getz Ice Shelf in West Antarctica show calving rates of 108, 91, and 52 Gt yr−1, respectively. These are followed by the Mertz Ice Shelf and Totten Ice Shelf in East Antarctica with calving rates of 52 and 35 Gt yr−1, respectively. Notably, during the observation period, we detected medium or large calving events from Totten Ice Shelf every year. It is different from calving from the Mertz Ice Shelf that was mainly contributed by an extra-large disintegration event covering more than 2500 km2 which occurred in February 2010.
The annual iceberg calving dataset of the Antarctic ice shelves (2005–2020) is the first to provide consistent and precise calving observations with the longest time span of 15 years. It not only directly reflects the quantitative characteristics and spatial distribution of Antarctic iceberg calving, but it also provides multidimensional variables of each independent calving event. This dataset can be used as fundamental information for subsequent studies on ice sheet mass balance, calving mechanisms, and their responses to climate change.
The interpretation of calving records spanning 12 orders of magnitude from 1 to 1012 m3 has demonstrated that the probability of calving events obeys a particular pattern whether they are small or large events – much like the Gutenberg–Richter law for earthquakes (Åström et al., 2014). Thus, the fine-scale and continuous observation of calving can be used to investigate how close particular glaciers are to their critical point and, thus, how sensitive they may be to near-future changes in climatic and geometric conditions. However, finer-scale direct observation is greatly limited by the accessibility of high-resolution remotely sensed imagery and significant manual overhead. Our observations provide records of calving volumes ranging from 108 to 1012 m3 from Antarctic ice shelves.
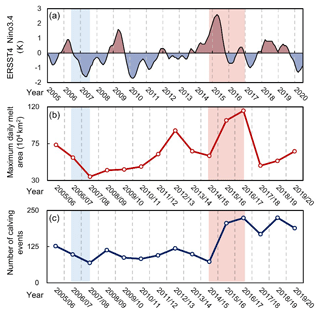
Figure 9Relationship between annual iceberg calving distribution for 2005–2020 and (a) oceanic Niño index data from https://ggweather.com/enso/oni.htm (last access: 11 September 2021) and (b) maximum daily ice sheet surface melting area data from http://pp.ige-grenoble.fr/pageperso/picardgh/melting/ (last access: 11 September 2021).
The calved-area uncertainty of our direct observation (Qi et al., 2020) is dependent on the spatial resolution of the imagery, the uncertainty of velocity data, and the perimeter-to-area ratio of the calved area. In the case of the same area, a long and narrow calving area has higher uncertainty than a square calving area. The relatively low-spatial-resolution satellite imagery used in this work and the characteristic of a long and narrow calving area are the main reasons that this method is not suitable for high-accuracy calving observation of marine-terminating glaciers. The trade-off between workload and uncertainty reduction is another consideration in choosing the minimum spatial scale of calving observation. With the calving scale decreasing from 100 km2, the number of annual calving events increases exponentially, which means that the monitoring workload also increases exponentially (Qi et al., 2020). Although direct calving observation has the minimum valid extraction area of 0.05 km2 based on 75 m SAR resolution images (Qi et al., 2020), it is uneconomical to observe calving events of less than 1 km2 using an exponentially increasing manual workload to slightly reduce the uncertainty of the total calving-rate estimation. This is why, in the present work, the calving area and mass of calving events of less than 1 km2 of the Antarctic ice shelves were estimated based on the observation-area ratio and direct observation of 1–10 km2 calving events.
The total circum-Antarctic iceberg calving rate of 955.4±51.4 Gt yr−1 between 2005 and 2020 observed and estimated in the present study is less than the steady-state iceberg calving fluxes of 1265 Gt yr−1 estimated by Rignot et al. (2013) and 1321 Gt yr−1 estimated by Depoorter et al. (2013). The steady-state calving flux is the calving flux necessary to maintain an assumed steady-state calving front for a given set of ice thicknesses and velocities along the ice front gate (Rignot et al., 2013; Depoorter et al., 2013). Such “flux-gate” calving calculations are suitable for the marine-terminating glaciers. Our estimated calving rate of the marine-terminating glaciers, 166.7±15.2 Gt yr−1, is very close to that reported by Rignot et al. (2013), i.e., 176 Gt yr−1. However, such “flux-gate” calving calculations for ice shelves are inevitably biased as they underestimate iceberg calving for retreating ice shelves or overestimate it for advancing ice shelves. Our observed average calving rate of 770.3±29.5 Gt yr−1 from calving events larger than 1 km2 between 2005 and 2020 is slightly greater than the average rate of 755 Gt yr−1 between 2005 and 2011 (Liu et al., 2015), which is contributed by two distinct high calving rates of 1398.8 Gt yr−1 in 2015/2016 and 1832.6 Gt yr−1 in 2016/2017. The average calving rate of 788.7±36.2 Gt yr−1 of all of the Antarctic ice shelves between 2005 and 2020 is the sum of 770.3±29.5 Gt yr−1 and the estimated average calving rate of 18.4±6.7 Gt yr−1 from calving events less than 1 km2, which is less than the steady-state calving fluxes of 1089 Gt yr−1 estimated by Rignot et al. (2013) and 1026 Gt yr−1 estimated by Liu et al. (2015). Thus, the Antarctic ice shelves are growing in extent.
Observations show that enhanced iceberg calving events have primarily been attributed to varying atmospheric and oceanic conditions (Shepherd et al., 2003; van den Broeke, 2005; Scambos et al., 2009; Braun and Humbert, 2009; Liu et al., 2015; Massom et al., 2018). Previous studies have revealed that ocean-driven thinning enhances iceberg calving and the retreat of Antarctic ice shelves based on the first record of all icebergs larger than 1 km2 calving from all of the Antarctic ice shelves between 2005 and 2011 (Liu et al., 2015). Here, the time series of this dataset has been extended from 6 to 15 years. The calving probability of Antarctic ice shelves indicated by the number of calving events has obvious inter-annual variation during our observation period (Fig. 6). Because 76 % of the calving events have recurrence intervals of less than 8 years, the annual variation of the number of calving events probably reflects the calving response to current climate variability. This provides an opportunity to examine the potential associations between iceberg calving and remote and local climate forcings.
Here, we show two examples from our preliminary analysis. First, Fig. 9c and a show the relationship between the number of calving events and the oceanic Niño index. Remotely, El Niño leads to anomalous increases in sea surface temperature and Antarctic ice sheet temperature. We found that a strong El Niño might lead to an increase in the number of calving events of Antarctic ice shelves, and there has been intensified iceberg calving since the strong El Niño. Second, Fig. 9c and b show the correlation between iceberg calving and ice sheet surface melting. Locally, atmospheric warming intensified ice sheet surface melting, resulting in increased meltwater, which may trigger the expansion of rifts and crevasses and finally enhance iceberg calving. Based on this dataset, we found significant positive correlations between the maximum daily surface melting area and the number of calving events (r=0.76, p=0.003).
The developed iceberg calving product applies a 15-year calving distribution with year, length, area, scale, thickness, volume, mass, recurrence interval, and measurement uncertainty attributes for each calving event. The product applies an annual temporal resolution, and its spatial resolution is set to 1 km2.
The dataset, entitled “Annual iceberg calving dataset of the Antarctic ice shelves (2005–2020)”, is stored in Shapefile format and shared via the National Tibetan Plateau Data Center (http://data.tpdc.ac.cn/en/, last access: 11 September 2021): https://doi.org/10.11888/Glacio.tpdc.271250 (Qi et al., 2021).
XC, YL, and MQ conceived of, designed, and conducted the experiment. YL and MQ contributed to the research framework and helped develop the methodology. MQ and YL performed the data analysis. MQ, YL, JL, and QS contributed to analyzing the results. MQ and QF contributed to the data processing. All authors contributed to the discussion and writing of the paper.
The authors declare that they have no conflict of interest.
Publisher's note: Copernicus Publications remains neutral with regard to jurisdictional claims in published maps and institutional affiliations.
We greatly thank the European Space Agency (ESA) for providing the Sentinel-1 and Envisat imagery, we thank the National Aeronautics and Space Administration (NASA) and the United States Geological Survey (USGS) for providing the Landsat and MODIS data, and we truly appreciate the National Snow and Ice Data Center (NSIDC) for providing the ice velocity and ice sheet boundary products. We thank British Antarctic Survey (BAS) for providing Bedmap2, and we are grateful to the Polar Geospatial Center at the University of Minnesota and UGA for providing the Reference Elevation Model of Antarctica (REMA).
This research was funded by the National Key Research and Development Program of China (grant nos. 2016YFA0600103 and 2018YFA0605403), the National Natural Science Foundation of China (grant no. 41925027), and Qian Xuesen Lab. – DFH Sat. Co. Joint Research and Development Fund.
This paper was edited by Tao Che and reviewed by Mohammed Shokr and one anonymous referee.
Åström, J. A., Vallot, D., Schäfer, M., Welty, E. Z., O'Neel, S., Bartholomaus, T. C., Liu, Y., Riikilä, T. I., Zwinger, T., Timonen, J., and Moore, J. C.: Termini of calving glaciers as self-organized critical systems, Nat. Geosci., 7, 874–878, https://doi.org/10.1038/ngeo2290, 2014.
Berthier, E., Scambos, T. A., and Shuman, C. A.: Mass Loss of Larsen B Tributary Glaciers (Antarctic Peninsula) Unabated Since 2002, Geophys. Res. Lett., 39, 13, https://doi.org/10.1029/2012GL051755, 2012.
Bindschadler, R.: History of lower Pine Island Glacier, West Antarctica, from Landsat imagery, J. Glaciol., 48, 536–544, 2002.
Braun, M. and Humbert, A.: Recent Retreat of Wilkins Ice Shelf Reveals New Insights in Ice Shelf Breakup Mechanisms, IEEE Geosci. Remote S., 6, 263–267, https://doi.org/10.1109/lgrs.2008.2011925, 2009.
Cook, A. J. and Vaughan, D. G.: Overview of areal changes of the ice shelves on the Antarctic Peninsula over the past 50 years, The Cryosphere, 4, 77–98, https://doi.org/10.5194/tc-4-77-2010, 2010.
Cook, A. J., Fox, A. J., Vaughan, D. G., and Ferrigno, J. G.: Retreating glacier fronts on the Antarctic Peninsula over the past half-century, Science, 308, 541–544, https://doi.org/10.1126/science.1104235, 2005.
Depoorter, M. A., Bamber, J. L., Griggs, J. A., Lenaerts, J. T., Ligtenberg, S. R., van den Broeke, M. R., and Moholdt, G.: Calving fluxes and basal melt rates of Antarctic ice shelves, Nature, 502, 89–92, https://doi.org/10.1038/nature12567, 2013.
Fountain, A. G., Glenn, B., and Scambos, T. A.: The Changing Extent of the Glaciers Along the Western Ross Sea, Antarctica, Geology, 45, 927–930, 2017.
Fretwell, P., Pritchard, H. D., Vaughan, D. G., Bamber, J. L., Barrand, N. E., Bell, R., Bianchi, C., Bingham, R. G., Blankenship, D. D., Casassa, G., Catania, G., Callens, D., Conway, H., Cook, A. J., Corr, H. F. J., Damaske, D., Damm, V., Ferraccioli, F., Forsberg, R., Fujita, S., Gim, Y., Gogineni, P., Griggs, J. A., Hindmarsh, R. C. A., Holmlund, P., Holt, J. W., Jacobel, R. W., Jenkins, A., Jokat, W., Jordan, T., King, E. C., Kohler, J., Krabill, W., Riger-Kusk, M., Langley, K. A., Leitchenkov, G., Leuschen, C., Luyendyk, B. P., Matsuoka, K., Mouginot, J., Nitsche, F. O., Nogi, Y., Nost, O. A., Popov, S. V., Rignot, E., Rippin, D. M., Rivera, A., Roberts, J., Ross, N., Siegert, M. J., Smith, A. M., Steinhage, D., Studinger, M., Sun, B., Tinto, B. K., Welch, B. C., Wilson, D., Young, D. A., Xiangbin, C., and Zirizzotti, A.: Bedmap2: improved ice bed, surface and thickness datasets for Antarctica, The Cryosphere, 7, 375–393, https://doi.org/10.5194/tc-7-375-2013, 2013.
Furst, J. J., Durand, G., Gilletchaulet, F., Tavard, L., Rankl, M., Braun, M., and Gagliardini, O.: The safety band of Antarctic ice shelves, Nat. Clim. Change, 6, 479–482, 2016.
Griggs, J. A. and Bamber L. J.: Antarctic ice-shelf thickness from satellite radar altimetry, J. Glaciol., 57, 485–498, 2011.
Hill, E. A., Carr, J. R., Stokes, C. R., and Gudmundsson, G. H.: Dynamic changes in outlet glaciers in northern Greenland from 1948 to 2015, The Cryosphere, 12, 3243–3263, https://doi.org/10.5194/tc-12-3243-2018, 2018.
Howat, I. M., Porter, C., Smith, B. E., Noh, M.-J., and Morin, P.: The Reference Elevation Model of Antarctica, The Cryosphere, 13, 665–674, https://doi.org/10.5194/tc-13-665-2019, 2019.
Li, T., Liu, Y., and Cheng, X.: Recent and imminent calving events do little to impair Amery ice shelf's stability, Acta Oceanol. Sin., 39, 168–170, https://doi.org/10.1007/s13131-020-1600-6, 2020.
Liu, H. and Jezek, K. C.: A Complete High-Resolution Coastline of Antarctica Extracted from Orthorectified Radarsat SAR Imagery, Photogramm. Eng. Rem. S., 70, 605–616, 2004.
Liu, Y., Cheng, X., Hui, F., Wang, F., and Chi, Z.: Antarctic iceberg calving monitoring based on EnviSat ASAR images, Journal of Remote Sensing, 17, 479–494, 2013.
Liu, Y., Moore, J. C., Cheng, X., Gladstone, R. M., Bassis, J. N., Liu, H., Wen, J., and Hui, F.: Ocean-driven thinning enhances iceberg calving and retreat of Antarctic ice shelves, P. Natl. Acad. Sci. USA, 112, 3263–3268, https://doi.org/10.1073/pnas.1415137112, 2015.
Lovell, A. M., Stokes, C. R., and Jamieson, S. S. R.: Sub-decadal variations in outlet glacier terminus positions in Victoria Land, Oates Land and George V Land, East Antarctica (1972–2013), Antarct. Sci., 29, 468–483, 2017.
Luckman, A., Benn, D. I., Cottier, F., Bevan, S., Nilsen, F., and Inall, M.: Calving rates at tidewater glaciers vary strongly with ocean temperature, Nat. Commun., 6, 8566–8566, 2015.
Massom, R. A., Giles, A. B., Warner, R. C., Fricker, H. A., Legresy, B., Hyland, G., Lescarmontier, L., and Young, N. W.: External influences on the Mertz Glacier Tongue (East Antarctica) in the decade leading up to its calving in 2010, J. Geophys. Res., 120, 490–506, 2015.
Massom, R. A., Scambos, T. A., Bennetts, L. G., Reid, P., Squire, V. A., and Stammerjohn, S. E.: Antarctic ice shelf disintegration triggered by sea ice loss and ocean swell, Nature, 558, 383–389, https://doi.org/10.1038/s41586-018-0212-1, 2018.
MODIS Characterization Support Team (MCST): MODIS 250 m Calibrated Radiances Product, NASA MODIS Adaptive Processing System, Goddard Space Flight Center, USA, https://doi.org/10.5067/MODIS/MOD02QKM.06, 2017.
Medrzycka, D., Benn, D. I., Box, J. E., Copland, L., and Balog, J.: Calving Behavior at Rink Isbræ, West Greenland, from Time-Lapse Photos, Arct. Antarct. Alp. Res., 48, 263–277, https://doi.org/10.1657/aaar0015-059, 2016.
Miles, B. W. J., Stokes, C. R., and Jamieson, S. S. R.: Simultaneous disintegration of outlet glaciers in Porpoise Bay (Wilkes Land), East Antarctica, driven by sea ice break-up, The Cryosphere, 11, 427–442, https://doi.org/10.5194/tc-11-427-2017, 2017.
Morlighem, M., Rignot, E., Binder, T., Blankenship, D. D., Drews, R., Eagles, G., Eisen, O., Ferraccioli, F., Forsberg, R., and Fretwell, P. T. J. N. G.: Deep glacial troughs and stabilizing ridges unveiled beneath the margins of the Antarctic ice sheet, Nat. Geosci., 13, 132–137, 2020.
Mouginot, J., Scheuchl, B., and Rignot, E.: Mapping of Ice Motion in Antarctica Using Synthetic-Aperture Radar Data, Remote Sens., 4, 2753–2767, https://doi.org/10.3390/rs4092753, 2012.
Mouginot, J., Rignot, E., Scheuchl, B., and Millan, R.: Comprehensive Annual Ice Sheet Velocity Mapping Using Landsat-8, Sentinel-1, and RADARSAT-2 Data, Remote Sens., 9, 364, https://doi.org/10.3390/rs9040364, 2017a.
Mouginot, J., Scheuchl, B., and Rignot, E.: MEaSUREs Antarctic Boundaries for IPY 2007–2009 from Satellite Radar, Version 2 [DB/OL], NASA National Snow and Ice Data Center Distributed Active Archive Center, https://doi.org/10.5067/AXE4121732AD, 2017b.
Mouginot, J., Rignot, E., and Scheuchl, B.: Continent-Wide, Interferometric SAR Phase, Mapping of Antarctic Ice Velocity, Geophys. Res. Lett., 46, 9710–9718, https://doi.org/10.1029/2019gl083826, 2019.
Pattyn, F. and Morlighem, M.: The uncertain future of the Antarctic Ice Sheet, Science, 367, 1331–1335, https://doi.org/10.1126/science.aaz5487, 2020.
Picard, G. and Fily, M.: Surface melting observations in Antarctica by microwave radiometers: Correcting 26 year time series from changes in acquisition hours, Remote Sens. Environ., 104, 325–336, 2006.
Pritchard, H. D., Ligtenberg, S. R. M., Fricker, H. A., Vaughan, D. G., van den Broeke, M. R., and Padman, L.: Antarctic ice-sheet loss driven by basal melting of ice shelves, Nature, 484, 502–505, https://doi.org/10.1038/nature10968, 2012.
Qi, M., Liu, Y., Lin, Y., Hui, F., Li, T., and Cheng, X.: Efficient Location and Extraction of the Iceberg Calved Areas of the Antarctic Ice Shelves, Remote Sens., 12, 2658, https://doi.org/10.3390/rs12162658, 2020.
Qi, M., Liu, Y., Cheng, X., Hui, F., and Chen, Z.: Annual Iceberg Calving Dataset of the Antarctic Ice Shelves (2005–2020), National Tibetan Plateau Data Center, https://doi.org/10.11888/Glacio.tpdc.271250, 2021.
Rignot, E., Casassa, G., Gogineni, P., Krabill, W. B., Rivera, A., and Thomas, R.: Accelerated Ice Discharge from the Antarctic Peninsula following the Collapse of Larsen B Ice Shelf, Geophys. Res. Lett., 31, 1–4, 2004.
Rignot, E., Bamber, J. L., van den Broeke, M. R., Davis, C., Li, Y., van de Berg, W. J., and van Meijgaard, E.: Recent Antarctic ice mass loss from radar interferometry and regional climate modelling, Nat. Geosci., 1, 106–110, 2008.
Rignot, E., Mouginot, J., and Scheuchl, B.: Ice flow of the Antarctic ice sheet, Science, 333, 1427–1430, https://doi.org/10.1126/science.1208336, 2011.
Rignot, E., Jacobs, S., Mouginot, J., and Scheuchl, B.: Ice-shelf melting around Antarctica, Science, 341, 266–270, https://doi.org/10.1126/science.1235798, 2013.
Rignot, E., Mouginot, J., and Scheuchl, B.: MEaSUREs InSAR-Based Antarctica Ice Velocity Map, Version 2, NASA National Snow and Ice Data Center Distributed Active Archive Center, Boulder, CO, USA, https://doi.org/10.5067/D7GK8F5J8M8R, 2017.
Scambos, T. A., Haran, T., Fahnestock, M., Painter, T. H., and Bohlander, J.: MODIS-based Mosaic of Antarctica (MOA) data sets: Continent-wide surface morphology and snow grain size, Remote Sens. Environ., 111, 242–257, 2007.
Scambos, T., Fricker, H. A., Liu, C.-C., Bohlander, J., Fastook, J., Sargent, A., Massom, R., and Wu, A.-M.: Ice shelf disintegration by plate bending and hydro-fracture: Satellite observations and model results of the 2008 Wilkins ice shelf break-ups, Earth Planet. Sc. Lett., 280, 51–60, https://doi.org/10.1016/j.epsl.2008.12.027, 2009.
Shepherd, A., Wingham, D., Payne, T., and Skvarca, P.: Larsen ice shelf has progressively thinned, Science, 302, 856–859, https://doi.org/10.1126/science.1089768, 2003.
van den Broeke, M.: Strong surface melting preceded collapse of Antarctic Peninsula ice shelf, Geophys. Res. Lett., 32, https://doi.org/10.1029/2005gl023247, 2005.
Yu, Y., Zhang, Z., Shokr, M., Hui, F., Cheng, X., Chi, Z., Heil, P., and Chen, Z.: Automatically Extracted Antarctic Coastline Using Remotely-Sensed Data: An Update, Remote Sens.-Basel, 11, 1844, https://doi.org/10.3390/rs11161844, 2019.
Zhao, C., Cheng, X., Hui, F., Kang, J., Liu, Y., Wang, X., Wang, F., Cheng, C., Feng, Z., Ci, T., Zhao, T., and Zhai, M.: Monitoring the Amery Ice Shelf front during 2004–2012 using ENVISAT ASAR data, Advances in Polar Science, 24, 133–137, https://doi.org/10.3724/sp.J.1085.2013.00133, 2014.


