the Creative Commons Attribution 4.0 License.
the Creative Commons Attribution 4.0 License.
 | 27 Aug 2021
A year of attenuation data from a commercial dual-polarized duplex microwave link with concurrent disdrometer, rain gauge, and weather observations
Vojtěch Bareš
Martin Fencl
Marc Schleiss
Joël Jaffrain
Alexis Berne
Jörg Rieckermann
Commercial microwave links (CMLs) in telecommunication networks can provide relevant information for remote sensing of precipitation and other environmental variables, such as path-averaged drop size distribution, evaporation, or humidity. The CoMMon field experiment (COmmercial Microwave links for urban rainfall MONitoring) mainly focused on the rainfall observations by monitoring a 38 GHz dual-polarized CML of 1.85 km path length at a high temporal resolution (4 s), as well as a co-located array of five disdrometers and three rain gauges over 1 year. The dataset is complemented with observations from five nearby weather stations. Raw and pre-processed data, which can be explored with a custom static HTML viewer, are available at https://doi.org/10.5281/zenodo.4923125 (Špačková et al., 2021). The data quality is generally satisfactory for further analysis, and potentially problematic measurements are flagged to help the analyst identify relevant periods for specific study purposes. Finally, we encourage potential applications and discuss open issues regarding future remote sensing with CMLs.
- Article
(3977 KB) - Full-text XML
- BibTeX
- EndNote


Accurate information about precipitation is important for many applications from agriculture to pluvial flooding (Chwala and Kunstmann, 2019). Commercial microwave links (CMLs) from telecommunication networks represent a promising source of information (Graf et al., 2020; Overeem et al., 2016) as their signals are affected by both liquid and solid precipitation. Presently, there are an estimated 5 million CMLs (Ericsson, 2019) deployed around the world, and the widespread coverage of mobile phone networks includes sparsely or completely ungauged areas. CMLs can observe precipitation close to the ground and can be queried remotely from network operation centres within a few seconds, enabling operational applications such as precipitation nowcasting or hydrological forecasts and early flood warnings. Currently, only a small number of open datasets for studying the small-scale variability of rainfall and its relationship to CML attenuation data are available. In the Netherlands, van Leth et al. (2018) provided measurements from three co-located microwave links near Wageningen. Gires et al. (2018) published a dataset of 2 months of disdrometer data using three co-located devices and provided a dataset of disdrometer data collected during a measurement campaign testing a rainfall simulator (Gires et al., 2020). Unfortunately, datasets of CML attenuation and observations of precipitation microphysics with a high temporal resolution lack the ability to fully tap into this potential and identify current knowledge gaps (see below).
For example, the analysis of Chwala and Kunstmann (2019) suggests that operational datasets from real-world case studies and methods, e.g. for baseline removal, are not openly available. As telecommunication providers are reluctant to share the properties of CMLs, the majority of datasets and important meta information are available only to the research groups involved. However, openly available datasets of precipitation microphysics and CML attenuation, ideally with detailed weather information, are essential to test available theories and benchmark the prediction capabilities of developed methods, which were mostly tuned and tested on non-public datasets. Nevertheless, there are openly available tools for CML rainfall information processing and mapping (e.g. Overeem et al., 2016; Chwala et al., 2020).
The goal of this paper is to publish the unique dataset and documentation of the “CoMMon” (Commercial Microwave links for rainfall MONitoring) experiment, consisting of a 1-year-long field campaign in Dübendorf (CH) during which attenuation data from a 38 GHz dual-polarized CML were collected, together with precipitation observations from rain gauges and disdrometers deployed along the CML path in high temporal resolution (Fig. 1a). In addition, weather data, such as temperature, dew point, relative humidity, and wind speed from two nearby and three more distant weather stations, were acquired. Noteworthy features of the data are (i) a dual-polarized CML, rather than single-polarization, (ii) an array of disdrometers in addition to rain gauges, and (iii) outdoor units of the CML operated with weather-protecting shields (Fig. 2), to investigate the impact of antenna wetting, for approximately half of the experimental period.
First, this paper will briefly describe the theory of rain retrieval and highlight the importance of drop size distribution. Second, we present the experimental setup, sensor specifications, experimental campaign, and structure of the collected data files and discuss data quality and reliability. The third section presents the database and the HTML viewer provided to explore the data efficiently. The fourth section discusses potential future applications of the CoMMon dataset.
2.1 The importance of drop size distribution for rain retrieval from commercial microwave links
The attenuation of a CML signal is related to the drop size distribution along its path. The observed attenuation can be used to calculate the rain rate between the two end nodes of a CML. The observed total loss Lt (dB) is the difference of transmitted and received signal power. Rainfall-induced specific attenuation k (dB km−1) due to raindrops passing the path of the microwave propagation can be formulated as follows:
where k is the specific attenuation (in dB km−1), Ab (dB) is background (baseline) attenuation (ITU-R, 2019), Aw (dB) is wet antenna attenuation, and l (km) is path length. Ab is usually determined during dry weather periods (Fencl et al., 2017; Polz et al., 2020) without dew or rain occurrence (see Figs. 7, 8) and is assumed to have the same level during rainfall. Aw describes the impact of radome wetting. The importance of accurate estimation of Aw increases in the case of short CMLs when its contribution to the observed attenuation is substantial (Pastorek et al., 2018).
The power law relationship approximates the relation between attenuation caused by raindrops and rainfall intensity (Atlas and Ulbrich, 1977):
where R is the rain rate in mm h−1 and parameters a and b are related to the CML characteristics (frequency, polarization) and drop size distribution (DSD), respectively (Olsen et al., 1978). Value b is close to 1 for frequencies between 20 and 40 GHz (ITU-R, 2005). While electromagnetic scattering for hydrometeors is generally complex (Eriksson, 2018), the specific attenuation for liquid precipitation can be estimated from the drop size distribution:
where f is the frequency, D (mm) denotes equi-volumetric drop diameter, N(D) (m−3 mm−1) is the number of drops per unit volume in a drop diameter interval (drop size distribution, DSD), and Cext(D,f) is the extinction cross section at frequency f (in m2), which determines the attenuation from a single drop.
The accuracy of the power law approximation (Eq. 2) can be assessed by comparing Eq. (3) to the rain rate R (Eq. 4) of the observed drop spectrum (Atlas and Ulbrich, 1977):
where v(D) is the terminal fall velocity (in m s−1) of a drop and D (mm) denotes equi-volumetric drop diameter.
2.2 Field campaign
The campaign took place in Dübendorf, Switzerland. Figure 1a presents the layout of the CoMMon field campaign with all sites (white pins) where the disdrometers and rain gauges were deployed. The two antennas were located at sites 1 (Dübendorf) and 5 (Wangen), and the CML was 1.85 km long (blue line). To assess wet antenna attenuation, antenna radomes and outdoor units were weather-protected by large custom-made PVC shields for approximately half of the experimental period (Fig. 2). The area between the antennas consists mainly of an airport, sport fields, agricultural fields, a shopping mall, and a highway. Five laser optical disdrometers were placed at sites 2, 3, 4, and 5. The disdrometers at site 2 were co-located to enable quality control and the quantification of observation uncertainties. Three tipping bucket rain gauges were also used at sites 2, 4, and 5 (Table 1). The location of each site was chosen based on a compromise between proximity to the CML path, accessibility, and protection against vandalism. The devices were situated as far as possible from roof edges to avoid wind disturbances. The instrument types and specifications are provided in Sect. 2.3 below and in the metadata sheets in the Zenodo repository.
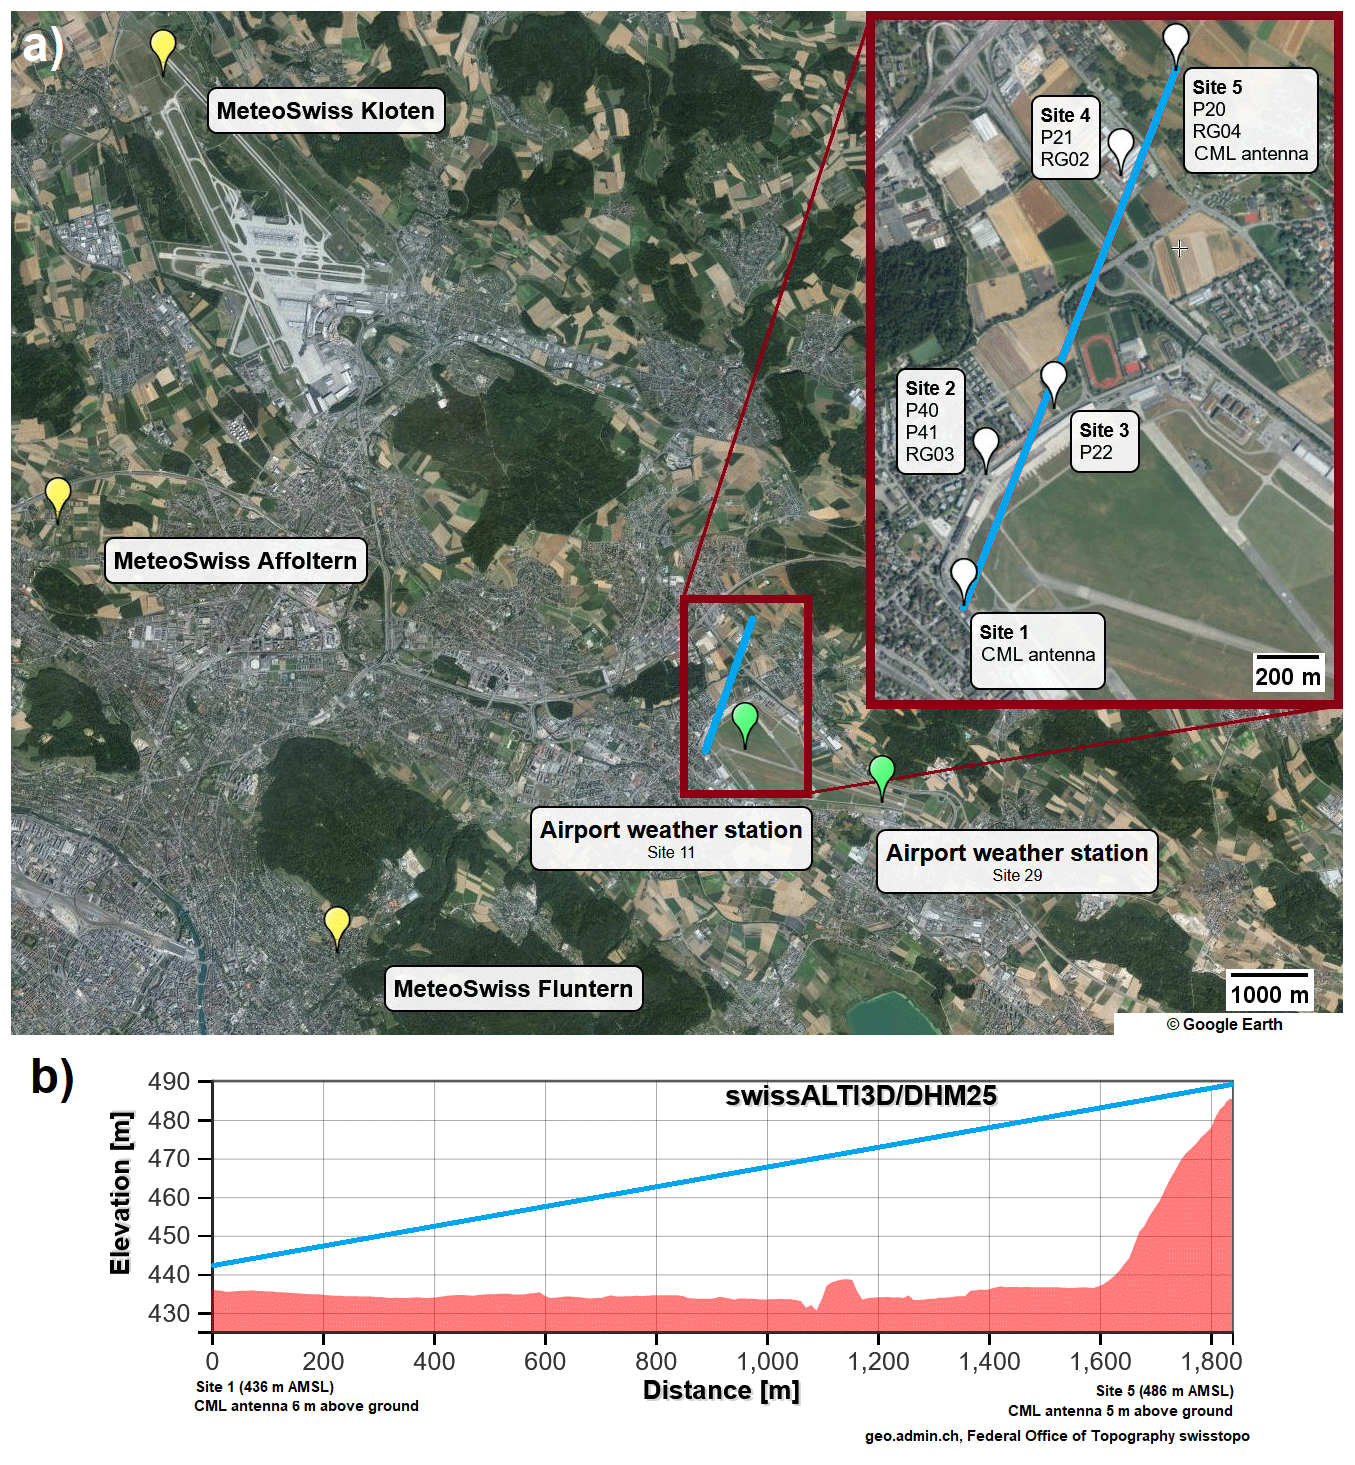
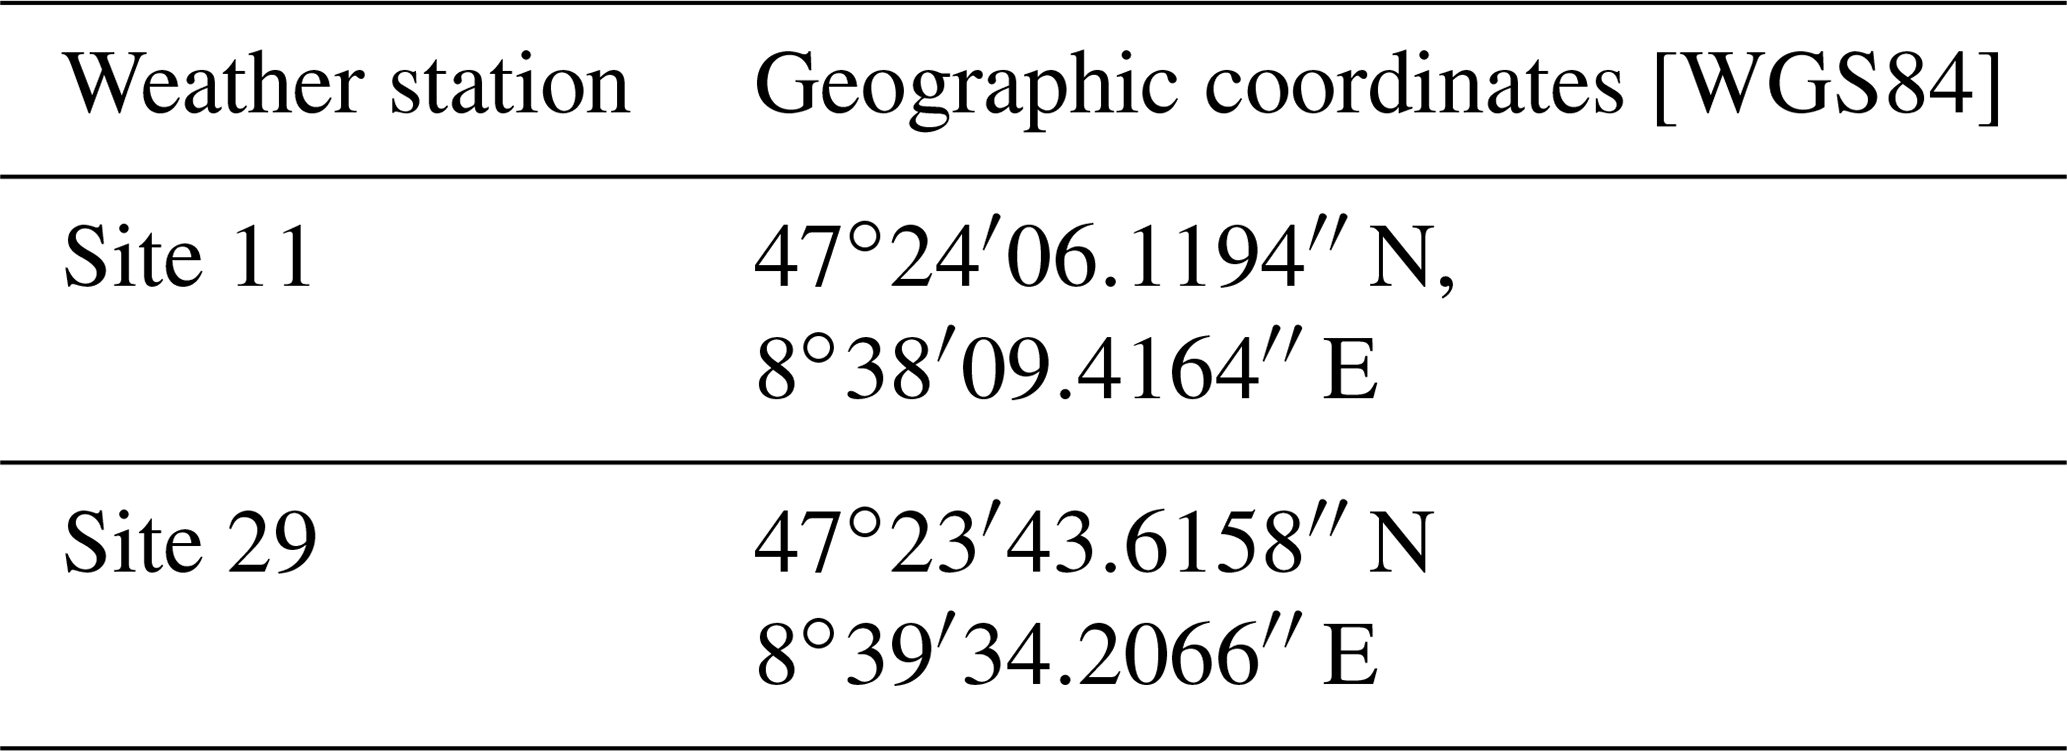
Figure 1(a) Layout of the CoMMon field campaign. The radio units are deployed at the end sites (site 1 and site 5). The path of the CML is in blue. Disdrometer (P, Parsivel) and rain gauge (RG, rain gauge) positions are indicated by white pins. Site 2 contained two co-located disdrometers for data quality control. Except for site 3, all rain gauges have a co-located disdrometer. The MeteoSwiss weather stations (yellow pins) are within 6 to 11 km away. Two additional weather stations (green) are located at the Dübendorf airport (site 11 and site 29). © Google Maps, all rights reserved. (b) Longitudinal profile of terrain under the CML path. © Federal Office of Topography, all rights reserved.
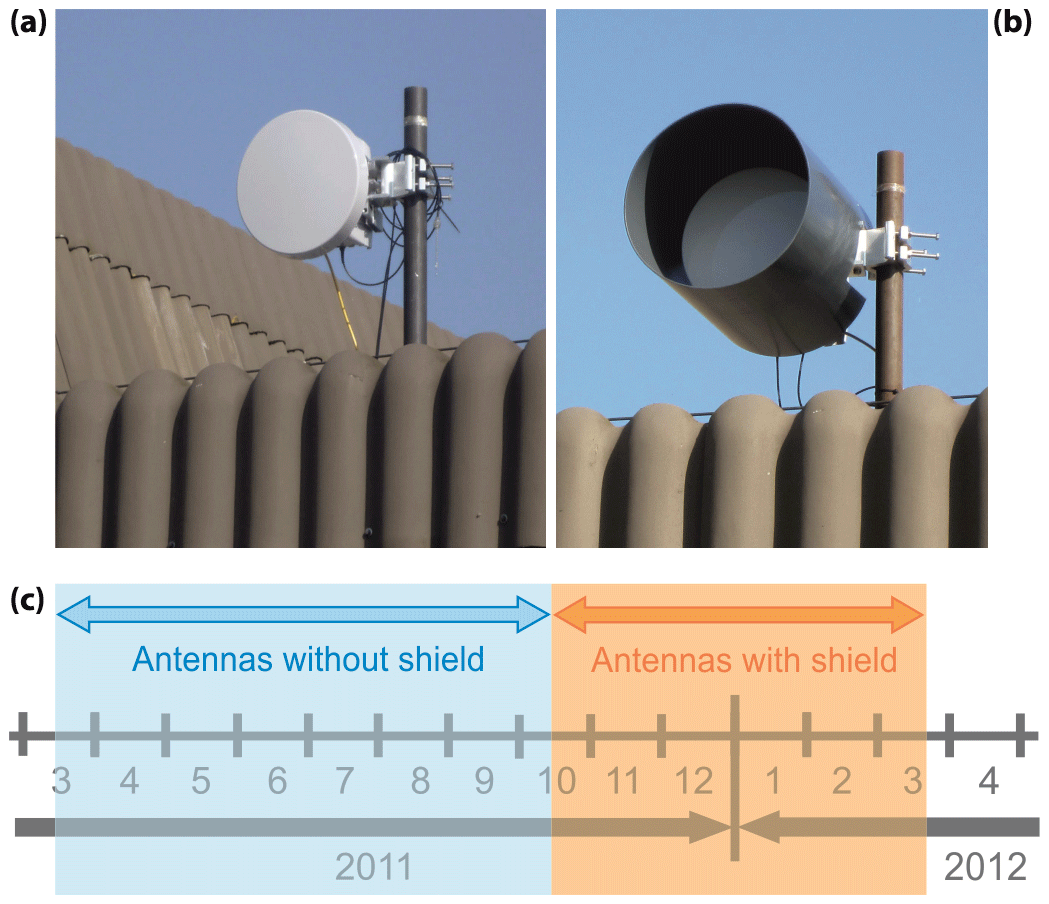
Figure 2(a, b) Outdoor unit of the dual-polarized MINI-LINK and the antenna radome without (a) and with custom shield (b). (c) Timeline of the operational period of the shielding of antenna radomes.
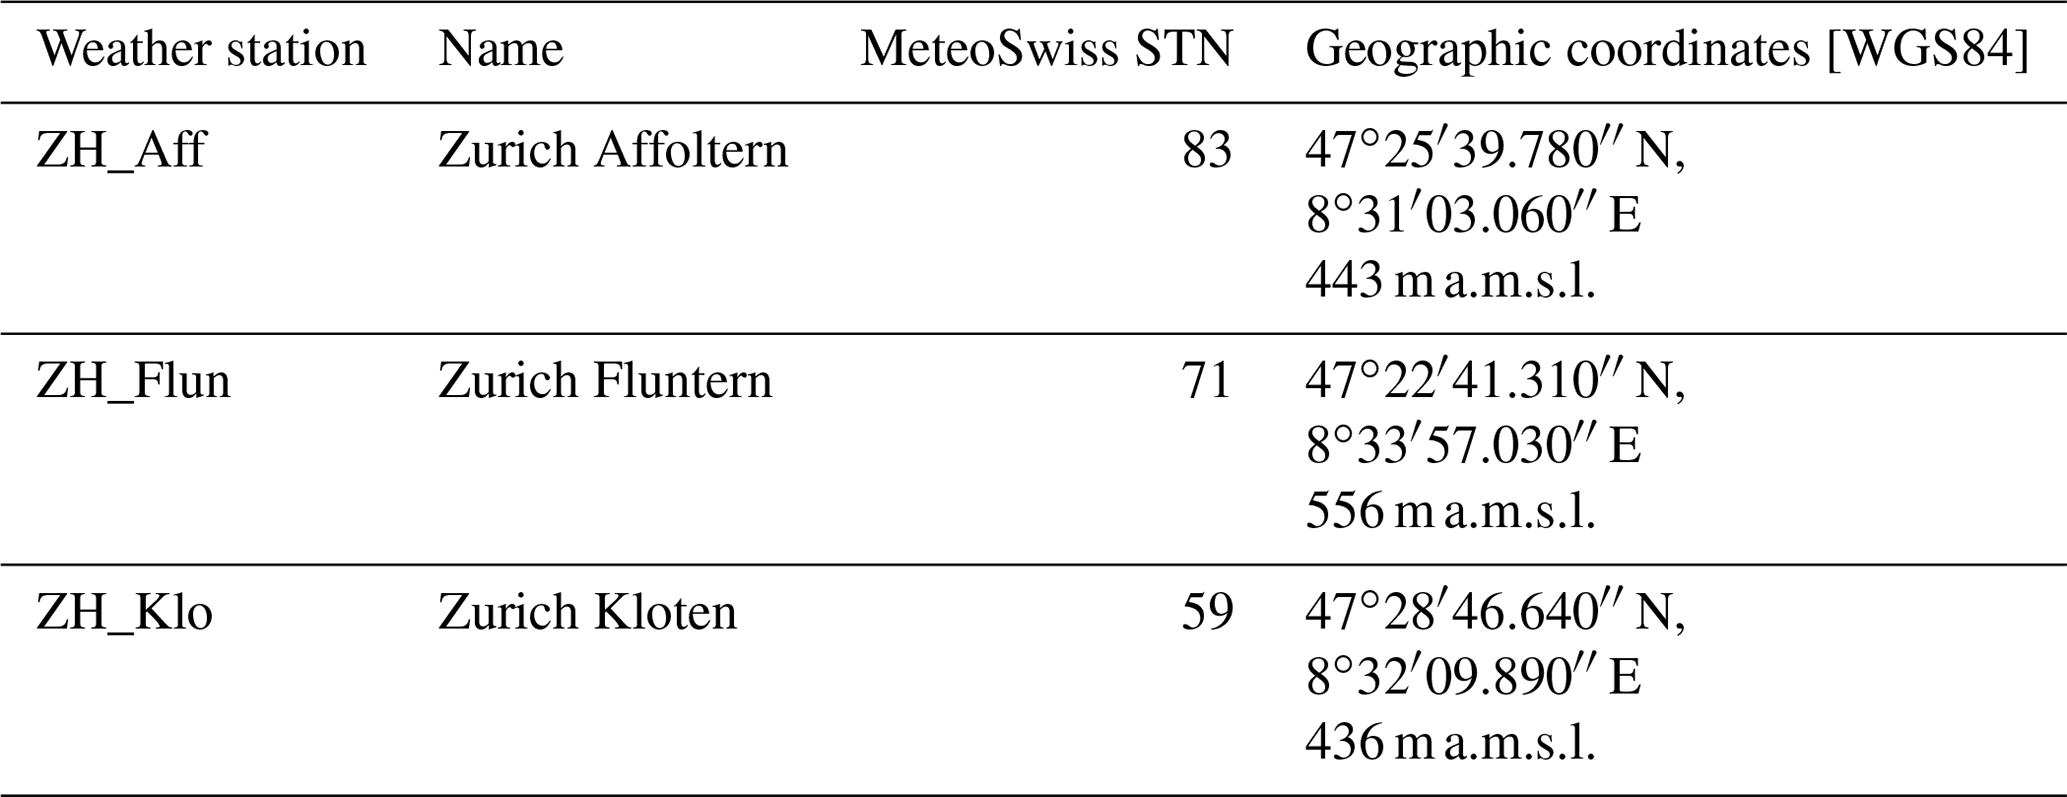
The campaign was launched on 9 March 2011 when the disdrometers and tipping bucket rain gauges were deployed. On 17 March 2011 two radio units of the CML were installed. The collected dataset is enhanced by the meteorological data (MeteoSwiss, 2020) obtained from MeteoSwiss (the Federal Office for Meteorology and Climatology in Switzerland) for the duration of the campaign. The weather stations are located in Zurich within 6 to 10 km of the experimental area (Table 2). Moreover, observations from two other weather stations located at the airport (Table 3) provided additional data for the time period from 1 March to 26 September 2011. The campaign ended on 21 March 2012.
Table 1Locations of the sites and deployed devices.
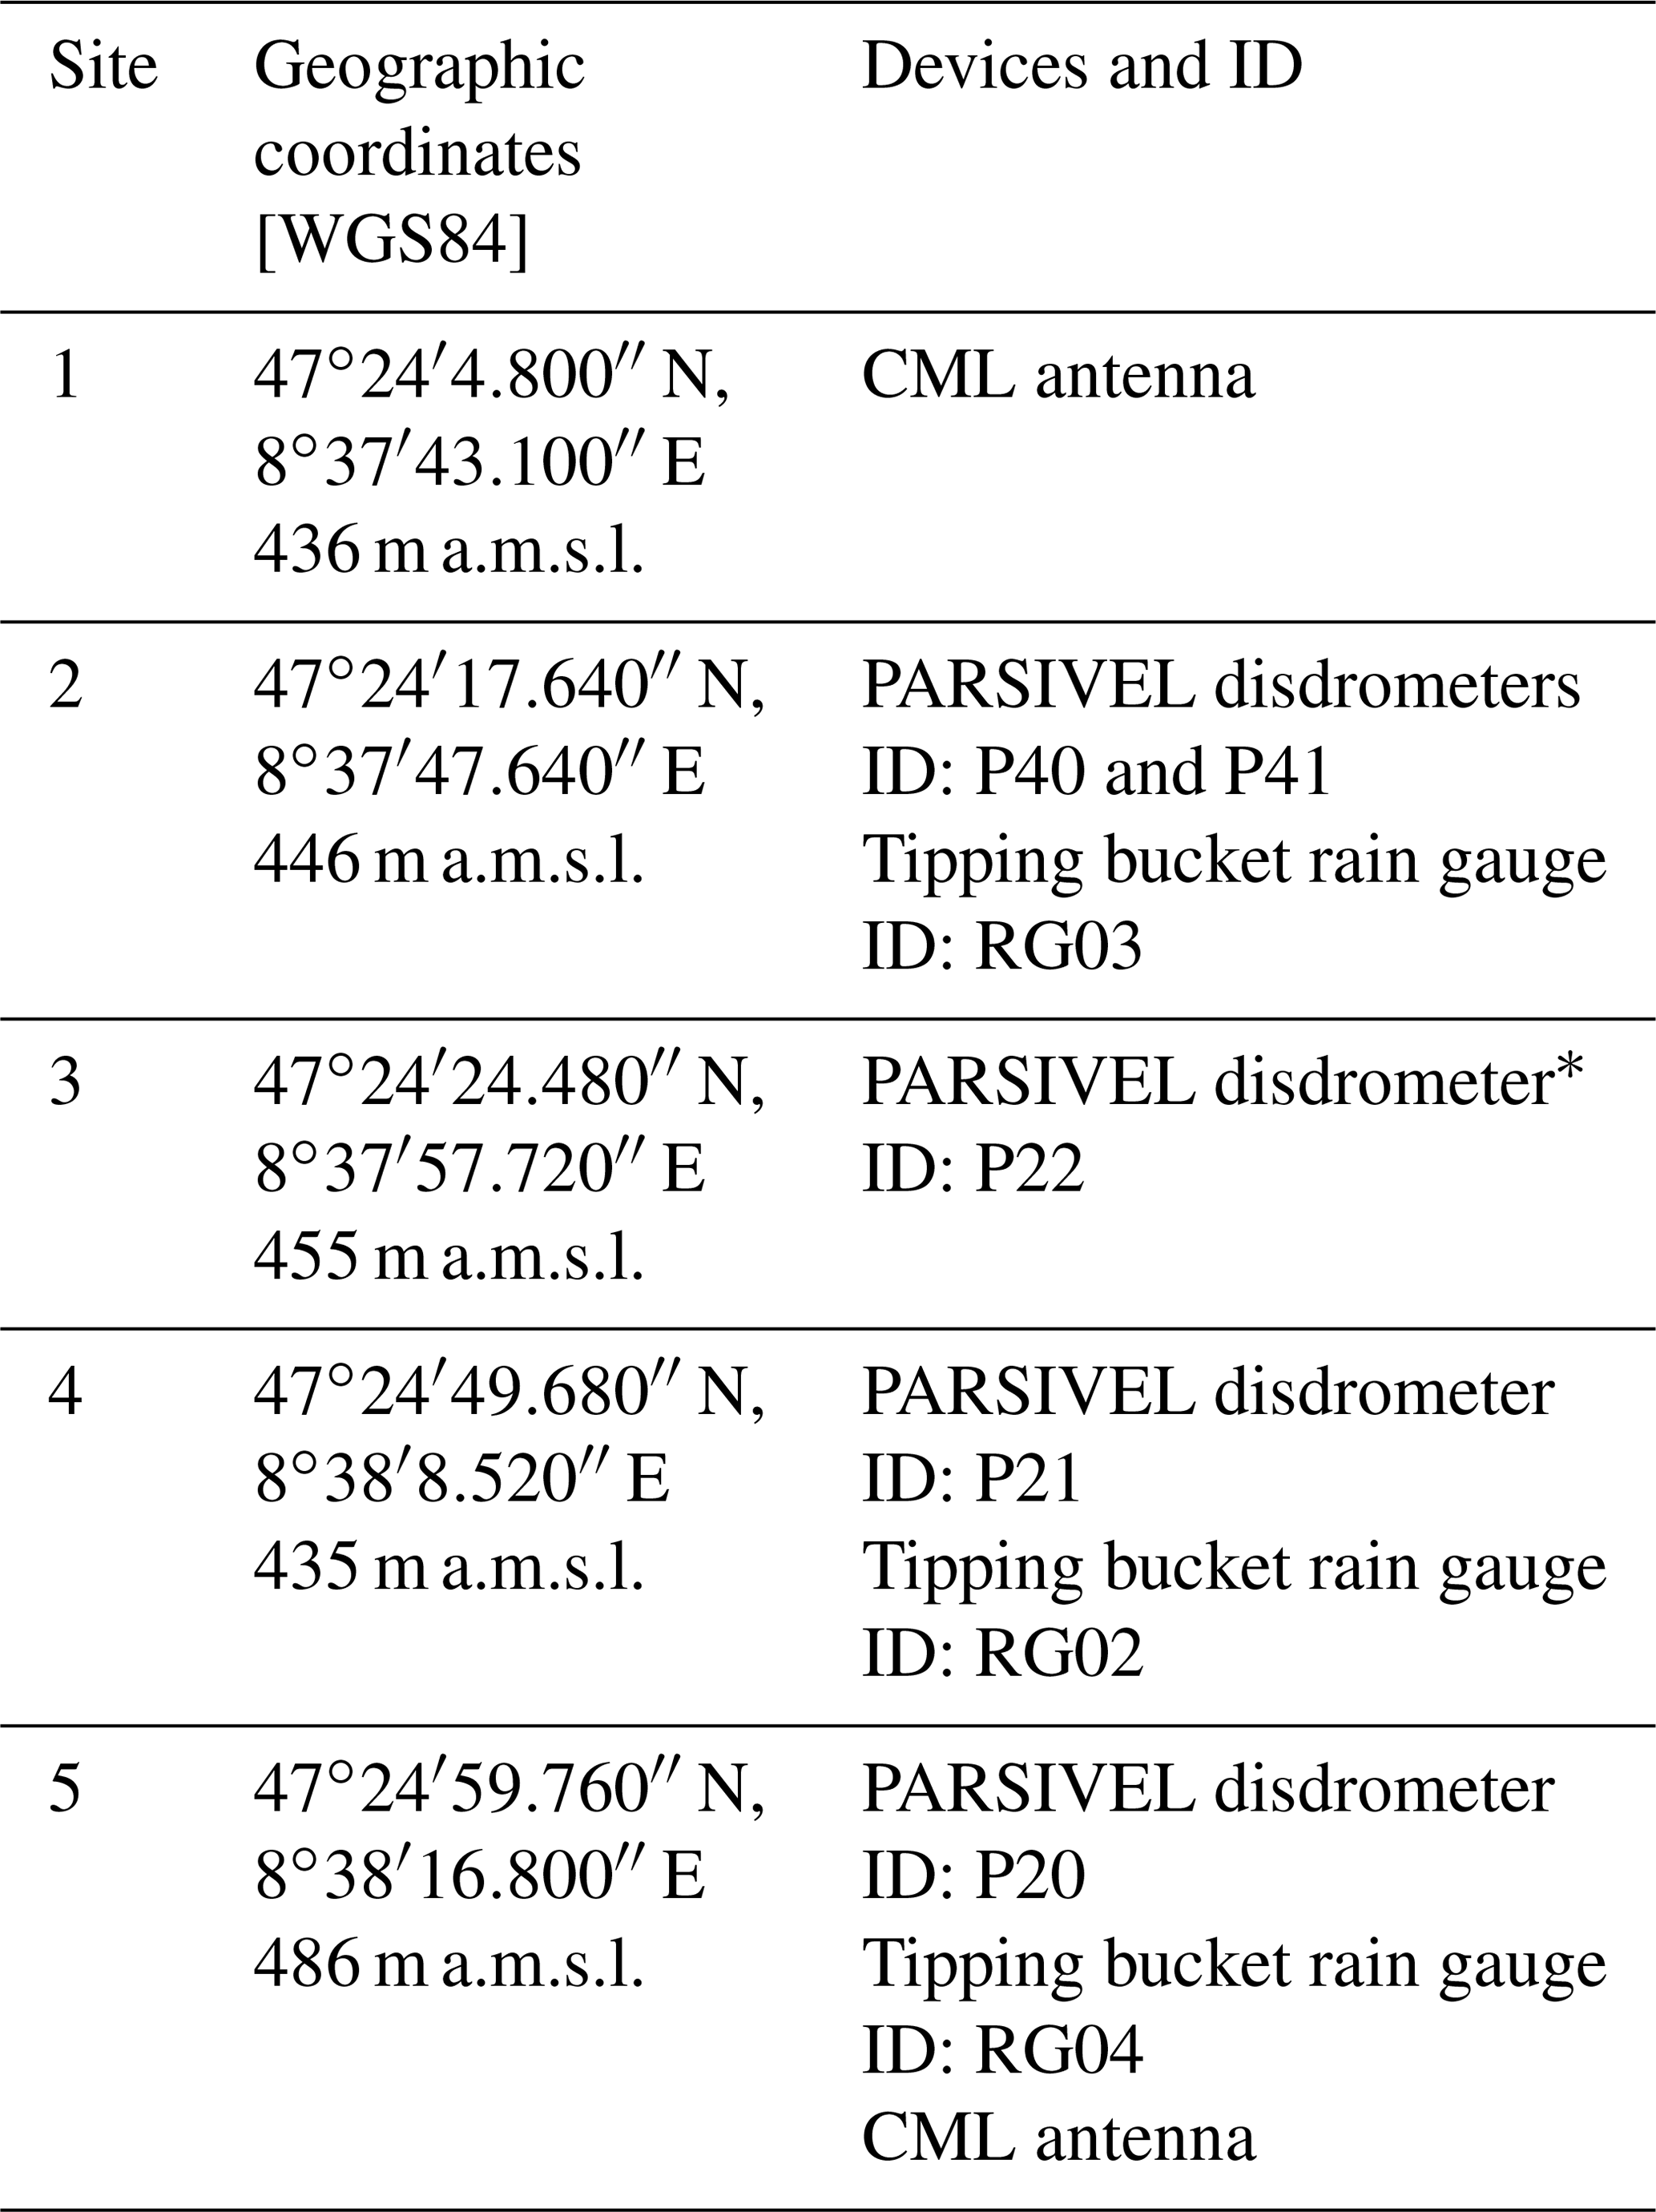
* Note: the only site with unrestricted access
2.3 Instrumentation
2.3.1 Commercial microwave link
The CML consisted of two MINI-LINK outdoor units manufactured by Ericsson comprising a radio and a MINI-LINK antenna (ANT20.3 38 HPX, model no. UKY 210 75/DC15 SH) with a diameter of 30 cm. The MINI-LINK is a duplex dual-polarized link that has two communication channels with a horizontal and a vertical polarization. The resolution of the transmitted power (Tx) was 1 dBm, and for received power (Rx) it was dBm expressed to one decimal place. The horizontally polarized electromagnetic (EM) waves were transmitted at frequencies of 38 657.5 MHz from site 1 and 37 397.5 MHz from site 5. The vertically polarized EM waves were transmitted at frequencies of 38 650.5 MHz from site 1 and 37 390.5 MHz from site 5. The length of the link was 1850 m. The antenna at site 1 was deployed 6 m above ground, and the antenna at site 5 was deployed 5 m above ground. The CML path was not horizontal, the antennas at sites 1 and 5 were located 442 and 491 m a.m.s.l., above mean sea level, respectively (with 1.52∘ to the horizontal plane). Measurement intervals were changed from the original 15 min setup to 4 s (instantaneous reading). Data were acquired by a software application based on Simple Network Management Protocol (Wang et al., 2012). During the measurement campaign, plastic shields were installed on the antennas on 6 October 2011 to avoid water films on the antenna radomes and to eliminate wet antenna attenuation due to rainfall. However, the wet antenna attenuation due to dew cannot be prevented.
The metadata sheets for the CML can be found in the Zenodo repository.
2.3.2 Laser optical disdrometers
Raindrop information was collected by the first generation of the PARSIVEL optical disdrometer manufactured by OTT Hydromet and retrofitted by EPFL-LTE to allow for remote access and data transfer (Jaffrain et al., 2011). The horizontal laser beam had an area of 54 cm2. The beam was oriented perpendicularly to the dominant wind direction in order to limit undersampling and splashing. The devices were deployed as far as possible from possible sources of turbulence and wake (roof edges and other obstacles). The cobwebs were not specifically prevented and they were not observed during the field visits. The measurement principle is based on the attenuation in received voltage and on the time required for the passage of a particle through the laser beam. From this, the terminal fall velocity and the equi-volumetric drop diameter can be estimated. The PARSIVEL rain rate (parameter 05 in Appendix C) retrieval is linked to the drop diameter. Drops larger than 1 mm are assumed to have an oblate shape with linearly decreasing axis ratio (i.e. the axis ratio between the vertical and horizontal dimensions of the drops) down to a value of 0.7 for 5 mm drops (Battaglia et al., 2010; Löffler-Mang and Joss, 2000). Data were categorized into 32 non-equidistant velocity classes and 32 non-equidistant diameter classes (see Appendices A and B). The first two diameter classes were always empty since they were outside the measurement range of the device. The sampling resolution was 30 s.
The metadata sheets for the laser optical disdrometers can be found in the Zenodo repository.
2.3.3 Tipping bucket rain gauges
The co-located tipping bucket rain gauges (3029-1, Précis Mécanique) were the same type of model and had been dynamically calibrated (Humphrey et al., 1997). The devices were deployed as far as possible from possible sources of turbulence and wake (roof edges and other structures). Deployed 50 cm from the ground (35 cm of the device itself and 15 cm of piece of wood and concrete), they had a sampling area of 400 cm2. Their bucket content of 4 g corresponded to the resolution of 0.1 mm of rain. The rain gauges were equipped with neither wind protection shields nor heating, but only six snow and four mixed precipitation events were observed during the campaign. The loggers had a time resolution 0.1 s, and their time drift was less than 2 min per month. The data were saved in the internal memory and downloaded on site.
The metadata sheets for the tipping bucket rain gauges can be found in the Zenodo repository.
2.3.4 Weather stations
Comprehensive weather data are provided by three additional weather stations operated by MeteoSwiss and located 8.9 km (Affoltern), 5.9 km (Fluntern), and 10.9 km (Kloten) from experimental site 3 (Fig. 1a) in azimuths 285, 238, and 318∘, respectively. Data were extracted using CLIMAP software provided by MeteoSwiss. The metadata sheets for the MeteoSwiss stations can be found in the Zenodo repository.
In addition, there were two stations of the Automatic Weather Observation Systems (MIDAS IV, Vaisala) at the Dübendorf airport. The MIDAS IV system employed two sensors at both ends of the runway as these weather stations provide data primarily used for airport operations. The temporal resolution varied between 3 and 60 s depending on the weather parameter. Complete metadata sheets could unfortunately not be compiled from information provided by Dübendorf airport staff.
2.4 Measured variables
CML attenuation data are available between 18 March 2011 and 15 April 2012. The data are given “as is”, i.e. without any processing or filtering. The columns of the microwave link data files are organized as described in Appendix E. The sampling interval of the instantaneous readings was 4 s. Missing observations are denoted by “NA”. Figure 3 presents an example of the observed received power for 22 June 2011.

Figure 3Example of measured received power for 22 June 2011 when antennas were not shielded. Green colours label the direction from site 1 to site 5 (D → W) and blue W → D. Light colours depict horizontal polarizations, and dark colours depict vertical polarization. Vertical red lines indicate NA values (not present during this event).
The disdrometers collected data from 11 March 2011 (for P41 from 16 April 2011) to 29 April 2012, and the disdrometer files provided raw data collected by PARSIVELs at 30 s resolution (see Appendix C for details). The eight types of precipitation (parameter 07 and 08 correspond to precipitation codes according to SYNOP; see Appendix D) were classified based on a velocity–diameter relationship (Löffler-Mang and Joss, 2000). The code corresponds to the specific precipitation type and its intensity (OTT, 2006). Parameter 16 registered the status of the optical lenses. The raw spectrum of 32×32 drop counts is in parameter 21 (diameter classes × velocity classes). Figure 4 illustrates the observations of the disdrometers.
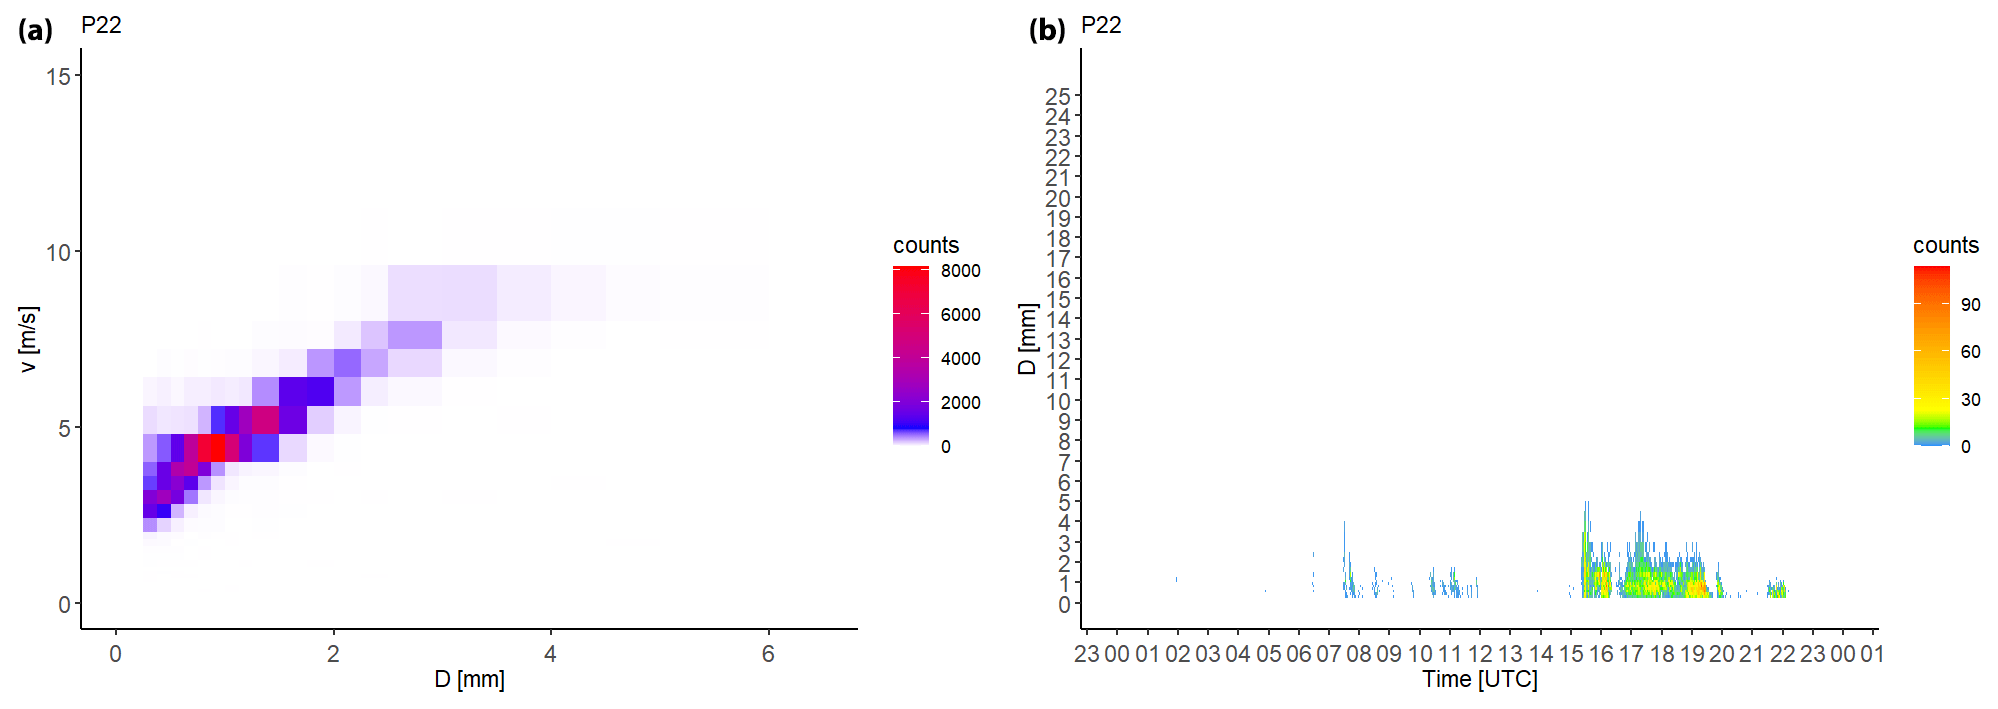
Figure 4Example of disdrometer data for 22 June 2011 at site 3 (disdrometer P22). (a) Scatter plot of the number of drops according to the velocity (terminal fall speed) and size (equi-volumetric drop diameter) classes. (b) Temporal evolution of the DSD.
The tipping bucket rain gauges collected data from 12 March 2011 (for RG04 from 17 March 2011) to 21 March 2012 (for RG04 to 20 March 2012). The rain gauge data had been partly processed. The regular temporal sampling resolution was set to 1 min, and the leap year (29 February 2012) had been accounted for. The columns of the data files were organized as described in Appendix F. Missing measurements are denoted by “NA”.
The comparison of cumulative rain of the three rain gauges and five disdrometers for the whole period of the campaign is presented in Fig. 5. It can be seen that both types of devices are in good agreement in general.
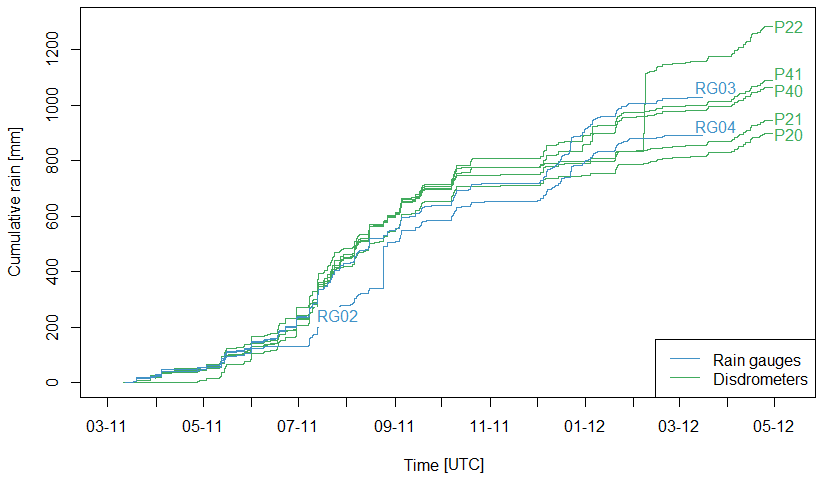
Figure 5Comparison of cumulative rain of the three rain gauges and five disdrometers. There were several outages, suspicious measurements and technical issues recorded, such periods are further described in Sect. 2.5. Despite this, both types of devices are generally in good agreement.
The atmospheric variables of the MeteoSwiss weather stations, collected for the time period from 1 March 2011 to 22 April 2012, are presented in Appendix G. There are 14 parameters in total, including air temperature, air pressure, wind, precipitation, sun radiation, sunlight duration, and dew point. The variables were recorded with a 10 min resolution.
The airport weather station data, collected for the time period from 1 March to 26 September 2011, contain monitored standard meteorological parameters such as temperature, dew point, relative humidity, pressure, rain intensity, and wind speed and direction with columns organized as described in Appendix H.
All measured variables are recorded in UTC.
2.5 Data quality and reliability
Field visits were conducted on 15 April 2011, 6 July 2011, 19 October 2011, 1 November 2011, and 16 March 2012 to maintain the instruments. In general, very little maintenance was necessary on the instruments during the frequent field visits. On 15 April 2011, the minor levelling corrections and data collections for all the rain gauges were done. On 6 July 2011, the batteries were replaced in all the rain gauge data loggers and the data were collected. On 19 October 2011, RG04 was inspected and no problems were found. On 1 November 2011, RG02 and RG04 were inspected with no reported issues. On 16 March 2012, RG02 was found blocked by a leaf and had empty batteries. The RG02 lagged laptop time by approximately 7 min. The difference between RG03 time and UTC was −00:05:31. The difference for RG04 was −00:02:28. Only the leap year had been corrected. The rain gauges were dynamically calibrated in the laboratory.
The CML had almost no technical issues that caused problems with data collection. Nevertheless, the unit at site 1 (Dübendorf) was not working properly in the period between 16 September and 9 October 2011 where no data is available.
The disdrometers P20, P21, and P22 did not provide uninterrupted data between 14 October and 4 November 2011. All disdrometers partially malfunctioned between 7 December 2011 and 14 January 2012 and between 26 January and 3 February 2012 from the undersupplied solar panels during winter. A significant overestimation of rainfall occurred on 7 and 8 February 2012 when P22 measured around 300 mm of cumulative rainfall. Unfortunately, site 3 did not provide data from a co-located rain gauge for comparison. The filter presented in Jaffrain and Berne (2011) can be used to remove dubious measurements. Disdrometer locations and orientations were chosen to minimize wind disturbances, staying as far away from sharp corners and tall objects as possible. Cobwebs were not observed during the field visits.
The rain gauges were deployed with adequate distance from trees and bushes to minimize the influence of wind whirling and clogging by leaves. However, one of the tipping bucket rain gauges faced technical issues that constrained the data collection. The greatest data availability gap, due to low batteries, happened at site 4 (RG02) between 6 July 2011 and 16 March 2012.
Figure 5 presents a comparison of cumulative rain collected by the rain gauges and disdrometers and shows a good temporal match of measured data. The outages of disdrometers between December and February described above caused the underestimation of rain amounts during this period. RG02 corresponds to RG03 for the entire time period when it was in operation. RG04 was blocked from the middle of June until 6 July 2011. There was also unrealistic rainfall recorded by RG04 on 24 August 2011. In total, 139.7 mm of rainfall were measured within 2.5 h, probably an artefact due to vandalism. The co-located disdrometer (P20) also showed a dissimilar temporal evolution of rain rate to the other disdrometers. Both quality issues appeared at site 5 and were probably caused by moving of the instrumentation during lawn mowing.
The data from the weather stations of MeteoSwiss and the airport are rather continuous and consistent.
Appendix J presents the data availability of the devices during the campaign period.
3.1 Description of raw data
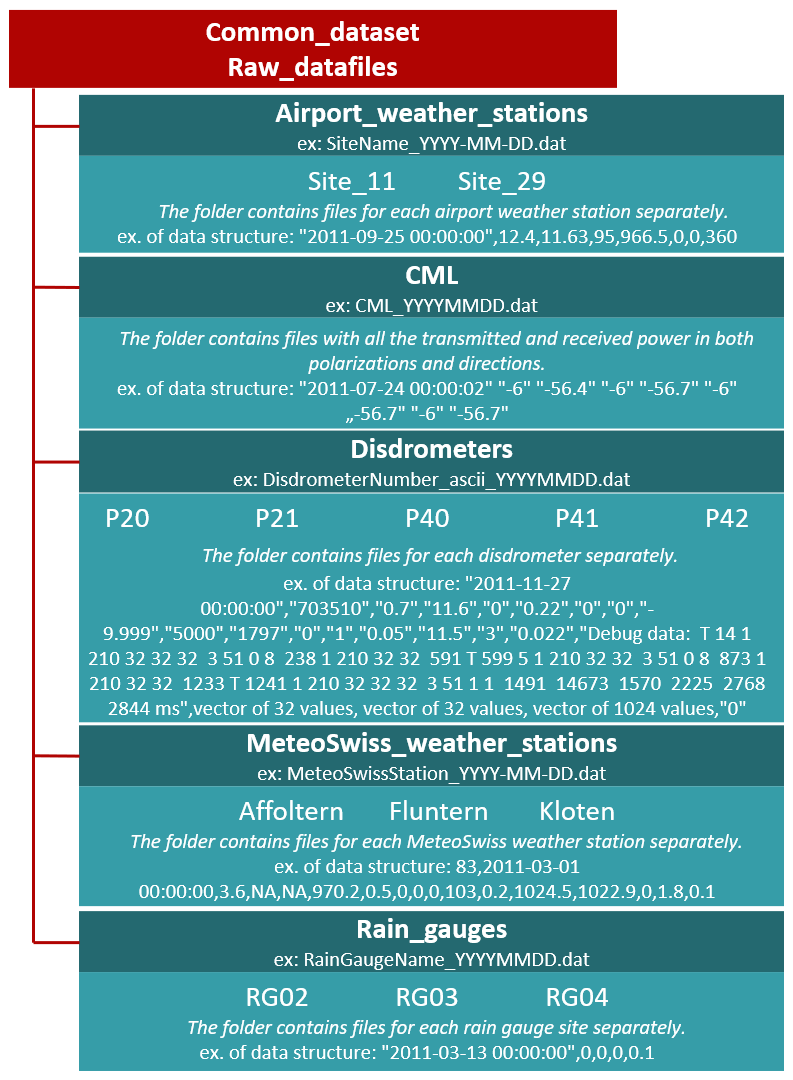
The raw data files are stored in various ASCII formats in folders based on the device and weather station and are available at daily resolution. The files are organized as depicted in Fig. 6. Filename format examples are presented for each folder.
3.2 Tool and HTML viewer
To facilitate the efficient exploration of the data plots, the HTML file makes it possible to readily plot pre-defined views of a selected day. The folders are related to the main data sources: the CML, the disdrometers, the rain gauges, and the MeteoSwiss and airport weather stations. The intensity of the red colour in the campaign calendar describes the daily cumulative rainfall depth, based on RG03, which enables the user to choose the most interesting days and explore them further. Once the day is selected, the plots in each folder are displayed.
There are eight pre-defined views in the drop-down menu in the viewer. The first view plots CML data accompanied by data from RG03 from site 2, which is located in the middle of the link path. Views two and three present rainfall intensities from the disdrometers, missing values, and drop size distributions. The fourth view displays rain gauge data and its missing values. Views five and six display the data and missing values from the airport weather stations, and the last two views concern the data and missing values from the MeteoSwiss weather stations. Note that November 2012 was extremely dry, and therefore no rainfall was recorded.
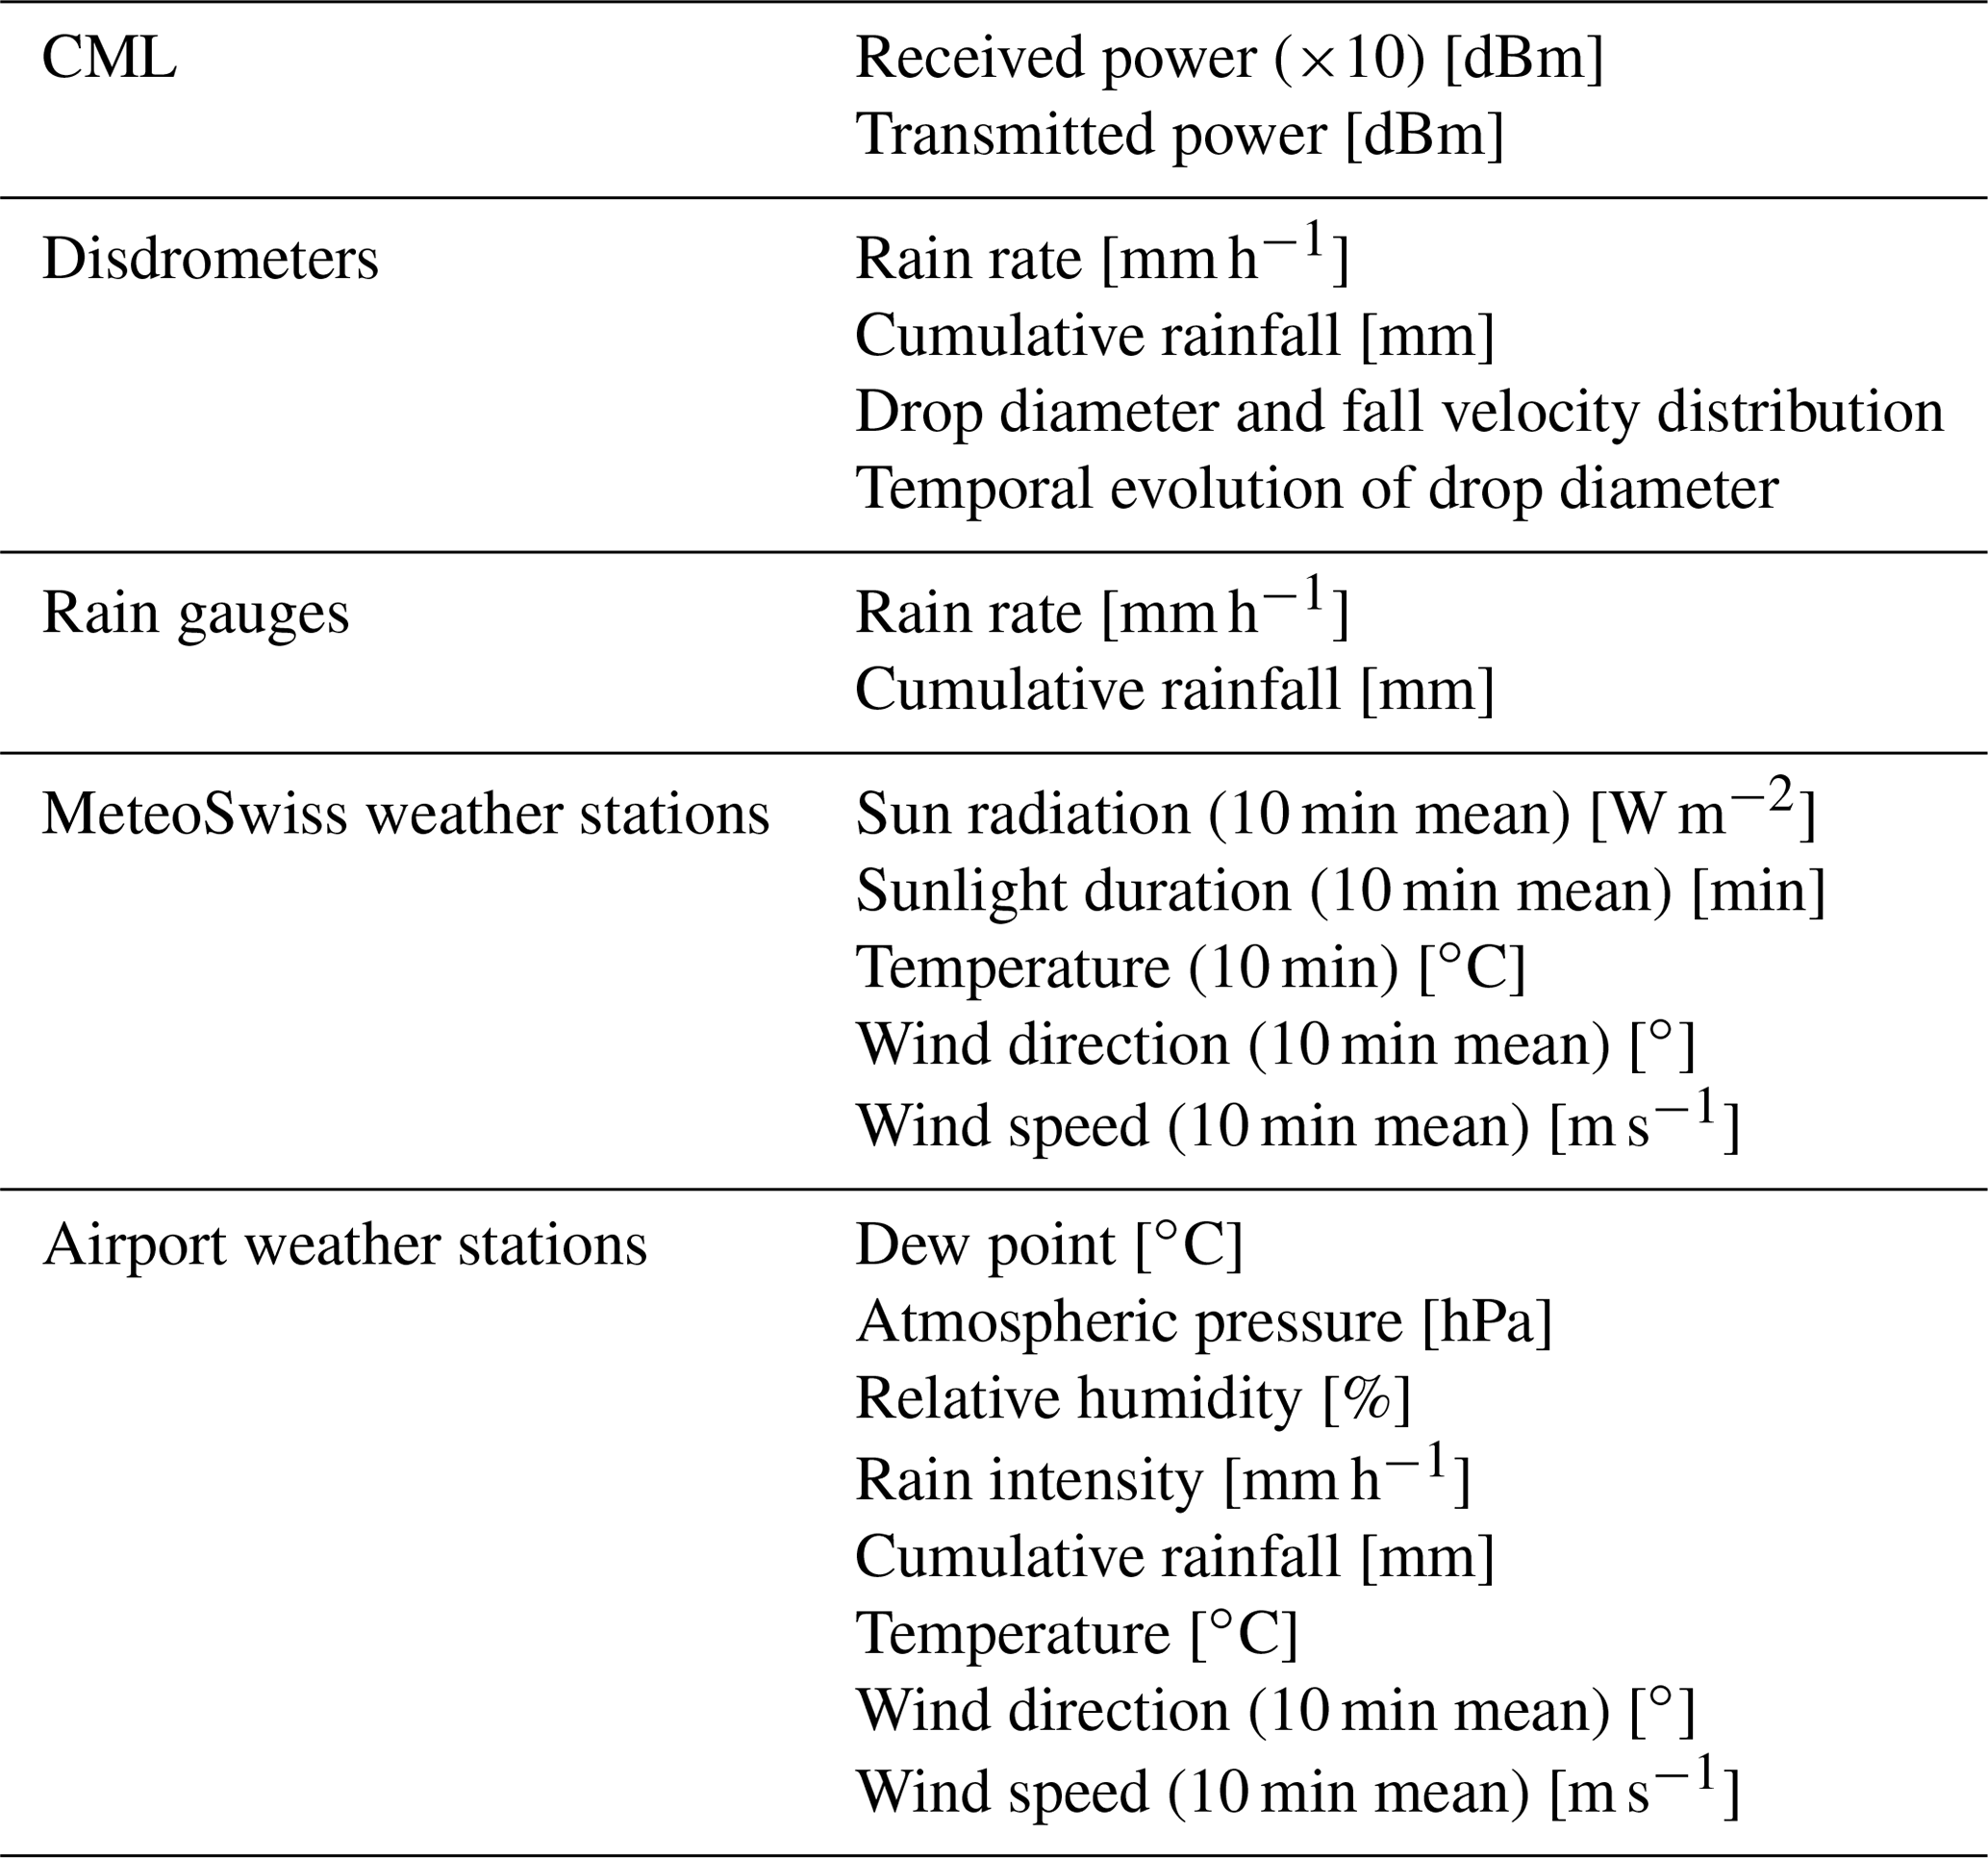
Table 4 summarizes the daily plots of measured quantities. All plotted quantities are accompanied by a plot of missing values. Each column in those figures represents 1 h of the day. The proportional amount of missing values in each hour is displayed in red.
Table 4Summary of quantities and their units displayed as daily plots in the html viewer.
The following section contains a short review of important open issues related to rainfall estimation using microwave links for which the CoMMon field campaign provides relevant data and could give valuable input in future research.
4.1 Former applications
4.1.1 Dry and wet classification and baseline estimation
Based on the dataset, Wang et al. (2012) developed a new algorithm for classifying dry and wet periods and estimating baseline attenuation using a Markov switching model that outperformed a previous method based on the standard deviation of link attenuation over a moving time window by Schleiss and Berne (2010). Using factor graph theory and robust local linear regression, Reller et al. (2011) and Schatzmann et al. (2012) used the CoMMon dataset to develop two alternative baseline models with similar offline and online performances.
4.1.2 Wet antenna attenuation
Based on data collected during the CoMMon experiment, Schleiss et al. (2013) quantified the magnitude and dynamics of wet-antenna attenuation (WAA) affecting commercial microwave links at 38 GHz. They found WAA values on the order of 1–2 dB, with an upper bound at about 2.3 dB. Furthermore, WAA increased exponentially during the first 5–20 min of rain and decreased exponentially as soon as the rain stopped. Figure 7 presents an example of the attenuation pattern caused by a wet antenna. The rate at which WAA decreased after an event showed substantial variation, ranging from a few minutes to several hours depending on temperature, wind, and humidity. In a follow-up study, Fencl et al. (2014) assessed the effectiveness of direct antenna shielding for mitigating WAA compared with post-processing techniques. They found that antenna shielding helps to substantially reduce bias in rainfall estimates. However, shielding did not outperform model-based corrections as signals from shielded antennas still experienced attenuation, even when the face of the radome was completely dry. Whether this is caused by the attenuation of side-lobes or these are effects caused by changes in the scattering and reflection behaviour of the surrounding buildings, such as nearby walls, roofs, or impervious surfaces, during wet weather is currently unknown.
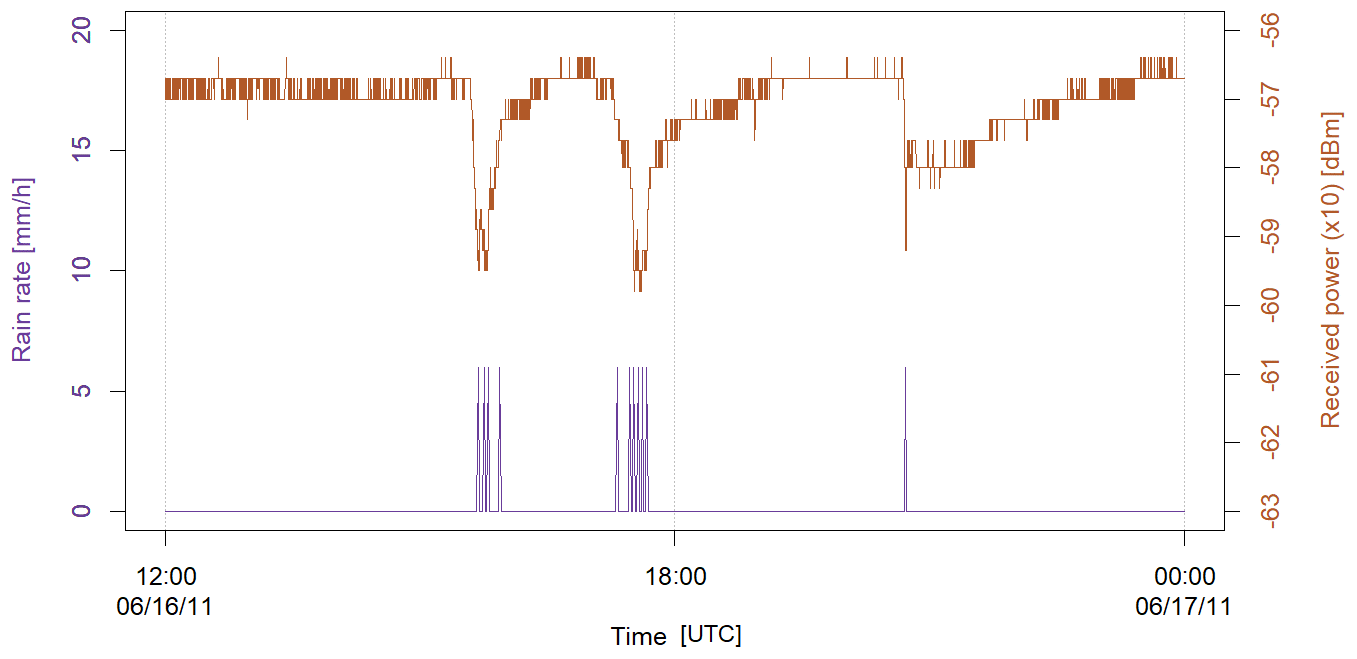
Figure 7Wet antenna attenuation pattern. Rainfall causes signal resulting in residual wetness on the surface of the radomes. The return of baseline attenuation to previous dry-weather levels is attributed to the drying of the antenna radomes (van Leth et al., 2018). The same behaviour was observed by new E-bands and reported recently in Fencl et al. (2020).
There are still several unresolved questions related to WAA, such as the effect of horizontal and vertical polarization on WAA magnitude or the quantification of WAA during fog and dew events (Fig. 8). For example, de Vos et al. (2019) showed that errors in CML quantitative precipitation estimates are the largest for observations during late night and early morning periods when dew is more likely to form on antennas. van Leth et al. (2018) observed additional attenuation on the order of 3 dB during foggy weather conditions and whenever dew was present on the antennas. To be precise, van Leth et al. (2018) explicitly mention that the theoretical upper limit for attenuation by fog droplets themselves is about 0.75 dB at 38 GHz for a 1 km path and a very high liquid water content of 0.8 g m−3. Therefore, no more than 1.5 dB km−1 can be expected due to the fog itself, and the rest is probably due to WAA. Therefore, reasonable estimates of attenuation during heavy fog are on the order of 2–3 dB of WAA +1–1.5 dB km−1 for the fog itself. Heated antennas would be needed to prevent the formation of dew and/or air blowers were to blow away the water during fog events. However, modelling these effects remains challenging, since the dew-related wetting depends on the weather conditions, as well as on the condition (or presence) of the hydrophobic radome cover. The CoMMon dataset could help gain new insight into these issues, for example, by further investigating WAA due to dew formation on antenna radomes (Fig. 8).
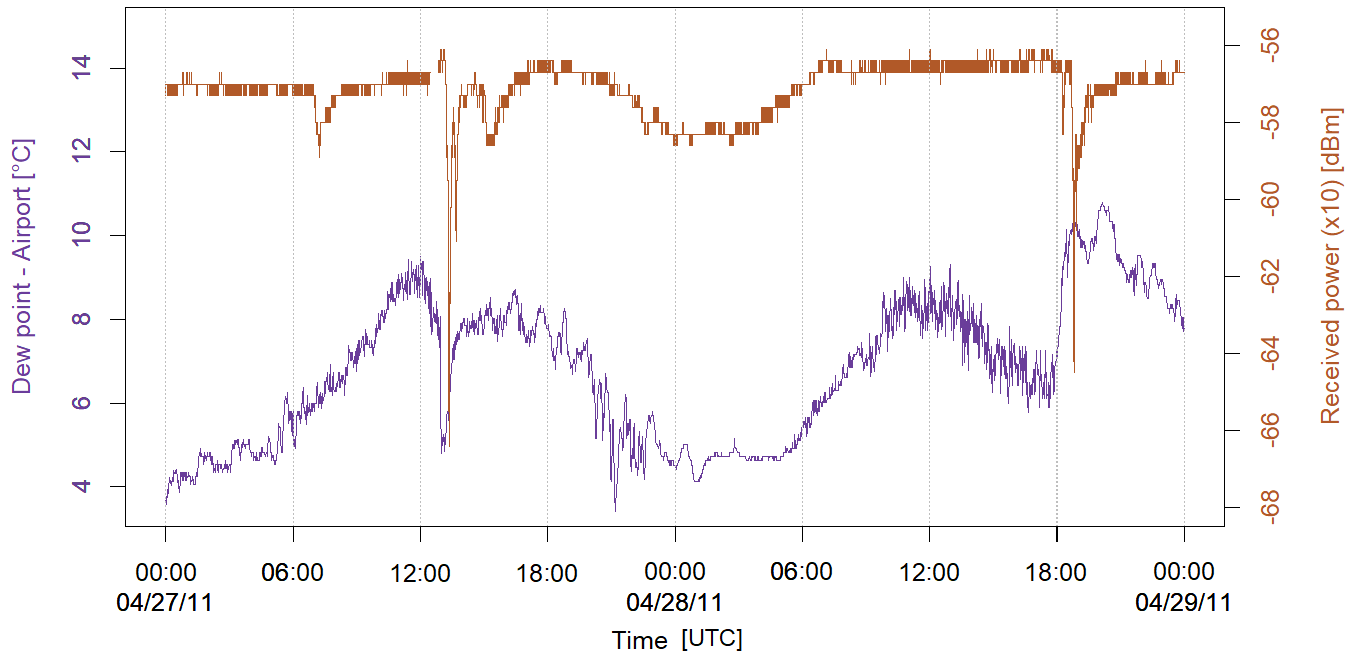
Figure 8Wet antenna attenuation due to dew formation causes substantial attenuation from approx. 18:00 UTC on 27 November 2011 to 07:00 UTC on 28 November 2011.
4.1.3 DSD retrieval and DSD related errors
Attenuation data of CMLs operating at different frequencies or polarizations could (in theory) be used for estimating path-averaged raindrop size distributions (e.g. Rincon and Lang, 2002). Research into this issue is still ongoing. Recently, Song et al. (2019) used a simulation study to illustrate how to retrieve DSDs from dual-frequency dual-polarization links. Another study by van Leth et al. (2020) based on a similar approach showed that reasonable performance on selected events and idealized conditions can be achieved. However, retrieved DSD parameters are not always reliable and large uncertainties remain due to quantization noise, baseline estimation, and wet-antenna attenuation. These could possibly be reduced by using the data to update prior knowledge on empirical drop size distributions using Bayesian data analysis (Cao et al., 2010).
In addition, the high-quality CoMMon dataset could provide the evidence base to test different retrieval techniques and to assess their strengths and limitations.
The data will be useful to better design outage-free radio communication systems. Detailed data on rainfall microphysics and microwave attenuation from operational devices can be extremely contributive to radio engineers (Kvicera et al., 2009).
4.2 Outlook
There are still many unsolved issues regarding how to effectively retrieve precipitation from CML attenuation in praxis. Given the high temporal resolution, the CoMMon data might be most useful in improving our understanding of antenna wetting, baseline dynamics, and the impact of variable DSDs.
First, wet antenna attenuation and dew formation on antennas are phenomena that need to be described more precisely to avoid the overestimation of rainfall. Several studies have suggested that correcting for wet antenna attenuation can significantly enhance results (Leijnse et al., 2008; Pastorek et al., 2021). Corrections probably cannot be based on frequency and signal dynamics alone, as the atmospheric state around the CML varies. In other words, temperature, relative humidity, radiation, and wind probably have a more significant impact on the drying time of the antennas and the conditions prior to wetting. To what extent machine learning (Habi and Messer, 2018) trained on many CoMMon-type datasets can provide an empirical solution remains to be seen.
Second, the baseline of transmitted minus received power is often approximated as constant, even though substantial variations during dry weather have been reported (Wang et al., 2012), and there is little evidence that the baseline remains stationary during wet periods. Different dry–wet weather classification approaches were presented in Schleiss and Berne (2010), Overeem et al. (2011), and Polz et al. (2020). A benchmarking activity with many datasets from different sites and climatic regions is still lacking.
Scattering theory suggests that a larger variation of drop size distribution challenges more precise retrieval for longer links (Leijnse et al., 2010). The disdrometer observations in the CoMMon dataset can also be used to build simulators, making it possible to better understand the attenuation–rainfall relation and assess CML rainfall retrieval uncertainties related to variable DSDs (Berne and Uijlenhoet, 2007; Schleiss et al., 2012). For example, the assumption that the path-integrated DSD can be represented by a simple unimodal distribution (e.g. a gamma or exponential distribution) might not be true for longer links, as rainfall rates and DSDs can exhibit significant heterogeneity along the path of the link. Similarly, for highly localized rain showers, only a small fraction of the link might actually experience rain, and not all antennas will be equally wet or dry at a given time.
Variable DSDs also represent major uncertainties at CMLs with higher frequency bands. Although to date most CMLs use frequencies from 5 to 40 GHz, the spectrum is currently further extended to 80 GHz. Recently, Fencl et al. (2020) used PARSIVEL observations from the CoMMon dataset to simulate rainfall retrieval from an E-band CML, which demonstrated that these may be promising tools for sensing light rainfall, a task that is challenging for lower frequencies due to the quantization of the attenuation data (Berne and Schleiss, 2009). In a similar fashion, CMLs are “blind” regarding extremely high intensities, as attenuation due to such high intensities drops below the receiver threshold of the hardware and causes outages of the CML (cf. the event on 5 August 2011). How this can be solved by “interpolating” missing observations based on signals from nearby sensors (Mital et al., 2020) remains to be seen.
Melting snow causes large attenuation of EM waves at frequencies commonly used by CMLs (ITU-R, 2015). Upton et al. (2007) identified periods with melting snow by analysing attenuation data of dual-frequency microwave links operating at 12.8 GHz/17.6 GHz and 10.5 GHz/17.5 GHz. Ostrometzky et al. (2015) suggested using CMLs operating at multiple frequencies to distinguish between periods with snow, melting snow, and rainfall and thus improve estimation of total accumulated precipitation. Attenuation of EM waves by ice particles, however, remains challenging to simulate due to complex shapes of these hydrometeors. Moreover, ice particles containing liquid water interact with EM waves in a substantially different manner (Eriksson, 2018).
Data from CML, disdrometers and rain gauges, and nearby weather stations are available with data files stored in the Zenodo repository at https://doi.org/10.5281/zenodo.4923125 (Špačková et al., 2021).
The dataset is available for reuse under a CC BY 4.0 license. License terms apply.
The data from the CoMMon field campaign described in this paper are relevant for the remote sensing of rainfall and the design of outage-free terrestrial wireless communication systems. The unique dataset provides a comprehensive package of attenuation data from a 38 GHz dual-polarized CML with concurrent disdrometer and rain gauge measurements at (sub-)minute resolution. In addition, meteorological data from the weather stations of MeteoSwiss and Dübendorf airport were included. The main conclusions are as follows.
-
The remote sensing of precipitation and related atmospheric phenomena, such as dew, remains a relevant problem. Using signals from commercial telecommunication microwave links to learn about these phenomena seems promising because they cover sparsely or completely ungauged regions and can be queried remotely and quickly. The open CoMMon dataset makes a unique contribution by providing dual-polarized transmitted and received power levels, as well as ground-level observations of precipitation microphysics and local weather. It fosters the interconnection of datasets, which can be used to better understand scattering phenomena and benchmark retrieval methods.
-
The dataset represents a duration of 1 year and contains data from (i) a single 38 GHz dual-polarized CML with a length of 1.85 km, (ii) co-located observations of five disdrometers, (iii) three rain gauges, and (iv) observations from five nearby weather stations. Specific highlights are, first, that the antenna radomes were protected by custom shielding for approximately half of the period of the campaign, thus making it possible to investigate the impact of antenna wetting, which is still considered a major disturbance for rainfall retrieval. Second, the data are provided in sub-minute resolutions, making it possible to investigate the detailed dynamics of the involved processes. Third, the dataset contains periods with rain but also periods during which ice hydrometeors including snow and melting snow occurred (see Appendix I).
-
Although the experimental campaign faced expected difficulties regarding sensor malfunctioning, data outages, etc., these episodes are well documented and thus do not compromise the usefulness of the dataset (Appendix J). The provided static HTML viewer also makes it easy to explore the data via pre-configured views of daily time series. For example, by focusing on days with intense or little precipitation, typical dynamics of the observed processes can be screened effortlessly.
-
The dataset contains unique evidence regarding several processes, such as the wetting and drying of antenna radomes and outdoor units or the impact of temperature and wind. We encourage several applications, from investigating baseline separation to wetting phenomena such as dew, which had much slower dynamics in comparison to rain-induced attenuation, to the retrieval of drop size distributions from the joint analysis of horizontal and vertical polarizations.
-
In the future, the CoMMon dataset can be used to further investigate challenging issues in the remote sensing of rainfall, such as the classification of dry and wet periods, space–time variability of DSDs, or even the analysis of fade margins for better radio network design.
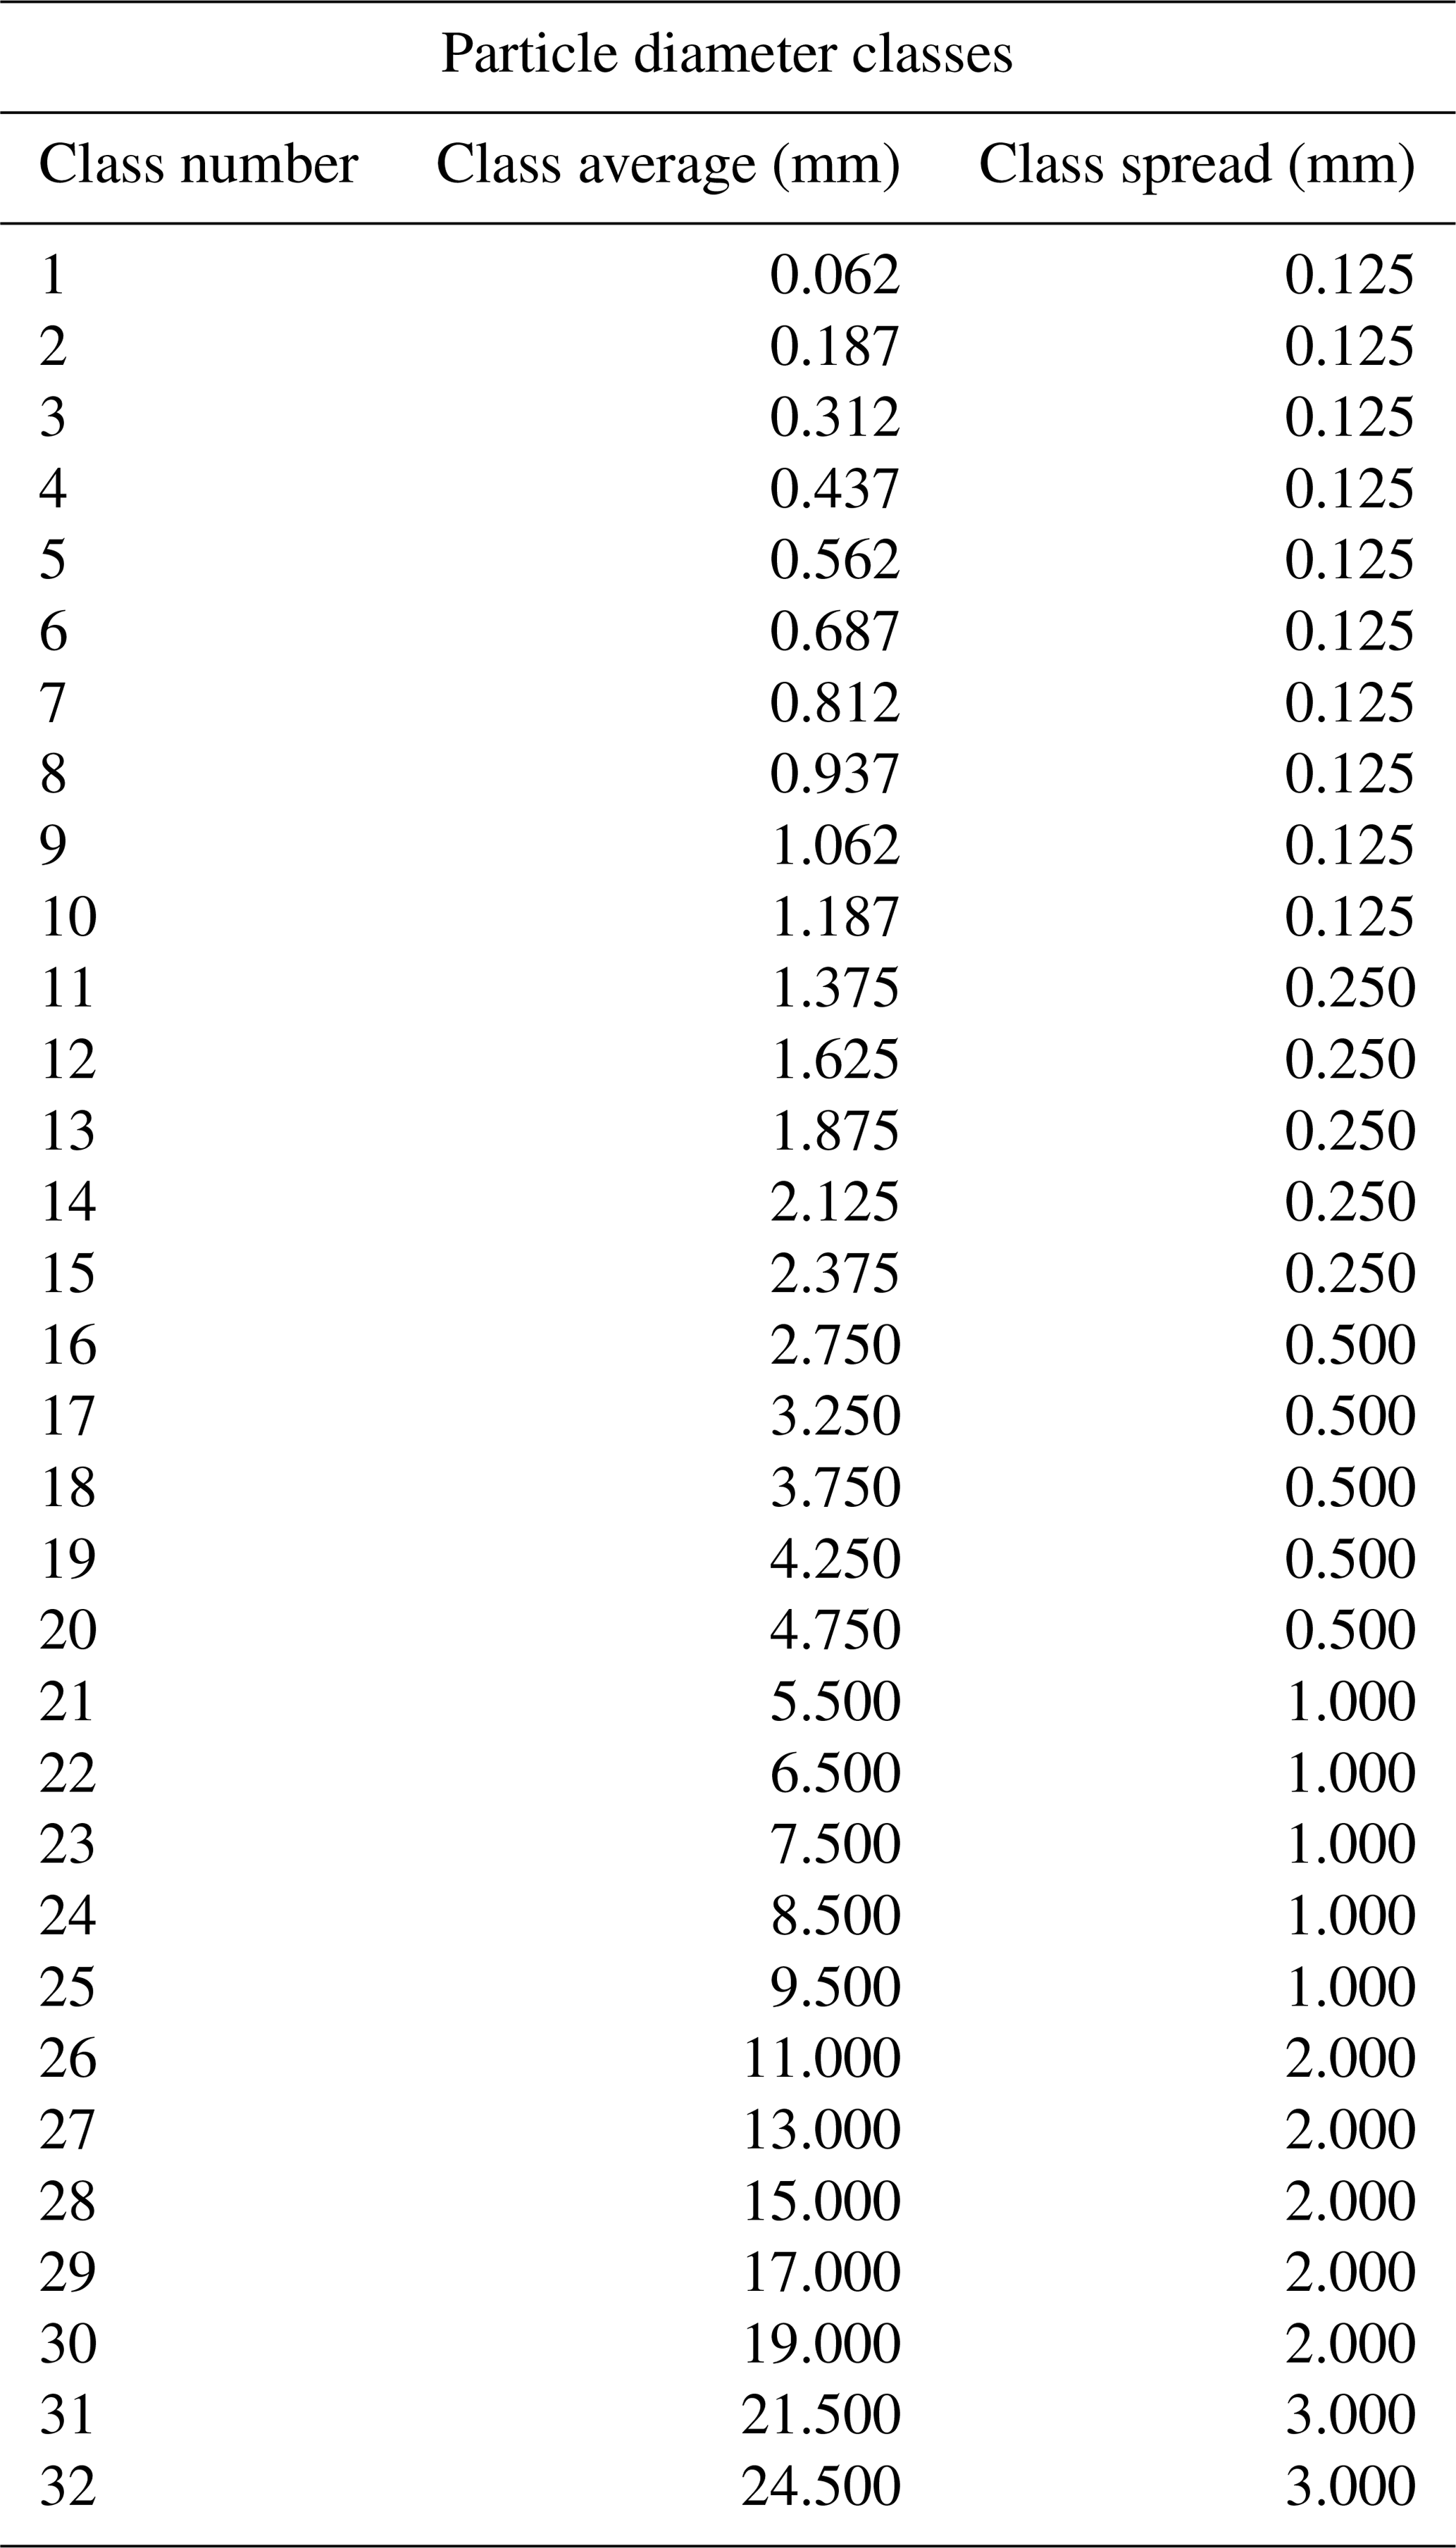

Table C1PARSIVEL raw data parameters.

Parameter 16 registers the status of the optical lenses (0: everything OK; 1: laser protective glass is dirty, but measurements are still possible; 2: laser protective glass is dirty, partially covered, no further usable measurements are possible; 3: laser damaged).
Table D1Precipitation code according to SYNOP.
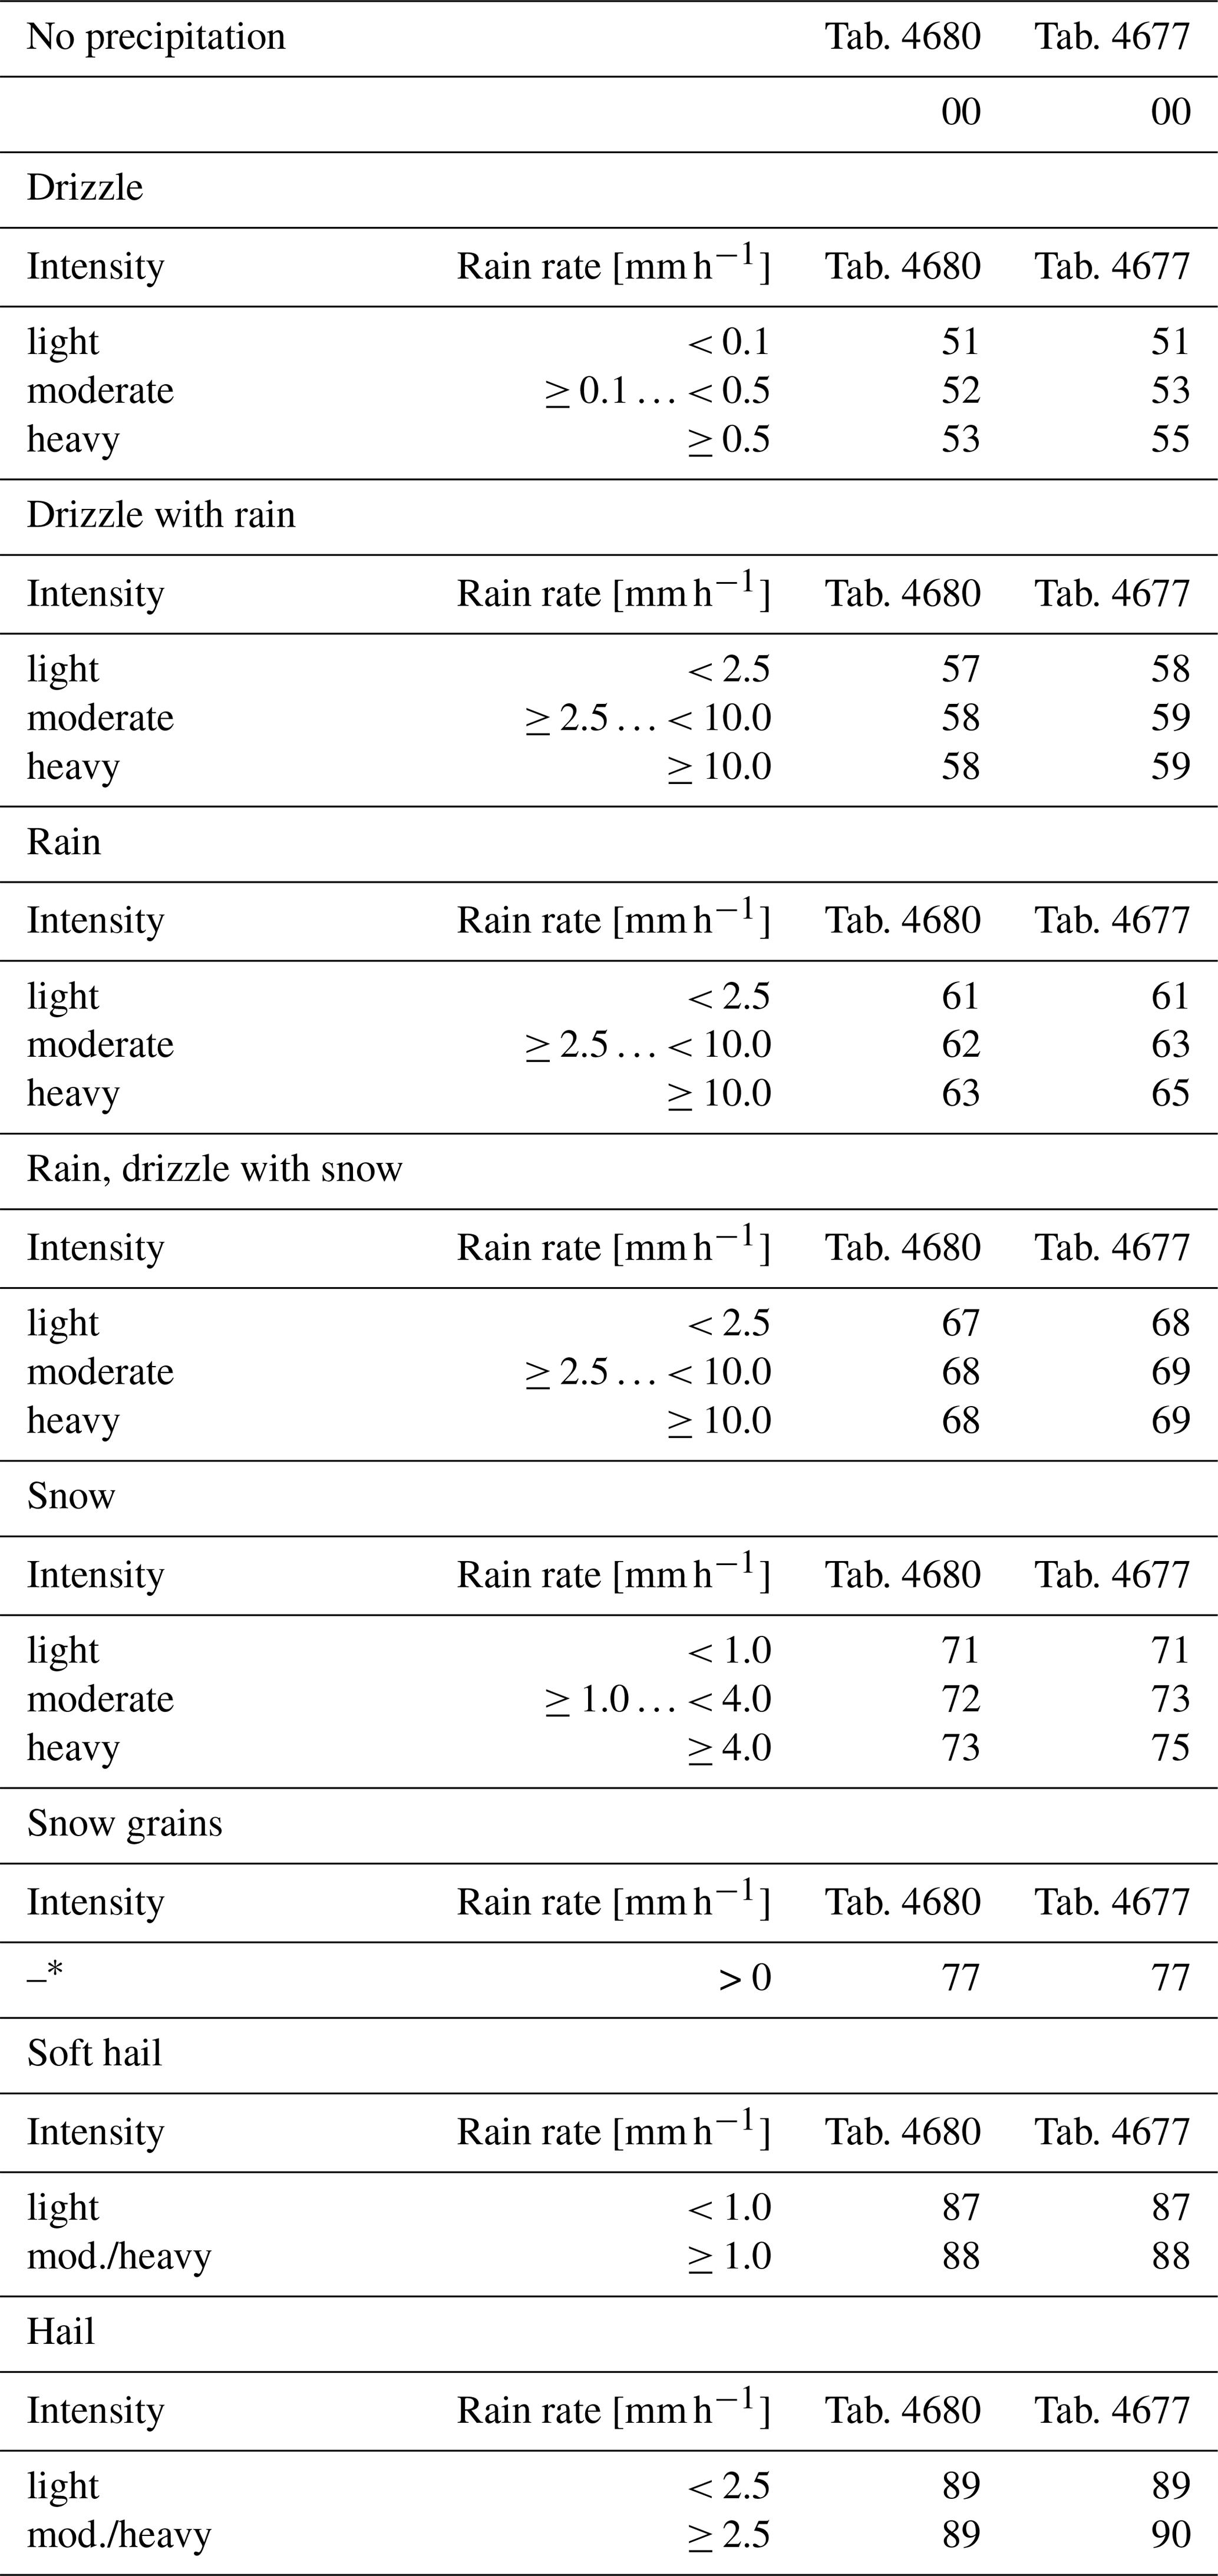
* No classification made
Table E1Measured CML parameters.
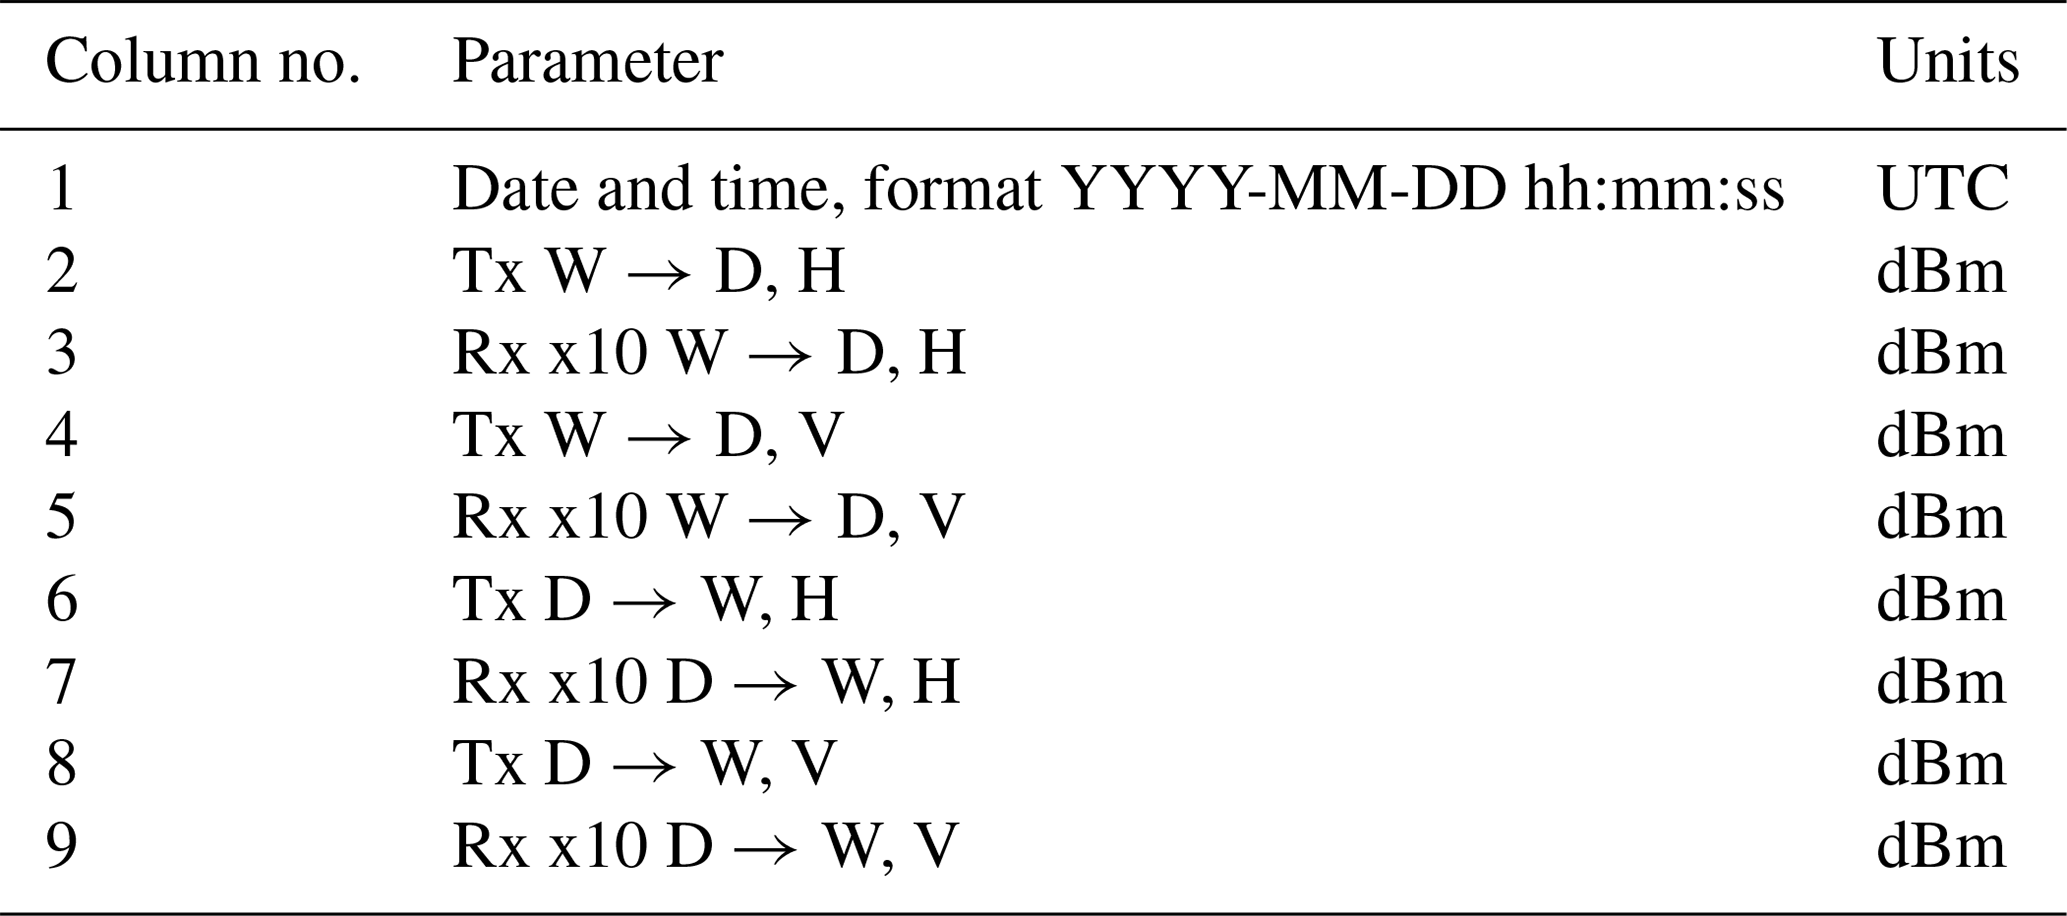
Transmitted power (Tx); Received power (Rx); Horizontal polarization (H); Vertical polarization (V); site 5 – Wangen (W); site 1 – Dübendorf (D); → direction of the signal
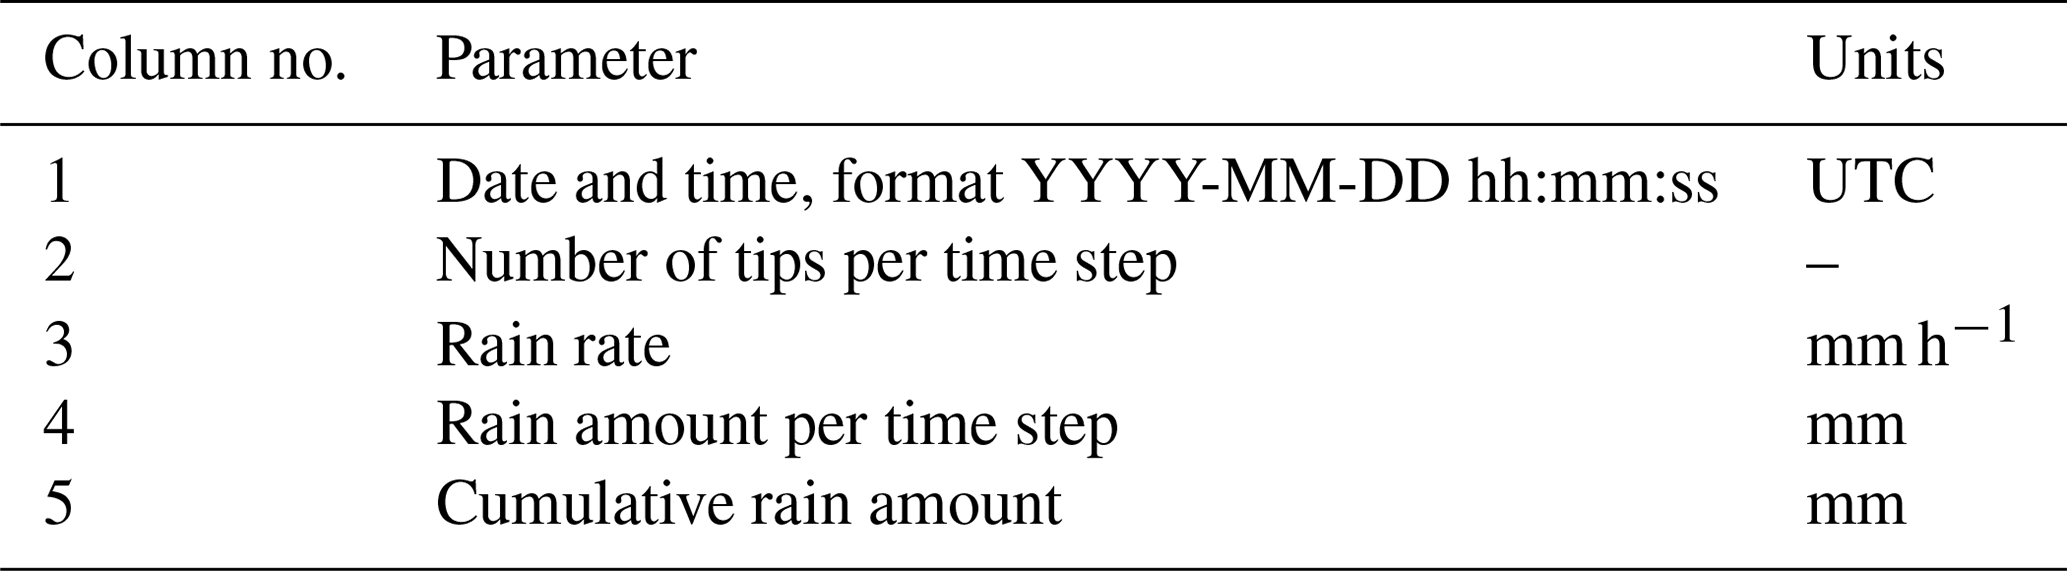
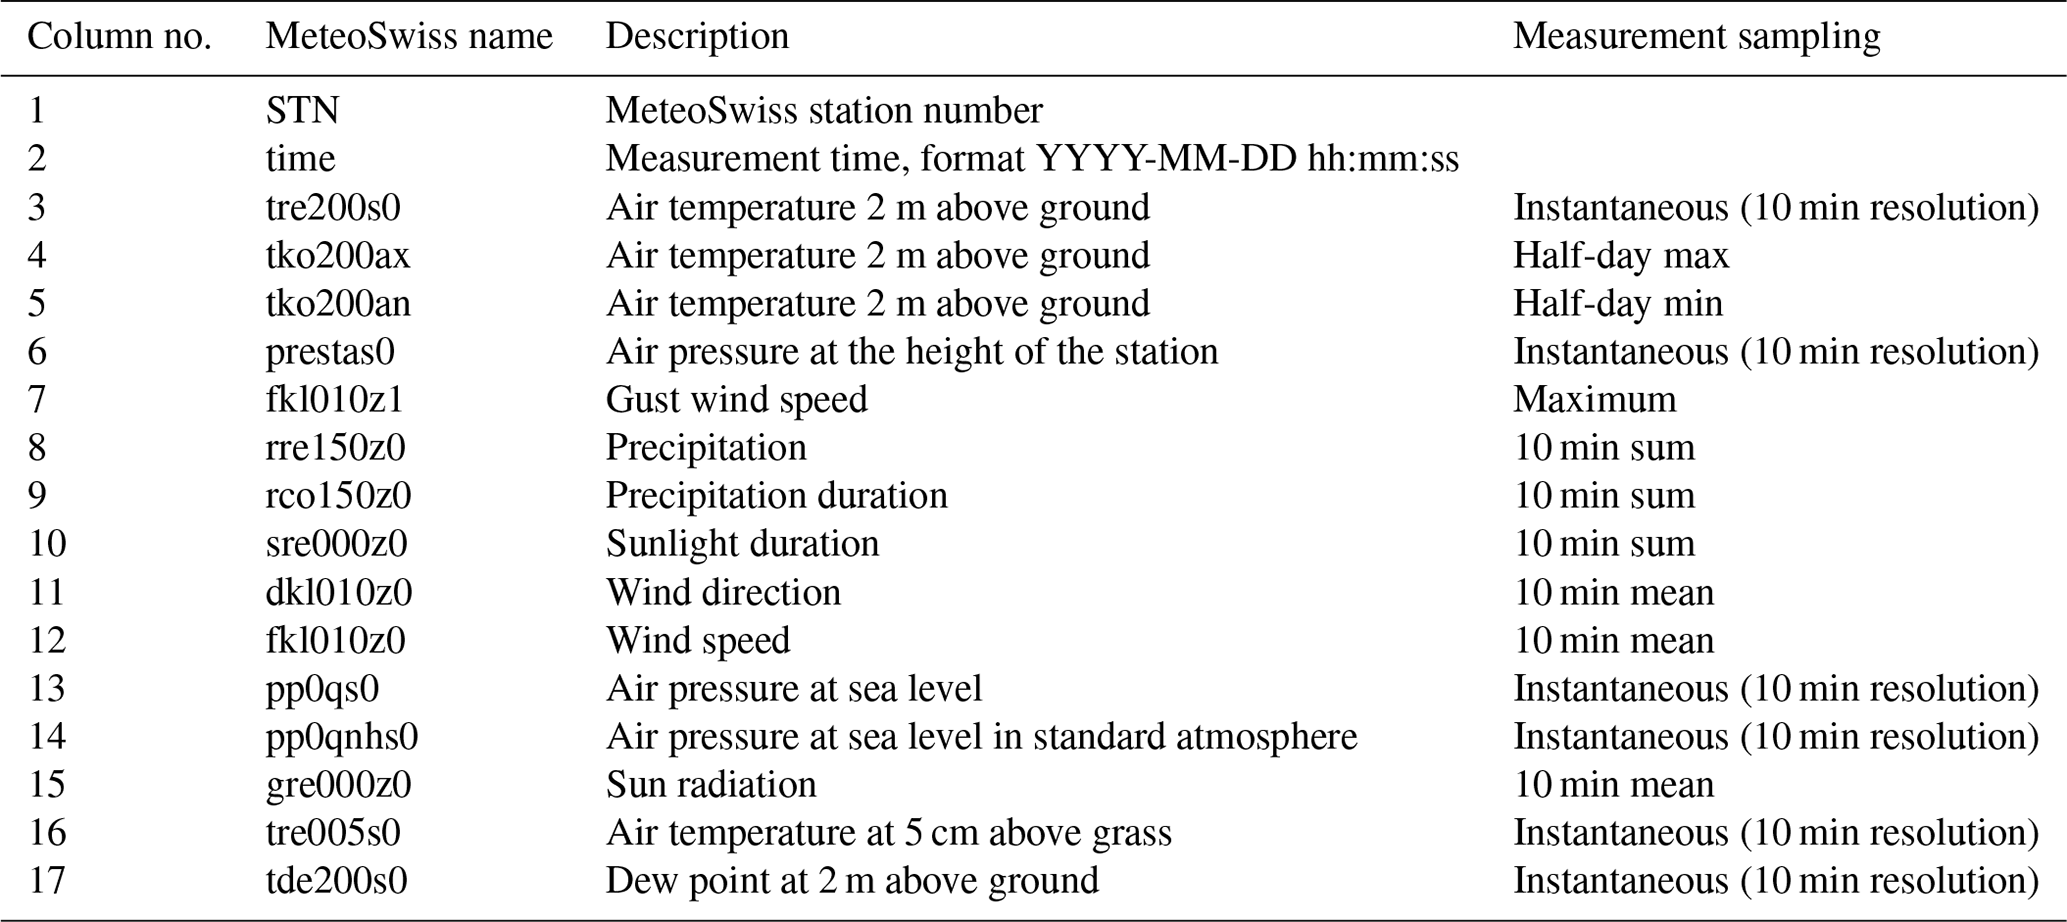

Table I1Example of precipitation event table. Complete table can be found in the Zenodo repository.
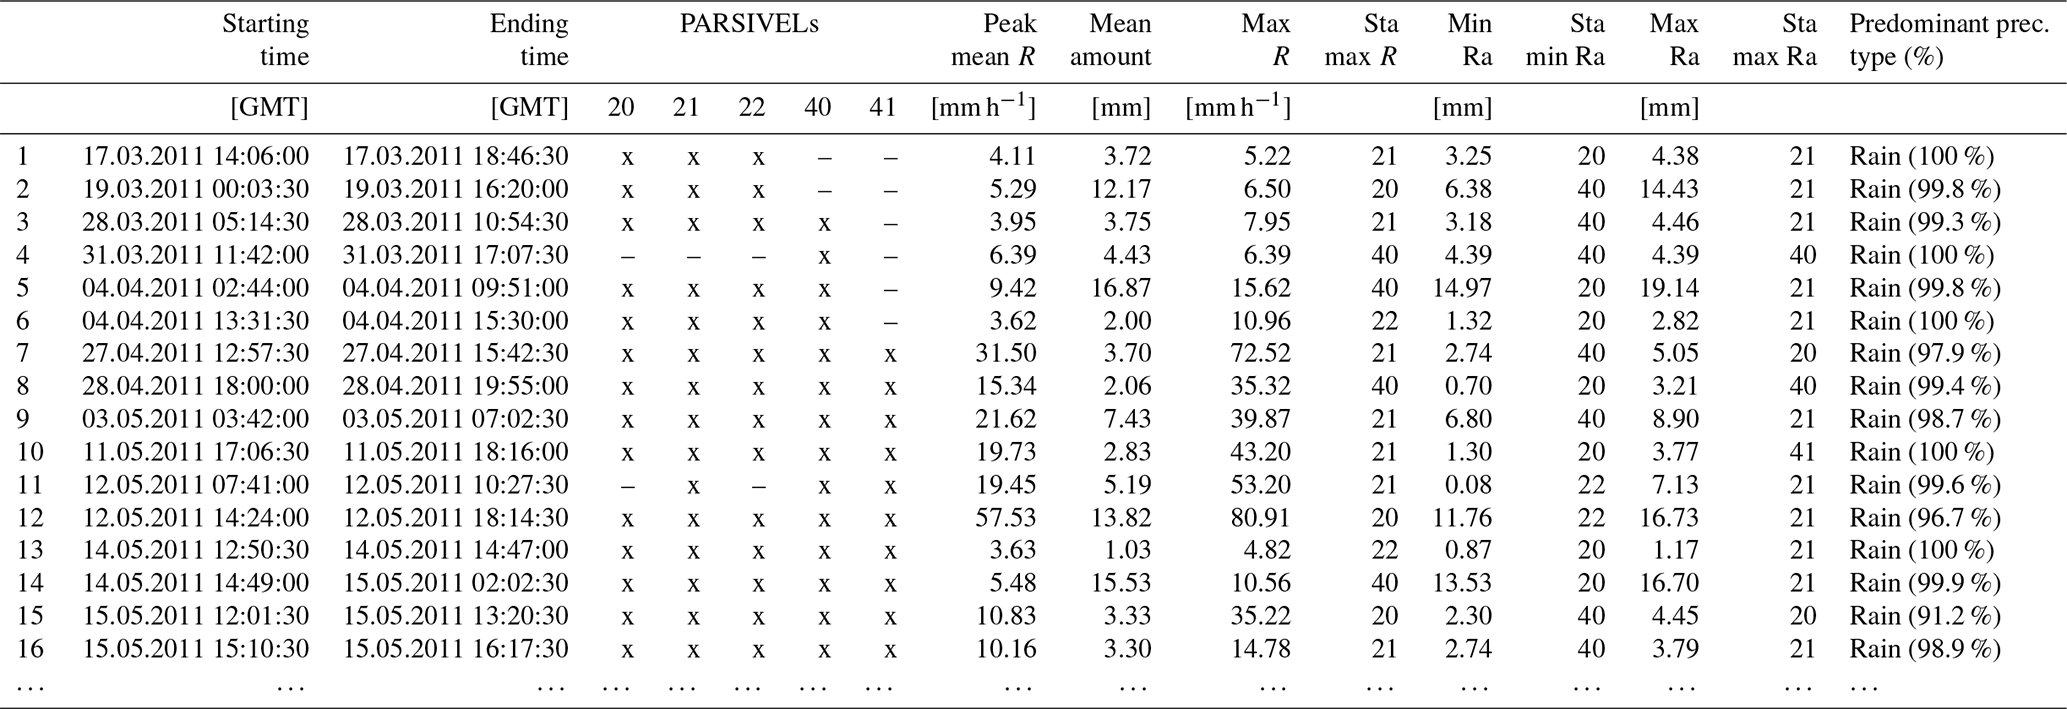
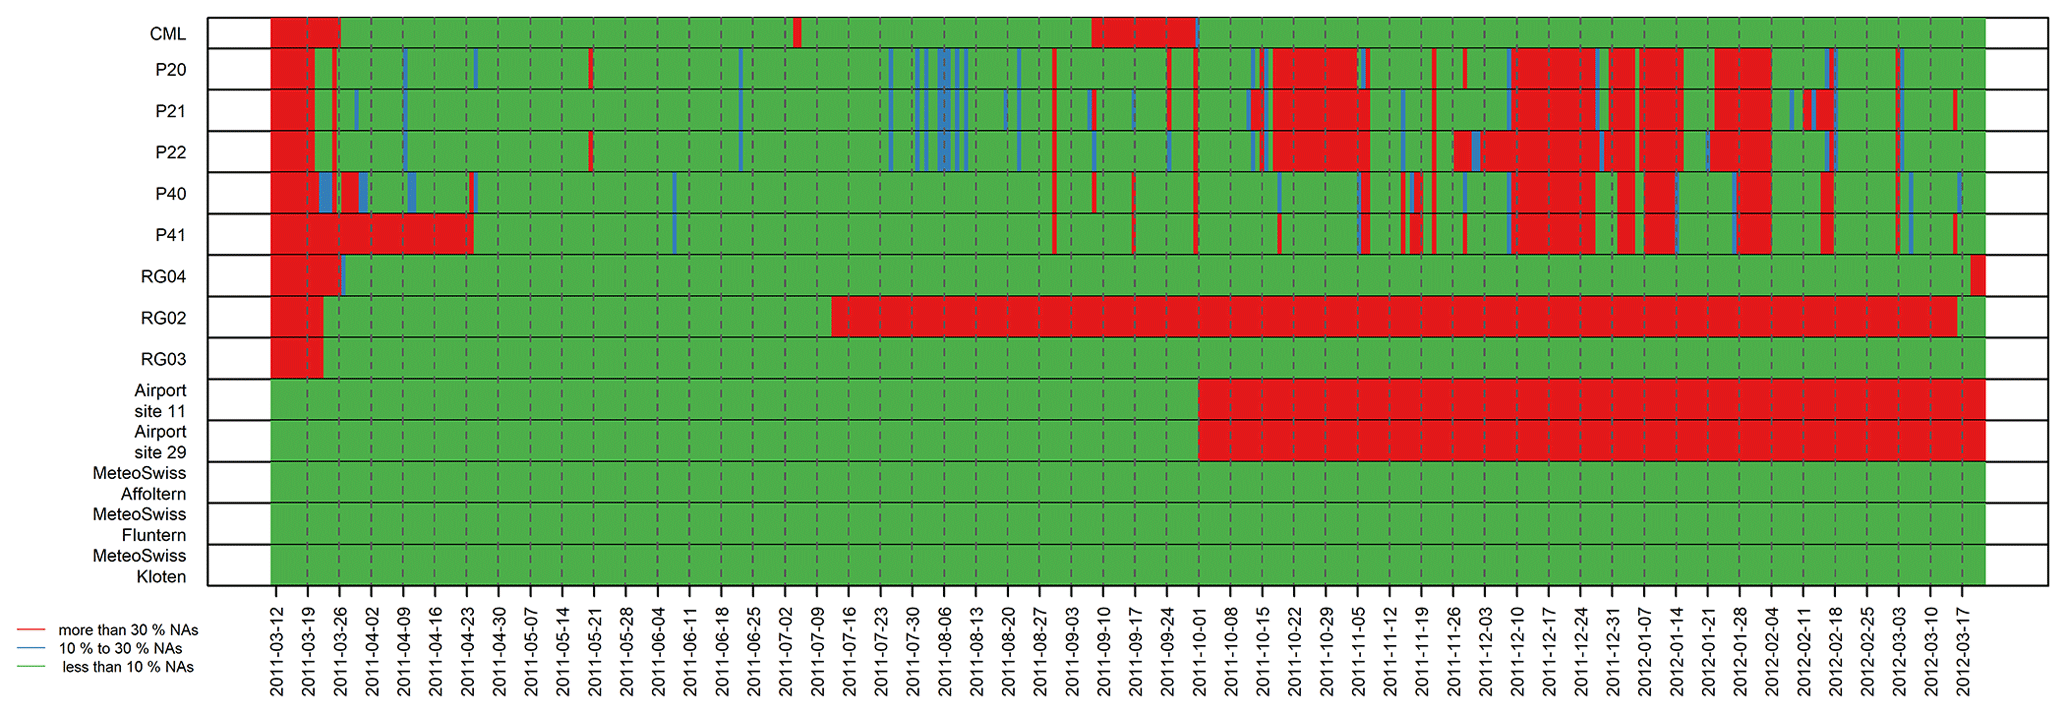
Figure J1Data availability scheme. Red means more than 30 % NA values. Blue means 10 % to 30 % NA values. Green means less than 10 % NA values.
AŠ processed the data with support from JJ, plotted the results, and wrote the manuscript with support from MS, JR, MF, and VB. The section regarding the applications of the dataset and outlook was written by MS. JJ and AB provided valuable feedback on the manuscript. JJ, MS, ZW, JR, and AB designed the experimental layout and installed and operated the CML, rain gauges, and disdrometers. AB and JR conceived the study and were in charge of overall direction and planning.
The authors declare that they have no conflict of interest.
Publisher’s note: Copernicus Publications remains neutral with regard to jurisdictional claims in published maps and institutional affiliations.
The authors gratefully acknowledge financial support from the Eawag and the Czech Science Foundation (GACR) project SpraiLINK 20-14151J. We thank all the persons who helped to perform the campaign. We want to mention Zhe Wang, Tobias Doppler, Richard Fankhauser, Vahab Rostampour (Eawag), Paul Stump, Angelo di Boni (RUAG), Christoph Wirz (Dübendorf airport), and Andre Studzinski (EPFL). We thank Martin Kryl for support with the implementation of the HTML viewer.
This research has been supported by the Eidgenössische Anstalt für Wasserversorgung Abwasserreinigung und Gewässerschutz (Commercial Microwave links for Urban Rainfall Monitoring (CoMMon)) and the Czech Science Foundation (grant no. GC20-14151J).
This paper was edited by Sibylle K. Hassler and reviewed by two anonymous referees.
Atlas, D. and Ulbrich, C. W.: Path- and Area-Integrated Rainfall Measurement by Microwave Attenuation in the 1–3 cm Band, J. Appl. Meteorol., 16, 1322–1331, https://doi.org/10.1175/1520-0450(1977)016<1322:PAAIRM>2.0.CO;2, 1977. a, b
Battaglia, A., Rustemeier, E., Tokay, A., Blahak, U., and Simmer, C.: PARSIVEL Snow Observations: A Critical Assessment, J. Atmos. Ocean. Tech., 27, 333344, https://doi.org/10.1175/2009JTECHA1332.1, 2010. a
Berne, A., and Uijlenhoet, R.: Path‐averaged rainfall estimation using microwave links: Uncertainty due to spatial rainfall variability, Geophys. Res. Lett., 34, L07403, https://doi.org/10.1029/2007GL029409, 2007. a
Berne, A. and Schleiss, M.: Retrieval of the rain drop size distribution using telecommunication dual-polarization microwave links, in: the 34th conference on radar meteorology, American Meteorological Society, Boston, availale at: https://ams.confex.com/ams/34Radar/techprogram/paper_155668.htm (last access: 11 December 2020), 2009. a
Cao, Q., Zhang, G., Brandes, E. A., and Schuur, T. J.: Polarimetric Radar Rain Estimation through Retrieval of Drop Size Distribution Using a Bayesian Approach, J. Appl. Meteorol. Clim., 49, 973–990 2010. a
Chwala, C., and Kunstmann, H.: Commercial microwave link networks for rainfall observation: Assessment of the current status and future challenges, WIREs Water, 6, e1337, https://doi.org/10.1002/wat2.1337, 2019. a, b
Chwala, C., Keis, F., Graf, M., Sereb, D., and Boose, Y.: pycomlink software package, v0.2.5 [code], available at: https://github.com/pycomlink/pycomlink (last access: 6 March 2021), 2020. a
de Vos, L. W., Overeem, A., Leijnse, H., and Uijlenhoet, R.: Rainfall Estimation Accuracy of a Nationwide Instantaneously Sampling Commercial Microwave Link Network: Error Dependency on Known Characteristics, J. Atmos. Ocean. Tech., 36, 1267–1283, https://doi.org/10.1175/JTECH-D-18-0197.1, 2019. a
Ericsson: Ericsson microwave outlook, available from: https://www.ericsson.com/4a8c1f/assets/local/reports-papers/microwave-outlook/2019/ericsson-microwave-outlook-report-2019.pdf (last access: 16 December 2020), 2019. a
Eriksson, P., Ekelund, R., Mendrok, J., Brath, M., Lemke, O., and Buehler, S. A.: A general database of hydrometeor single scattering properties at microwave and sub-millimetre wavelengths, Earth Syst. Sci. Data, 10, 1301–1326, https://doi.org/10.5194/essd-10-1301-2018, 2018. a, b
Fencl, M., Rieckermann, J., and Bareš, V.: Eliminating bias in rainfall estimates from microwave links due to antenna wetting, Geophysical Res. Abstr., EGU General Assembly 2014, Vol. 16, EGU2014-13107, Vienna, Austria, 2014. a
Fencl, M., Dohnal, M., Rieckermann, J., and Bareš, V.: Gauge-adjusted rainfall estimates from commercial microwave links, Hydrol. Earth Syst. Sci., 21, 617–634, https://doi.org/10.5194/hess-21-617-2017, 2017. a
Fencl, M., Dohnal, M., Valtr, P., Grabner, M., and Bareš, V.: Atmospheric observations with E-band microwave links – challenges and opportunities, Atmos. Meas. Tech., 13, 6559–6578, https://doi.org/10.5194/amt-13-6559-2020, 2020. a, b
Gires, A., Tchiguirinskaia, I., and Schertzer, D.: Two months of disdrometer data in the Paris area, Earth Syst. Sci. Data, 10, 941–950, https://doi.org/10.5194/essd-10-941-2018, 2018. a
Gires, A., Bruley, P., Ruas, A., Schertzer, D., and Tchiguirinskaia, I.: Disdrometer measurements under Sense-City rainfall simulator, Earth Syst. Sci. Data, 12, 835–845, https://doi.org/10.5194/essd-12-835-2020, 2020. a
Graf, M., Chwala, C., Polz, J., and Kunstmann, H.: Rainfall estimation from a German-wide commercial microwave link network: optimized processing and validation for 1 year of data, Hydrol. Earth Syst. Sci., 24, 2931–2950, https://doi.org/10.5194/hess-24-2931-2020, 2020. a
Habi, H. and Messer, H.: Wet-Dry Classification Using LSTM and Commercial Microwave Links, IEEE 10th Sensor Array and Multichannel Signal Processing Workshop (SAM), 149–153, 10.1109/SAM.2018.8448679, 2018. a
Humphrey, M. D., Istok, J. D., Lee, J. Y., Hevesi J. A., and Flint, A. L.: A New Method for Automated Dynamic Calibration of Tipping-Bucket Rain Gauges. J. Atmos. Ocean. Tech., 14, 1513–1519, https://doi.org/10.1175/1520-0426(1997)014<1513:ANMFAD>2.0.CO;2, 1997. a
ITU-R: Recommendation ITU-R P.838-3 – Specific attenuation model for rain for use in prediction methods, available at: http://www.itu.int/dms_pubrec/itu-r/rec/p/R-REC-P.838-3-200503-I!!PDF-E.pdf (last access: 6 March 2021), 2005. a
ITU-R: Recommendation ITU-R P.530-16 – Propagation data and prediction methods required for the design ofterrestrial line-of-sight systems, available at: https://www.itu.int/dms_pubrec/itu-r/rec/p/R-REC-P.530-16-201507-S!!PDF-E.pdf (last access: 6 March 2021), 2015. a
ITU-R: Recommendation ITU-R P.676-12 – Attenuation by atmospheric gases and related effects, available at: https://www.itu.int/dms_pubrec/itu-r/rec/p/R-REC-P.676-12-201908-I!!PDF-E.pdf (last access: 4 June 2021), 2019. a
Jaffrain, J. and Berne, A.: Experimental quantication of the sampling uncertainty associated with measurements from Parsivel disdrometers, J. Hydrometeor., 12, 352–370, https://doi.org/10.1175/2010JHM1244.1, 2011. a
Jaffrain, J., Studzinski, A., and Berne, A.: A network of disdrometers to quantify the small‐scale variability of the raindrop size distribution, Water Resour. Res., 47, W00H06, https://doi.org/10.1029/2010WR009872, 2011. a
Kvicera, V., Grabner, M., and Fiser, O.: Frequency and path length scaling of rain attenuation from 38 GHz, 58 GHz and 93 GHz data obtained on terrestrial paths, 2009 3rd European Conference on Antennas and Propagation, Berlin, 2648–2652, 2009. a
Leijnse, H., Uijlenhoet, R., and Stricker, J.: Microwave link rainfall estimation: Effects of link length and frequency, temporal sampling, power resolution, and wet antenna attenuation, Adv. Water Resour., 31, 1481–1493, https://doi.org/10.1016/j.advwatres.2008.03.004, 2008. a
Leijnse, H., Uijlenhoet, R., and Berne, A.: Errors and Uncertainties in Microwave Link Rainfall Estimation Explored Using Drop Size Measurements and High-Resolution Radar Data, J. Hydrometeorol., 11, 1330–1344, https://doi.org/10.1175/2010JHM1243.1, 2010. a
Löffler-Mang, M. and Joss J.: An optical disdrometer for measuring size and velocity of hydrometeors, J. Atmos. Ocean. Tech., 17, 130–139, 2000. a, b
MeteoSwiss: https://www.meteoswiss.admin.ch/home/measurement-values.html?param=messwerte-lufttemperatur-10min&station=REH&chart=hour, last access: 16 December 2020. a
Mital, U., Dwivedi, D., Brown, J. B., Faybishenko, B., Painter, S. L., and Steefel, C. I.: Sequential Imputation of Missing Spatio-Temporal Precipitation Data Using Random Forests, Front. Water, 2, 20, https://doi.org/10.3389/frwa.2020.00020, 2020. a
Olsen, R., Rogers, D., and Hodge, D.: The aRb relation in the calculation of rain attenuation, IEEE T. Anten. Propag., 26, 318–329, https://doi.org/10.1109/TAP.1978.1141845, 1978. a
Ostrometzky, J., Cherkassky, D., and Messer H.: Accumulated Mixed Precipitation Estimation Using Measurements from Multiple Microwave Links, Adv. Meteorol., 2015, 707646, https://doi.org/10.1155/2015/707646, 2015. a
OTT: Operating instructions: Present Weather Sensor Parsivel, 70.200.005.B.E 08-1008, 2006. a
Overeem, A., Leijnse, H., and Uijlenhoet, R.: Measuring urban rainfall using microwave links from commercial cellular communication networks, Water Resour. Res., 47, W12505, https://doi.org/10.1029/2010WR010350, 2011. a
Overeem, A., Leijnse, H., and Uijlenhoet, R.: Two and a half years of country‐wide rainfall maps using radio links from commercial cellular telecommunication networks, Water Resour. Res.h, 52, 8039–8065, https://doi.org/10.1002/2016WR019412, 2016.
Overeem, A., Leijnse, H., and Uijlenhoet, R.: Retrieval algorithm for rainfall mapping from microwave links in a cellular communication network, Atmos. Meas. Tech., 9, 2425–2444, https://doi.org/10.5194/amt-9-2425-2016, 2016. a, b
Pastorek, J., Fencl, M., Rieckermann, J., and Bareš, V.: The suitability of precipitation estimates from short CMLs for urban hydrological predictions, December 2018, International Workshop on Precipitation in Urban Areas (UrbanRain18), Pontresina, Switzerland, https://doi.org/10.3929/ethz-b-000347556, 2018. a
Pastorek, J., Fencl, M., Rieckermann, J., and Bareš, V.: Precipitation Estimates from Commercial Microwave Links: Practical Approaches to Wet-antenna Correction, submitted to Transactions on Geoscience and Remote Sensing (TGRS), Pre-print on engrXiv, submitted, 2021. a
Polz, J., Chwala, C., Graf, M., and Kunstmann, H.: Rain event detection in commercial microwave link attenuation data using convolutional neural networks, Atmos. Meas. Tech., 13, 3835–3853, https://doi.org/10.5194/amt-13-3835-2020, 2020. a, b
Reller, C., Loeliger, H., and Marín Díaz, J. P.: A model for quasi-periodic signals with application to rain estimation from microwave link gain, 19th European Signal Processing Conference, Barcelona, 2011, 971–975, 2011. a
Rincon, R. F., and Lang, R. H.: Microwave link dual-wavelength measurements of path-average attenuation for the estimation of drop size distributions and rainfall, IEEE T. Geosci. Remote, 40, 760–770, https://doi.org/10.1109/TGRS.2002.1006324, 2002. a
Schatzmann, A., Scheidegger, A., Rieckermann, J., and Ruckstuhl, A.: Robust extraction of rain-induced attenuation from microwave link observations using local regression, in: Urban challenges in rainfall analysis, edited by: Molnar, P., Burlando, P., and Einfalt, T., ETH Zurich, Zurich, 1–5, 2012. a
Schleiss, M. and Berne A.: Identification of Dry and Rainy Periods Using Telecommunication Microwave Links, IEEE Geosci. Remote Sens. Lett., 7, 611–615, https://doi.org/10.1109/LGRS.2010.2043052, 2010. a, b
Schleiss, M., Jaffrain, J., and Berne, A.: Stochastic Simulation of Intermittent DSD Fields in Time, J. Hydrometeorol., 13, 621–637, 2012. a
Schleiss, M., Rieckermann, J., and Berne, A.: Quantification and Modeling of Wet-Antenna Attenuation for Commercial Microwave Links, IEEE Geosci. Remote Sens. Lett., 10, 1195–1199, https://doi.org/10.1109/LGRS.2012.2236074, 2013. a
Song, K., Liu, X., Gao, T., and He, B.: Raindrop Size Distribution Retrieval Using Joint Dual-Frequency and Dual-Polarization Microwave Links, Adv. Meteorol., 2019, 7251870, https://doi.org/10.1155/2019/7251870, 2019. a
Špačková, A., Jaffrain, J., Wang, Z., Schleiss, M., Fencl, M., Bareš, V., Berne, A., and Rieckermann, J.: One year of attenuation data from a commercial dual-polarized duplex microwave link with concurrent disdrometer, rain gauge and weather observations, Zenodo [Data set], https://doi.org/10.5281/zenodo.4923125, 2021. a, b
Upton, G. J. G., Cummings, R. J., and Holt, A. R.: Identification of melting snow using data from dual-frequency microwave links, IEE Proc.-H, 1, 282–288, https://doi.org/10.1049/iet-map:20050285, 2007. a
van Leth, T. C., Overeem, A., Leijnse, H., and Uijlenhoet, R.: A measurement campaign to assess sources of error in microwave link rainfall estimation, Atmos. Meas. Tech., 11, 4645–4669, https://doi.org/10.5194/amt-11-4645-2018, 2018. a, b, c, d
van Leth, T. C., Leijnse, H., Overeem, A., and Uijlenhoet, R.: Estimating raindrop size distributions using microwave link measurements: potential and limitations, Atmos. Meas. Tech., 13, 1797–1815, https://doi.org/10.5194/amt-13-1797-2020, 2020. a
Wang, Z., Schleiss, M., Jaffrain, J., Berne, A., and Rieckermann, J.: Using Markov switching models to infer dry and rainy periods from telecommunication microwave link signals, Atmos. Meas. Tech., 5, 1847–1859, https://doi.org/10.5194/amt-5-1847-2012, 2012. a, b, c
- Abstract
- Introduction
- Data and methods
- The database
- Applications of the dataset and outlook
- Data availability
- Conclusions
- Appendix A: PARSIVEL drop diameter classes
- Appendix B: PARSIVEL drop velocity classes
- Appendix C: PARSIVEL raw data parameters
- Appendix D: Precipitation code according to SYNOP
- Appendix E: CML: measured parameters
- Appendix F: Rain gauges: measured parameters
- Appendix G: MeteoSwiss weather station parameters
- Appendix H: Airport weather station parameters
- Appendix I: Table of precipitation events
- Appendix J: Data availability scheme
- Author contributions
- Competing interests
- Disclaimer
- Acknowledgements
- Financial support
- Review statement
- References