the Creative Commons Attribution 4.0 License.
the Creative Commons Attribution 4.0 License.
 | 24 Aug 2021
Minute Sea-Level Analysis (MISELA): a high-frequency sea-level analysis global dataset
Petra Zemunik
Jadranka Šepić
Havu Pellikka
Leon Ćatipović
Ivica Vilibić
Sea-level observations provide information on a variety of processes occurring over different temporal and spatial scales that may contribute to coastal flooding and hazards. However, global research on sea-level extremes is restricted to hourly datasets, which prevent the quantification and analyses of processes occurring at timescales between a few minutes and a few hours. These shorter-period processes, like seiches, meteotsunamis, infragravity and coastal waves, may even dominate in low tidal basins. Therefore, a new global 1 min sea-level dataset – MISELA (Minute Sea-Level Analysis) – has been developed, encompassing quality-checked records of nonseismic sea-level oscillations at tsunami timescales (T<2 h) obtained from 331 tide-gauge sites (https://doi.org/10.14284/456, Zemunik et al., 2021b). This paper describes data quality control procedures applied to the MISELA dataset, world and regional coverage of tide-gauge sites, and lengths of time series. The dataset is appropriate for global, regional or local research of atmospherically induced high-frequency sea-level oscillations, which should be included in the overall sea-level extremes assessments.
- Article
(10853 KB) - Full-text XML
- BibTeX
- EndNote


Extreme sea-level events represent a major hazard in coastal zones and have an immediate impact on the coasts unlike processes acting on longer timescales, such as the rise of the mean sea-level, which allow much more time for adaptation (Menéndez and Woodworth, 2010). The sensitivity of the coastal zone infrastructure and populations to extreme sea levels emphasizes the need for investigation of their sources and characteristics, estimation of their incidence and strengths, cataloguing of historical events, assessments of their behaviour under the future climate, development of warning systems, and, ultimately, the conception of possible adaptation measures to these phenomena. However, these attempts are significantly limited by the availability of sea-level data in terms of resolution, coverage and quality.
Tide-gauge observations provide information on a wide range of oceanographic phenomena, including extreme events associated with tsunamis, storm surges and other causes of sudden coastal inundations. It has long been recognized that well-organized and accessible sea-level databases are a prerequisite for gaining knowledge on sea-level extremes (e.g. Vafeidis et al., 2008; Hunter et al., 2017) and, consequently, for the management of coastal hazards. However, no quality-checked global sea-level datasets afford sufficiently high temporal resolution to cover periods at which – in addition to extraordinary events like tsunamis – a variety of processes may contribute substantially to, or even dominate, the overall sea-level extremes (Vilibić and Šepić, 2017). Many research activities have been based on 1 min sea-level records and have mainly been focused on specific regions known for the frequent occurrence of meteotsunamis or high-frequency sea-level oscillations, such as the Mediterranean Sea (e.g. Šepić et al., 2015), Sicily (e.g. Šepić et al., 2018; Zemunik et al., 2021a), the Adriatic Sea (e.g. Šepić et al., 2016), the Balearic Islands (e.g. Marcos et al., 2009), the Finnish coast (e.g. Pellikka et al., 2014), the Great Lakes (e.g. Šepić and Rabinovich, 2014; Bechle et al., 2016), the East Coast of America (e.g. Pasquet et al., 2013), the Chilean coast (e.g. Carvajal et al., 2017), Japan (e.g. Heidarzadeh and Rabinovich, 2021), Australia (e.g. Pattiaratchi and Wijeratne, 2014), the Caribbean (Woodworth, 2017) and many others.
Accessible global sea-level datasets differ in both sampling and latency, following the needs of the scientific and user communities, from the quantification of climate changes and sea-level rise (e.g. Jevrejeva et al., 2006) through to the study of sea-level extremes (e.g. Menéndez and Woodworth, 2010). Global sea-level datasets from tide-gauge observations are dominantly assembled and archived in the following data centres and datasets:
-
Permanent Service for Mean Sea Level (PSMSL; https://www.psmsl.org, last access: 19 August 2021), which provides monthly and annual mean values of sea-level for ca. 1550 stations that are mainly used in climate sea-level studies (Holgate et al., 2013);
-
British Oceanographic Data Centre (BODC; https://www.bodc.ac.uk, last access: 19 August 2021), which handles hourly and higher-resolution global sea-level data in a section of international sea-level data (GLOSS/WOCE/CLIVAR data) for ca. 215 stations in delayed mode (up to a year), during which the centre performs inspection and quality control, in addition to the UK tide-gauge network and historical BPR (bottom pressure recorder) data;
-
Global Extreme Sea Level Analysis dataset (GESLA; http://www.gesla.org, last access: 19 August 2021, Woodworth et al., 2016, 2017), which contains global sea-level data with an hourly or higher (e.g. 10 or 15 min) resolution at the majority of 1355 tide gauges, although quality control is not undertaken centrally and instead relies on procedures undertaken by data providers;
-
University of Hawaii Sea Level Centre (UHSLC; https://uhslc.soest.hawaii.edu, last access: 19 August 2021), which distributes both preliminary quality-checked data in fast mode (1–2 months) for ca. 290 stations and a fully quality-checked hourly sea-level dataset through Joint Archive for Sea Level (JASL) (Caldwell et al., 2015) for ca. 515 stations, in cooperation with the NOAA National Centers for Environmental Information (https://www.ncei.noaa.gov/access/metadata/landing-page/bin/iso?id=gov.noaa.nodc:JIMAR-JASL, last access: 19 August 2021);
-
Intergovernmental Oceanographic Commission Sea Level Station Monitoring Facility (IOC SLSMF; http://www.ioc-sealevelmonitoring.org, last access: 19 August 2021) hosted by the Flanders Marine Institute (VLIZ), which provides raw global sea-level data for ca. 1100 stations with a 1 min or higher resolution in real time or near-real time that are designed for operational purposes.
Only the last dataset contains global sea-level records from tide gauges measuring at a 1 min resolution. However, the disadvantage is that there is no possibility of undertaking quality control in real time. Therefore, these raw records may contain many different problems (UNESCO, 2020). It should be noted here that some services freely share their 1 min data through specific databases, although the data only cover national coastlines or limited areas, like the NOAA Tides and Currents dataset (https://tidesandcurrents.noaa.gov, last access: 19 August 2021). In order to override these issues and provide a consistent global-scale dataset of research quality, the Minute Sea-Level Analysis (MISELA) dataset was developed and will be presented in this paper. MISELA contains delayed-mode 1 min quality-checked and high-pass-filtered (2 h cut-off period) sea-level records from a large number of tide gauges worldwide for a period from 2004 to 2019. Having access to a global dataset of 1 min sea-level data may accelerate the research on various high-frequency sea-level phenomena such as seiches, meteotsunamis, infragravity and coastal waves (e.g. Monserrat et al., 2006; Yankovsky, 2009; Pellikka et al., 2014; Pattiaratchi and Wijeratne, 2015; Dodet et al., 2019), which cannot be researched using hourly measurements.
The paper is organized as follows. In Sect. 2, the sources of the data used for the MISELA dataset and the quality control procedure are thoroughly described. Section 3 presents the MISELA dataset, the global and regional coverage of the quality-checked time series, and the basic statistics of the dataset. The paper finishes with the data availability statement and discussion on applications, perspectives and possible improvements of the MISELA dataset.
2.1 Sources of data
The main source for constructing the MISELA dataset is the Intergovernmental Oceanographic Commission Sea Level Station Monitoring Facility (Flanders Marine Institute (VLIZ) and Intergovernmental Oceanographic Commission (IOC), 2021), which provides raw sea-level data received in real time from more than 160 providers that presently operate approximately 935 tide-gauge stations. However, the network of tide gauges contains some stations that are in disrepair (total number of the IOC stations is ca. 1100).
The IOC database has been established following the disastrous 2004 Indian Ocean tsunami (Chlieh et al., 2007), after which UNESCO, through IOC, coordinated efforts to develop regional tsunami warning systems (Amato, 2020). The main objective of the facility is to inform users about the status of station availability and performance (Aarup et al., 2019). This includes displaying the tide-gauge station metadata and regularly checking the operational status of all stations, as well as contacting operators regarding non-operating stations. Another important objective is a display service through which one can undertake a quick visual inspection of the raw data in a selected half-daily, daily, weekly or monthly period during which the chosen station was operational (IOC, 2012). It is also possible to download the data for the whole operational period. However, any research use of these data would require additional processing (e.g. quality control), in order to properly prepare and involve data in statistical analyses and avoid misleading results and conclusions (Aarup et al., 2019).
As real-time data are mostly used for operational purposes, the IOC data have not undergone any quality control procedure and are shared “as received” from providers (see http://www.ioc-sealevelmonitoring.org/disclaimer.php, last access: 19 August 2021). Expectedly, many time series are of poor quality with spikes, shifts, drifts and other errors due to instrument malfunctions (Fig. 1), with the quality being dependent on the real-time quality control procedures set up by the operators and on the quality of sensors and instrumentation at the sites. The majority of the tide gauges provide data with a 1 min sampling frequency; however, some of them still record on a multi-minute timescale and are, thus, not included in the MISELA dataset. Further, some stations have multiple sensors (e.g. pressure, radar and bubbler sensors) to provide cross-calibration between measurements. Each of the stations comes with information such as the reference code, location and country of the tide gauge, the contact information for the local agency operating the station, the geographic position, the type of sensor for measurement and the sampling rate.
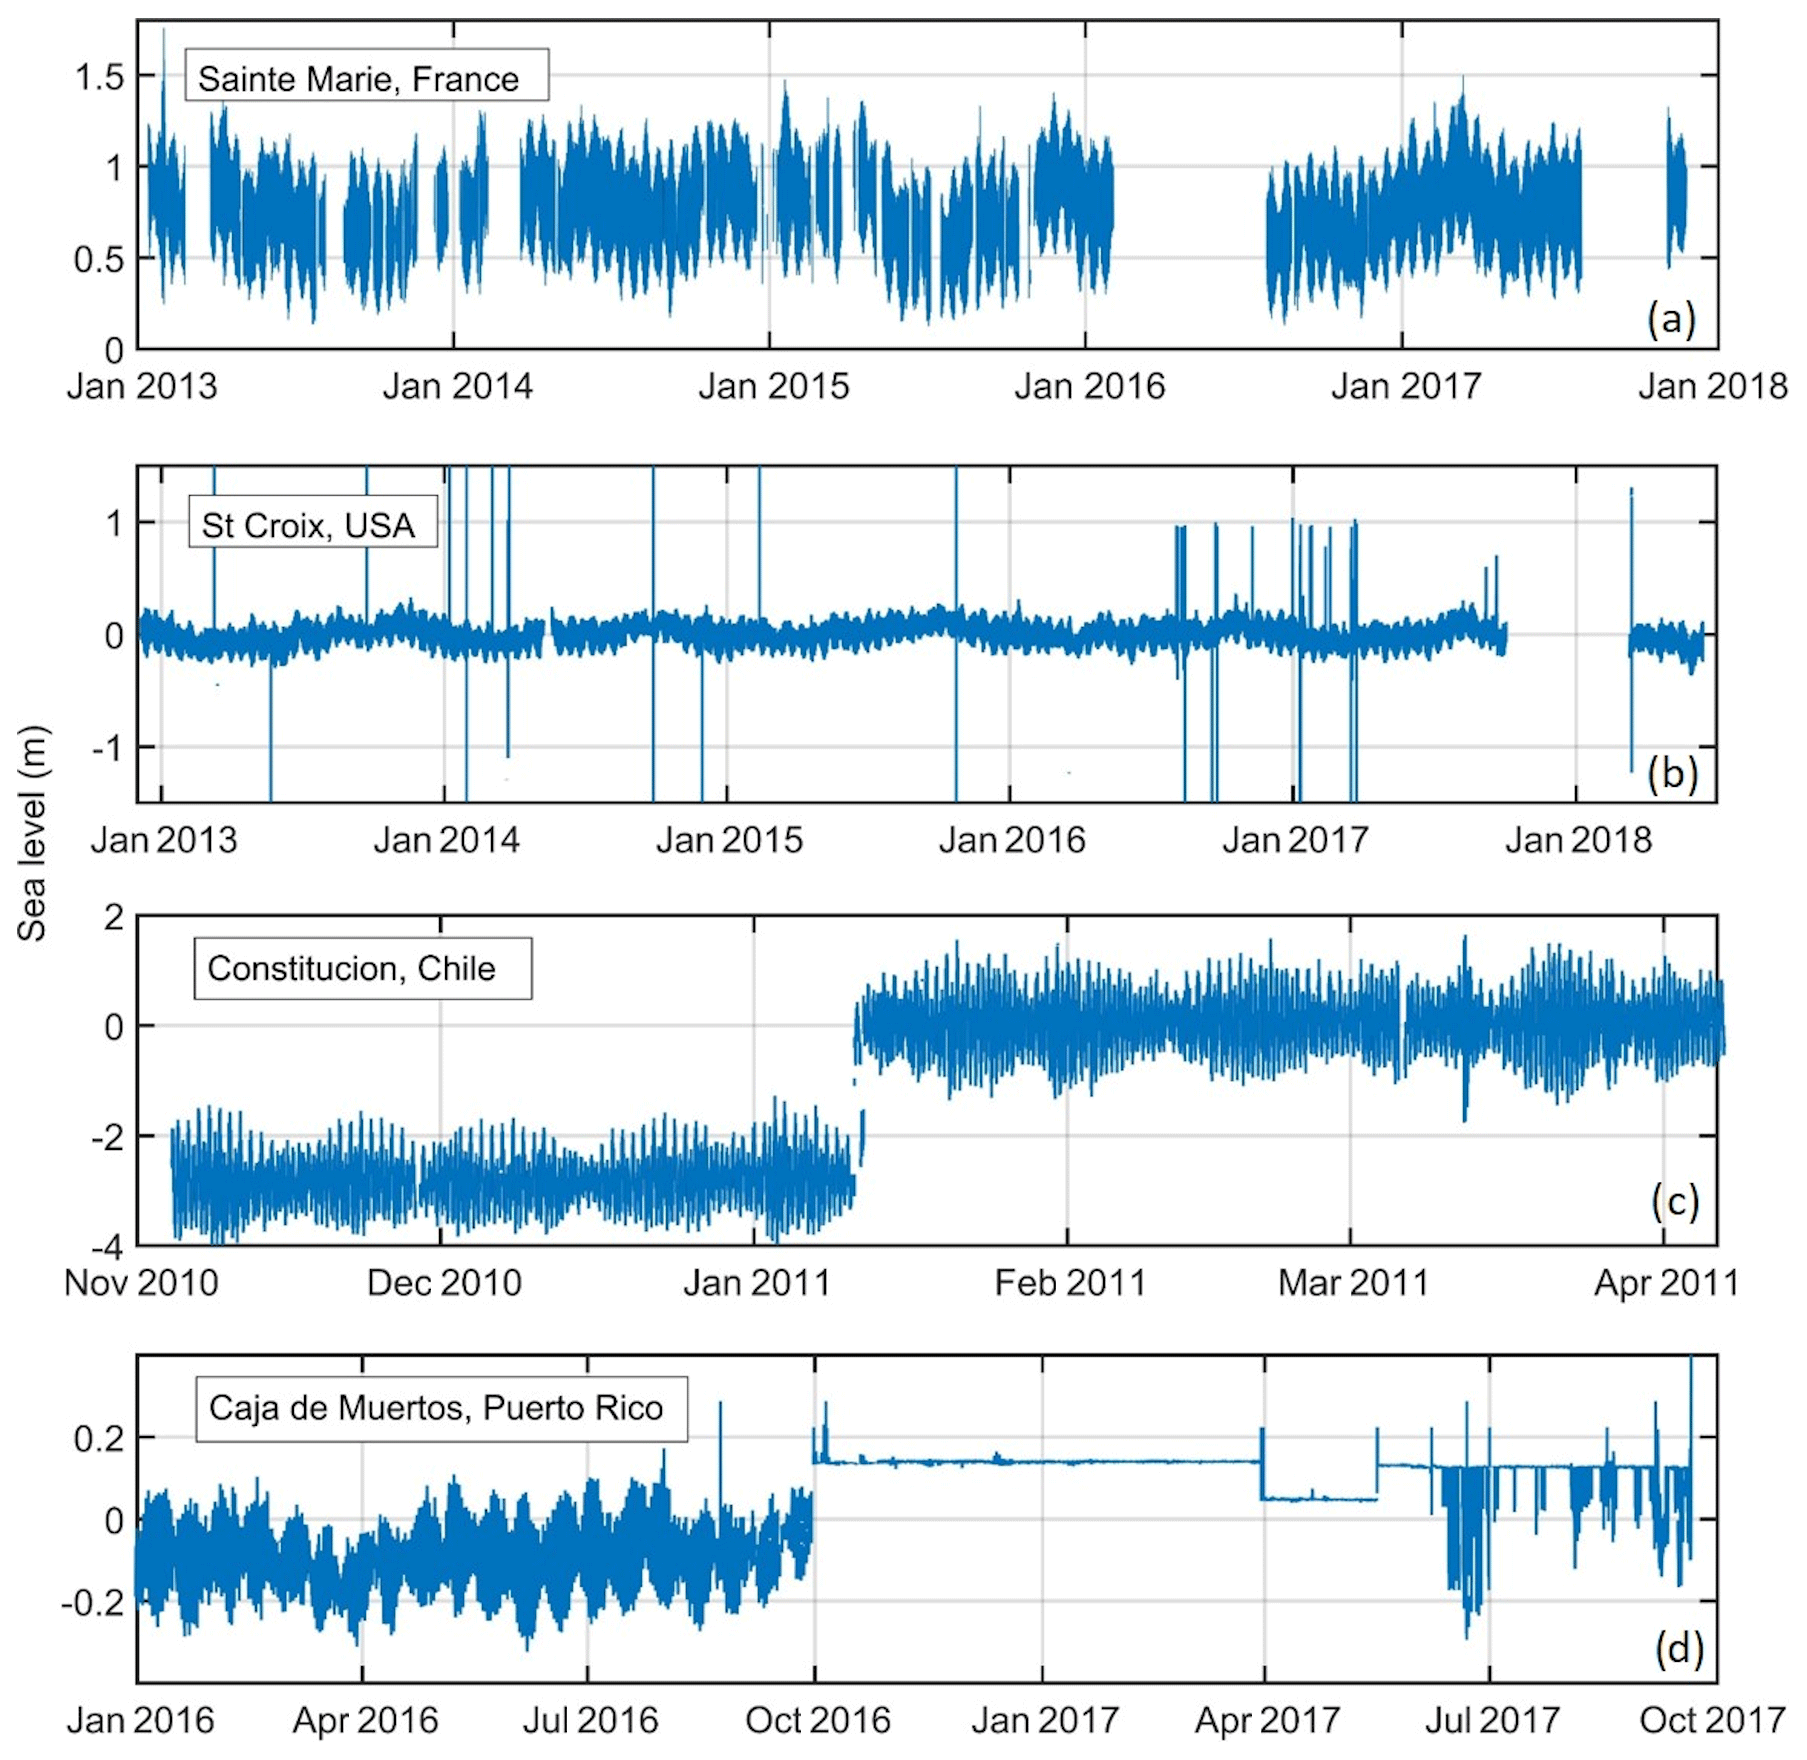
Figure 1Examples of measured 1 min sea-level series containing different problems with the data: (a) gaps, (b) spikes, (c) shifts and (d) spurious oscillations in time series.
Furthermore, 13 stations operated by the Finnish Meteorological Institute (FMI, https://en.ilmatieteenlaitos.fi/, last access: 19 August 2021) and situated on the east coast of the Baltic Sea are included in the MISELA dataset. The 1 min sea-level records are available from 2004 and have already been used in several regional studies on meteorological tsunamis along the Finnish coast (e.g. Pellikka et al., 2014; Jylhä et al., 2018). The FMI data are not included in the IOC SLSMF database. Finally, sea-level data from four stations in the Adriatic Sea were provided by the Institute of Oceanography and Fisheries (IOF, https://acta.izor.hr/wp/en/, last access: 19 August 2021). These stations, except Split, can also be found in the IOC SLSMF dataset, although only after October 2018, whereas the IOF provided the data from May 2017 onwards.
2.2 Quality control (QC) procedures
The first step in the development of the MISELA dataset was implementing a procedure that reads and stores data from the IOC SLSMF portal for the period from the beginning of the station activity until June 2018. After obtaining the sea-level time series from the IOC, FMI and IOF stations, we selected stations with at least a 2-year-long series and no more than 30 % of data gaps for further processing. As the dataset is intended to be applicable for the statistical analysis of high-frequency sea-level processes, we chose a length of 1.4 years (70 % of 2 years) as a threshold, because short time series or those overly intermitted with data gaps would not significantly contribute to the research. For stations with multiple sensors, we selected the longest series or the series with the lowest percentage of data gaps. These gaps were not interpolated with the data recorded by the other sensors at the same station, as it appeared that the sensors may measure the intensity of the sea-level oscillations at a 1 min timescale differently. The datum and clock shift were also not considered, as this would require information that is not available at the IOC SLSMF. Stations with data records of very low quality (spikes that are distributed throughout most of the time series and appear on an hourly or multi-hourly basis, or obvious incorrect records like spurious oscillations produced by malfunctions of instruments), established via visual inspection, were also not included in the processing. Along with 13 FMI and 4 IOF stations, 314 stations were selected from the IOC that satisfied the above conditions, constituting 331 time series in total.
The dataset required further processing, as it contained numerous data quality issues (Fig. 1). The series were first detided by removing all significant tidal components using the MATLAB software package T_Tide (Pawlowicz et al., 2002) in order to allow for simpler visual inspection of the residual signal. The automatic quality control procedures included removing of out-of-range values, i.e. values with a 50 cm difference from one neighbouring value or a 30 cm difference from both neighbouring values (in case of the FMI stations, a 20 cm difference from one or a 15 cm difference from both neighbouring values). The automatic spike detection procedure was continued by applying the methodology described in Williams et al. (2019): removing the values that deviate by 3 standard deviations from a spline fitted using a least-squares method. After the automatic control, the remaining spikes were detected and removed by visual inspection of all records. During this time-consuming process, each series was inspected over 15 d windows, and spurious spikes and isolated data that had passed through the automatic procedures were manually removed. In these quality control steps, a considerable amount of data was removed, in particular at the beginning or end of the time series. Therefore, the MISELA time series might be shorter (down to 1.5 years) or have a percentage of gaps higher than 30 %, when compared to the raw series. Unlike the existing automatic quality control systems, SELENE (EuroGOOS DATA-MEQ working group, 2010) and Automatic Tide Gauge Processing System from the National Oceanography Centre (NOC) (Williams et al., 2019), our approach also introduced a manual procedure, given the great variety of data issues stemming from a wide range of operators, operating procedures and sea-level sensors. Not all issues (e.g. spikes, spurious oscillations, “stucks of instruments”; see Williams et al., 2019, for an explanation of the latter) were removed properly; thus, a more robust approach than that provided by the fully automated system was necessary, although it required a lot of effort and time.
The next step in creating the MISELA dataset was to exclude sea-level records observed during seismic tsunamis, as the applications are directed towards research on atmospherically induced sea-level oscillations, which has been an emerging field during the last few decades (e.g. Pattiaratchi and Wijeratne, 2015; Vilibić et al., 2021). Using the National Geophysical Data Center/World Data Service (NGDC/WDS) Global Historical Tsunami Database (https://www.ngdc.noaa.gov/hazard/tsu_db.shtml, last access: 19 August 2021), we listed all tsunamis from 2006 to 2018 and deleted several days of data (depending on the tsunami intensity) during each recorded tsunami at all stations in the area. To restrict to the data to the high-frequency sea-level signal only, the final step included digital filtering of the data by the high-pass Kaiser–Bessel filter (Thomson and Emery, 2014; Šepić et al., 2015; Vilibić and Šepić, 2017) with a cut-off period of 2 h. Therefore, the applications of the MISELA dataset are designed exclusively for researching atmospherically induced sea-level oscillations at tsunami timescales. However, the dataset might be combined with other existing datasets (at hourly resolutions) that are available from known databanks (like these listed in Sect. 1). Prior to filtering, linear interpolation of gaps shorter than 1 week was carried out, as digital filtering requires a continuous time series. While a great majority of data outliers were removed from the records, some undoubtedly remain in the data, as the visual control is subject to errors and omissions and is also, to a certain extent, subjective. It should be highlighted that sea-level data from the IOC SLSMF database up to June 2015 were downloaded, quality-controlled, processed and analysed by Vilibić and Šepić (2017); in this work, the data were further extended to June 2018, controlled following common quality control procedures and gathered into the MISELA dataset. The complete quality control (QC) procedure is illustrated in Fig. 2, while Fig. 3 demonstrates three examples of sea-level series before and after the procedures were applied.
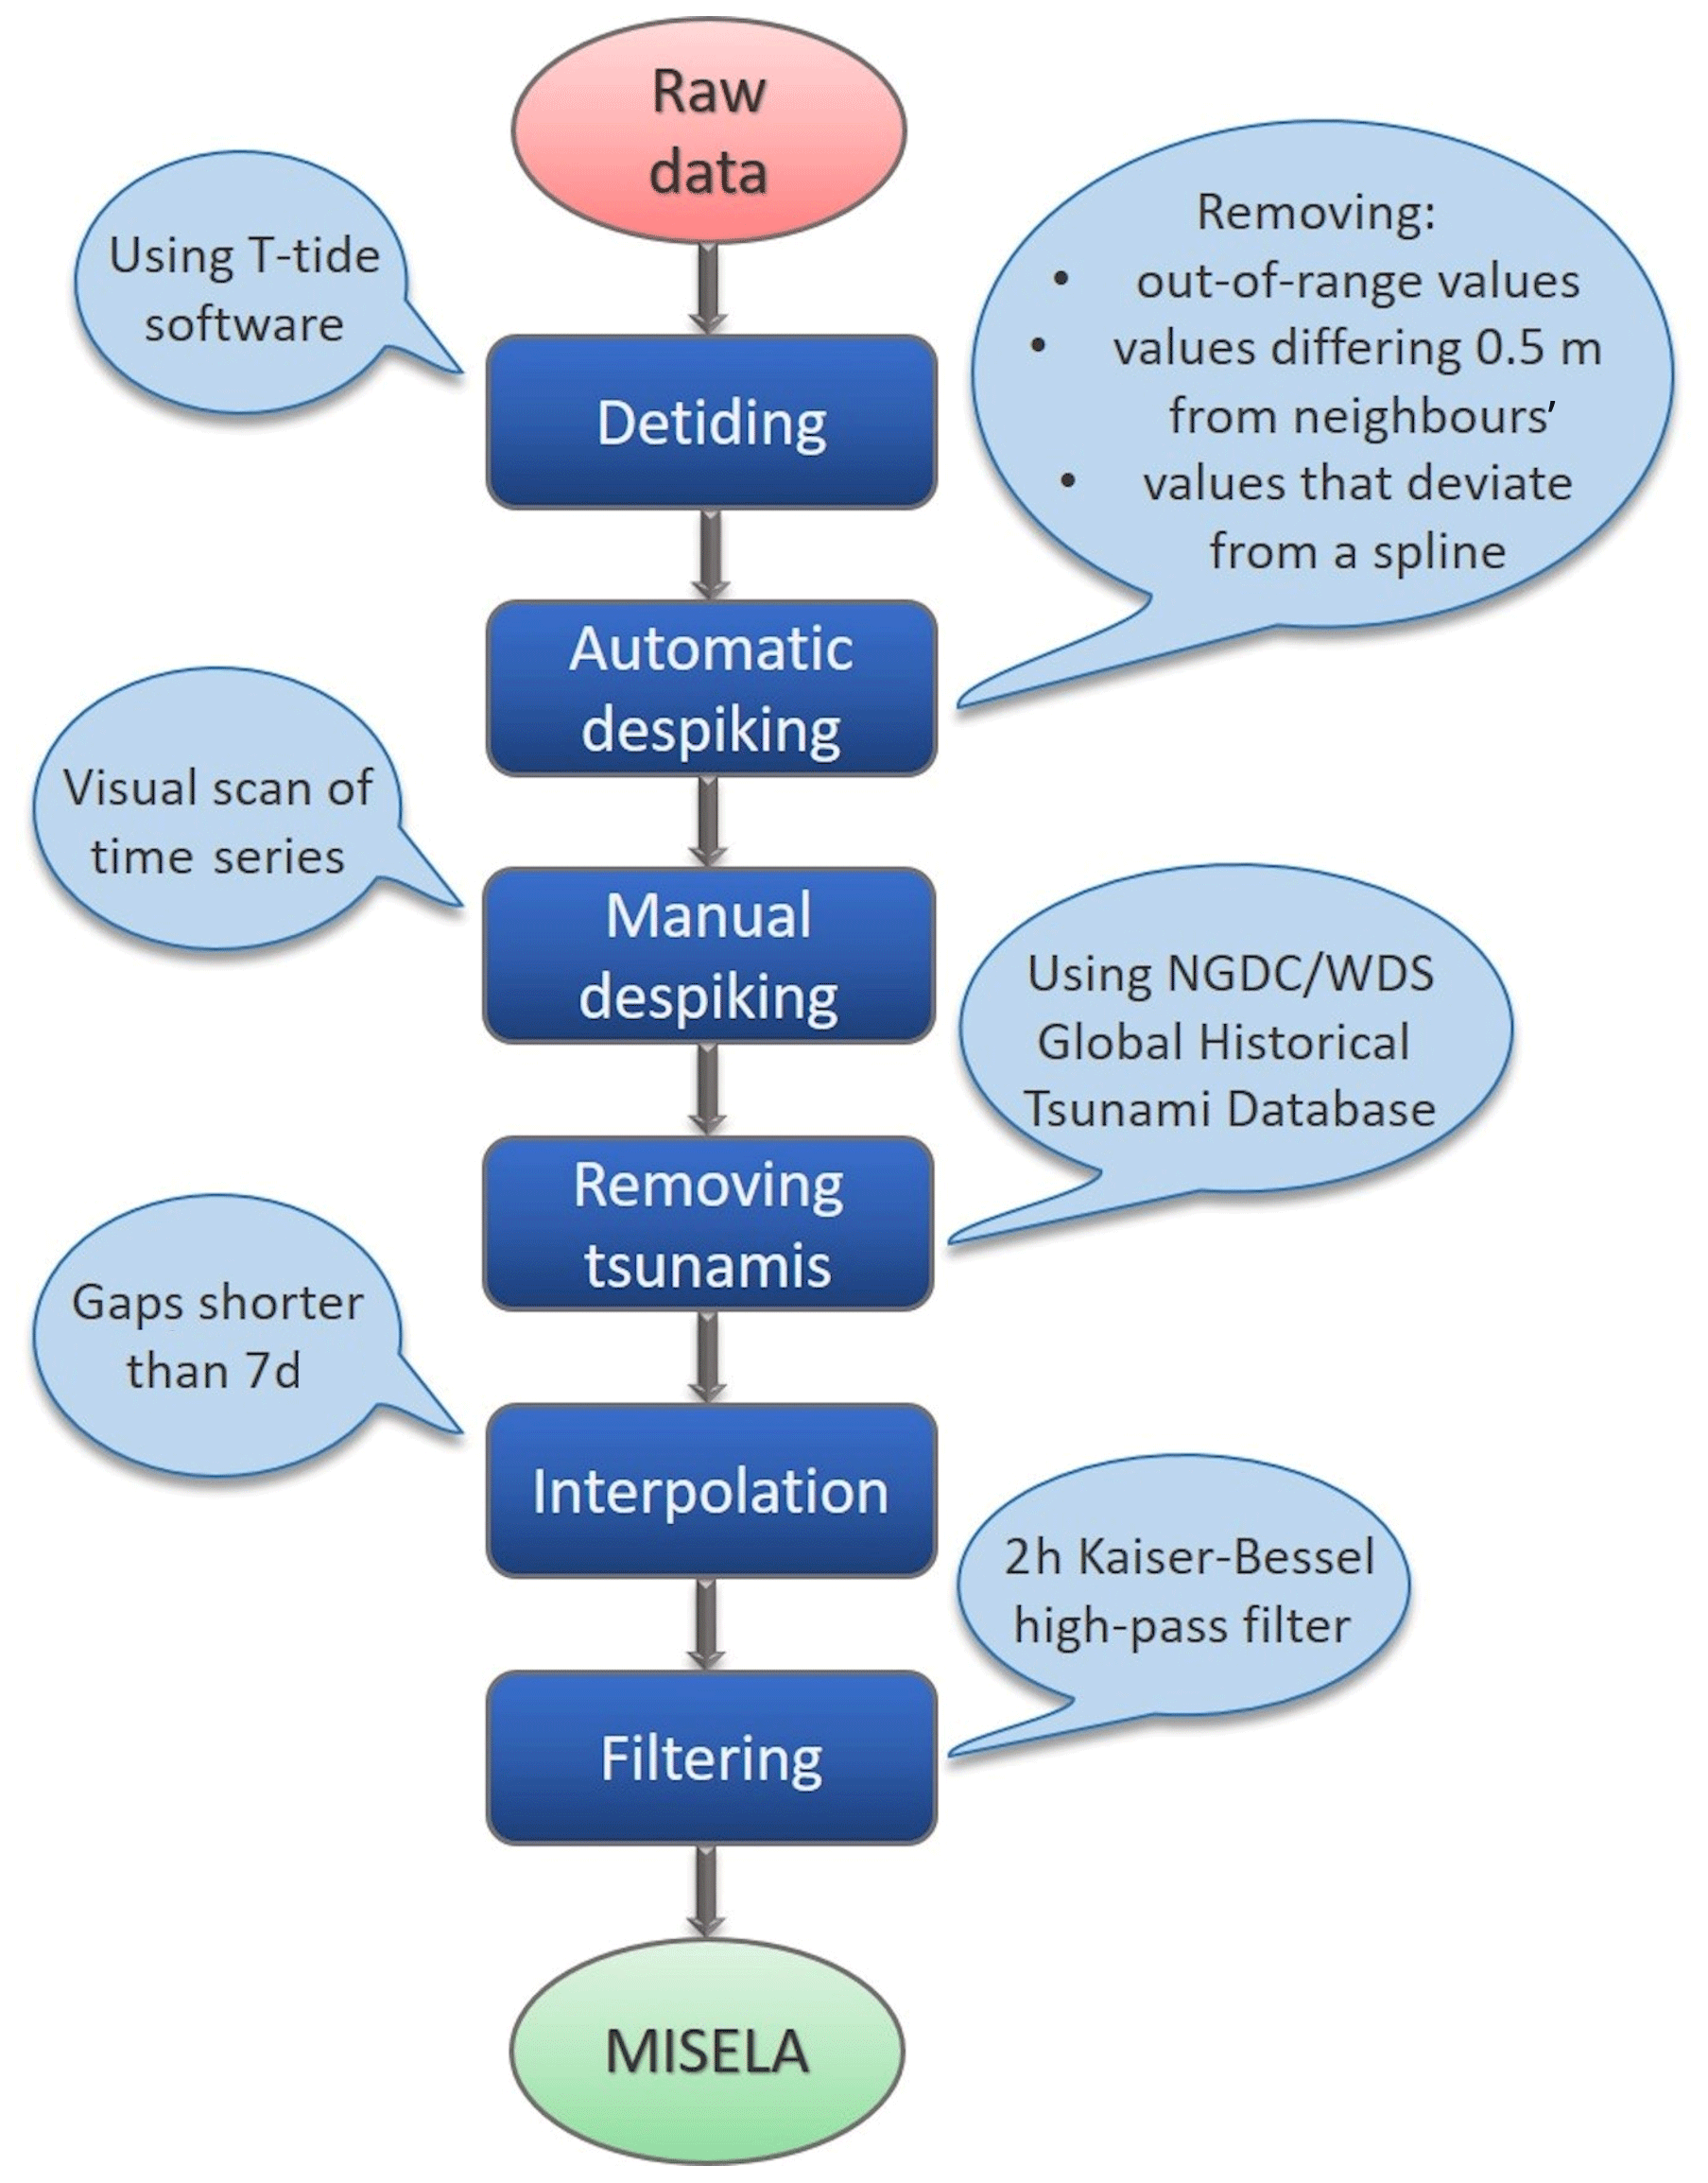
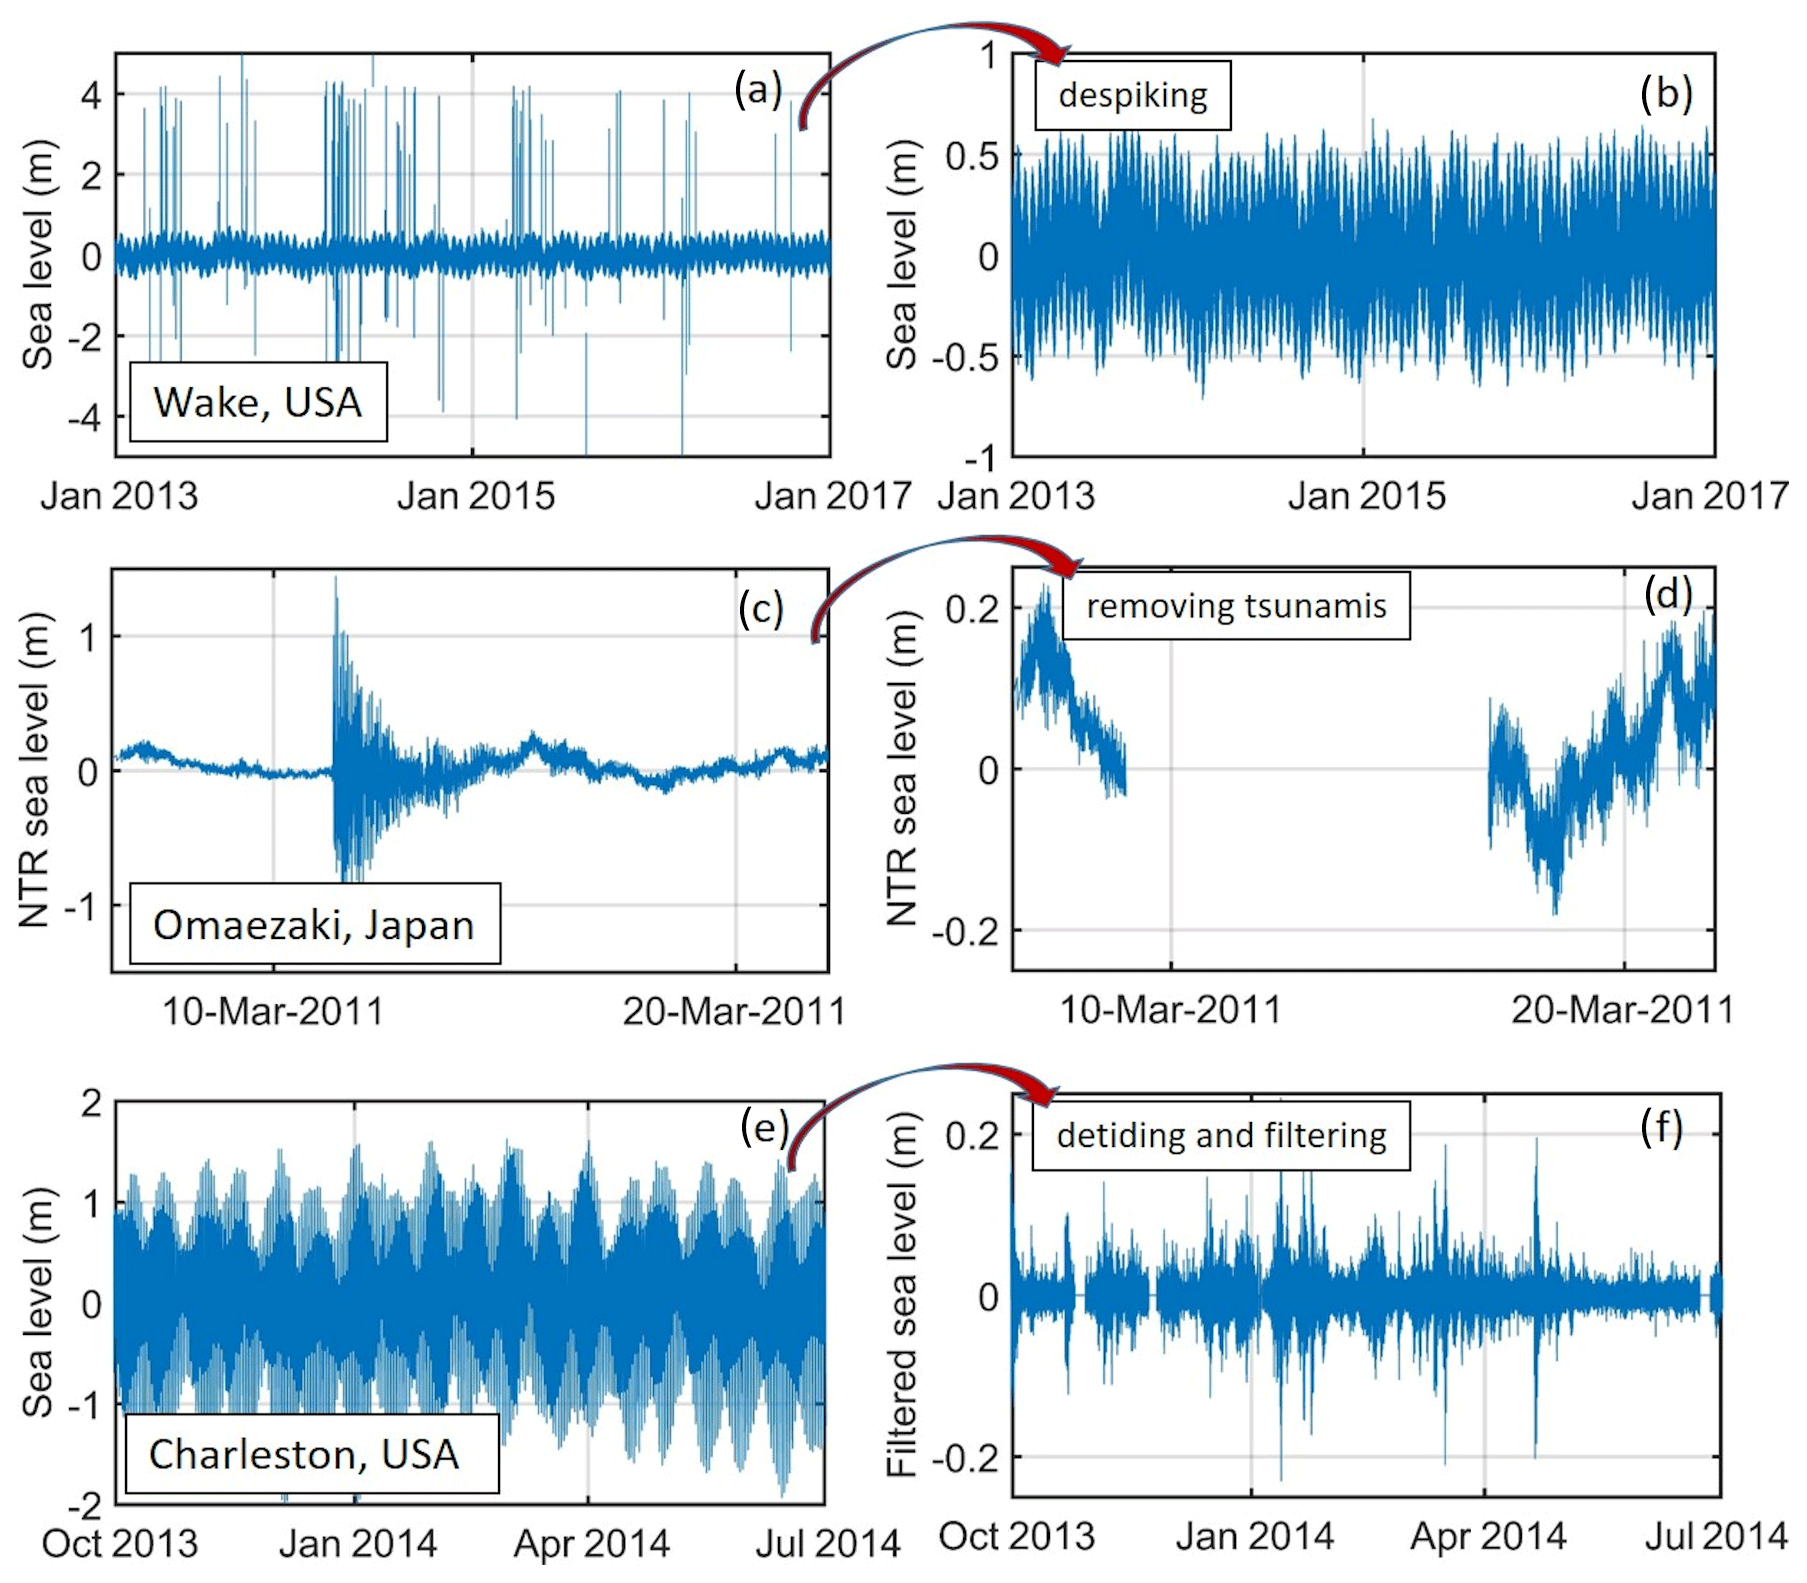
Figure 3Examples of three time series before (a, c, e) and after (b, d, f) processing. NTR stands for the non-tidal residual.
The MISELA dataset contains 331 data files in the NetCDF format, each corresponding to high-frequency sea-level time series from one tide gauge. The file contains three variables: “time”, “nslott” (nonseismic sea-level oscillations at tsunami timescales, Vilibić and Šepić, 2017) and “QC”, along with global attributes including the station code, geographic position of the station, origin of data and contact person for the dataset. Table 1 shows an example of a MISELA file with the station name “abas”. This is a four-letter station code taken from the IOC Sea Level Station Monitoring Facility website; therefore, one can easily find additional metadata about each IOC station if needed (e.g. location, country, local contact, type of sensor). The FMI and IOF stations differ from the IOC stations in that they have the full name of the station location in the title of the files (e.g. “helsinki”, “degerby”, “velaluka”, “starigrad”) instead of a shorter code name. The variable time is represented in the unit of minutes since 1 January 2000 00:00:00 UTC with the sea-level value noted in the same row as the nslott variable and the corresponding quality control flag of the data in the QC variable. The dimension of the variables provides quick information on the record length, considering that approximately half a million data points represent a 1-year-long record. The nslott variable is the final product obtained after the whole quality control process and contains the sea-level time series filtered with a high-pass filter (cut-off period of 2 h).
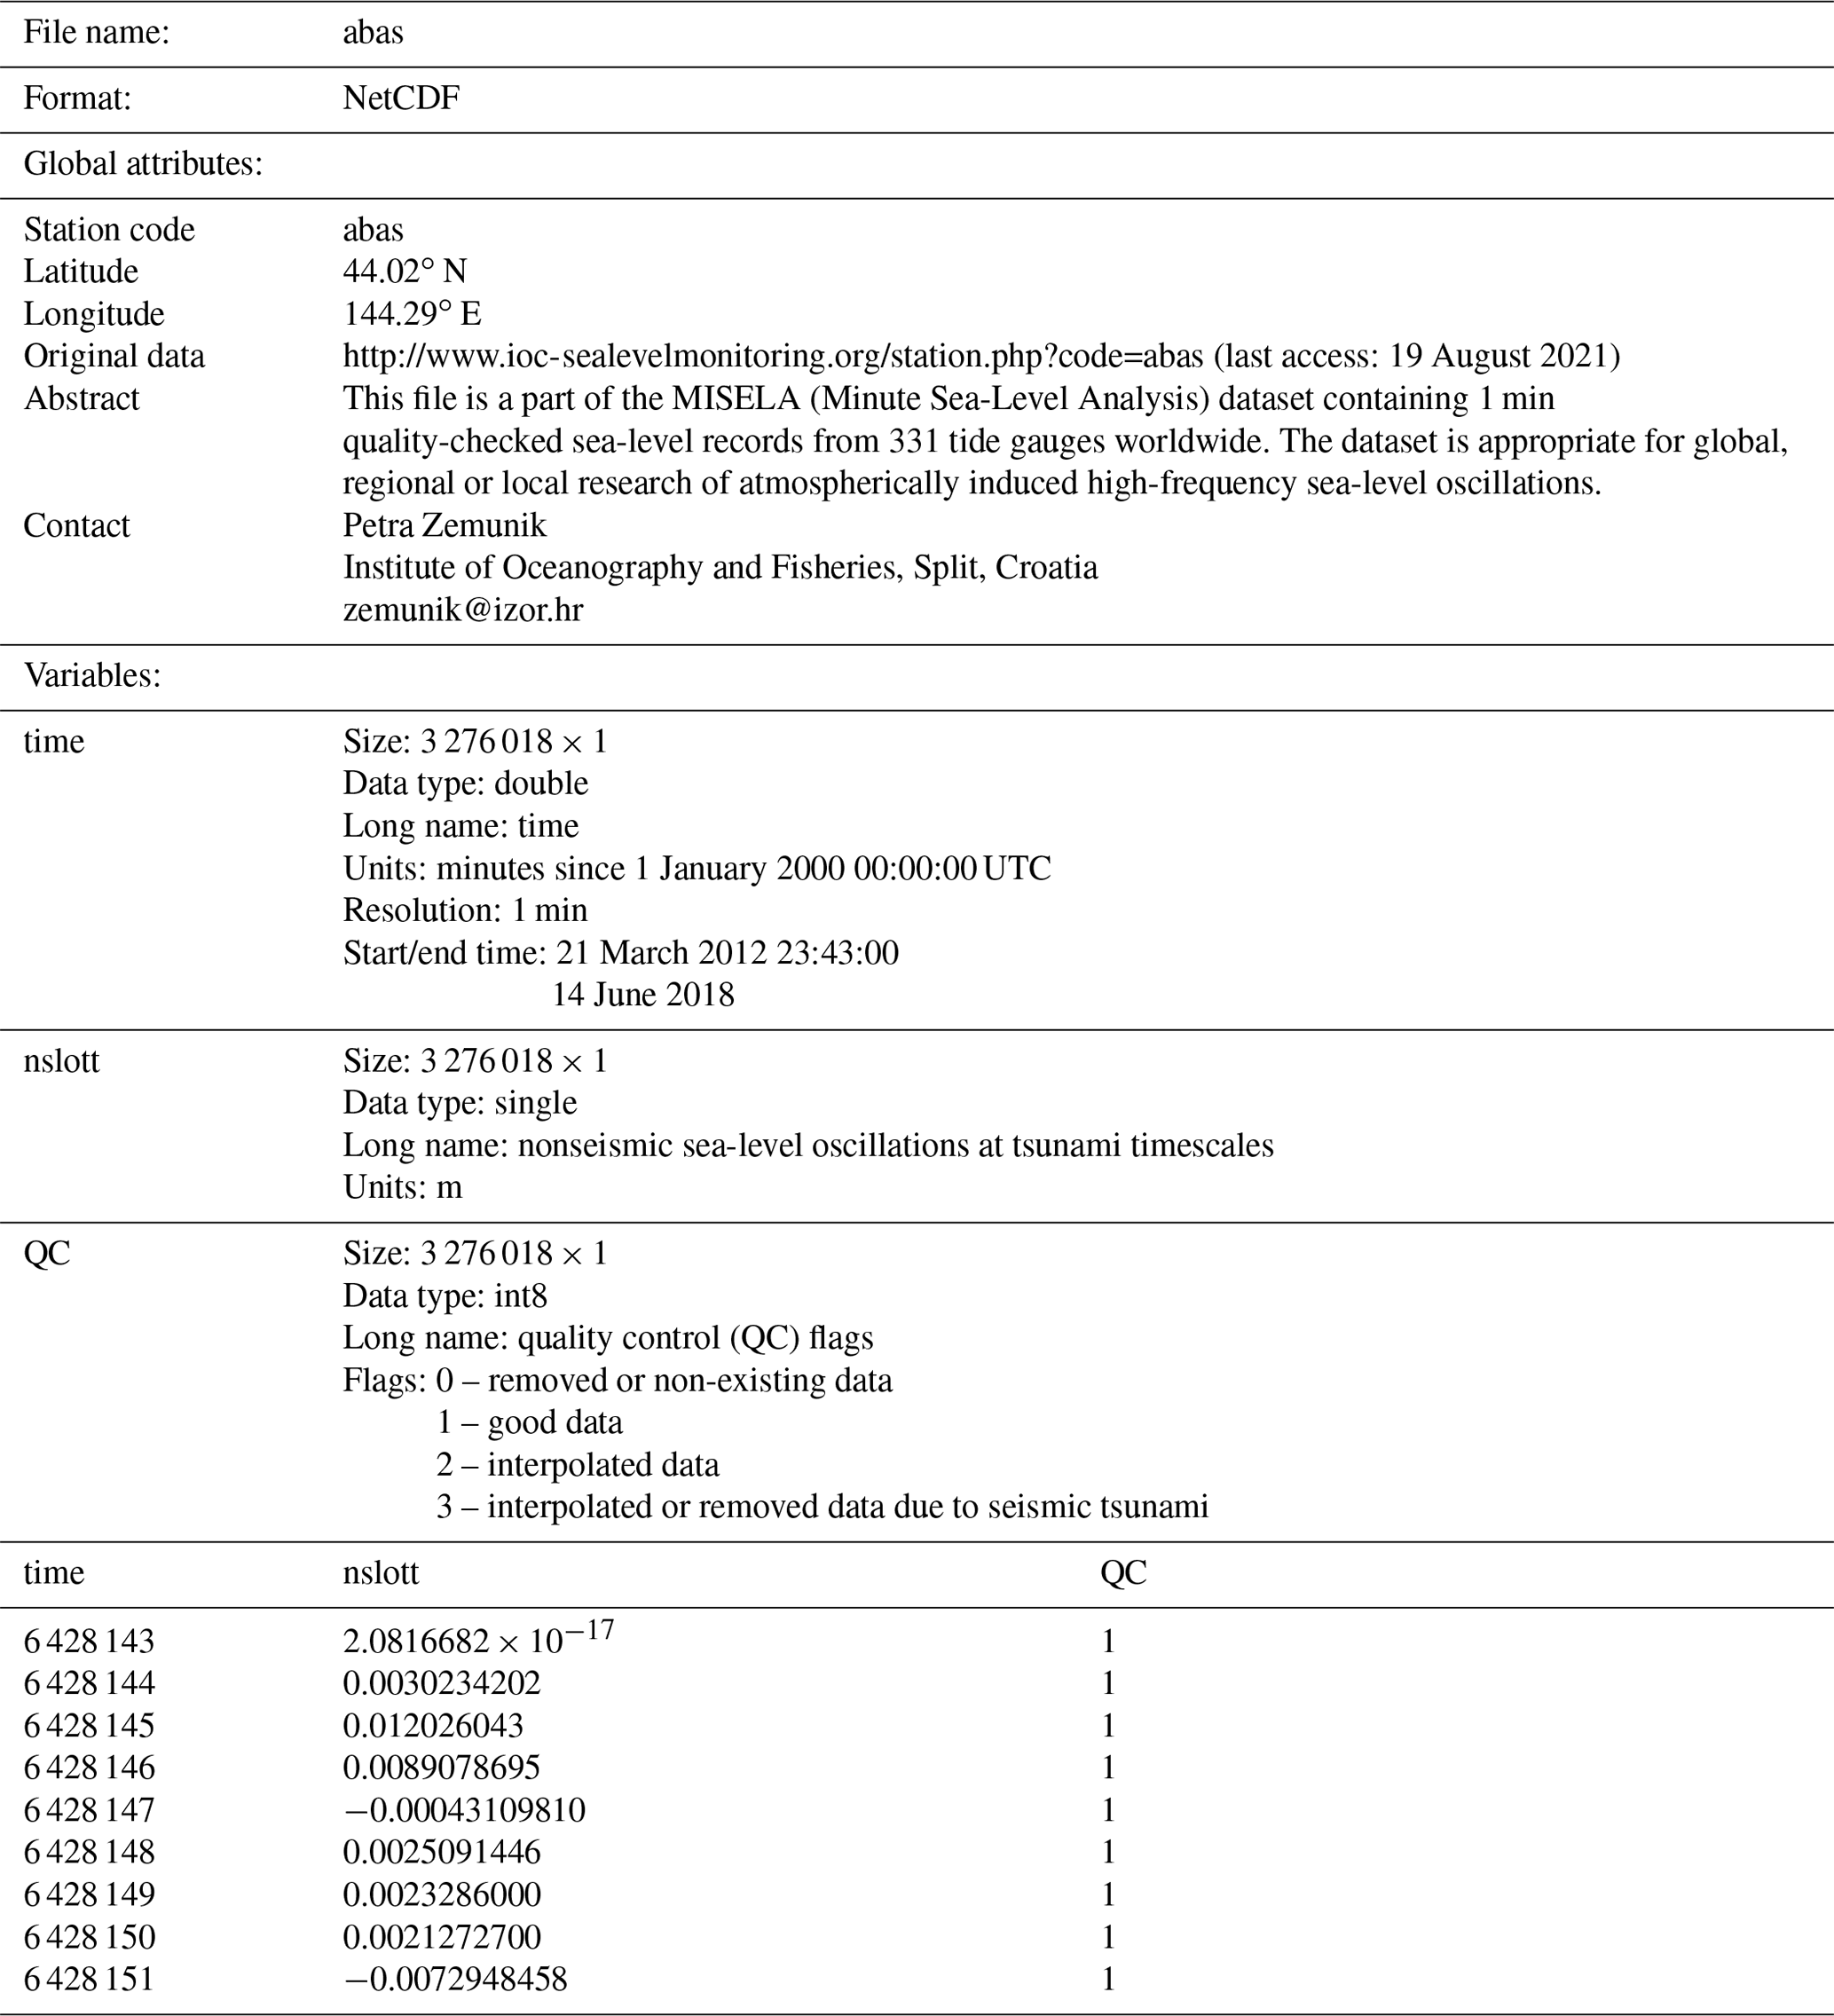
Figure 4 shows that stations included in the MISELA dataset cover many of the world's coasts. The tide-gauge network is denser in the areas with a long history of sea-level monitoring, in particular at the tsunami timescale, like the Mediterranean Sea, both the East and West coasts of America and the coasts of Chile and Australia. Additionally, many island countries and archipelagos have well-developed networks of tide gauges, such as Japan, New Zealand, the Aleutian Islands, Hawaii and the Caribbean. However, some areas, including the east coast of South America and the entire African coast, the Middle East, and the Indonesian and Russian coasts, are still underrepresented in the IOC SLSMF, presumably due to underinvestment in sea-level monitoring or due to data-sharing restriction policies. In general, the Northern Hemisphere dominates over the Southern Hemisphere in terms of spatial coverage (70 % of stations are in the Northern Hemisphere), particularly in the zone between 30 and 60∘ N that contains 137 densely deployed stations spread over the coasts of North America, Europe and Japan.
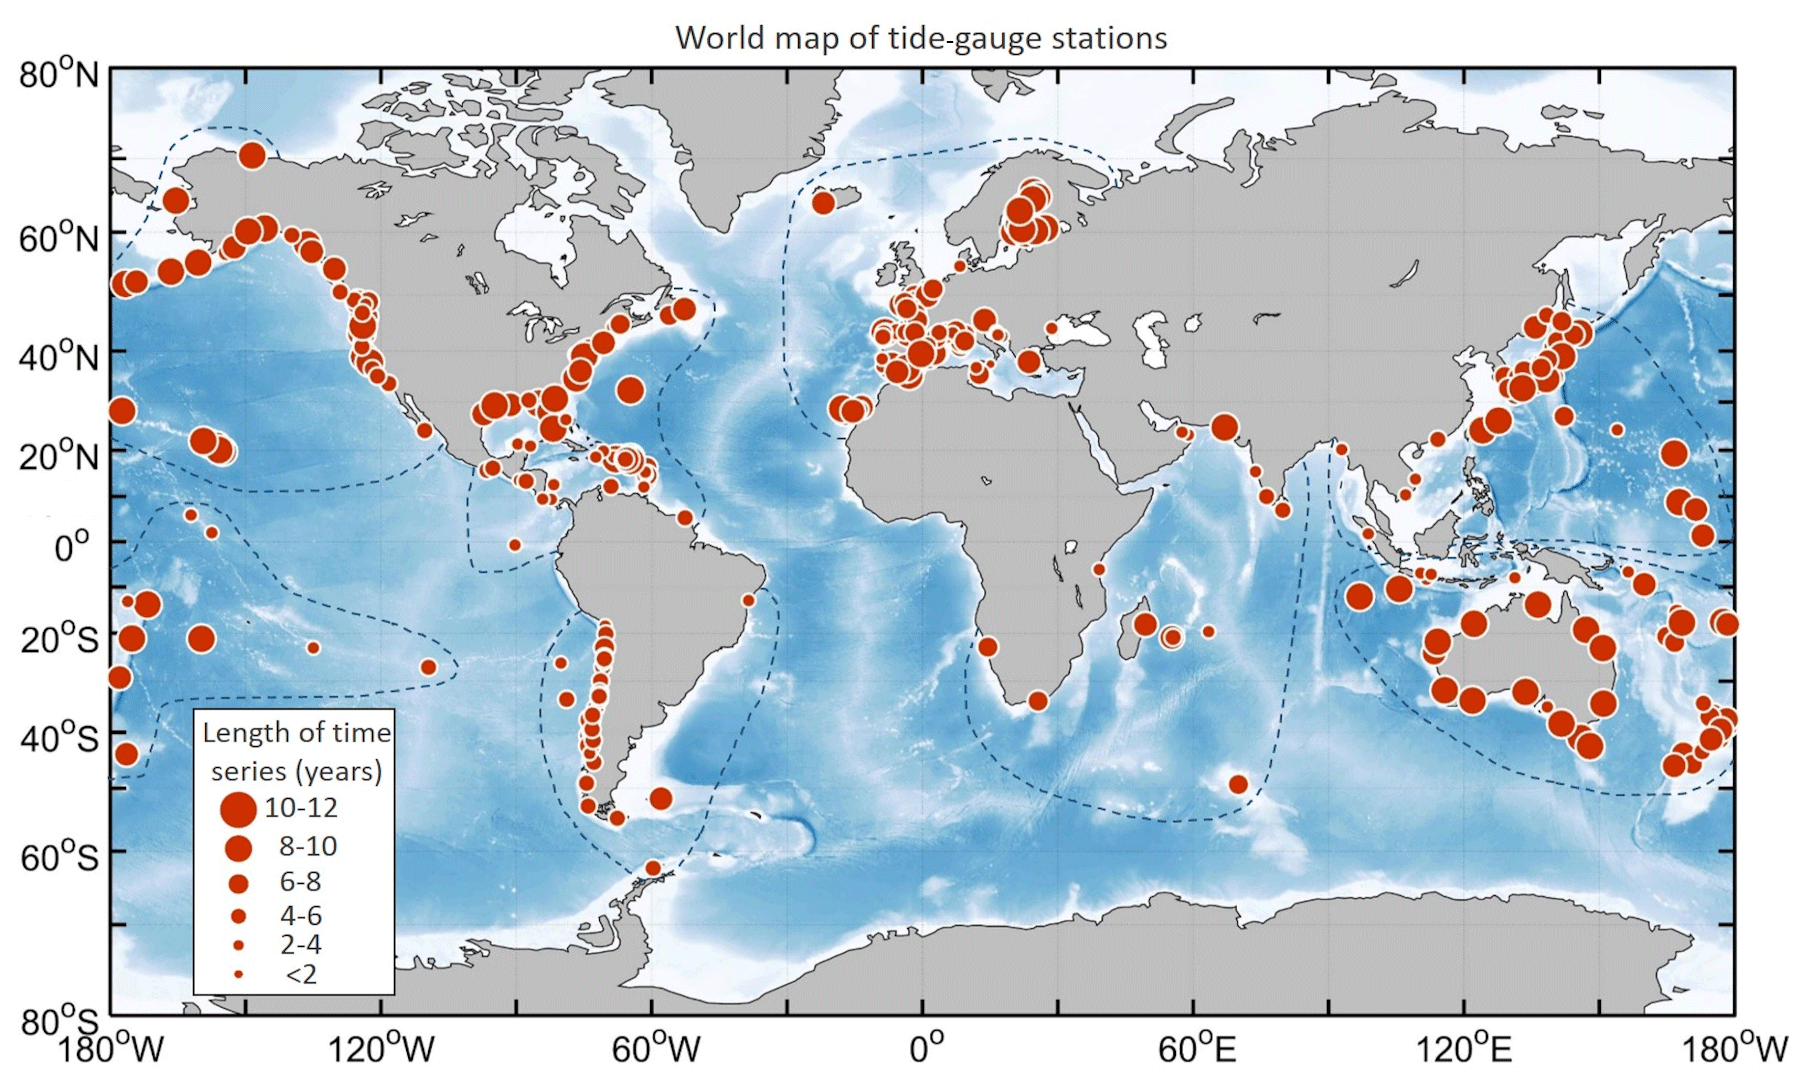
Figure 4A world map of the MISELA station locations. The size of the circles is proportional to the length of the time series. The borderlines between different macro-regions are indicated.
Figure 5 shows a close-up of areas populated by stations, revealing densely distributed tide gauges on the coasts of the western Mediterranean and Europe, the Finnish coast, the Gulf of Mexico, the Caribbean Islands, the East and West coasts of America, and the Japanese and Chilean coasts, indicating that satisfactory coverage exists for regional investigations.
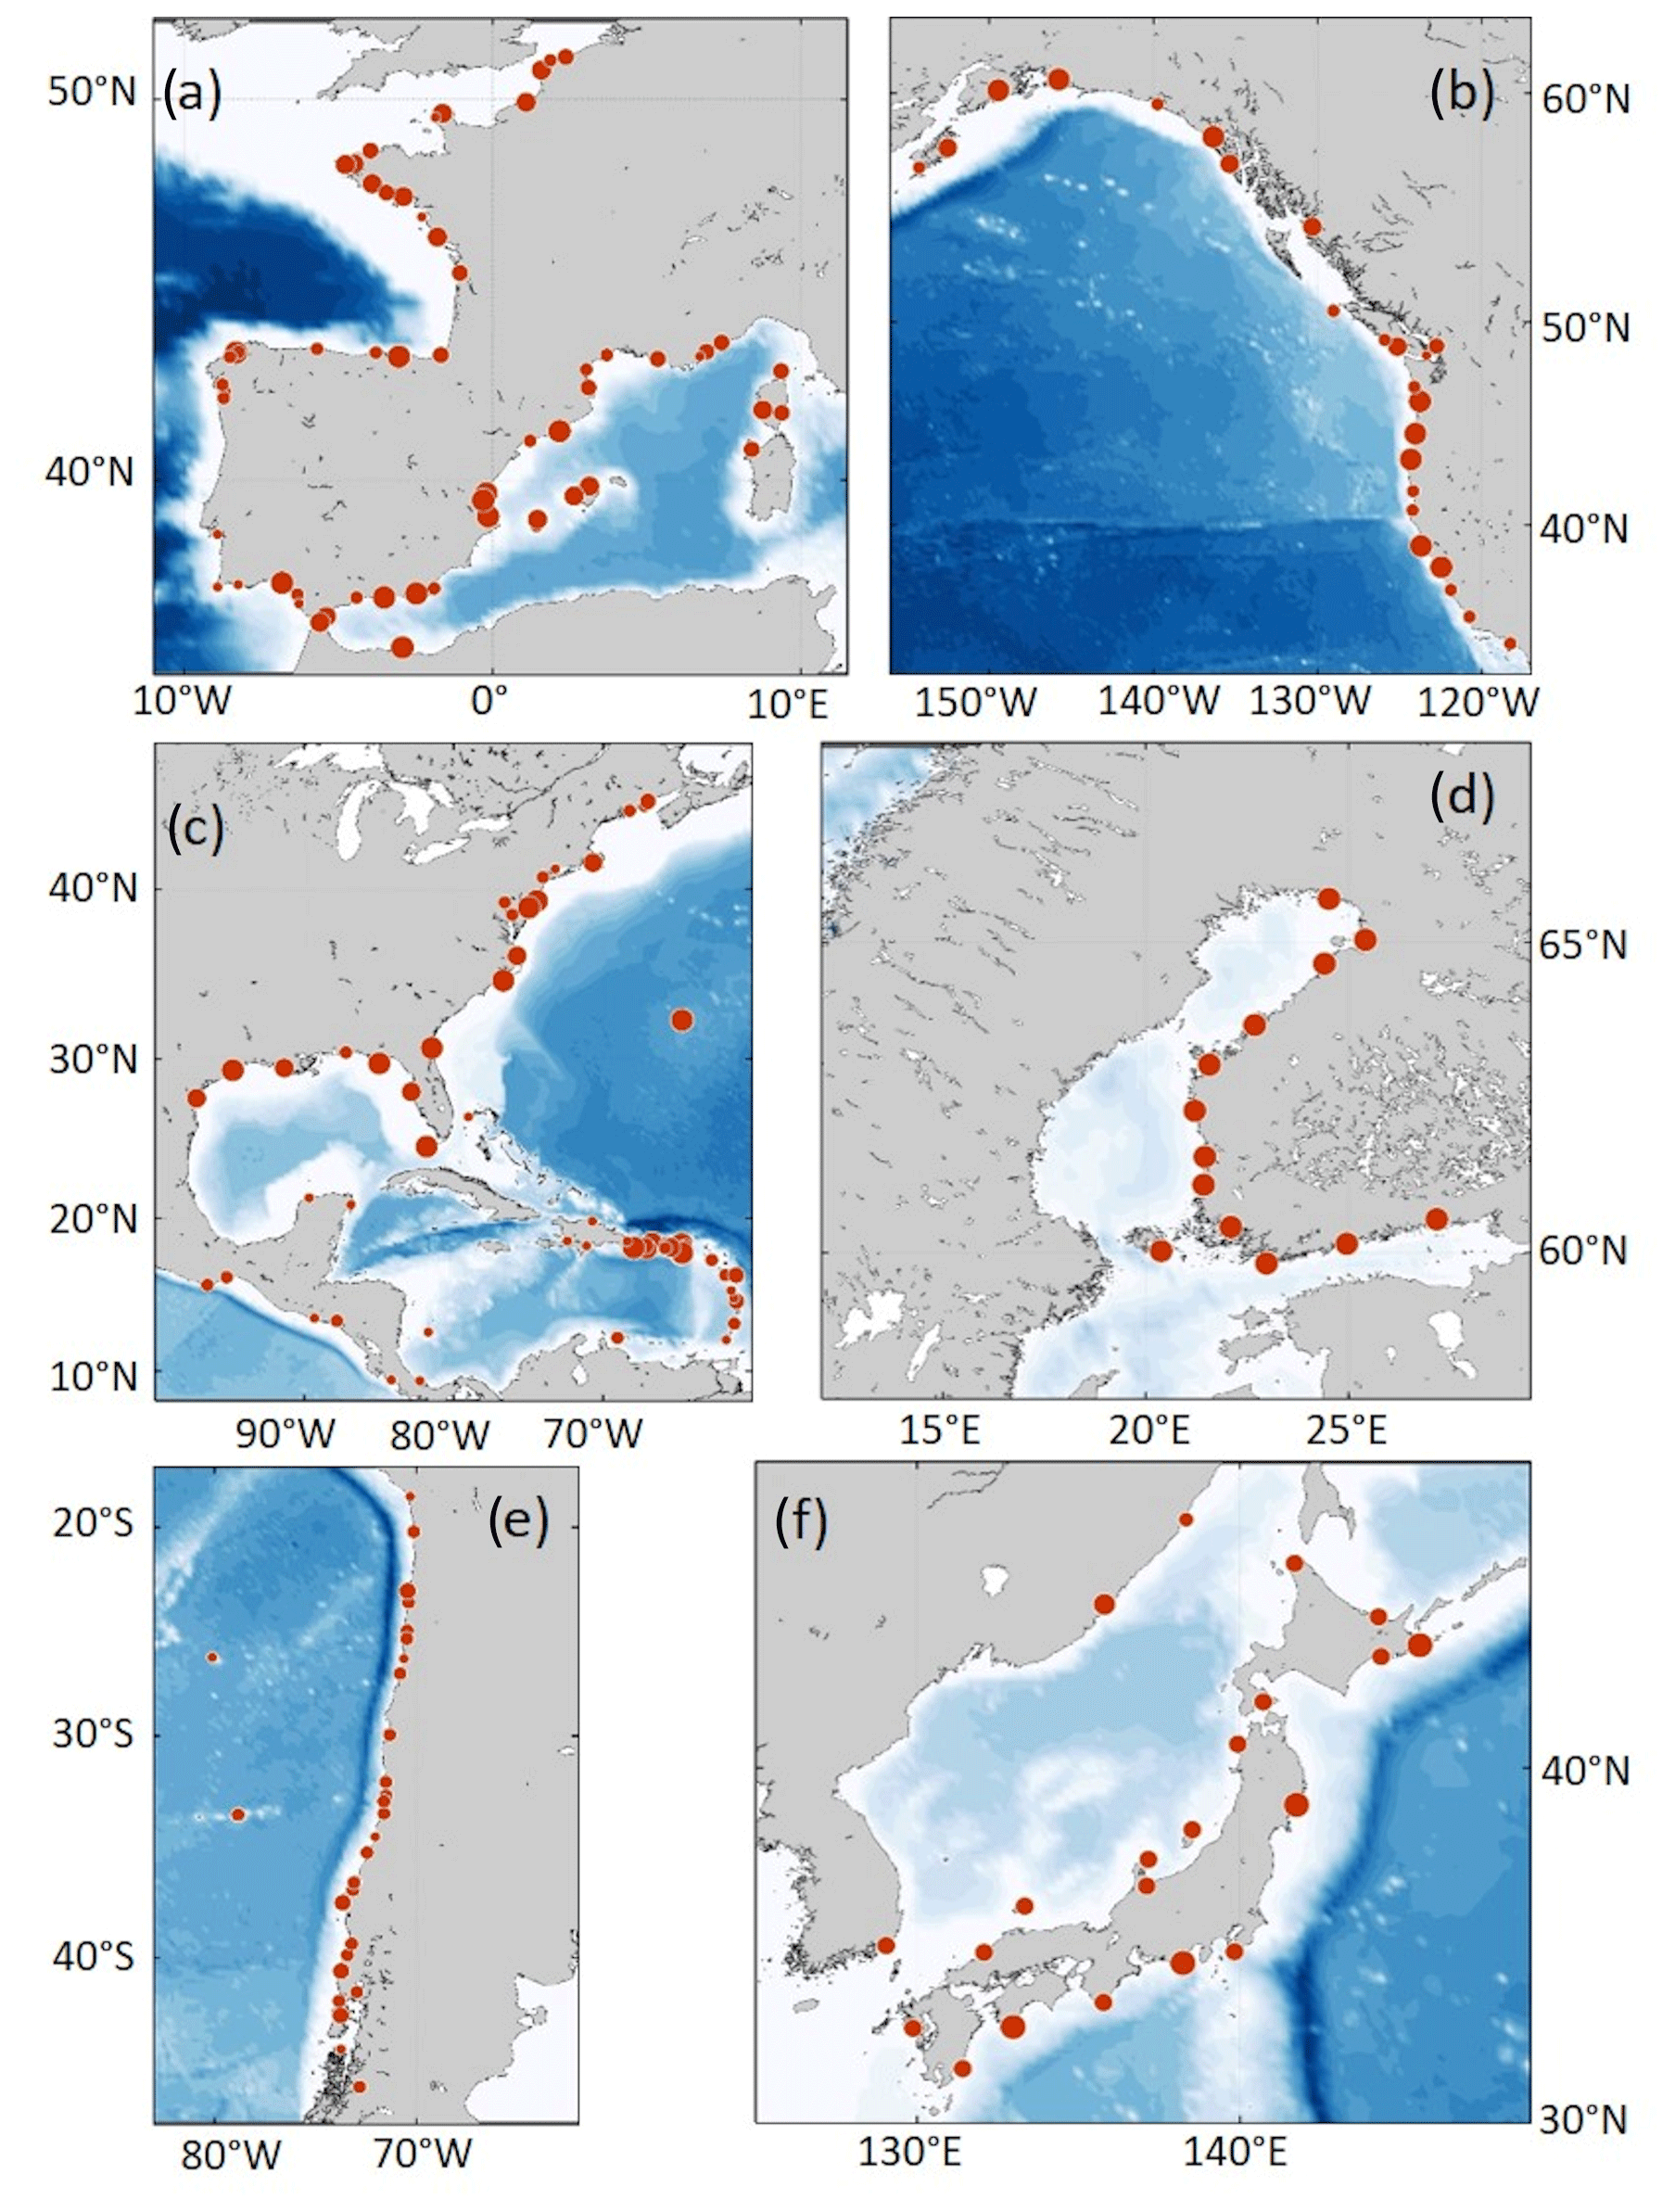
Figure 5A close-up view of areas populated by stations: (a) the western Mediterranean and western Europe; (b) the West Coast of America; (c) the Caribbean, the Gulf of Mexico and the East Coast of America; (d) the Finnish coast; (e) the Chilean coast; and (f) the Japanese coast.
In total, the MISELA dataset contains 2303 station-years of data spanning between 2004 and 2019, with an overall average record length of nearly 7 years, although this varies from only 1.5 years at some stations to 12 years at others. Longer records (> 10 years) are primarily located in the Baltic region and Australia, whereas shorter records (<4 years) are grouped in Chile, Central America and Indonesia. An important contribution to the overall dataset comes from densified subsystems, such as the Mediterranean, Japan, the Gulf of Mexico and New Zealand, for which records of various lengths can be found.
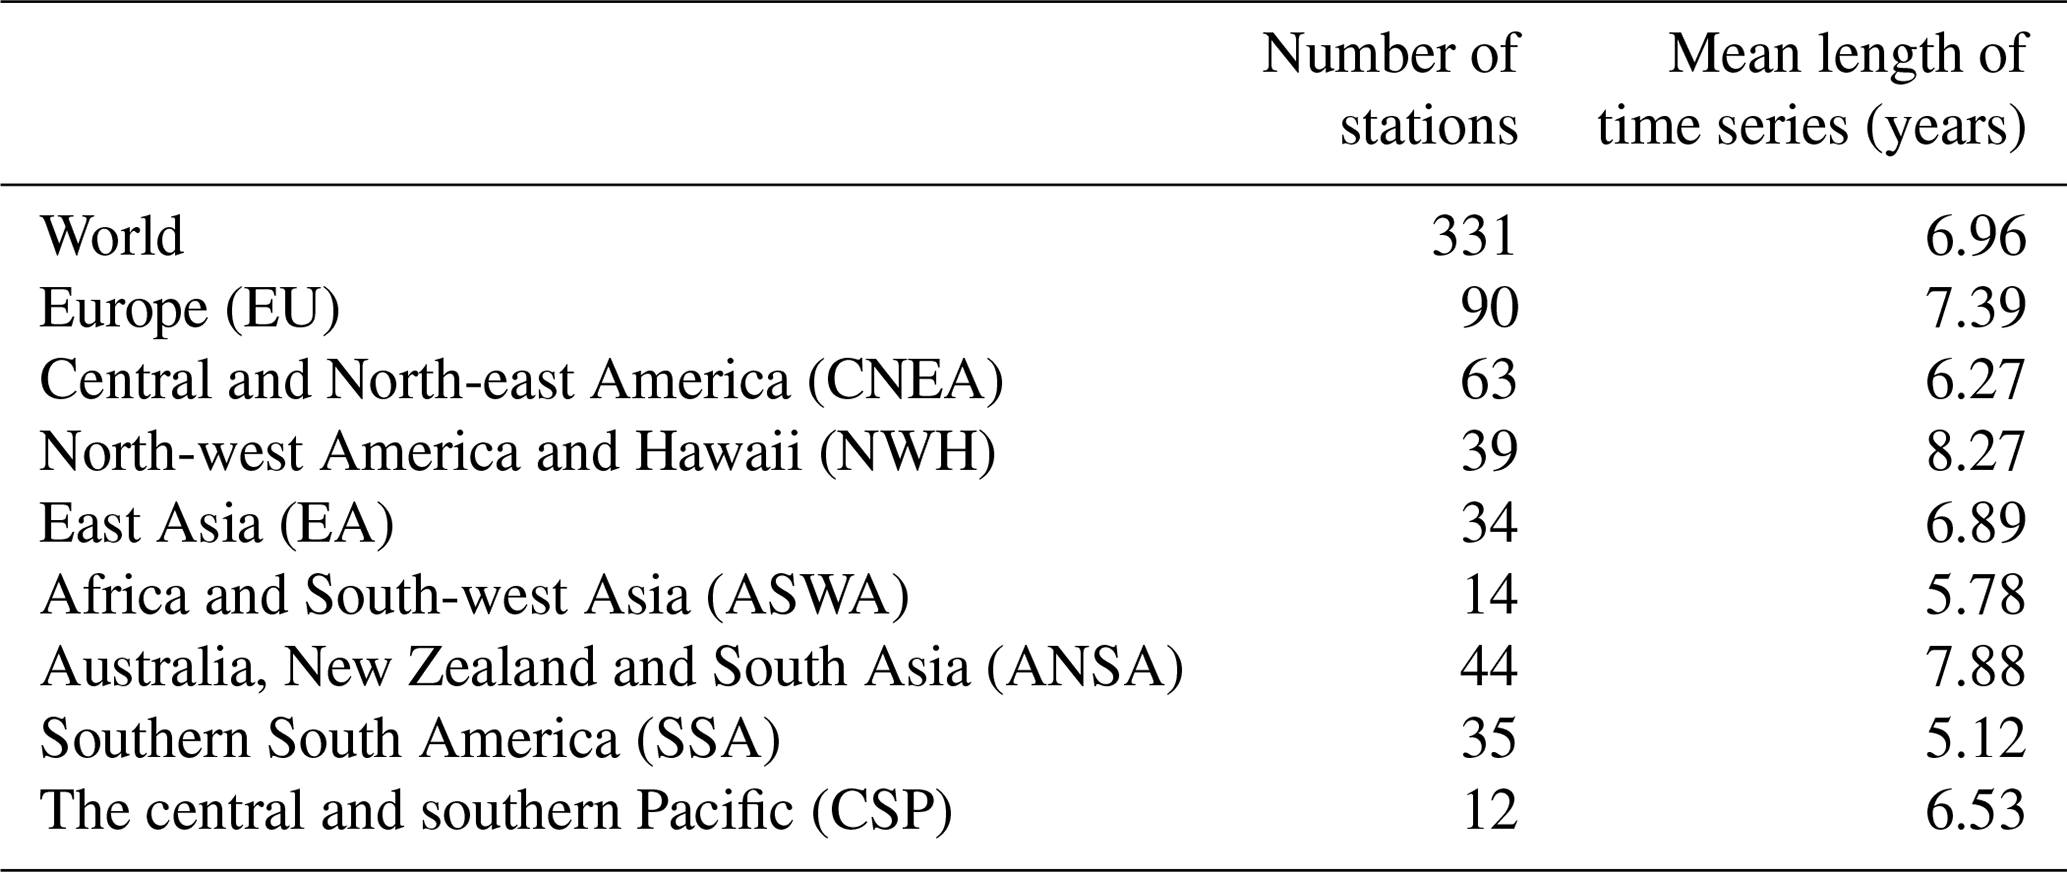
For regional statistics, we classified stations into eight macro-regions: Europe (EU), Central and North-east America (CNEA), North-west America and Hawaii (NWH), East Asia (EA), Africa and South-west Asia (ASWA), Australia, New Zealand and South Asia (ANSA), southern South America (SSA) and the central and southern Pacific (CSP). Table 2 shows that, on average, the longest time series (8.3 years) are available for the stations in the NWH macro-region, followed by the ANSA and EU macro-regions (7.8 and 7.4 years respectively), whereas, on average, the shortest records are found in the SSA and ASWA macro-regions (5.1 and 5.8 years respectively). Interestingly, some of the longest individual records are found in the ASWA macro-region, which mostly has shorter time series (Fig. 6b).
Table 2Number of stations and the mean length of time series (in years) in each macro-region and globally.
Most of the sea-level observations in the MISELA dataset were made after 2011, when many tide gauges were installed or added to the IOC Sea Level Station Monitoring Facility as a reaction to the disastrous 2011 Tōhoku earthquake and tsunami in Japan (Simons et al., 2011; Fig. 6a). The expansion of the sea-level network in 2012 is particularly evident for the EA, CNEA and NWH regions, and numerous stations were also added in the SSA region in 2013. The EU area continuously has the highest number of stations among all macro-regions. All macro-regions show a positive trend in the number of active stations over the period from 2006 to 2018. It should be highlighted that we obtained records from the IOC stations for the period from as early as 1 January 2006, when the portal began operating, up until 14 June 2018, when we last downloaded data. Unfortunately, we have not downloaded sea-level time series since 14 June 2018 due to extended time requirements involved with the data quality control. Nonetheless, most stations had been installed or started providing data after than January 2006 and some were uninstalled or stopped providing data before June 2018; therefore, these stations contain shorter records. Records from the 4 IOF stations end in December 2019, and records from the 13 FMI stations begin in January 2004 (the EU region), resulting in a lower number of stations at the beginning and at the end of the whole MISELA period (2004–2019; Fig. 6a).
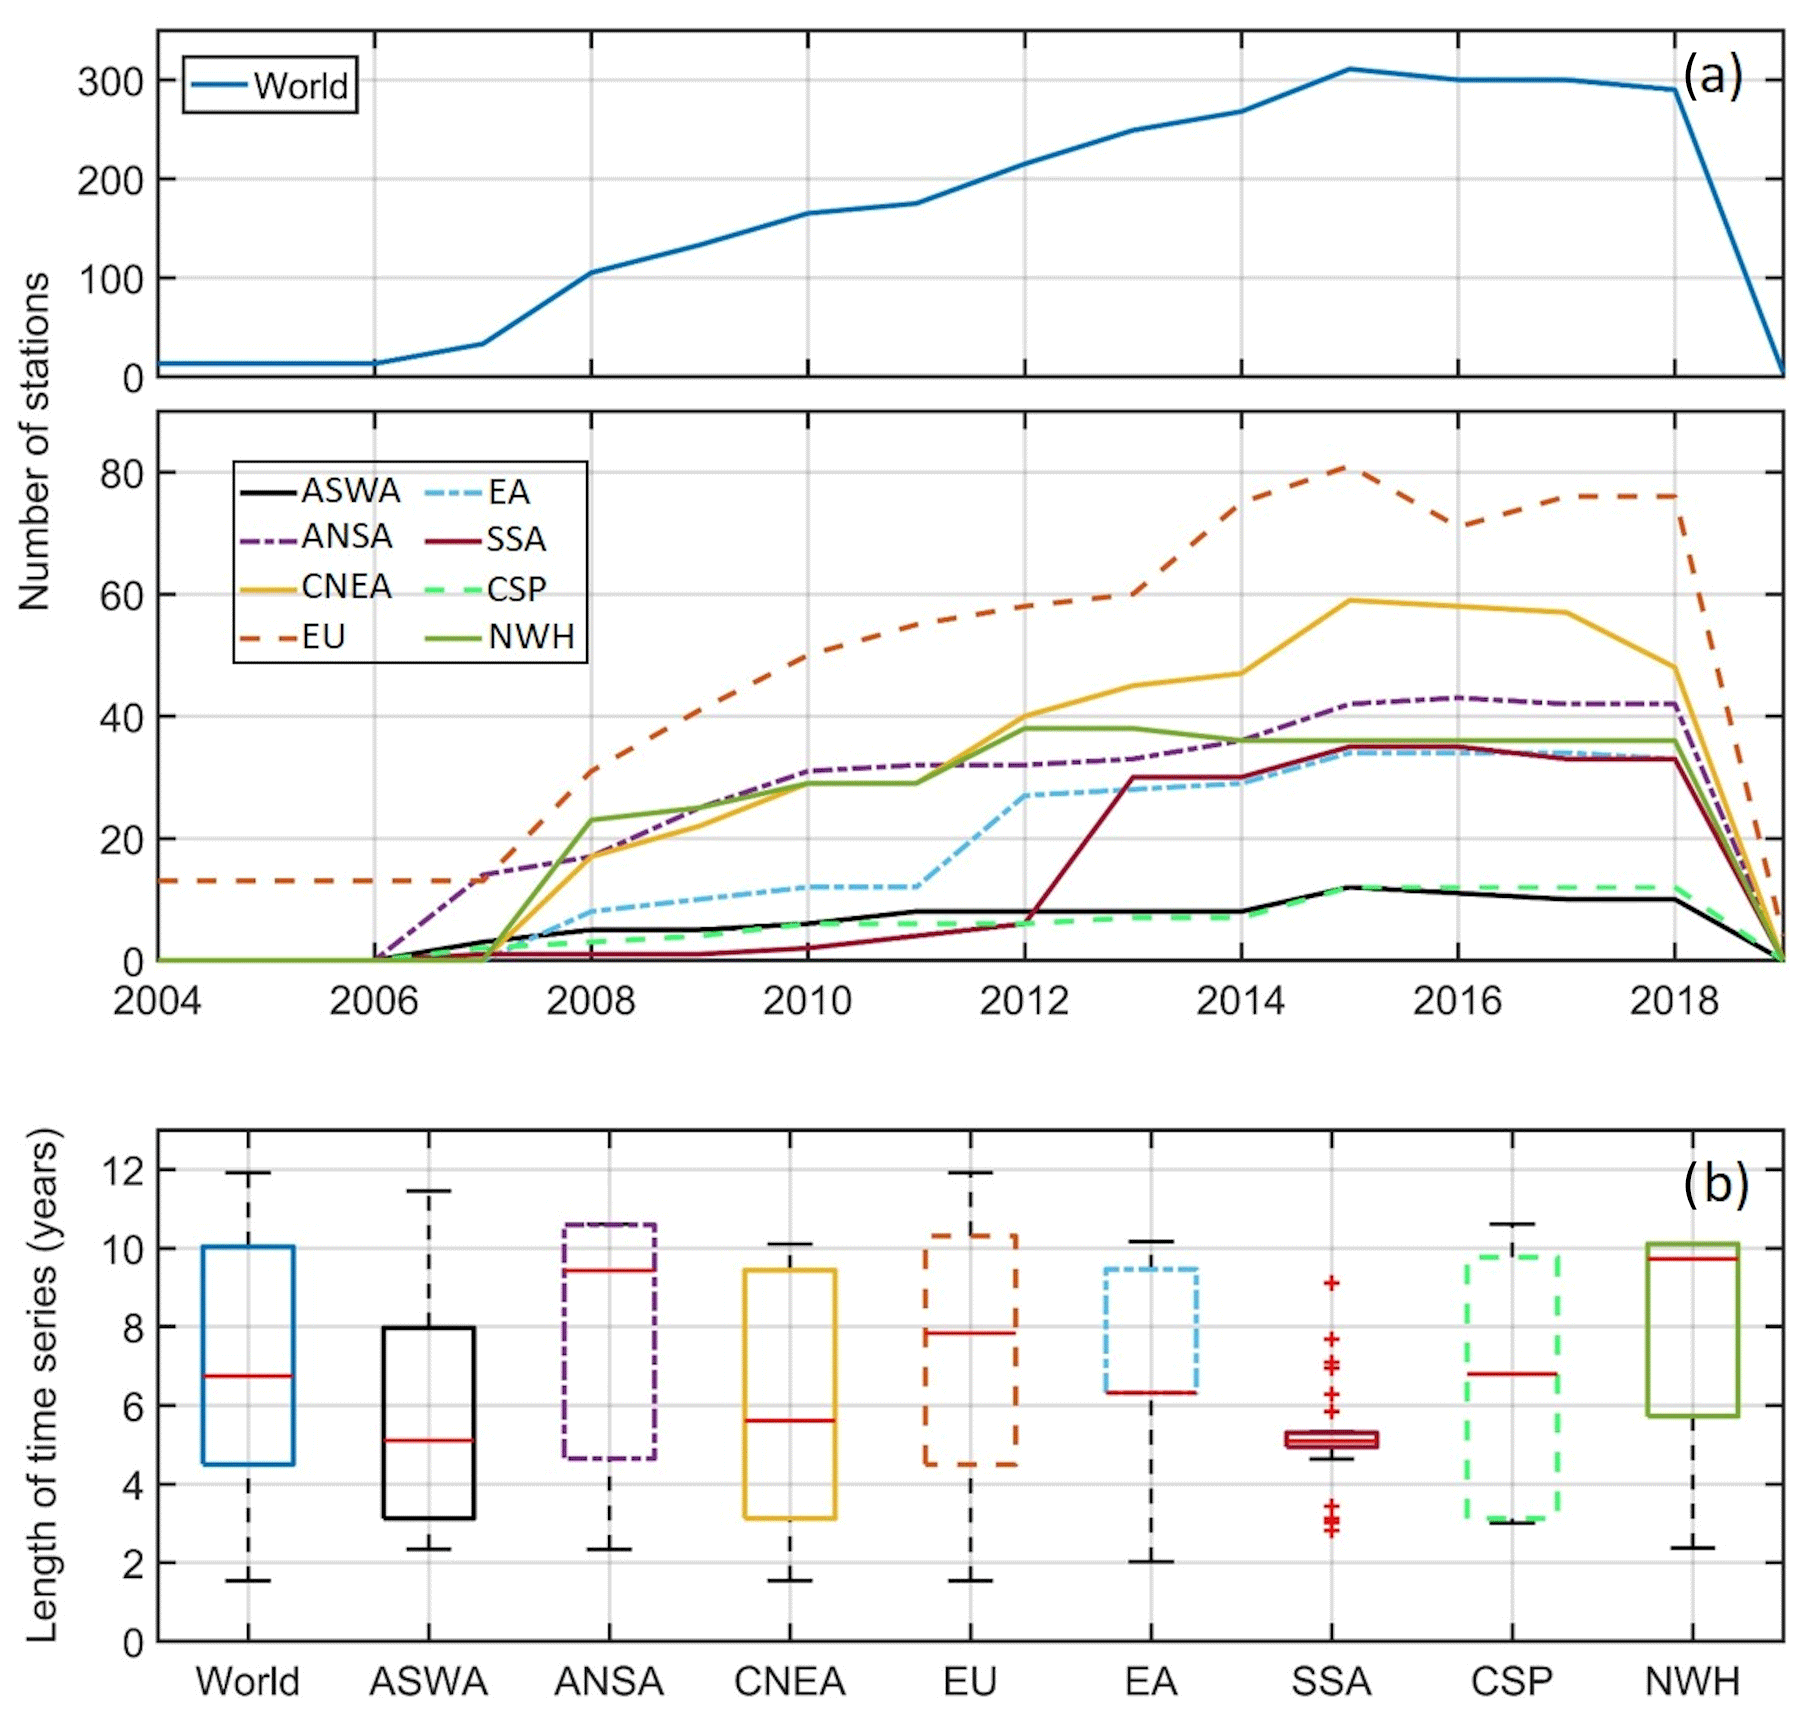
Figure 6(a) Annual number of stations present for the years between 2004 and 2019, and (b) boxplots of the length of the time series in each macro-region and globally. On each boxplot, the central red mark indicates the median, and the bottom and top edges of the box indicate the 25th and 75th percentiles, respectively. The whiskers extend to the lowest and highest values (not considered as outliers), and the outliers are shown as red pluses.
The data described in this paper can be accessed through the Marine Data Archive of the Flanders Research Institute (VLIZ) at https://doi.org/10.14284/456 (Zemunik et al., 2021b).
A new global dataset of high-frequency sea-level oscillations, the MISELA dataset, was specifically designed and created to serve as a tool for coastal hazard assessment, in particular those from atmospherically induced high-frequency sea-level oscillations. The ability to study this hazard has, until recently, been restricted by technological and computational limitations on data storage, computational power of data-processing systems and telecommunications of earlier tide-gauge technology. Fortunately, the “rate” of research on high-frequency sea-level oscillations, in particular on meteotsunamis, has strongly increased in recent years (Vilibić et al., 2021). It is not certain how high-frequency sea-level oscillations will change under the future climate scenarios; however, there are methods that describe a methodology for estimating their future occurrence rates (Vilibić et al., 2018). Therefore, it is important to have a dataset that may provide the quality-checked global data for such coastal studies.
The MISELA dataset merges data from different sources to create a consistent dataset, which may serve for research into the magnitude and incidence of moderate and extreme high-frequency sea-level phenomena, like meteotsunamis, on the global scale. The primary motivation stems from the need to gather measurements, standardize them and bring them to a research-quality level. To date, none of the existing sea-level databanks have provided a global quality-checked dataset with a sampling interval of 1 min. However, it should be emphasized here that the quality control procedure imposes some limitations on the dataset. Numerous issues (including shifts, drifts and spurious signals) in the raw data disabled the preparation of high-quality 1 min sea-level data from original measurements; instead, this work was forced to focus solely on high-frequency part of the signal. Filtering of the data removed vertical shifts and drifts that could not be removed by other automatic procedures. This has restricted the use of the MISELA dataset to research of high-frequency processes only. Furthermore, some issues have remained unresolved – for example, datum and clock shifts have not been processed, as this would require a tremendous amount of time and information that is not available at IOC SLSMF. Nevertheless, we expect that these issues only impact a low percentage of the overall data. Another future improvement of the dataset could be achieved by filling the data gaps with data from other sensors (where more than one is available), rather than interpolating. However, various sensors may measure sea-level oscillations at a 1 min timescale differently, due to the use of different averaging methods or the fact that some sensors are installed in a stilling well whereas others are not. Thus, the standardization of data from different sensors is required at locations where it can be achieved, although this depends on time, effort and financial investment. Nevertheless, this would be a way to improve the MISELA dataset.
Herein, we suggest several components of the future perspective in the research of high-frequency sea-level phenomena. The main component is concerned with an increase in the sampling resolution for numerous tide gauges that have retained a lower sampling frequency. Another component, emphasized by the Global Sea Level Observing System (GLOSS), refers to the installation of tide gauges according to all international standards on coasts where no gauges currently exist (IOC, 2012). New tools and technologies for observing and processing sea-level data (e.g. Pérez et al., 2013; García-Valdecasas et al., 2021) have enabled instrumentation to reach a standard in sea-level measurements at a 1 min timescale, thereby contributing to the improvement of existing high-frequency sea-level networks and the development of new ones. This also includes the development of quality control procedures in real time; however, for scientific purposes, such automatic quality control may not be sufficient to reach a fully controlled data product. The recent manual on the quality control of sea-level data (UNESCO/IOC, 2020) has gathered all relevant aspects and recommendations on this topic. In summary, quality checks must maintain common standards, acquire consistency and ensure reliability in order to contribute to processing the data according to the FAIR (Findability, Accessibility, Interoperability and Reusability) Guiding Principles for scientific data management and stewardship (Wilkinson et al., 2016). Following these principles, all time series stored in the MISELA dataset have undergone a standardized quality control procedure (described in Sect. 2.2). However, the vast efforts during the quality control were spent on visual (manual) inspection, as the series suffer from data issues that are not detectable by automatic procedures. Together with the development of new techniques for quality control and a great effort towards standardization, more procedures can hopefully be automated in the future; hence, the amount of time dedicated to visual inspection may be reduced.
In spite of the above-mentioned arguments, there are tide gauges and tide-gauge networks that have a lower sampling resolution, thereby providing data from which high-frequency sea-level oscillations cannot be extracted nor studied properly. For example, the tide-gauge network of the United Kingdom is still operating with a resolution of 15 min, although such a coarse sampling resolution may strongly affect the estimate of coastal sea-level extremes (Tsimplis et al., 2009). For that reason, Vilibić and Šepić (2017) concluded that the global tide-gauge network should be standardized to sample at a 1 min resolution and to report, as far as possible, near-real-time quality-controlled data. In addition to this, it is mandatory to regularly maintain installed tide-gauge stations to ensure the quality of the data. Hopefully, global sea-level networks will develop in this way in the future.
There are a number of future improvements that could contribute to the evolution of the MISELA dataset. Specifically, some areas have a low station coverage due to sparse sea-level station networks or restrictive data policies, whereas some regions stand out as having made significant developments over the past years. For example, a major gap in the provision of data is related to the African coasts (an exception is part of the East African coast and nearby islands where tide-gauge stations were installed following the Sumatra tsunami). This is not a new issue, as attempts have been made to construct a sea-level network in Africa since last century (IOC, 1997; Woodworth et al., 2007). However, long-term maintenance remains a problem. Moreover, the MISELA dataset contains very few stations in the areas of the Middle East, India, Russia and the east coast of South America. The Global Sea-Level Observing System (GLOSS) core network of active tide-gauge stations today contains a slightly higher number of stations in these regions, although they are excluded from the MISELA dataset as they do not meet specific conditions regarding the length and continuity of the time series and the resolution of the measurements. In addition, in some of these regions, data ownership restricts data exchange (Woodworth et al., 2016); however, we hope that their operators may consider providing 1 min sea-level data to the MISELA dataset in the future. Last but not least, polar regions have always represented a great issue for tide-gauge operations, and their records are highly desirable in all aspects of sea-level research.
In the future, the MISELA dataset can be updated with new data as these become available, although this would require the engagement of more human resources (necessary for carrying such extensive quality control procedures), preferably from sea-level data centres. Further, putting these activities – which are basically fulfilling demand from the community carrying out research on high-frequency sea–level oscillations and meteotsunamis – under the umbrella of GLOSS or other sea-level programmes would institutionalize the efforts and would result in an improved-quality product. Extending the time series would also make study results more reliable. Moreover, as new tide gauges are installed, the total number of stations in the MISELA dataset can increase, and a better global coverage can be achieved.
All authors participated in performing quality control procedures. IV and PZ developed the concept for the paper, PZ wrote the initial version of the text, and all authors commented on and revised the text and approved the final article.
The authors declare that they have no conflict of interest.
Publisher’s note: Copernicus Publications remains neutral with regard to jurisdictional claims in published maps and institutional affiliations.
We are grateful to the hundreds of data providers and thousands of researchers, engineers and technicians engaged in the maintenance of tide-gauge stations whose data are included in the MISELA dataset. Comments and issues raised by Clea Denamiel, Philip Woodworth and two anonymous reviewers are particularly appreciated and greatly improved the paper. We would also like to thank Bart van Hoorne and Francisco Hernandez, who have kept the SLSMF web system running since its inception.
This work has been conducted through the “Young Researchers' Career Development Project – Training New Doctoral Students” of the Croatian Science Foundation, with the support of the Croatian Science Foundation projects ADIOS (grant no. IP-2016-06-1955), BivACME (grant no. IP-2019-04-8542) and StVar-Adri (grant no. IP-2019-04-5875); the European Commission, H2020 Research Framework projects SHExtreme (grant no. 853045) and BLUEMED (grant no. 727453); the Unity Through Knowledge Fund project MESSI (grant no. 25/15); the Interreg Italy–Croatia Programme projects CHANGE WE CARE and ECOSS; and the European Structural and Investment Funds 2014–2020 projects CAAT (grant no. KK.01.1.1.04.0064) and HIDROLAB (grant no. KK.01.1.1.04.0053).
This paper was edited by François G. Schmitt and reviewed by two anonymous referees.
Aarup, T., Wöppelmann, G., Woodworth, P. L., Hernandez, F., Vanhoorne, B., Schöne, T., and Thompson, P. R.: Comments on the article “Uncertainty and bias in electronic tide-gauge records: evidence from collocated sensors” by Stella Pytharouli, Spyros Chaikalis, Stathis C. Stiros in Measurement (Volume 125, September 2018), Measurement, 135, 613–616, https://doi.org/10.1016/j.measurement.2018.12.007, 2019.
Amato, A.: Some reflections on tsunami Early Warning Systems and their impact, with a look at the NEAMTWS, Boll. Geof. Teor. Appl., 61, 403–420, https://doi.org/10.4430/bgta0329, 2020.
Bechle, A. J., Wu, C. H., Kristovich, D. A. R., Anderson, E. J., Schwab, D. J., and Rabinovich, A. B.: Meteotsunamis in the Laurentian Great Lakes, Sci. Rep.-UK, 6, 37832, https://doi.org/10.1038/srep37832, 2016.
Caldwell, P. C., Merrifield, M. A., and Thompson, P. R.: Sea level measured by tide gauges from global oceans – the Joint Archive for Sea Level holdings (NCEI Accession 0019568), Version 5.5, NOAA National Centers for Environmental Information [data set], https://doi.org/10.7289/V5V40S7W, 2015.
Carvajal, M., Contreras-Lopez, M., Winckler, P., and Sepulveda, I.: Meteotsunamis occurring along the southwest coast of South America during an intense storm, Pure Appl. Geophys., 174, 3313–3323, https://doi.org/10.1007/s00024-017-1584-0, 2017.
Chlieh, M., Avouac, J. P., Hjorleifsdottir, V., Song, T. R. A., Ji, C., Sieh, K., Sladen, A., Hebert, H., Prawirodirdjo, L., Bock, Y., and Galetzka, J.: Coseismic slip and afterslip of the great M-w 9.15 Sumatra-Andaman earthquake of 2004, B. Seismol. Soc. Am., 97, S152–S173, https://doi.org/10.1785/0120050631, 2007.
Dodet, G., Melet, A., Ardhuin, F., Bertin, X., Idier, D., and Almar, R.: The contribution of wind-generated waves to coastal sea-level changes, Survey Geophys., 40, 1563–1601, https://doi.org/10.1007/s10712-019-09557-5, 2019.
EuroGOOS DATA-MEQ working group: Recommendations for in-situ data Near Real Time Quality Control, Coriolis Data Centre, 23 pp., https://doi.org/10.13155/36230, 2010.
Flanders Marine Institute (VLIZ) and Intergovernmental Oceanographic Commission (IOC): Sea level station monitoring facility, VLIZ, https://doi.org/10.14284/482, 2021.
García-Valdecasas, J., Pérez Gómez, B., Molina, R., Rodríguez, A., Rodríguez, D., Pérez, S., Campos, A., Rodríguez Rubio, P., Gracia, S., Ripollés, L., Terrés Nicoli, J. M., Javier de los Santos, F., and Álvarez Fanjul, E.: Operational tool for characterizing high-frequency sea level oscillations, Nat. Hazards, 106, 1149–1167, https://doi.org/10.1007/s11069-020-04316-x, 2021.
Heidarzadeh, M. and Rabinovich, A. B.: Combined hazard of typhoon-generated meteorological tsunamis and storm surges along the coast of Japan, Nat. Hazards, 106, 1639–1672, https://doi.org/10.1007/s11069-020-04448-0, 2021.
Holgate, S. J., Matthews, A., Woodworth, P. L., Rickards, L. J., Tamisiea, M. E., Bradshaw, E., Foden, P. R., Gordon, K. M., Jevrejeva, S., and Pugh, J.: New Data Systems and Products at the Permanent Service for Mean Sea Level. J. Coastal. Res., 288, 493–504, https://doi.org/10.2112/jcoastres-d-12-00175.1, 2013.
Hunter, J. R., Woodworth, P. L., Wahl, T., and Nicholls, R. J.: Using global tide gauge data to validate and improve the representation of extreme sea levels in flood impact studies, Global. Planet. Change, 156, 34–45, https://doi.org/10.1016/j.gloplacha.2017.06.007, 2017.
IOC: Global Sea Level Observing System (GLOSS) implementation plan – 1997, UNESCO/Intergovernmental Oceanographic Commission, Technical Series, No. 50, 91 pp. & Annexes, UNESCO, Paris, 1997.
IOC: Global Sea Level Observing System (GLOSS) Implementation Plan – 2012, UNESCO/Intergovernmental Oceanographic Commission, 41 pp., 2012, IOC Technical Series No. 100, GOOS Report No. 194, JCOMM Technical Report No. 66, UNESCO, Paris, 2012.
Jevrejeva, S., Grinsted, A., Moore, J. C., and Holgate, S.: Nonlinear trends and multiyear cycles in sea level records, J. Geophys. Res.-Oceans, 111, C09012, https://doi.org/10.1029/2005JC003229, 2006.
Jylhä, K., Kämäräinen, M., Fortelius, C., Gregow, H., Helander, J., Hyvärinen, O., Johansson, M., Karppinen, A., Korpinen, A., Kouznetsov, R., Kurzeneva, E., Leijala, U., Mäkelä, A., Pellikka, H., Saku, S., Sandberg, J., Sofiev, M., Vajda, A., Venäläinen, A., and Vira, J.: Recent meteorological and marine studies to support nuclear power plant safety in Finland, Energy, 165, 1102–1118, https://doi.org/10.1016/j.energy.2018.09.033, 2018.
Marcos, M., Monserrat, S., Medina, R., Orfila, A., and Olabarrieta, M.: External forcing of meteorological tsunamis at the coast of the Balearic Islands, Phys. Chem. Earth, 34, 938–947, https://doi.org/10.1016/j.pce.2009.10.001, 2009.
Menéndez, M. and Woodworth, P. L.: Changes in extreme high water levels based on a quasi-global tide-gauge data set, J. Geophys. Res.-Oceans, 115, C10011, https://doi.org/10.1029/2009JC005997, 2010.
Monserrat, S., Vilibić, I., and Rabinovich, A. B.: Meteotsunamis: atmospherically induced destructive ocean waves in the tsunami frequency band, Nat. Hazards Earth Syst. Sci., 6, 1035–1051, https://doi.org/10.5194/nhess-6-1035-2006, 2006.
Pasquet, S., Vilibić, I., and Šepić, J.: A survey of strong high-frequency sea level oscillations along the US East Coast between 2006 and 2011, Nat. Hazards Earth Syst. Sci., 13, 473–482, https://doi.org/10.5194/nhess-13-473-2013, 2013.
Pattiaratchi, C. and Wijeratne, E. M. S.: Observations of meteorological tsunamis along the south-west Australian coast, Nat. Hazards, 74, 281–303, https://doi.org/10.1007/s11069-014-1263-8, 2014.
Pattiaratchi, C. B. and Wijeratne, E. M. S.: Are meteotsunamis an underrated hazard?, Philos. T. R. Soc. A, 373, 20140377, https://doi.org/10.1098/rsta.2014.0377, 2015.
Pawlowicz, R., Beardsley, B., and Lentz, S.: Classical tidal harmonic analysis including error estimates in MATLAB using T_TIDE, Comput. Geosci., 28, 929–937, https://doi.org/10.1016/s0098-3004(02)00013-4, 2002.
Pellikka, H., Rauhala, J., Kahma, K. K., Stipa, T., Boman, H., and Kangas, A.: Recent observations of meteotsunamis on the Finnish coast, Nat. Hazards, 74, 197–215, https://doi.org/10.1007/s11069-014-1150-3, 2014.
Pérez, B., Álvarez Fanjul, E., Pérez, S., de Alfonso, M., and Vela, J.: Use of tide gauge data in operational oceanography and sea level hazard warning systems, J. Oper. Oceanogr., 6, 1–18, https://doi.org/10.1080/1755876x.2013.11020147, 2013.
Šepić, J. and Rabinovich, A. B.: Meteotsunami in the Great Lakes and on the Atlantic coast of the United States generated by the “derecho” of June 29–30, 2012, Nat. Hazards, 74, 75–107, https://doi.org/10.1007/s11069-014-1310-5, 2014.
Šepić, J., Vilibić, I., Lafon, A., Macheboeuf, L., and Ivanović, Z.: High-frequency sea level oscillations in the Mediterranean and their connection to synoptic patterns, Prog. Oceanogr., 137, 284–298, https://doi.org/10.1016/j.pocean.2015.07.005, 2015.
Šepić, J., Međugorac, I., Janeković, I., Dunić, N., and Vilibić, I.: Multi-meteotsunami event in the Adriatic Sea generated by atmospheric disturbances of 25–26 June 2014, Pure Appl. Geophys., 173, 4117–4138, https://doi.org/10.1007/s00024-016-1249-4, 2016.
Šepić, J., Vilibić, I., Rabinovich, A. B., and Tinti, S.: Meteotsunami (“Marrobbio”) of 25–26 June 2014 on the Southwestern Coast of Sicily, Italy, Pure Appl. Geophys., 175, 1573–1593, https://doi.org/10.1007/s00024-018-1827-8, 2018.
Simons, M., Minson, S. E., Sladen, A., Ortega, F., Jiang, J. L., Owen, S. E., Meng, L. S., Ampuero, J. P., Wei, S. J., and Chu, R. S.: The 2011 magnitude 9.0 Tohoku-Oki Earthquake: mosaicking the megathrust from seconds to centuries, Science, 332, 1421–1425, https://doi.org/10.1126/science.1206731, 2011.
Thomson, R. R. and Emery, W. J.: Data analysis methods in physical oceanography, 3rd Edn., Elsevier, Oxford, United Kingdom, https://doi.org/10.1016/C2010-0-66362-0, 2014.
Tsimplis, M. N., Marcos, M., Pérez, B., Challenor, P., Garcia-Fernandez, M. J., and Raicich, F.: On the effect of the sampling frequency of sea level measurements on return period estimate of extremes – Southern European examples, Cont. Shelf Res., 29, 2214–2221, https://doi.org/10.1016/j.csr.2009.08.015, 2009.
UNESCO/IOC: Quality Control of in situ Sea Level Observations: A Review and Progress towards Automated Quality Control, Vol. 1. Paris, France, UNESCO, 70 pp., https://doi.org/10.25607/OBP-854, 2020.
Vafeidis, A. T., Nicholls, R. J., Mcfadden, L., Tol, R. S. J., Hinkel, J., Spencer, T., Grashoff, P. S., Boot, G., and Klein, R. J. T.: A new global coastal database for impact and vulnerability analysis to sea-level rise, J. Coastal. Res., 24, 917–924, https://doi.org/10.2112/06-0725.1, 2008.
Vilibić, I. and Šepić, J.: Global mapping of nonseismic sea level oscillations at tsunami timescales, Sci. Rep.-UK, 7, 40818, https://doi.org/10.1038/srep40818, 2017.
Vilibić, I., Šepić, J., Dunić, N., Sevault, F., Monserrat, S., and Jordà, G.: Proxy-based assessment of strength and frequency of meteotsunamis in future climate, Geophys. Res. Lett., 45, 10501–10508, https://doi.org/10.1029/2018GL079566, 2018.
Vilibić, I., Rabinovich, A. B., and Anderson, E. J.: The global perspective on meteotsunami science: Editorial, Nat. Hazards, 106, 1087–1104, https://doi.org/10.1007/s11069-021-04679-9, 2021.
Yankovsky, A. E.: Large-scale edge waves generated by hurricane landfall, J. Geophys. Res.-Oceans, 114, C04014, https://doi.org/10.1029/2008JC005113, 2009.
Wilkinson, M. D., Dumontier, M., Jan Aalbersberg, I., Appleton, G., Axton, M., Baak, A., Blomberg, N., Boiten, J. W., da Silva Santos, L. B., Bourne, P. E., Bouwman, J., Brookes, A. J., Clark, T., Crosas, M., Dillo, I., Dumon, O., Edmunds, S., Evelo, C. T., Finkers, R., Gonzalez-Beltran, A., Gray, A. J. G., Groth, P., Goble, C., Grethe, J. S., Heringa, J., 't Hoen, P. A. C. , Hooft, R., Kuhn, T., Kok, R., Kok, J., Lusher, S. J., Martone, M. E., Mons, A., Packer, A. L., Persson, B., Rocca-Serra, P., Roos, M., van Schaik, R., Sansone, S. A., Schultes, E., Sengstag, T., Slater, T., Strawn, G., Swertz, M. A., Thompson, M., van der Lei, J., van Mulligen, E., Velterop, J., Waagmeester, A., Wittenburg, P., Wolstencroft, K., Zhao, J., and Mons, B.: The FAIR Guiding Principles for scientific data management and stewardship, Sci. Data, 3, 160018, https://doi.org/10.1038/sdata.2016.18, 2016.
Williams, J., Matthews, A., and Jevrejeva, S.: Development of an automatic tide gauge processing system, National Oceanography Centre Research and Consultancy Report, 64, Southampton, National Oceanography Centre, 26 pp., 2019.
Woodworth, P. L.: Seiches in the eastern Caribbean, Pure Appl. Geophys., 174, 4283–4312, https://doi.org/10.1007/s00024-017-1715-7, 2017.
Woodworth, P. L., Aman, A., and Aarup, T.: Sea level monitoring in Africa, African J. Mar. Sci., 29, 321–330, https://doi.org/10.2989/AJMS.2007.29.3.2.332, 2007.
Woodworth, P. L., Hunter, J. R., Marcos Moreno, M., Caldwell, P. C., Menendez, M., and Haigh, I. D.: GESLA (Global Extreme Sea Level Analysis) high frequency sea level dataset – Version 2, British Oceanographic Data Centre – Natural Environment Research Council, UK, https://doi.org/10.5285/3b602f74-8374-1e90-e053-6c86abc08d39, 2016.
Woodworth, P. L., Hunter, J. R., Marcos, M., Caldwell, P., Menéndez, M., and Haigh, I.: Towards a global higher-frequency sea level dataset, Geosci. Data J., 3, 50–59, https://doi.org/10.1002/gdj3.42, 2017.
Zemunik, P., Bonanno, A., Mazzola, S., Giacalone, G., Fontana, I., Genovese, S., Basilone, G., Candela, J., Šepić, J., Vilibić, I., and Aronica, S.: Observing meteotsunamis (“Marrobbio”) on the southwestern coast of Sicily, Nat. Hazards, 196, 1337–1363, https://doi.org/10.1007/s11069-020-04303-2, 2021a.
Zemunik, P., Vilibić, I., Šepić, J., Pellikka, H., and Ćatipović, L.: MISELA: Minute Sea-Level Analysis, Marine Data Archive [data set], https://doi.org/10.14284/456, 2021b.