the Creative Commons Attribution 4.0 License.
the Creative Commons Attribution 4.0 License.
 | 03 Aug 2021
A multi-source 120-year US flood database with a unified common format and public access
Mengye Chen
Shang Gao
Jonathan J. Gourley
Tiantian Yang
Xinyi Shen
Randall Kolar
Despite several flood databases available in the United States, there is a benefit to combine and reconcile these diverse data sources into a comprehensive flood database with a unified common format and easy public access in order to facilitate flood-related research and applications. Typically, floods are reported by specialists or media according to their socioeconomic impacts. Recently, data-driven analysis can reconstruct flood events based on in situ and/or remote-sensing data. Lately, with the increasing engagement of citizen scientists, there is the potential to enhance flood reporting in near-real time. The central objective of this study is to integrate information from seven popular multi-sourced flood databases into a comprehensive flood database in the United States, made readily available to the public in a common data format. Natural language processing, geocoding, and harmonizing processing steps are undertaken to facilitate such development. In total, there are 698 507 flood records in the United States from 1900 to the present, which highlights the longest and most comprehensive recording of flooding across the country. The database features event locations, durations, date/times, socioeconomic impacts (e.g., fatalities and economic damages), and geographic information (e.g., elevation, slope, contributing area, and land cover types retrieved from ancillary data for given flood locations). Finally, this study utilizes the flood database to analyze flood seasonality within major basins and socioeconomic impacts over time. It is anticipated that thus far the most comprehensive yet unified database can support a variety of flood-related research, such as a validation resource for hydrologic or hydraulic simulations, hydroclimatic studies concerning spatiotemporal patterns of floods, and flood susceptibility analysis for vulnerable geophysical locations. The dataset is publicly available with the following DOI: https://doi.org/10.5281/zenodo.4547036 (Li, 2020).
- Article
(4335 KB) - Full-text XML
- BibTeX
- EndNote


Floods are one of the most common and costliest natural hazards globally (World Health Organization). In fact, around 74 % of natural hazards between 2001 and 2018 were water-related, among which floods were the most devastating. In the United States, eight of the 10 costliest weather disasters (in billions of USD) were floods between 1980 and 2019 (https://www.ncdc.noaa.gov/billions/events, last access: 10 February 2021), and almost 10 % of the flash floods have resulted in agricultural and economic losses beyond USD 100 000 (US dollars) per event (Gourley et al., 2017). The flood-producing storms and hurricanes frequently strike the coastal regions with devastating socioeconomic impacts, among which the most damaging Hurricane Katrina affected nine states and resulted in monetary losses of over USD 168 billion. Moreover, under the influences of climate change, the increasingly intensified hydrologic cycle and sea level rise pose more threats to coastal areas (Alfieri et al., 2016; Tabari, 2020). IPCC AR5 (2014) has reported that the frequency and intensity of floods in the United States are changing, which challenges current water-related infrastructure and water management principles. In light of flood risks, a compilation of a comprehensive flood database can provide insights into both national and regional flood characteristics.
Many published works have hitherto been limited to developed countries such as European countries and the United States. Developing countries either restrict data sharing or lack the resources to collect and assemble flood events. With respect to the available period, not many works continuously offer up-to-date flood data accessible to the public or research communities (e.g., Fiorillo et al., 2018; He et al., 2018; Luu et al., 2019; Petrucci et al., 2019; Shi, 2003). However, it is noteworthy that there are means of collecting flood information. Conventionally, flood reports are produced by local specialists with limited and sometimes delayed information (e.g., Filrilo et al., 2018; He et al., 2018; Luu et al., 2019; Petrucci et al., 2019). Later on, media outlets (e.g., newspaper) start to participate in timely flood reporting, but typically on the high-impact floods (e.g., Hilker et al., 2009; Shi, 2013; Smith et al., 2012; Vos et al., 2010). Insurance companies collectively offer valuable information on flood damages and people affected from a financial perspective (Swiss Re, 2010). Until recently, the increasing engagement of social scientists has greatly supported near-real-time flood reporting with web or mobile applications (Chen et al., 2016; de Bruijn et al., 2019), although these reports are often confined to populated urban areas. In addition to human-led reporting, stream gage and opportunistic sensors (e.g., surveillance cameras, ground radars, and satellites) can also augment flood monitoring in real time (Hall et al., 2015; Shen et al., 2019).
Despite long-established flood records (reports), there are few studies attempting to merge multi-source flood databases, especially considering the increasing number and diversity of flood databases available. The motivations of a merged dataset are primarily twofold. First and foremost, we are still under-utilizing all sorts of flood information that can be used for model validation and flood risk analysis (Scotti et al., 2020). Second, each individual dataset has its own limitations, and thereby no single database holistically describes flooding in a given region (Gourley et al., 2013). For instance, flood reports by government agencies or the media are skewed towards high-impact events, whereas local community-level, low-end floods are oftentimes ignored. In light of these motivations, efforts should be undertaken to collectively merge all possible sources to provide off-the-shelf data support to complement flood-related research. Gourley et al. (2013) assembled a georeferenced US database from three primary sources: (1) discharge observations from the U.S. Geological Survey (USGS), (2) flood reports by the National Weather Service from 2006 to 2013, and (3) witness reports from the public. Amponsah et al. (2018) merged a high-resolution flash flood database in Europe with a set of spatial data, rainfall data, and discharge data from 1991 to 2015. Petrucci et al. (2019) collaboratively harmonized five regional flood databases from 1980 to 2015 in the Mediterranean region to investigate the causes of deaths in flood events. These merged datasets are relatively short in time and not complete. In this study, we introduce a comprehensive United States Flood Database – USFD, which compiles seven individual databases and converts them into a common data format. Sources to compile this database include (1) reports from news media, (2) reconstructed flood events from gage and satellite instruments, and (3) crowdsourcing data queried from the web and mobile applications. As a result, a 120-year flood database in the United States is assembled, unified, and published for public access, as well as an interactive web interface for immediate use. This dataset includes diverse flood subtypes, including riverine flooding, coastal flooding, flash flooding, etc., and features the longest and most comprehensive recording of flooding across the country. It is anticipated that this database can support a variety of flood-related research, such as a validation source for hydrologic/hydraulic simulation, climatic studies concerning spatiotemporal patterns of floods given this long-term and US-wide coverage, and flood risk analysis for vulnerable geophysical locations. Primary assessments on flood occurrences across the Unites States, flood seasonality within major basins, and socioeconomic impacts across time are carried out to share insights into US floods.
This article is structured as follows. Section 2 details seven individual databases and ancillary datasets used to form our database. Section 3 describes methods to retrieve (query), clean, and unify these datasets in a processing pipeline. Lastly, Sect. 4 serves as a pre-assessment on floods in the United States over the past 120 years, spatially aggregated by geopolitical boundaries and for major US river basins.
2.1 Individual databases
In this section, we detail seven individual databases, which are the NOAA National Weather Service (NWS) storm reports, Emergency Events Database (EM-DAT), Dartmouth Flood Observatory database (DFO), the University of Connecticut Flood Events Database (FEDB), cyber-infrastructure flood database (CyberFlood), meteorological Phenomena identification near the ground data (mPing), and Global Flood Monitoring (GFM). Each candidate of this compiled database has to satisfy the following criteria: (1) published by trustworthy organizations, (2) has been used in at least one traceable high-impact publication, and (3) contains useful information for flood-related research.
2.1.1 National Weather Service storm reports
The NOAA NWS routinely publishes post-event reports of floods from trained spotters, local authorities, and emergency management officials. This dataset is arguably the most exhaustive meteorology-driven reporting in the United States. The descriptors can be mainly categorized into the geophysical location (e.g., begin and end location), time period (e.g., begin and end time), causes (e.g., heavy rain), impacts (e.g., fatalities and damages), and narratives (see technical documentation for details: https://www.nws.noaa.gov/directives/sym/pd01016005curr.pdf, last access: 20 December 2020). Limitations of this database for flood events are summarized in Gourley et al. (2013), including (1) imprecise event location, (2) times related to meteorological events, (3) relying on in-person witness accounts, and (4) limited information about the site exposure to antecedent condition. We retrieve all flood records from 1950 to the present, which totals 144 313 reports.
2.1.2 Emergency Events Database (EM-DAT)
The EM-DAT database is produced and maintained by the Centre for Research on the Epidemiology of Disasters (CRED) in Belgium, which contains all types of global natural disasters in the world from 1900 to the present. These recorded events should meet one of the following criteria: (1) > 10 people dead, (2) > 100 people affected, (3) declaration of a state of emergency, or (4) a call for international assistance. Therefore, regional floods or street-level floods are not included in this database. The sources of information stem from government agencies, non-government organizations, insurance companies, research institutes, and press agencies. The EM-DAT provides information including geographic location, time entry, fatalities, and economic damages. The geographic location is uncertain to studies considering precise flood locations such as inundation mappings, and the economic damages are obtained from insurance claims. All the flood-related data entries are collected via public access at https://www.emdat.be/ (last access: 20 December 2020). Due to its stringent reporting criteria, there are only 189 events recorded in the United States.
2.1.3 Dartmouth Flood Observatory (DFO)
The DFO data, regarded as one of the most popular flood databases in the world, collects flood events from news, government agencies, and stream gauges and remote-sensing instruments from 1985 to the present (Brakenridge, 2020). Different from other databases, the DFO collectively retrieves spatial flood information from satellite remote-sensing products, such as the Moderate Resolution Image Spectroradiometer (MODIS), Sentinel-1, and Landsat. Flood extent is accordingly provided as shapefiles for easy integration into Geographic Information Systems software. The tabular data include geophysical location, date/time, fatalities, affected area, displaced people, flood severity, and primary causes. However, events without significant river flooding are not included in this database, and they are subject to uncertainties from satellite-derived flood extent such as water-like echoes in urban areas and limitations due to cloudiness. A total of 469 events have been retrieved from its tabular data in the United States.
2.1.4 University of Connecticut Flood Events Database (FEDB)
Taking advantage of nation-wide flow records at 6301 stations operated by the U.S. Geological Survey (USGS) and radar rainfall measurements, a comprehensive flood database is reconstructed from 2002 to 2013, using the characteristic point method (Shen et al., 2017). At each gauge site, flood events are identified by baseflow separation and filtered with non-significant peaks (i.e., less than 95th percentile). Additionally, flood-producing rainfall events are traced within a certain time window to portray an event. The FEDB provides shapefiles of stream gauges with a series of flood event attributes (e.g., flow peak, flow period, rainfall event period, base flow, rainfall–runoff coefficient, and spatial moments-based characteristics). The original dataset is retrieved from https://ucwater.engr.uconn.edu/fedb (last access: 25 December 2020). Limitations of this database are that the reconstructed events may not necessarily lead to damages, which may undermine its role in flood-impact-related research, and the flood events must occur in USGS-gauged basins. In major flooding events (e.g., Hurricane Harvey), some stream gauges may be flushed away, so no event is recorded. Over 542 000 events have been reconstructed in the United States, making this flood database the biggest contributor to the combined database.
2.1.5 CyberFlood
CyberFlood is a crowdsourced flood database by collecting event reports in a web application developed at the University of Oklahoma (Wan et al., 2014). It is regarded as one of the first integrated systems that collect, organize, visualize, and manage a flood database globally. However, the flood records may be falsely reported due to lack of cross-reference scrutiny. We queried the latest results of CyberFlood, which contains flood events, geographic locations, date/time, country code, causes, and fatalities. The latest version of CyberFlood has 203 flood records from 1998 to 2008. To facilitate data unification, we convert all the code-based descriptors to strings (i.e., country and causes) with key matching methods.
2.1.6 meteorological Phenomena Identification Near the Ground (mPing)
The mPing app is a crowdsourcing, weather-reporting software jointly developed by NOAA National Severe Storms Laboratory (NSSL) and the University of Oklahoma (Elmore et al., 2014). Members of the public who downloaded this app based on their GPS-enabled smartphones can report the weather event at their locations. Time, geophysical coordinates, and standard event types (e.g., flood events classified into four severity levels, tornado, precipitation type, wind) are provided. The four flood severity levels are based on the flash flood severity index (FFSI) proposed by Schroeder et al. (2016). Like any other crowdsourcing datasets, the major limitation lies in the data validation, as some events are improperly misreported or even hacked with data injection. Chen et al. (2013) compared these reports to ground radar observations with respect to precipitation types, and a satisfying correspondence is found between the two. mPing data provide REST API for research-purpose uses, and we queried flood-related events from 2013 to the present with 5000 flood events counted.
2.1.7 Global flood monitoring (GFM)
The GFM data are produced and managed by de Bruijn et al. (2019), with over 88 million Twitter tweets over the globe since 2014. Contents tied to flood observations are filtered with the natural language processing (NLP) tool BERT, which extracts time of observation and toponyms (in token) and assigns reports to the database attributes after a quality assessment. It is found in the study of Bruijn et al. (2019) that around 90 % of the events are correctly detected when compared to another disaster database. Table attributes include event_id, location_id, location_ID_url, country_ID, country_ISO3, and the time of detection. Due to privacy issues, all the locations are archived in tokens, which requires further decoding. Uncertainties related to this dataset are its geographic locations and technical algorithms to filter events. For studies requiring precise flood locations, this dataset may not be a good candidate. Data are publicly accessible at https://www.globalfloodmonitor.org/download (last access: 22 December 2020). Given the latest database, we retrieved 6315 flood events in the United States and subsequently processed them as described in Sect. 3.
2.2 Ancillary datasets
Since one purpose of this database is for flood susceptibility analysis, contributing factors to flooding are also incorporated for a given location. Land use–land cover (LULC), digital elevation model (DEM), slope, distance to a major river, drainage area, and 500-year flood depth are factored into the data attributes. The LULC value is retrieved from the Copernicus Global Land Service (CGLS) at 100 m resolution, covering urban, cultivated land, forest, vegetation, wetland, water, and ice. The topographic inputs (i.e., DEM and slope) are acquired from the NASA Shuttle Radar Topography Mission (SRTM) at 90 m spatial resolution, and hydrography datasets (i.e., river networks, drainage area) are acquired from MERIT Hydro at the same resolution (Yamazaki et al., 2019). The 500-year flood depth is downloaded from the Joint Research Centre Data Catalogue at https://data.jrc.ec.europa.eu/collection/floods (last access: 27 December 2020) at 1 km spatial resolution. All the extensive computations (i.e., sampling) are processed using the Google Earth Engine platform (Gorelick et al., 2017).
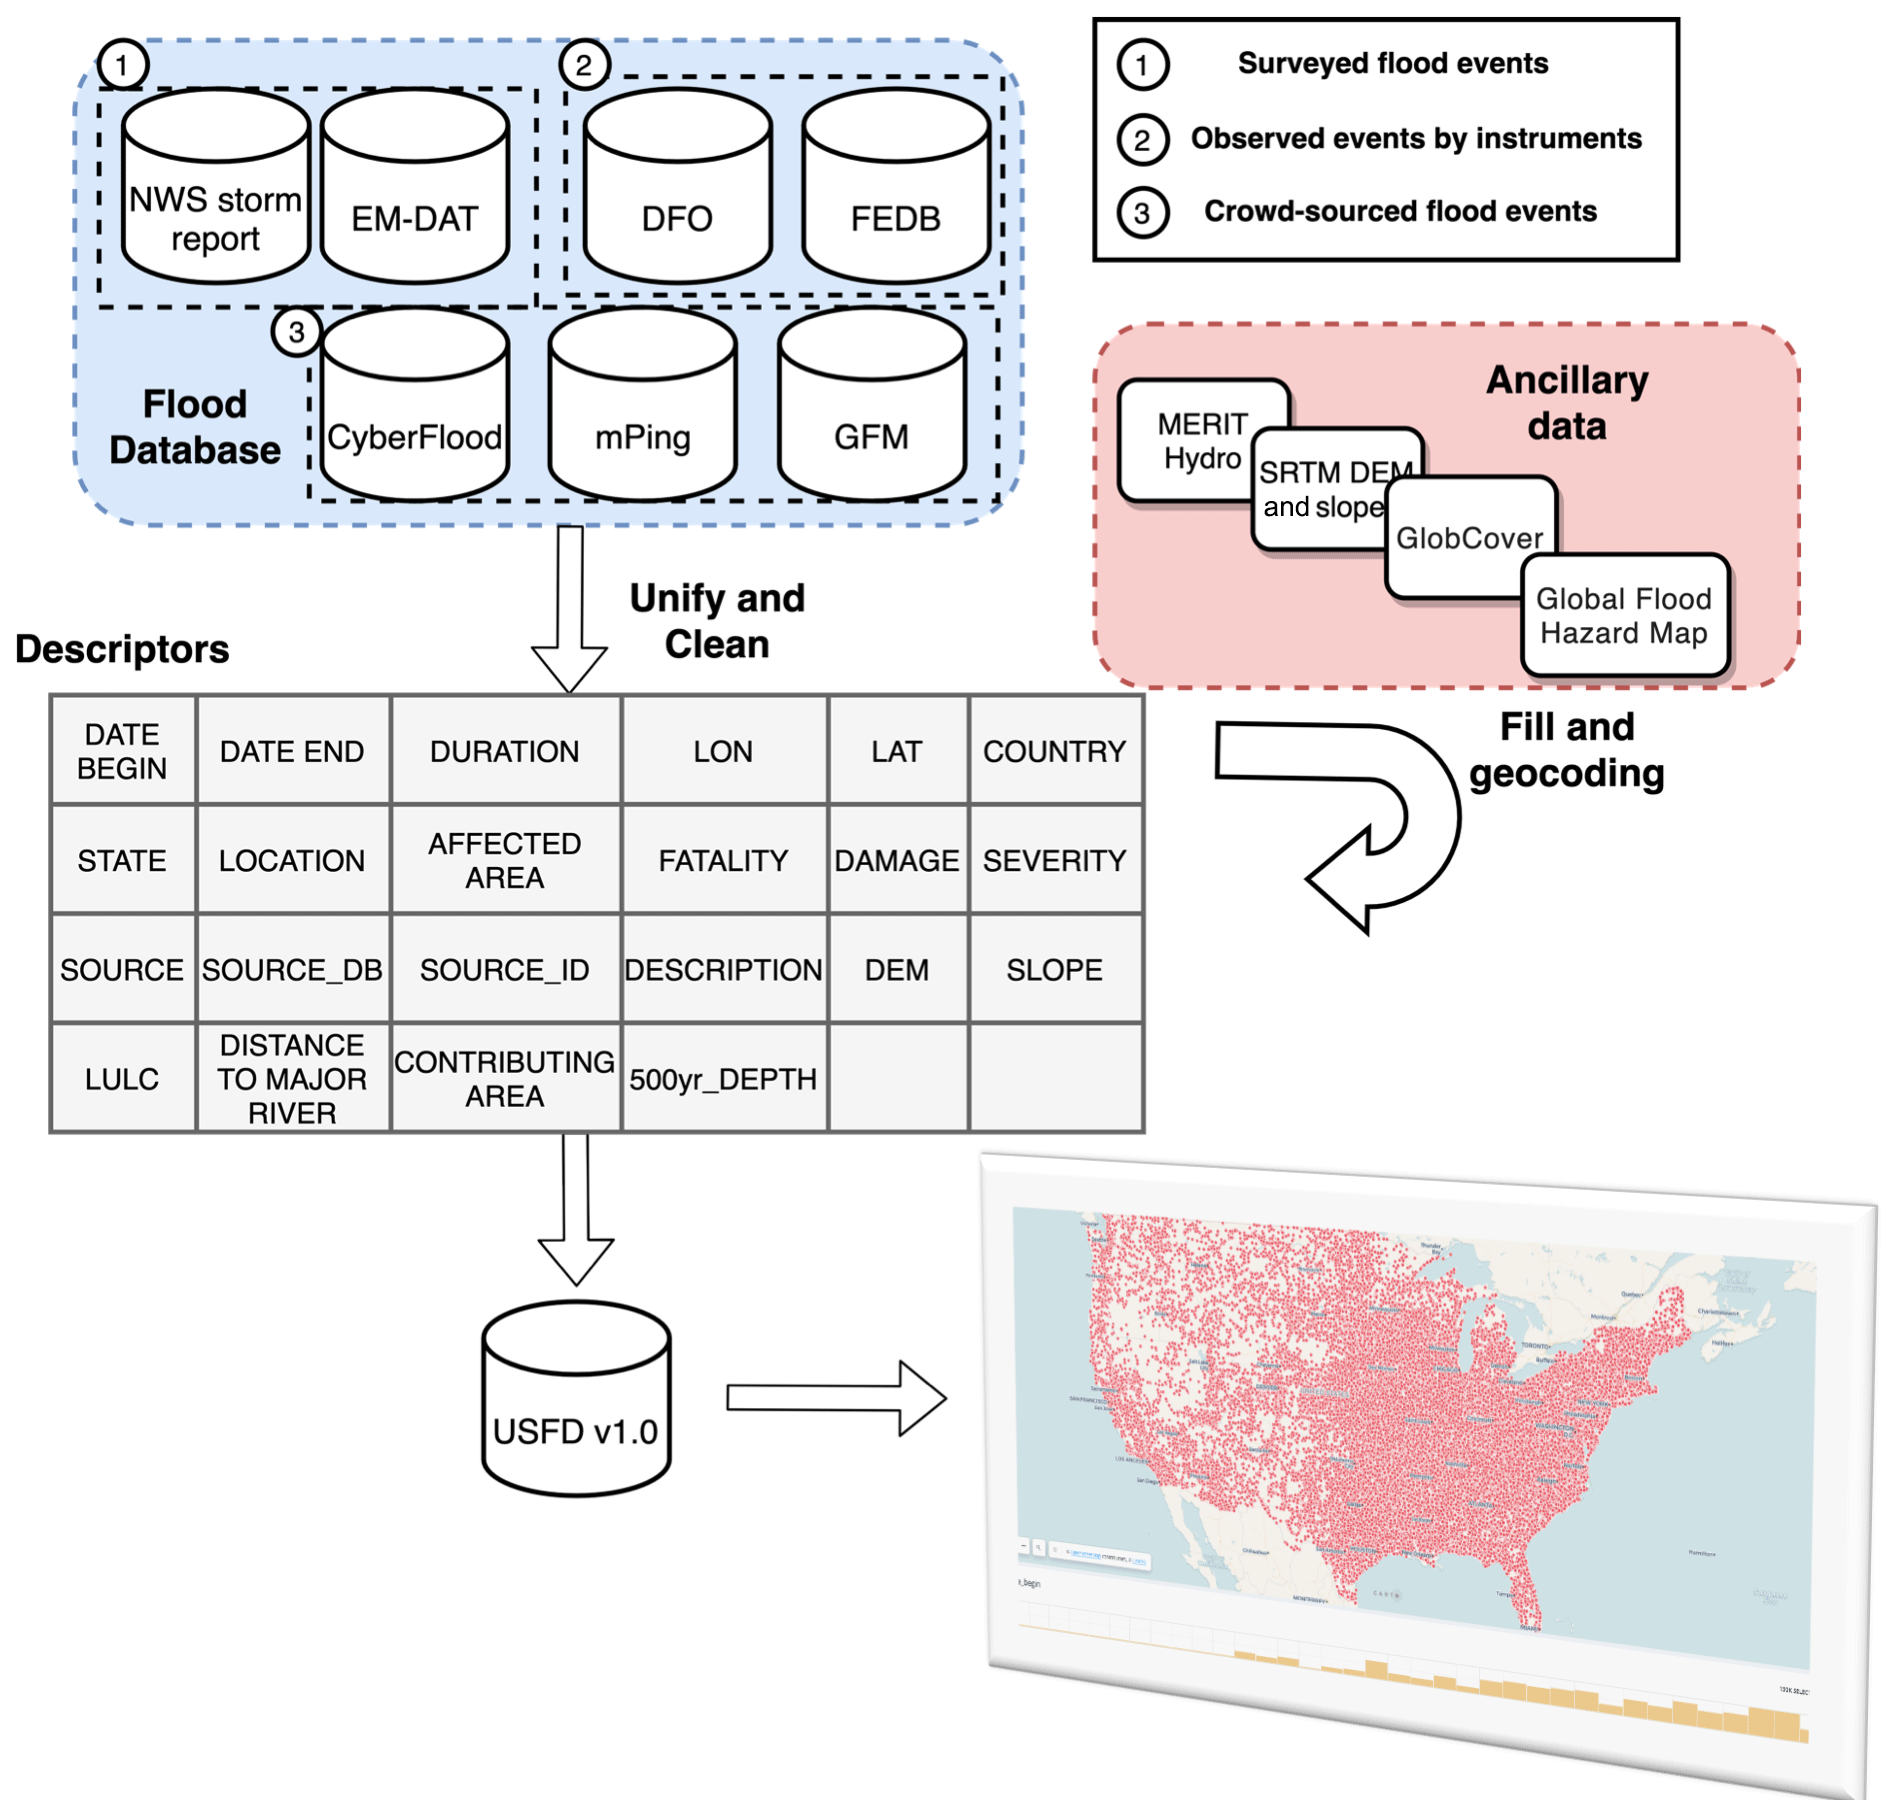
Figure 1Flowchart of dataset processing.
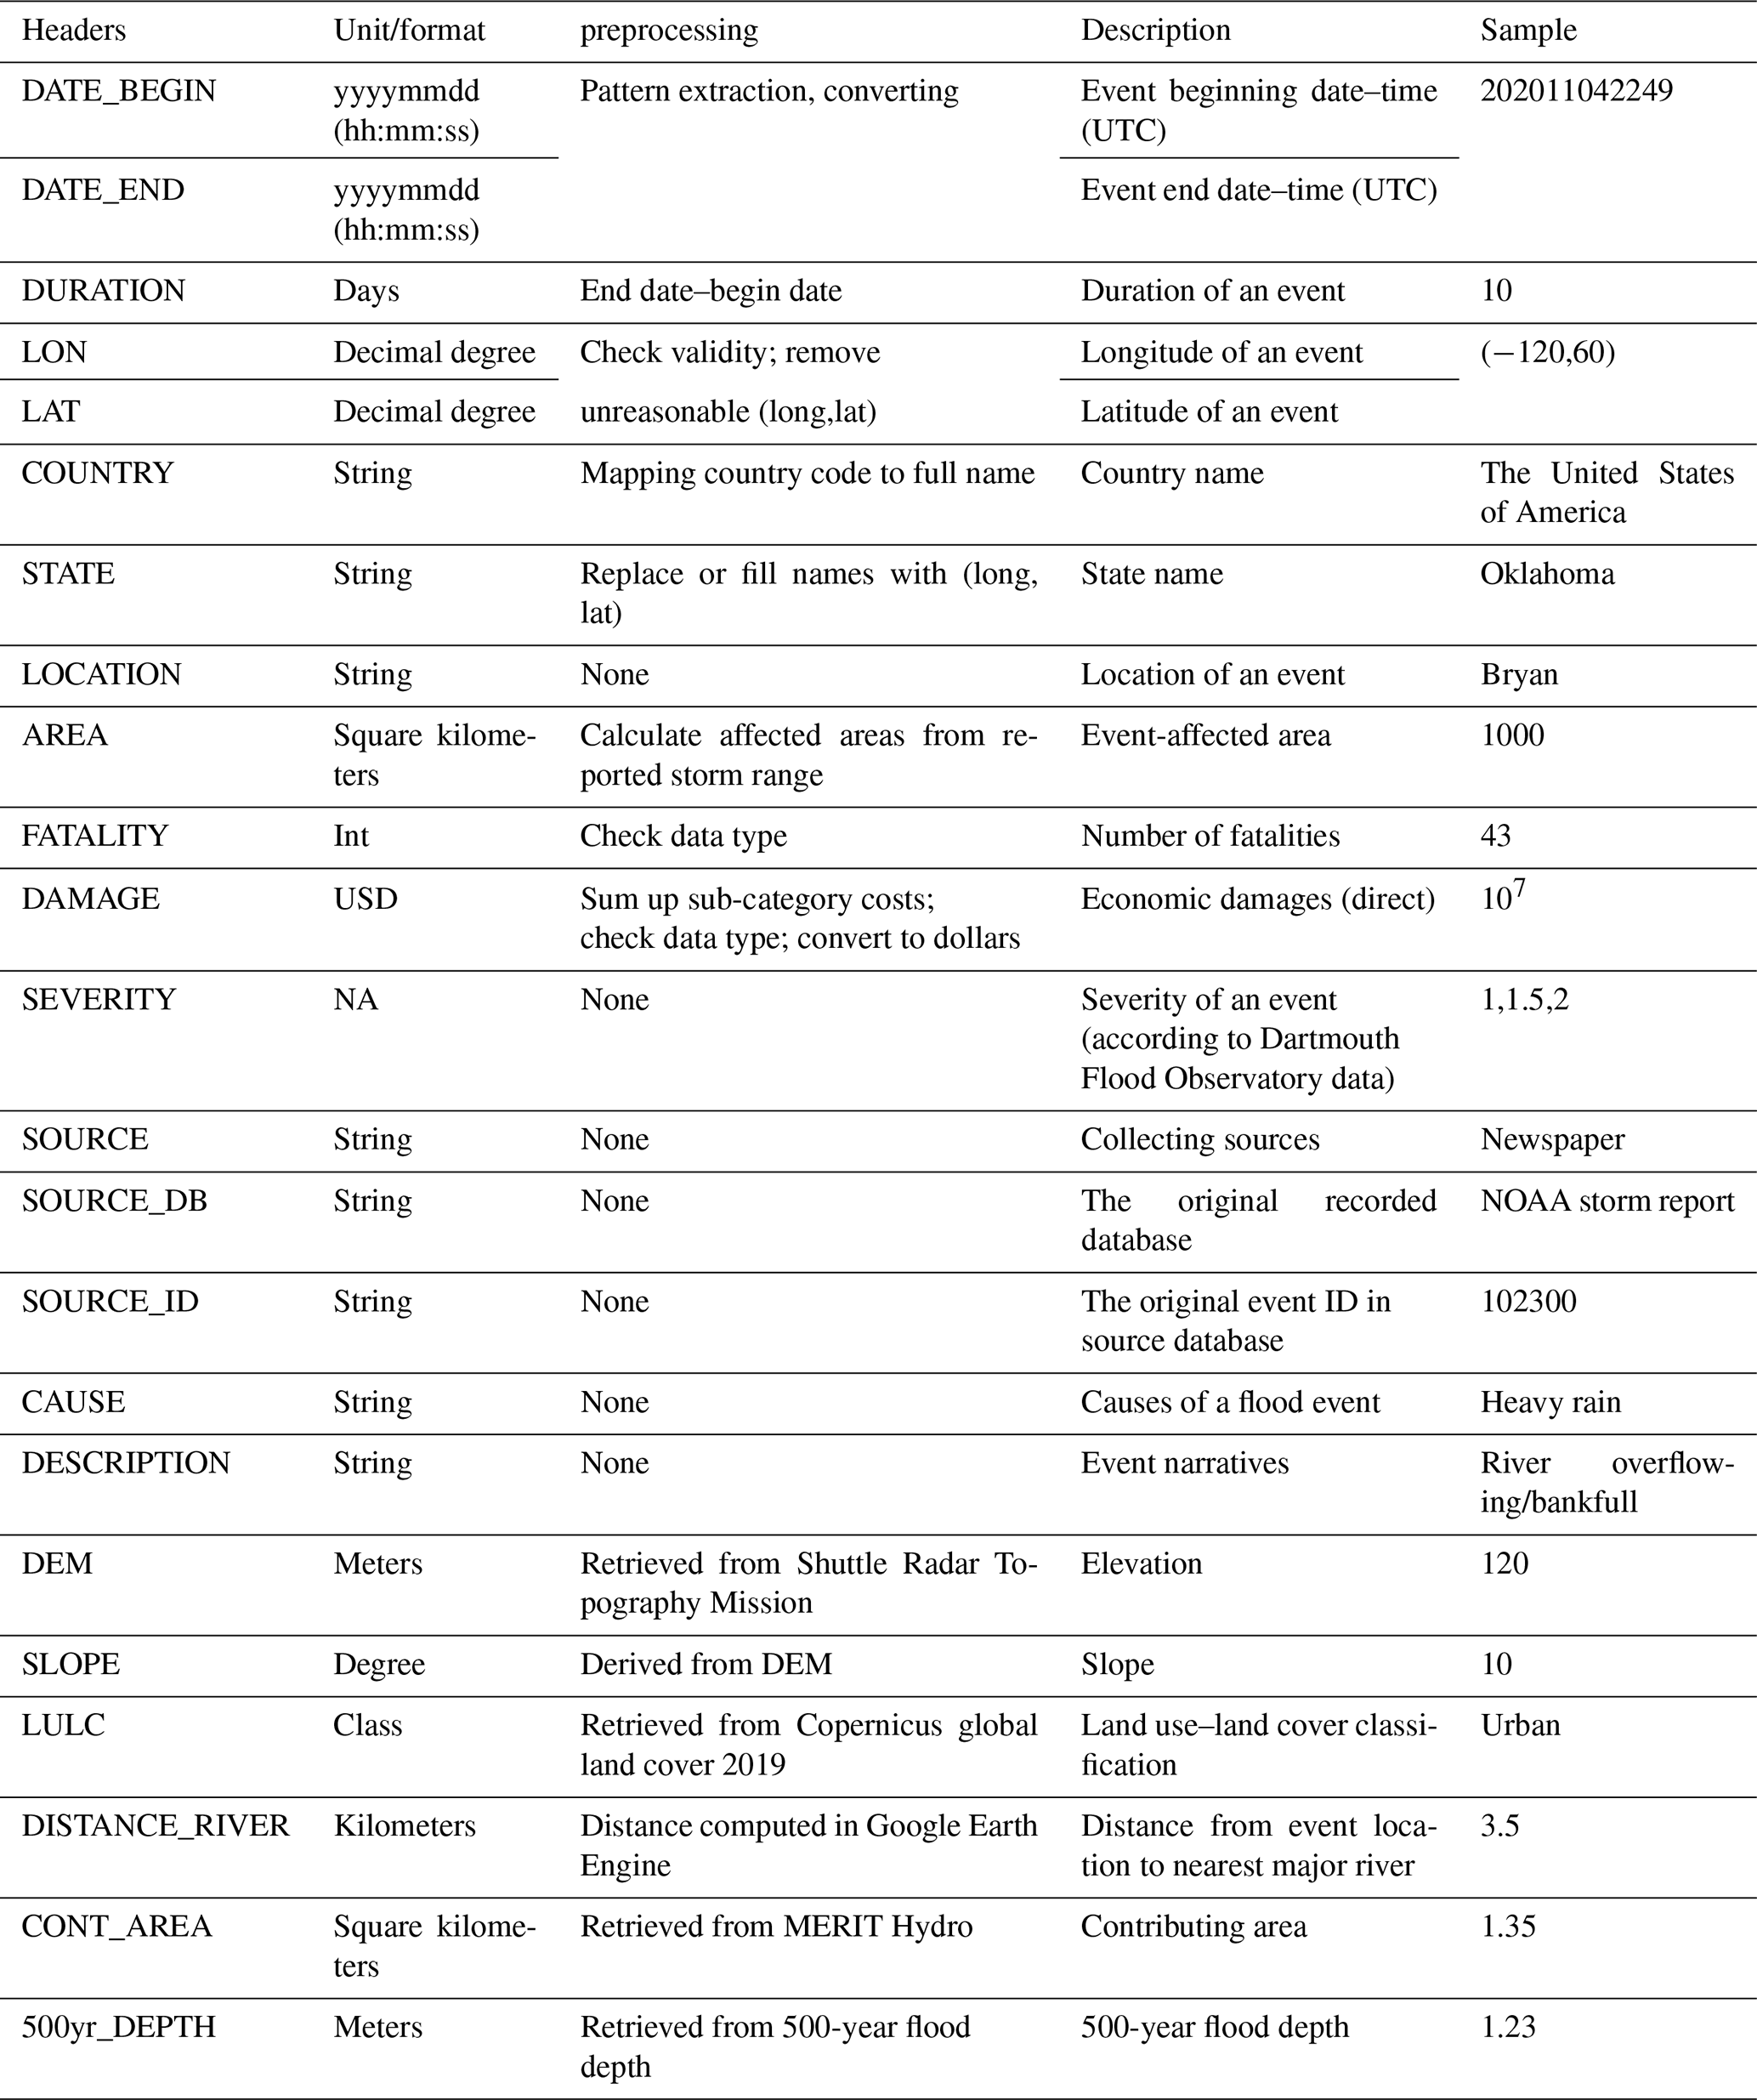
Figure 1 displays the processing flowchart, including pre-processing, merging, and unifying all seven individual databases comprising the USFD v1.0. There are 22 descriptors in the database, including the start and end time (UTC), duration (days), longitude and latitude (decimal degrees), toponyms (country, state, and location), flood impacts (i.e., affected area, severity, damage, and fatality), sources (i.e., source database, source ID, collecting sources), event description, and environmental variables as mentioned in Sect. 2.2. Detailed header descriptions and pre-processing steps are summarized in Table 1. Two intrinsic factors describing flood events are date–time and locations. The date–time information varies in different databases. Some early reports do not record the precise date–time of an event onset, using only year or year and month. For clarity, we format them in a concatenated string with maximum available information. The date 23 June 2015 00:00:00 is recoded as “20150623000000”, and June 2015 is inserted as “201506”. The date–time of all records are converted to UTC.
It is challenging to completely retrieve the location of events from some databases. The NWS storm report has some missing entries in geographic coordinates, but it has detailed narratives. To compensate, we use the NLP toolkit provided by the spaCy package, which contains pre-trained models for English multi-tasks. spaCy firstly tokenizes the event narratives and subsequently parses and tags each word with respective entities. Then, we can geocode locations into geographic coordinates via calling the Google Map API. The GFM also does not contain precise geophysical locations to protect user privacy. Therefore, the geographic coordinates are inferred by first converting location tokens into administrative locations (e.g., cities and villages) via the GeoNames API and then geocoding them into geographic coordinates. The state names of a merged dataset are firstly validated with geophysical locations from an inverse geocoding. If they do not match, a new name from GeoNames is assigned to replace the original one. Meanwhile, the empty fields are also filled during this process. We also processed supplementary flood information such as affected areas and damages from the original database. The affected area for each event is calculated by assuming a circular area whose radius is approximated by the recorded range if available. For economic damages, we sum up all available sub-category damages (e.g., agriculture, property, and structure) to give a holistic view. For those single databases that do not provide information or information that cannot be inferred from the specific header, we uniformly treat them as not-a-number (NAN) values. As a result, we merged 698 507 total flood records in the United States from 1900 to the present. In the DOI link, a merged database USFD, along with seven individual databases, is provided in either comma-separated format or Excel format for general readability. Additionally, an interactive web interface is built and hosted at http://hydro.ou.edu/research/us-flood-database/ (last access: 10 July 2021), where users can do immediate analysis online and download the datasets.
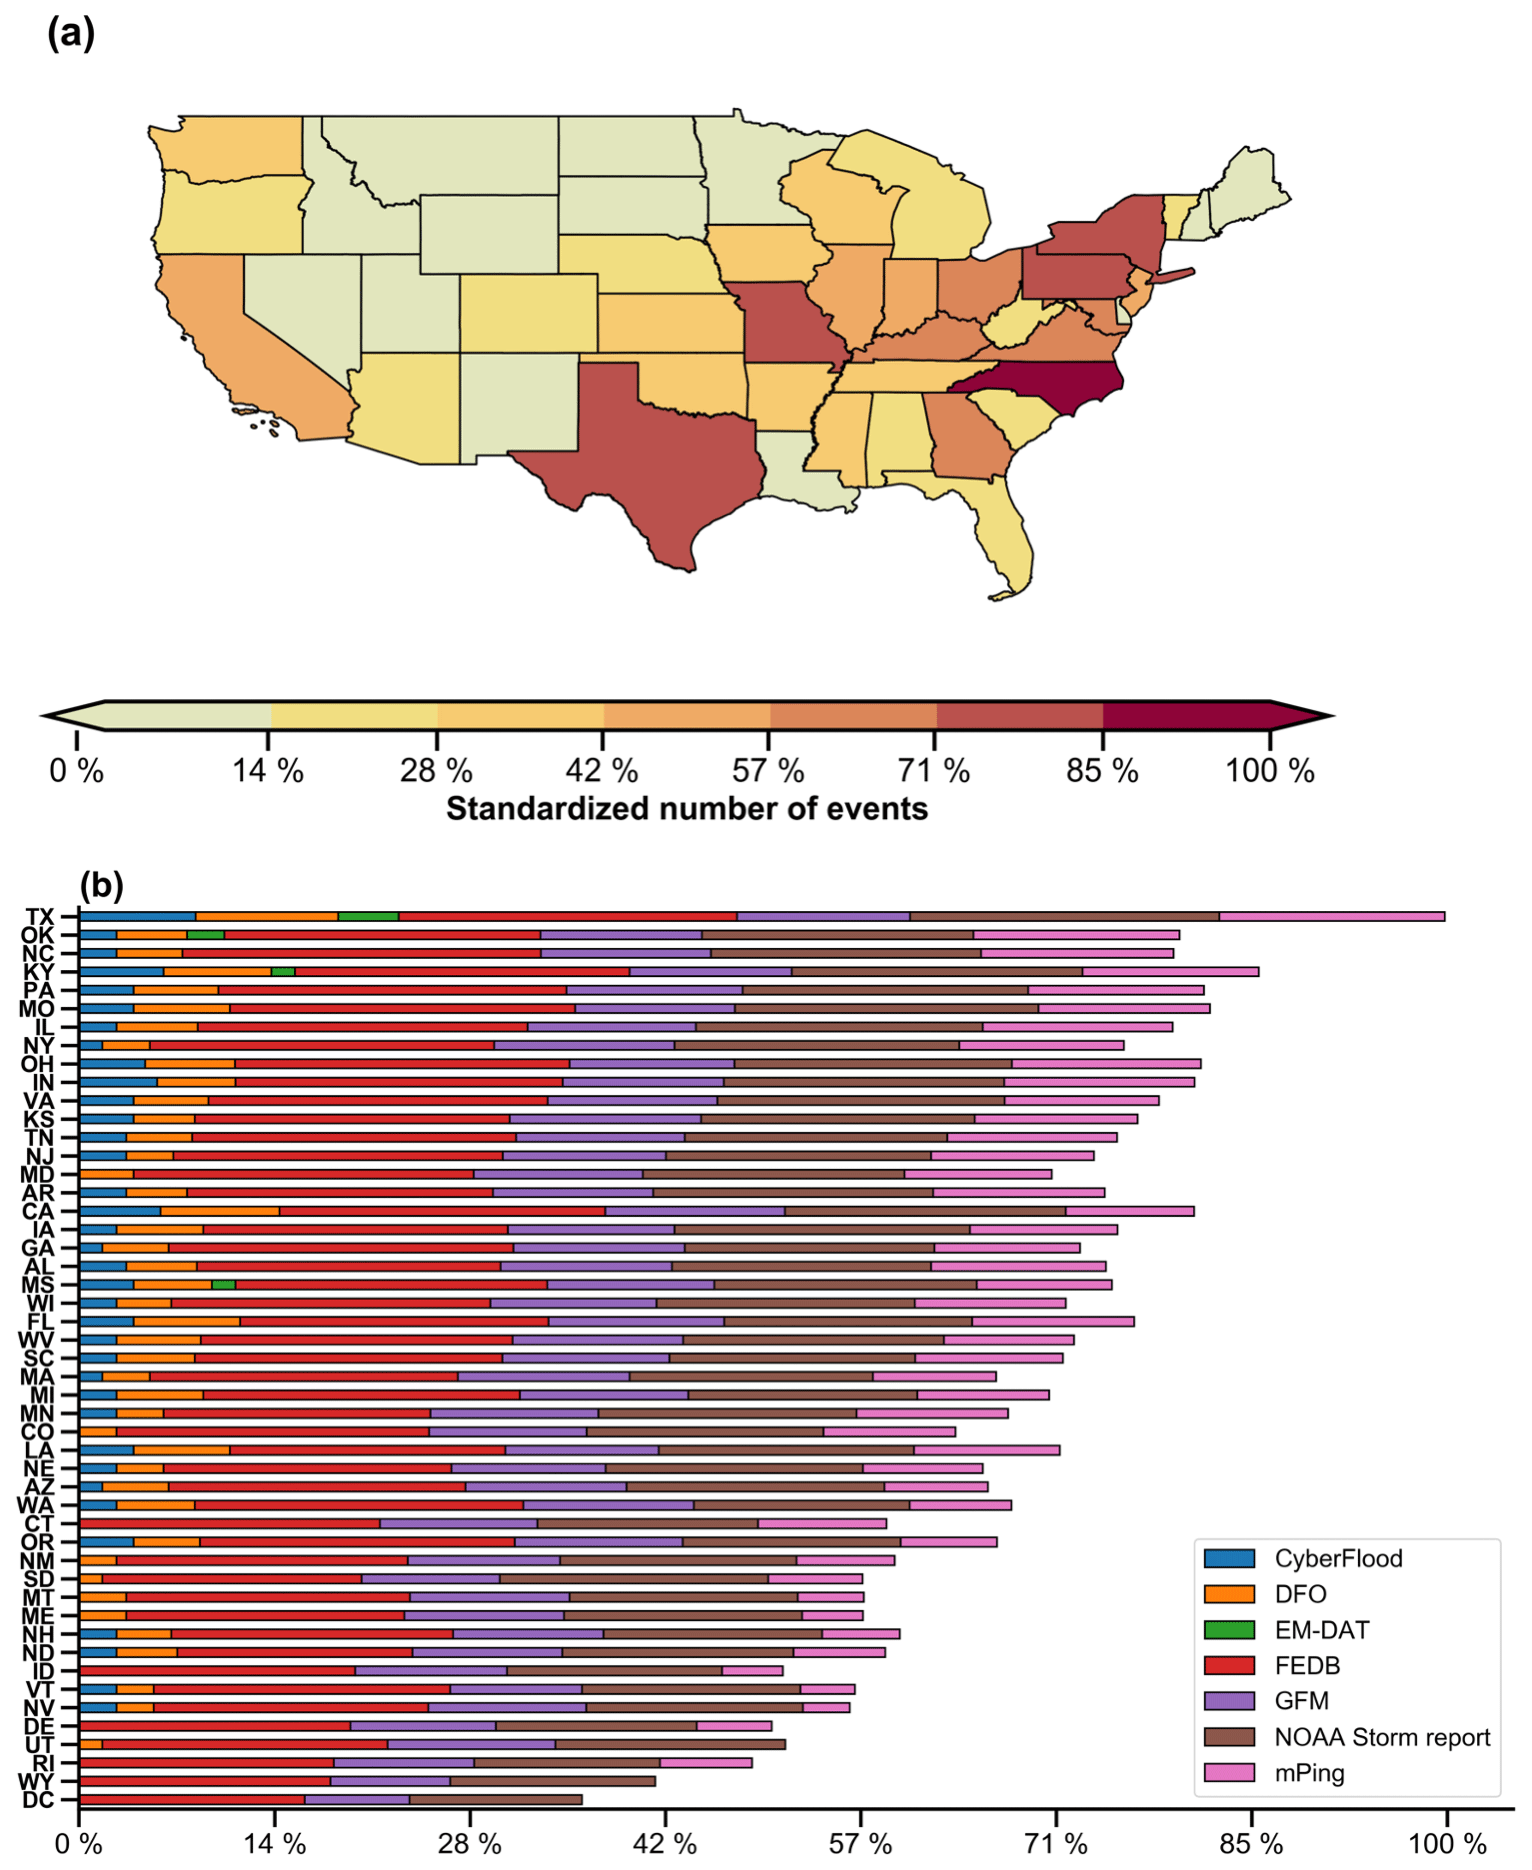
Figure 2(a) Map of min–max standardized flood occurrences in the United States; (b) fractions of logarithmic event numbers of each candidate database to logarithmic total event numbers.
4.1 Nationwide distributions
Figure 2a shows the nationwide distribution of flood events at state levels. Because the total event numbers might be skewed by replicated events in different databases, we standardize the event counts of each state by the maximum number of events, including repetitive events from different sources, out of all states to reveal the relative composition. It is noteworthy that we do not intend to discard repetitive events because they are reported with different attributes and uncertainties in different candidate databases; it is up to users to select the one that fits into their scopes. North Carolina, Texas, Missouri, and Pennsylvania are the top-listed regions with over 50 % of the total population, among which North Carolina experiences the most cases. From the meteorological perspective, North Carolina is prone to flooding due to a mixture of a flood-generating mechanisms, with landfalling tropical cyclones and extratropical systems being the primary large-scale drivers, in conjunction with warm-season thunderstorms. In the meantime, the combination of snowmelt and rain-on-snow contributes to flood peak occurring on the lee side of the Appalachian Mountains (Smith et al., 2011). The most devastating flood, estimated as a 500-year flood, was caused by Hurricane Floyd and led to 35 fatalities. Texas, similar to North Carolina, is affected by tropical cyclones and hurricanes, which produce compound inland and coastal flooding (Li et al., 2020). Anthropogenic effects such as urbanization and regulation, apart from meteorological effects, are equally critical for inland flooding. Blum et al. (2020) in a recent study noted that these listed regions experienced increased urbanization from 1974 to 2012, resulting in an average 3.3 % increased flood magnitude by changes in impervious cover alone.
Figure 2b lists detailed event numbers for each state and the composition of each individual flood database. The FEDB contributes a major portion of the unified database because of the data length of flow records, and states with higher gauge densities undoubtedly yield more event numbers than gauge-sparse regions. The data nonuniformity underlies a major limitation of this specific dataset. Regions with more exposure to observational sources (e.g., densely populated and gauge-dense areas) likely have more recorded events. However, it is expected that by including more observations from remote-sensing sources, this gap can be potentially compensated for. Following the composition, NWS storm reports comprise the second largest number of events because of the long data length (i.e., 70 years). Other databases, such as EM-DAT, though the longest available length, only record very-high-impact events, and the crowdsourcing databases are limited by their short lengths.
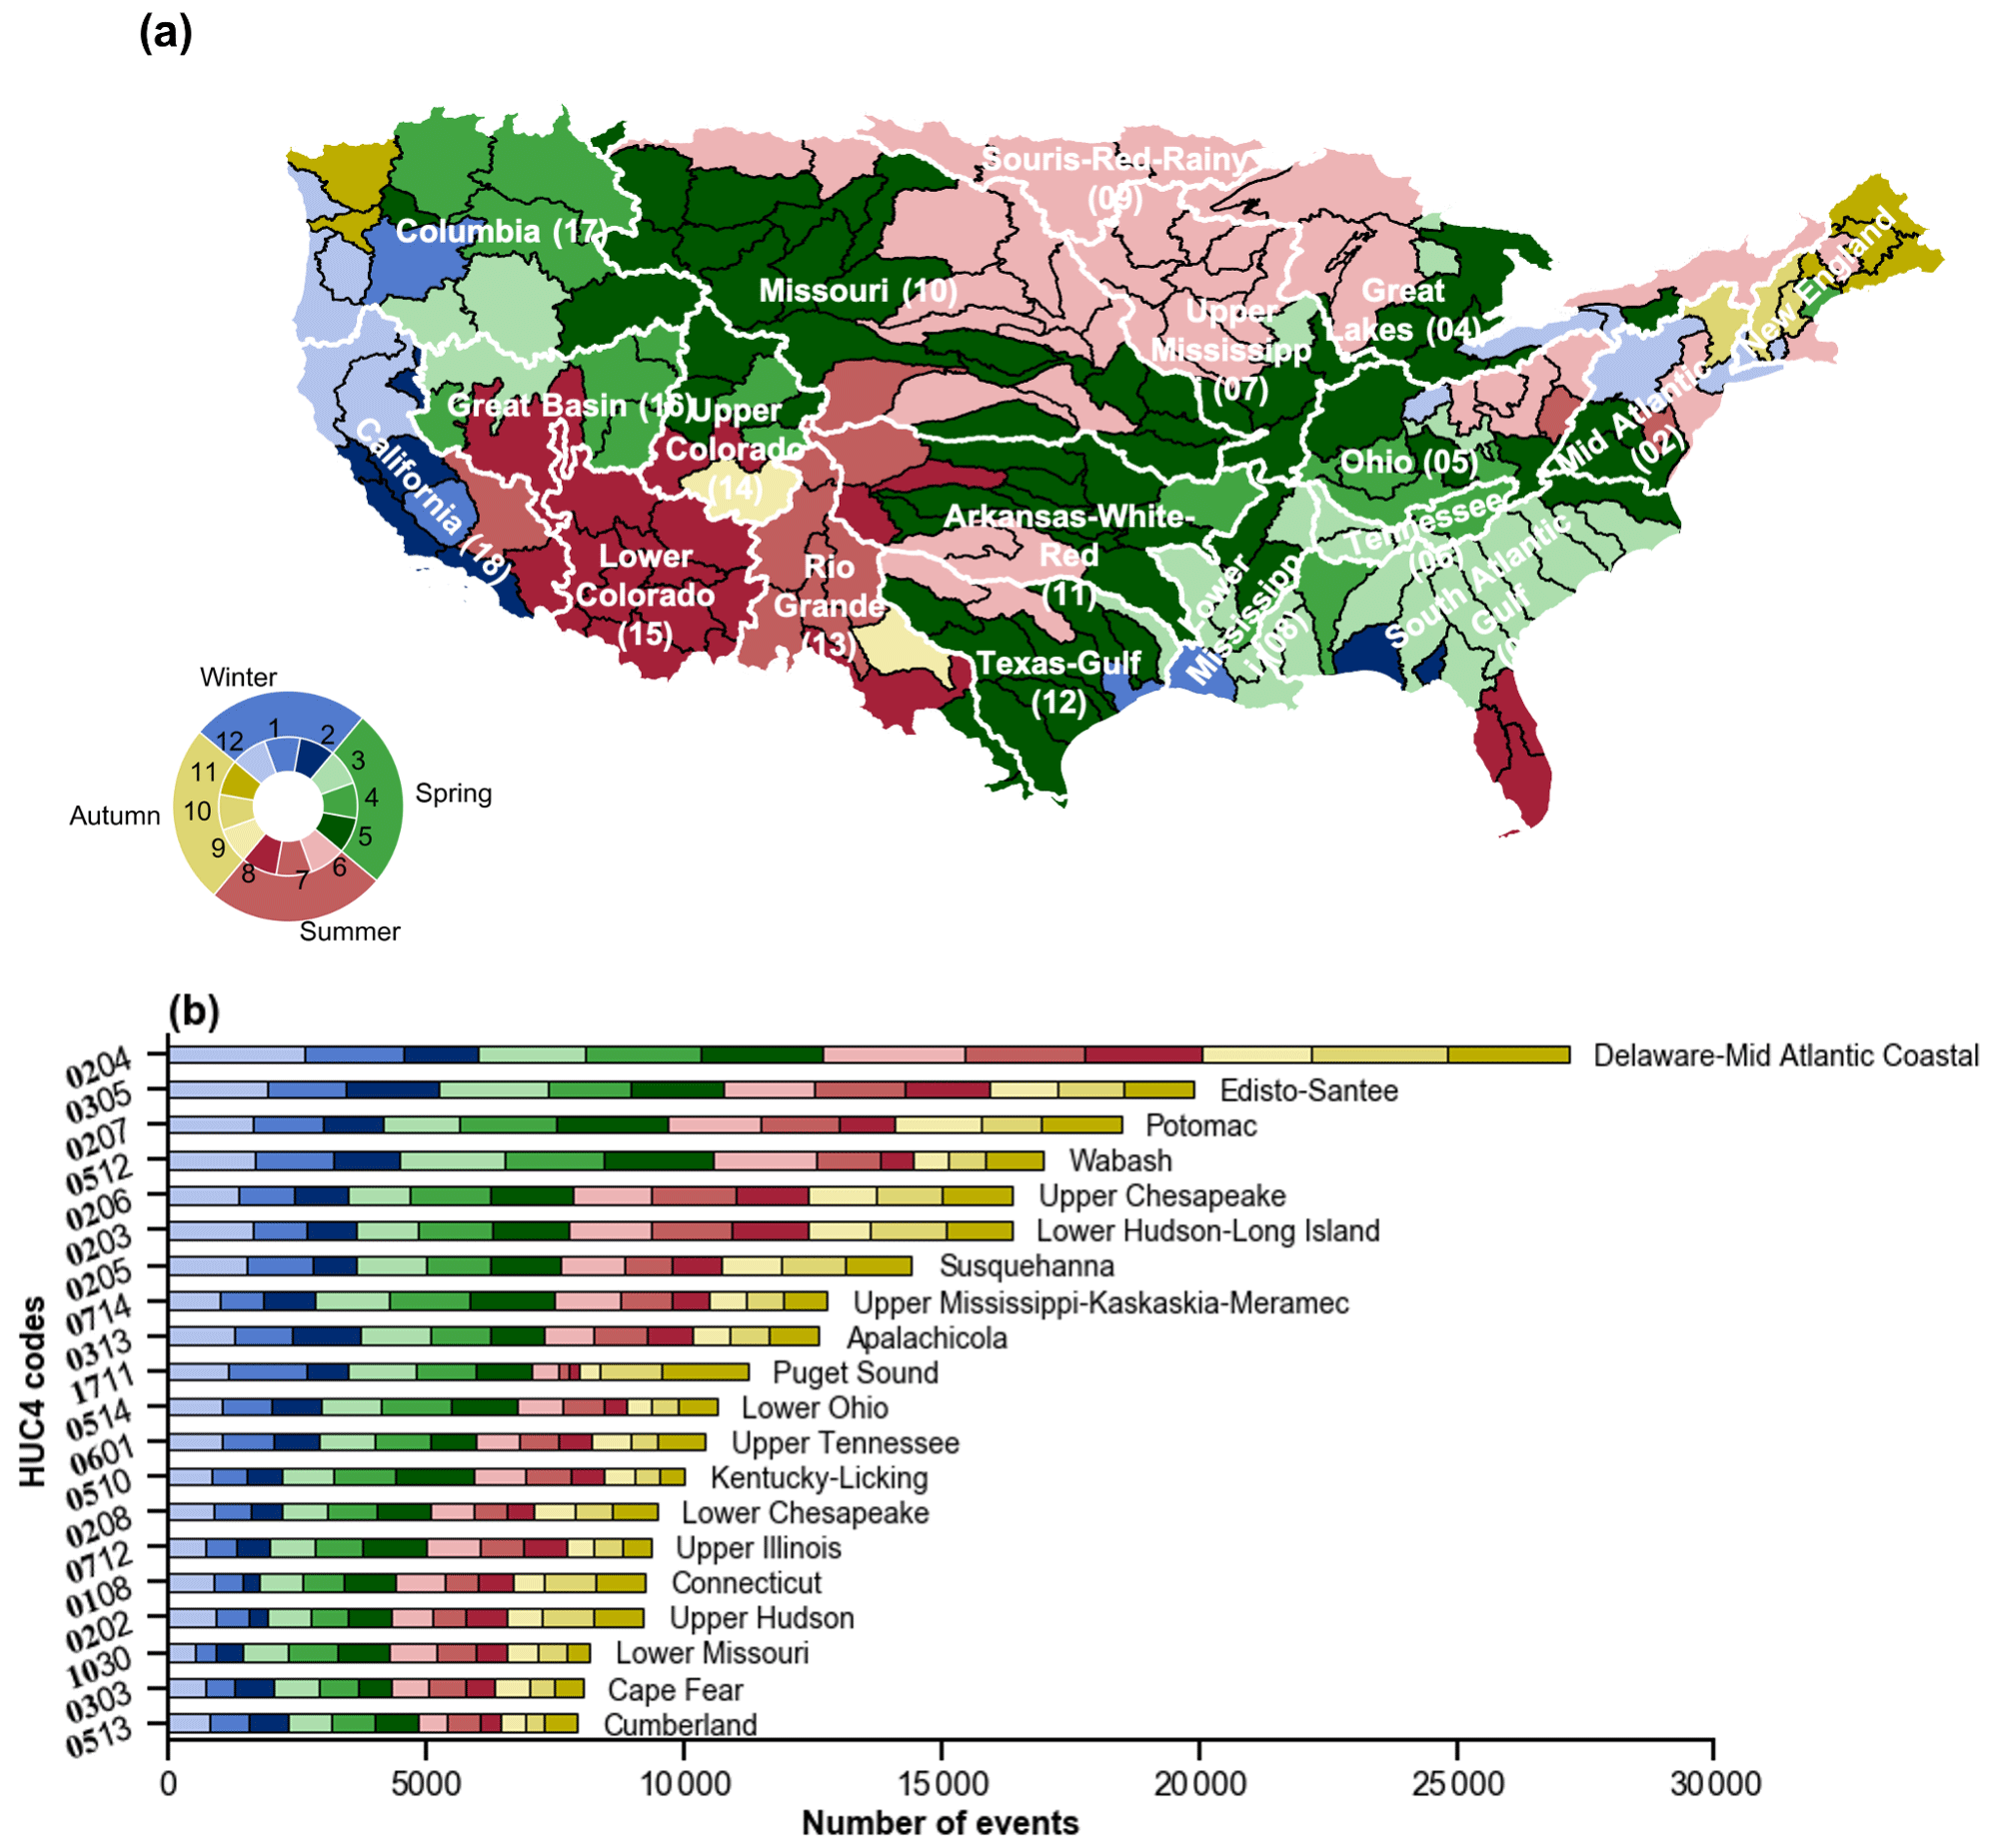
Figure 3(a) Map of months with largest flood occurrence in major US watersheds (Hydrologic Unit Code 4). (b) Flood occurrences of the top 20 HUC4 basins (HUC2 codes in bold), grouped by months.
4.2 Flood seasonality in major water basins
Flood variability is highly associated with seasonal atmospheric pathways of moisture delivery and basin attributes (Dickinson et al., 2019). In this regard, we segregate the nation-wide events into major basins and months. The hydrologic unit code (HUC) four-digit basins, as shown in Fig. 3, are obtained from the national hydrography dataset. Figure 3a depicts months with the highest number of events. Flooding generally happens between January and June over the majority of the US basins, similar to that of other studies (e.g., Brunner et al., 2020; Dickinson et al., 2019; Villarini, 2016). The basins are clustered into several regions according to local hydroclimatologies. On the west coast (e.g., western Washington, Oregon, and California), flood events are dominant in winter months because of atmospheric rivers (ARs) as a main driving factor, which are a carrier of water vapor from the tropics (Ralph et al., 2006). Moving to the east, floods in the Rockies (i.e., Upper Colorado and Great basins) are characterized by spring snowmelt in snow-fed rivers, whereas in the Desert Southwest (e.g., Lower Colorado and Rio Grande regions), floods likely occur in late summer, which is ascribed to the North American monsoon and North Pacific tropical cyclones. Closer to the Gulf of Mexico, flooding events during late spring and summer are due to severe thunderstorm activity and mesoscale convective systems. The lower Mississippi, Ohio, and Tennessee river basins experience their biggest floods during the spring from extratropical cyclones (Lavers and Villarini, 2013). The lower Florida Peninsula features high numbers of summer flood events, which are tied to North Atlantic tropical cyclones (Villarini et al., 2014). In the northeastern United States, tropical cyclones, winter–spring extratropical cyclones, and warm-season thunderstorms are the primary flood agents, yet winter–spring extratropical cyclones account for larger fractions (Smith et al., 2011; Villarini, 2016). Figure 3b displays the number of flood events within each basin, grouped by months. The Mid-Atlantic region (HUC2-02) takes seven places out of the top 20 HUC4 basins listed in Fig. 3b, with the Delaware River basin near the coast (HUC2-0204) being the highest one. In terms of flood seasonality, it is relatively evenly spanned across seasons and months for these listed basins, which suggests its susceptibility to widespread floods. This symmetric feature around the Appalachian Mountains across seasons is also highlighted in Villarini (2016), in which they suggest flow regulations play an essential role in weakening the seasonal cycle. In a recent study by Brunner et al. (2020), these basins are identified as severe or moderate widespread flooding in space, and our results indicate these regions also have widespread flooding in time (month).
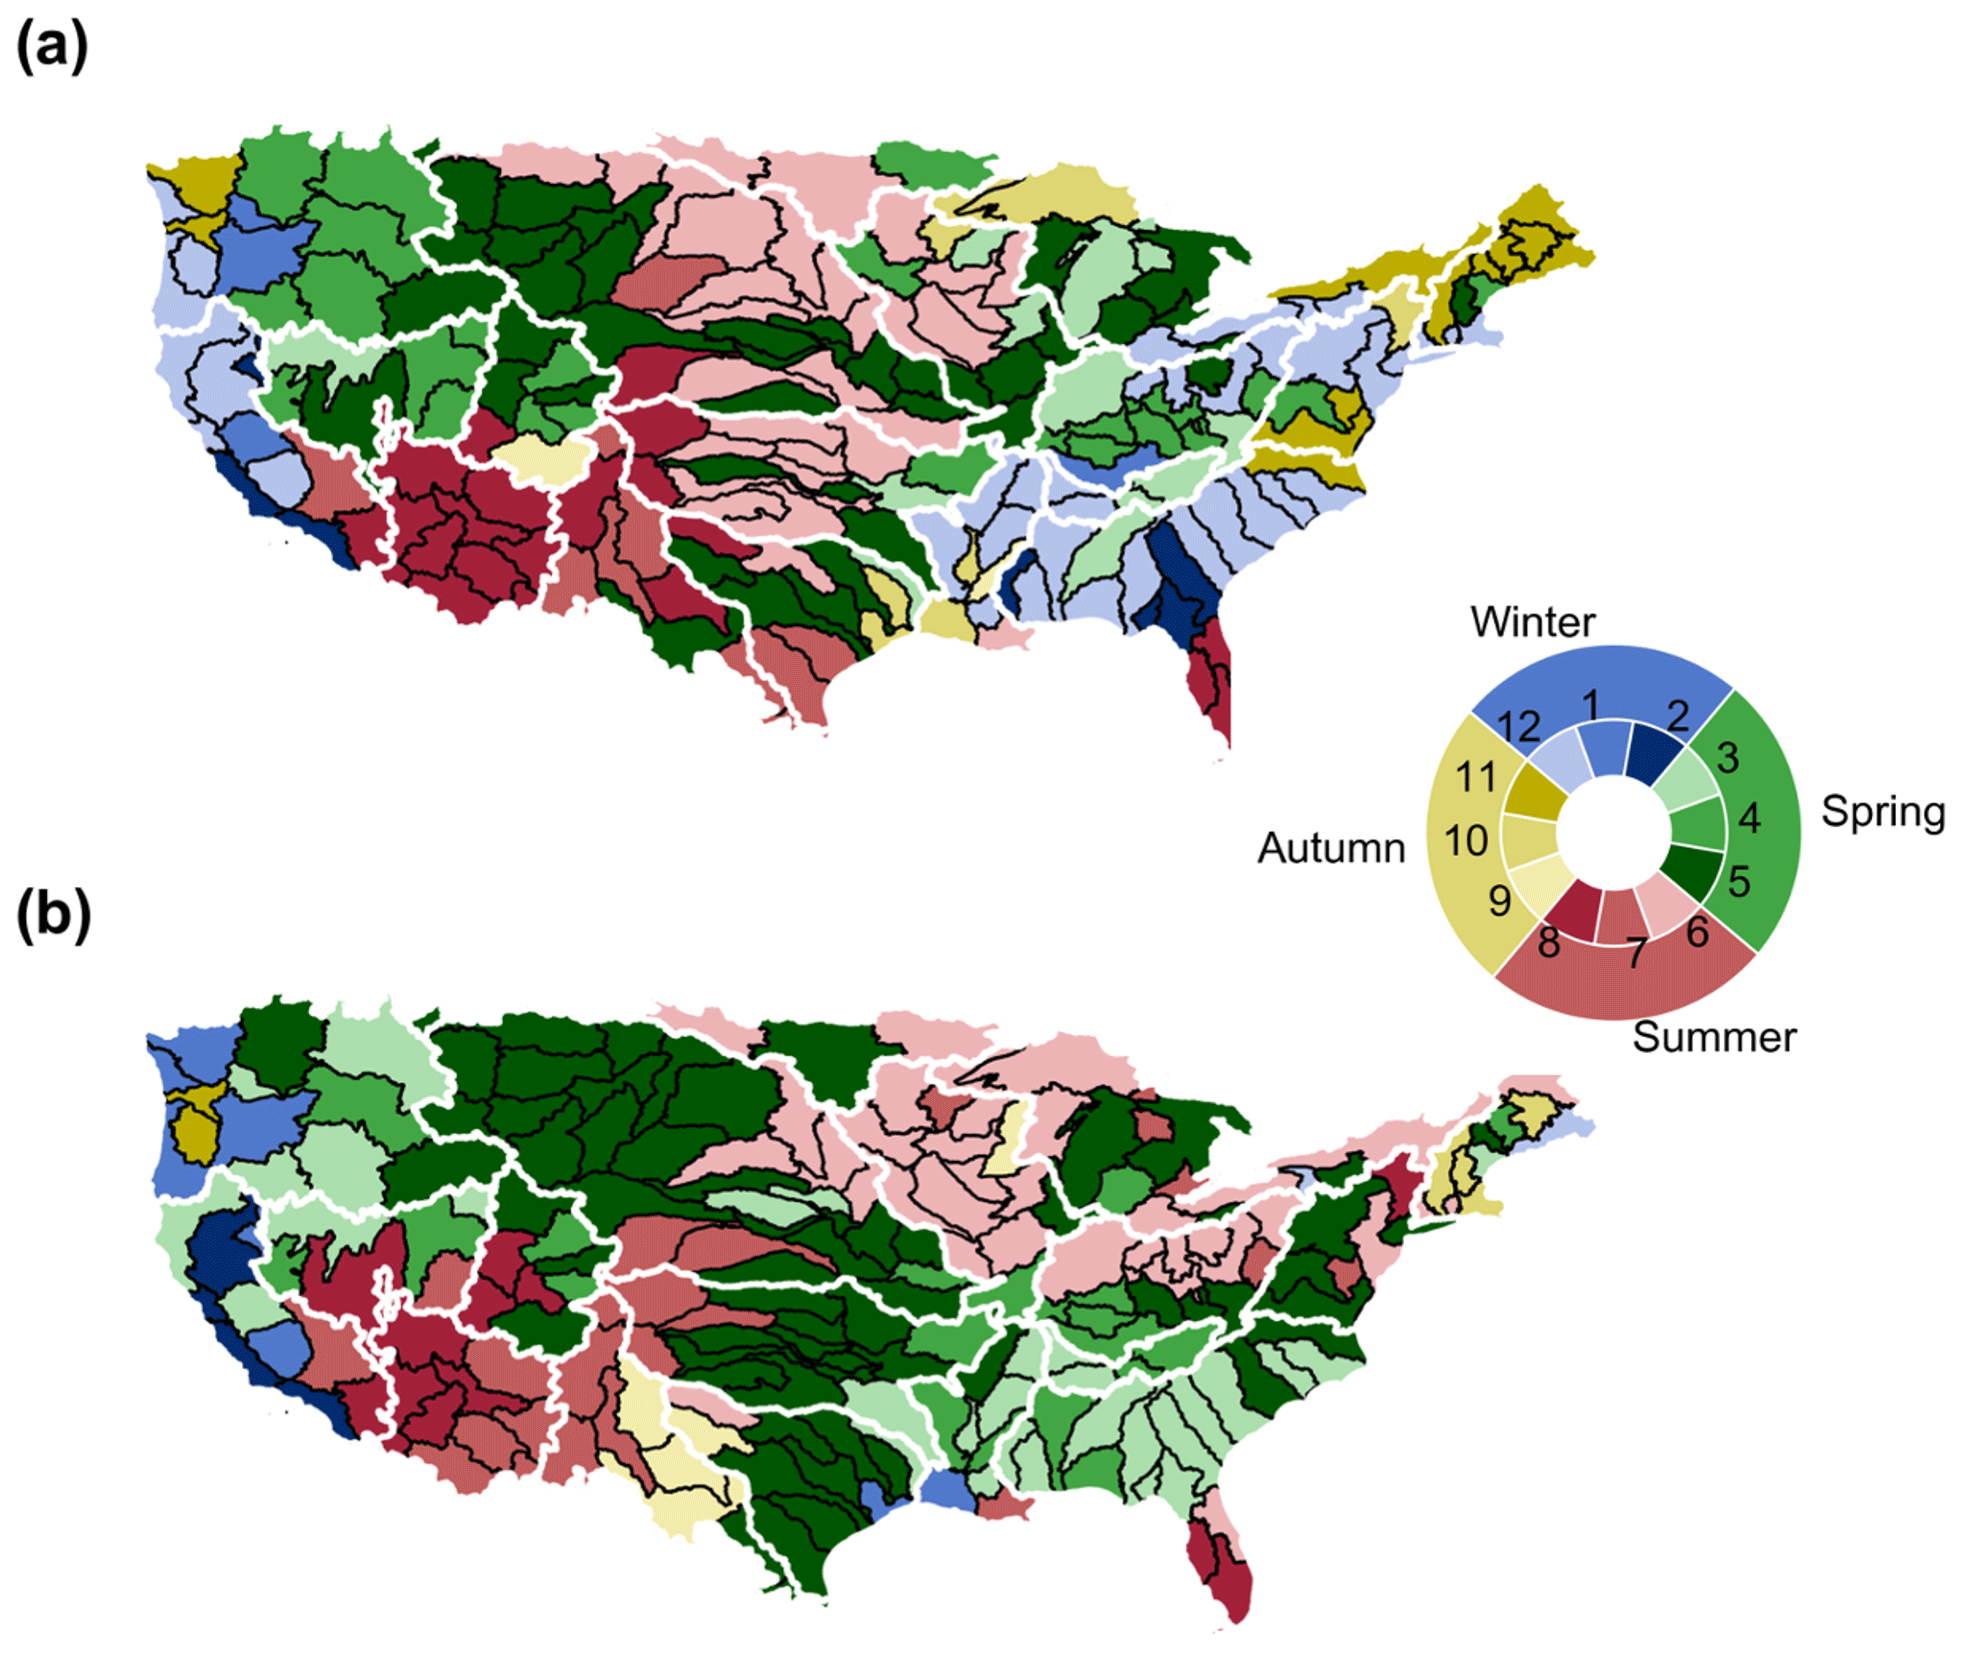
Figure 4Maps of month of maximum flood frequency, same as Fig. 3a but for two periods: (a) 2000–2010 and (b) 2010–2020.
Figure 4 depicts the flood seasonality for two separate periods, 2000–2010 (panel a) and 2010–2020 (panel b), which investigates potential shifts in flood timing for US river basins. On the west coast (California and Columbia basin), there is a shift from early winter flooding to late winter or early spring flooding, especially near the northern coast. This probably relates to snowmelt occurring in early spring, in conjunction with the rain-on-snow effect. The Great Plains feature an earlier maximum flood frequency, transitioning from early summer to late spring, which relates to enhanced and earlier timing of thunderstorm activities due to spring warming. The south Atlantic Coast shows a delayed maximum flood frequency from winter to spring. The lower Florida Peninsula, however, does not present a clear monthly shift, which is still controlled by tropical cyclones.
4.3 Flood impact assessment
In the USFD, flood impacts are based on affected areas, economic damages, and fatalities. Since affected areas are relatively subjective, they are not analyzed in this study. All the economic damages (US dollars) are adjusted for inflation with GDP deflectors obtained from the World Bank. To avoid repeated counts of damages or fatalities due to repetitive events, we herein calculate the mean values per event. Figure 5 depicts the fatalities and damages by year. Although events continuously span from 1900 to the present, impact assessments were not provided in the earlier years (before 1980). The 10-year running mean represents the long-term trend. Both fatalities and damages begin at high rates in the early years, possibly due to the immature understanding of floods and lack of flood protection measures. The 1964 flood event which happened in the Pacific Northwest and northern California during the Christmas holiday, also known as the “Thousand Year Flood”, caused hundreds of millions of dollars in damages, and over 10 people lost their lives. Since 1990, however, with the improved measures in flood prediction, management, and protection, fatality rates have started to decrease except for some highlighted major events. Yet, in recent years, damages have shown a slight upward trend, which is tied to frequent floods caused by intensified active hurricane events and anthropogenic effects. For instance, the 2011 and 2012 Atlantic hurricane seasons are deemed the third and fourth most active hurricane season on record. The 2017 hurricane season featuring Harvey, Irma, and Maria was the costliest hurricane season on record, which is reflected in flood-related damages. Land surface changes such as urbanization continue to develop a conducive environment for urban flooding.
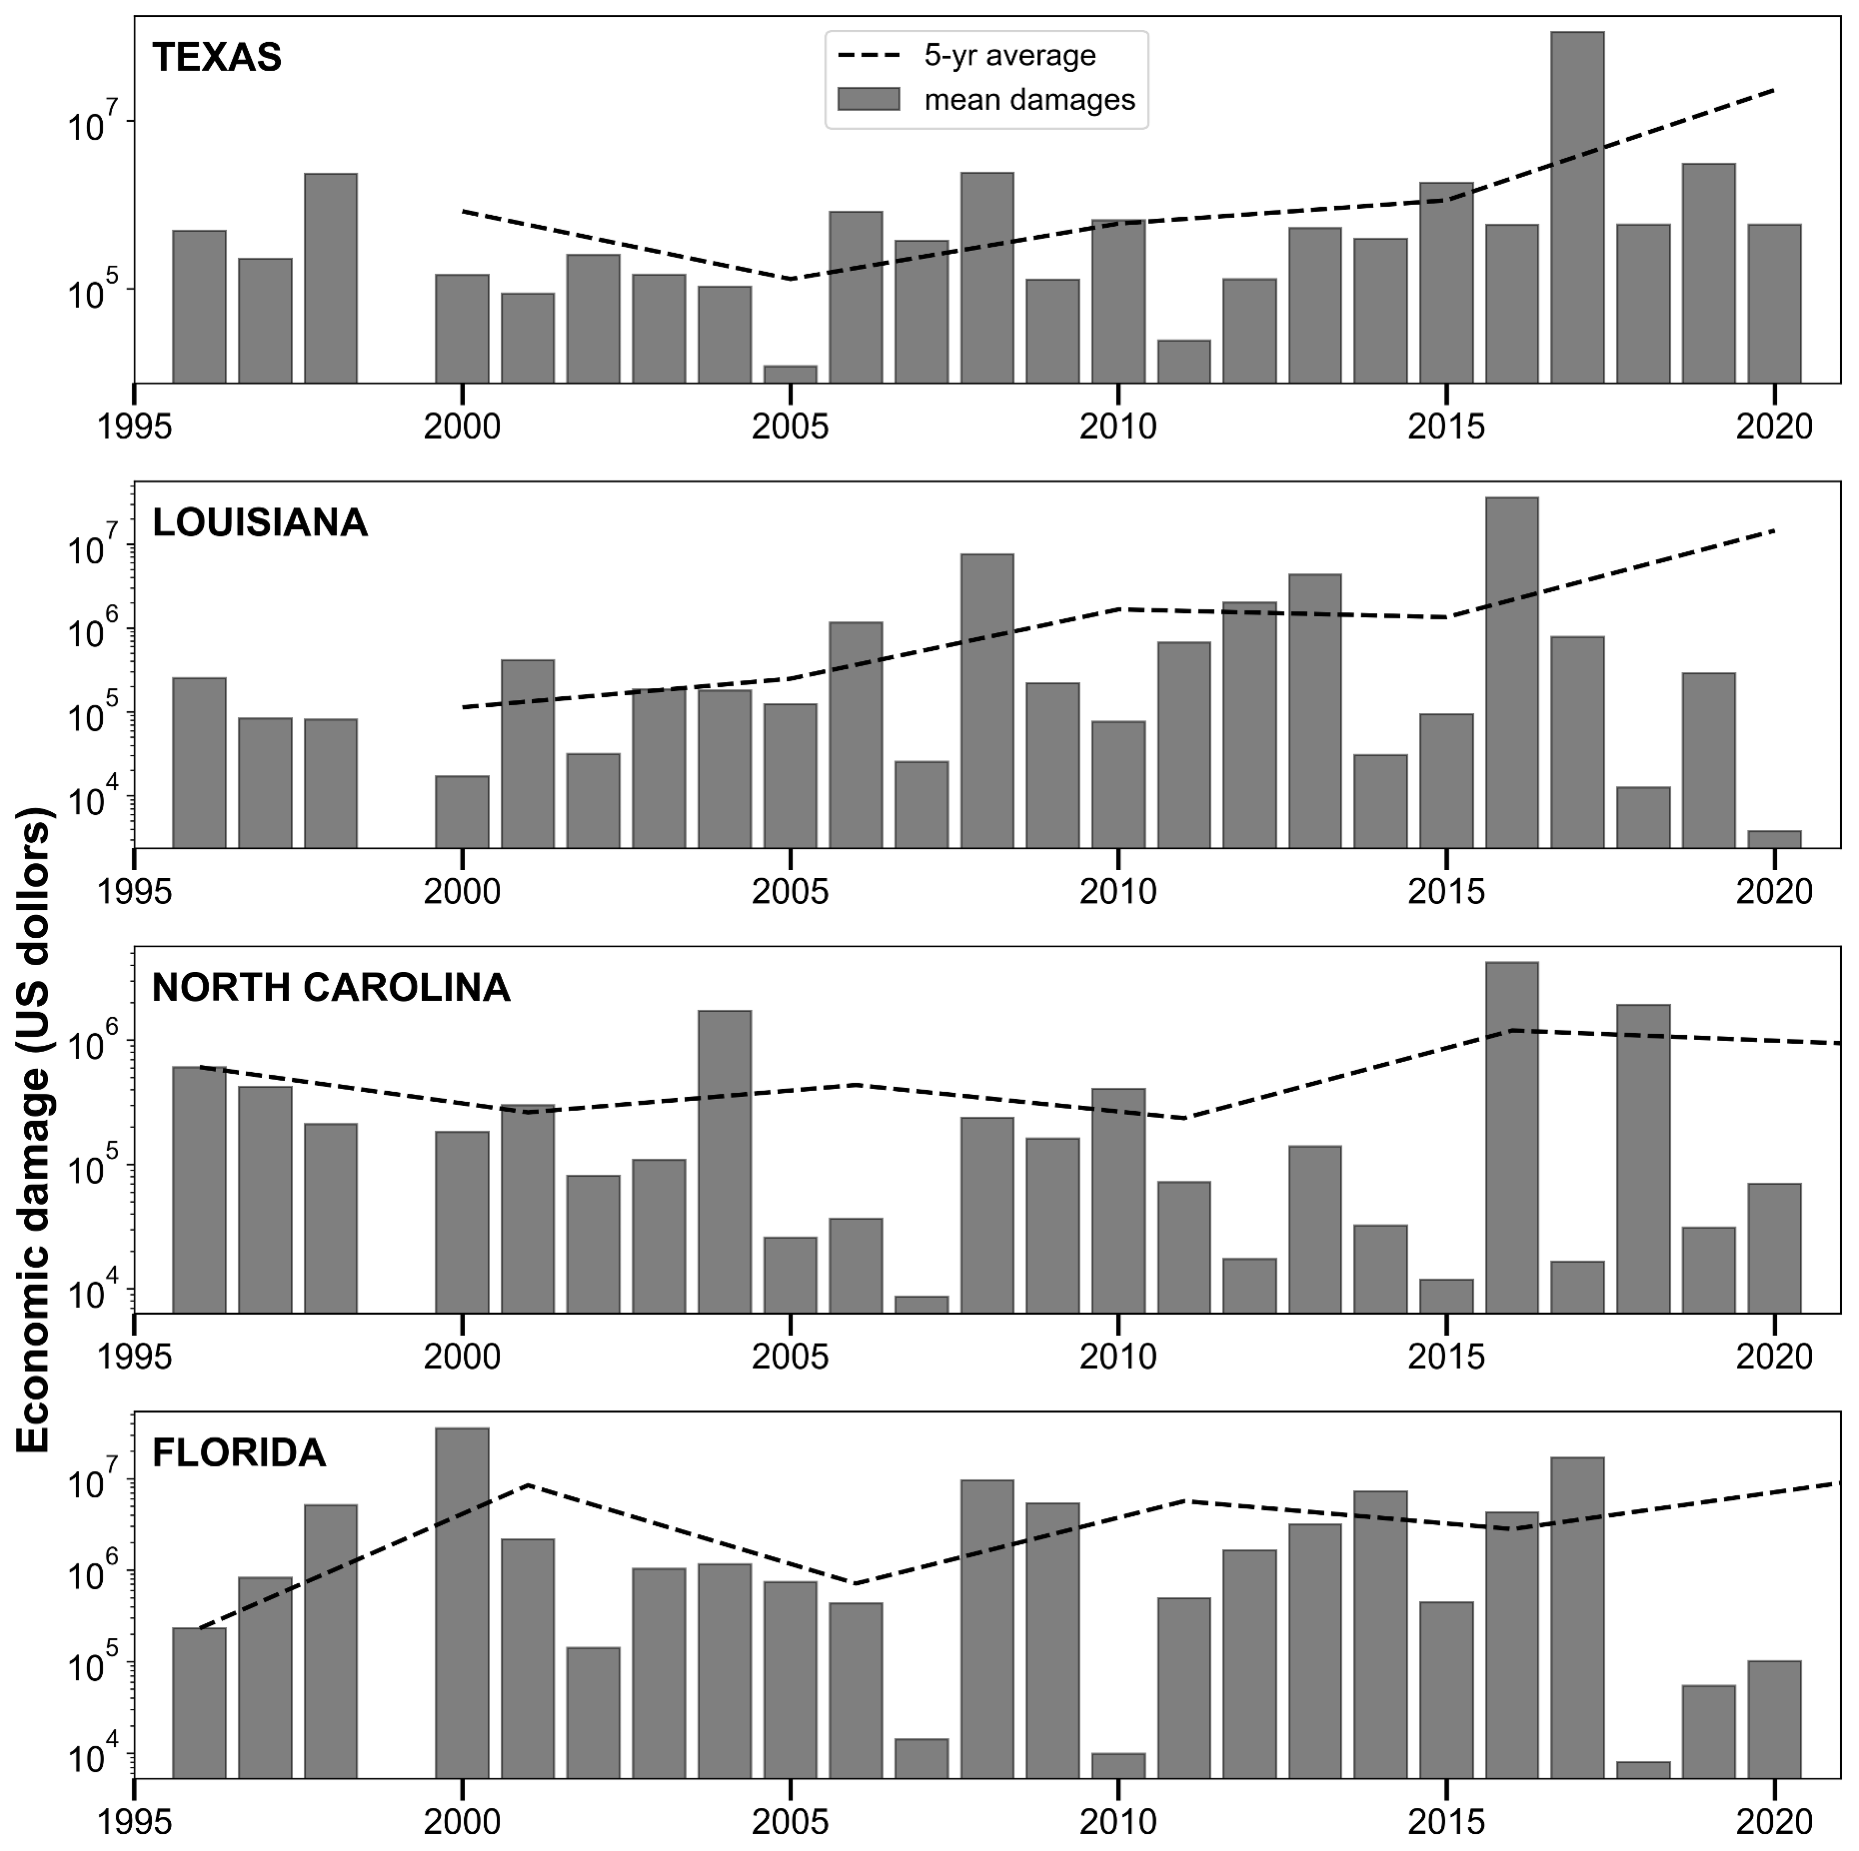
State-specific damages across time shown in Fig. 6 reveal the trends in flooding hotspots. For Texas and Louisiana, consistent upward trends are present because of intensified extreme events in the Gulf Coast. The slopes of annual flood damage curves are the greatest among the identified hotspots, manifesting potential flood risks. North Carolina has experienced an increase in damages in the past 10 years, accompanied by major events during the 2016 and 2018 Atlantic hurricane seasons. Florida, similar to North Carolina, has encountered active hurricane seasons and accompanying damages. In summary, these flood hotspots with increased flood damages should raise awareness from policy-makers and the public.
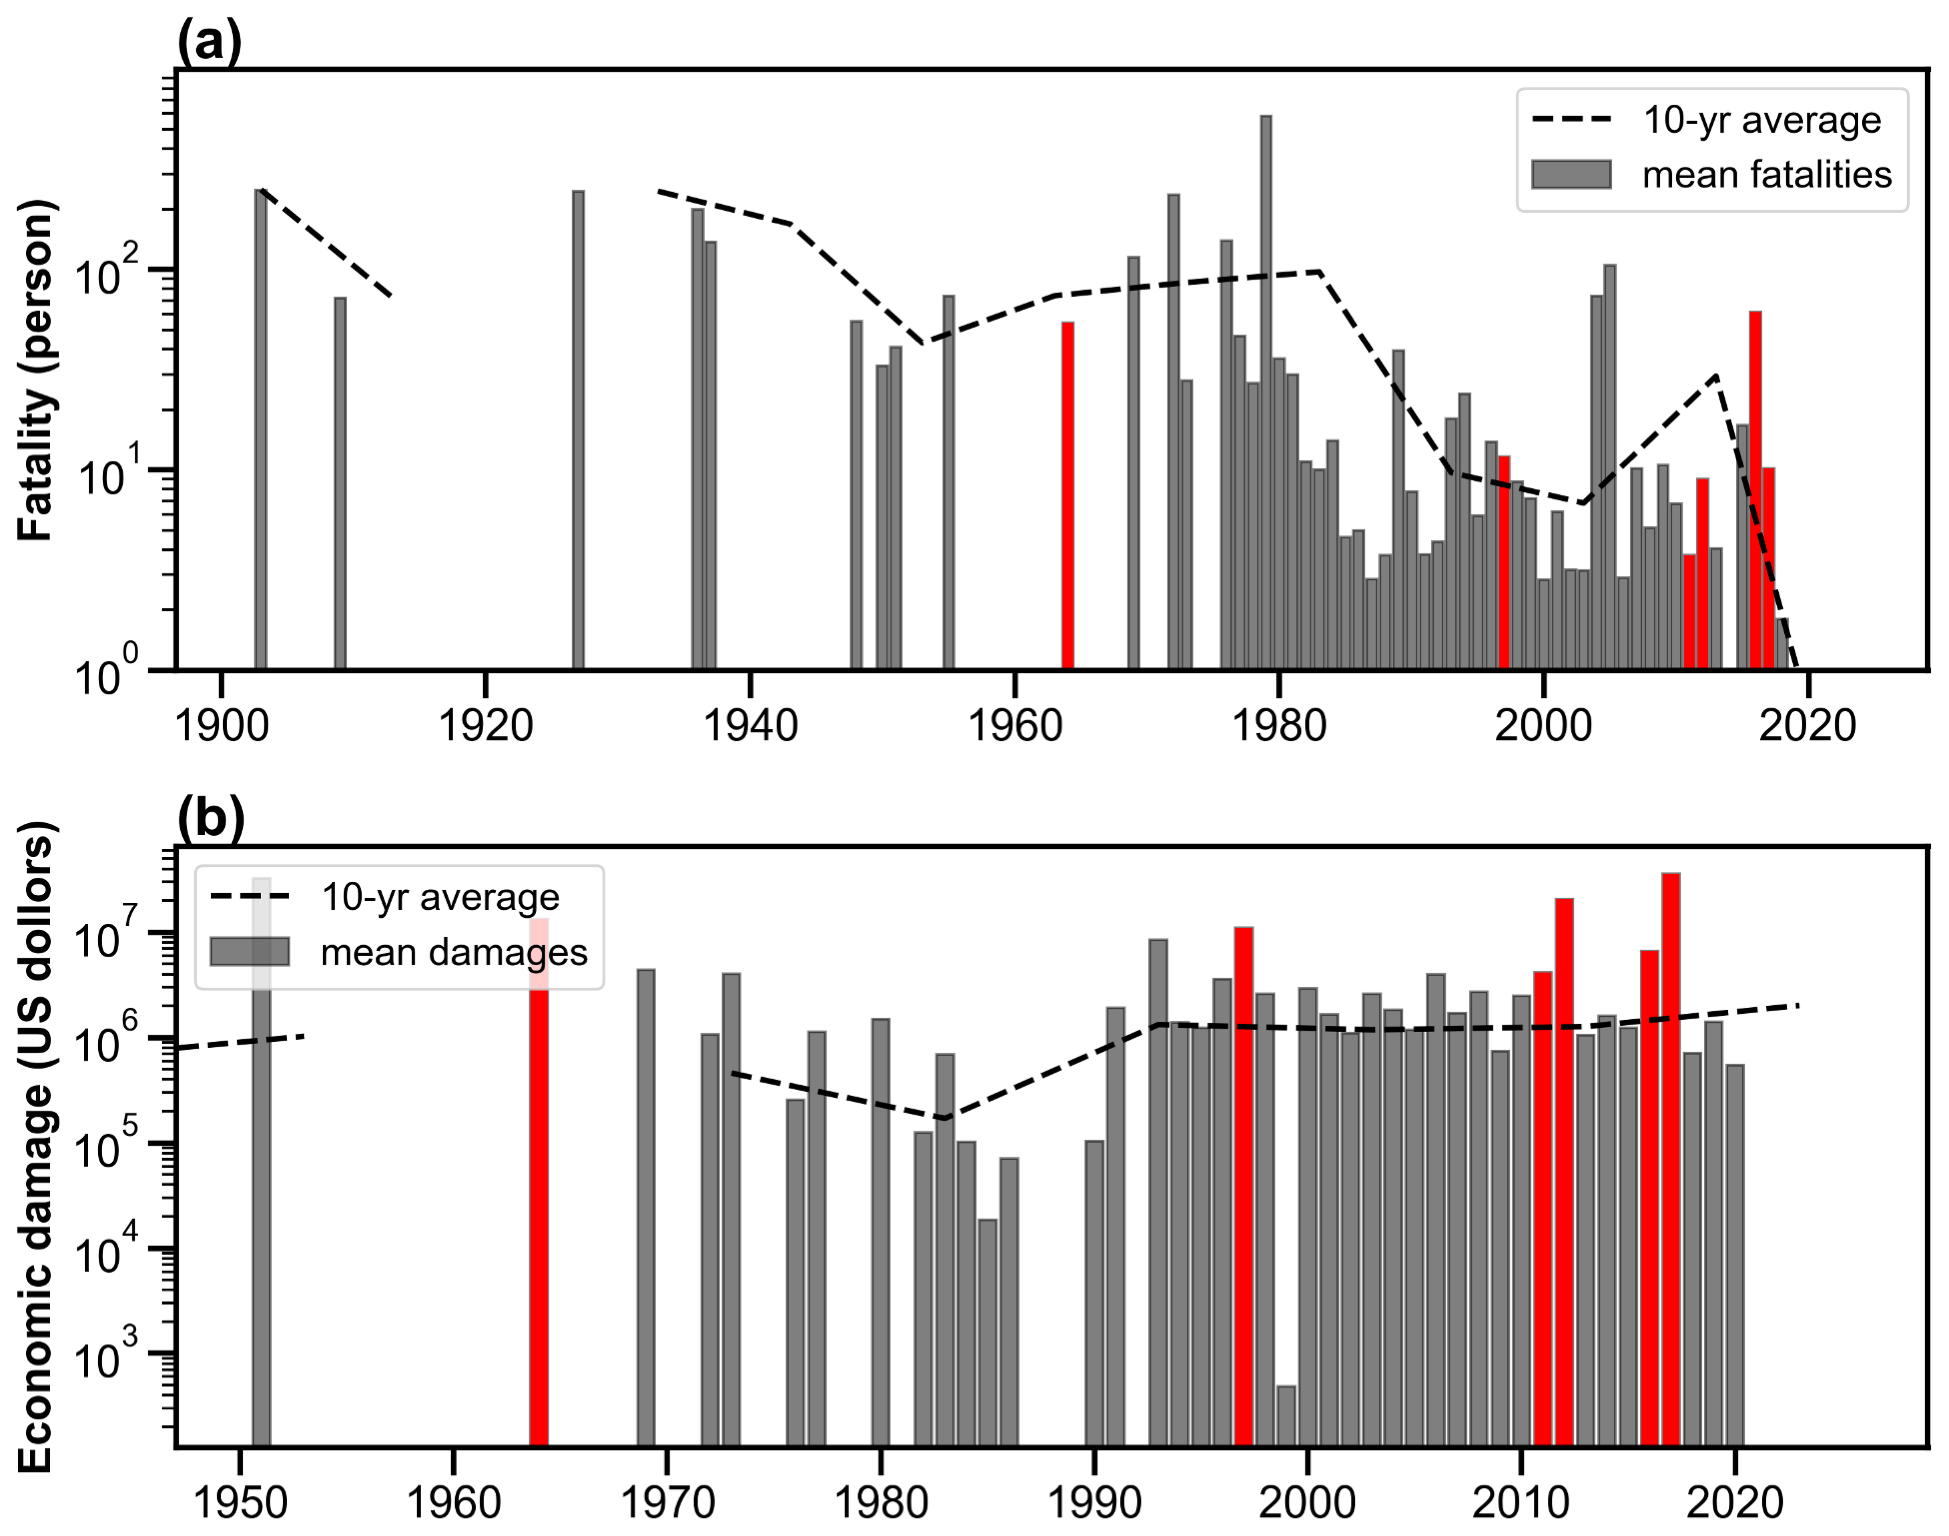
Figure 5Time series of flood impacts: (a) mean fatalities per event and (b) mean economic damages per event (US dollars based on 2020). The highlighted bars represent 1964, 1997, 2011, 2012, 2016, and 2017, which are the active hurricane seasons on record.
The USFD open-access dataset and all individual datasets are available at https://doi.org/10.5281/zenodo.4547036 (Li, 2020).
The Python code to process, merge, and analyze this database is publicly available at https://github.com/chrimerss/USFD (last access: 10 July 2021), https://doi.org/10.5281/zenodo.5090020 (Li, 2021).
This work presents a merged United States Flood Database (USFD) that features the longest and most comprehensive recording of flooding across the country. The merged database, integrated from multiple sources, can overcome limitations inherent to the individual databases and thus maximize benefits. It is expected that this database can support a variety of flood-related research, such as a validation resource for hydrologic and hydraulic model simulations, hydroclimatic studies concerning spatiotemporal patterns of floods, and flood susceptibility analysis for vulnerable geophysical locations.
We showcase three analyses based on the developed flood database. For flood occurrences across the United States, Texas, Pennsylvania, and Missouri are highlighted with great exposure to floods in total amount, which could raise awareness from policy-makers and the public. Flood seasonality in major river basins generally follows the large-scale synoptic weather patterns. In addition, delayed timings of maximum flood frequency are observed in the west coast and Atlantic River basin, possibly due to earlier snowmelt than in prior decades that now contributes to spring floods. Floods in the Great Plains, on the contrary, feature an earlier month of maximum flood frequency, which is possibly tied to intensified thunderstorm activities because of earlier spring warming. Lastly, flood impacts are assessed in terms of economic damages and fatalities, and we found a slight increasing trend in damages in recent years. Especially in Texas and Louisiana, a consistent increase in damages is evident, which relates to intensified storm activity and expanding urban zones. Under a warming climate, storms are projected to occur more frequently in the future, which challenges current water infrastructures and water management principles (IPCC, 2014).
Notwithstanding, there are some limitations associated with the current version of USFD. First, the individual databases disproportionally make up the merged one. FEDB, taken from streamflow records over a long history, consists of the majority of the flood events. The emerging crowdsourced databases are expected to play a significant role with the increasing engagement of citizen scientists. Space-based observations could markedly bridge the gaps between well-observed urban areas and gauged basins to gauge-sparse areas in rural zones. For instance, complete use of the MODIS imagery on board Terra and Aqua satellites, in association with Landsat or synthetic aperture radar data, can reconstruct global flood events at daily resolution. In addition to flood extent, flood depth can also be approximated through the use of high-resolution DEM data. Floods, reported by insurance companies, offer another angle to not only record events, but relate flood hazards to societal impacts comprehensively. In the future, we hope to incorporate such a dataset to enrich our database at a global scale. Second, uncertainties exist in each candidate database. The web-based crowdsourcing dataset may be less reliable because of lack of stringent data scrutiny, especially for studies that require precise flood locations. Developing new guidance for citizen scientists is a remedy. The instrument uncertainties are subject to confined locations such as stream gauges and technical algorithms to retrieve flood information such as remotely sensed observations. Algorithm developers should take into account how to quantify uncertainties in addition to the end product. The flood reports from government agencies are relatively less uncertain. Therefore, it is highly recommended that users select the candidate databases that fit their research scope. We also encourage each flood database, during its original development, to produce uncertainty measures quantitatively. In a future work, we will consider ways of incorporating uncertainty measures from individual flood databases and harmonize them into one for delivering comprehensive flood information. Third, the data-processing framework needs to be automated in real time. We plan to migrate processing codes to the cloud, so that they can query records from the child databases and update the parent database on a regular basis.
ZL, JJG, and YH conceived this study; ZL, MC, and SG implemented the methodology and conceived the case study; ZL wrote the codes and the manuscript; all other authors reviewed and edited the manuscript.
The authors declare that they have no conflict of interest.
Publisher's note: Copernicus Publications remains neutral with regard to jurisdictional claims in published maps and institutional affiliations.
The first author is sponsored by the Hydrology and Water Security program and the Hoving fellowship at the University of Oklahoma. We would like to acknowledge the efforts of collecting information from the seven open-source flood databases. The authors appreciate the two anonymous reviewers for their valuable input to improve this paper.
This paper was edited by David Carlson and reviewed by two anonymous referees.
Alfieri, L., Bisselink, B., Dottori, F., Naumann, G., De Roo, A., and Salamon P.: Global projections of river flood risk in a warmer world, Earths Future., 5, 171–182, https://doi.org/10.1002/2016EF000485, 2016.
Amponsah, W., Ayral, P.-A., Boudevillain, B., Bouvier, C., Braud, I., Brunet, P., Delrieu, G., Didon-Lescot, J.-F., Gaume, E., Lebouc, L., Marchi, L., Marra, F., Morin, E., Nord, G., Payrastre, O., Zoccatelli, D., and Borga, M.: Integrated high-resolution dataset of high-intensity European and Mediterranean flash floods, Earth Syst. Sci. Data, 10, 1783–1794, https://doi.org/10.5194/essd-10-1783-2018, 2018.
Brakenridge, G. R.: Global active archive of large flood events, Dartmouth Flood Observatory, University of Colorado, available at: http://floodobservatory.colorado.edu/Archives/index.html, last access: 28 December 2020.
Brunner, M. I., Papalexiou, S., Clark, M. P., and Gilleland, E.: How probable is widespread flooding in the United States?, Water Resour. Res., 56, e2020WR028096, https://doi.org/10.1029/2020WR028096, 2020.
Chen, S., Gourley, J. J., Hong, Y., Cao, Q., Carr, N., Kirstetter, P. E., Zhang, J., and Flamig, Z.: Using citizen science reports to evaluate estimates of surface precipitation type, B. Am. Meteorol. Soc., 97, 187–193, https://doi.org/10.1175/BAMS-D-13-00247.1, 2016.
de Bruijn, J. A., de Moel, H., Jongman, B., de Ruiter, M. C., Wagemaker, J., and Aerts, J. C. J. H.: A global database of historic and real-time flood events based on social media, Sci. Data, 6, 311, https://doi.org/10.1038/s41597-019-0326-9, 2019.
Dickinson, J. E., Harden, T. M., and McCabe, G. J.: Seasonality of climatic drivers of flood variability in the conterminous United States, Sci. Rep., 9, 15321, https://doi.org/10.1038/s41598-019-51722-8, 2019.
Elmore, K. L., Flamig, Z. L., Lakshmanan, V., Kaney, B. T., Farmer, V., Reeves, H. D., and Rothfusz, L. P: MPING: Crowd-Sourcing Weather Reports for Research, B. Am. Meteorol. Soc., 95, 1335–1342, https://doi.org/10.1175/BAMS-D-13-00014.1, 2014.
Fiorillo, E., Crisci, A., Issa, H., Maracchi, G., Morabito, M., and Tarchiani, V.: Recent Changes of Floods and Related Impacts in Niger Based on the ANADIA Niger Flood Database, Climate, 6, 59, https://doi.org/10.3390/cli6030059, 2018.
Gorelick, N., Hancher, M., Dixon, M., Ilyushchenko, S., Thau, D., and Moore, R.: Google Earth Engine: Planetary-scale geospatial analysis for everyone, Remote Sens. Environ., 202, 18–27, https://doi.org/10.1016/j.rse.2017.06.031, 2017.
Gourley, J. J., Hong, Y., Flamig, Z. L., Arthur, A., Clark, R., Calianno, M., Ruin, I., Ortel, T., Wieczorek, M. E., Kirstetter, P. E., Clark, E., and Krajewski, W. F.: A unified Flash flood database across the United States, B. Am. Meteorol. Soc., 94, 799–805, https://doi.org/10.1175/BAMS-D-12-00198.1, 2013.
Hall, J., Arheimer, B., Aronica, G. T., Bilibashi, A., Boháč, M., Bonacci, O., Borga, M., Burlando, P., Castellarin, A., Chirico, G. B., Claps, P., Fiala, K., Gaál, L., Gorbachova, L., Gül, A., Hannaford, J., Kiss, A., Kjeldsen, T., Kohnová, S., Koskela, J. J., Macdonald, N., Mavrova-Guirguinova, M., Ledvinka, O., Mediero, L., Merz, B., Merz, R., Molnar, P., Montanari, A., Osuch, M., Parajka, J., Perdigão, R. A. P., Radevski, I., Renard, B., Rogger, M., Salinas, J. L., Sauquet, E., Šraj, M., Szolgay, J., Viglione, A., Volpi, E., Wilson, D., Zaimi, K., and Blöschl, G.: A European Flood Database: facilitating comprehensive flood research beyond administrative boundaries, Proc. IAHS, 370, 89–95, https://doi.org/10.5194/piahs-370-89-2015, 2015.
He, B., Huang, X., Ma, M., Chang, Q., Tu, Y., Li, Q., Zhang, K., and Hong, Y.: Analysis of flash flood disaster characteristics in China from 2011 to 2015, Nat. Hazards, 90, 407–420, https://doi.org/10.1007/s11069-017-3052-7, 2018.
Hilker, N., Badoux, A., and Hegg, C.: The Swiss flood and landslide damage database 1972–2007, Nat. Hazards Earth Syst. Sci., 9, 913–925, https://doi.org/10.5194/nhess-9-913-2009, 2009.
IPCC: Climate Change 2014: Synthesis Report, Contribution of Working Groups I, II and III to the Fifth Assessment Report of the Intergovernmental Panel on Climate Change, edited by: Core Writing Team, Pachauri, R. K., and Meyer, L. A., IPCC, Geneva, Switzerland, 151 pp., 2014.
Li, Z.: United States Flood Database (Version v1.0), Zenodo, https://doi.org/10.5281/zenodo.4547036, 2020.
Li, Z.: chrimerss/USFD (Version 1.0) [code], Zenodo, https://doi.org/10.5281/zenodo.5090020, 2021.
Li, Z., Chen, M., Gao, S., Hong, Z., Tang, G., Wen, Y., Gourley, J. J., and Hong, Y.: Cross-Examination of Similarity, Difference and Deficiency of Gauge, Radar and Satellite Precipitation Measuring Uncertainties for Extreme Events Using Conventional Metrics and Multiplicative Triple Collocation, Remote Sens., 12, 1258, https://doi.org/10.3390/rs12081258, 2020.
Mallakpour, I. and Villarini, G.: The changing nature of flooding across the central United States, Nat. Clim. Change 5, 250–254, https://doi.org/10.1038/nclimate2516, 2015.
Ralph, F. M., Neiman, P. J., Wick, G. A., Gutman, S. I., Dettinger, M. D., Cayan, D. R., and White, A. B.: Flooding on California's Russian River: role of atmospheric rivers, Geophys. Res. Lett., 33, L13801, https://doi.org/10.1029/2006GL026689, 2006.
Petrucci, O., Papagiannaki, K., Aceto, L., Boissier, L., Kotroni, V., Grimalt, M., Llasat, M. C., Llasat-Botija, M., Rossello, J., Pasqua, A. A., and Vinet, F.: MEFF: The database of MEditerranean Flood Fatalities (1980 to 2015), J. Flood Risk Manage., 12, e12461, https://doi.org/10.1111/jfr3.12461, 2019.
Schroeder, A., Gourley, J., Hardy, J., Henderson, J., Parhi, P., Rahmani, V., Reed, K., Schumacher, R., Smith, B., and Taraldsen, M.: The development of a flash flood severity index, J. Hydrol., 541, 523–532, https://doi.org/10.1016/j.jhydrol.2016.04.005, 2016.
Shen, X., Mei, Y., and Anagnostou, E. N.: A comprehensive database of flood events in the contiguous United States from 2002 to 2013, B. Am. Meteorol. Soc., 98, 1493–1502, https://doi.org/10.1175/BAMS-D-16-0125.1, 2017.
Shen, X., Anagnostou, E. N., Allen, G. H., Brakenridge, R., and Kettner, A. J.: Near-real-time non-obstructed flood inundation mapping using synthetic aperture radar, Remote Sens. Environ., 221, 302–315, https://doi.org/10.1016/j.rse.2018.11.008, 2019.
Shi, P. J.: Atlas of natural disaster system of China, Science Press, Beijing, 2003.
Smith, A. E. R., Bates, P. D., and Hayes, C.: Evaluation of a coastal flood inundation model using hard and soft data, Environ. Model. Softw., 30, 35–46, https://doi.org/10.1016/j.envsoft.2011.11.008, 2012.
Smith, J. A., Villarini, G., and Baeck, M. L.: Mixture Distributions and the Hydroclimatology of Extreme Rainfall and Flooding in the Eastern United States, J. Hydrometeorol., 12, 294–309, https://doi.org/10.1175/2010JHM1242.1, 2011.
Storm Events Database: https://www.ncdc.noaa.gov/stormevents/, last access: 30 October 2020.
Swiss Re: sigma – Natural catastrophes and man-made disasters in 2009, Swiss Reinsurance Company Ltd, Zurich, Switzerland, 2010.
Tabari, H.: Climate change impact on flood and extreme precipitation increases with water availability, Sci. Rep., 10, 13768, https://doi.org/10.1038/s41598-020-70816-2, 2020.
Villarini, G.: On the seasonality of flooding across the continental United States, Adv. Water Resour., 87, 80–91, https://doi.org/10.1016/j.adv.watres.2015.11.009, 2016.
Villarini, G., Goska, R., Smith, J. A., and Vecchi, G. A.: North Atlantic Tropical Cyclones and U.S. Flooding, B. Am. Meteorol. Soc., 95, 1381–1388, https://doi.org/10.1175/BAMS-D-13-00060.1, 2014.
Wan, Z., Hong, Y., Khan, S., Gourley, J., Flamig, Z., Kirschbaum, D., and Tang, G.: A cloud-based global flood disaster community cyber-infrastructure: Development and demonstration, Environ. Model. Softw., 58, 86–94, https://doi.org/10.1016/j.envsoft.2014.04.007, 2014.
Yamazaki, D., Ikeshima, D., Sosa, J., Bates, P. D., Allen, G. H., and Pavelsky, T. M.: MERIT Hydro: A high-resolution global hydrography map based on latest topography dataset, Water Resour. Res., 55, 5053–5073, https://doi.org/10.1029/2019WR024873, 2019.