the Creative Commons Attribution 4.0 License.
the Creative Commons Attribution 4.0 License.
 | 26 Jul 2021
Global Covenant of Mayors, a dataset of greenhouse gas emissions for 6200 cities in Europe and the Southern Mediterranean countries
Albana Kona
Fabio Monforti-Ferrario
Paolo Bertoldi
Marta Giulia Baldi
Georgia Kakoulaki
Nadja Vetters
Christian Thiel
Giulia Melica
Eleonora Lo Vullo
Alessandra Sgobbi
Christofer Ahlgren
Brieuc Posnic
The Paris Agreement has underlined the role of cities in combating climate change. The Global Covenant of Mayors for Climate & Energy (GCoM) is the largest international initiative dedicated to promoting climate action at a city level, covering globally over 10 000 cities and almost half the population of the European Union (EU) by end of March 2020. The fifth Intergovernmental Panel on Climate Change (IPCC) report notes that there is a lack of comprehensive, consistent datasets of cities' greenhouse gas (GHG) emission inventories. In order to partly address this gap, we present a harmonised, complete and verified dataset of GHG inventories for 6200 cities in European and Southern Mediterranean countries, signatories of the GCoM initiative. To complement the reported emission data, a set of ancillary data that have a direct or indirect potential impact on cities' climate action plans were collected from other datasets, supporting further research on local climate action and monitoring the EU 27 (the 27 member states of the EU) progress on Sustainable Development Goal (SDG) 13 on climate action. The dataset (Kona et al., 2020) is archived and publicly available with the DOI https://doi.org/10.2905/57A615EB-CFBC-435A-A8C5-553BD40F76C9.
- Article
(1432 KB) - Full-text XML
-
Supplement
(10452 KB) - BibTeX
- EndNote


Cities consume over two-thirds of the world's energy and generate about 70 % of global greenhouse gas (GHG) emissions (IPCC, 2014) while being at the same time particularly vulnerable to the impacts of climate change (Reckien et al., 2018). An increasing number of cities have voluntarily adhered to transnational networks active in climate action (Busch et al., 2018; Heidrich et al., 2016; van der Ven et al., 2017). As these networks and initiatives have evolved, cities' ambitions and climate targets have increased to match or even go beyond the ambition of countries (Bertoldi et al., 2018c).
However, the scientific community notes the current lack of systemic knowledge of cities' quantified contribution to combating climate change (Acuto et al., 2018; IPCC, 2015). This knowledge gap originates from many issues, including dissimilarities in the methodologies used for developing local emission accounting and reference scenarios and for setting ambition targets, as well as the absence of a global, open and harmonised dataset of cities' emission inventories (Kona et al., 2018). Only as recently as 2019 were the first datasets published in the academic literature, aiming to fill regional gaps (Adami et al., 2020; Kilkis, 2019; Palermo et al., 2020b).
Table 1Datasets and their attributes.
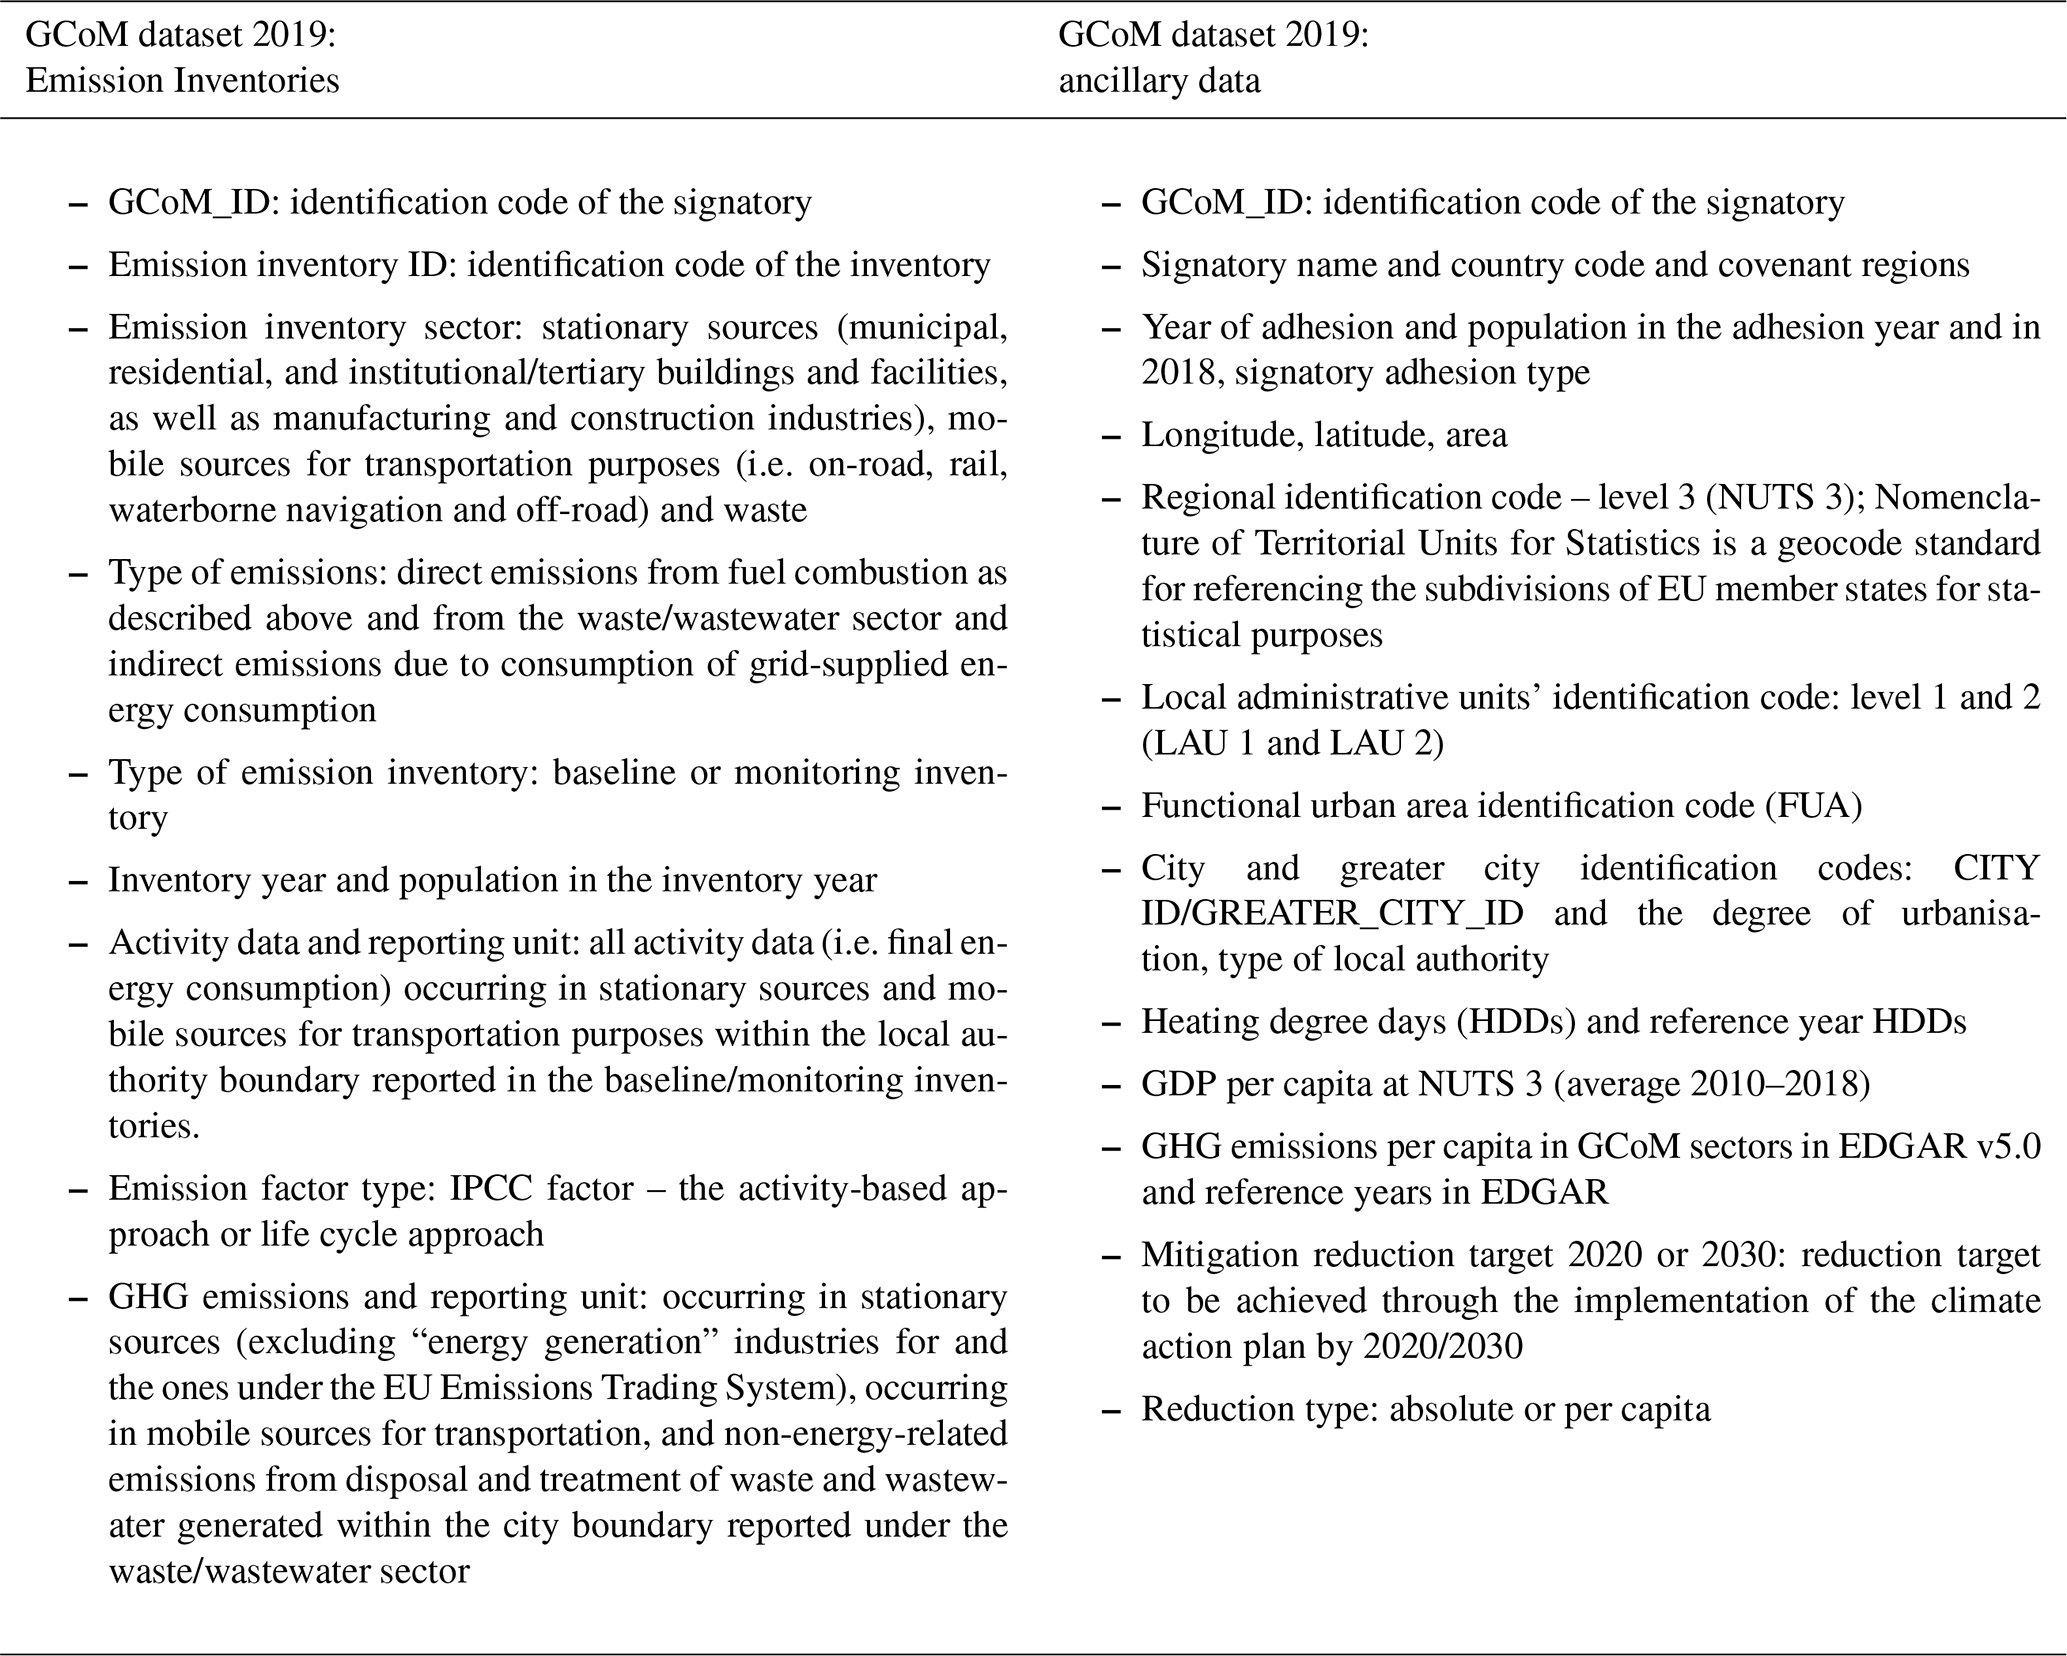
GCoM dataset 2019: Emission Inventories contains self-reported data in the MyCovenant platform of the GCoM reporting framework. Table 2 of the online dataset reports these emission-related data, while Table 1 reports their metadata description. GCoM dataset 2019: ancillary data comprises geographical attributes, socio-economic aspects and demographic characteristics at a city level derived from Eurostat (i.e. the statistical office of the European Union) and from EDGAR v5.0 (i.e. Emissions Database for Global Atmospheric Research). Table 3 of the online dataset reports these ancillary data, while Table 1 reports their metadata description.
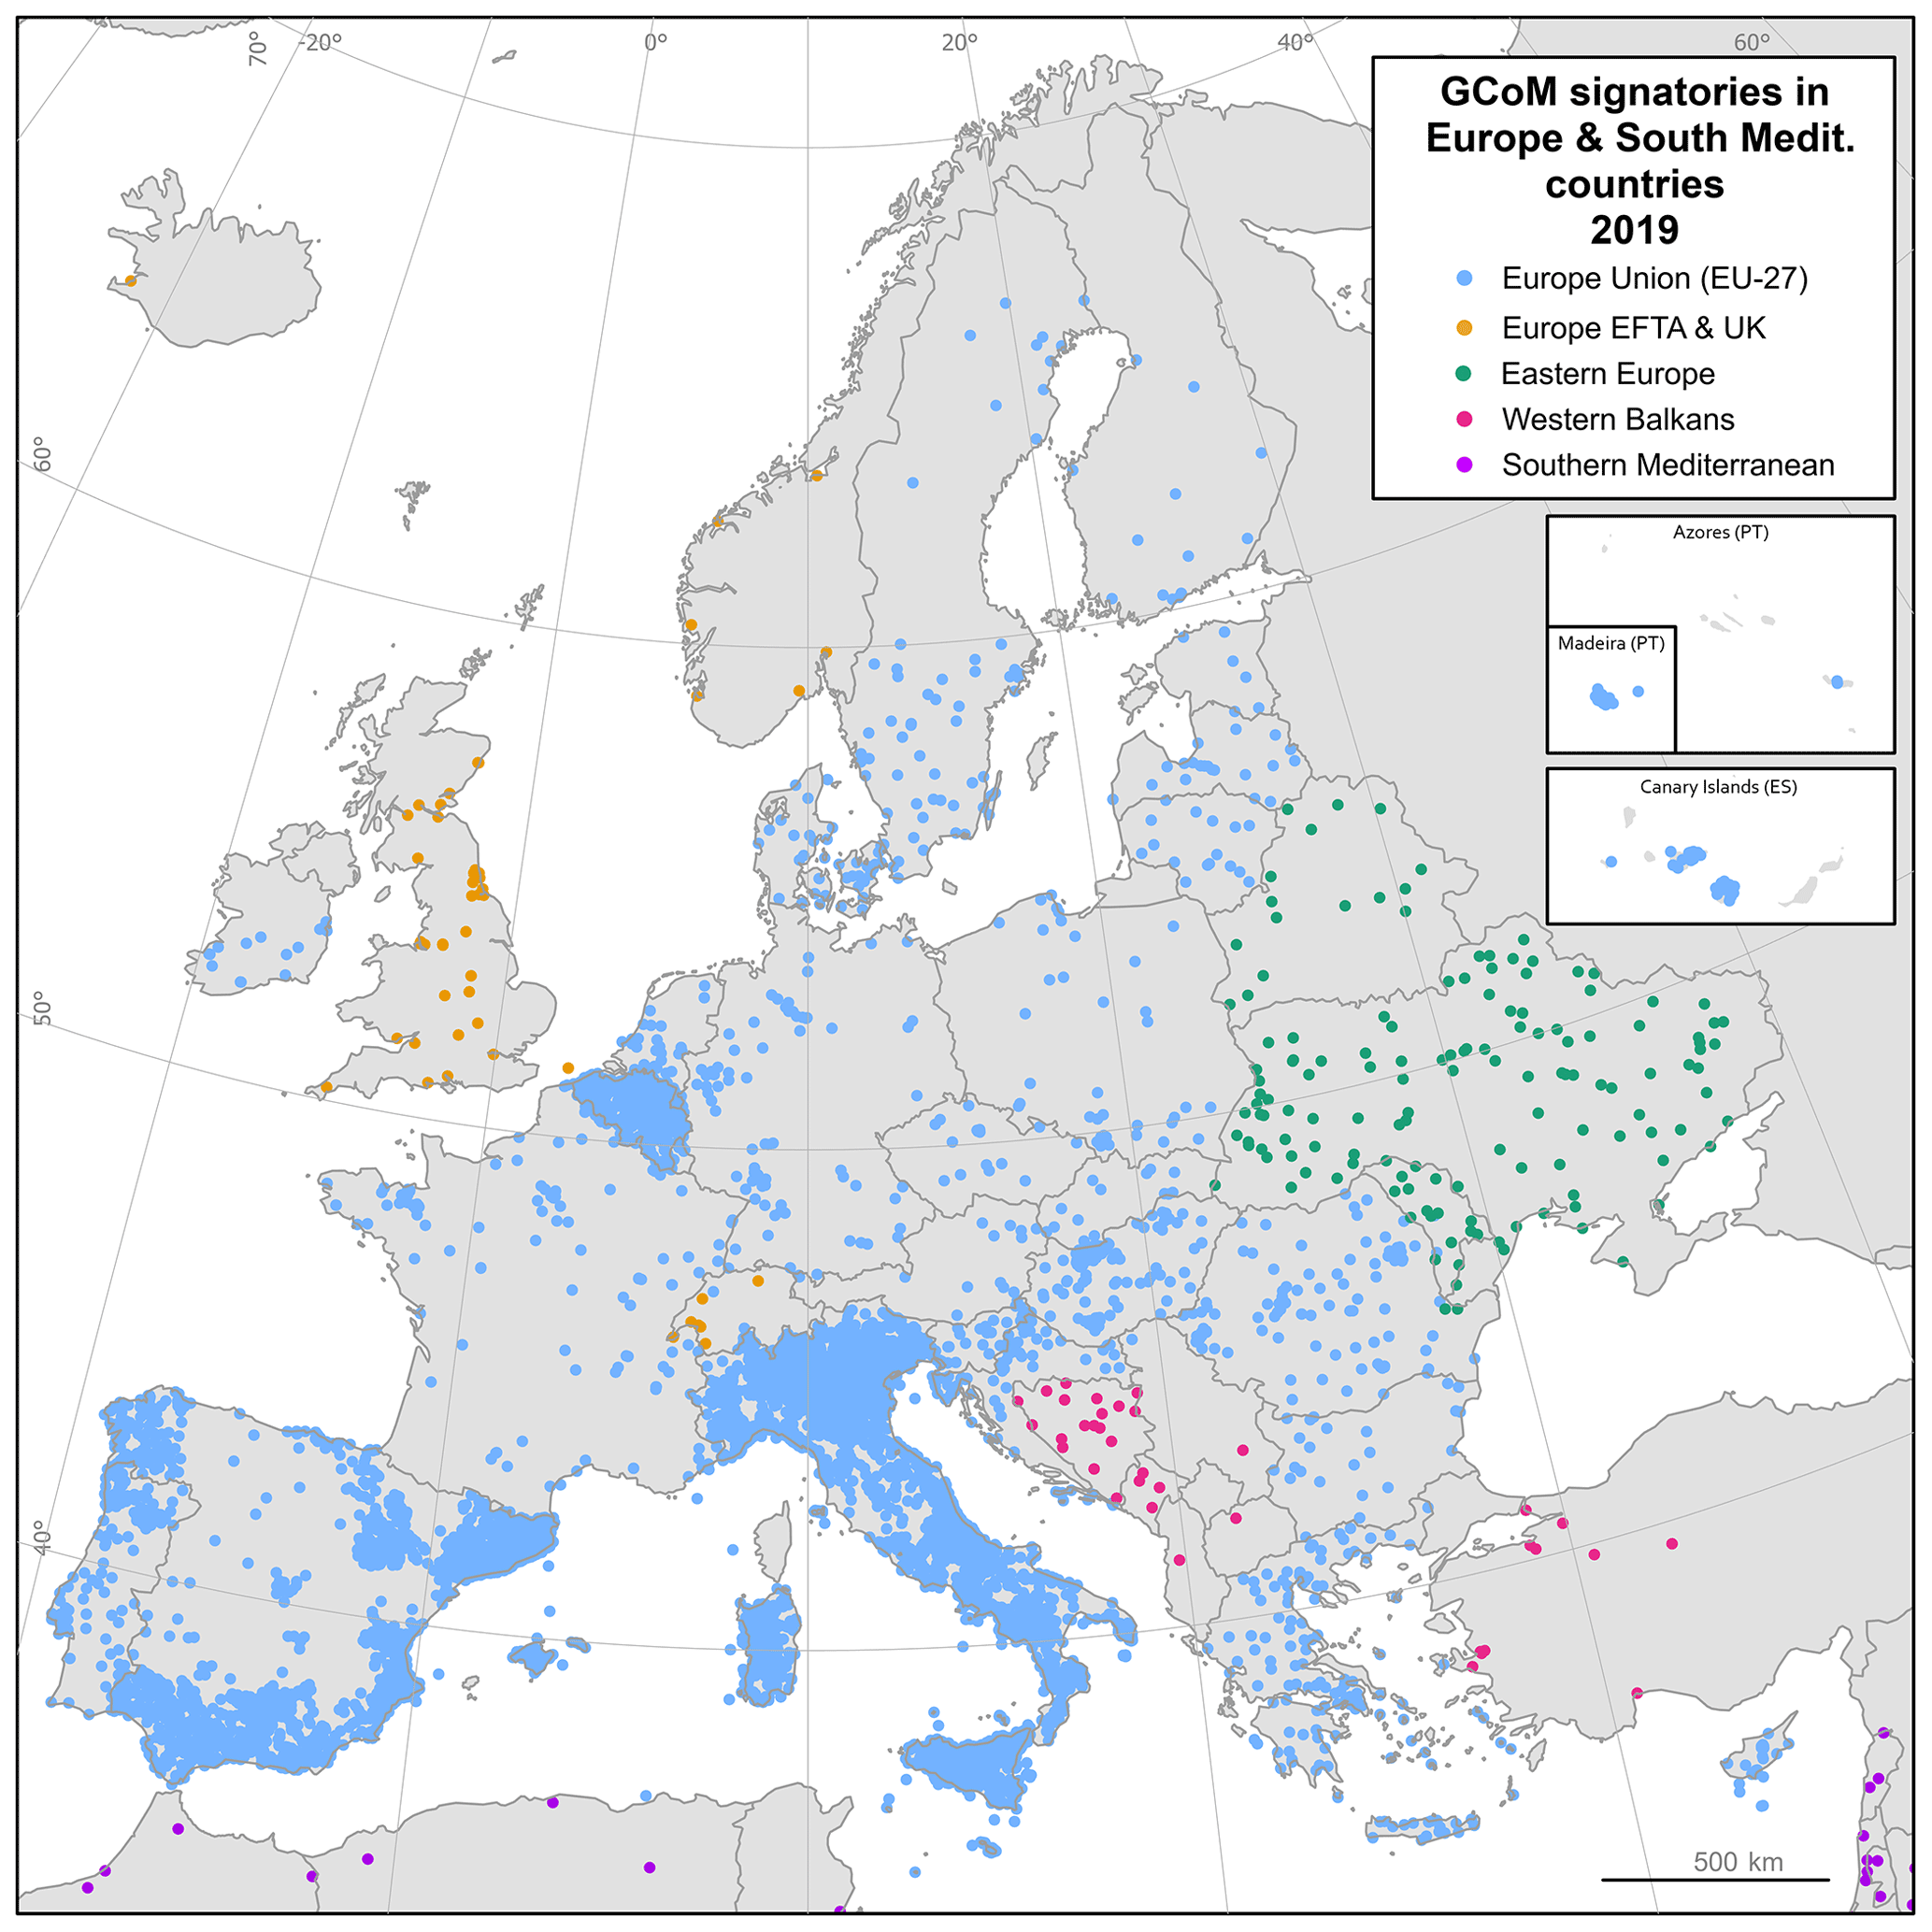
Figure 1Global Covenant of Mayors signatories in Europe and Southern Mediterranean countries as of 2019. The map “GCoM signatories in Europe and South Mediterranean countries as of 2019” reports the location of the local authorities reporting to the MyCovenant platform of the GCoM common reporting framework. Table 3 of the online dataset reports these signatories (8136) and their ancillary data, while Table 1 reports their metadata description. This dataset covers the following countries, grouped into the covenant regions. European Union: EU 27; European Free Trade Association (EFTA) and the UK: Iceland, Norway, Switzerland and the UK; Western Balkans: Albania, Bosnia and Herzegovina, Montenegro, North Macedonia, Serbia, and Turkey; Eastern Europe: Armenia, Azerbaijan, Belarus, Georgia, Kazakhstan, Moldova, Tajikistan and Ukraine; Southern Mediterranean countries: Algeria, Lebanon, Jordan, Morocco, State of Palestine, Israel and Tunisia.
The dataset presented in this paper aims to fill these gaps in Europe and Southern Mediterranean countries (Table 1). It consists of a harmonised, comprehensive and verified dataset of GHG emissions based on data produced by 6200 cities in the 27 member states of the EU (EU 27), the European Free Trade Association (EFTA) countries and the UK, the Western Balkans, and the EU Eastern Europe and Southern neighbourhoods (Fig. 1).
The dataset is extremely valuable for communities engaged in climate action, including policymakers at all levels pursuing informed decisions, as demonstrated by the several and diverse studies based on Global Covenant of Mayors for Climate & Energy (GCoM) data that have appeared in the literature in recent years. To illustrate, Palermo et al. (2020a) discussed the mitigation policies at the local level and Pablo-Romero et al. (2018) analysed the so-called Benchmarks of Excellence actions, while Croci et al. (2016) analysed the major cities present at that time in the database and Famoso et al. (2015) focused their study on the participation of signatories from Sicily.
Thanks to the improved accessibility of the dataset and the addition of a number of useful ancillary variables, we expect the number of studies to grow in the near future. In order to further support the scientific community, along with the dataset, we provide the method of producing the data, the corresponding metadata and the technical validation performed.
The European Commission launched the Covenant of Mayors (CoM) in 2008 to endorse and support the effort of EU local authorities in mitigating climate change. In 2015, the covenant expanded to include climate adaptation. In 2011, the initiative was launched in the EU's Eastern and Southern neighbourhoods, and in 2016 the initiative became global, through the launch of the GCoM. The initiative registered a very rapid growth from 241 signatories in 2008 in the EU 27 to more than 10 000 signatories covering more than 869 million inhabitants worldwide in March 2020.
The Joint Research Centre (JRC), the science and knowledge service of the European Commission, provides scientific and technical support to GCoM cities in the development and implementation of their climate action plans. The scientific support is given through guidance on methodologies for emission accounting and climate adaptation, as well as through the development of urban policy tools for climate action (Bertoldi et al., 2018a, b; Kovac et al., 2020; Monforti-Ferrario et al., 2018; Peduzzi et al., 2020). The technical support consists of checking and validating the data reported by cities on the MyCovenant platform (https://www.covenantofmayors.eu, last access: January 2021).
The published dataset (Kona et al., 2020) contains verified reported GHG emissions for 6200 European and South Mediterranean cities for a set of reference years. Given the voluntary nature of the GCoM and the difficulty of local authorities reporting using a harmonised framework, a statistical method for checking the reliability, cleaning and validating of the reported data was developed and applied. The method allows building a coherent dataset and consists of four steps:
-
reporting principles, data extraction and clustering of signatories into two groups (large/small areas) based on population size and degree of urbanisation (threshold 50 000 inhabitants) (see Sect. 2.1);
-
outlier identification and treatment in large urban areas – coherence and completeness checks on the data reported in the platform with the official Sustainable Energy and Climate Action Plan (SECAP) document (see Sect. 2.2);
-
outlier identification and treatment in small and medium towns – statistical method applied for the identification and correction of outliers in small urban areas in small–medium towns (see Sect. 2.3);
-
ancillary data – signatories from the EU matched with their respective administrative units in the EU official statistics for cities; harmonised statistical information on signatories allows building a referenced structure for collecting, processing, storing, analysing and aggregating data to support the monitoring of the EU progress on the Sustainable Development Goal (SDG) 13 on climate action (Eurostat, 2020) (see Sect. 2.4).
The dataset (Table 1 in online dataset) thus contains adjusted self-reported data from cities (i.e. GCoM dataset 2019: Emission Inventories) coupled with ancillary data (GCoM dataset 2019: ancillary data) related to geographic attributes (area, latitude and longitude, local administrative codes, heating degree days), socio-economic aspects (GDP per capita) and demographic characteristics at the city level (degree of urbanisation, population time series). A detailed technical evaluation at the city level was also performed against the independent estimates provided by the Emissions Database for Global Atmospheric Research (EDGAR) v5.0 (which provides time series of global anthropogenic emissions of greenhouse gases and air pollutants by country on a spatial grid; Crippa et al., 2020).
In compliance with the EU data policy, we are now in a position to share with the community a 10-year dataset validated and harmonised with the EU statistical information system of local authorities. The validation process assesses the completeness of the data (i.e. to a minimum reporting requirement) and the coherence of the data (i.e. data reported in the platform are coherent with the climate action plan document) and includes a data-cleaning step (i.e. detection of outliers and their treatment). In spite of the overall good quality of the dataset, some limitations and uncertainties remain and are described under the “Limitations and future work” section.
The resulting dataset is of great value and interest and targets the needs expressed clearly by the scientific and academic community and governmental institutions. This is demonstrated through several data release requests that have been received from different groups. These include the IPCC working group on climate mitigation, the United Nations Framework Convention on Climate Change Non-state Actor Zone for Climate Action (UNFCCC NAZCA), governmental and research institutions of EU 27 member states interested in the local contribution to the national reduction targets, and other subnational levels interested in understanding the active territorial participation in the climate action movement.
A distinctive characteristic of the European GCoM initiative is that it includes in its members small towns interested and engaged in climate action, often absent from other initiatives. Therefore, this dataset offers cities of all sizes the means to formulate a comparative analysis of the magnitude, efficiency and intensity of energy use and GHG emissions. Users are advised to read in detail the description of the dataset provided in this paper and to be aware of the overall scope of the GCoM initiative when designing their investigations. In particular, they should be aware that the initiative was never meant to be a method to create exhaustive inventories of all emission sources in the territory or to deal with emissions already included in national-scale control initiatives, such as the EU Emissions Trading System (ETS) mechanisms. GHG emissions mainly reported are CO2 emissions and in rare cases CH4 or N2O emissions. Further to the information presented in this paper, a more comprehensive amount of information and the corresponding guidelines are available through the CoM website http://www.covenantofmayors.eu (last access: January 2021).
Here we describe the methods used to produce and consolidate the final dataset. Due to local authorities' difficulties in harnessing and reporting data within a harmonised framework, which may differ from that of the national emission reporting, not all the self-reported data could be considered reliable. Therefore, a method was developed to construct a robust dataset of emission inventories, organised into four steps:
-
Step 1 – data reporting principles, extraction and clustering. Accounting principles of GHG reporting framework, data extraction and clustering of signatories are classified into two groups (large/small areas) based on the degree of urbanisation and/or population size (threshold 50 000 inhabitants).
-
Step 2 – detection of outliers from large urban areas. Digital curation of data reported in the platform is performed in terms of completeness and coherence with the official climate action plan document, the so-called SECAP, in large urban areas.
-
Step 3 – detection of outliers from small–medium towns. A statistical method is used for the identification and detection of outliers in the GHG emission dataset in small–medium towns.
-
Step 4 – matching emission data with ancillary data. Signatories from the EU are matched with their respective local administrative units of the Geographic Information System of the Commission (GISCO).
2.1 Data principles, extraction and clustering
To streamline measurement and reporting procedures under the GCoM, the Common Reporting Framework (GCoM CRF) was developed during 2018 in consultation with partners and signatories.
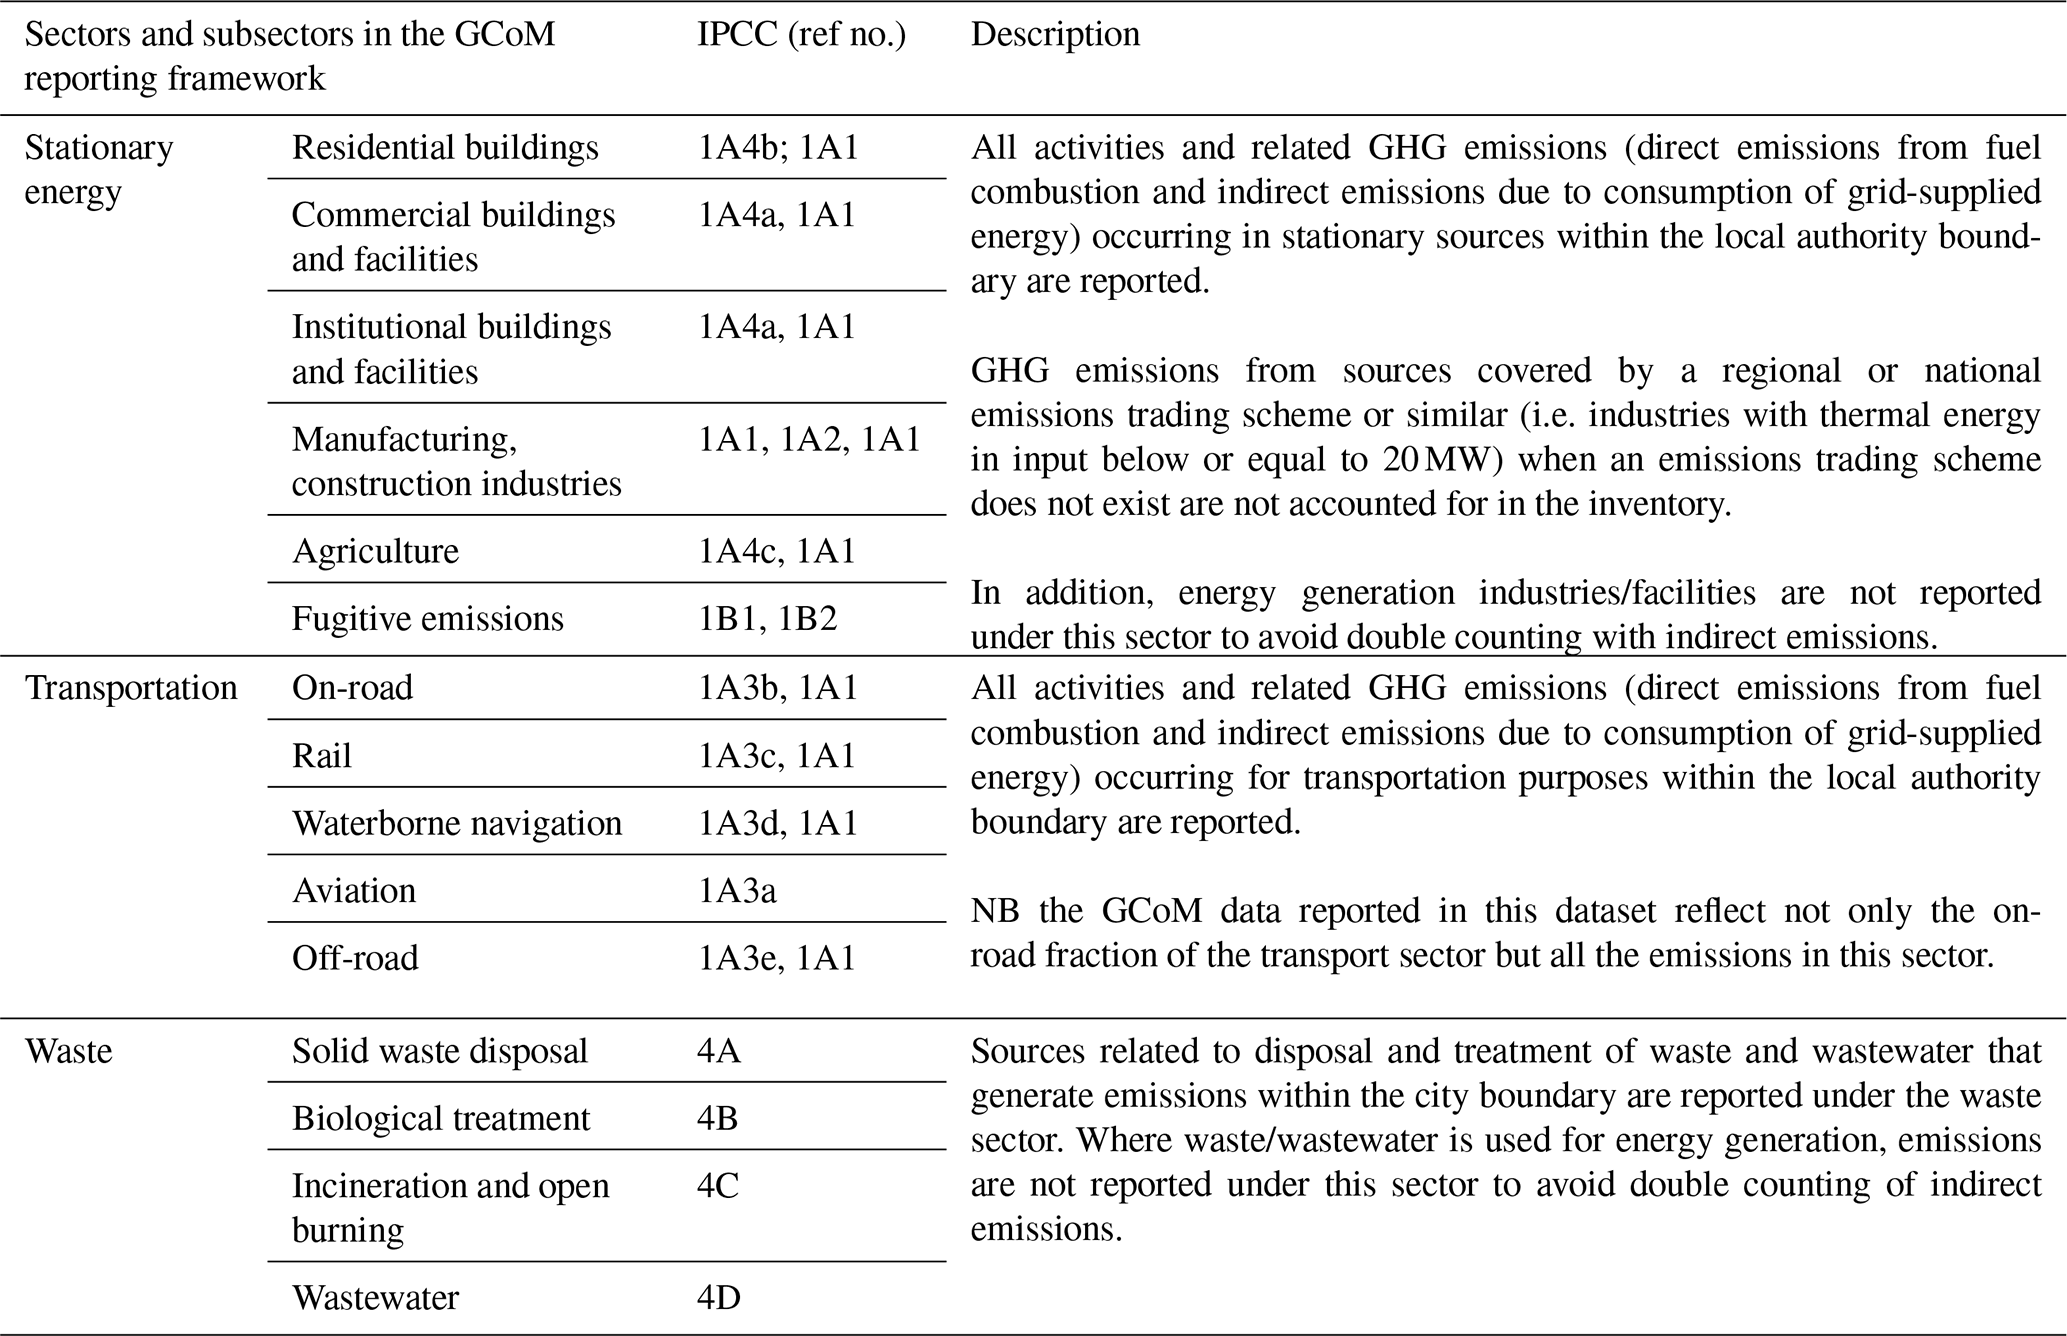
Table 2Mapping of emission source categories in the GCoM reporting framework based on the IPCC 2006 guidance.
While the platforms differ in terms of the data collection approach, they are aligned with the GCoM CRF. The dataset provided in the current study is based on the information reported by signatories through the MyCovenant platform, one of the officially recognised reporting platforms of the initiative and the one used by majority of the signatories. In the following, we report a brief description of the data collected on MyCovenant in alignment with the GCoM CRF.
The reporting framework is built upon the Emission Inventory Guidance, used by the European Covenant of Mayors, and the Global Protocol for Community-Scale Greenhouse Gas Emission Inventories (GPC), used by the Compact of Mayors. Both refer to the 2006 Intergovernmental Panel on Climate Change (IPCC) Guidelines for National Greenhouse Gas Inventories. The protocols for accounting the cities' emissions differ mainly in the principles and minimum reporting requirements on sources, the types of gas and the boundary of the inventory to be reported.
The protocol for accounting the emissions is closely aligned with the IPCC 2006 guidelines regarding the source category of the in-boundary emissions (i.e. the administrative boundaries). It includes “sources” and “activities” rather than the scope framework used in other city protocols (for example the GHG protocol of the World Resources Initiative (WRI)). Nevertheless, the emission inventory is not meant to be an exhaustive inventory of all emission sources in the territory. It focuses mainly on GHG emissions related to sectors (stationary energy, transport and waste/wastewater) where the local authority could intervene through sectoral measures and urban policies. Signatories can report GHG emissions from the industrial processes and product use (IPPU) and agriculture, forestry and other land use (AFOLU) sectors as well where these are significant (Table 2).
Moreover, one of the main differences in GHG emission reporting between non-state (e.g. cites) and state actors is the level of flexibility in choosing the inventory year with the most reliable data. The recommended baseline year for reporting is 1990 or the closest subsequent year for which the most comprehensive and reliable data can be provided (for example 2005).
The geographical boundaries of the “local territory” are the administrative boundaries of the entity (municipality, region) governed by the local authority which is a signatory to the GCoM. Regarding the types of gas, GCoM signatories should report emissions of carbon dioxide (CO2), methane (CH4) and nitrous oxide (N2O) converted into CO2 equivalents (CO2eq), according to their global warming potential (local governments should also disclose which GWP factors they are using). The three main GHG emission categories included in the inventories are
-
direct emissions due to final energy consumption, excluding those from industrial plants involved in the ETS;
-
indirect emissions related to grid-supplied energy (electricity, heat or cold) consumed in the local territory (Kona et al., 2019);
-
non-energy-related direct emissions (such as from waste, wastewater) that occur in the local territory if the climate action plan contains measures to reduce such GHG emissions.
The GHG emissions are automatically derived in the platform as the product of activity data (detailing the energy consumption/waste per carrier/type) and emission factors, as reported by the signatories (Table 2). The emission factors are coefficients, which quantify the emissions per unit of activity, and one of three approaches can be used:
-
IPCC (2006) – emission factors for fuel combustion with default values mostly based on the carbon content of each fuel;
-
national or subnational emission factors for fuel combustion when these are different from the IPCC's;
-
life cycle assessment (LCA) – emission factors for the overall life cycle of each energy carrier, i.e. including not only the GHG emissions due to fuel combustion but also emissions of the entire energy supply chain – exploitation, transport and processing.
The procedure to verify and improve the coherence of the dataset starts with the extraction of complete emission inventories stored in a relational SQL database. At the closing date of this study (September 2019), 6239 climate action plans with complete inventories had been submitted by cities in the EU 27, EFTA countries and the UK, the Western Balkans, and the EU Eastern and Southern neighbourhoods.
Inventories and other data are self-reported to the online platform and must accurately reflect the content of the official climate action plan (called the Sustainable Energy and Climate Action Plan (SECAP) document. The SECAP document is a separate file, usually in PDF format and publicly available, that represents the official action plan endorsed and signed by the local council.

Figure 2GHG emissions per capita of signatories in the GCoM dataset 2019, showing the frequency distribution of GHG emissions per capita from the emission inventories dataset, with observations that range from 0 to 80 t CO2eq per capita, with a mean of 5.18 t CO2eq per capita. This comprehends the emissions from all the GCoM sectors (stationary energy, transportation and waste), excluding manufacturing and construction industries. On the vertical axis the density values are reported, i.e. the share of signatories with the same range of GHG emissions per capita, by the width of the range (0.01 in this case).
The first step consists in understanding if data are correctly reported and assessing their quality. Yearly GHG emissions per capita are plotted for each signatory (Fig. 2). The occurrence of outliers (e.g. large numbers of per capita values) is a clear indication of errors in the data; therefore not all the data collected in the platform are consistent with the SECAP document. As the calculations of performance indicators for the dataset, such as the mean and standard deviation, can be distorted by a single grossly inaccurate data point, checking and treating outliers is a routine part of data analysis.
Due to the high volume of information, it is not feasible to check individually the consistency of all the data objects with the SECAP document. The collection of the attributes (i.e. the variables – 15 energy carriers and 16 subsectors) describes the data objects (which are also known as records, points, cases, samples, entities or instances), which visually correspond to the rows in the Excel files.
The original dataset comprises 6239 signatories with a baseline inventory, out of which 1845 have an additional monitoring inventory. In each inventory the cities report at most data for 15 energy carriers grouped into 16 subsectors, resulting therefore in 1.94 million data objects. The 16 subsectors have been grouped into 6 sectors (i.e. municipal, residential, tertiary, manufacturing and construction industries, transportation, and waste sector; see Table 2), and null objects were deleted, leading in total to 61 207 data objects.
We therefore adopted a rule to treat the outliers based on the benefits expected when scrutinising the dataset for the overall assessment of the initiative. Data users willing to produce performance indicators on the impact and the contribution of climate actions planned and implemented by CoM signatories must benefit from a robust dataset in order to avoid artefacts and unreliable results. In this context, it is evident that the bigger a city is, the more impact any errors will have on the overall dataset. In order to have an accurate representation, it is then of utmost importance that large cities have highly accurate data.
Hence, we decided to adopt a customised method to treat outliers based on the signatories' degree of urbanisation and population size (source https://ec.europa.eu/eurostat/web/nuts/local-administrative-units, last access: January 2021). The 6239 signatories and their data were clustered into two groups:
-
Large urban areas. These are densely populated areas with a population density of at least 1500 inhabitants km−2 and a minimum population of 50 000. For this group manual curation of imputed errors in inventories was implemented, which significantly increased the performance indicators of the database by increasing their robustness (described in Step 2).
-
Small towns and rural areas. These are intermediate and thinly populated areas. For this group an automatic routine to identify and remove the outliers is applied. The rules governing the automatic detection and treatments of the outliers are detailed in Step 3.
2.2 Data cleaning – large urban areas
In this section, we describe the steps followed to detect and treat the outliers in inventories from large urban areas (i.e. cities and greater cities, with a population density of at least 1500 inhabitants km−2 and a minimum population of 50 000) along with correctness and completeness checks in the overall dataset. The identification and treatment of outliers in this group of cities has been performed qualitatively.
Because of the harmonisation process of GCoM administrative data and local administrative units of the Eurostat database 2018 (Eurostat, 2018), 430 signatories covering 116.2 million inhabitants are classified as cities and greater cities. In addition, in the other regions outside of the EU 27 (i.e. Eastern Europe, Western Balkans and Southern Mediterranean) where the classification was not available, we adopted as a criterion only the population size threshold (i.e. a minimum population of 50 000). Hence, within the GCoM dataset 2019 there are 701 baseline inventories presented by large urban areas, covering a total population of 165.26 million inhabitants.
As part of the evaluation process carried out by the JRC on individual SECAPs, activity data were compared against the national/EU averages (available at national/EU statistical systems such as Eurostat and the European Environment Agency). In the case of reported data that ranged 1 or more units higher than the average of the sector's national average, we double-checked the accuracy of the platform's reported data with the SECAP document. As a result of the digital curation of outliers, identified through the comparison of self-reported data on the MyCovenant platform against the same data declared in the SECAP, 20 inventories (i.e. about 3 %) have been manually corrected. The SECAP document represents the official action plan endorsed and signed by the local council; therefore, we assume as valid the data reported in the SECAP. The errors were often due to the misinterpretation of the unit measure to be reported in the online template (e.g. kWh yr−1 instead of MWh yr−1).
At this point in the procedure, with the help of the statistical routine and the digital curation, we have consolidated the dataset related to activity data. The next step consists of comparing the emission factors used in GCoM inventories against the reference values from IPCC AR4 (IPCC, 2007) and the JRC databases (Lo Vullo et al., 2020) and their completeness (i.e. missing data on emissions were derived from reported activity data and vice versa). In the case of reported emission factors that ranged beyond ± 50 % of the reference value, we corrected them with the corresponding reference value. As a result of this procedure, there were 153 inventories from large urban areas, where 9.7 % (i.e. 526 out of 5433 objects) of the data objects were corrected.
2.3 Data cleaning – small and medium towns
In this section we describe the automatic routine implemented to detect and treat the outliers in inventories from small–medium towns (number of inventories is 5538 covering a total population of 46.78 million inhabitants).
Urban GHG emissions per capita may deviate significantly from national averages, due to the tendency of emissions to concentrate around human activities. Therefore, setting exclusion ranges of outliers in the per capita GHG emissions based on the national averages may lead to the exclusion of a high number of valid emission inventories from the GCoM dataset. To avoid this bias, we apply a statistical method based on intrinsic properties of the distribution of the emissions in the GCoM database. This allows identifying more accurately potentially unreliable emission inventories and the outliers likely to be the results of incorrect data entry.
The procedure starts with dividing the data into two groups based on the normalisation process: the activity data in the residential/municipal/institutional/tertiary buildings and transport sector were normalised with the population size, whereas the activity data in manufacturing and construction industries were normalised with the GDP values. The majority of these industries are already governed by the cap and trade system (ETS); therefore they are not recommended to be reported in the GCoM platform, although exceptions exist. In addition, signatories that report manufacturing emissions are generally large urban areas (80 % of the activity data within this sector are reported by cities and greater cities), which we have already examined individually to check for outlying data.
The outlier identification method is based on a generalised extreme studentised deviate (ESD) procedure for the detection of abnormal energy consumption. The ESD is commonly used in the literature (Cerquitelli et al., 2019; Forster, 2013; Rosner, 1983; Seem, 2007) because of its excellent performance under a variety of conditions in detecting one or more outliers in a dataset that follows an approximately normal distribution. The per capita activity data in the residential/municipal/institutional/tertiary buildings and transport sector follow approximately a normal distribution.
Table 3Statistical parameters of the GHG emissions in the 2019 GCoM datasets.

The procedure iteratively identifies the extreme values in the dataset and then selects to remove those observations which are higher than the extreme values with a confidence level of 95 %. A detailed description of the routine is available in files 1 and 2 in the Supplement.
Applying this approach, 39 inventories were removed from the initial dataset (i.e. from the initial 5538 inventories). These signatories received further feedback in addition to the routine checks already performed at the time of data submission and have been approached to check and correct the data on the online platform. The clean and robust dataset thus contains 5499 inventories. As a result, the original inventory containing 6239 entries was reduced to a clean dataset of 6200 signatories (i.e. 99 % of the original data), referred to in this paper as GCoM dataset 2019: Emission Inventories.
To conclude, a non-parametric statistical procedure, i.e. the median absolute deviation (MAD), has also been applied to identify outliers in the dataset that do not follow a normal distribution. This method is more robust than the ESD but less efficient, and its validity increases as data approach a normal distribution. Similarly to the ESD, the choice of the critical value is motivated by the reasoning that if observations other than outliers have an approximately normal distribution, the method picks up as an outlier any observations more than about 3 standard deviations from the means. The results of the MAD procedure produce the same outliers as the ESD procedure; therefore, we argue that the assumption of the quasi-normal distribution is correct.
The next step consists of verifying the emission factors used in the inventories against the reference values from IPCC 2006 and the JRC databases (Lo Vullo et al., 2020) and checking their completeness (i.e. missing data on emissions were derived from reported activity data and vice versa). In the case of reported emission factors that ranged beyond ± 50 % of the reference value, we corrected them with the corresponding reference value. Because of this procedure, there were 3019 inventories from small towns, where 15 % (i.e. records) of the data records were corrected. Table 3 compares the main descriptive parameters of the two datasets. The main difference can be noted in the skewness parameter. Both frequency distributions have a positive skewness, meaning that the right tail is longer and the mass of the distribution is concentrated on the left of the curve.
2.4 Matching emission data with ancillary data
GCoM signatories, when submitting their data to the MyCovenant platform, report the local authority name, the country and their centroids' coordinates. Through these three attributes, we have been able to digitally match the signatories with their corresponding local administrative units in the Geographic Information System of the Commission (GISCO) (Eurostat, 2018). Harmonised statistical information on signatories allows building a referenced structure for collecting, processing, storing, analysing and aggregating data.
In this way, we can derive all ancillary data related to institutional, demographic and socio-economic dimensions:
-
Institutional dimension. The GCoM signatories are associated with their corresponding NUTS codes, their local administrative units' codes, their functional urban area and cities codes, their geographical coordinates, and the area and shape files of their local administrative units.
-
Demographic dimension. The GCoM signatories are associated with the population data in 2018 and the degree of urbanisation.
-
Socio-economic and climate dimension. The GCoM signatories are associated with the GDP at the NUTS 3 level and heating degree days at the NUTS 3 level.
Table 4Mapping of emission source categories with IPCC categories.
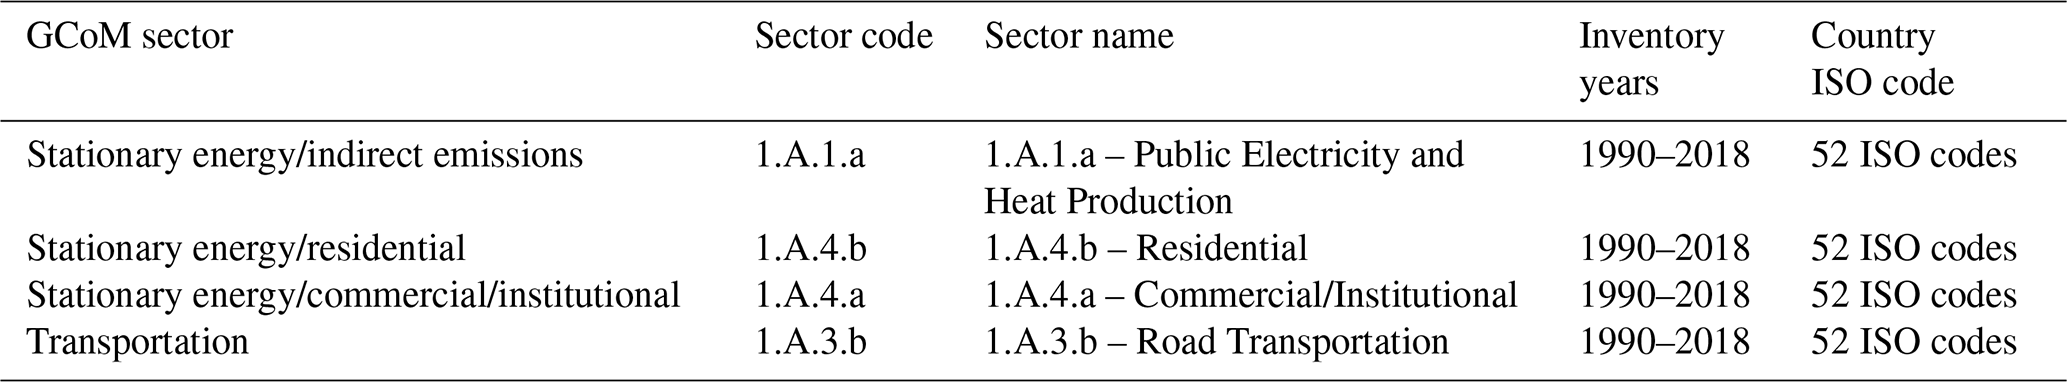
The aim of the ancillary data is also to support the monitoring of the SDG 13 on climate action in an EU 27 context, which focuses on climate mitigation, climate impacts and initiatives that provide support to climate action such as the GCoM. More broadly, the ancillary data could support further research on investigating drivers of climate action at a city level and the development of urban policy design. In addition, we extracted the national values of GHG emissions per capita from EDGAR v5.0 for the corresponding GCoM activity sectors (Table 4).
In the case of the GCoM, the uncertainty in reported emissions is particularly difficult to estimate since non-formal uncertainty analysis is applied by cities to the activity data and the emission factors. Hence, given this limitation, we argue that the best practical way to assess the uncertainty in reported data is to perform a detailed benchmark of the overall dataset against international emission datasets such as EDGAR v5.0. A similar approach has been applied to validate cities' emission data in the United States (Nangini et al., 2019).
Although such a procedure does not necessarily imply an absolute validation of our data, it could clarify to what extent the dataset is comparable with an internationally reputed source such as EDGAR v5.0. It is also worth noticing that the two benchmarked datasets are different on principle, as the GCoM collects data from local authorities with a supposedly good knowledge of their territory, while the methods used in EDGAR v5.0 (Crippa et al., 2020) downscale the emissions from a national or subnational scale to finer scales using spatial proxies and present results in gridded maps. EDGAR v5.0 combines several proxies ranging from population density to specific point source location maps for estimating emissions of different economic sectors. Regardless of the different approaches, the potential use of EDGAR gridded data for the examination of emissions in large samples of cities worldwide has been already noted in the literature (Marcotullio et al., 2014).
Using ArcGIS, we overlaid the signatories' urban spatial boundaries onto the EDGAR v5.0 emission grids. We then used the built-in spatial Zonal Statistics tool to estimate total emissions for each urban area and two source categories: energy in buildings and road transportation. EDGAR v5.0 includes emissions from a variety of sources (Solazzo et al., 2021) at the aggregate level of at least a 0.1∘ spatial resolution (representing about 10 km × 10 km at the Equator). Here we use the EDGAR v5.0 global grids of estimated emissions in metric tonnes for the year 2005 for the most prevalent GHGs: carbon dioxide excluding short-cycle organic carbon (i.e. CO2_excl_short-cycle_org_C). Emissions of CO2_excl_short-cycle_org_C include all fossil CO2 (such as fossil fuel combustion) and exclude all sources and sinks from land use, land-use change and forestry (LULUCF) (Crippa et al., 2020). Overall, we compared data from 1945 signatories from the EU 27 countries + the UK with EDGAR v5.0 corresponding data on direct emissions in energy in the buildings sector and road transportation.
Appendix A provides a detailed discussion of the benchmark of the two datasets in both the transport and the buildings sectors.
Overall, considering the completely different origin of EDGAR v5.0 and GCoM primary data, the agreement has to be considered satisfactory, taking into consideration the well-known difficulties in matching inventories based on top-down or bottom-up approaches and the uncertainties affecting inventories in general (see e.g. Solazzo et al., 2021, for a deep analysis of EDGAR v5.0 uncertainties).
Local authorities that adhere to transnational networks active in climate action, by making publicly available the plan, without any obligation to do so, render themselves accountable both globally and locally (Gordon, 2016). This paper presents a major attempt to provide the scientific community with a reliable, consistent and complete dataset, derived from the cities' plan submissions. The following provides an overview of the results extracted from the analysis of the dataset in terms of signatories' participation and the submission status of the climate action plans, as well as their implementation progress in terms of the emission trend.
Starting with adhesion, Table 3 in the dataset reports the full list of the 8136 signatories and associated ancillary data. The ancillary data comprise institutional (i.e. statistical, administrative information), demographic (i.e. population, degree of urbanisation) and socio-economic data (i.e. GDP, heating degree days, national GHG emissions per capita). Harmonised statistical information on signatories (i.e. the ancillary data) allows building a referenced structure for collecting, processing, storing, analysing and aggregating data to support the monitoring of the EU 27 progress on the SDG 13 on climate action (Eurostat, 2020).
Regarding action planning, three-quarters of these signatories (i.e. 6200 local authorities) submitted an action plan, comprising a baseline emission inventory and a set of actions to reach their climate mitigation goals.
Regarding the trend, fewer than one-third of these submissions (i.e. 1845 signatories) reported progress on the implementation of the action plan by presenting a second inventory, called a monitoring report. Table 2 in the dataset reports the activity data and related emissions mapped in the baseline and monitoring inventories aggregated into stationary energy, transport and waste subsectors.
Hence, the progress made by the signatories in the implementation of their climate action plans is assessed in terms of emissions based on these data. Since the inventories might have different reporting sectors, we analysed the trend considering only those sectors reported within both inventories, the baseline and the monitoring one. We found that the absolute reductions achieved from baseline inventories to monitoring inventories correspond to 23 %. If cities had progressed linearly towards their target, these signatories would have achieved 17 % of emission reduction by the inventory years, which is lower than the 23 % observed reduction. Consequently, we can assume that monitoring signatories are on track to reach their commitment.
Most data handling in applying the methods and technical validation was performed in MATLAB (available in file 1 in the Supplement) and Microsoft Excel (file 2 in the Supplement).
The dataset is archived and publicly available with the DOI number https://doi.org/10.2905/57A615EB-CFBC-435A-A8C5-553BD40F76C9 (Kona et al., 2020).
Despite the data mining and verification process, a few limitations and uncertainties remain in relation to the data quality. To start with, it is important to highlight the fact that the overall quality of the data reported in the platform depends mostly on the city's capacity to gather data and report them under the harmonised framework of the GCoM. The JRC does not correct or adjust the reported data per se, but it is the responsibility of the signatory, on receipt of the feedback analysis from experts, to check and possibly revise its data according to the climate action plan. Indeed, we have noted an increasing quality of data reported from cities since 2010, mainly thanks to this feedback–rechecking system. Therefore, the aim of the approach adopted here is not to validate the data as such (they are collected and reported by the signatories) but to guarantee as far as possible the internal consistency and completeness of the data reported in the online platform with the climate action plan documents (i.e. the SECAP).
Secondly, there is limited knowledge on the methods used by cities in determining the emissions, especially within the transport sector. The aim of the technical validation reported in Sect. 4 is to compare the GCoM dataset against international datasets such as EDGAR, being well aware of the fact that the GCoM reports direct observations, whereas EDGAR calculates emissions following a consistent IPCC Tier 1 approach based on Activity Data and Emission Factors country-specific information.
In small–medium urban areas, we assume that local authorities use the territorial approach based on the collected activity data. For these areas, there is a good match with EDGAR v5.0 data, whereas in large urban areas, we note a significant deviation from EDGAR proxies. As already mentioned, this is probably due, among other factors, to the differences between locally collected data (e.g. on local fleets) and average national information. Moreover, due to the uncertainty in the methodological differences for accounting for the emissions, embedded in the nature of the sector, the emissions in this sector can differ widely between cities with similar patterns or sizes.
Regarding waste, the mapping of emissions in this sector has only been added in the last revision of the reporting framework; therefore we expect more data in this sector to become available as cities integrate them into their inventories. For this reason, data from this category were not included in the present study.
Finally, a major source of uncertainty originates from the use of emission factors developed for a national or sometimes even international scale, especially for the electricity and waste sectors. According to our information, signatories often apply the default emission factors provided by the JRC and based on the very wide scale IPCC Tier 1 approach. Clearly, such a coarse granularity is not always able to catch local peculiarities and features.
On the contrary, deploying city-level emission factors for instance for electricity supplied through the grid, taking also into account local renewable energy production, would greatly increase the accuracy of the data.
Future work is envisaged to explore the possibility of also undertaking a comparable analysis of the data reported by GCoM signatories through the CDP-ICLEI Unified Reporting System and other recognised/affiliated national and regional reporting platforms with a view to expanding the coverage of a harmonised, complete and verified dataset of GHG inventories at a city level.
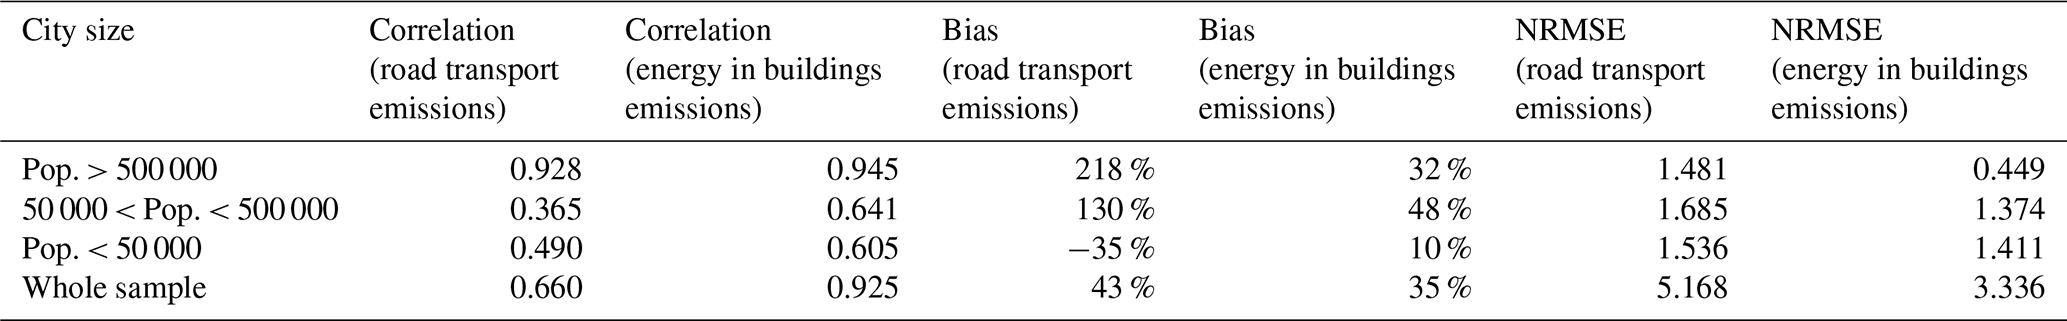
Tables A1 and A2 show the values of absolute emissions (Table A1) and three selected benchmark indicators – namely correlation, bias and normalised root mean square error (NRMSE) – (Table A2) for both EDGAR v5.0 and GCoM datasets in road transport and energy in buildings sectors. Values are reported for both the whole set of selected signatories and three subsets based on population size.
Firstly, it has to be noticed how correlation and NRMSE are consistently better for energy in buildings than road traffic and, for both sectors, tend to improve with increasing the city size, in agreement with the already-mentioned fact that the coarse resolution of EDGAR v5.0 limits the description of smaller areas.
Analysing sectors, it is evident that the GCoM provides consistently higher values of EDGAR v5.0 for energy in the buildings sector, by an average value of 35 % with an overall correlation coefficient of 0.925. This relatively small bias and the good correlation values observed might be attributed to the fact that, in this sector, EDGAR v5.0 splits sectorial emissions on the basis of population density, without at the moment considering regional data. Similarly, GCoM signatories collect data mainly from utilities, data that are themselves good proxies for national energy usage patterns and fuels deployed.
Regarding the traffic sector, Table A2 also shows how the bias between EDGAR v5.0 and GCoM emission data for road transport increases as a function of the city size, with GCoM transport emissions lower than EDGAR data in the smallest cities and overcoming them by a factor of 3 in the largest cities. This is most probably due to the well-known fact that the largest cities act as traffic attractors: there the number of vehicles not only is proportional to the city population but also depends on the incoming and crossing traffic caused by cities activities, an effect that is captured by GCoM ground-based data but is more difficult to be addressed by EDGAR, which uses population density as a spatial proxy for emissions allocation. Moreover, the GCoM dataset reported here reflects not only the on-road fraction of the transport sector but all the emissions in this sector, due to the old version of the reporting platform that collected data without distinguishing the modal share. It also has to be considered that the GCoM reports real data supplied from the transportation department, which are not necessarily caught in EDGAR – for instance, EDGAR v5.0 uses the average national fleet that could be quite different from a local one – and, finally, that the default GCoM emission factors often used by signatories do not apply the very fine categorisation of the vehicle fleet applied in EDGAR.
In summary, observing the overall values of the benchmark indicators reported in the last line of Table A2 and considering once again the deep differences in data sources, with the GCoM based on local authorities' knowledge, while EDGAR v5.0 is based on the use of population density as a main proxy, the behaviour observed does not come as a surprise and confirms the consistency between the two datasets, given the different methodologies applied.
Table A1Absolute emissions (Mt CO2eq) for road transport and energy in buildings sectors in EDGAR v5.0 and GCoM datasets of selected signatories.
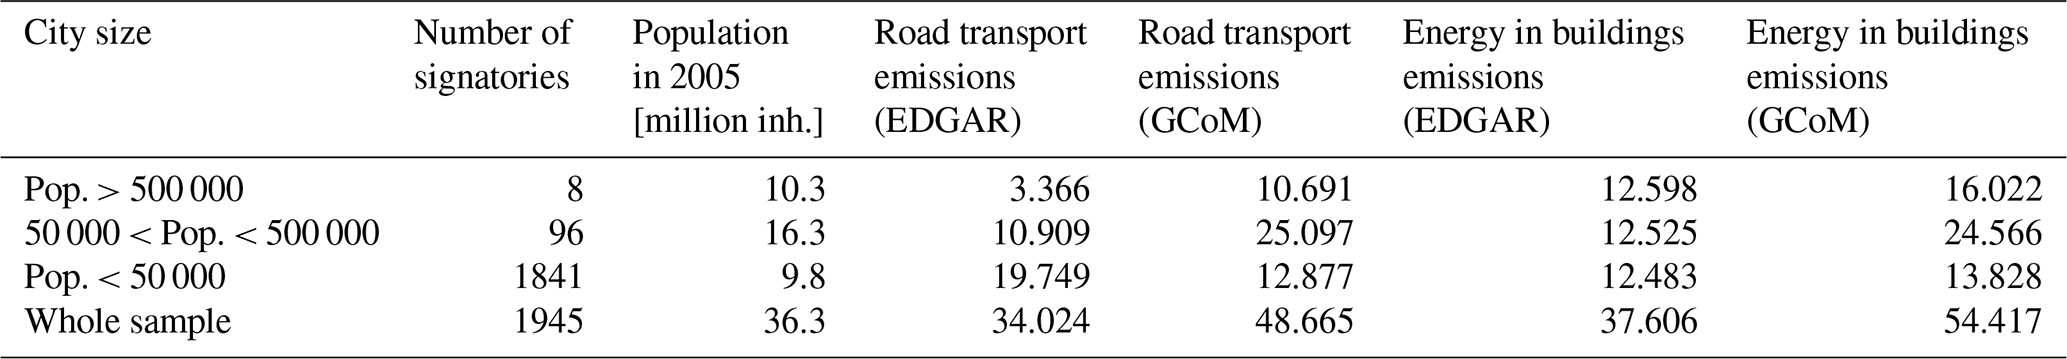
Table A2Benchmark indicators for road transport and energy in buildings sectors in EDGAR v5.0 and GCoM datasets of selected signatories.
The supplement related to this article is available online at: https://doi.org/10.5194/essd-13-3551-2021-supplement.
AK, FMF and PB designed the research. AK prepared the manuscript. AK, MGB, GK and CA assembled and prepared the dataset. All the authors revised the methodological steps and the manuscript.
The authors declare that they have no conflict of interest.
The views expressed are purely those of the authors and may not in any circumstances be regarded as stating an official position of the European Commission.
Publisher's note: Copernicus Publications remains neutral with regard to jurisdictional claims in published maps and institutional affiliations.
We are grateful to local authorities who make public their engagement in climate action planning through their participation in the Global Covenant of Mayors initiative. The authors would like to thank the European Commission Directorate-General for Energy, the CoM Office and JRC colleagues working in the CoM initiative for their support in giving visibility and effectiveness to the effort of cities and local governments in the climate change action. A special acknowledgement goes to our colleagues Monica Lanzoni, for her in-depth review of the statistical analyses, and Andreas Kontogeorgos, for his contribution to English language review.
This paper was edited by Nellie Elguindi and reviewed by two anonymous referees.
Acuto, M., Parnell, S., and Seto, K. C.: Building a global urban science, Nature Sustainability, 1, 4–6, https://doi.org/10.1038/s41893-017-0013-9, 2018.
Adami, L., Tubino, M., Ragazzi, M., Conti, F., and Rada, E. C.: Local actions for reducing global greenhouse gas footprint: 10 years of covenant of mayors initiative, International Journal of Sustainable Development and Planning, 15, 247–252, https://doi.org/10.18280/ijsdp.150216, 2020.
Bertoldi, P., Iancu, A., Kona, A., Suvi, M., Muntean, M., Lah, O., and Rivas, S.: Guidebook “How to develop a Sustainable Energy and Climate Action Plan (SECAP)”: PART 2 – Baseline Emission Inventory (BEI) and Risk and Vulnerability Assessment (RVA), EUR 29412, Publications Office of the European Union, Luxembourg, https://doi.org/10.2760/118857, 2018a.
Bertoldi, P., Kona, A., Palermo, V., Zangheri, P., Serrenho, T., Rivas, S., Labanca, N., Kilkis, S., Lah, O., Glancy, R., Follador, M., Barbosa, P., and Andreanidou, K.: Guidebook “How to develop a Sustainable Energy and Climate Action Plan (SECAP)” PART 3-Policies, key actions, good practices for mitigation and adaptation to climate change and Financing SECAP(s), Publication Office of the European Union, Luxembourg, https://doi.org/10.2760/58898, 2018b.
Bertoldi, P., Kona, A., Rivas, S., and Dallemand, J. F.: Towards a global comprehensive and transparent framework for cities and local governments enabling an effective contribution to the Paris climate agreement, Curr. Opin. Env. Sust., 30, 67–74, https://doi.org/10.1016/j.cosust.2018.03.009, 2018c.
Busch, H., Bendlin, L., and Fenton, P.: Urban Climate Shaping local response – The influence of transnational municipal climate networks on urban climate governance, Urban Climte, 24, 221–230, https://doi.org/10.1016/j.uclim.2018.03.004, 2018.
Cerquitelli, T., Corso, E. Di, Proto, S., Capozzoli, A., Bellotti, F., Cassese, M. G., Baralis, E., Mellia, M., Casagrande, S., and Tamburini, M.: Exploring energy performance certificates through visualization, in: Proceedings of the Workshops of the EDBT/ICDT 2019 Joint Conference, EDBT/ICDT 2019, Lisbon, Portugal, 26 March 2019, edited by: CEUR-WS.org, p. 7, available at: http://ceur-ws.org/Vol-2322/BigVis_2.pdf (last access: January 2021), 2019.
Crippa, M., Solazzo, E., Huang, G., Guizzardi, D., Koffi, E., Muntean, M., Schieberle, C., Friedrich, R., and Janssens-Maenhout, G.: High resolution temporal profiles in the Emissions Database for Global Atmospheric Research, Scientific Data, 1–17, https://doi.org/10.1038/s41597-020-0462-2, 2020.
Croci, E., Lucchitta, B., Janssens-Maenhout, G., Martelli, S., and Molteni, T.: Urban CO2 mitigation strategies under the Covenant of Mayors: An assessment of 124 European cities, J. Clean. Prod., 169, 161–177, https://doi.org/10.1016/j.jclepro.2017.05.165, 2016.
Eurostat: GISCO, available at: https://ec.europa.eu/eurostat/web/gisco/geodata/reference-data/administrative-units-statistical-units/lau#lau19 (last access: January 2021), 2018.
Eurostat: SDG 13 – Climate action, available at: https://ec.europa.eu/eurostat/statistics-explained/index.php?title=SDG_13_-_Climate_action#Climate_mitigation (last access: 24 May 2021), 2020.
Famoso, F., Lanzafame, R., Monforte, P., and Scandura, P. F.: Analysis of the covenant of mayors initiative in sicily, Enrgy. Proced., 81, 482–492, https://doi.org/10.1016/j.egypro.2015.12.122, 2015.
Forster, G.: Understanding Statistics: Basic Theory and Practice, available at: https://www.lulu.com/shop/grant-foster/understanding-statistics-basic-theory-and-practice/paperback/product-20680689.html?page=1&pageSize=4 (last access: January 2021), 484 pp., 2013.
Gordon, J. D.: The Politics of Accountability in Networked Urban Climate Governance, Global Environ. Polit., 16, 82–100, 2016.
Heidrich, O., Reckien, D., Olazabal, M., Foley, A., Salvia, M., Hurtado, S. D. G., Orru, H., Flacke, J., Geneletti, D., Pietrapertosa, F., Hamann, J. J., and Tiwary, A.: National climate policies across Europe and their impacts on cities strategies, J. Environ. Manage., 168, 36–45, https://doi.org/10.1016/j.jenvman.2015.11.043, 2016.
IPCC: 2006 IPCC Guidelines for National Greenhouse Gas Inventories, Prepared by the National Greenhouse Gas Inventories Programme, edited by: Eggleston, H. S., Buendia, L., Miwa, K., Ngara, T., and Tanabe, K., IGES, Japan, 2006.
IPCC: Climate Change 2007: Mitigation. Contribution of Working Group III to the Fourth Assessment Report of the Intergovernmental Panel on Climate Change, edited by: Metz, B., Davidson, O. R., Bosch, P. R., Dave, R., and Meyer, L. A., Cambridge University Press, Cambridge, UK and New York, NY, USA, 2007.
IPCC: Climate Change 2014: Mitigation of Climate Change. Contribution of Working Group III to the Fifth Assessment Report of the Intergovernmental Panel on Climate Change, edited by: Edenhofer, O., Pichs-Madruga, R., Sokona, Y., Farahani, E., Kadner, S., Seyboth, K., Adler, A., Baum, I., Brunner, S., Eickemeier, P., Kriemann, B., Savolainen, J., Schlömer, S., von Stechow, C., Zwickel, T., and Minx, J. C., Cambridge University Press, Cambridge, UK and New York, NY, USA, available at: http://www.ipcc.ch/pdf/assessment-report/ar5/wg3/ipcc_wg3_ar5_full.pdf (last access: January 2021), 2014.
IPCC: Human Settlements, Infrastructure, and Spatial Planning, in: Climate Change 2014: Mitigation of Climate Change: Working Group III Contribution to the IPCC Fifth Assessment Report, Cambridge University Press, Cambridge, https://doi.org/10.1017/CBO9781107415416.018, pp. 923–1000, 2015.
Kilkis, S.: Data on cities that are benchmarked with the sustainable development of energy, water and environment systems index and related cross-sectoral scenario, Data in Brief, 24, 103856, https://doi.org/10.1016/j.dib.2019.103856, 2019.
Kona, A., Bertoldi, P., Monforti-Ferrario, F., Rivas, S., and Dallemand, J. F.: Covenant of mayors signatories leading the way towards 1.5 degree global warming pathway, Sustain. Cities Soc., 41, 568–575, https://doi.org/10.1016/J.SCS.2018.05.017, 2018.
Kona, A., Bertoldi, P., and Kılkış, Ş.: Covenant of Mayors: Local Energy Generation, Methodology, Policies and Good Practice Examples, Energies, 12, 985, https://doi.org/10.3390/en12060985, 2019.
Kona, A., Bertoldi, P., Baldi, M., Monforti-Ferrario, F., Palermo, V., Lo Vullo, E., Rivas-Calvete, S., Kakoulaki, G., Vetters, N., Thiel, C., Sgobbi, A., Ahlgren, C., and Posnic, B.: A dataset of GHG emissions for 6,200 cities in Europe and the Southern Mediterranean countries, Publications Office European Union, Luxembourg, https://doi.org/10.2905/57A615EB-CFBC-435A-A8C5-553BD40F76C9, 2020.
Kovac, A., Mcdaniel, S., Kona, A., Bertoldi, P., and Chavara, C.: Aggregating Cities' GHG Mitigation Targets with Modeled Emissions Scenarios, available at: https://files.wri.org/s3fs-public/aggregating-cities-ghg-mitigation-targets.pdf (last access: January 2021), World Resources Institute, Washington, D.C., 2020.
Lo Vullo, E., Muntean, M., Duerr, M., Kona, A., and Bertoldi, P.: National and European Emission Factors for Electricity, Covenant of Mayors, Luxembourg, available at: https://data.jrc.ec.europa.eu/collection/id-00172 (last access: January 2021), Joint Research Centre Data Catalogue, 2020.
Marcotullio, P. J., Sarzynski, A., Albrecht, J., and Schulz, N.: A Top-Down Regional Assessment of Urban Greenhouse Gas Emissions in Europe, Ambio, 43, 957–968, https://doi.org/10.1007/s13280-013-0467-6, 2014.
Monforti-Ferrario, F., Kona, A., Peduzzi, E., Pernigotti, D., and Pisoni, E.: The impact on air quality of energy saving measures in the major cities signatories of the Covenant of Mayors initiative, Environ. Int., 118, 222–234, https://doi.org/10.1016/j.envint.2018.06.001, 2018.
Nangini, C., Peregon, A., Ciais, P., Weddige, U., Vogel, F., Wang, J., Bréon, F.-M., Bachra, S., Wang, Y., Gurney, K., Yamagata, Y., Appleby, K., Telahoun, S., Canadell, J. G., Grübler, A., Dhakal, S., and Creutzig, F.: A global dataset of CO2 emissions and ancillary data related to emissions for 343 cities, Scientific Data, 6, 180280, https://doi.org/10.1038/sdata.2018.280, 2019.
Pablo-Romero, M. del P., Pozo-Barajas, R., and Sánchez-Braza, A.: Analyzing the effects of the benchmark local initiatives of Covenant of Mayors signatories, J. Clean. Prod., 176, 159–174, https://doi.org/10.1016/J.JCLEPRO.2017.12.124, 2018.
Palermo, V., Bertoldi, P., Apostolou, M., Kona, A., and Rivas, S.: Assessment of climate change mitigation policies in 315 cities in the Covenant of Mayors initiative, Sustain. Cities Soc., 60, 102258, https://doi.org/10.1016/j.scs.2020.102258, 2020a.
Palermo, V., Bertoldi, P., Apostolou, M., Kona, A., and Rivas, S.: Data on mitigation policies at local level within the Covenant of Mayors' monitoring emission inventories, Data in Brief, 32, 106217, https://doi.org/10.1016/j.dib.2020.106217, 2020b.
Peduzzi, E., Baldi, M. G., Pisoni, E., Kona, A., Bertoldi, P., and Monforti-ferrario, F.: Impacts of a climate change initiative on air pollutant emissions: Insights from the Covenant of Mayors, Environ. Int., 145, 106029, https://doi.org/10.1016/j.envint.2020.106029, 2020.
Reckien, D., Salvia, M., Heidrich, O., Church, J. M., Pietrapertosa, F., De Gregorio-Hurtado, S., D'Alonzo, V., Foley, A., Simoes, S. G., Lorencová, E. K., Orru, H., Orru, K., Wejs, A., Flacke, J., Olazabal, M., Geneletti, D., Feliu, E., Vasilie, S., Nador, C., Krook-Riekkola, A., Matosović, M., Fokaides, P. A., Ioannou, B. I., Flamos, A., Spyridaki, N., Balzan, M. V., Fülöp, O., Paspaldzhiev, I., Grafakos, S., and Dawson, R.: How are cities planning to respond to climate change? Assessment of local climate plans from 885 cities in the EU-28, J. Clean. Prod., 191, 207–219, https://doi.org/10.1016/j.jclepro.2018.03.220, 2018.
Rosner, B.: Percentage Points for a Generalized ESD Many-Outlier Procedure, Technometrics, 25, 165–172, 1983.
Seem, J. E.: Using intelligent data analysis to detect abnormal energy consumption in buildings, Energ. Buildings, 39, 52–58, 2007.
Solazzo, E., Crippa, M., Guizzardi, D., Muntean, M., Choulga, M., and Janssens-Maenhout, G.: Uncertainties in the Emissions Database for Global Atmospheric Research (EDGAR) emission inventory of greenhouse gases, Atmos. Chem. Phys., 21, 5655–5683, https://doi.org/10.5194/acp-21-5655-2021, 2021.
van der Ven, H., Bernstein, S., and Hoffmann, M.: Valuing the Contributions of Nonstate and Subnational Actors to Climate Governance, Global Environ. Polit., 17, 1–20, 2017.