the Creative Commons Attribution 4.0 License.
the Creative Commons Attribution 4.0 License.
 | 21 Jul 2021
Lake surface sediment pollen dataset for the alpine meadow vegetation type from the eastern Tibetan Plateau and its potential in past climate reconstructions
Fang Tian
Kai Li
Xiaoshan Yu
Lina Liu
Nannan Wang
A modern pollen dataset with an even distribution of sites is essential for pollen-based past vegetation and climate estimations. As there were geographical gaps in previous datasets covering the central and eastern Tibetan Plateau, lake surface sediment samples (n=117) were collected from the alpine meadow region on the Tibetan Plateau between elevations of 3720 and 5170 m a.s.l. Pollen identification and counting were based on standard approaches, and modern climate data were interpolated from a robust modern meteorological dataset. A series of numerical analyses revealed that precipitation is the main climatic determinant of pollen spatial distribution: Cyperaceae, Ranunculaceae, Rosaceae, and Salix indicate wet climatic conditions, while Poaceae, Artemisia, and Chenopodiaceae represent drought. Model performance of both weighted-averaging partial least squares (WA-PLS) and the random forest (RF) algorithm suggest that this modern pollen dataset has good predictive power in estimating the past precipitation from pollen spectra from the eastern Tibetan Plateau. In addition, a comprehensive modern pollen dataset can be established by combining our modern pollen dataset with previous datasets, which will be essential for the reconstruction of vegetation and climatic signals for fossil pollen spectra on the Tibetan Plateau. Pollen datasets including both pollen counts and percentages for each sample, together with their site location and climatic data, are available at the National Tibetan Plateau Data Center (TPDC; Cao et al., 2021; https://doi.org/10.11888/Paleoenv.tpdc.271191).
- Article
(7674 KB) - Full-text XML
- BibTeX
- EndNote


The relationship between modern pollen and climate, and its representation of vegetation, is the basis for explaining and reconstructing past climate and vegetation qualitatively or quantitatively (Juggins and Birks, 2012), and so improving the quality of the modern pollen dataset is a primary step for an objective investigation of the modern relationship and ensuring reliable climate and vegetation reconstructions (Cao et al., 2018). To make the pollen source area and taphonomy as compatible as possible, modern pollen assemblages should be retrieved from the same type of sedimentary environment as the fossil pollen spectra (Birks et al., 2010). Hence, to reconstruct past climate and vegetation from fossil pollen extracted from a lacustrine sediment, a corresponding modern pollen dataset of samples collected from lake surface sediments is necessary. Although there are some modern pollen datasets for the Tibetan Plateau established to investigate the relationships between pollen and climate or vegetation (Shen et al., 2006; Herzschuh et al., 2010; Ma et al., 2017), there are geographical gaps (e.g. the central and eastern Tibetan Plateau) in the sampled lakes which may bias interpretations.
The available modern pollen datasets reveal that pollen assemblages on the Tibetan Plateau are generally simple with Cyperaceae, Artemisia, Poaceae, and Chenopodiaceae as the dominant taxa (e.g. Herzschuh et al., 2010; Cao et al., 2014) and with arboreal pollen taxa becoming more influential in the marginal areas (e.g. Ma et al., 2017; Li et al., 2020). It is essential to identify the climatic indicators of the modern pollen taxa (particular for the four dominant taxa) on the Tibetan Plateau because the climatic indicators derived from modern pollen datasets from the surrounding lowland cannot be directly employed on the Tibetan Plateau. With our current modern pollen dataset extracted from lake surface sediments, we aim to (1) fill a geographical gap and thus establish a comprehensive modern pollen dataset covering the entire Tibetan Plateau; (2) determine the climatic indicators for common pollen taxa from the alpine meadow ecosystem; and (3) evaluate the predictive power of the modern dataset to reconstruct past climate and assess the reliability of the random forest (RF) algorithm in calibrating the pollen–climate relationship.
The elevation range of the lakes sampled for our pollen dataset is between 3720 and 5170 m a.s.l. with a median of 4420 m a.s.l. (the 25 % quantile is 4230 m a.s.l. and the 75 % quantile is 4550 m a.s.l.; Fig. 1). The climate of this region is controlled by the Asian Summer Monsoon in summer with warm and wet climatic conditions and by westerlies in winter with cold and dry conditions (Wang, 2006). The eastern and central Tibetan Plateau containing these sampled lakes (with >4000 m a.s.l. elevation) is covered by alpine meadow with sporadic patches of subalpine shrub. The plant communities of the alpine meadow are dominated by Kobresia species (Cyperaceae) generally, with Ranunculaceae, Asteraceae, Polygonum (Polygonaceae), Potentilla (Rosaceae), Fabaceae, and Caryophyllaceae as the common taxa. The subalpine shrub is generally distributed on the northern slopes of mountains with Salix oritrepha and Potentilla fruticosa as the main shrub components, while the herbaceous taxa mentioned above are also common (Wu, 1995; Herzschuh et al., 2010; unpublished vegetation survey).
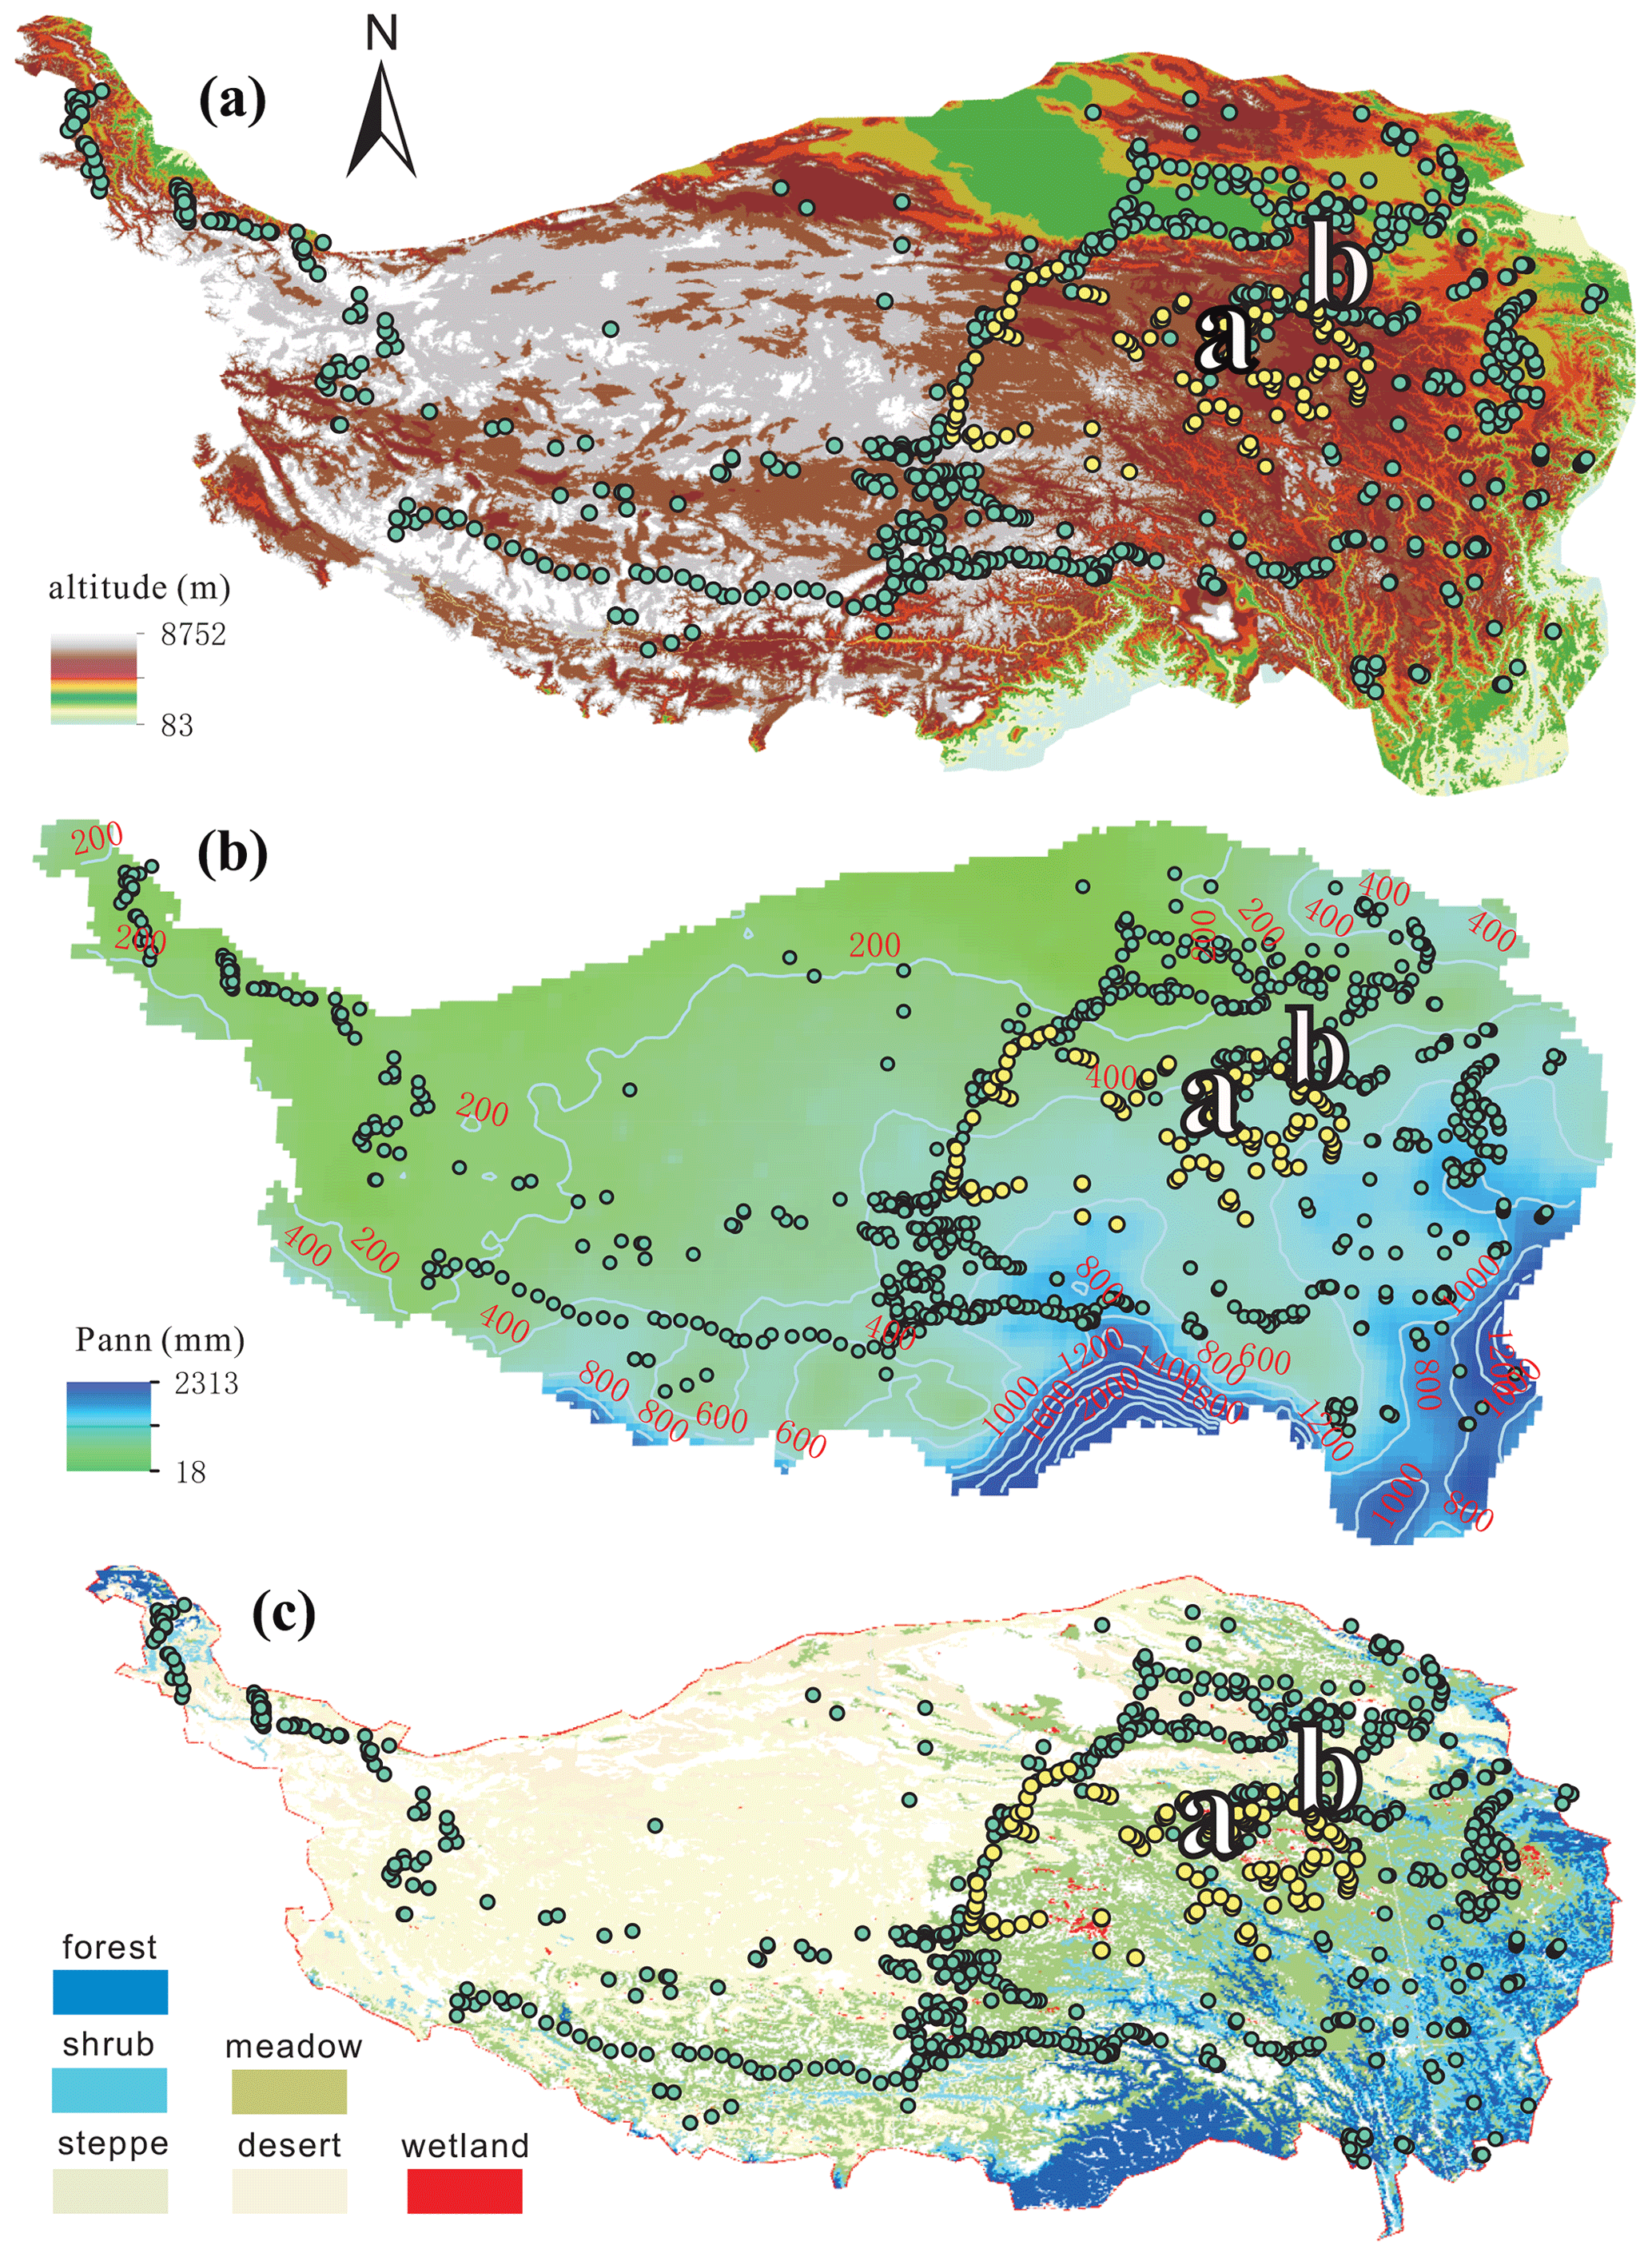
Figure 1Spatial distribution of modern pollen samples (yellow dots: the 117 sampled lakes; bluish green dots: previous samples – surface soils and lake surface sediments – included in the dataset of Cao et al., 2014). (a) Digital elevation model; (b) isohyet map (mm); and (c) vegetation map. The letters “a” and “b” indicate the locations of Koucha Lake and Xingxinghai Lake.
3.1 Sample collecting and pollen processing
To ensure the even distribution of the representative lakes, we travelled not only along the hardened roads but also the dirt roads to collect samples from the alpine meadow on the eastern and central Tibetan Plateau in July and August 2018. To reduce the influence of long-distance pollen grains transported by wind and rivers, small and shallow lakes (or pools) with less than 100 m radius and without long inflow rivers (n=117) (locally sourced pollen grains are the dominant components for small lakes; Sugita, 1993) were selected to collect pollen samples (Fig. 1). To reduce the influence of the lake-shore vegetation component, the lake surface sediment samples were collected from the central part of each lake, with the top 2 cm of lake sediment forming the sample (Tian et al., 2008). Although the selected lakes generally have an even distribution, there is still a gap in the south-west part of the study area because of a lack of lake and road access (Fig. 1).
For pollen extraction, approximately 10 g (wet untreated sediment) per sample was subsampled. Pollen samples were processed using standard acid–alkali–acid procedures (including 10 % HCl, 10 % KOH, 40 % HF, and a 9:1 mixture of acetic anhydride and sulfuric acid successively; Fægri and Iversen, 1975), followed by 7 µm mesh sieving. A tablet with Lycopodium spores (27 560 grains per tablet) was added to each sample prior to pollen extraction as tracers (Maher, 1981). Pollen grains were identified with the aid of modern pollen reference slides collected from the eastern and central Tibetan Plateau (including 401 common species of alpine meadow; Cao et al., 2020) and published atlases for pollen and spores (Wang et al., 1995; Tang et al., 2017). More than 500 terrestrial pollen grains were counted for each sample, and more than 200 Lycopodium spores were counted for most of the samples (mean = 270 grains; median = 480 grains), both of which ensure a reliable representation of the entire pollen assemblage by the counted pollen data.
3.2 Data processing
To obtain modern climatic data for the sampled lakes, the Chinese Meteorological Forcing Dataset (CMFD; gridded near-surface meteorological dataset) with a temporal resolution of 3 h and a spatial resolution of 0.1∘ was employed (He et al., 2020). The CMFD is made through the fusion of remote-sensing products, reanalysis datasets, and in situ station data between January 1979 and December 2018, and its high reliability has already been confirmed for western China including the Tibetan Plateau (He et al., 2020). Geographical distances of each sampled lake to each pixel in the CMFD were calculated based on their longitude and latitude coordinates using the rdist.earth function in the fields package version 9.6.1 (Nychka et al., 2019) for R (version 3.6.0; R Core Team, 2019), and the meteorological data (3 h resolution between January 1979 and December 2018) of the nearest pixel to a sampled lake were assigned to represent the climatic conditions of that lake. Finally, the mean annual precipitation (Pann; mm), mean annual temperature (Tann; ∘C), and mean temperature of the coldest month (Mtco; ∘C) and warmest month (Mtwa; ∘C) were calculated for each sampled lake based on the long-term continuous meteorological data.
To visualize the relationships between modern pollen assemblages and climatic variables, ordination techniques were employed based on the square-root-transformed pollen data of 19 taxa (those present in at least three samples and with a ≥3 % maximum) to stabilize variances and optimize the signal-to-noise ratio (Prentice, 1980). Detrended correspondence analysis (DCA; Hill and Gauch, 1980) revealed that the length of the first axis of the pollen data was 1.44 SD (standard deviation units), indicating that a linear response model is suitable for our pollen dataset (ter Braak and Verdonschot, 1995). We performed redundancy analysis (RDA) to visualize the distribution of pollen species and sampling sites along the climatic gradients, selecting the minimal adequate model using forward selection and checking the variance inflation factors (VIFs) at each step. If VIF values were higher than 20, which indicates that some variables in the model are co-linear, we stopped adding variables (ter Braak and Prentice, 1988). These ordinations were performed using the decorana and rda functions in the vegan package version 2.5-4 (Oksanen et al., 2019) for R.
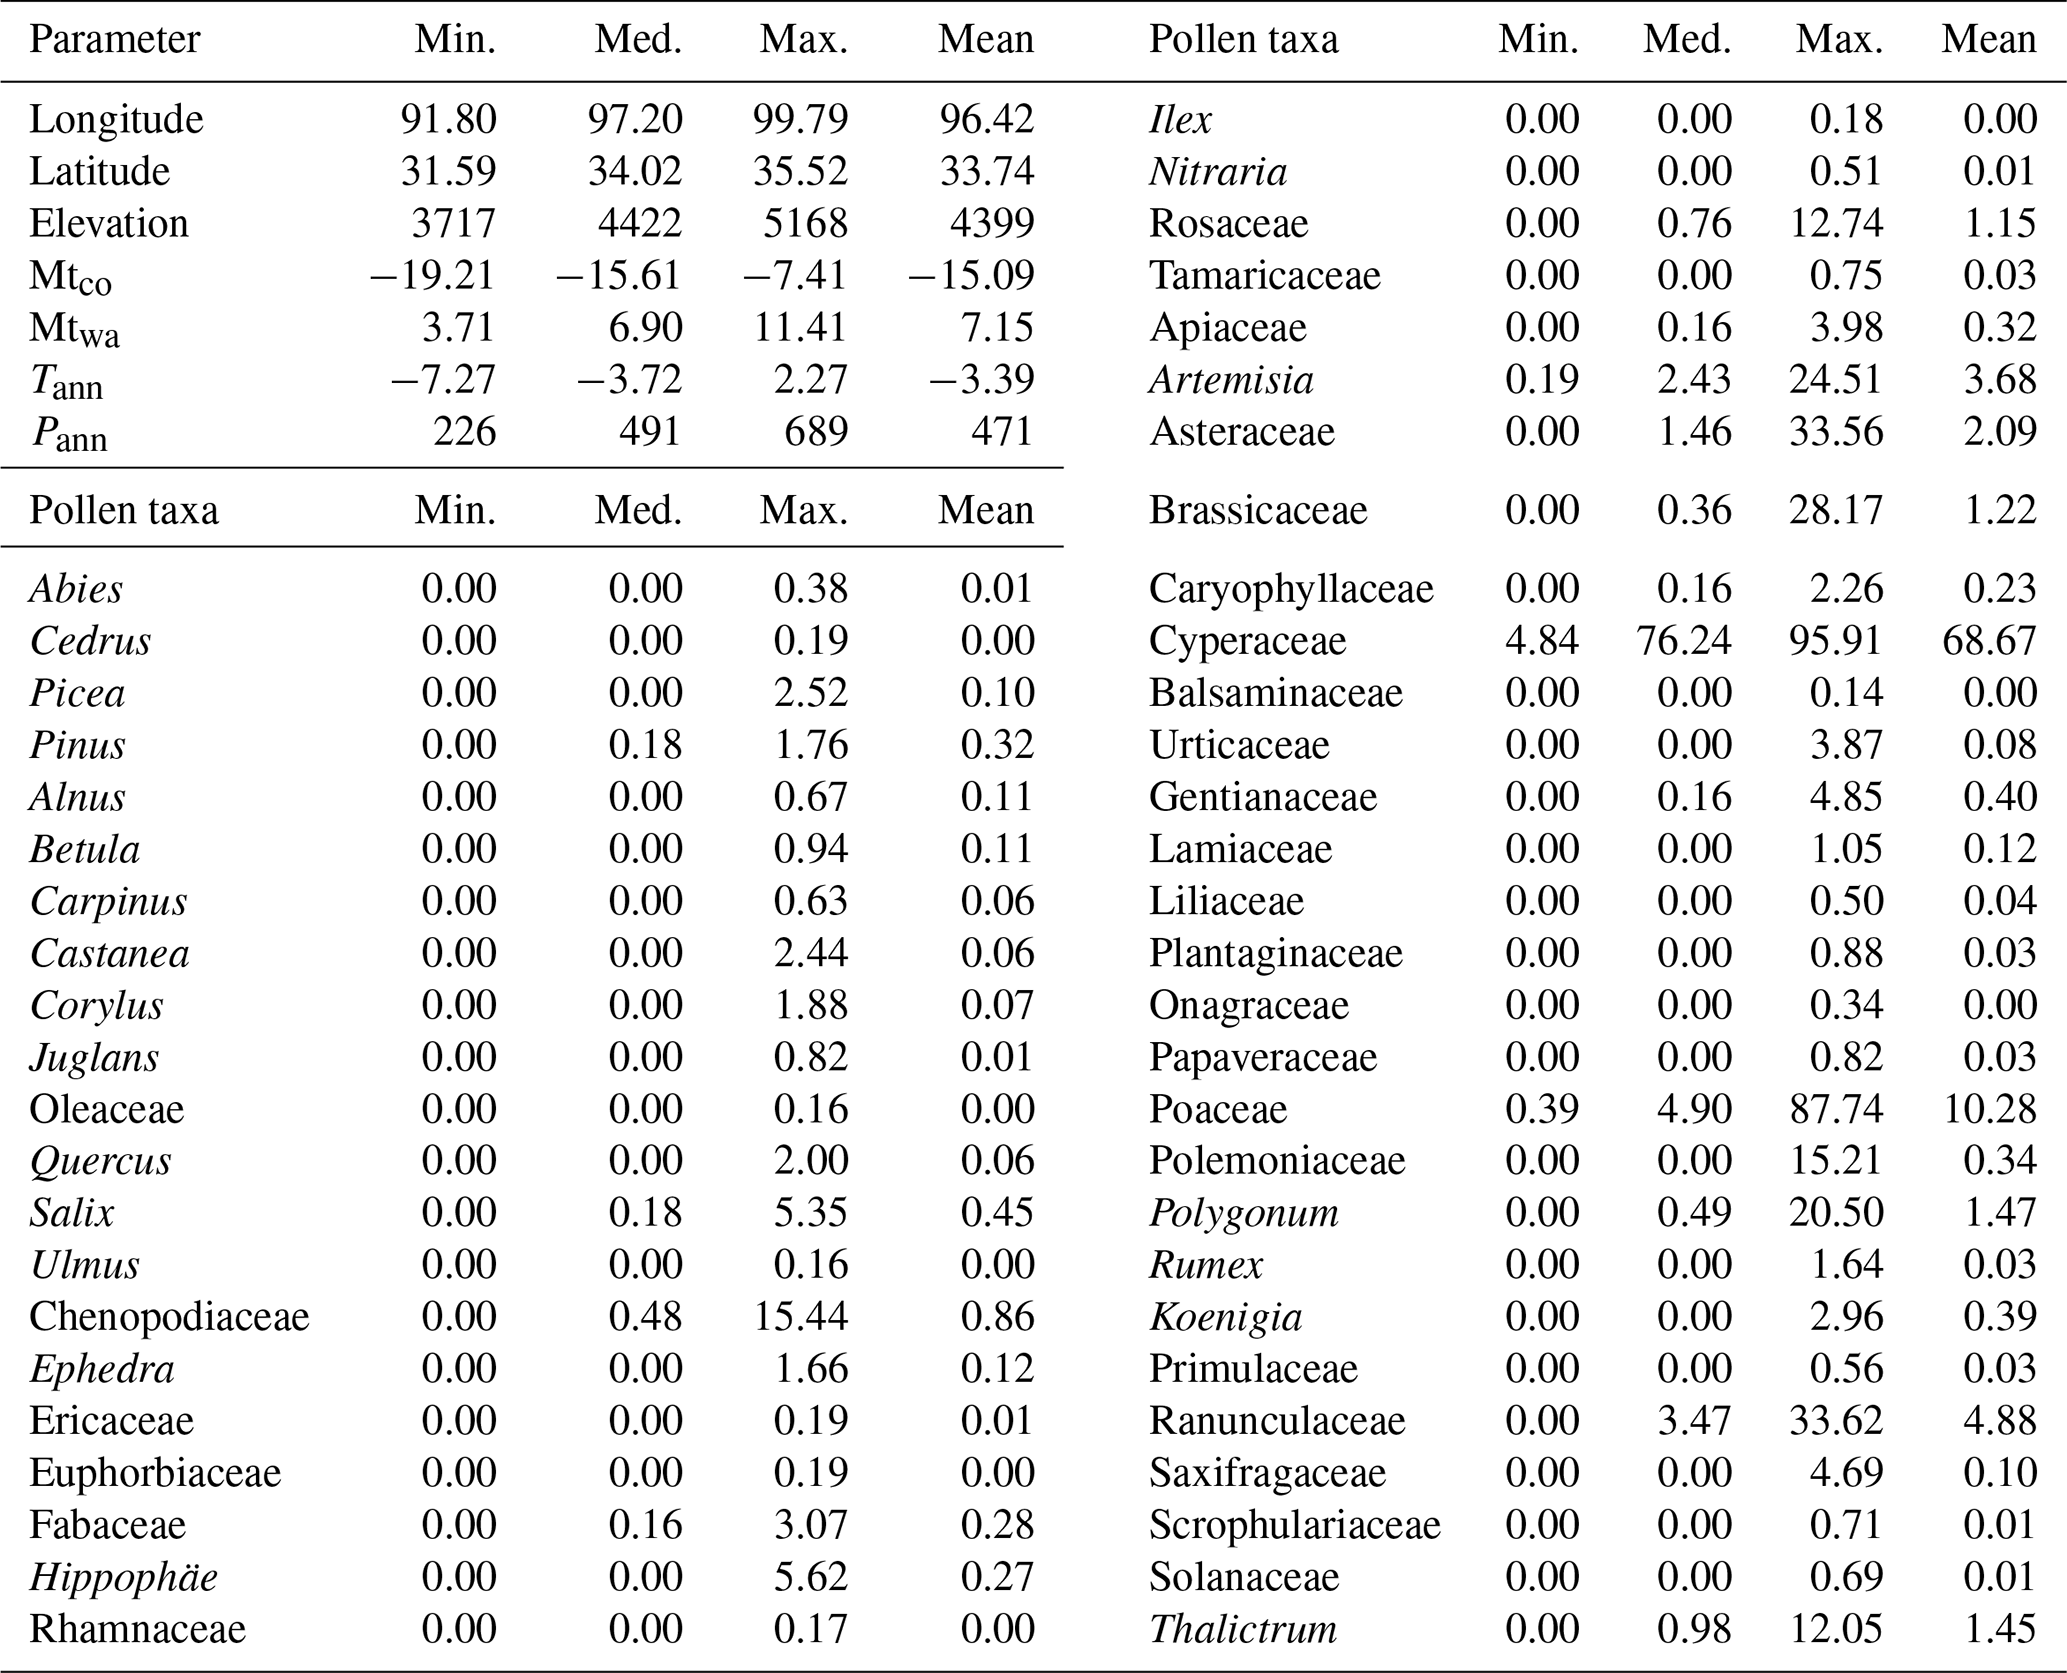
Table 1Summary statistics for parameters in the pollen dataset. Min.: minimum; Med.: median; and Max.: maximum. Units for longitude and latitude are degrees, elevation is in metres above sea level, Mtco, Mtwa, and Tann are ∘C, Pann is in millimetres, and pollen data are percentages.
Boosted regression tree (BRT) analysis was applied to determine how strongly the climatic variables influence the distribution of each individual pollen taxon using square-root-transformed pollen percentages. A BRT model was generated using the gbm.step function in the dismo package version 1.0-12 (Hijmans et al., 2015) for R with a Gaussian error distribution.
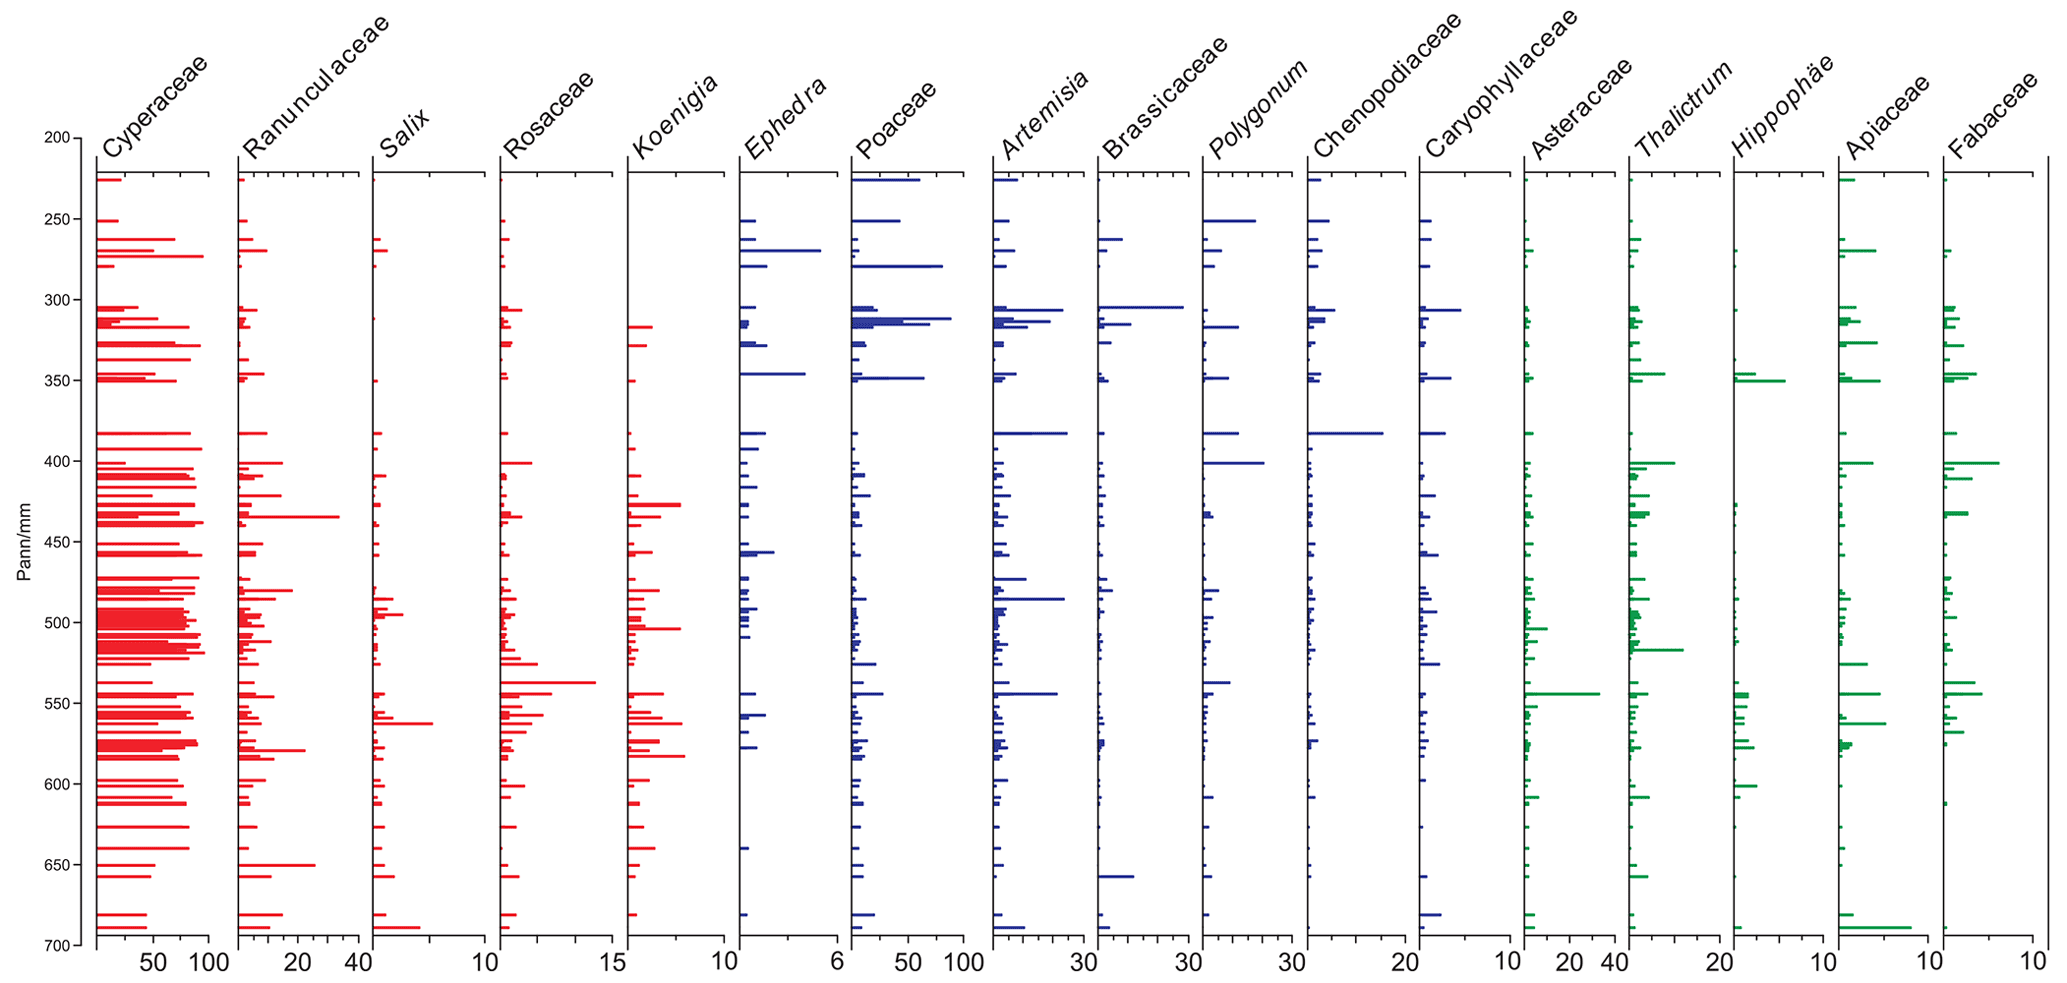
Figure 2Pollen diagram showing the major taxa (percentage; %) of the 117 samples arranged by mean annual precipitation (Pann; mm). Pollen taxa with red bars are positively related to Pann, those with blue bars are negatively related to Pann, and the relationship is insignificant for those with green bars.
The basic assumption of pollen-based past climate reconstruction assumes that pollen taxa recorded in the modern calibration set have similar ecological requirements as those in the fossil spectra (Juggins and Birks, 2012); in other words, the modern vegetation–climate relationship is assumed to be stable temporally through the target period for reconstruction. To evaluate the potential of the pollen dataset for past climate reconstruction, both the traditional method of weighted-averaging partial least squares (WA-PLS) and a new approach using the random forest (RF) algorithm were run. WA-PLS was performed using the WAPLS function in the rioja package version 0.7-3 (Juggins, 2012) for R using leave-one-out cross-validation, pollen percentages of the 19 selected pollen taxa were square-root transformed, and the number of WA-PLS components used was selected using a randomization t test (Juggins and Birks, 2012). We performed the RF algorithm with the randomForest package (version 4.6-14; Liaw, 2018) in R. RF is an algorithm that integrates multiple decision trees, and the importance of each explanatory variable is measured as the percentage increase in the residual sum of squares after randomly shuffling the order of the variables to determine which explanatory variable can be added to the model. In our study, the importance of all pollen taxa on the spatial distribution of Pann was estimated and the model systematically optimized by a stepwise reduction in variables by deleting the least important one. Our final RF model includes 19 pollen taxa (Appendix B), which all make a positive contribution to the precipitation distribution. To assess the predictive power of our pollen dataset, pollen spectra from Koucha Lake (covering the last 16 cal kyr BP (calibrated thousand years before 1950 CE); 34.0∘ N, 97.2∘ E; 4540 m a.s.l.; Herzschuh et al., 2009) and Xingxinghai Lake (covering the last 7.5 cal kyr BP; 34.8∘ N, 98.1∘ E; 4228 m a.s.l.; Zhang et al., unpublished) were selected as the target fossil pollen datasets for quantitative reconstruction. A statistical significance test for all reconstructions was performed following the methods described in Telford and Birks (2011) using the randomTF function in the palaeoSig package version 1.1.2 for both WA-PLS and RF reconstruction methods separately (Telford, 2013).
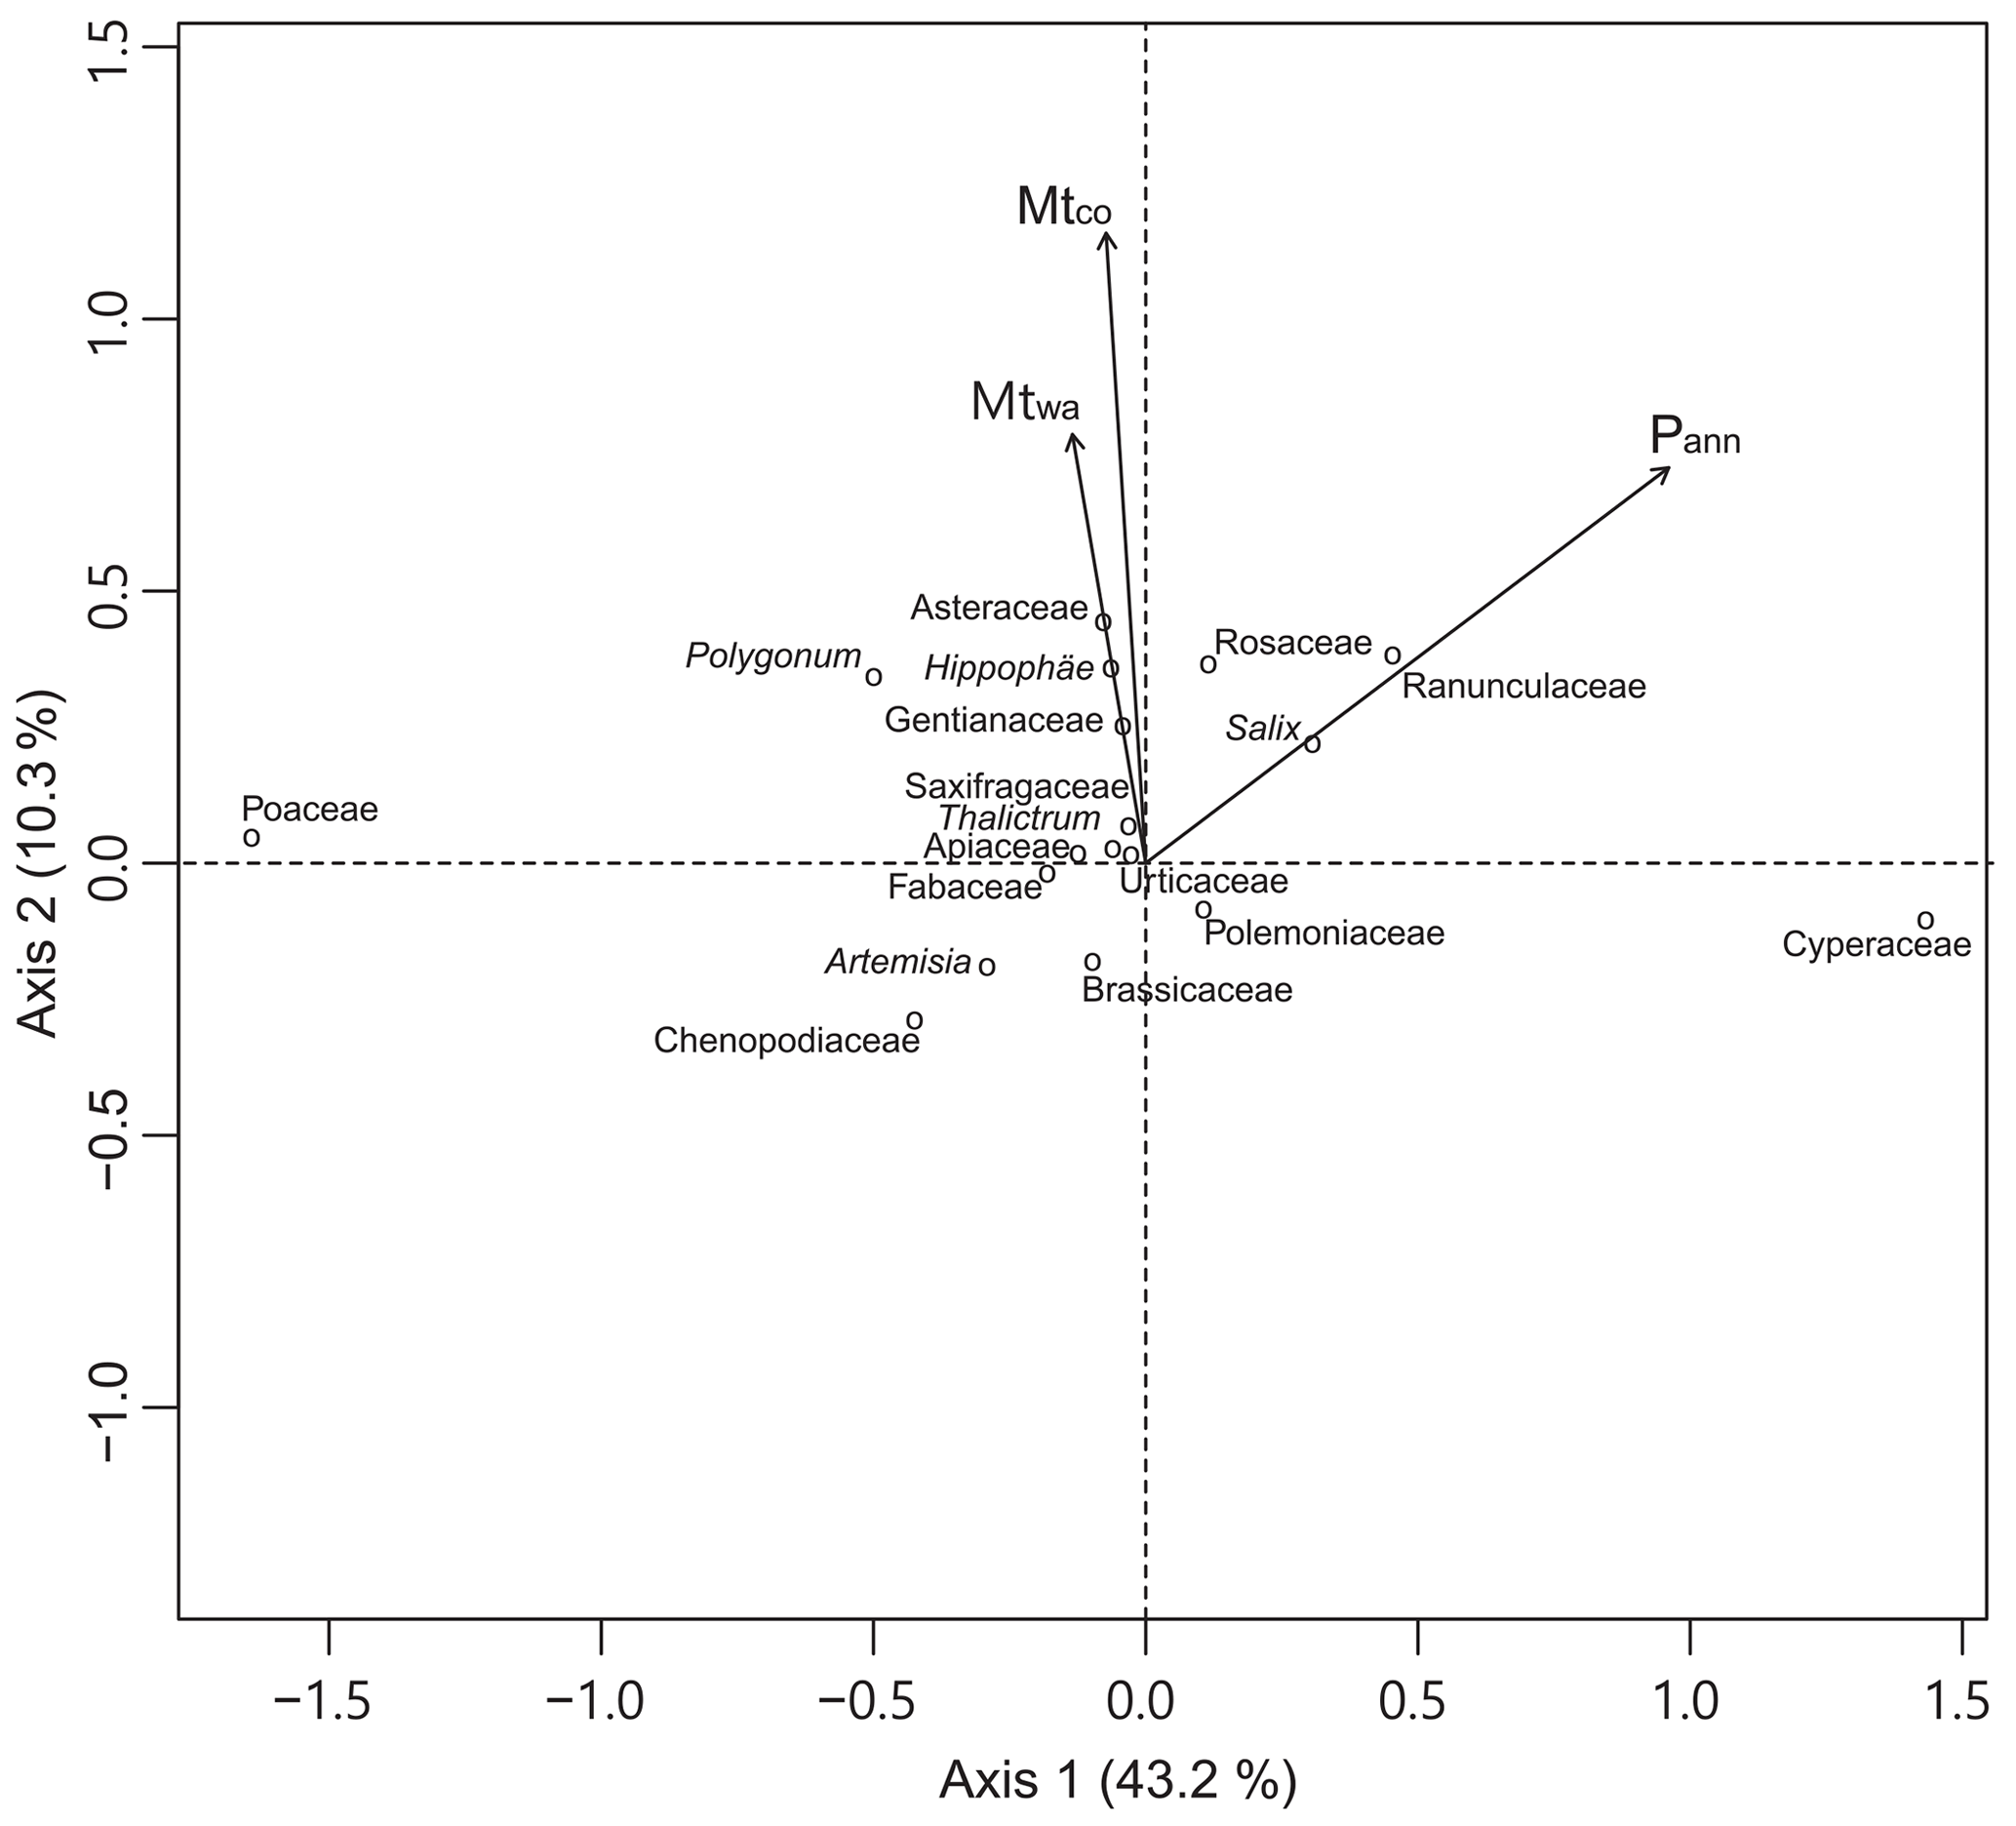
Figure 3Plot of the first two redundancy analysis (RDA) axes showing the relationships between 18 pollen taxa (circles) and three climatic variables (arrows). Pann: mean annual precipitation (mm); Mtco: mean temperature of the coldest month (∘C); and Mtwa: mean temperature of the warmest month (∘C).
Pollen assemblages of the dataset from alpine meadows are dominated by Cyperaceae (mean 68.4 %, maximum 95.9 %), with other herbaceous pollen taxa being common, including Poaceae (mean 10.3 %, maximum 87.7 %), Ranunculaceae (mean 4.8 %, maximum 33.6 %), Artemisia (mean 3.7 %, maximum 24.5 %), and Asteraceae (mean 2.1 %, maximum 33.6 %). Salix (mean 0.4 %, maximum 5.3 %) is the major shrub taxon in these pollen assemblages, while arboreal taxa occur with low percentages generally (mean total arboreal percentage 0.9 %, maximum 5.8 %), mainly comprising Pinus (mean 0.3 %, maximum 1.8 %), Betula (mean 0.1 %, maximum 0.9 %), and Alnus (mean 0.1 %, maximum 0.7 %). Published vegetation data (e.g. Wu, 1995; Herzschuh et al., 2010) and our vegetation survey reveal that trees are absent from the alpine meadow communities within the study area; thus we believe the arboreal pollen with low abundances in the dataset will have been transported by wind from adjacent regions to the south and east. Generally, these pollen assemblages represent well the plant components in the alpine meadow communities, although they are influenced slightly by long-distance pollen transported by wind (Fig. 2).

Figure 4BRT-modelled climate influences on pollen (seven dominant or major taxa) percentages. The pollen responses to three climatic variables (red curves) are fitted with local polynomial regression (LOESS).

Figure 5Scatter plots of observed annual precipitation (Pann) vs. predicted Pann by weighted-averaging partial least squares regression (WA-PLS) and random forest algorithm (RF).
The region covered by these modern pollen samples has a Pann gradient from 226 to 689 mm and cold thermal conditions with low Tann (−7.3 to 2.3 ∘C) and Mtco (−19.2 to −7.4 ∘C). A series of RDAs reveal that, relative to Mtco and Mtwa, Pann explains more pollen assemblage variation (10.8 % as a sole predictor in RDA) in the dataset (Table 2). A biplot of the RDA shows that the direction of the Pann vector has a smaller angle with the positive direction of axis 1 (captures 43.2 % of total inertia in the dataset) than with the positive direction of axis 2 (10.3 %), indicating that the major component of axis 1 should be moisture. RDA axis 1, which is highly correlated with Pann, divides the pollen taxa into two groups generally: Cyperaceae, Ranunculaceae, Rosaceae, and Salix indicating wet climatic conditions (located along the positive direction of Pann), while Poaceae, Artemisia, and Chenopodiaceae represent drought (located along the negative direction of Pann; Fig. 3). Axis 2 is highly correlated with the two temperature variables; however, these dominant pollen taxa have insignificant distributions along the axis, and hence temperature is the secondary climatic variable for the pollen dataset relative to precipitation (Fig. 3). Because of low occurrences and abundances for some rare pollen taxa, BRT models are only performed for 14 dominant or common pollen taxa. BRT modelling results suggest that Pann is the main climatic determinant for 9 out of 10 of the major pollen taxa with >0.6 prevalence, with Asteraceae an exception having Mtco as its main climatic determinant (68 %; Table 3). BRT results reveal that pollen abundances of Cyperaceae, Ranunculaceae, and Salix are positively related to Pann, while those of Poaceae, Artemisia, and Chenopodiaceae have a negative relationship with Pann, which is consistent with the RDA results (Figs. 3 and 4; Appendix A).
Table 2Summary statistics of redundancy analysis (RDA) of 19 pollen species and four climatic variables. VIF: variance inflation factor; Pann: mean annual precipitation (mm); Mtco: mean temperature of the coldest month (∘C); Mtwa: mean temperature of the warmest month (∘C); and Tann: annual mean temperature (∘C).
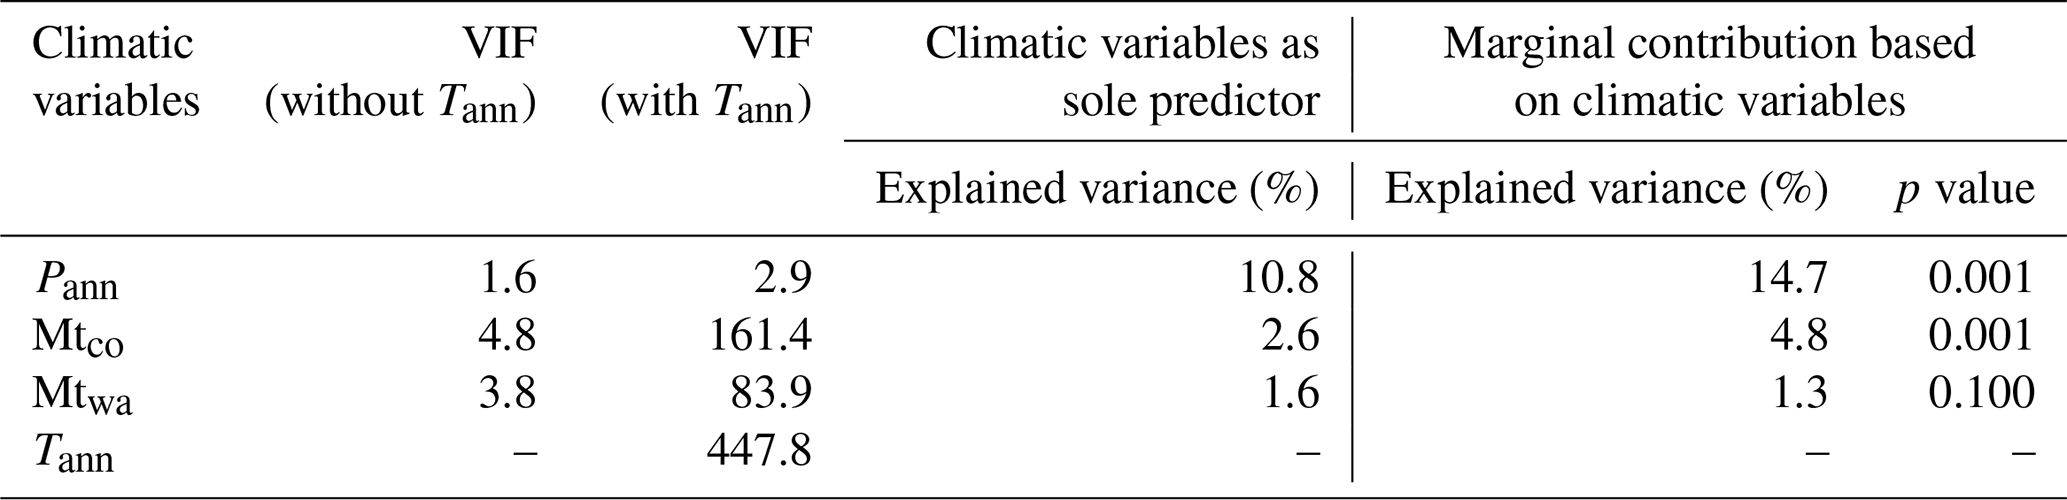
Table 3Relative influence of climatic variables to the spatial distributions of 14 pollen taxa based on boosted regression tree (BRT) models. For each variable, the relative influence is expressed as a percentage among the three variables. Pollen taxa are ordered by decreasing prevalence (the proportion of sites in which each taxon is present).
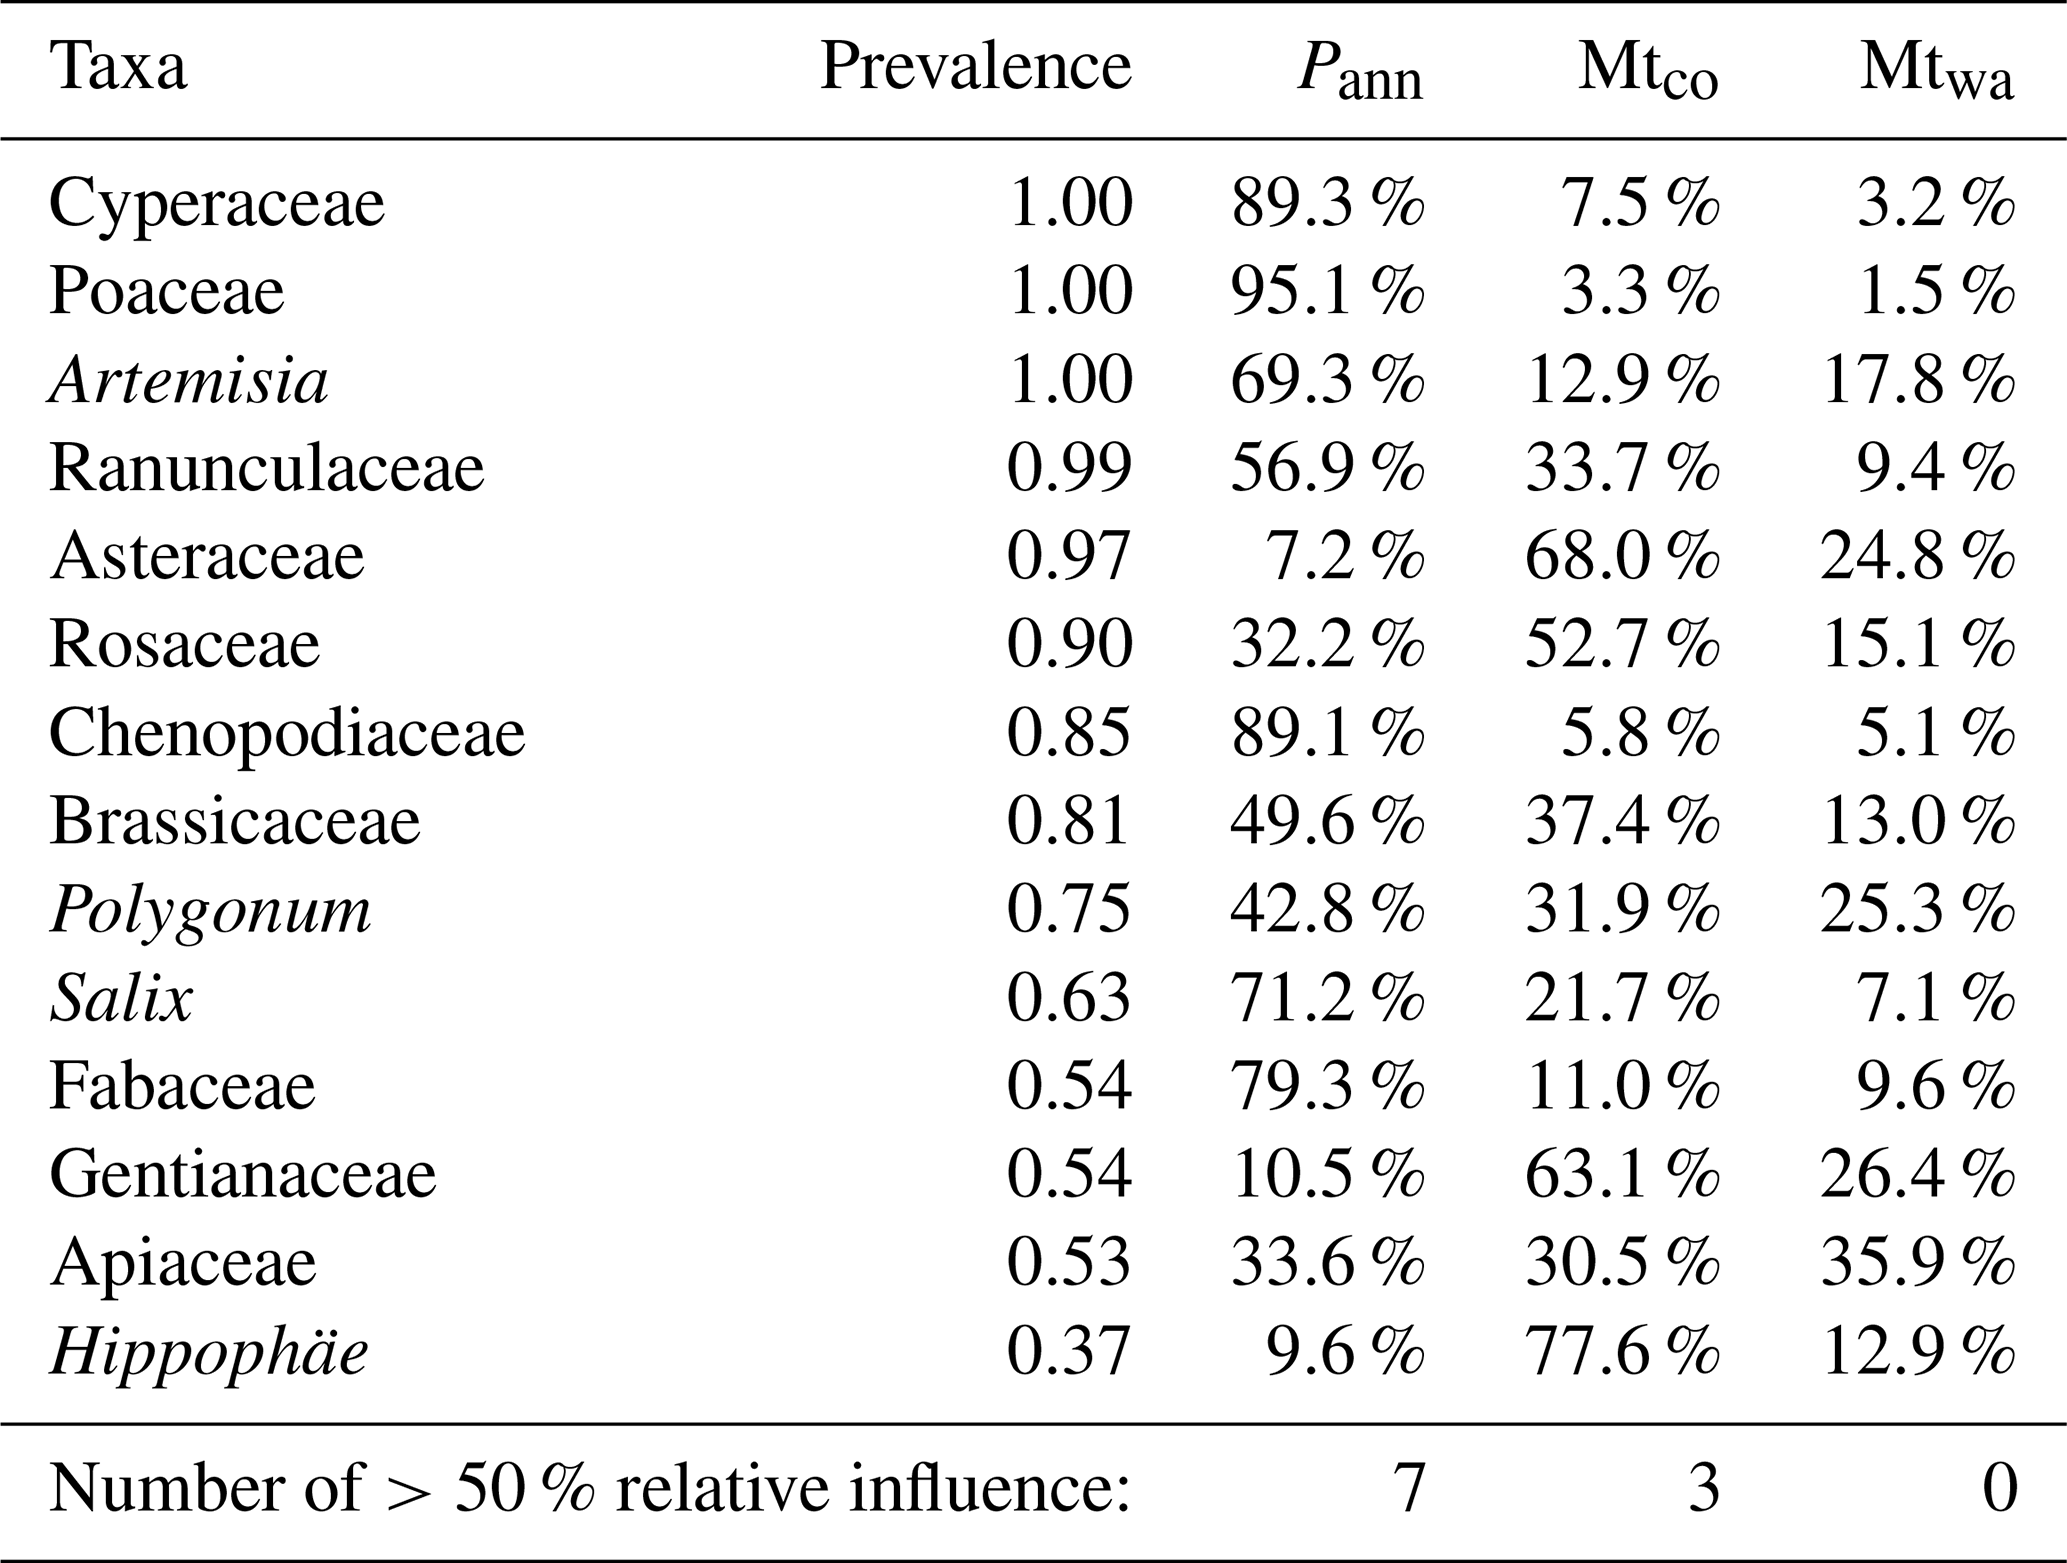

Figure 6Statistical significance test of Pann reconstructions from two lakes using weighted-averaging partial least squares regression (WA-PLS) and the random forest (RF) algorithm. Grey histograms indicate the proportion of variance in the fossil pollen spectra explained by random variables (999 times), and the dotted red line is the 95 % quantile, the dotted black line is the variance in the pollen explained by the first PCA axis, and the solid black line is the explanation by the reconstructed Pann.
Numerical analyses reveal that Pann is the most important climatic determinant of pollen distribution in the eastern Tibetan Plateau; hence, Pann is selected as the target variable in the calibration set to assess the predictive power of this pollen dataset. Both approaches (WA-PLS and RF) perform well with low RMSEP values (the root mean square error of prediction) and high r2 values (coefficient of determination between observed and predicted climatic variables; Fig. 5). However, the plots of observed vs. predicted Pann show a overestimate of Pann for arid sites and an underestimate for wet sites (Fig. 5). Hence, the inevitable “edge effects” should be treated with caution. Nevertheless, reconstructions covering ca. 400–500 mm Pann should be reliable because of the low bias in the central part of the Pann gradient (Fig. 5).
Although the model performance of RF is not any better than that of WA-PLS, the reconstruction produced by RF might be more reliable as suggested by the statistical significance testing and comparison with modern observed Pann for the two lakes (Koucha Lake and Xingxinghai Lake). Statistical significance testing shows that the proportion of variance in the fossil data explained by the WA-PLS reconstruction is less than the 95 % quantile of the variance explained by a reconstruction based on random environmental variables (999 trials) for the two lakes, while reconstructions produced by RF explain a higher proportion (Fig. 6). In other words, reconstructions produced by RF might be controlled by the major pollen components because the explained proportion of variance in the fossil pollen spectra is closer to that explained by the first principal components analysis (PCA) axis, while reconstructions by WA-PLS could be influenced more by the pollen taxa with low abundances (Fig. 6). The hypothesis that WA-PLS is influenced more by low-abundance pollen taxa is supported by the high variation in reconstructed Pann among the fossil pollen samples (Fig. 7). Relative to reconstructions of WA-PLS, results of RF have lower temporal variation and fewer outliers, and the Pann predicted by RF is closer to the observed Pann for the two lakes (Koucha Lake, 500 mm; Xingxinghai Lake, 350 mm) than that by WA-PLS.
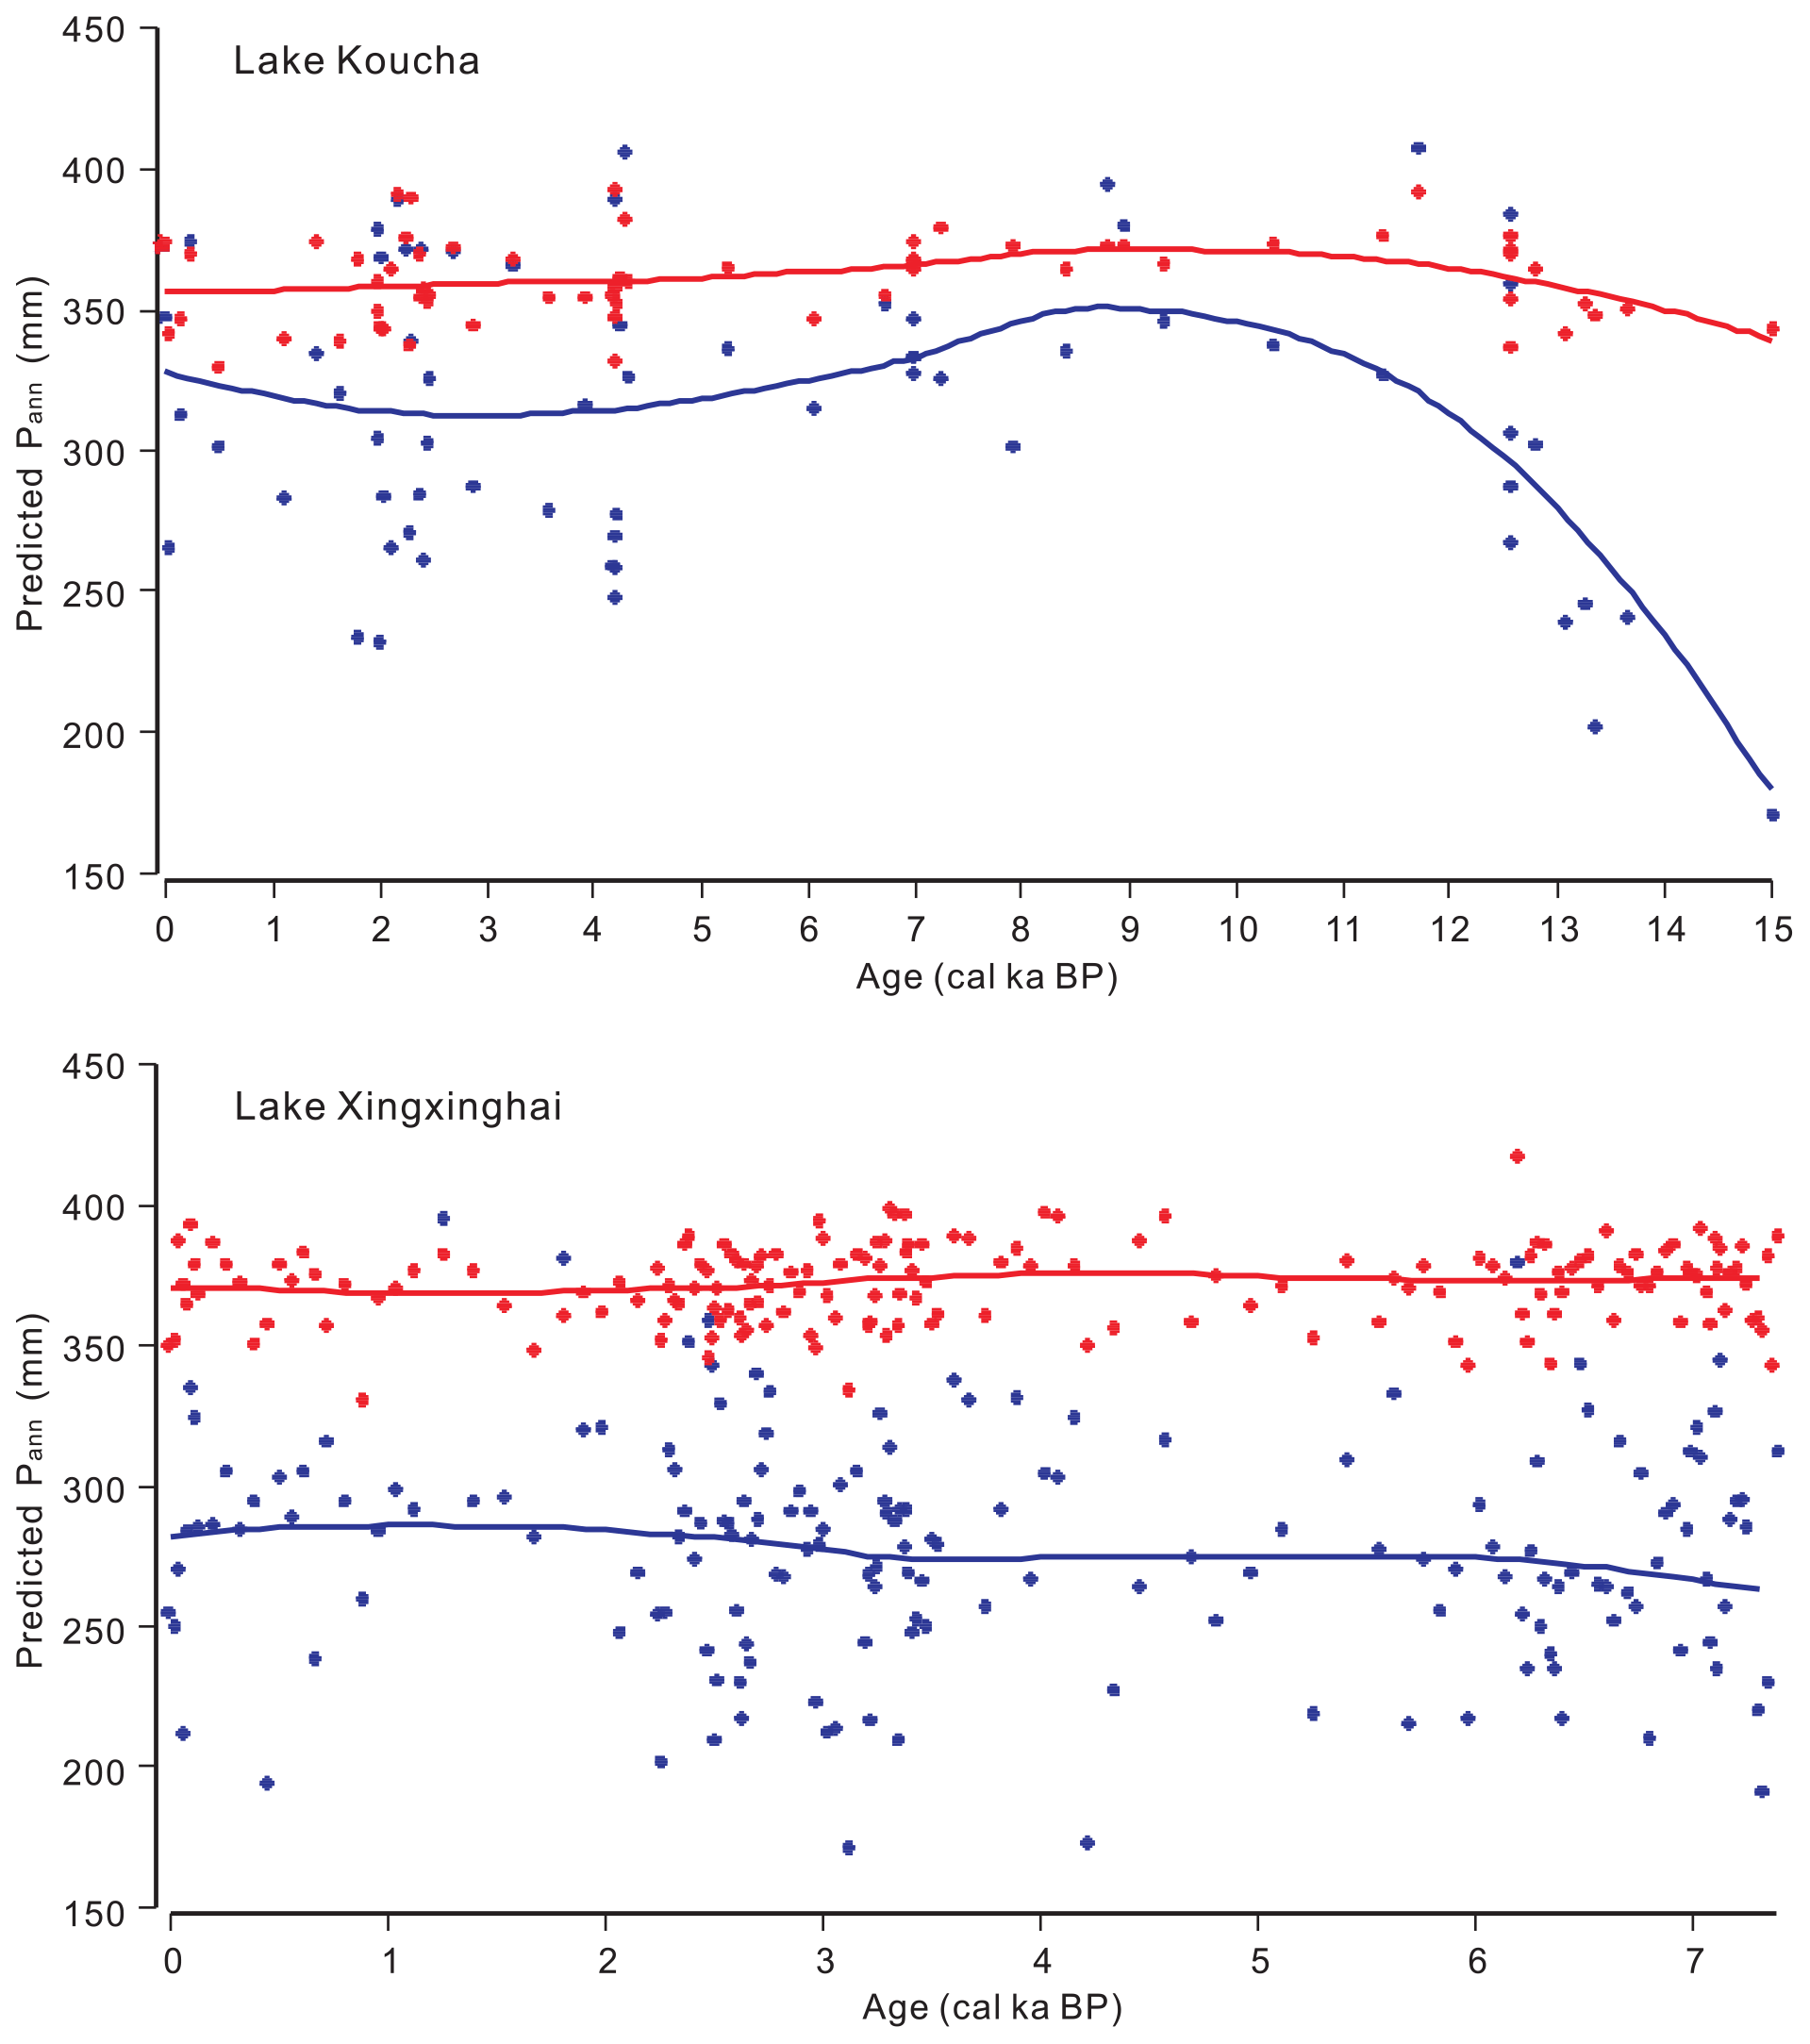
Figure 7Annual precipitation (Pann; mm) reconstructions for two Tibetan lakes using the weighted-averaging partial least squares regression (blue) and random forest algorithm (red). The curves are fitted by local polynomial regression (LOESS).
Pollen datasets including both pollen counts and percentages for each sample together with their locations and climatic data are available at the National Tibetan Plateau Data Center (TPDC; Cao et al., 2021; https://doi.org/10.11888/Paleoenv.tpdc.271191).
We present a regional modern pollen dataset extracted from lake surface sediments from the alpine meadow vegetation type on the Tibetan Plateau (eastern Tibetan Plateau; 31.6–35.5∘ N, 91.8–99.8∘ E), including pollen counts and pollen percentages, together with their positions and climatic data. Numerical analyses reveal that Pann is the most important climatic determinant for pollen distribution in the dataset. Our dataset behaves reliably and has good predictive power for past moisture reconstruction, and the random forest algorithm is a potentially reliable approach in pollen-based past environment reconstruction.
In addition, our open-access dataset can fill the geographical gap left by the two previous modern pollen datasets (lake surface sediments; Shen et al., 2006; Herzschuh et al., 2010) on the eastern Tibetan Plateau. By combining our dataset here with the previous ones (e.g. Herzschuh et al., 2019), a comprehensive modern pollen dataset is created covering vegetation types from the alpine forest to alpine steppe on the Tibetan Plateau, and it will greatly improve the reliability of past vegetation reconstructions and climate estimations.
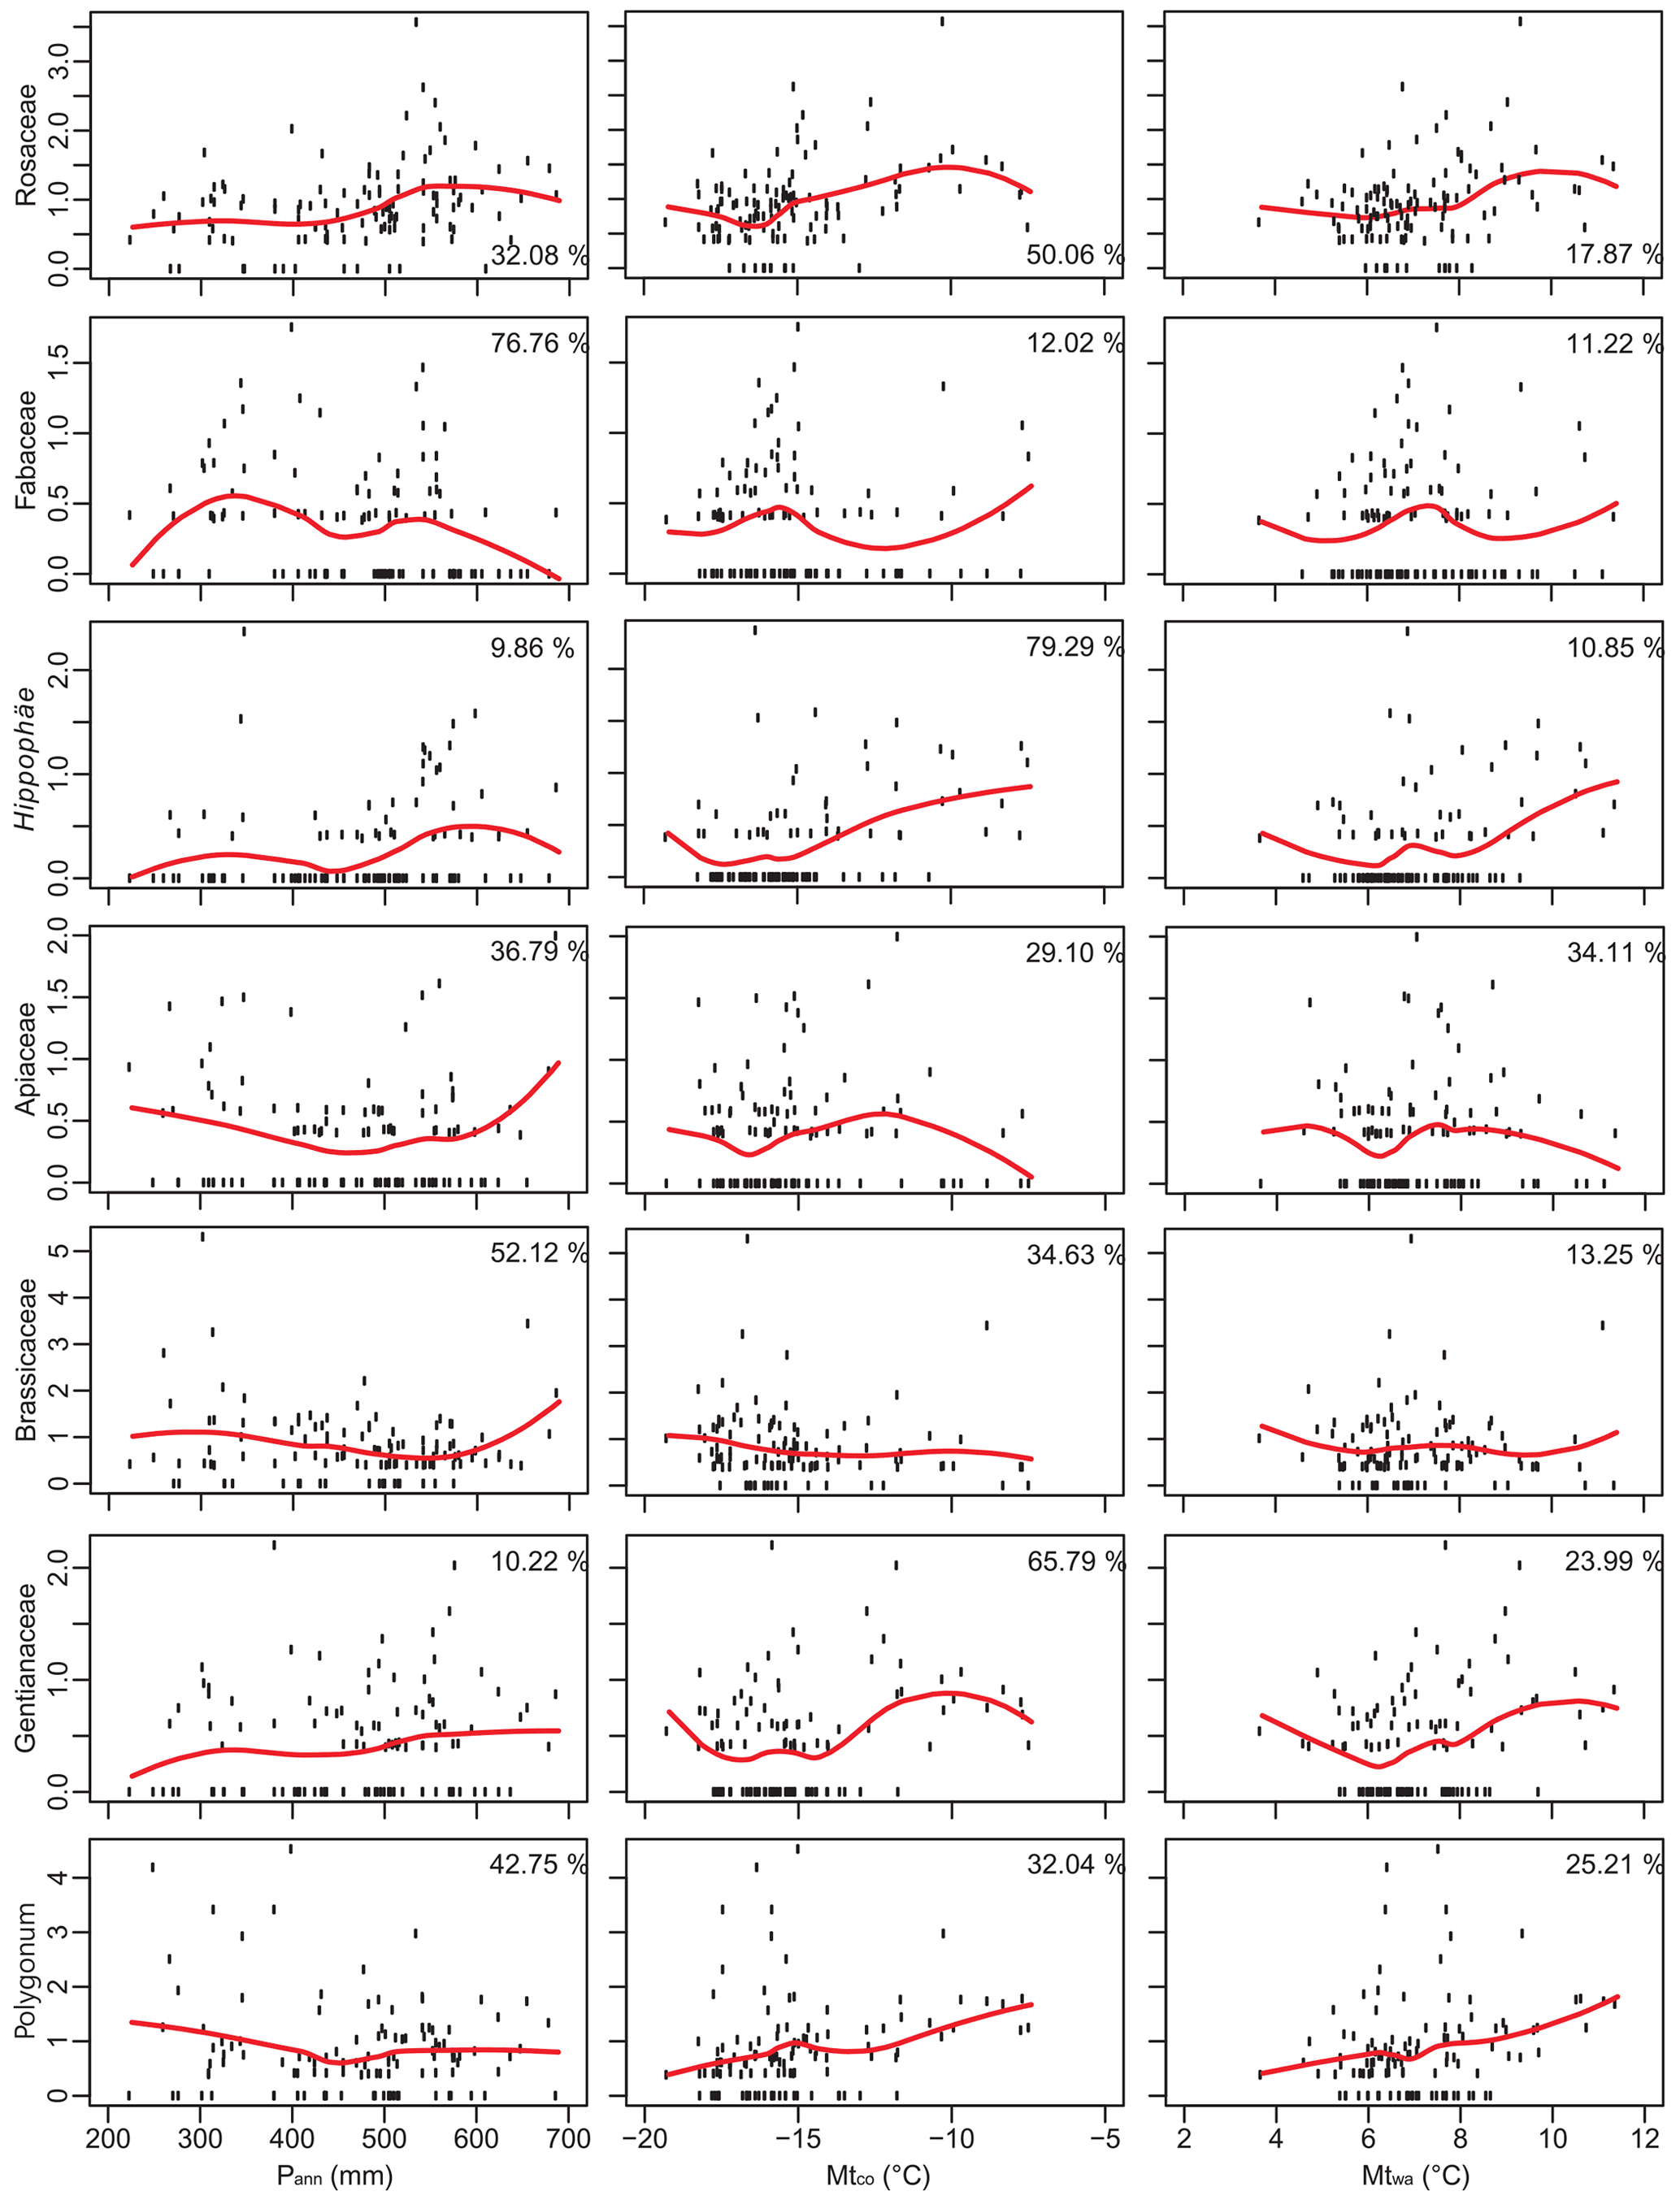
Figure A1BRT-modelled climate influences on pollen (seven common or minor taxa) percentages. The pollen responses to three climatic variables (red curves) are fitted with a local polynomial regression (LOESS).
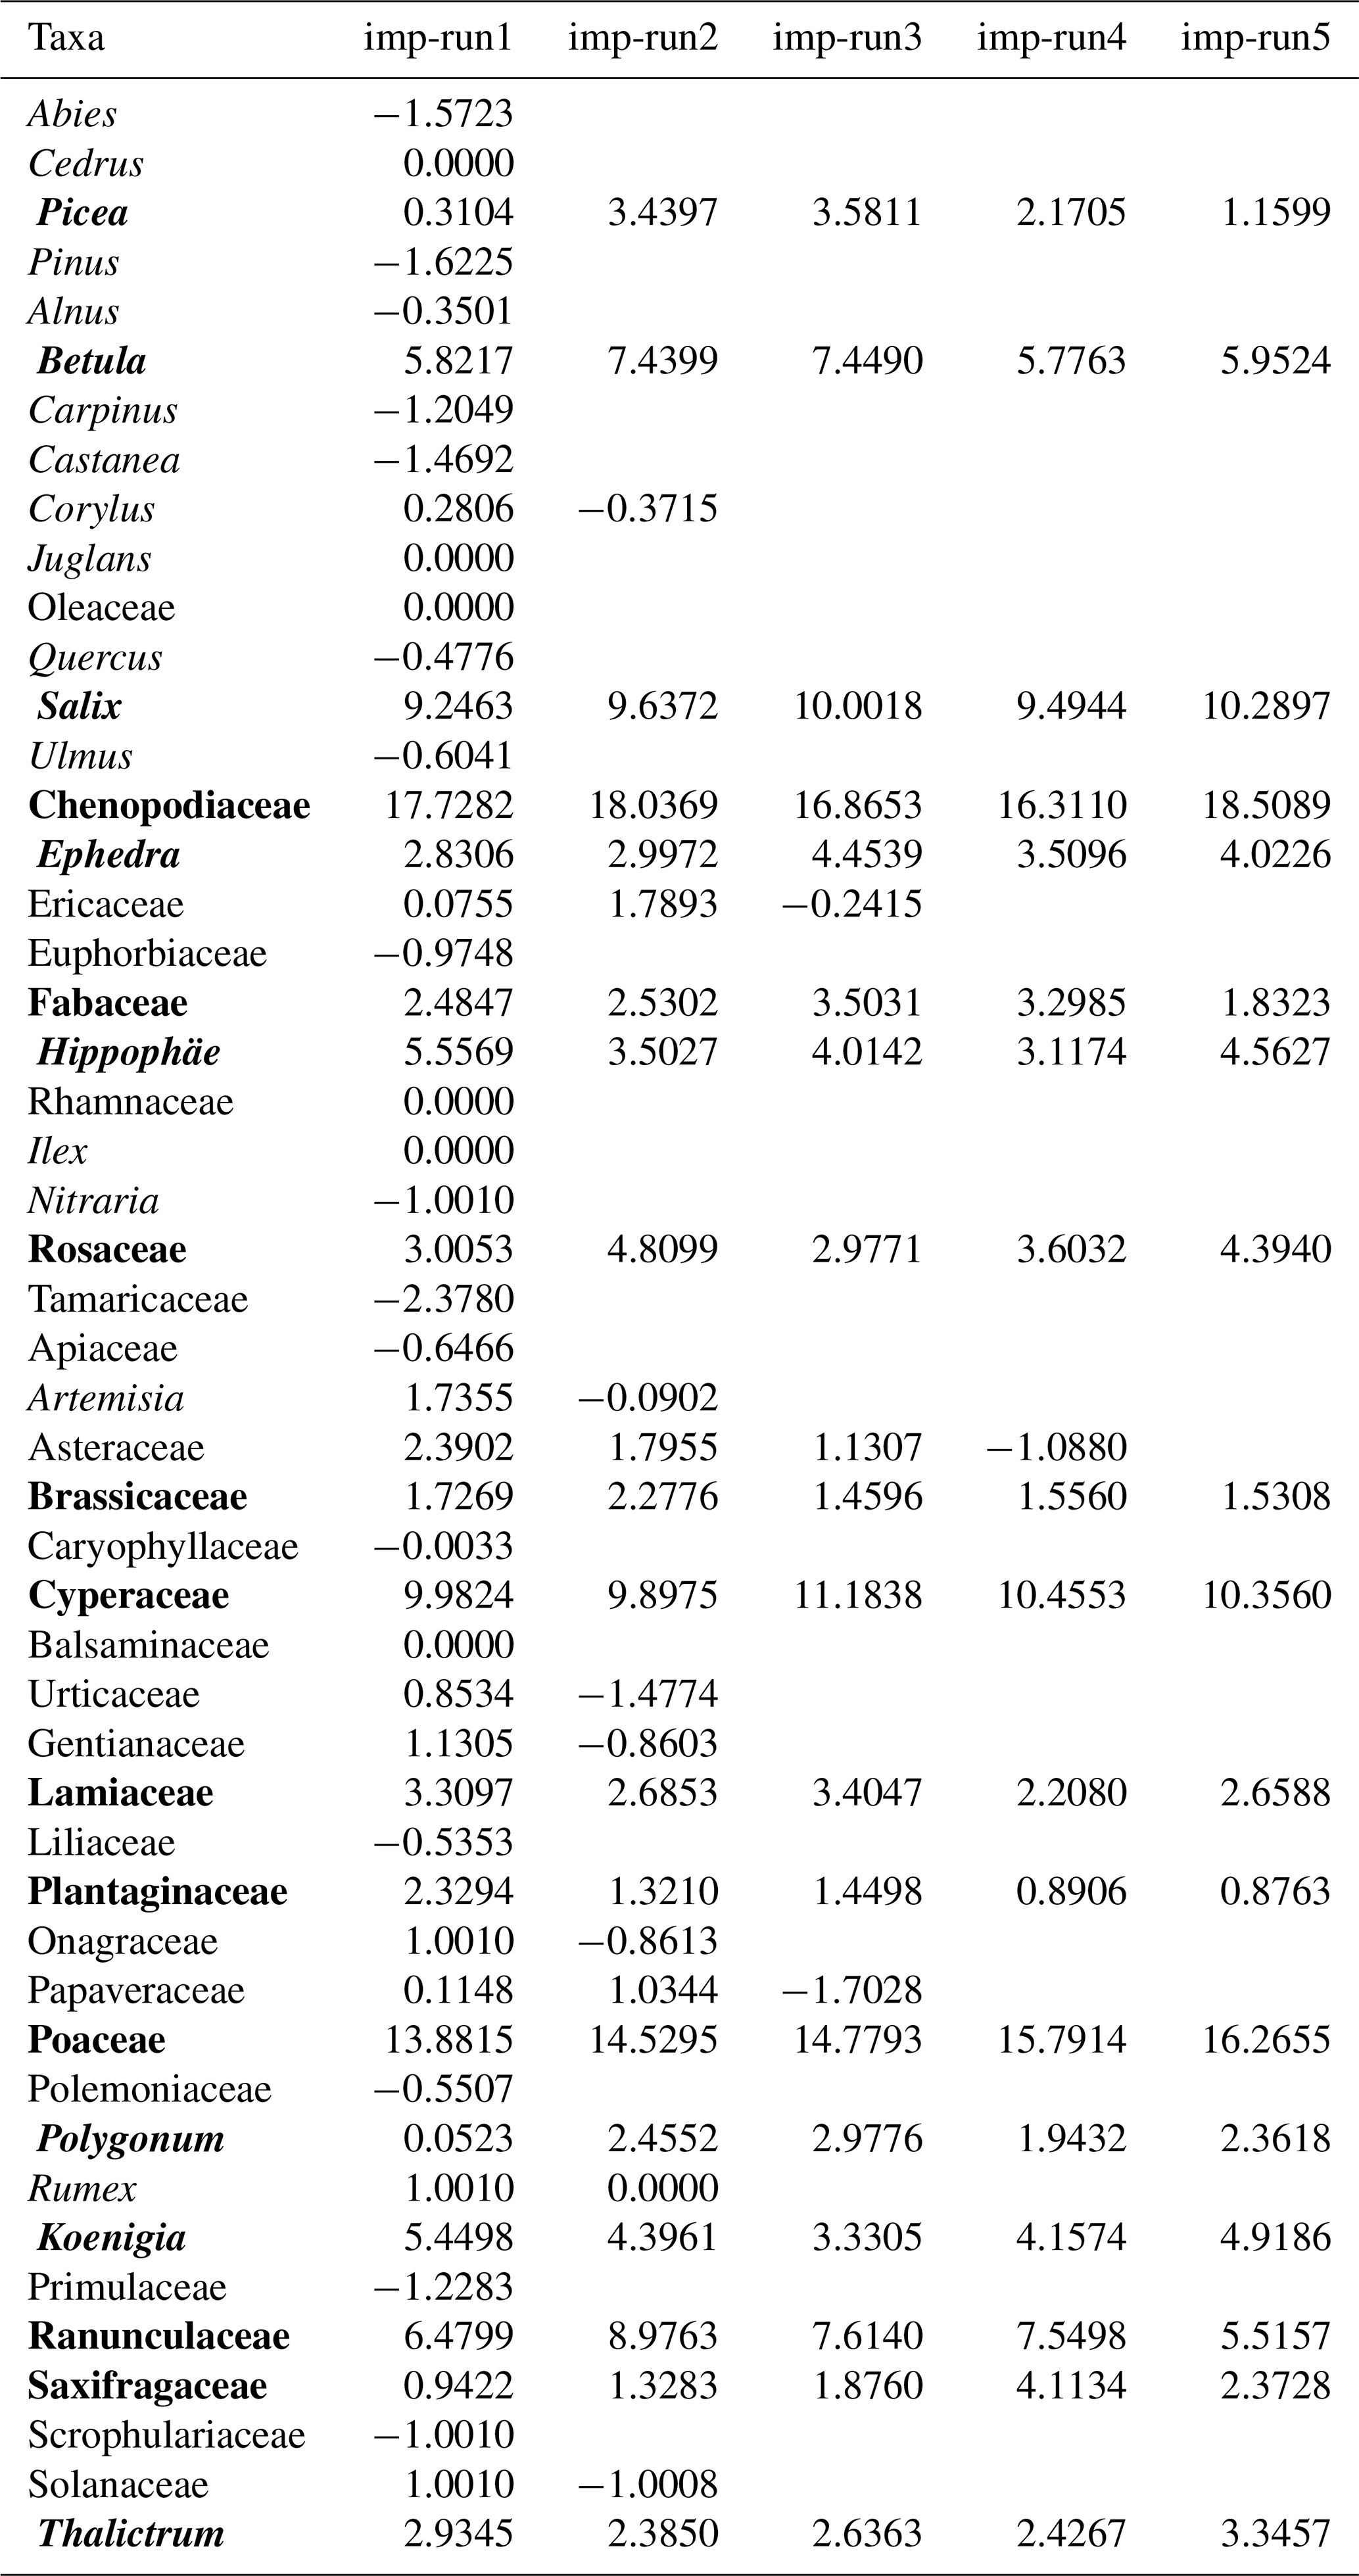
Table B1Importance (imp) of pollen taxa on the spatial distribution of Pann was repeatedly assessed by the random forest algorithm (RF). Shown in bold are the pollen taxa selected for the Pann reconstruction based on RF.
XC and JN designed the pollen dataset. XC and KL collected pollen samples. XY and FT compiled the pollen identification and counting. XC and FT performed numerical analyses and organized the manuscript, and LL and NW prepared the figures. All authors discussed the results and contributed to the final paper.
The authors declare that they have no conflict of interest.
Publisher's note: Copernicus Publications remains neutral with regard to jurisdictional claims in published maps and institutional affiliations.
The authors would like to express their gratitude to Xiaoyi Wang (Institute of Tibetan Plateau Research, CAS) who provided help with the random forest analysis and to Cathy Jenks who provided help with language editing.
The sample collection and research were supported by the National Natural Science Foundation of China (grant nos. 41877459 and 41930323), the Basic Science Center for Tibetan Plateau Earth System (BSCTPES, NSFC project no. 41988101), CAS Pioneer Hundred Talents Program (Xianyong Cao), and Pan-Third Pole Environment Study for a Green Silk Road of the CAS Strategic Priority Research Program (grant no. XDA20090000).
This paper was edited by Hannes Grobe and reviewed by two anonymous referees.
Birks, H. J. B., Heiri, O., Seppä, H., and Bjune, A. E.: Strengths and weaknesses of quantitative climate reconstructions based on late-Quaternary biological proxies, Open Ecol. J., 3, 68–110, https://doi.org/10.1016/j.quaint.2012.07.228, 2010.
Cao, X., Tian, F., and Ding, W.: Improving the quality of pollen-climate calibration-sets is the primary step for ensuring reliable climate reconstructions, Sci. Bull., 63, 1317–1318, https://doi.org/10.1016/j.scib.2018.09.007, 2018.
Cao, X., Tian, F., Li, K., and Ni, J.: Atlas of pollen and spores for common plants from the east Tibetan Plateau, National Tibetan Plateau Data Center, https://doi.org/10.11888/Paleoenv.tpdc.270735, 2020.
Cao, X., Tian, F., Li, K., and Ni, J.: Lake sediment-surface pollen dataset for alpine meadow in eastern Tibetan Plateau [data set], National Tibetan Plateau Data Center, https://doi.org/10.11888/Paleoenv.tpdc.271191, 2021.
Cao, X. Y., Herzschuh, U., Telford, R. J., and Ni, J.: A modern pollen-climate dataset from China and Mongolia: assessing its potential for climate reconstruction, Rev. Palaeobot. Palynol., 211, 87–96, https://doi.org/10.1016/j.revpalbo.2014.08.007, 2014.
Fægri, K. and Iversen, J.: Textbook of pollen analysis, Munksgaard, Copenhagen, 1975.
He, J., Yang, K., Tang, W., Lu, H., Qin, J., Chen, Y., and Li, X.: The first high-resolution meteorological forcing dataset for land process studies over China, Sci. Data, 7, 25, https://doi.org/10.1038/s41597-020-0369-y, 2020.
Herzschuh, U., Birks, H. J. B., Mischke, S., Zhang, C., and Böhner, J.: A modern pollen-climate calibration set based on lake sediments from the Tibetan Plateau and its application to a Late Quaternary pollen record from the Qilian Mountains, J. Biogeogr., 37, 752–766, https://doi.org/10.1111/j.1365-2699.2009.02245.x, 2010.
Herzschuh, U., Kramer, A., Mischke, S., and Zhang, C.: Quantitative climate and vegetation trends since the late glacial on the northeastern Tibetan Plateau deduced from Koucha Lake pollen spectra, Quaternary Res., 71, 162–171, https://doi.org/10.1016/j.yqres.2008.09.003, 2009.
Herzschuh, U., Cao, X., Laepple, T., Dallmeyer, A., Telford, R., Ni, J., Chen, F., Kong, Z., Liu, G., Liu, K.-B., Liu, X., Stebich, M., Tang, L., Tian, F., Wang, Y., Wischnewski, J., Xu, Q., Yan, S., Yang, Z., Yu, G., Zhang, Y., Zhao, Y., and Zheng, Z.: Position and orientation of the westerly jet determined Holocene rainfall patterns in China, Nat. Commun., 10, 2376, https://doi.org/10.1038/s41467-019-09866-8, 2019.
Hijmans, R.J., Phillips, S., Leathwick, J., and Elith, J.: Dismo: Species Distribution Modeling, version 1.0-12, available at: https://cran.r-roject.org/web/packages/dismo/ (last access: June 2020), 2015.
Hill, M. O. and Gauch, H. G.: Detrended correspondence analysis: an improved ordination technique, Vegetatio, 42, 41–58, https://doi.org/10.1007/BF00048870, 1980.
Juggins, S.: Rioja: analysis of Quaternary Science Data version 0.7-3, available at: http://cran.r-project.org/web/packages/rioja/index.html (last access: June 2020), 2012.
Juggins, S. and Birks, H. J. B.: Quantitative environmental reconstructions from biological data, in: Birks, H. J. B., Lotter, A. F., Juggins, S., and Smol, J. P., Tracking environmental change using lake sediments (vol. 5): Data handling and numerical techniques, Springer, Dordrecht, 431–494, 2012.
Li, J. F., Xie, G., Yang, J., Ferguson, D. F., Liu, X. D., Liu, H., and Wang, Y. F.: Asian Summer Monsoon changes the pollen flow on the Tibetan Plateau, Earth-Sci. Rev., 202, 103114, https://doi.org/10.1016/j.earscirev.2020.103114, 2020.
Liaw, A.: randomForest: Breiman and Cutler's Random Forests for Classification and Regression, available at: https://cran.r-project.org/web/packages/randomForest/index.html (last access: June 2020), 2018.
Ma, Q., Zhu, L., Wang, J., Ju, J., Lü, X., Wang, Y., Guo, Y., Yang, R., Kasper, T., Haberzettl, T., and Tang, L.: Artemisia/Chenopodiaceae ratio from surface lake sediments on the central and western Tibetan Plateau and its application, Palaeogeogr. Palaeocl., 479, 138–145, https://doi.org/10.1016/j.palaeo.2017.05.002, 2017.
Maher, L. J.: Statistics for microfossil concentration measurements employing samples spiked with marker grains, Rev. Palaeobot. Palynol., 32, 153–191, https://doi.org/10.1016/0034-6667(81)90002-6, 1981.
Nychka, D., Furrer, R., Paige, J., and Sain, S.: fields: Tools for spatial data, version 9.6.1, available at: https://cran.r-project.org/web/packages/fields/ (last access: June 2020), 2019.
Oksanen, J., Blanchet, F. G., Friendly, M., Kindt, R., Legendre, P., McGlinn, D., Minchin, P. R., O'Hara, R. B., Simpson, G. L., Solymos, P., Stevens, M. H. H., Szoecs, E., and Wagner, H.: vegan: Community Ecology Package, version 2.5-4, available at: https://cran.r-project.org/web/packages/vegan/index.html (last access: June 2020), 2019.
Prentice, I. C.: Multidimensional scaling as a research tool in Quaternary palynology: a review of theory and methods, Rev. Palaeobot. Palynol., 31, 71–104, https://doi.org/10.1016/0034-6667(80)90023-8, 1980.
R Core Team: R, A language and environment for statistical computing, R Foundation for Statistical Computing, Vienna, 2019.
Shen, C., Liu, K. B., Tang, L., and Overpeck, J. T.: Quantitative relationships between pollen rain and climate in the Tibetan Plateau, Rev. Palaeobot. Palynol., 140, 61–77, https://doi.org/10.1016/j.revpalbo.2006.03.001, 2006.
Sugita, S.: A model of pollen source area for an entire lake surface, Quaternary Res., 39, 369–244, https://doi.org/10.1006/qres.1993.1027, 1993.
Tang, L., Mao, L., Shu, J., Li, C., Shen, C., and Zhou, Z.: Atlas of Quaternary pollen and spores in China, Science Press, Beijing, 2017.
Telford, R. J.: palaeoSig: Significance tests for palaeoenvironmental reconstructions, version 1.1-2, available at: http://cran.r-project.org/web/packages/palaeoSig/index.html (last access: June 2020), 2013.
Telford, R. J. and Birks, H. J. B.: Effect of uneven sampling along an environmental gradient on transfer-function performance, J. Palaeolimnol., 46, 99–106, 2011.
ter Braak, C. J. F. and Prentice, I. C.: A theory of gradient analysis, Adv. Ecol. Res., 18, 271–317, https://doi.org/10.1016/S0065-2504(08)60183-X, 1988.
ter Braak, C. J. F. and Verdonschot, P. F. M.: Canonical correspondence analysis and related multivariate methods in aquatic ecology, Aquat. Sci., 57, 255–289, https://doi.org/10.1007/BF00877430, 1995.
Tian, F., Xu, Q., Li, Y., Cao, X., Wang, X., and Zhang, L.: Pollen assemblage characteristics of lakes in the monsoon fringe area of China, Chinese Sci. Bull., 53, 3354–3363, https://doi.org/10.1007/s11434-005-0408-2, 2008.
Wang, B.: The Asian Monsoon, Springer, Chichester, 2006.
Wang, F. X., Qian, N. F., Zhang, Y. L., and Yang, H. Q.: Pollen Flora of China, Science Press, Beijing, 1995.
Wu, Z. Y.: The vegetation of China. Science Press, Beijing, 1995 (in Chinese).