the Creative Commons Attribution 4.0 License.
the Creative Commons Attribution 4.0 License.
 | 19 Jul 2021
Long-term variations in actual evapotranspiration over the Tibetan Plateau
Yaoming Ma
Binbin Wang
Lei Zhong
Weiqiang Ma
Xuelong Chen
Zhongbo Su
Actual terrestrial evapotranspiration (ETa) is a key parameter controlling land–atmosphere interaction processes and water cycle. However, spatial distribution and temporal changes in ETa over the Tibetan Plateau (TP) remain very uncertain. Here we estimate the multiyear (2001–2018) monthly ETa and its spatial distribution on the TP by a combination of meteorological data and satellite products. Validation against data from six eddy-covariance monitoring sites yielded root-mean-square errors ranging from 9.3 to 14.5 mm per month and correlation coefficients exceeding 0.9. The domain mean of annual ETa on the TP decreased slightly (−1.45 mm yr−1, p<0.05) from 2001 to 2018. The annual ETa increased significantly at a rate of 2.62 mm yr−1 (p<0.05) in the eastern sector of the TP (long >90∘ E) but decreased significantly at a rate of −5.52 mm yr−1 (p<0.05) in the western sector of the TP (long <90∘ E). In addition, the decreases in annual ETa were pronounced in the spring and summer seasons, while almost no trends were detected in the autumn and winter seasons. The mean annual ETa during 2001–2018 and over the whole TP was 496±23 mm. Thus, the total evapotranspiration from the terrestrial surface of the TP was 1238.3±57.6 km3 yr−1. The estimated ETa product presented in this study is useful for an improved understanding of changes in energy and water cycle on the TP. The dataset is freely available at the Science Data Bank (https://doi.org/10.11922/sciencedb.t00000.00010; Han et al., 2020b) and at the National Tibetan Plateau Data Center (https://doi.org/10.11888/Hydro.tpdc.270995, Han et al., 2020a).
- Article
(7285 KB) - Full-text XML
-
Supplement
(542 KB) - BibTeX
- EndNote


As the birthplace of Asia's major rivers, the Tibetan Plateau (TP), famous as the “Water Tower of Asia”, is essential to the Asian energy and water cycles (Immerzeel et al., 2010; Yao et al., 2012). Along with increasing air temperature, evidence from the changes in precipitation, runoff, and soil moisture indicates that the hydrological cycle of the TP has been intensified during the past century (Yang et al., 2014). Consuming around two-thirds of global terrestrial precipitation, evapotranspiration (ET) is a crucial component that affects the exchange of water and energy between the land surface and the atmosphere (Oki and Kanae, 2006; Fisher et al., 2017). ET is also a key factor modulating regional and global weather and climate. As one essential connecting component between the energy budget and the water cycle in the terrestrial ecosystems (Xu and Singh, 2005), ET and its variations have been drawing more attention worldwide (Xu and Singh, 2005; Li et al., 2014; T. Zhang et al., 2018; Yao et al., 2019; G. Wang et al., 2020). Total evaporation from large lakes of the TP has been quantitatively estimated recently (B. Wang et al., 2020); however, the terrestrial ET on the TP and its spatial and temporal changes remain very uncertain.
Many studies have tried to evaluate ET's temporal and spatial variability across the TP using various methods. The pan evaporation (Epan), which represents the amount of water evaporated from an open circular pan, is the most popular observational data source of ET. Long time series of Epan are often available with good comparability among various regional measurements. Thus, it has been widely used in various disciplines, e.g., meteorology, hydrology, and ecology. Several studies have revealed the trend of Epan on the TP (Zhang et al., 2007; Liu et al., 2011; Shi et al., 2017; C. Zhang et al., 2018; Yao et al., 2019). Although Epan and potential ET suggest the long-term variability in ET according to the complementary relationship (CR) between Epan and actual ET (ETa) (Zhang et al., 2007), these measures cannot precisely depict the spatial pattern of trends in ETa. Recently, several studies applied revised models based on the CR of ET to estimate ETa on the TP (T. Zhang et al., 2018; Ma et al., 2019; G. Wang et al., 2020). Employing only routine meteorological observations without requiring any vegetation and soil information is the most significant advantage of CR models (Szilagyi et al., 2017). However, numerous assumptions and requirements of validations of key parameters limit the application and performance of CR models over different climate conditions. The application of eddy-covariance (EC) technologies in the past decade has dramatically advanced our understanding of the terrestrial energy balance and ETa over various ecosystems across the TP. However, the fetch of the EC observation is on the order of hundreds of meters, thus impeding the ability to capture the plateau-scale variations in ETa. Therefore, finding an effective way to advance the estimation of ETa on the TP is of great importance.
Satellite remote sensing (RS) provides temporally frequent and spatially contiguous measurements of land surface characteristics that affect ET, for example, land surface temperature, albedo, and vegetation index. Satellite RS also offers the opportunity to retrieve ET over a heterogeneous surface (Zhang et al., 2010). Multiple RS-based algorithms have been proposed. Among these algorithms, the surface energy balance system (SEBS) proposed by Su (2002) has been widely applied to retrieve land surface turbulent fluxes on the TP (Chen et al., 2013b; Ma et al., 2014; Zou et al., 2018; Zhong et al., 2019; Han et al., 2016, 2017). Chen et al. (2013b) improved the roughness length parameterization scheme for heat transfer in SEBS to expand its modeling applicability over bare ground, sparse canopy, dense canopy, and snow surfaces in the TP. An algorithm for effective aerodynamic roughness length had been introduced into the SEBS model to parameterize subgrid-scale topographical form drag (Han et al., 2015, 2017). This scheme improved the skill of the SEBS model in estimating the surface energy budget over mountainous regions of the TP. A recent advance by Chen et al. (2019) optimized five critical parameters in SEBS using observations collected from 27 sites globally, including 6 sites on the TP, and suggested that the overestimation of the global ET was substantially improved with the use of optimal parameters.
While the spatial and temporal pattern of the ETa in the TP had been investigated in many studies (T. Zhang et al., 2018; G. Wang et al., 2020; Zhang et al., 2007), considerable inconsistencies for both trends and magnitudes of ETa exist due to uncertainties in forcing and parameters used by various models. Thus, in this study, with full consideration of the recent developments in the SEBS model over the TP, we aim to (1) develop an 18-year (2001–2018) ETa product of the TP, along with independent validations against EC observations; (2) quantify the spatiotemporal variability in the ETa in the TP; and (3) uncover the main factors dominating the changes in ETa, using the estimated product.
2.1 Model description
The SEBS model (Su, 2002) was used to derive land surface energy flux components in the present study. The remotely sensed land surface energy balance equation is given by
Rn is net radiation flux (W m−2), H is sensible heat flux (W m−2), LE is latent heat flux (W m−2), and G0 is ground heat flux (W m−2). Note that this equation neglected energy stored in the canopy, energy consumption related to freeze–thaw processes of permafrost and glaciers, etc. This equation is not applicable to any condition where a phase change in water occurs, except the liquid-to-vapor phase change.
The land surface net radiation flux was computed as
where α is the land surface albedo derived from the Moderate Resolution Imaging Spectroradiometer (MODIS) products. Downward shortwave (SWD) and longwave (LWD) radiation was obtained from the China Meteorological Forcing Dataset (CMFD). Land surface temperature (Ts) and emissivity (ε) values were also obtained from MODIS products.
In vegetated areas the soil heat flux, G0, was calculated from the net radiation flux and vegetation cover:
where rs and rc are ratios of ground heat flux and net radiation for surfaces with bare soil and full vegetation, respectively. Fractional vegetation cover (fc) was derived from the normalized difference vegetation index (NDVI). Over water surfaces (NDVI <0 and α<0.47), G0=0.5Rn was used (Chen et al., 2013a; Gao et al., 2011). On glaciers, G0 is negligible (Yang et al., 2011) and G0=0.05Rn.
In the atmospheric surface layer, sensible heat flux and friction velocity were calculated based on the Monin–Obukhov similarity (Stull, 1988),
U is the horizontal wind velocity at a reference height z (m) above the ground surface; θ0 is the potential temperature at the land surface (K); θa is the potential temperature (K) at the reference height z; d0 is the zero-plane displacement height (m); ρ is the air density (kg m−3); Cp is the specific heat for moist air (J kg−1 ∘C−1); κ=0.4 is the von Kármán's constant; u* is the friction velocity; L is the Monin–Obukhov length (m); θv is the potential virtual temperature (K) at the reference height z; ψm and ψh are the stability correction functions for momentum and sensible heat transfer, respectively; and g is the gravity acceleration (m s−2). To account for the form drag caused by subgrid-scale topographical obstacles, effective roughness lengths for momentum (, m) and sensible heat (, m) transfer were introduced into the SEBS model by Han et al. (2017). These modifications are parameterized as follows (Grant and Mason, 1990; Han et al., 2015):
where h is the average height of the subgrid-scale roughness obstacles; λ is the average density of the subgrid-scale roughness elements calculated from digital elevation models; D is the form drag coefficient, and D=0.4 is used for the mountainous areas of the TP as suggested by Han et al. (2015); and z0 m and z0 h are the local-scale roughness lengths for momentum and heat transfer (m), respectively. Detailed calculations can be found in Su (2002). A revised algorithm for z0 h developed by Chen et al. (2013b) was applied as this algorithm outperforms the original scheme of the SEBS model on the TP.
To constraint the actual evapotranspiration, the evaporative fraction was applied in the SEBS model, which is determined by taking energy balance considerations at dry and wet limiting cases. Under the dry-limit condition, the evaporation becomes zero due to the limited supply of available soil moisture, while water vapor evaporates at the potential rate under the wet-limit condition (Su, 2002). The evaporative fraction (Λ) is defined as
After calculating evaporative fraction based on the assumption of dry and wet limits, latent heat flux was calculated by inverting Eq. (9). Finally, latent heat flux was converted to ETa. Details are available in Su (2002) and Chen et al. (2013a). Note that the dry-wet limit assumption did not apply to frozen soil, water, snow, and ice surfaces. The latent heat flux was obtained as the residual of the surface energy balance Eq. (1) after calculating net radiation, sensible heat flux, and ground heat flux when the dry-wet limit assumption is not applicable.
2.2 Data
In situ observations, satellite-based products, and meteorological forcing data were used in this study to estimate monthly ETa over the TP area. The CMFD, which was developed based on the released China Meteorological Administration (CMA) data (He et al., 2020), was used as model input. The CMFD covers the whole landmass of China at a spatial resolution of 0.1∘ and a temporal resolution of 3 h. The CMFD dataset was established through the fusion of in situ observations, remote sensing products, and reanalysis datasets. In particular, the dataset benefits from the merging of the observations at about 700 CMA weather stations and by using the Global Energy and Water Cycle Experiment – Surface Radiation Budget (GEWEX-SRB) shortwave radiation dataset (Pinker and Laszlo, 1992). The GEWEX-SRB data have not been used in any other reanalysis dataset. In addition, independent datasets observed in western China, where weather stations are scarce, were used to evaluate the CMFD. This includes data collected through the Heihe Watershed Allied Telemetry Experimental Research (HiWATER) (Li et al., 2013) and the Coordinated Enhanced Observing Period (CEOP) Asia–Australia Monsoon Project (CAMP) (Ma et al., 2003). The CMFD dataset has been validated against in situ meteorological observations and compared with other reanalysis datasets on the TP, demonstrating that it is one of the best meteorological forcing datasets over the TP area (Zhou et al., 2016; Xie et al., 2017; B. Wang et al., 2020). Therefore, it is suitable for this study to drive the SEBS model. Detailed information for the CMFD dataset is listed in Table 1.
Table 1Input datasets used in this study. Note that DEM stands for digital elevation model, MOD11C3 is the short name of the MODIS/Terra land surface temperature and emissivity monthly L3 global products, MOD09CMG is the short name of the MODIS/Terra surface reflectance daily L3 global products, MOD13C2 is the short name of the MODIS/Terra vegetation indices' monthly L3 global products, ASTER GDEM stands for the Advanced Spaceborne Thermal Emission and Reflection Radiometer (ASTER) global DEM (GDEM), GLAS stands for the Geoscience Laser Altimeter System, and SPOT stands for the Systeme pour l’Observation de la Terre sensor.

MODIS monthly land surface products, including land surface temperature and emissivity, land surface albedo, and vegetation index, provide land surface conditions for the SEBS model. Detailed information on MODIS land surface variables is listed in Table 1. The values of land surface variables in the MODIS monthly products are derived by compositing and averaging the values from the corresponding month of MODIS daily files. Validations of MODIS land surface temperature and albedo against in situ observations on the TP suggest a high quality of MODIS land surface products with low biases and small root-mean-square errors (Chen et al., 2014; Wang et al., 2004; Ma et al., 2011).
In situ EC data observed at six flux stations on the TP were used to validate model results. Locations of the six observation sites are illustrated in Fig. 1, and detailed descriptions for these six sites are shown in Table 2. The instrumental setup at each site consists of an EC system comprising a sonic anemometer (CSAT3, Campbell Scientific Inc) and an open-path gas analyzer (LI-7500, LI-COR); a four-component radiation flux system (CNR-1, Kipp & Zonen), installed at a height of 1.5 m; a soil heat flux plate (Hukseflux, HFP01), buried in the soil at a depth of 0.1 m; and soil moisture and temperature probes, buried at a depth of 0.05, 0.10, and 0.15 m, respectively (Han et al., 2017). The EC data were processed with the EC software package TK3 (Mauder and Foken, 2015). The main post-processing procedures of the EC raw data were as follows: spike detection, coordinate rotation, spectral loss correction, frequency response corrections (Moore, 1986), and corrections for density fluctuations (Webb et al., 1980). The ground heat flux was obtained by summing the flux value observed by the heat flux plate and the energy storage in the layer above the heat flux plate (Han et al., 2016). A more comprehensive dataset including the EC data used in this work has been published and is freely available (Ma et al., 2020).
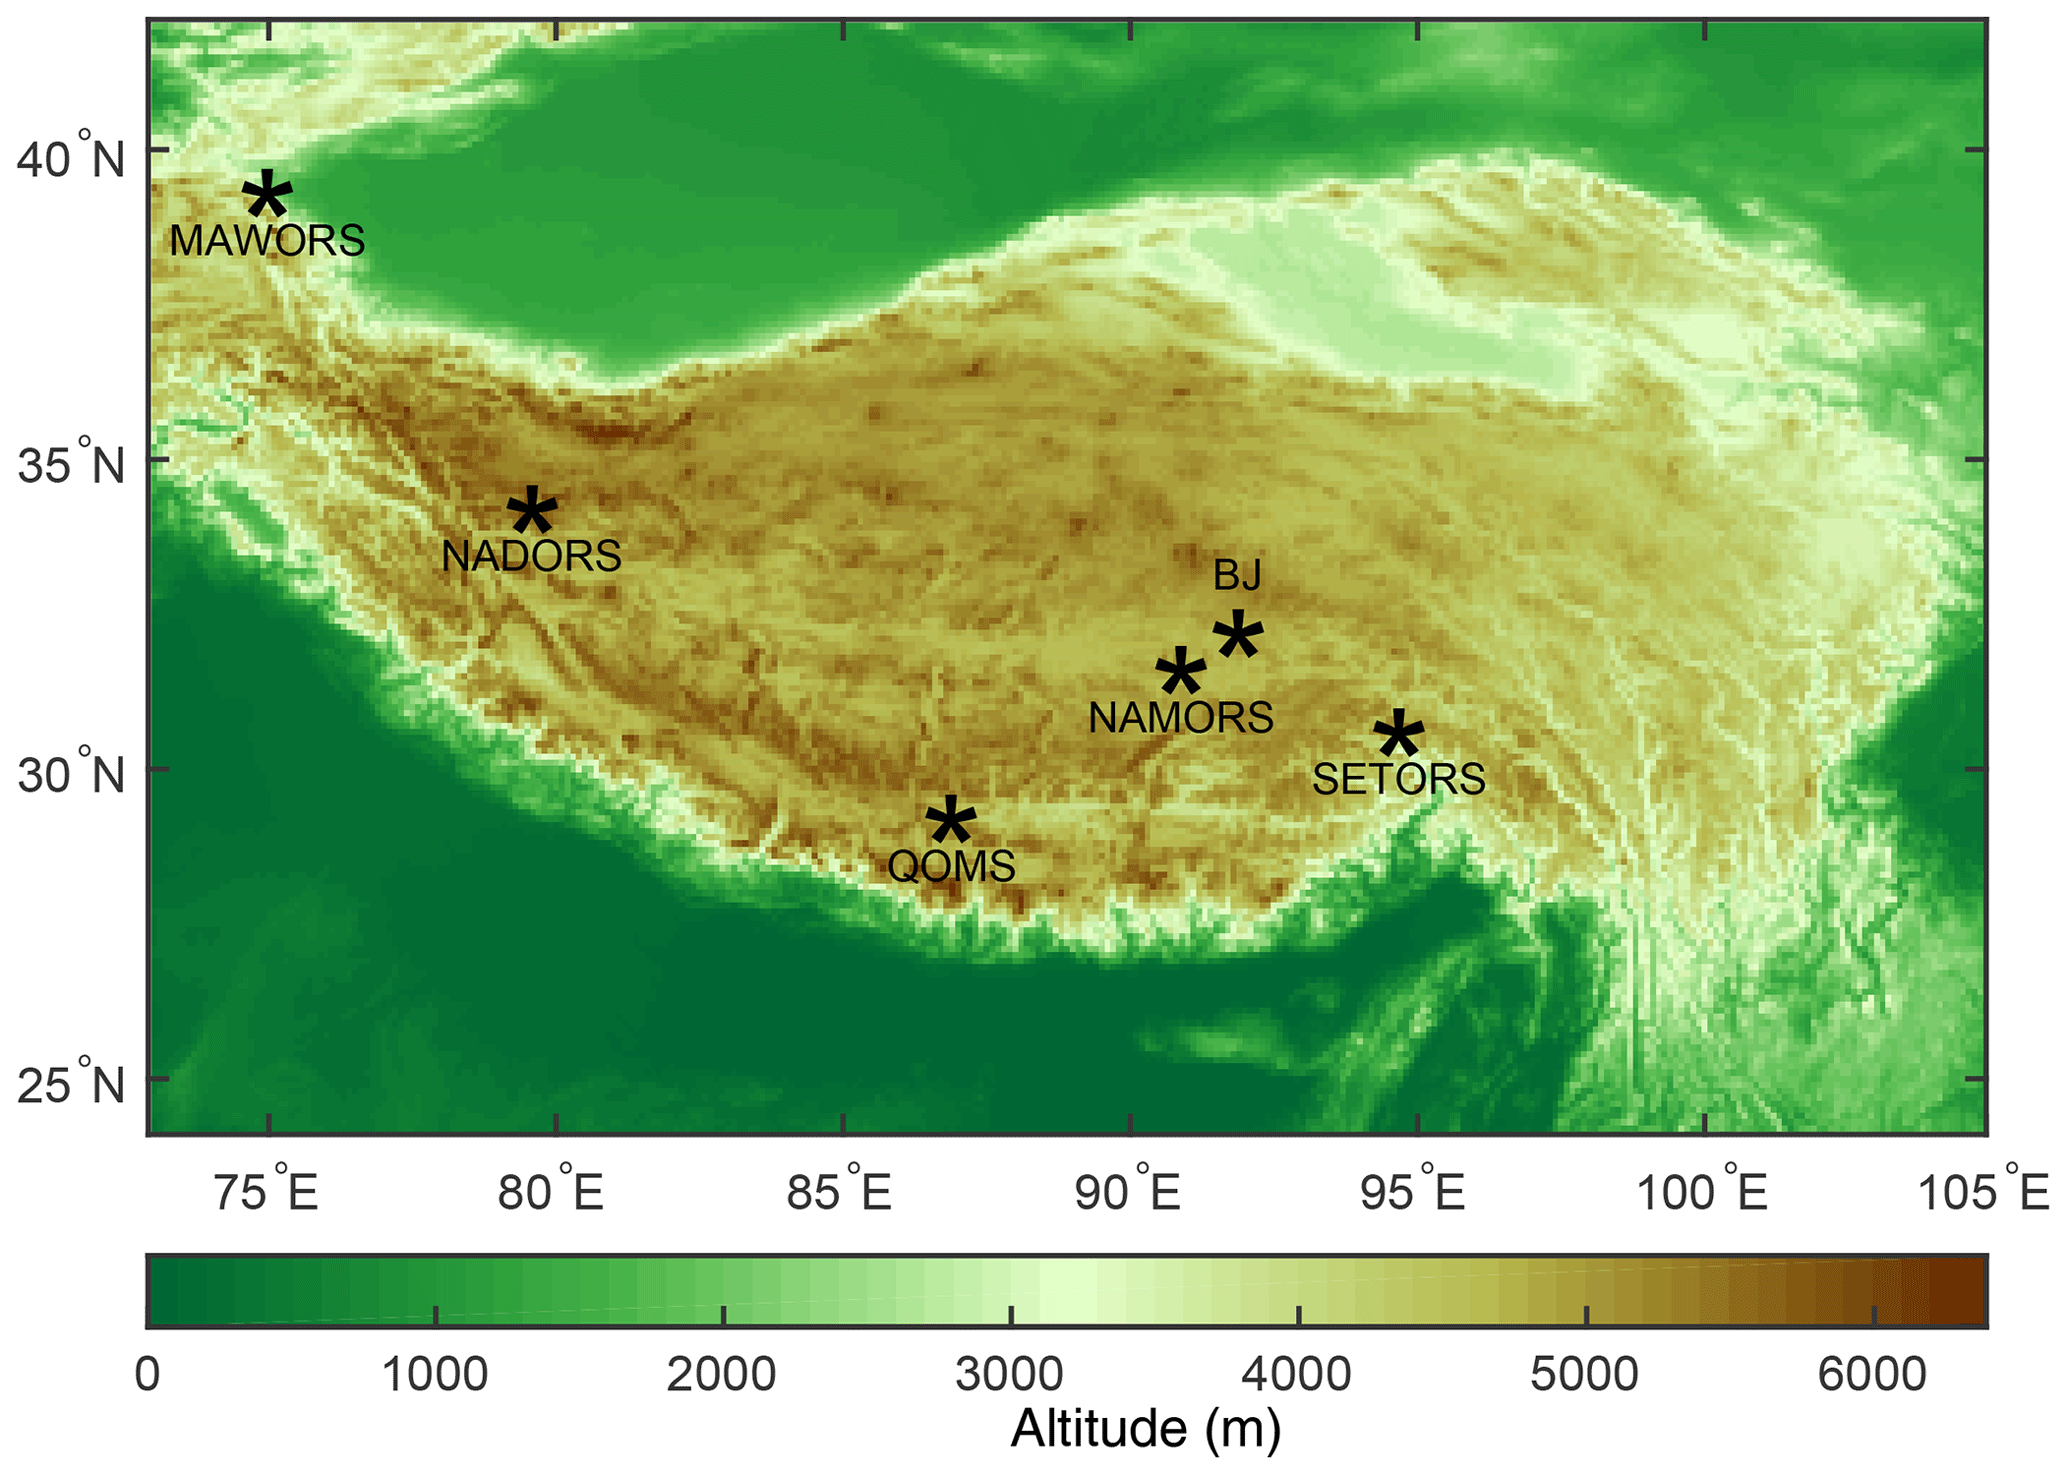
Figure 1Locations of the six flux tower sites (marked by pentagrams) on the TP. The legend of the color map is elevation above mean sea level in meters.

The 3-hourly CMFD data were averaged into daily and then into monthly data to be consistent with MODIS products in terms of temporal resolution. Daily land surface albedo has been averaged into a monthly variable. MODIS land surface products and canopy height data were remapped onto the CMFD's grid. Monthly EC data and in situ meteorological observations, which are used for model validation, were generated from half-hourly variables.
2.3 Model evaluation metrics and data analysis methods
The model performance was assessed using the Pearson correlation coefficient (R), the root-mean-square error (RMSE), and the mean bias (MB) between the estimated and observed monthly ETa at the six stations on the TP.
The least-square regression technique was used to detect the long-term linear annual trends in ETa values. The linear model to simulate ETa values (Yt) against time (t) is defined as below, and the slope of the linear equation (b) is taken as the changing trend,
The Student's t test, having an n−2 degree of freedom (n is the number of samples), was used to evaluated the statistical significance of the linear trends, and only tests with a p value less than 0.05 were selected as having passed the significance test.
3.1 Validation against flux tower observations
The SEBS-estimated ETa was validated against EC observations at six flux stations on the TP at a monthly scale (Fig. 2). The SEBS model is capable of capturing both the magnitude and seasonal variation in the monthly ETa signal at all the six stations. The correlation coefficients are all larger than 0.9 and have passed the significance test at the p=0.01 level. RMSE values range from 9.3 to 14.5 mm per month, with the minimum at the BJ station and the maximum at the SETORS station. The MB values are all negative except at the NADORS station, which means the SEBS model slightly underestimated ETa values on the TP.
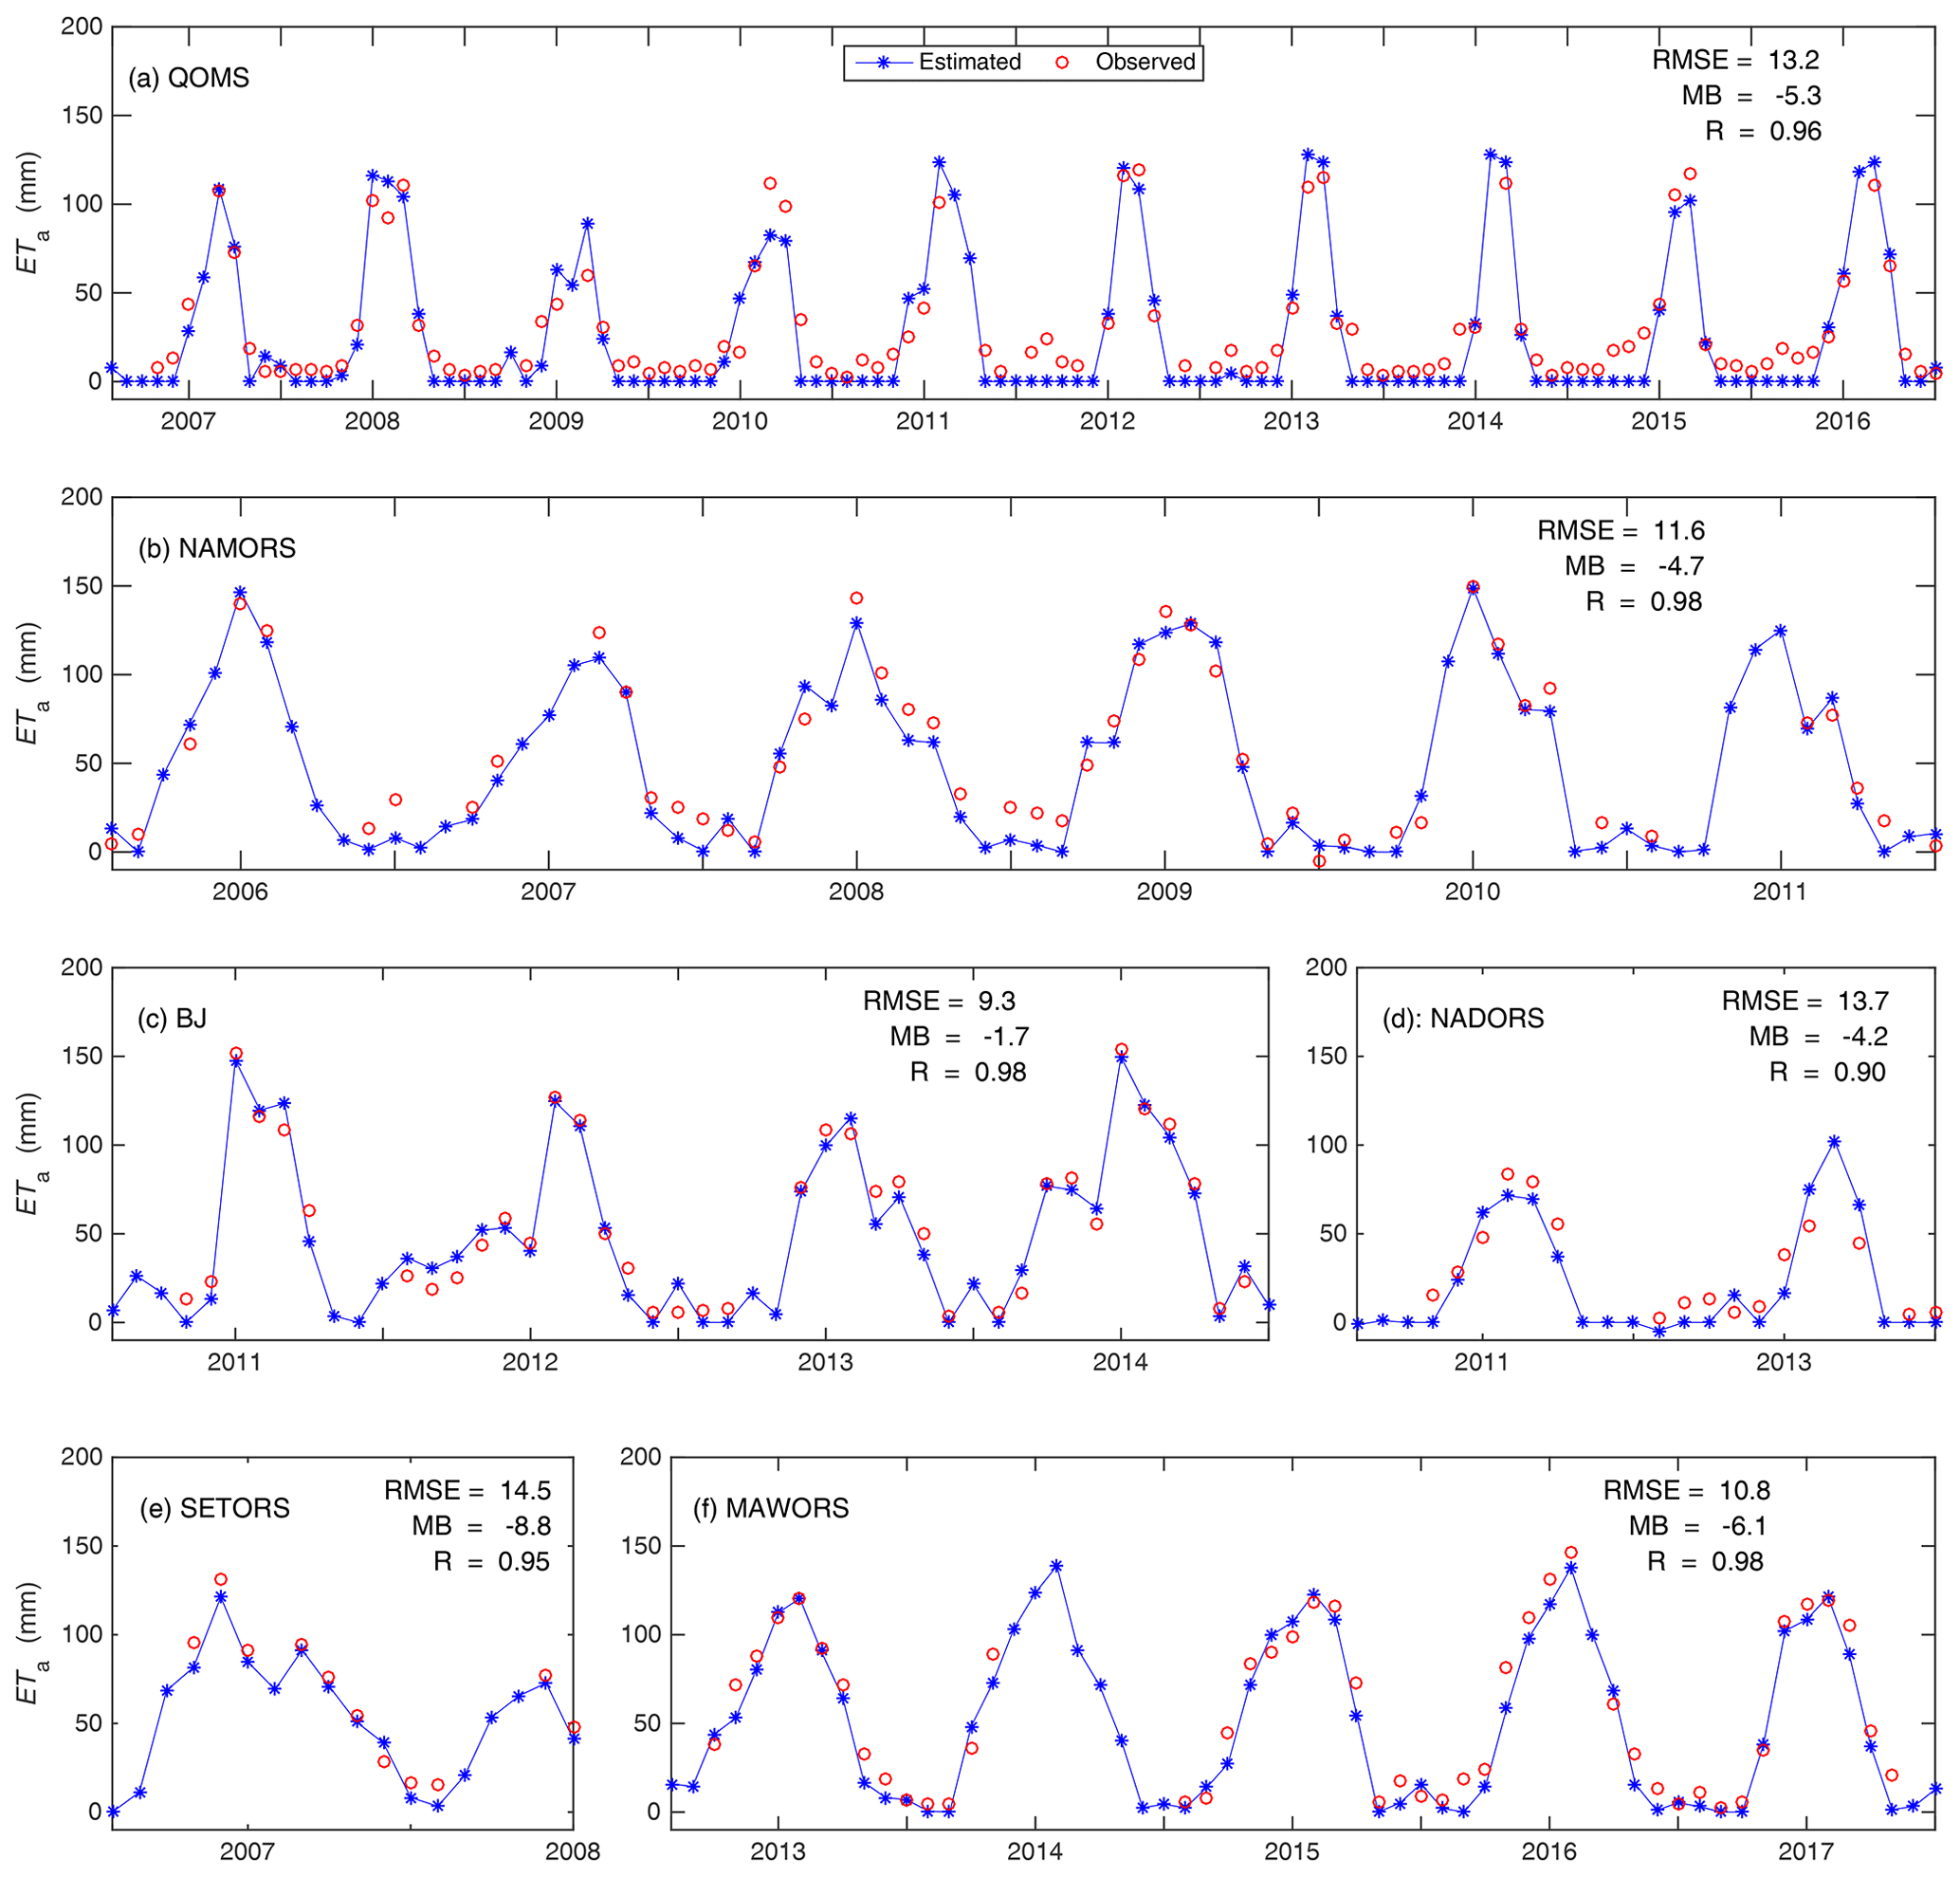
Figure 2SEBS-estimated and EC-observed monthly ETa at the six stations (a–f) on the TP in years when the latter observations were available. RMSE is the root-mean-square error, MB is the mean bias, and R is the correlation coefficient.
Specifically, the SEBS model performed particularly well at the short-grass sites (BJ and NAMORS), with correlation coefficients as high as 0.98 and MB values below 5.0 mm per month. At the high-grass site (SETORS) and the gravel site (QOMS), the SEBS model is capable of reproducing the EC-observed monthly ETa with RMSE values of 14.5 and 13.2 mm per month, respectively. In addition, the underestimates of ETa by SEBS are mostly in the dry season, when the canopy is withered. The validation at the site scale indicates that the SEBS model used in this work can be applied to a wide range of ecosystems over the TP.
3.2 Spatial distribution
There was a clear spatial pattern to the multiyear average of annual ETa between 2001 and 2018 (Fig. 3). In general, the SEBS-estimated ETa decreases from the southeast to the northwest of the TP, with the maximum value above 1200 mm in southeastern Tibet and the Hengduan Mountains and the minimum value less than 100 mm on the northwestern edge of the TP. In the central TP, where there are several lakes, ETa was typically from 500 to 1000 mm. ETa was lower than 200 mm over the high snow- and ice-bound mountainous areas, for example, over the northern slopes of the Himalaya, the Nyenchen Tanglha Mountains, and the eastern section of the Tanggula Mountains. The reason is that these snow- and ice-bound mountainous areas have a higher ability to reflect downward shortwave radiation and hence have less available energy to evaporate. On the whole, the domain-averaged multiyear mean annual ETa over the TP is 496±23 mm. The total amount of water evapotranspired from the terrestrial surface of the TP is around 1238.3±57.6 km3 yr−1, considering the area of the TP to be 2.5×10⁶ km2.
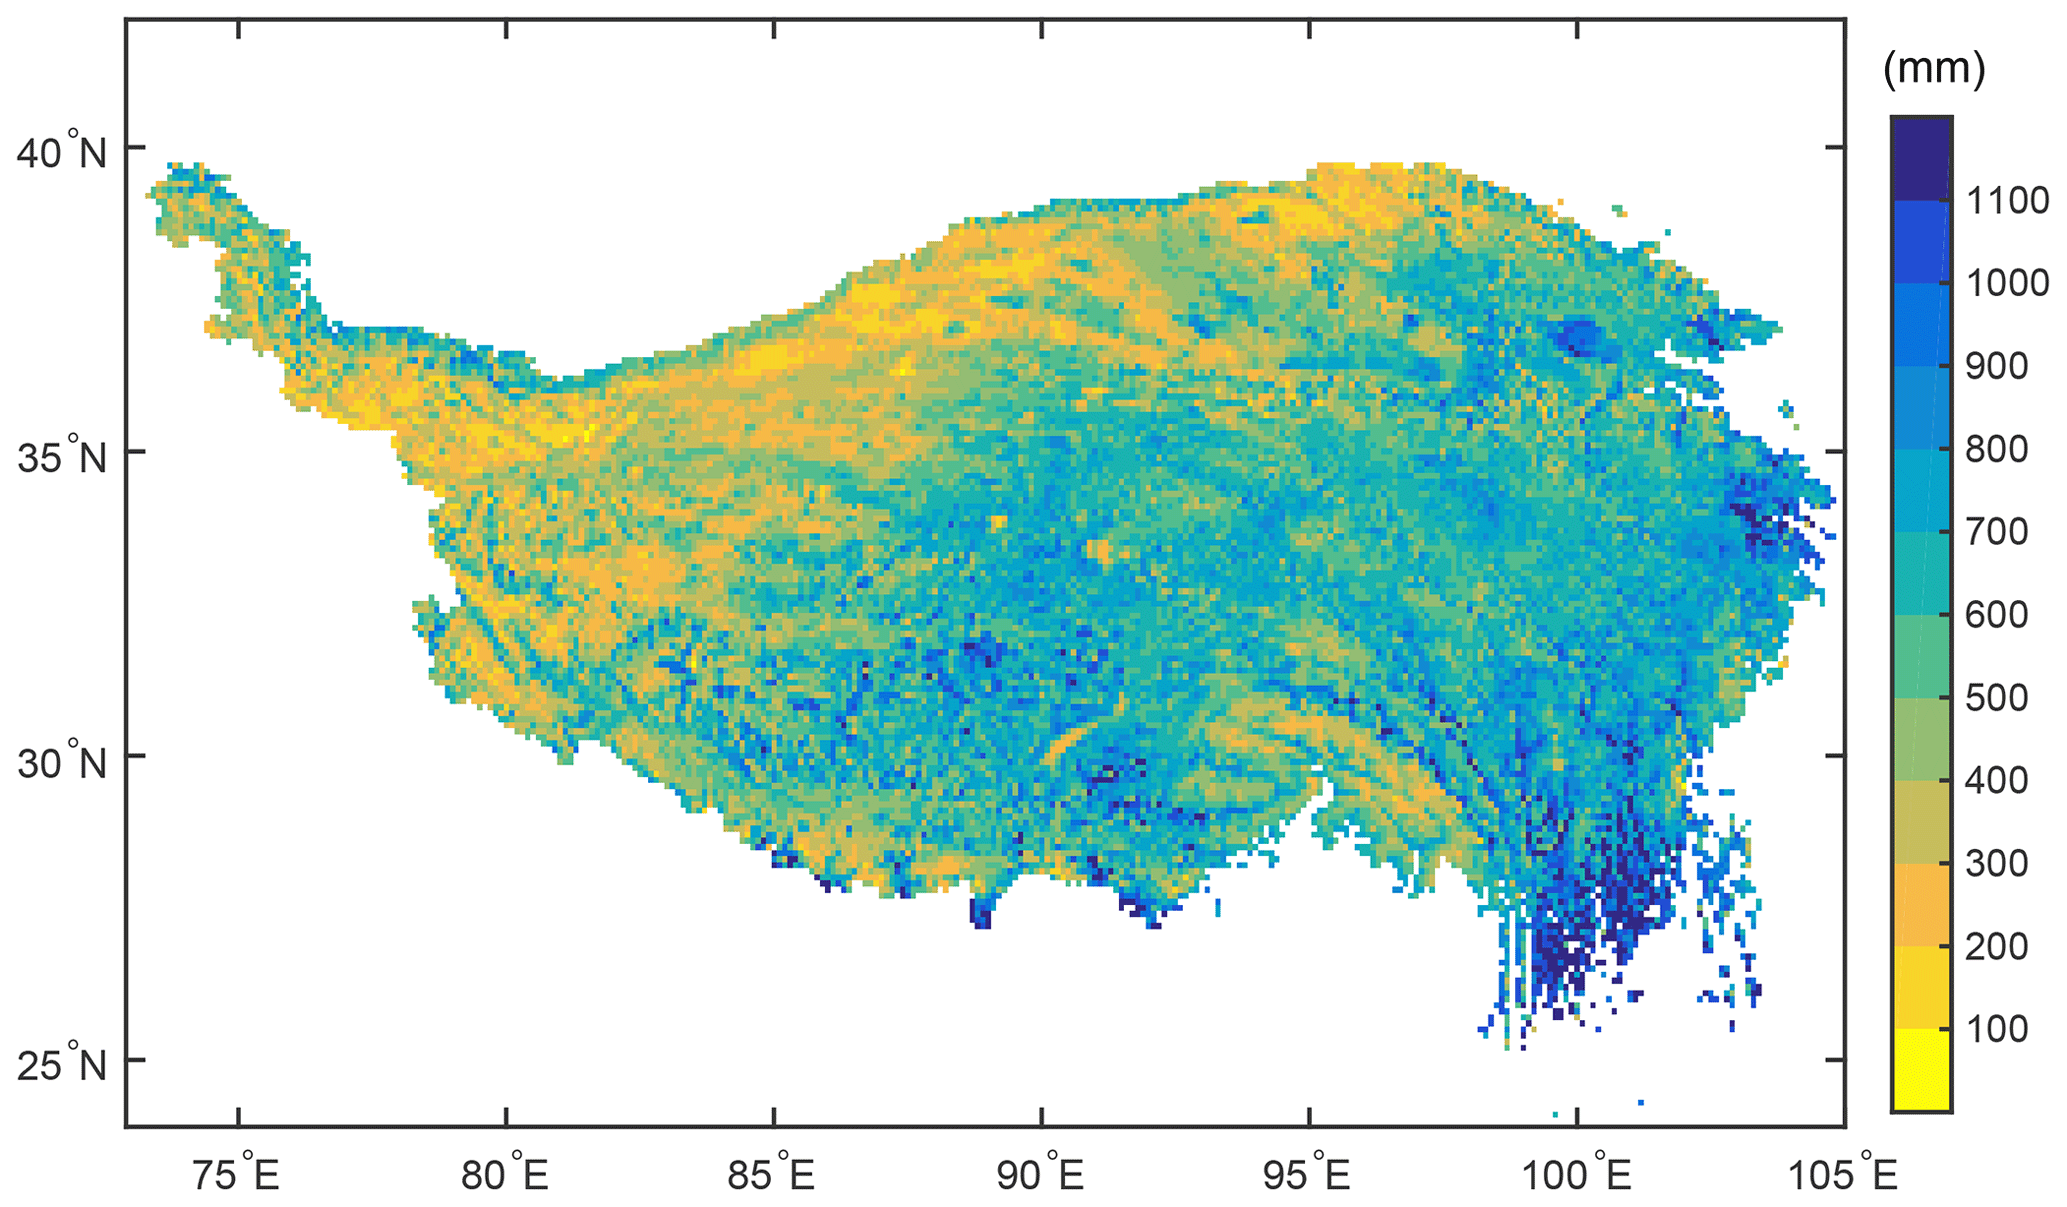
Figure 3Spatial distribution of the SEBS-estimated multiyear (2001–2018) average annual ETa.
Figure 4 shows the multiyear-average spring (March, April, and May), summer (June, July, and August), autumn (September, October, and November), and winter (December, January, and February) ETa on the TP. Generally, the distribution pattern of seasonal ETa was comparable with that of the annual ETa. Both seasonal and annual ETa show a decreasing trend from the southeastern TP to the northwestern TP. Note that the spatial contrast of ETa almost faded out in the winter season owing to a minimum in available energy and precipitation (Fig. 4d). The ETa in spring is higher than that in autumn, except for some high mountainous areas (e.g., mountain ranges of the Himalaya and Hengduan Mountains). The spring ETa ranges from 50 to 450 mm, while autumn ETa ranges from 50 to 250 mm. In summer, the ETa is larger than 250 mm in most of the TP, while the ETa is still below 100 mm in large areas of the northwestern TP. The multiyear seasonal ETa averaged over the whole TP is 140±10, 256±12, 84±5, and 34±4 mm for spring, summer, autumn, and winter, respectively.

Figure 4Spatial distributions of the SEBS-estimated multiyear (2001–2018) average seasonal ETa (millimeters per season) values over the TP. (a) Spring, (b) summer, (c) autumn, (d) winter.
3.3 Trend analysis
The trend of annual ETa during 2001–2018 is shown in Fig. 5. Overall, an increasing trend of SEBS-simulated ETa is dominant in the eastern TP (long >90∘ E), while a decreasing trend is dominant in the western TP (long <90∘ E). The trends pass the t test (p<0.05) in most parts of the areas. The decreasing trend in the western TP is pronounced and passes the t test (p<0.05). This trend is larger than −7.5 mm yr−1 in most parts of the area and even larger than −10 mm yr−1 in a few parts. In the eastern TP, the increasing trend is mostly between 5 and 10 mm yr−1 and passes the t test (p<0.05). The ETa trend tends to be greater along the marginal region of the northern, eastern, and southeastern TP. Along the marginal region of the southwestern TP and in the western section of the Himalaya Mountains this trend weakens.
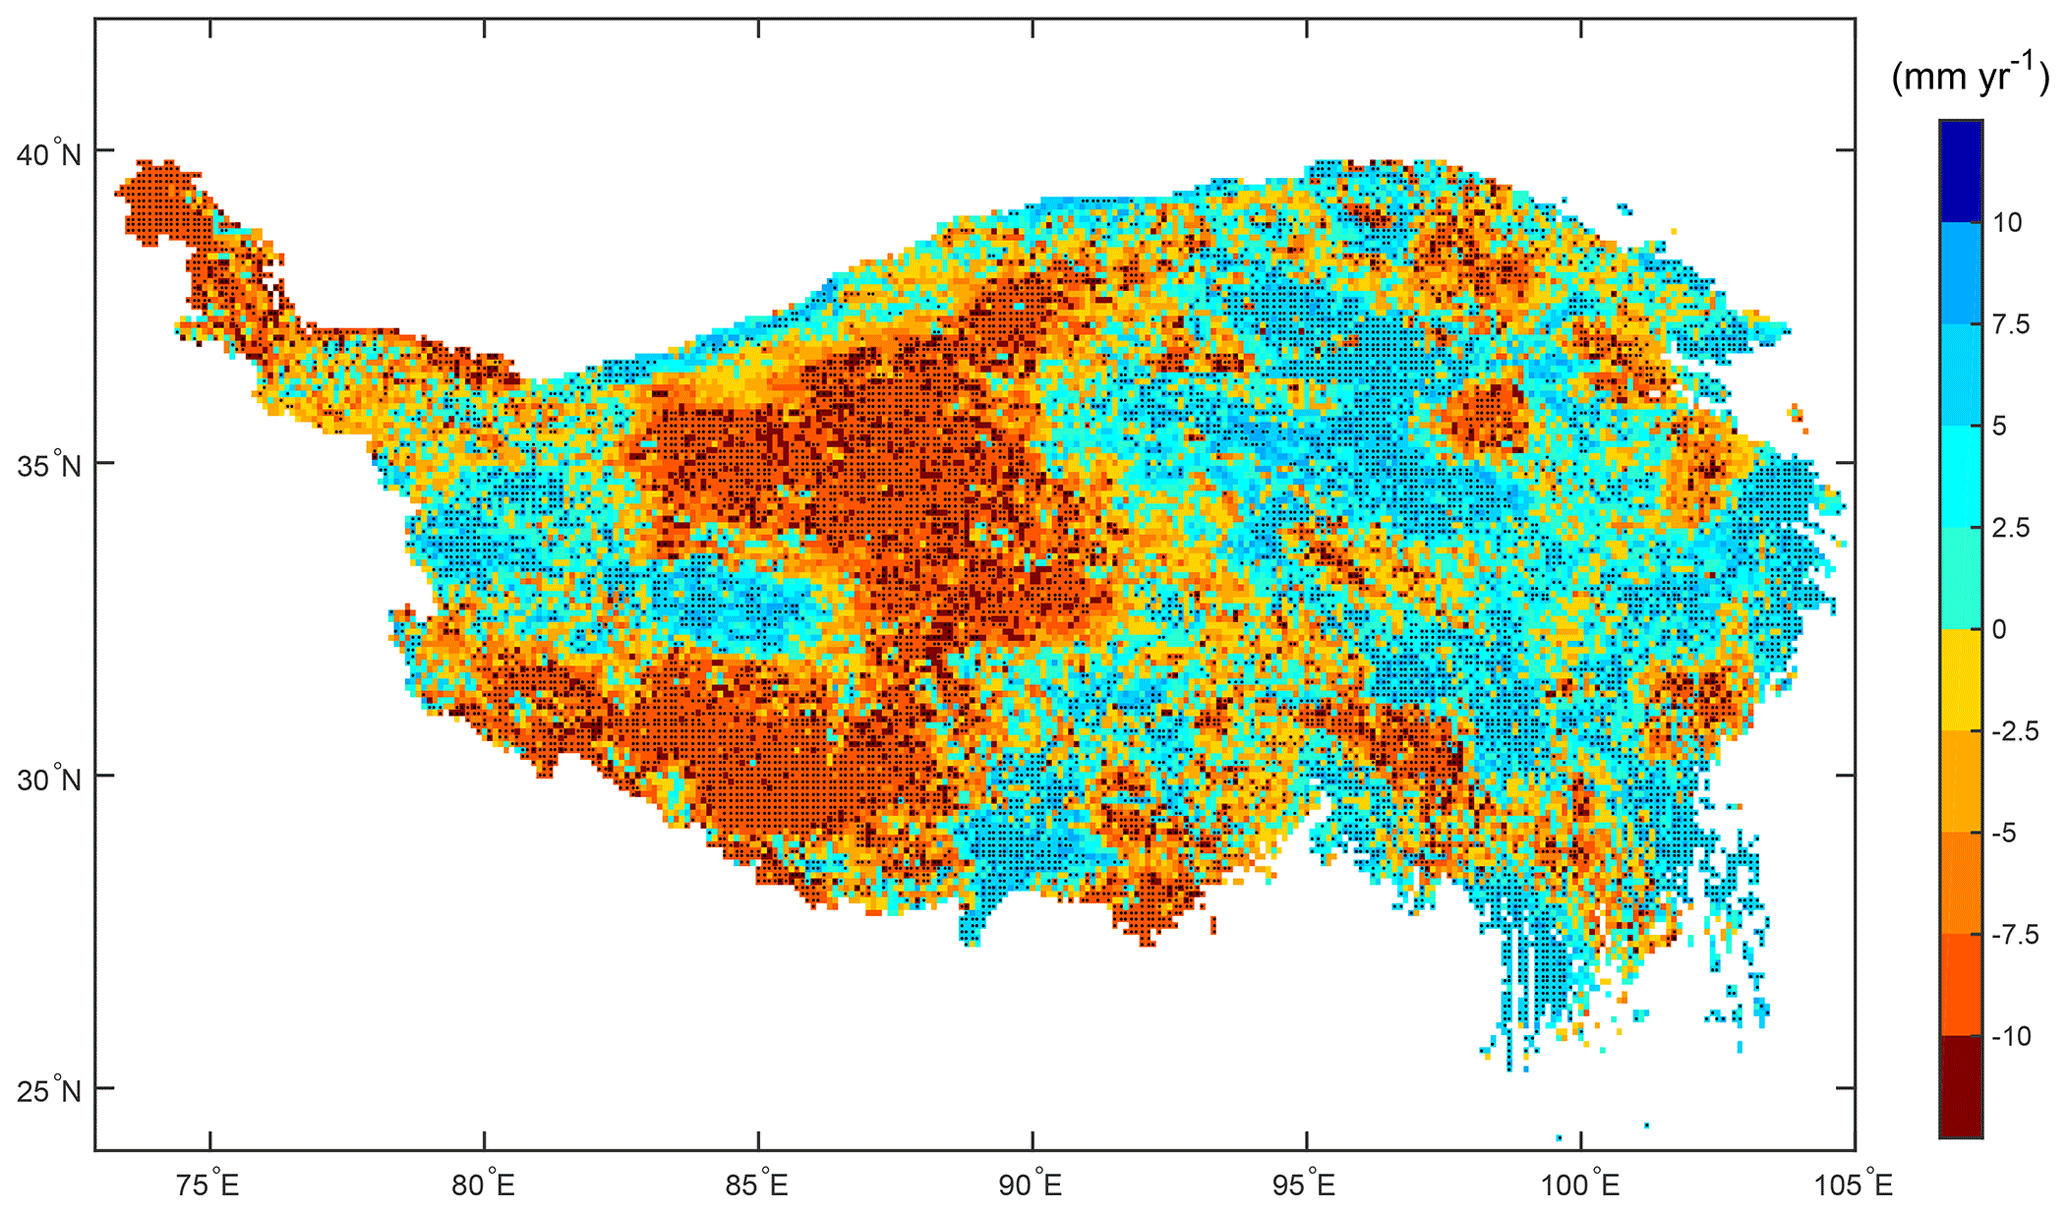
Figure 5Spatial distribution of annual ETa linear trend on the TP from 2001 to 2018. The stippling indicates the trends that pass the t test (p<0.05).
The trends of seasonal ETa between 2001 and 2018 are spatially heterogeneous over the TP (Fig. 6). Decreasing trends in spring and summer are generally at a rate between −2.5 and −7.5 mm yr−1, and increasing trends are generally at a rate below 5.0 and 7.5 mm yr−1 in spring and summer, respectively. Areas showing decreasing ETa tend to become larger in autumn and winter seasons. Both the decreasing and increasing trends are subdued in autumn and winter compared with that in the spring and summer seasons. Decreasing rates of ETa in autumn and winter are generally below −2.5 mm yr−1, and only a few areas have a rate larger than −2.5 mm yr−1.
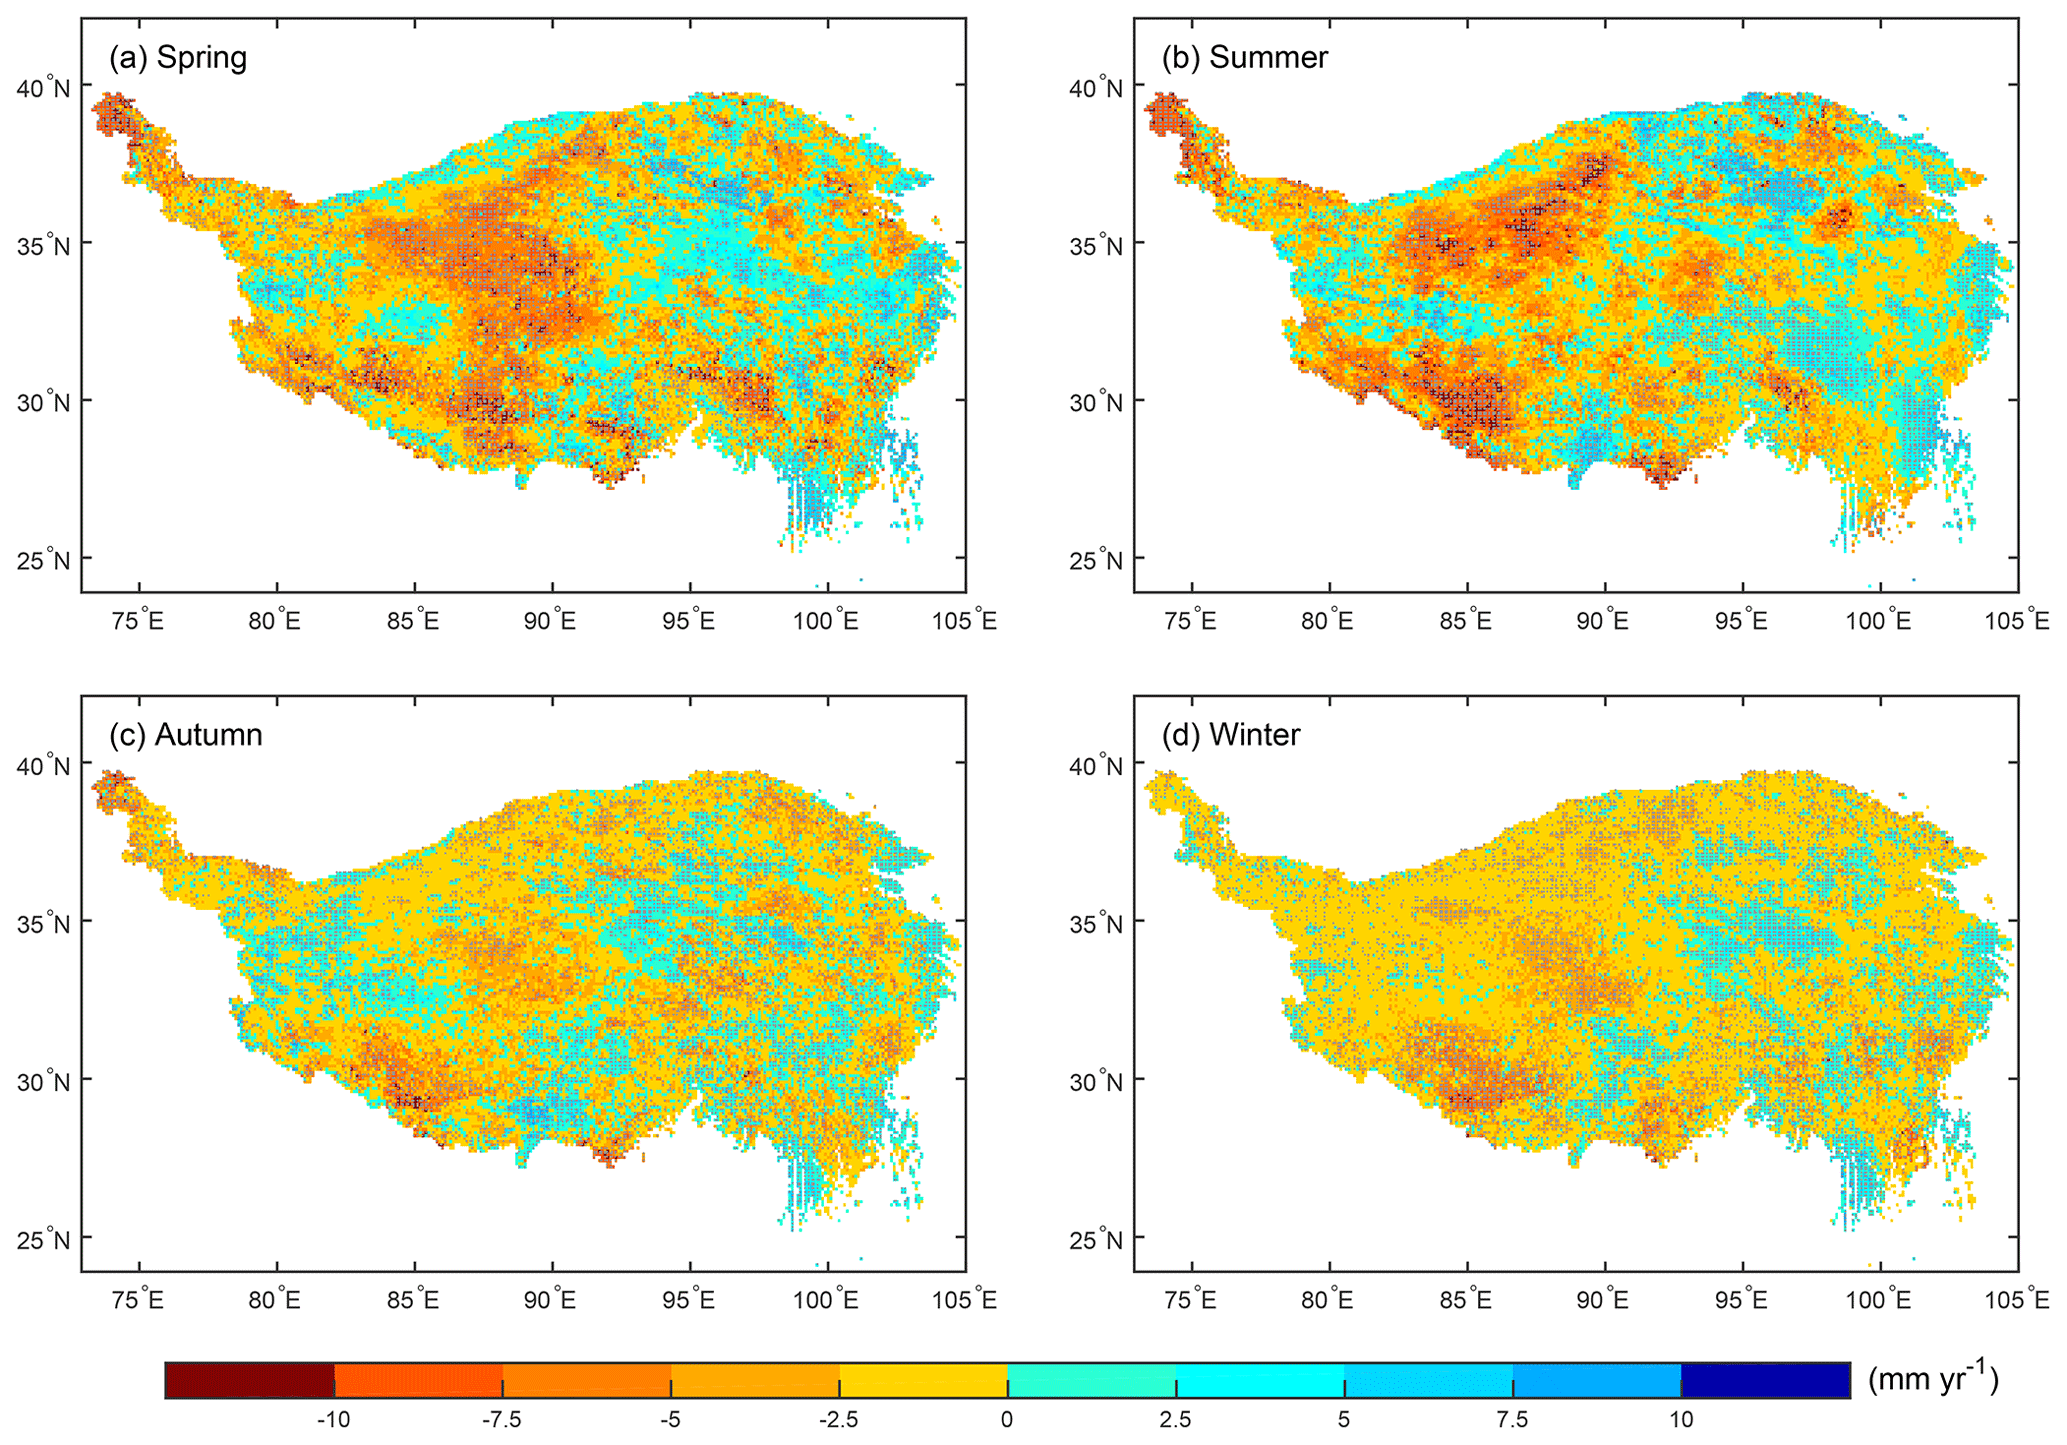
Figure 6Spatial distributions of seasonal ETa linear trends on the TP from 2001 to 2018: (a) annual, (b) spring, (c) summer, (d) autumn, (e) winter. The stippling indicates the trends that pass the t test (p<0.05).
Due to the contrast in the trends in the eastern and western halves of the TP, we divided the TP into two regions: the eastern TP (long >90∘ E) and the western TP (long <90∘ E). Trends of the ETa anomaly averaged over the entire TP, the western TP, and the eastern TP are shown in Fig. 7a. The domain means of ETa on the TP as a whole and in the western TP decreased at rates of −1.45 and −5.52 mm yr−1, respectively. However, the ETa in the eastern TP increased at a rate of 2.62 mm yr−1. The decreasing rate of ETa in the entire TP is influenced mainly by the significant decrease in ETa in the western TP. Seasonally, the rates of change in ETa over the whole TP are −0.82 mm yr−1 (p<0.05) and −0.79 mm yr−1 (p<0.05) in spring and summer, respectively (Fig. 7b). However, in autumn and winter the ETa changes at a rate of 0.10 and 0.06 mm yr−1, respectively, and does not pass the t test (p<0.05). ETa in the spring and summer seasons accounts for 75.7 % of the annual ETa. The variation in amplitude and changing rates in these two seasons are much larger than in the other seasons. Moreover, spatial distributions of spring and summer ETa trends are close to that of the annual ETa trend (Fig. 6). Thus, changes in ETa in the spring and summer dominate the variations in ETa in the whole year.
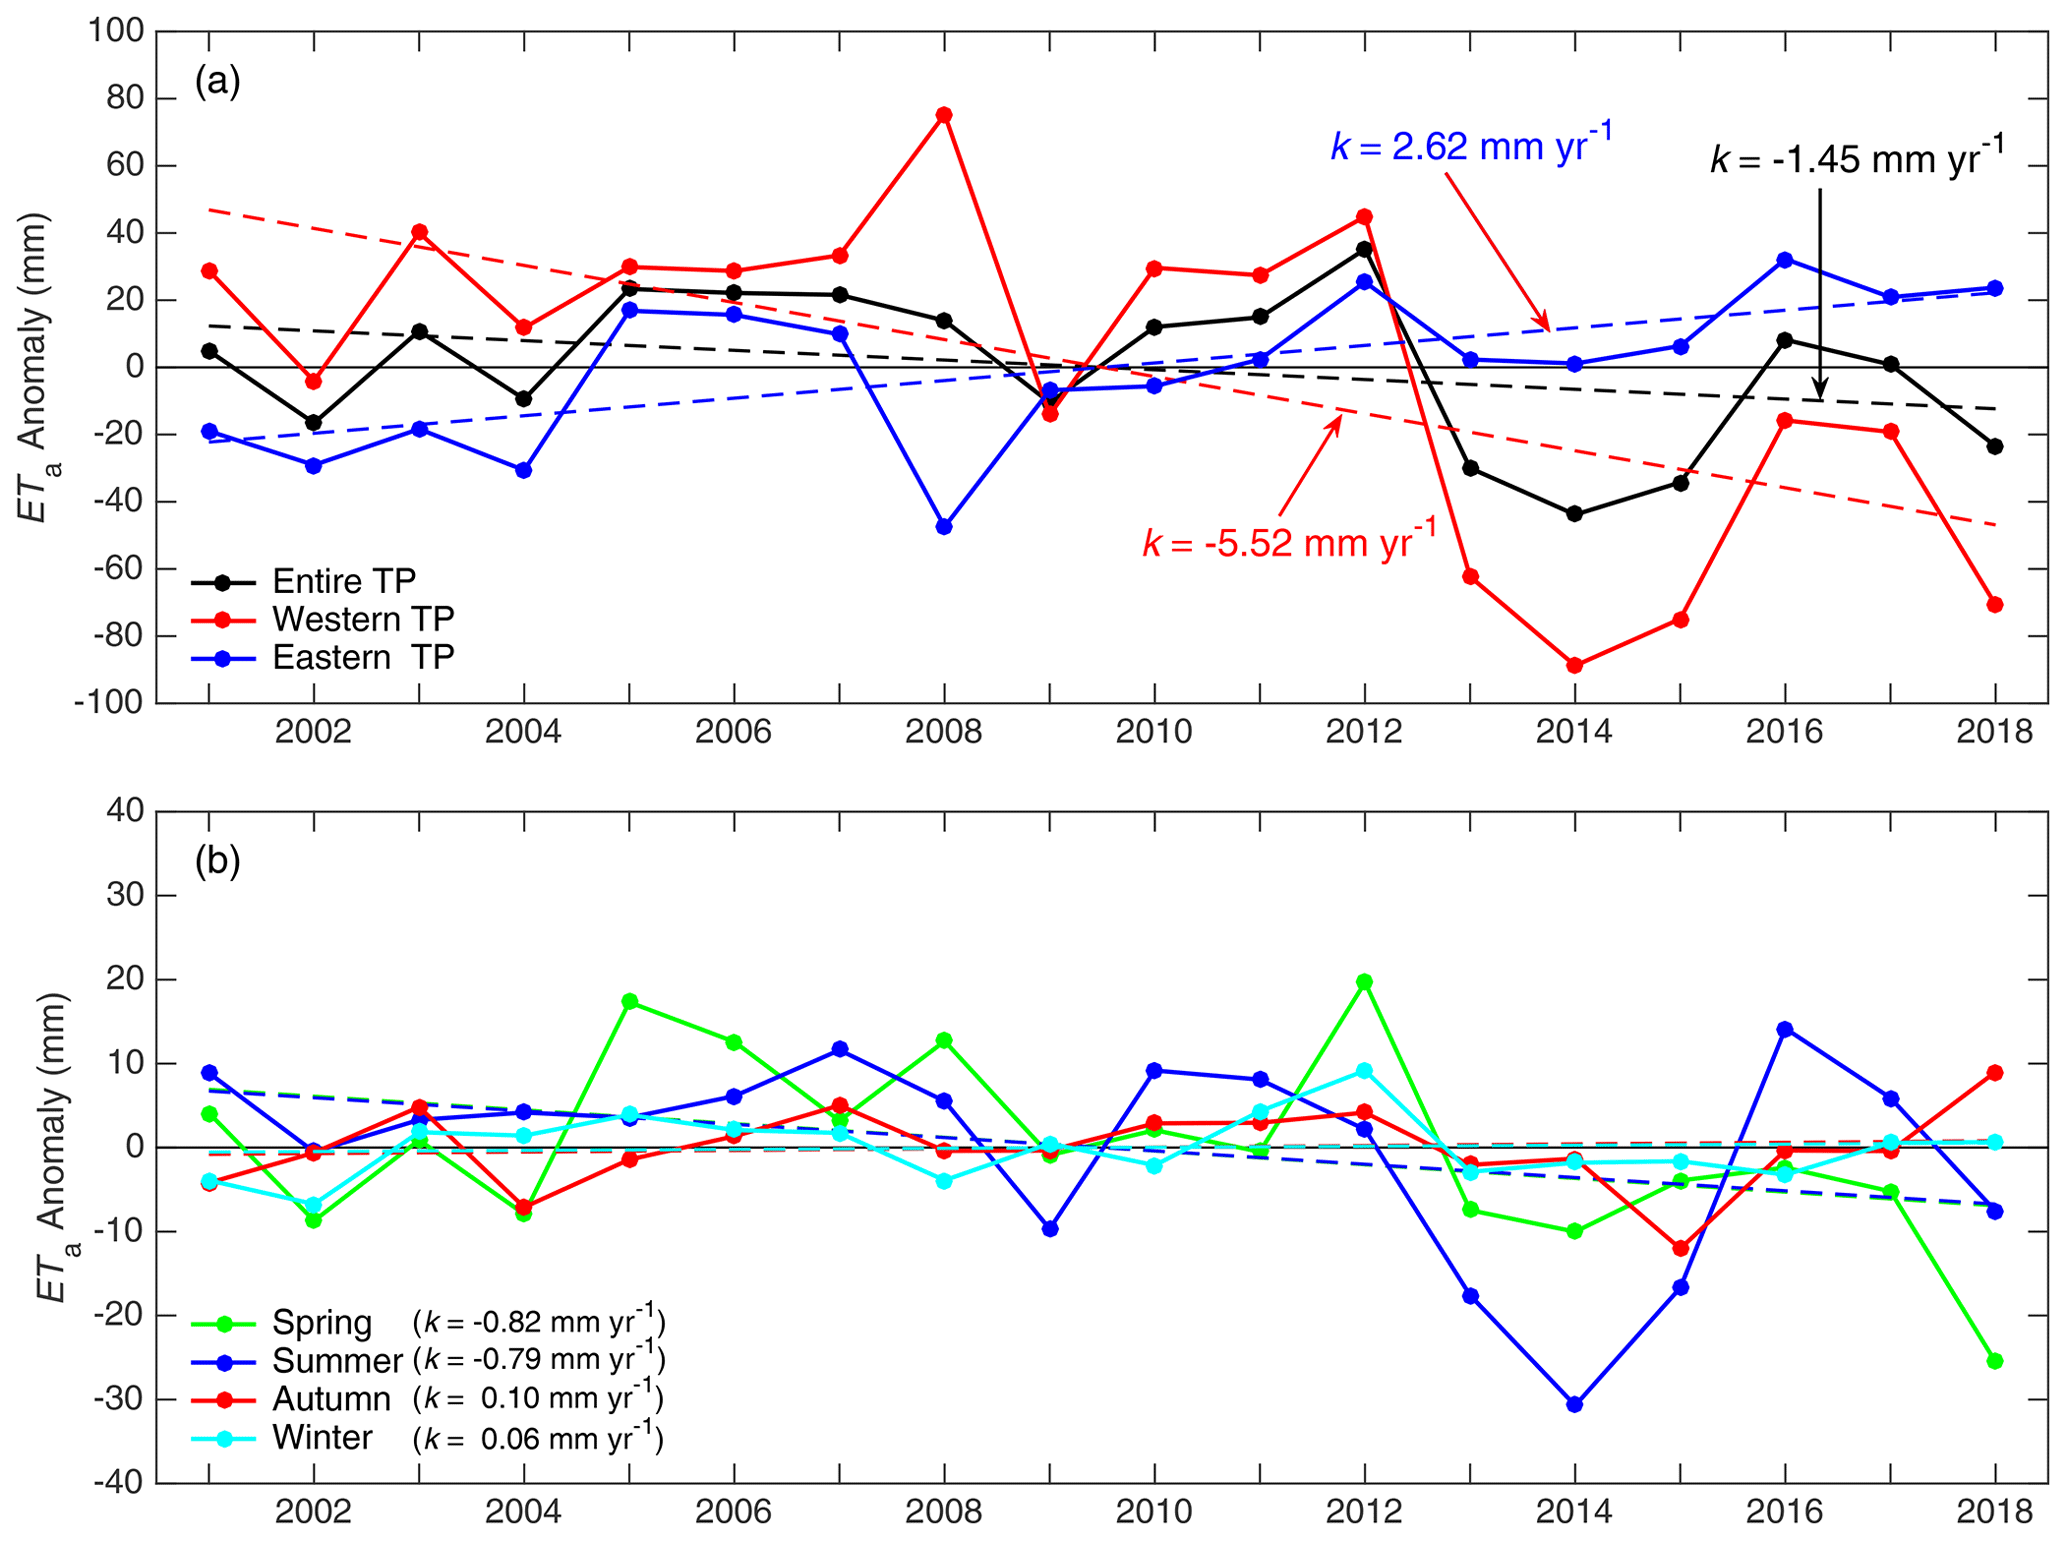
Figure 7Anomalies of the domain-averaged annual ETa of the entire TP, the western TP (long <90∘ E), and the eastern TP (long >90∘ E), respectively (a). Domain-averaged seasonal ETa anomalies over the entire TP (b). The dashed straight lines indicate linear trends during 2001–2018, and k is the slope of the straight line.
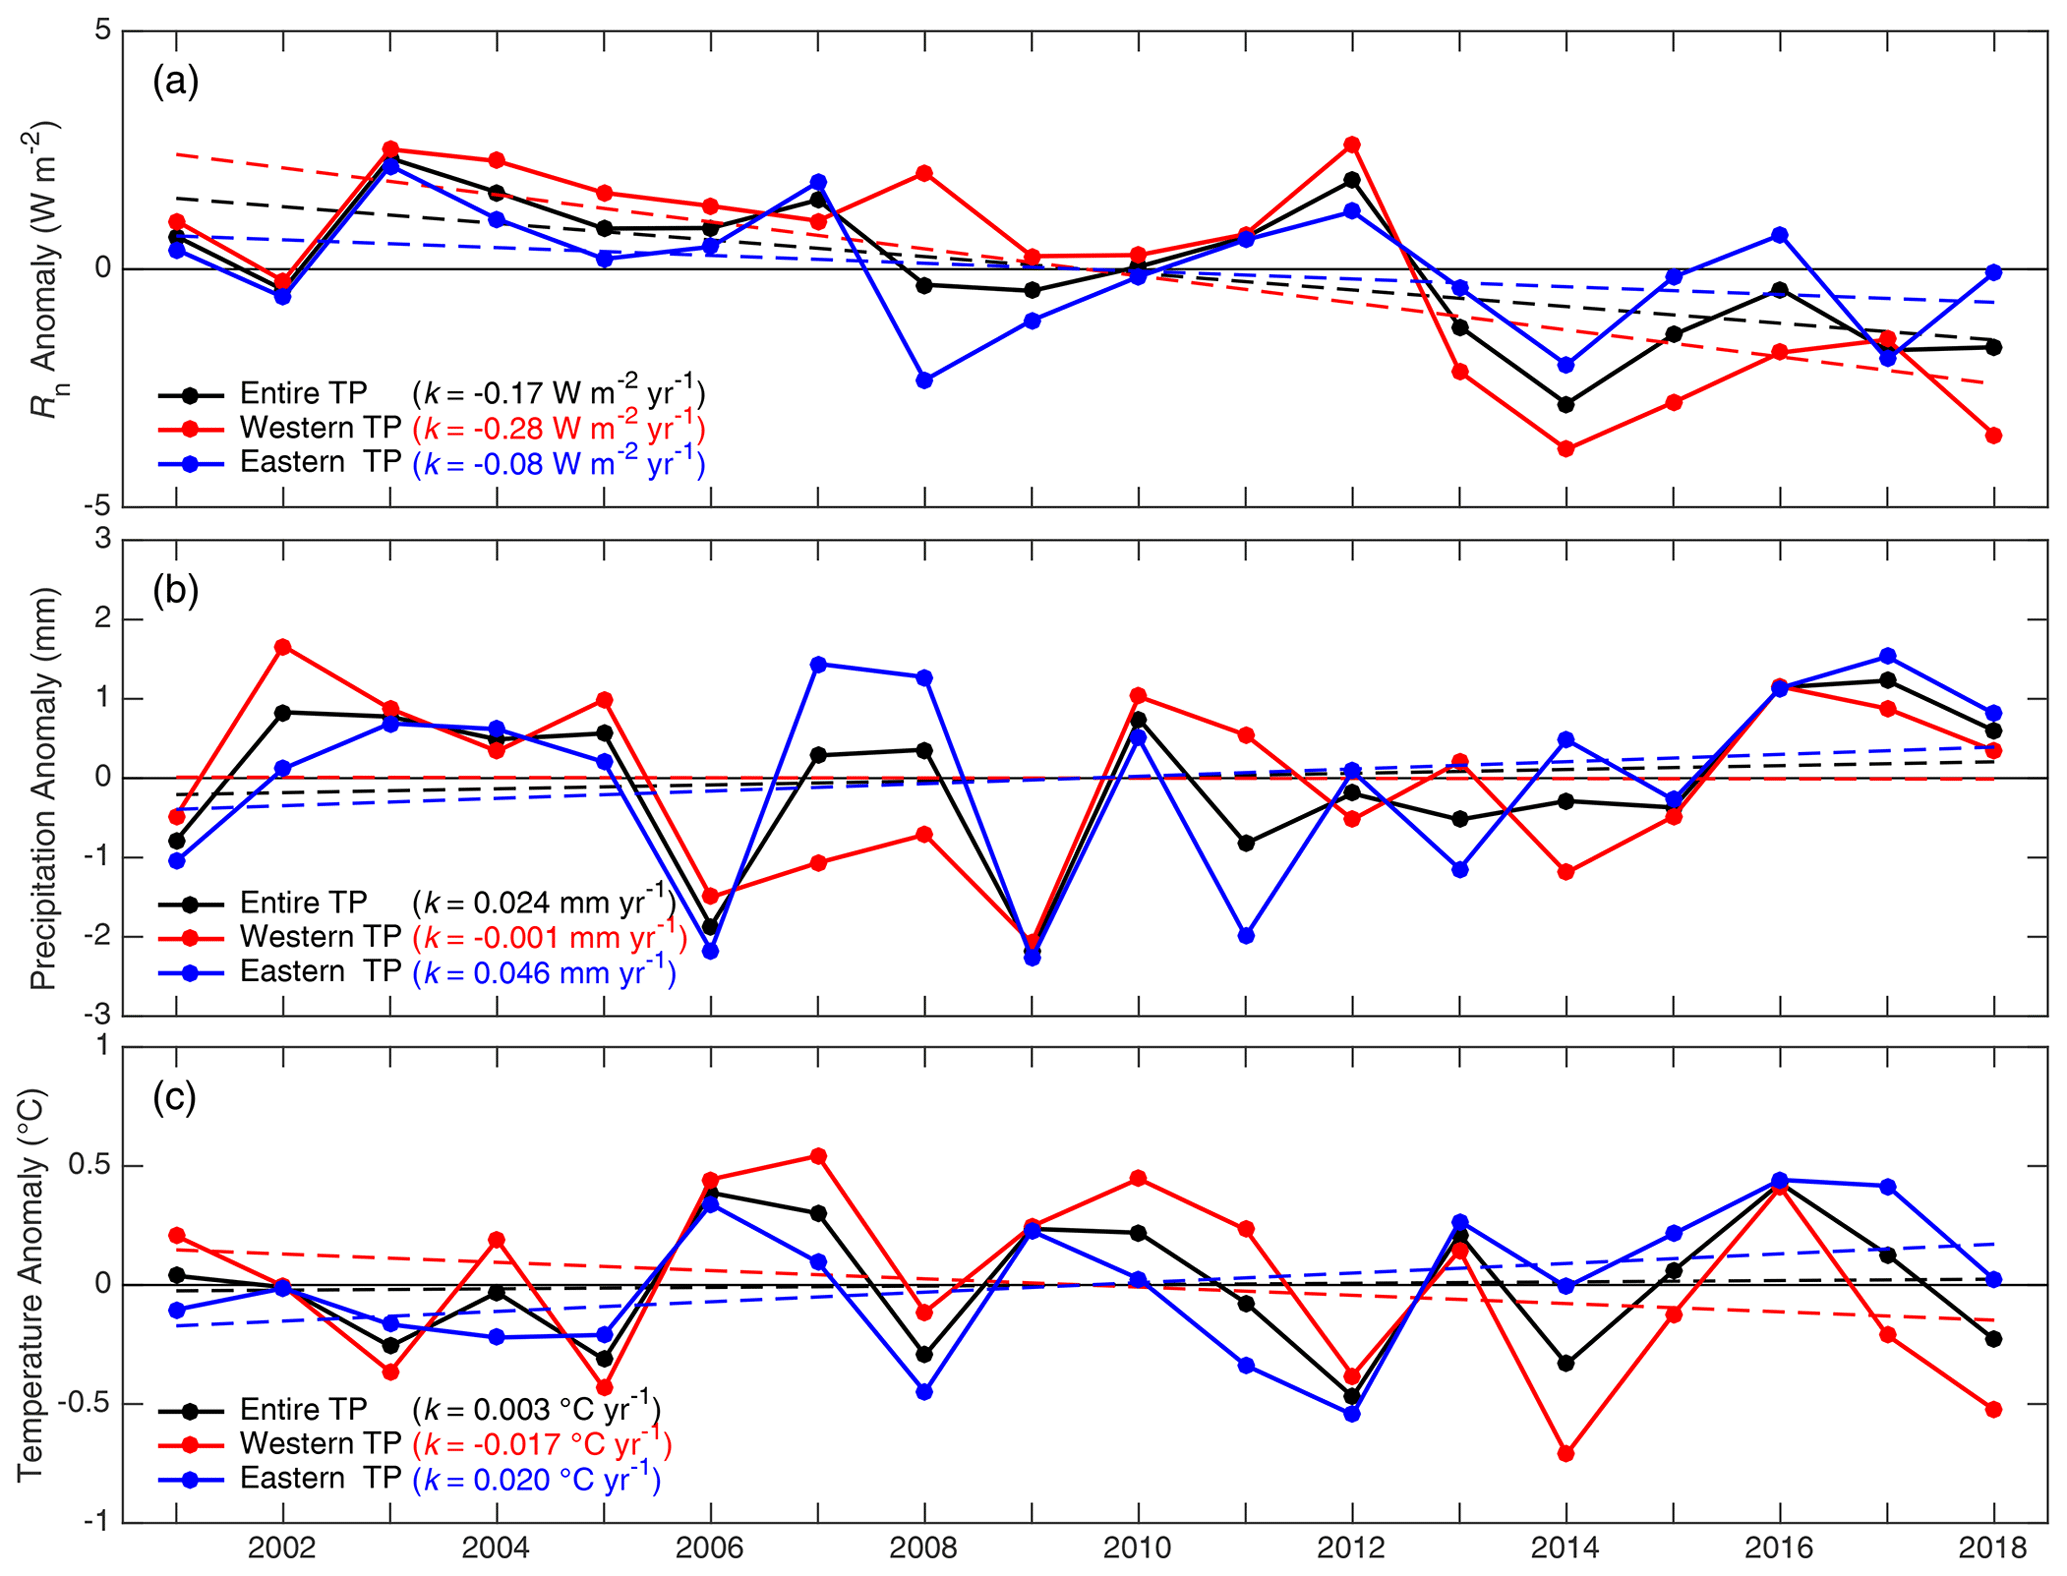
Figure 8Domain-averaged anomalies of annual Rn (a), precipitation (b), and temperature (c) over the entire TP, the western TP (long <90∘ E), and the eastern TP (long >90∘ E), respectively. The dashed straight lines indicate linear trends during 2001–2018, and k is the slope of the straight line.
The decrease in ETa over the whole TP and in the western TP during 2001–2018 can be explained by the decrease in Rn in the same time period (Fig. 8a). From 2001 to 2012, ETa averaged over the entire TP increased slightly and then decreased dramatically from 2012, reaching a minimum in 2014. The significant decrease in ETa between 2012 and 2014 was due to the rapid decline in the Rn (Fig. 8a). In the eastern TP, ETa increased during 2001–2018, while Rn decreased in the same period. Thus, Rn was not the dominant factor controlling the annual variations in ETa. However, the increasing trends of both precipitation and air temperature can explain the increase in ETa in the eastern TP during the period 2001–2018 (Fig. 8b and c). The increasing precipitation increased the water resource available for ETa. Moreover, the increasing air temperature accelerated the melting of permafrost and glaciers on the TP. Hence, the melting water replenished the ecosystem and increased the ETa of the eastern TP.
Although the domain-averaged trend in ETa has been decreasing across the entire TP from 2001 to 2018, ETa values in some areas have increased. Moreover, the changing rates also depend on the time series of ETa. For example, the ETa increased slightly from 2001 to 2012, while it decreased from 2001 to 2018. This demonstrates the necessity to evaluate the spatial distribution of changing trends in ETa and utilize long time series to investigate the trends in ETa over the TP.
The dataset presented and analyzed in this article has been released and is available for free download from the Science Data Bank (https://doi.org/10.11922/sciencedb.t00000.00010, Han et al., 2020b) and from the National Tibetan Plateau Data Center (https://doi.org/10.11888/Hydro.tpdc.270995, Han et al., 2020a). The dataset is published under the Creative Commons Attribution 4.0 International (CC BY 4.0) license.
The SEBS-estimated ETa is at a resolution of around 10 km, while the footprint of EC-observed ETa values ranges from a few dozen meters to a few hundred meters. SEBS-estimated ETa compares very well with observations at the six flux towers, showing low RMSE and MB values. These estimates were able to capture annual and seasonal variations in ETa, despite these two datasets being mismatched in their spatial representation. Note that the energy consumption related to freeze–thaw processes and sublimation is neglected. Thus, the dataset is likely to be less reliable over the glacier and permafrost and in the winter season.
Heterogeneous land surface characteristics and nonlinear changes in atmospheric conditions resulted in heterogeneities in spatial distributions of ETa and changes in ETa. The SEBS-estimated multiyear (2001–2018) mean annual ETa on the TP was 515±22 mm, resulting in approximately 1287.5±55.0 km3 yr−1 of total water evapotranspiration from the terrestrial surface. Annual ETa generally decreased from the southeast to the northwest of the TP. The maximum was over 1200 mm, in southeastern Tibet and the Hengduan Mountains, while the minimum was less than 100 mm in the northwestern marginal area of the TP. Moreover, ETa was typically lower than 200 mm over snow- and ice-bound mountainous areas as there was limited available energy to evaporate the water.
Averaged over the entire TP, annual ETa increased slightly from 2001 to 2012 but decreased significantly after 2012 and reached a minimum in 2014. Generally, there was a slight decreasing trend in the domain mean annual ETa on the TP at the rate of −1.45 mm yr−1 (p<0.05) from 2001 to 2018. However, trends of annual ETa were opposite in the western and eastern TP. The annual ETa decreased significantly in the western TP at a rate of −5.52 mm yr−1 (p<0.05) from 2001 to 2018, while annual ETa in the eastern TP increased at a rate of 2.62 mm yr−1 (p<0.05) in the same period.
The spatial distributions of seasonal ETa trends were also noticeably heterogeneous during 2001–2018. The spatial patterns of ETa trend in spring and summer were similar to the annual changes in ETa. ETa decreased as well in the spring and summer seasons but at slower rates compared with the annual ETa; however, only very weak trends were found in the autumn and winter seasons.
The supplement related to this article is available online at: https://doi.org/10.5194/essd-13-3513-2021-supplement.
CH and YM conceived the study and analyzed simulation output. CH ran simulations, post-processed output, and generated the figures. CH and YM wrote the manuscript with assistance from all co-authors.
The authors declare that they have no conflict of interest.
Publisher’s note: Copernicus Publications remains neutral with regard to jurisdictional claims in published maps and institutional affiliations.
This article is part of the special issue “Extreme environment datasets for the three poles”. It is not associated with a conference.
The CMFD data were obtained from the National Tibetan Plateau Data Center (https://data.tpdc.ac.cn/en/data/8028b944-daaa-4511-8769-965612652c49/, last access: 9 July 2021). MODIS data were obtained from the NASA Land Processes Distributed Active Archive Center (https://lpdaac.usgs.gov/, last access: 9 July 2021). Global 1 km forest canopy height data were obtained from the Oak Ridge National Laboratory Distributed Active Archive Center for Biogeochemical Dynamics (https://daac.ornl.gov/cgi-bin/dsviewer.pl?ds_id=1271, last access: 9 July 2021). The authors would like to thank all colleagues working at the observational stations on the TP for their maintenance of the instruments.
This research has been supported by the Second Tibetan Plateau Scientific Expedition and Research (STEP) program (grant no. 2019QZKK0103), the Strategic Priority Research Program of the Chinese Academy of Sciences (grant no. XDA20060101), and the National Natural Science Foundation of China (grant nos. 91837208, 41705005, and 41830650).
This paper was edited by Tao Che and reviewed by Massimo Menenti and one anonymous referee.
Chen, X., Su, Z., Ma, Y., Yang, K., and Wang, B.: Estimation of surface energy fluxes under complex terrain of Mt. Qomolangma over the Tibetan Plateau, Hydrol. Earth Syst. Sci., 17, 1607–1618, https://doi.org/10.5194/hess-17-1607-2013, 2013a.
Chen, X., Su, Z., Ma, Y., Yang, K., Wen, J., and Zhang, Y.: An Improvement of roughness height parameterization of the surface energy balance system (SEBS) over the Tibetan Plateau, J. Appl. Meteorol. Clim., 52, 607–622, https://doi.org/10.1175/JAMC-D-12-056.1, 2013b.
Chen, X., Su, Z., Ma, Y., Liu, S., Yu, Q., and Xu, Z.: Development of a 10-year (2001–2010) 0.1∘ data set of land-surface energy balance for mainland China, Atmos. Chem. Phys., 14, 13097–13117, https://doi.org/10.5194/acp-14-13097-2014, 2014.
Chen, X., Su, Z., Ma, Y., and Middleton, E. M.: Optimization of a remote sensing energy balance method over different canopy applied at global scale, Agr. Forest Meteorol., 279, 107633–107633, https://doi.org/10.1016/j.agrformet.2019.107633, 2019.
Fisher, J. B., Melton, F., Middleton, E., Hain, C., Anderson, M., Allen, R., McCabe, M. F., Hook, S., Baldocchi, D., Townsend, P. A., Kilic, A., Tu, K., Miralles, D. D., Perret, J., Lagouarde, J.-P., Waliser, D., Purdy, A. J., French, A., Schimel, D., Famiglietti, J. S., Stephens, G., and Wood, E. F.: The future of evapotranspiration: Global requirements for ecosystem functioning, carbon and climate feedbacks, agricultural management, and water resources, Water Resour. Res., 53, 2618–2626, https://doi.org/10.1002/2016WR020175, 2017.
Gao, Z. Q., Liu, C. S., Gao, W., and Chang, N.-B.: A coupled remote sensing and the Surface Energy Balance with Topography Algorithm (SEBTA) to estimate actual evapotranspiration over heterogeneous terrain, Hydrol. Earth Syst. Sci., 15, 119–139, https://doi.org/10.5194/hess-15-119-2011, 2011.
Grant, A. L. M. and Mason, P. J.: Observations of boundary-layer structure over complex terrain, Q. J. Roy. Meteor. Soc., 116, 159–186, https://doi.org/10.1002/qj.49711649107, 1990.
Han, C., Ma, Y., Su, Z., Chen, X., Zhang, L., Li, M., and Sun, F.: Estimates of effective aerodynamic roughness length over mountainous areas of the Tibetan Plateau, Q. J. Roy. Meteor. Soc., 141, 1457–1465, https://doi.org/10.1002/qj.2462, 2015.
Han, C., Ma, Y., Chen, X., and Su, Z.: Estimates of land surface heat fluxes of the Mt. Everest region over the Tibetan Plateau utilizing ASTER data, Atmos. Res., 168, 180–190, https://doi.org/10.1016/j.atmosres.2015.09.012, 2016.
Han, C., Ma, Y., Chen, X., and Su, Z.: Trends of land surface heat fluxes on the Tibetan Plateau from 2001 to 2012, Int. J. Climatol., 37, 4757–4767, https://doi.org/10.1002/joc.5119, 2017.
Han, C., Ma, Y., Wang, B., Zhong, L., Ma, W., Chen, X., and Su, Z.: Monthly mean evapotranspiration data set of the Tibet Plateau (2001–2018), National Tibetan Plateau Data Center [data set], https://doi.org/10.11888/Hydro.tpdc.270995, 2020a.
Han, C., Ma, Y., Wang, B., Zhong, L., Ma, W., Chen, X., and Su, Z.: The estimated actual evapotranspiration over the Tibetan Plateau from 2001 to 2016, V1, Science Data Bank (ScienceDB) [data set], https://doi.org/10.11922/sciencedb.t00000.00010, 2020b.
He, J., Yang, K., Tang, W., Lu, H., Qin, J., Chen, Y., and Li, X.: The first high-resolution meteorological forcing dataset for land process studies over China, Scientific Data, 7, 25, https://doi.org/10.1038/s41597-020-0369-y, 2020.
Immerzeel, W. W., van Beek, L. P. H., and Bierkens, M. F. P.: Climate change will affect the asian water towers, Science, 328, 1382–1385, https://doi.org/10.1126/science.1183188, 2010.
Li, X., Cheng, G., Liu, S., Xiao, Q., Ma, M., Jin, R., Che, T., Liu, Q., Wang, W., Qi, Y., Wen, J., Li, H., Zhu, G., Guo, J., Ran, Y., Wang, S., Zhu, Z., Zhou, J., Hu, X., and Xu, Z.: Heihe Watershed Allied Telemetry Experimental Research (HiWATER): Scientific objectives and experimental design, B. Am. Meteorol. Soc., 94, 1145–1160, https://doi.org/10.1175/BAMS-D-12-00154.1, 2013.
Li, X., Wang, L., Chen, D., Yang, K., and Wang, A.: Seasonal evapotranspiration changes (1983–2006) of four large basins on the Tibetan Plateau, J. Geophys. Res.-Atmos., 119, 13079–13095, https://doi.org/10.1002/2014JD022380, 2014.
Liu, X., Zheng, H., Zhang, M., and Liu, C.: Identification of dominant climate factor for pan evaporation trend in the Tibetan Plateau, J. Geogr. Sci., 21, 594–608, https://doi.org/10.1007/s11442-011-0866-1, 2011.
Ma, N., Szilagyi, J., Zhang, Y., and Liu, W.: Complementary-relationship-based modeling of terrestrial evapotranspiration across China during 1982–2012: Validations and spatiotemporal analyses, J. Geophys. Res.-Atmos., 124, 4326–4351, https://doi.org/10.1029/2018JD029850, 2019.
Ma, W., Ma, Y., and Ishikawa, H.: Evaluation of the SEBS for upscaling the evapotranspiration based on in-situ observations over the Tibetan Plateau, Atmos. Res., 138, 91–97, https://doi.org/10.1016/j.atmosres.2013.10.020, 2014.
Ma, Y., Su, Z., Koike, T., Yao, T., Ishikawa, H., Ueno, K., and Menenti, M.: On measuring and remote sensing surface energy partitioning over the Tibetan Plateau–from GAME/Tibet to CAMP/Tibet, Phys. Chem. Earth Pt. A/B/C, 28, 63–74, https://doi.org/10.1016/S1474-7065(03)00008-1, 2003.
Ma, Y., Zhong, L., Wang, B., Ma, W., Chen, X., and Li, M.: Determination of land surface heat fluxes over heterogeneous landscape of the Tibetan Plateau by using the MODIS and in situ data, Atmos. Chem. Phys., 11, 10461–10469, https://doi.org/10.5194/acp-11-10461-2011, 2011.
Ma, Y., Hu, Z., Xie, Z., Ma, W., Wang, B., Chen, X., Li, M., Zhong, L., Sun, F., Gu, L., Han, C., Zhang, L., Liu, X., Ding, Z., Sun, G., Wang, S., Wang, Y., and Wang, Z.: A long-term (2005–2016) dataset of hourly integrated land–atmosphere interaction observations on the Tibetan Plateau, Earth Syst. Sci. Data, 12, 2937–2957, https://doi.org/10.5194/essd-12-2937-2020, 2020.
Mauder, M. and Foken, T.: Eddy-Covariance Software TK3, Documentation and Instruction Manual of the Eddy-covariance Software Package TK3 (update), University of Bayreuth, Bayreuth, Germany, Zenodo [data set], https://doi.org/10.5281/zenodo.20349, 2015.
Moore, C. J.: Frequency response corrections for eddy correlation systems, Bound.-Lay. Meteorol., 37, 17–35, https://doi.org/10.1007/BF00122754, 1986.
Oki, T. and Kanae, S.: Global hydrological cycles and world water resources, Science, 313, 1068–1072, https://doi.org/10.1126/science.1128845, 2006.
Pinker, R. T. and Laszlo, I.: Modeling surface solar irradiance for satellite applications on a global scale, J. Appl. Meteorol., 31, 194–211, https://doi.org/10.1175/1520-0450(1992)031<0194:MSSIFS>2.0.CO;2, 1992.
Shi, H., Li, T., and Wang, G.: Temporal and spatial variations of potential evaporation and the driving mechanism over Tibet during 1961–2001, Hydrolog. Sci. J., 62, 1469–1482, https://doi.org/10.1080/02626667.2017.1332416, 2017.
Stull, R. B.: An introduction to boundary layer meteorology, Kluwer Academic Publishers, Dordrecht, https://doi.org/10.1007/978-94-009-3027-8, 1988.
Su, Z.: The Surface Energy Balance System (SEBS) for estimation of turbulent heat fluxes, Hydrol. Earth Syst. Sci., 6, 85–100, https://doi.org/10.5194/hess-6-85-2002, 2002.
Szilagyi, J., Crago, R., and Qualls, R.: A calibration-free formulation of the complementary relationship of evaporation for continental-scale hydrology, J. Geophys. Res.-Atmos., 122, 264–278, https://doi.org/10.1002/2016JD025611, 2017.
Wang, B., Ma, Y., Su, Z., Wang, Y., and Ma, W.: Quantifying the evaporation amounts of 75 high-elevation large dimictic lakes on the Tibetan Plateau, Science Advances, 6, eaay8558, https://doi.org/10.1126/sciadv.aay8558, 2020a.
Wang, G., Lin, S., Hu, Z., Lu, Y., Sun, X., and Huang, K.: Improving actual evapotranspiration estimation integrating energy consumption for ice phase change across the Tibetan Plateau, J. Geophys. Res.-Atmos., 125, e2019JD031799, https://doi.org/10.1029/2019JD031799, 2020b.
Wang, K., Liu, J., Zhou, X., Sparrow, M., Ma, M., Sun, Z., and Jiang, W.: Validation of the MODIS global land surface albedo product using ground measurements in a semidesert region on the Tibetan Plateau, J. Geophys. Res.-Atmos., 109, D05107, https://doi.org/10.1029/2003JD004229, 2004.
Webb, E. K., Pearman, G. I., and Leuning, R.: Correction of flux measurements for density effects due to heat and water vapour transfer, Q. J. Roy. Meteor. Soc., 106, 85–100, https://doi.org/10.1002/qj.49710644707, 1980.
Xie, Z., Hu, Z., Gu, L., Sun, G., Du, Y., and Yan, X.: Meteorological forcing datasets for blowing snow modeling on the Tibetan Plateau: Evaluation and intercomparison, J. Hydrometeorol., 18, 2761–2780, https://doi.org/10.1175/JHM-D-17-0075.1, 2017.
Xu, C. Y. and Singh, V. P.: Evaluation of three complementary relationship evapotranspiration models by water balance approach to estimate actual regional evapotranspiration in different climatic regions, J. Hydrol., 308, 105–121, https://doi.org/10.1016/j.jhydrol.2004.10.024, 2005.
Yang, K., Wu, H., Qin, J., Lin, C., Tang, W., and Chen, Y.: Recent climate changes over the Tibetan Plateau and their impacts on energy and water cycle: A review, Global Planet. Change, 112, 79–91, https://doi.org/10.1016/j.gloplacha.2013.12.001, 2014.
Yang, W., Guo, X., Yao, T., Yang, K., Zhao, L., Li, S., and Zhu, M.: Summertime surface energy budget and ablation modeling in the ablation zone of a maritime Tibetan glacier, J. Geophys. Res., 116, D14116, https://doi.org/10.1029/2010JD015183, 2011.
Yao, T., Thompson, L., Yang, W., Yu, W., Gao, Y., Guo, X., Yang, X., Duan, K., Zhao, H., Xu, B., Pu, J., Lu, A., Xiang, Y., Kattel, D. B., and Joswiak, D.: Different glacier status with atmospheric circulations in Tibetan Plateau and surroundings, Nat. Clim. Change, 2, 663–667, https://doi.org/10.1038/nclimate1580, 2012.
Yao, T., Lu, H., Feng, W., and Yu, Q.: Evaporation abrupt changes in the Qinghai-Tibet Plateau during the last half-century, Scientific Reports, 9, 20181, https://doi.org/10.1038/s41598-019-56464-1, 2019.
Zhang, C., Liu, F., and Shen, Y.: Attribution analysis of changing pan evaporation in the Qinghai–Tibetan Plateau, China, Int. J. Climatol., 38, e1032–e1043, https://doi.org/10.1002/joc.5431, 2018.
Zhang, K., Kimball, J. S., Nemani, R. R., and Running, S. W.: A continuous satellite-derived global record of land surface evapotranspiration from 1983 to 2006, Water Resour. Res., 46, W09522, https://doi.org/10.1029/2009WR008800, 2010.
Zhang, T., Gebremichael, M., Meng, X., Wen, J., Iqbal, M., Jia, D., Yu, Y., and Li, Z.: Climate-related trends of actual evapotranspiration over the Tibetan Plateau (1961–2010), Int. J. Climatol., 38, e48–e56, https://doi.org/10.1002/joc.5350, 2018.
Zhang, Y., Liu, C., Tang, Y., and Yang, Y.: Trends in pan evaporation and reference and actual evapotranspiration across the Tibetan Plateau, J. Geophys. Res., 112, D12110, https://doi.org/10.1029/2006JD008161, 2007.
Zhong, L., Ma, Y., Hu, Z., Fu, Y., Hu, Y., Wang, X., Cheng, M., and Ge, N.: Estimation of hourly land surface heat fluxes over the Tibetan Plateau by the combined use of geostationary and polar-orbiting satellites, Atmos. Chem. Phys., 19, 5529–5541, https://doi.org/10.5194/acp-19-5529-2019, 2019.
Zhou, J., Wang, L., Zhang, Y., Guo, Y., and He, D.: Spatiotemporal variations of actual evapotranspiration over the Lake Selin Co and surrounding small lakes (Tibetan Plateau) during 2003–2012, Science China Earth Sciences, 59, 2441–2453, https://doi.org/10.1007/s11430-016-0023-6, 2016.
Zou, M., Zhong, L., Ma, Y., Hu, Y., Huang, Z., Xu, K., and Feng, L.: Comparison of two satellite-based evapotranspiration models of the Nagqu river basin of the Tibetan Plateau, J. Geophys. Res.-Atmos., 123, 3961–3975, https://doi.org/10.1002/2017JD027965, 2018.