the Creative Commons Attribution 4.0 License.
the Creative Commons Attribution 4.0 License.
 | 12 Jul 2021
Slope deformation, reservoir variation and meteorological data at the Khoko landslide, Enguri hydroelectric basin (Georgia), during 2016–2019
Alessandro Tibaldi
Federico Pasquaré Mariotto
Paolo Oppizzi
Fabio Luca Bonali
Nino Tsereteli
Levan Mebonia
Johni Chania
The Greater Caucasus mountain belt is characterized by deep valleys, steep slopes and frequent seismic activity, the combination of which results in major landslide hazard. Along the eastern side of the Enguri water reservoir lies the active Khoko landslide, whose head scarp zone affects the important Jvari–Khaishi–Mestia road, one of the few connections with the interior of the Greater Caucasus. Here, we present a database of measurement time series taken over a period of 4 years (2016–2019) that enables us to compare slope deformation with meteorological factors and human-induced perturbations owing to variations in the water level of the reservoir. The monitoring system we used is composed of two digital extensometers, placed within two artificial trenches excavated across the landslide head scarp. The stations are also equipped with internal and near-ground surface thermometers. The dataset is integrated by daily measurements of rainfall and lake level. The monitoring system – the first installed in Georgia – was set up in the framework of a NATO-funded project, aimed at assessing different types of geohazards affecting the Enguri artificial reservoir and the related hydroelectrical plant. Our results indicate that the Khoko landslide displacements appear to be mainly controlled by variations in hydraulic load, in turn induced by lake level oscillations. Rainfall variations might also have contributed, though this is not always evident for all the studied period. The full databases are freely available online at the following DOI: https://doi.org/10.20366/unimib/unidata/SI384-2.0 (Tibaldi et al., 2020).
- Article
(30337 KB) - Full-text XML
- BibTeX
- EndNote


Landslides are widespread natural hazard sources, affecting most of the world's countries and capable of causing serious economic losses. In fact, they can damage buildings, communication systems and the overall environment. Moreover, these natural events are a major cause of loss of life (Froude and Petley, 2018). The monitoring of landslides is a necessary step to implement protective measures, as it allows us to recognize possible acceleration in slope deformation rate and alert residents or close road communication systems, where needed. This type of monitoring is also of paramount importance for assessing possible triggering factors (Casagli et al., 2009), determining the level of risk (Spiker and Gori, 2003), and planning land use and risk management (Fell et al., 2005; Bertolini et al., 2005). This activity can be of special relevance in cases of complex situations, such as those affecting an artificial water reservoir, where water variations can destabilize (or stabilize) the slopes overlooking the basin. In such cases, multiparameter data can be crosscut in order to look into possible correlations between lake level variations, meteorological conditions and slope deformations, which in turn are key to effectively managing the filling and emptying of the reservoir.
The database of slope deformation can be derived from a variety of possible monitoring tools, which range from on-site instruments to remotely controlled ones. The former include continuous or intermittent data collection, such as settlement gauges, inclinometers and piezometric groundwater measurements (Meisina et al., 2008). Surveys can be carried out by detecting surface movements of unstable areas through levels, theodolites, electronic distance measurement and total station GPS measurements (Liu, 2006). Remote control systems include aerial or terrestrial photogrammetry in the visible or radar ranges (Bitelli et al., 2004). Monitoring the distance between two points across the main landslide head scarp is the most effective way to describe the displacements within the landslide at a site far away from its toe. This is particularly helpful in assessing the susceptibility of the whole landslide body to variations in toe conditions: in fact, a feedback at the head scarp helps to decipher the long range of these effects.
In November 2016, an international team of scientists, under the aegis of NATO, set about working in the area of the Enguri artificial water reservoir, on the southwestern foothills of the Greater Caucasus, Georgia (Fig. 1). During the first of several research missions, the team installed, for the first time in Georgia, two digital extensometers across the head scarp of the major, active Khoko landslide, located along the eastern mountain slope overlooking the reservoir. The associated hydroelectrical plant, built during the Soviet era (Fig. 1c), is responsible for about half of the energy supply to the country (Tibaldi et al., 2018). This monitoring activity is particularly relevant because the study area is located in a region affected by widespread seismicity (Fig. 1a), associated with still-active mountain building processes, which have led to the formation of the Greater Caucasus and Lesser Caucasus, resulting from the continent–continent collision between the African–Arabian and Eurasian plates (Reilinger et al., 1997, 2006; Koçyigit et al., 2001; Pasquaré et al., 2011). Seismicity can produce earthquakes with Ms values of 6–7 (Tsereteli et al., 2016) and macroseismic intensities up to 10 (Varazanashvili et al., 2018), as a consequence of active compressional tectonics (Tsereteli et al., 2016; Tibaldi et al., 2017a, b, 2019). As broadly agreed upon in the scientific literature, there is a tight connection between active tectonic processes and the occurrence of landslides (e.g., Tibaldi et al., 2004, 2015; Tibaldi and Pasquaré, 2008; Pasquaré Mariotto and Tibaldi, 2016). As it is beyond doubt that, in the future, a seismic event will happen again in the area, the installed monitoring landslide system will be instrumental in quantitatively assessing the effects of ground shaking on the slope deformation rate.
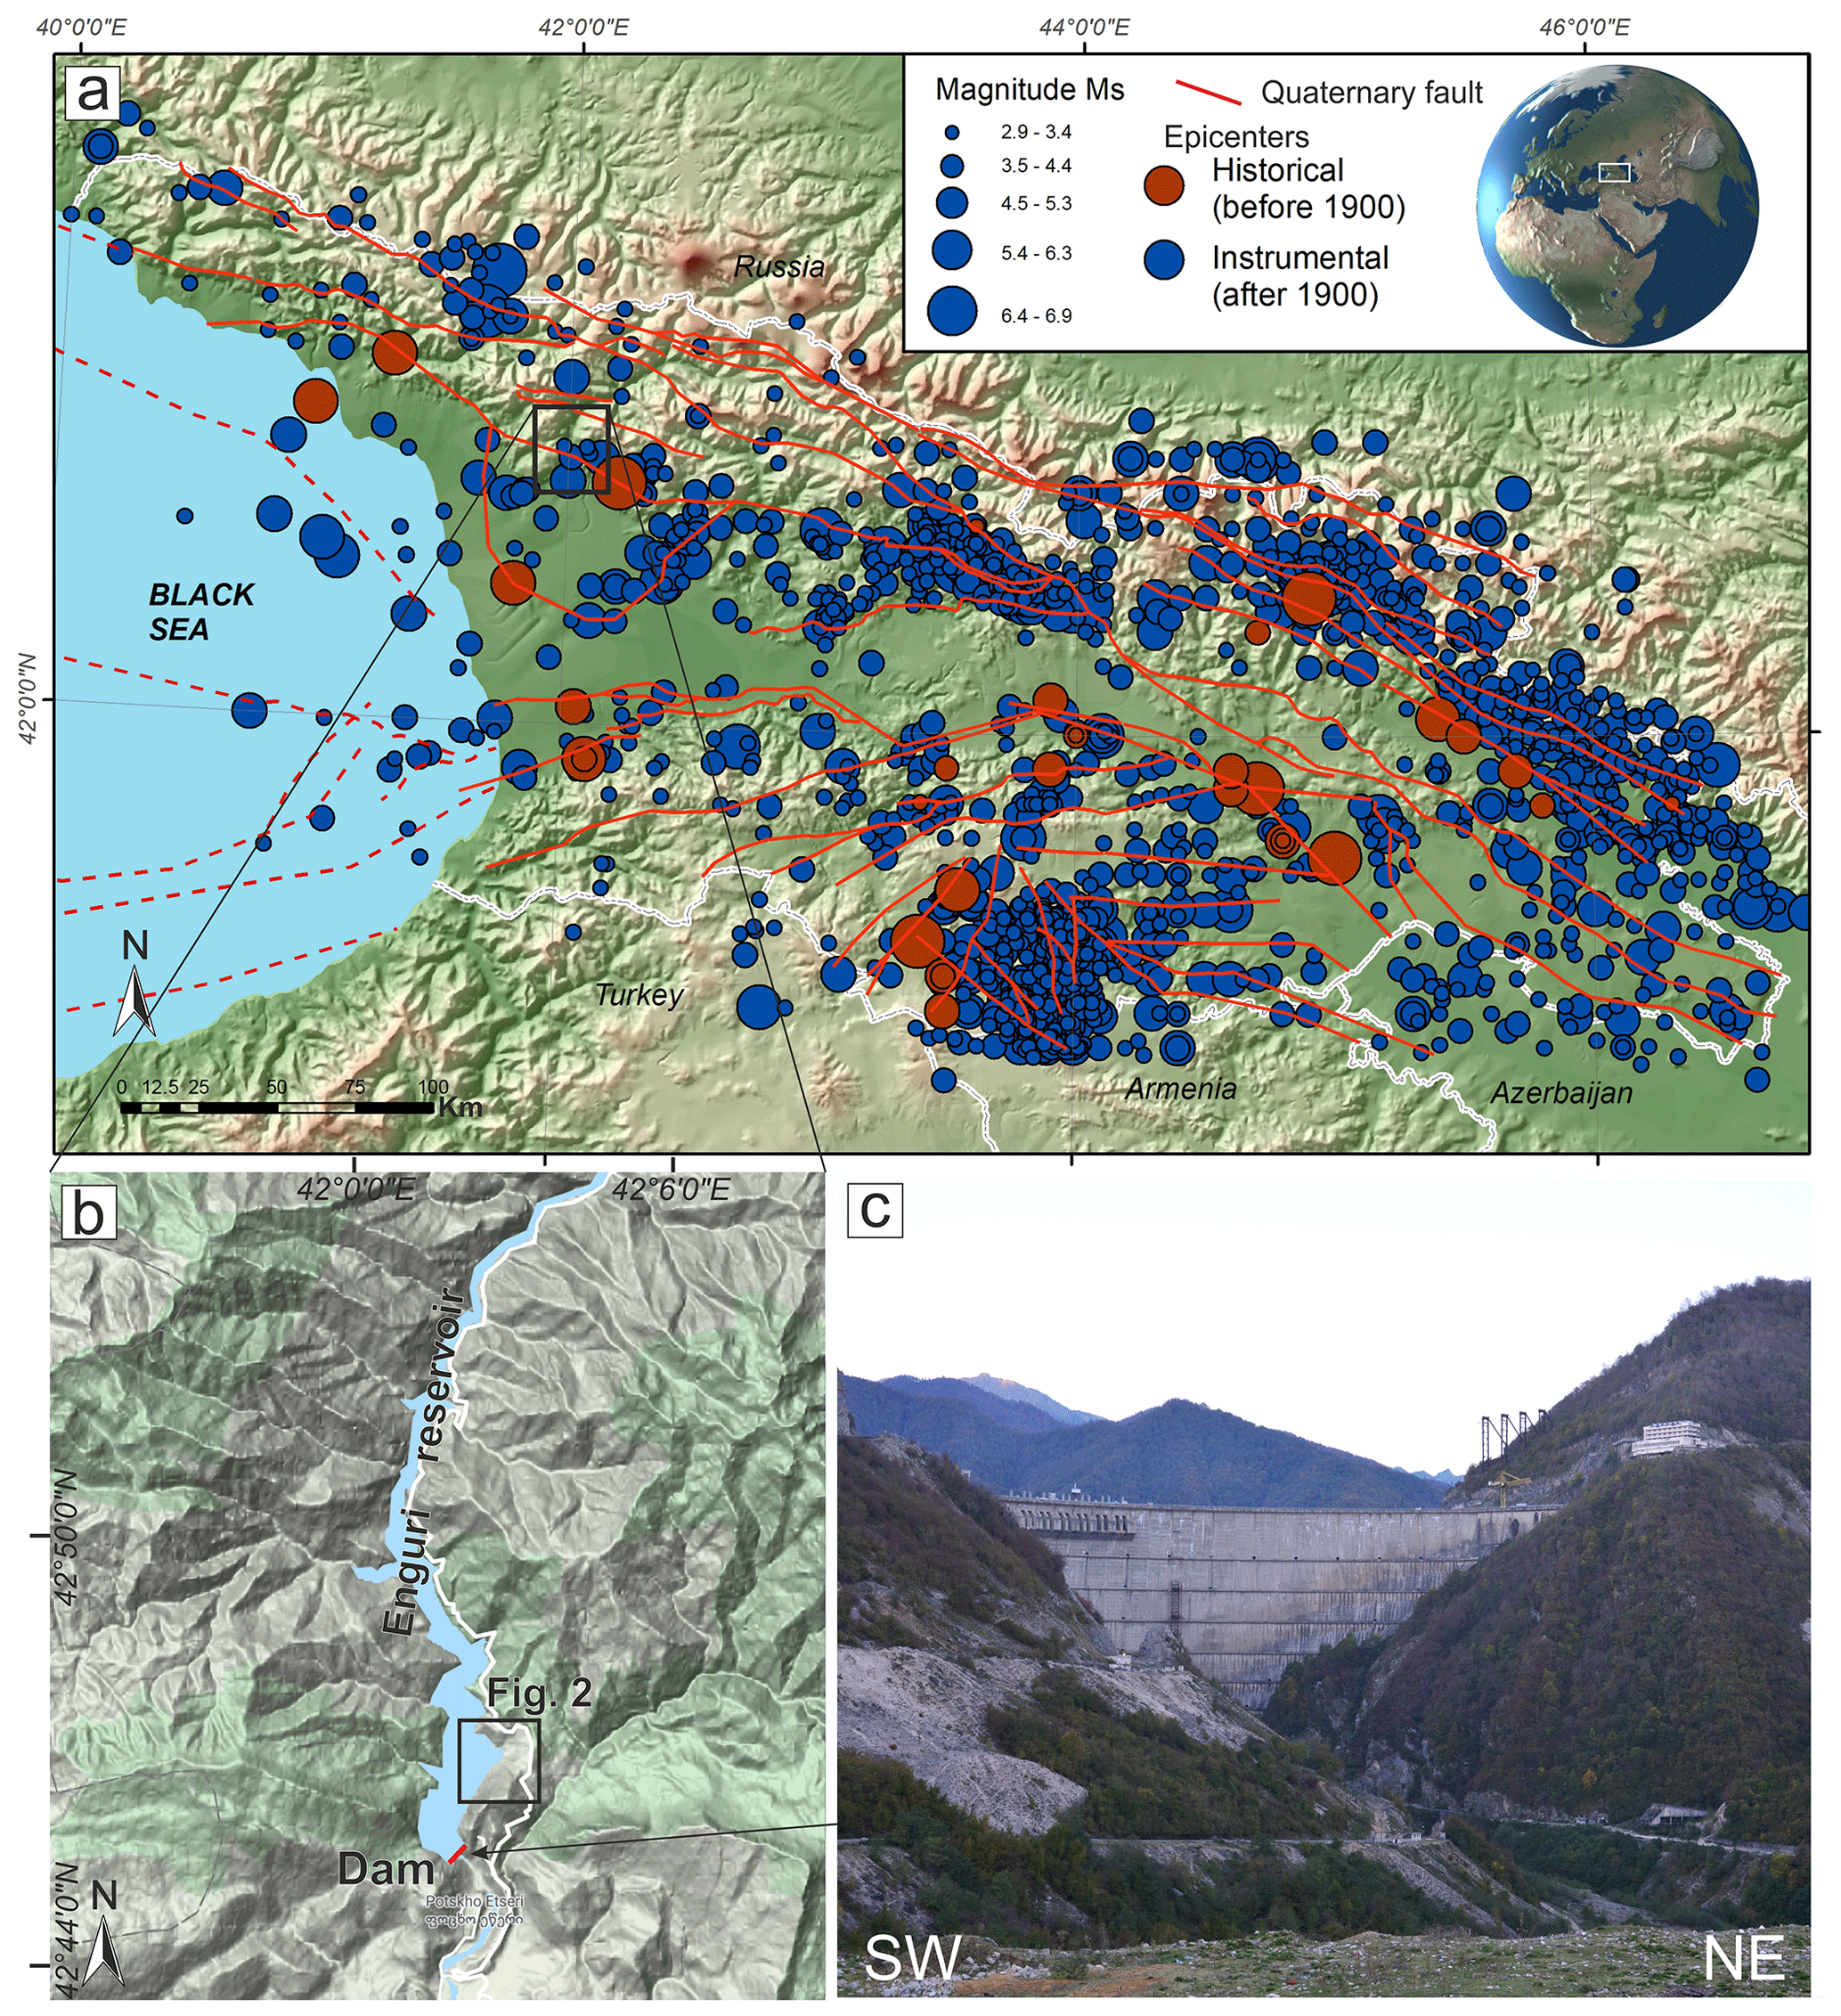
Figure 1(a) Main historic and instrumental earthquake epicenters in the western Greater Caucasus; the black rectangle shows the area of panel (b). White lines are country borders; the main Quaternary faults (red lines) are from Gulen and EMME WP2 Team (2011) and Tsereteli et al. (2016). Reference system: WGS84, geographic coordinates. (b) DEM of the Enguri reservoir area, with dam location, © Google Maps. (c) Photo of the Enguri dam.
Last but not least, the Jvari–Khaishi–Mestia road cuts across the uppermost portion of the Khoko landslide, along a 2 km long stretch, at an elevation of 700 m a.s.l. Several field surveys in the area enabled the team to assess the presence of developing cracks, shear planes, opening of holes and an overall active deformation concentrated along 150–200 m long road segments, which could pose serious threats to road traffic security. These fractured zones are being continuously repaired by way of asphalt refilling, with the purpose of preventing serious damage and road accidents.
We hereby provide and illustrate the database of measurements gathered by way of the integrated monitoring system installed at the Khoko landslide. The main goals of our research are to identify the range and patterns of deformation and assess possible relations between changes in water level at the artificial Enguri reservoir, meteorological factors (temperature and rain) and slope deformations. The analysis of these multi-temporal datasets is of broad interest, as it can provide a detailed framework for planning the most appropriate actions in the management of major water reservoirs aimed at energy production.
2.1 Quaternary geology and geomorphology
The study area is characterized by substrate rocks and widespread Quaternary deposits, which have been mapped thanks to a new geological survey, integrated with geological maps compiled prior to the creation of the artificial lake (Fig. 2). The studied slope is marked by landforms that are typical of recent/active gravitational deformation; the total surface area affected by slope instability, which is about 1.2 km2, is characterized by debris, colluvium, alluvial, and ancient landslide deposits (Fig. 2) and fractured substrate rocks. Debris deposits are widespread in the lower parts of the mountain located in the southern sector of the study area, outside the landslide area. They can also be observed at the head scarp of the landslide. Colluvium deposits mantle the central part of the landslide body and the lowermost slope in the southwestern sector of the study area. Landslide deposits are widespread in the upper portion of the landslide body. Alluvial deposits are located along the trace of the old Enguri river, now below the artificial lake's level.

Figure 2Geological and geomorphological map of the study area, modified after Tibaldi et al. (2019). Location in Fig. 1b.
At an altitude of 720–740 m, a number of scarps can be noticed, facing westward and affecting areas near the Jvari–Khaishi–Mestia road (Figs. 2 and 3). The height of such scarps ranges from 20 to 70 m, representing the head scarps. These overall scarps cannot be the effect of roadcut during the road construction because these scarps are longer than the road, and thus the road only in part follows the scarp. In fact, the scarp is prolonged outward from the road in the northern part. Moreover, the road cuts through the scarp in the southern part. Finally, the very large height of these scarps is poorly compatible with the supposed cut of a small road, especially considering that this scarp height is also present outside of the road. Anyway, some local modification of the lower part of the head scarp profile may have taken place during the road excavation. At the foot of the scarps, the topography either is horizontal or gently dips westward, suggesting a possible uphill tilting of the slope (Fig. 3a). The asphalted surface of the road here is affected by fissures, as wide as a few centimeters, and by 20 cm high (in 2016) westward-facing scarps (Fig. 3d). These structures are parallel to sub-parallel to the morphologically high head scarps. As documented by Tibaldi et al. (2019), in the forest across the southern segment of the head scarps, tens of meters long and up to 3.8 m wide fissures were found. Some of the trees, with trunks of about 20 cm in diameter, were growing inside the fissures, suggesting that the fissures have a long history, dating back at least several tens of years (Tibaldi et al., 2019).
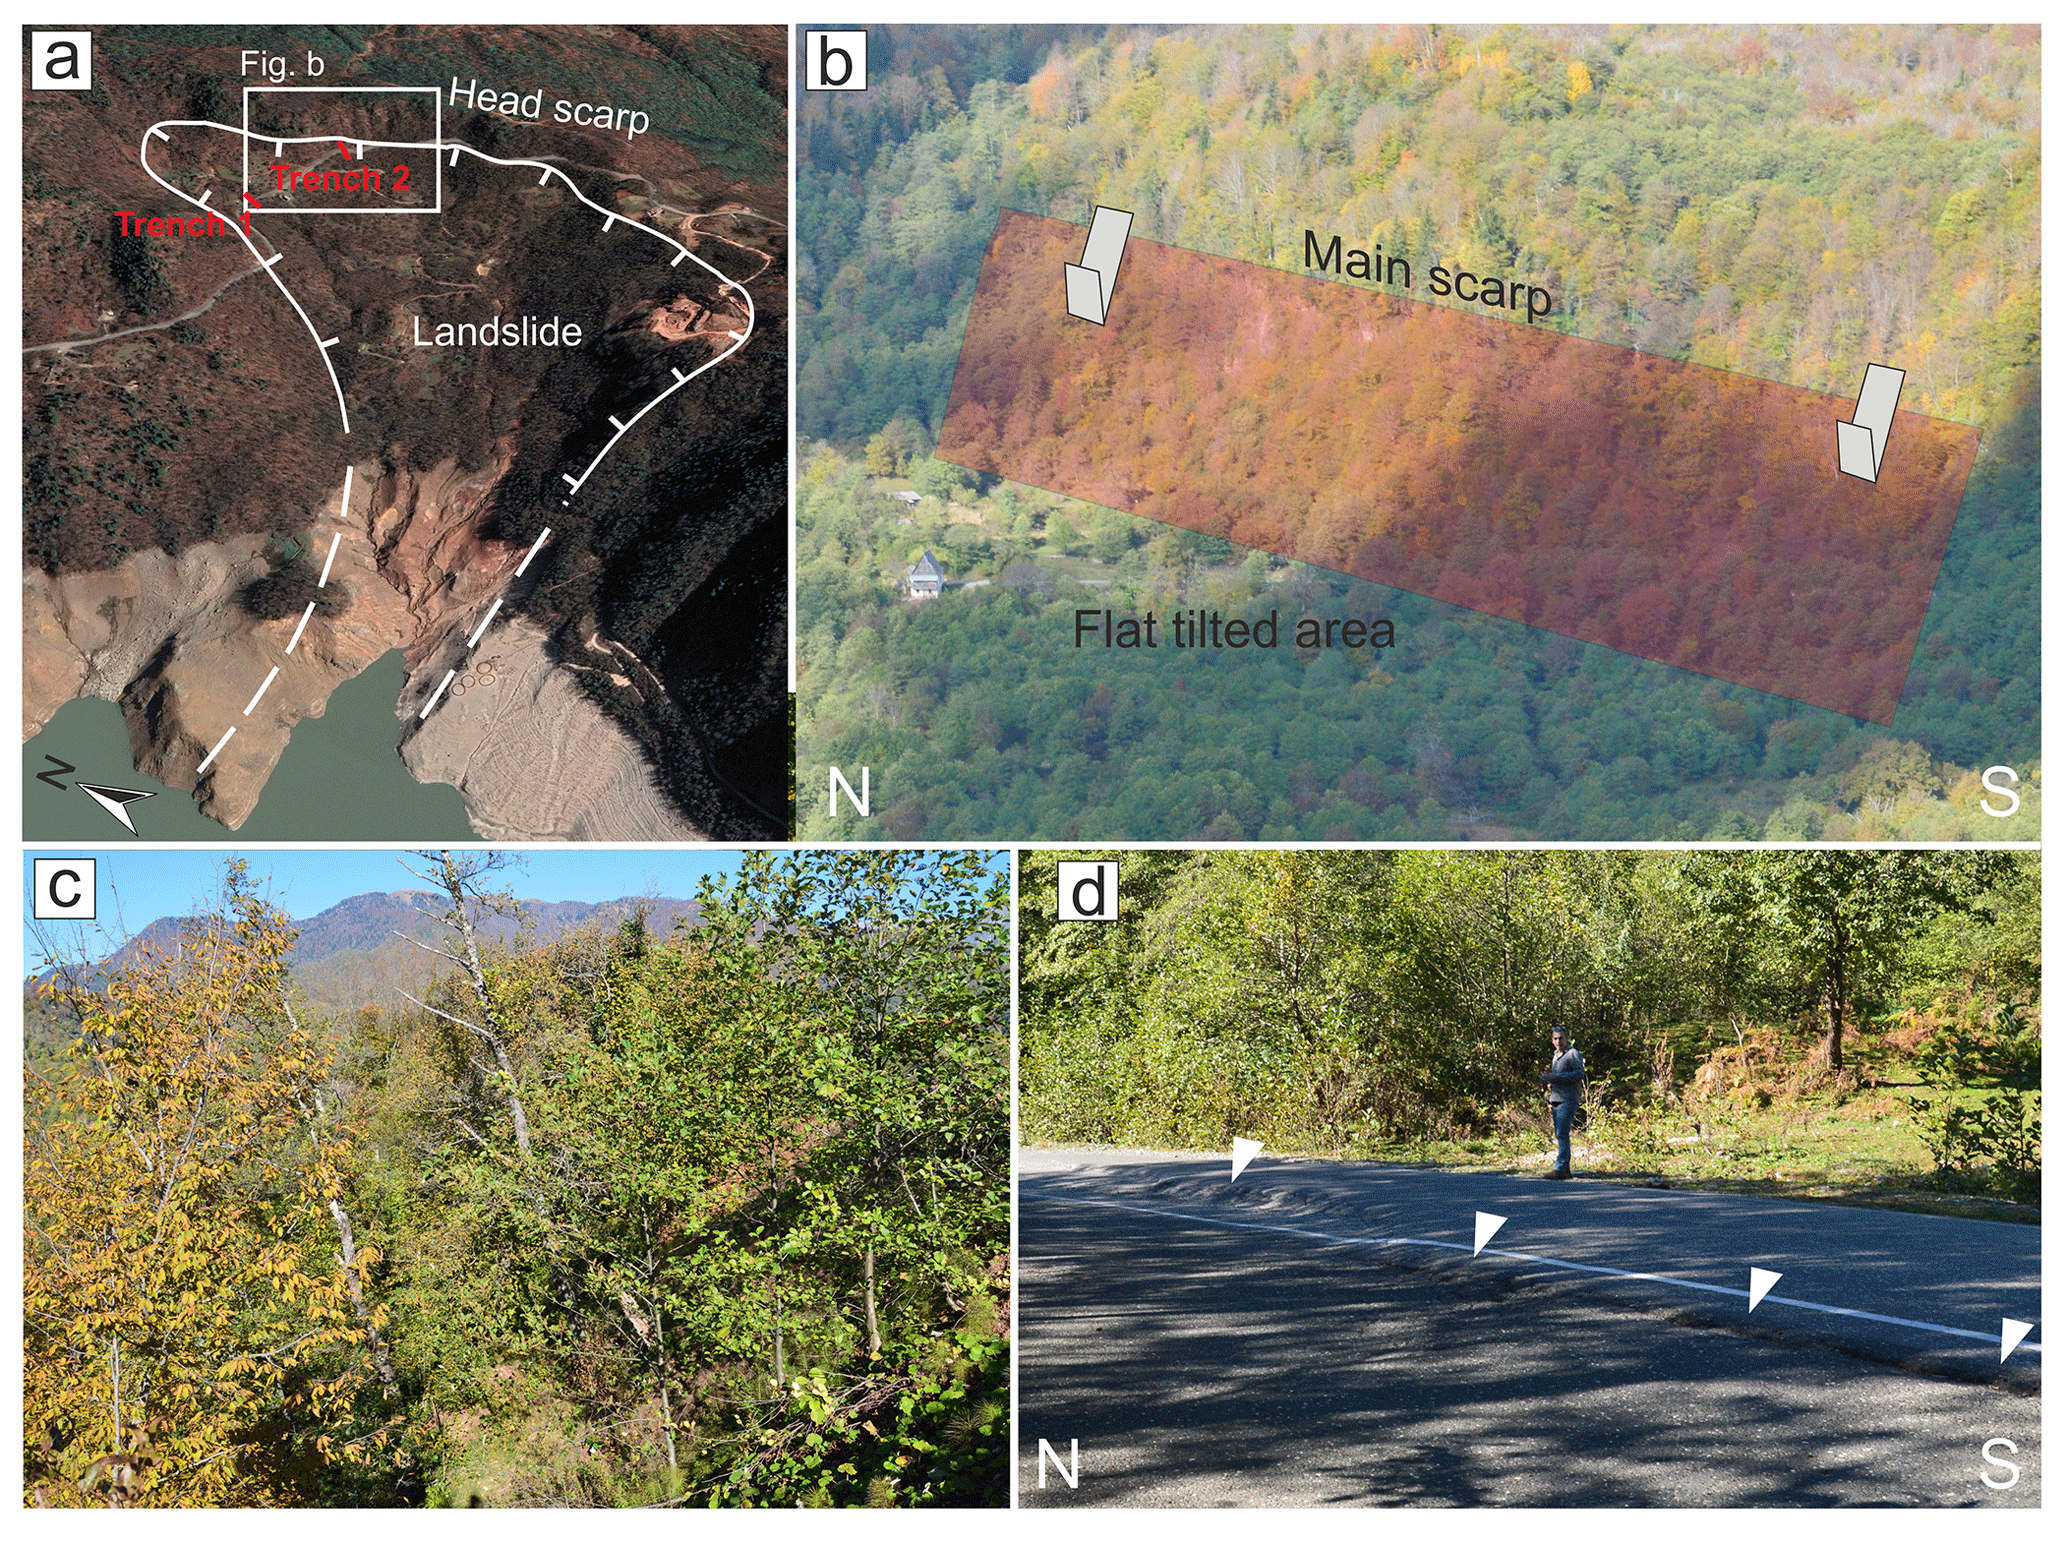
Figure 3(a) Oblique view of the studied landslide (© Google Earth 2021); trench locations are shown. (b) Photo of a segment of the landslide head scarp; it is worth noticing the flat-lying area at the foot of the scarp, created by the uphill tilting of the slope during rotational movements of the landslide block. House for scale (left-hand side of the flat area). (c) Example of tilted trees along the landslide slope. (d) Photo of the escarpments cutting the Jvari–Khaishi–Mestia road (white triangles), representing the surface expression of active landslide slip planes.
Downhill from the head scarp, several changes in inclination affect the slope, resulting in a series of downhill-facing scarps. Most are oriented perpendicularly to the local slope dip and can be observed on the upper part of the slope. This suggests the possible presence of secondary landslide slip planes (Tibaldi et al., 2019). Besides, most of the studied slope is characterized by the presence of several tilted trees; this is another indicator of active slope deformation (Fig. 3c).
The arrangement of river streams, as shown in Fig. 2, is based on the present-day river network and Soviet-era topographic maps compiled before the buildup of the water reservoir. In the slope section above the present-day lake, the rivers mostly follow the average slope dip, according to a dendritic pattern. Below the present-day lake level, one single stream was draining the landslide area. Here, at the toe of the slope, this single stream was running parallel to the main Enguri river but with a northward, opposite flow (Tibaldi et al., 2019). This is an anomaly in the stream pattern that can be linked to a disturbance in the average slope topography, suggesting a possible early bulging of the landslide toe.
2.2 Substrate description
Around the landslide area, Jurassic volcanic and terrigenous rocks and Cretaceous carbonate deposits crop out (Fig. 2), generally dipping to the south. The inclination of the Cretaceous strata cropping out around the Enguri dam is on the order of 60–70∘, whereas the bedding attains a shallower dip northward, becoming subhorizontal toward the northern part of the reservoir. Below the carbonate layers, Jurassic deposits can be observed, made of sandstones, tuffs, tuff breccias and gypsum layers that crop out locally along the southeastern slopes of the reservoir. In the landslide area, essentially Jurassic and Quaternary deposits crop out. Here, most of the Jurassic rocks dip to the east, with slight variations (Fig. 4b). Presently, gypsum is excavated from a small mine, for economic purposes. Near the coast of the artificial lake, at the foot of the onshore section of the landslide, there are intensely deformed gypsum rocks.

Figure 4(a) Trace (dashed red line) of the geological section and location (red dots) of the piezometers described in Table 1. Black lines are major landslide scarps (© Google Earth 2021). (b) Geological section across the slope facing the Enguri reservoir. Black columns represent locations and depth of logs used to construct the cross section. Dashed black lines are the main potential slip surfaces calculated through a static analysis by Tibaldi et al. (2019); red lines with arrows are landslide scarps surveyed in the field. Data of the submerged part are derived from geological surveys made in the Soviet era, before the construction of the dam.
The complexity of the geometry of the head scarps, as well as the morphology of the slope, and the size of the whole unstable slope suggest that the landslide slip surface is not unique and there are probably different, partially superimposed slip planes. This interpretation is supported by the analysis of the state of preservation of piezometers originally installed in the landslide body. We checked the instruments and noticed that most of the piezometers installed during 2015 across the landslide are interrupted at depths between 16 and 42 m (Table 1). Although the a priori hypothesis must be mentioned that these interruptions may have been produced by infiltration of fine material into the piezometers, we made the measurements in May 2017, only 2 years after their installation; thus the very recent age of the piezometers suggests that these may be the depths where the piezometric logs are intersected by the sliding surfaces of active landslides. This is supported by the observation that close piezometers, originally excavated down to different depths, are now interrupted at the same depth, such as BH3 and BH4 cut at −16 m and BH1 and BH2 cut at −35 to −36 m. The fact that in general these ruptures are located at different depths indicates the presence of different slip planes.
Table 1Characteristics of measured piezometers and water table depth; b.g.s. refers to depths below ground surface.
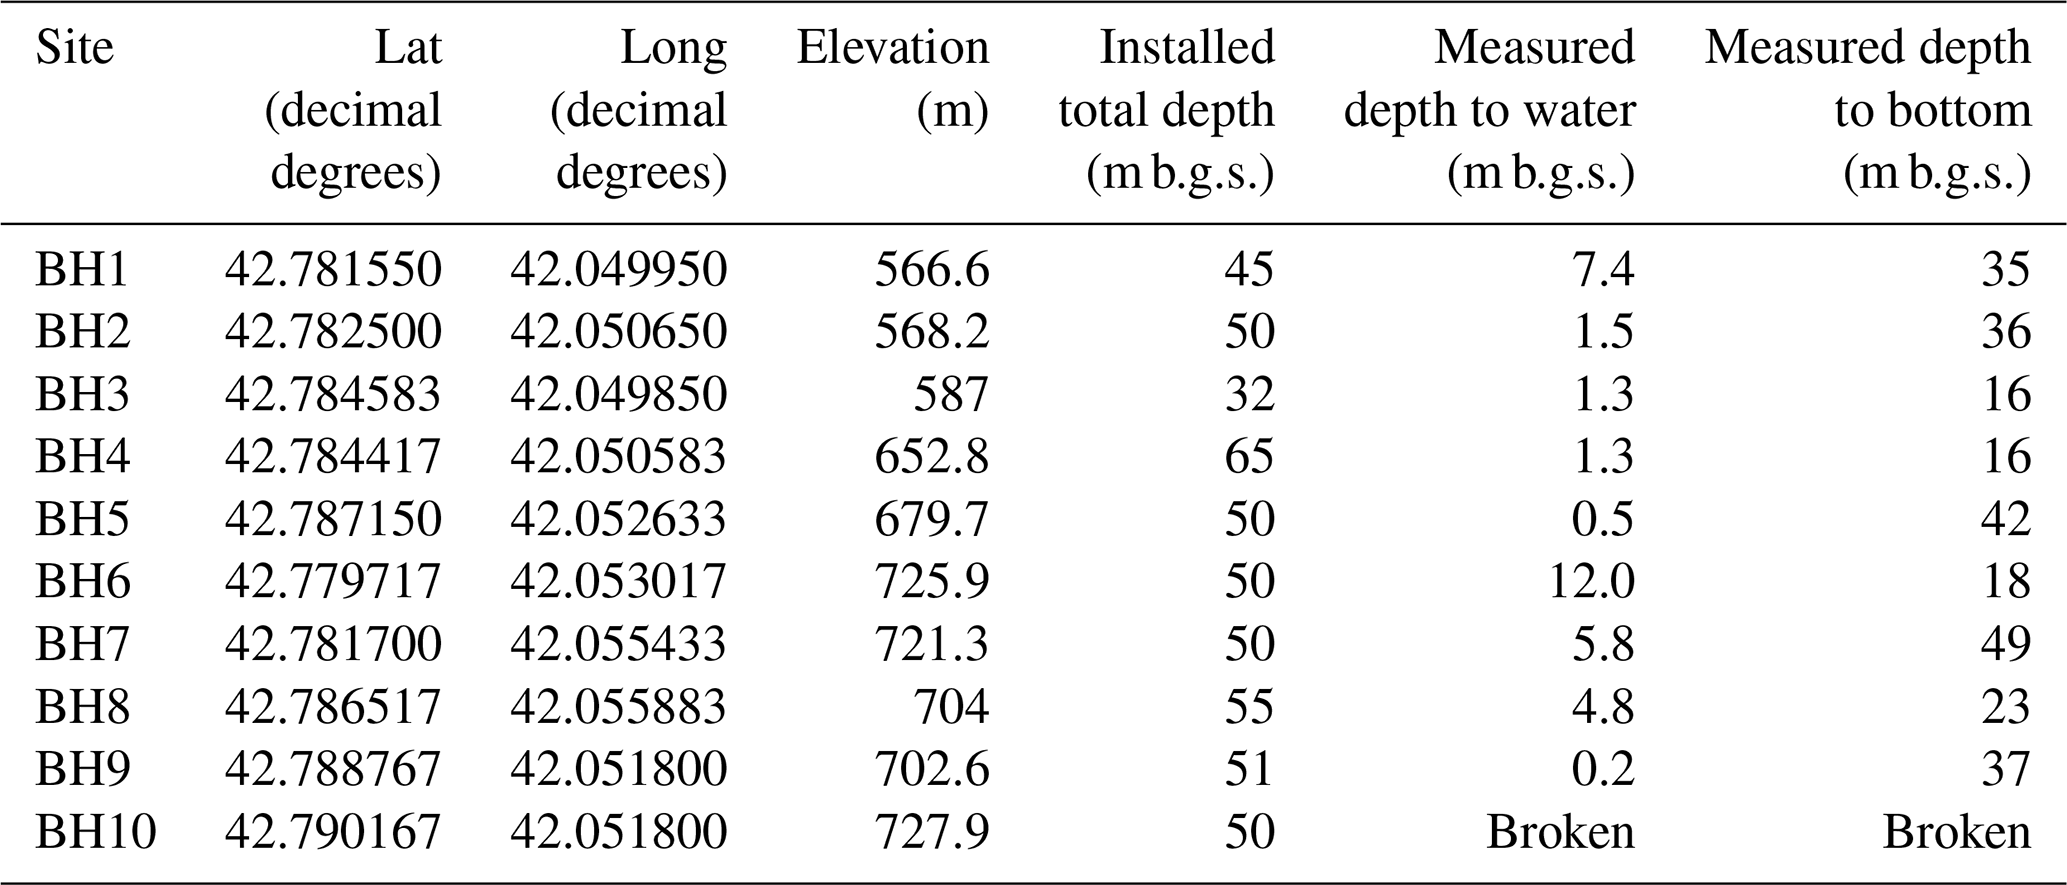
Other logs were drilled during the Soviet era to reconstruct the rock distribution in the substrate. An analysis of the lithological characteristics of the logs shows that the intact substrate rock is located at deeper levels, on the order of several tens of meters. For example, logs 3261 and 3297 (drilled in 1966) (Fig. 4b) show the presence of clastic, unconsolidated deposits, rich in clay and locally gypsum fragments, down to a depth of 57.5 m (log 3297), and/or clastic deposits with a sill-to-clay matrix down to at least 61 m (log 3297) and at least 80 m (log 3261). Log 3291 (also drilled in 1966) shows the presence of clay and gypsum deposits down to a depth of 30 m and of the substrate at greater depths. The geological survey integrated with the observations of the logs and piezometers enabled us to prepare the geological section of Fig. 4b, which extends across the onshore landslide portion and below the lake (Fig. 4a). The section indicates that the intact substrate rock is always deeper than 30 m, down to 80 m. In this section, we added the head scarps of slip planes as observed in the field (red lines) and the main slip surfaces (dashed black lines) as obtained by a numerical slope analysis performed by Tibaldi et al. (2019). The analysis was carried out considering different levels of the lake reservoir; in the section are represented (i) the deepest slip surface (corresponding to FS <1) among those obtained with a maximum of 510 m a.s.l. of the reservoir water level (this surface starts at log BH4), (ii) the deepest slip surface (corresponding to FS <1) among those calculated with a minimum of 430 m a.s.l. of the reservoir water level (this surface starts at log BH3) and (iii) the shallowest slip surface that is present in both scenarios of the lake level.
In 2016, two trenches were excavated across the main head scarps of the Khoko landslide, separated by about 240 m. The location of the sites selected for trenching is indicated in Fig. 3a, and these locations were based upon the presence of clear indicators of active deformation on the road, at the foot of the main landslide scarps. Each of the two trenches was suitable for hosting a horizontal, digital extensometer (wire linear potentiometric transducer, SF500). The two trenches were opened perpendicularly to the scarp strike, crossing the road at a high angle (Fig. 5a). The instrumentation was placed within a protection system aimed at avoiding disturbance or damage from heavy load traffic (Fig. 5b–d). The opening of the trenches was performed in two stages so as to enable vehicles to drive through the area along alternating lanes. The protection of the measurement stations consists of a channel in reinforced concrete, buried down to a depth of at least 50 cm.
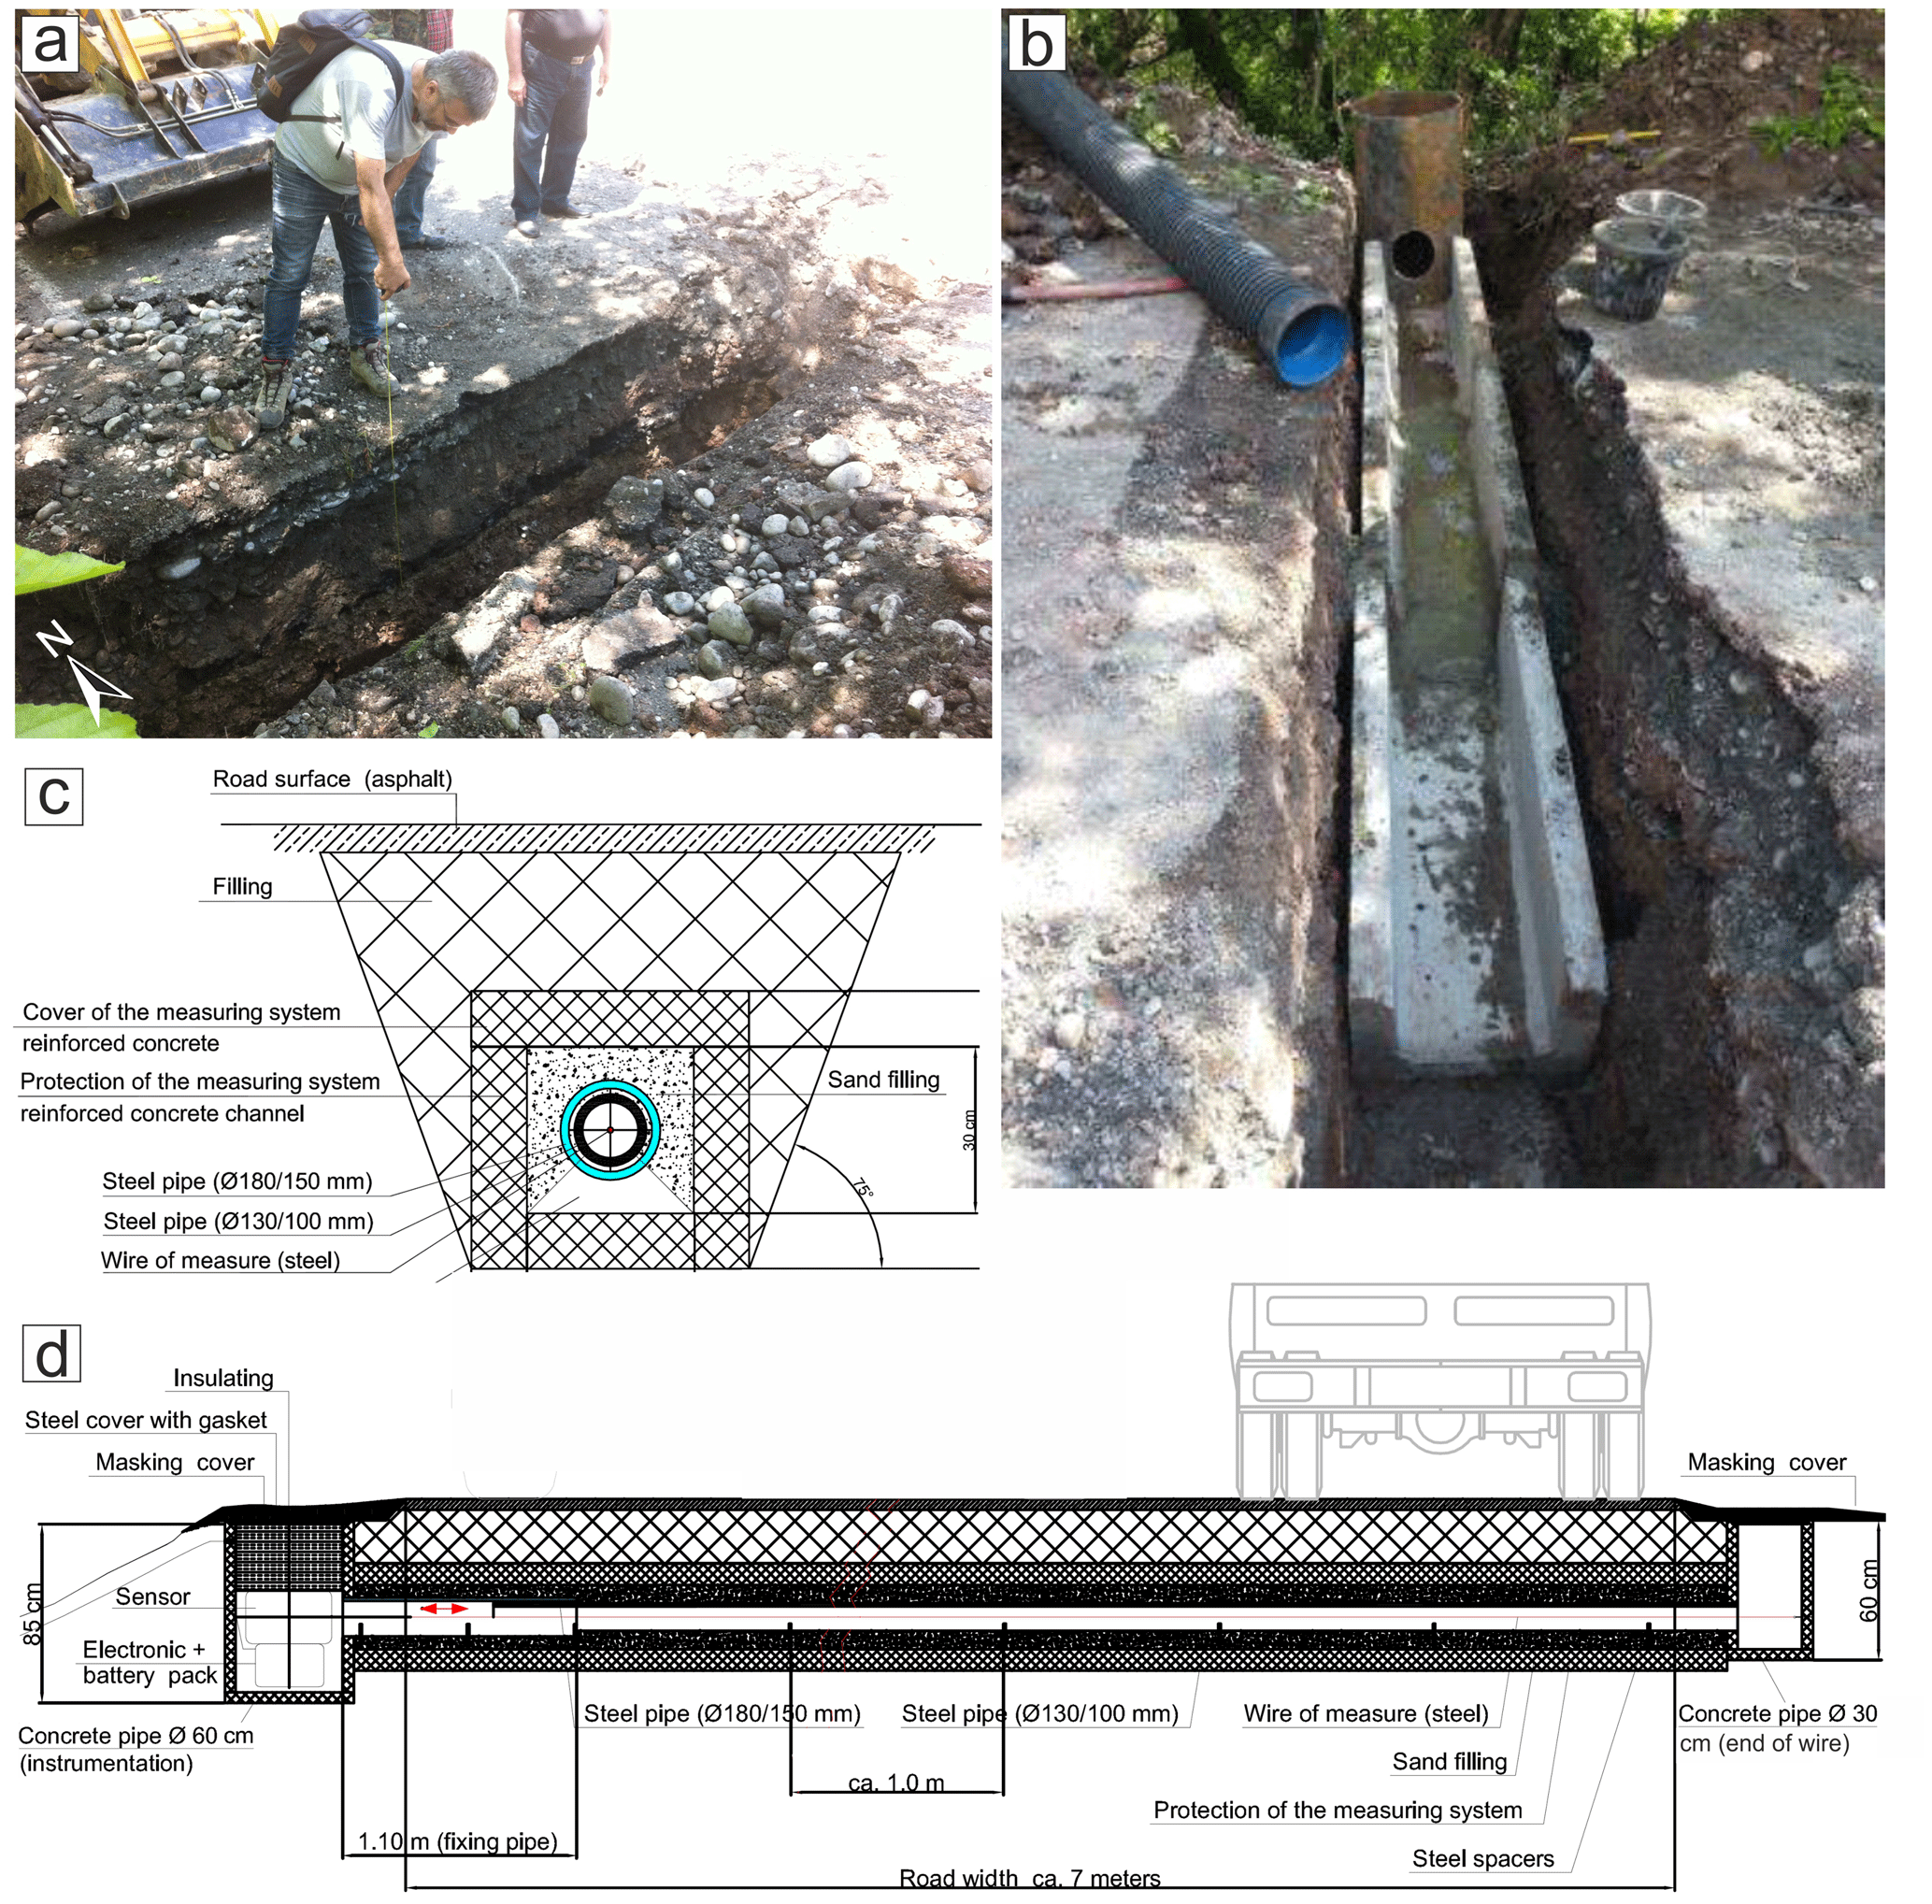
Figure 5(a) Opening of trench no. 1. (b) Installation of the concrete protection for the extensometer. (c) Section transversal to the extensometer system. (d) Longitudinal section of the extensometer system. Location of the two measurement stations provided in Fig. 3a.
The instrument is composed of a wire, a digital meter and a recorder system. The stainless-steel wire changes its length based on the relative movements of the piercing points to which it is connected. The wire was inserted into a pipe, laid down horizontally and protected with sand (Fig. 5c, d). At both ends, steel pipes were positioned, aimed at securing the measurement wire and the electronic instrumentation. Each vertical tube was equipped with a steel cover and gasket. The two covers were buried underneath a 15 cm thick soil layer. These operations were made more difficult by the presence of a pavement in concrete beneath the present-day asphalt layer. The meter is a wire potentiometric position transducer that turns a linear motion into a resistance variation. It is made of a precision rotating potentiometer operated by the winding or unwinding stainless-steel wire.
Due to the impossibility of transmitting the data directly to a computer at the Enguri dam premises or via the internet (due to the remoteness of the site), the measurements are stored in a digital recorder (data logger THEMIS USB GPRS) and downloaded on a 30 d basis. The system is connected to a set of insulated batteries with a life of 6 months.
Extensometer no. 1 was put into operation in November 2016, whereas the second extensometer began recording data in May 2017. The instruments also include an internal and external sensor of temperature – a Pt100.
The station for measuring the Enguri lake level is installed at an altitude of 360 m in the dam. It is made of a Multi Channel Recorder RSG30 Ecograph T, by Endress+Hauser, using the software ETU00xA, V2.02.xx. The data are transmitted in real time to the dam administration and stored in local computers.
Rainfall amounts are recorded by a station, situated at an altitude of 540 m near the dam's administrative building. The station features the Davis Vantage Pro2 instrument, suitable for measuring rainfall, wind speed, temperature and humidity, with data updated every 2.5 s. It comes with a self-emptying tipping spoon determining rainfall amounts in 0.2 mm increments and is laser-calibrated for increasing accuracy. The data are transmitted in real time to the dam administration and stored in local computers.
4.1 Extensometer data
The measurements described here reflect the real extension of this part of the slope and cannot be related to the transit of heavy trucks along the road for the following reasons: the two instruments are encapsulated in concrete boxes, and moreover between the instruments and the road asphalt there is a 50 cm thick layer of reinforced concrete that was installed during the Soviet period. This clearly protects the extensometers from effects of truck transit. Moreover, the extensometers recorded long periods of increase and decrease in extension movements, whereas trucks are always present.
Figure 6 shows the readings collected over a 35-month interval, between 4 November 2016 and 9 October 2019, by the extensometer at station no. 1. The overall extension recorded during the 35-month period is equal to 88.7 mm, corresponding to an average extension rate of 0.08 mm/d (that is 30.8 mm/yr). Extension peaked from 16 May 2017 to 8 August 2017, with a total extension of 52 mm, corresponding to an average rate of 0.61 mm/d. This documented acceleration in the movement coincided with the opening of new fractures on the road surface at about 700 m of altitude, i.e., 230 m above the average lake level of 470 m a.s.l.
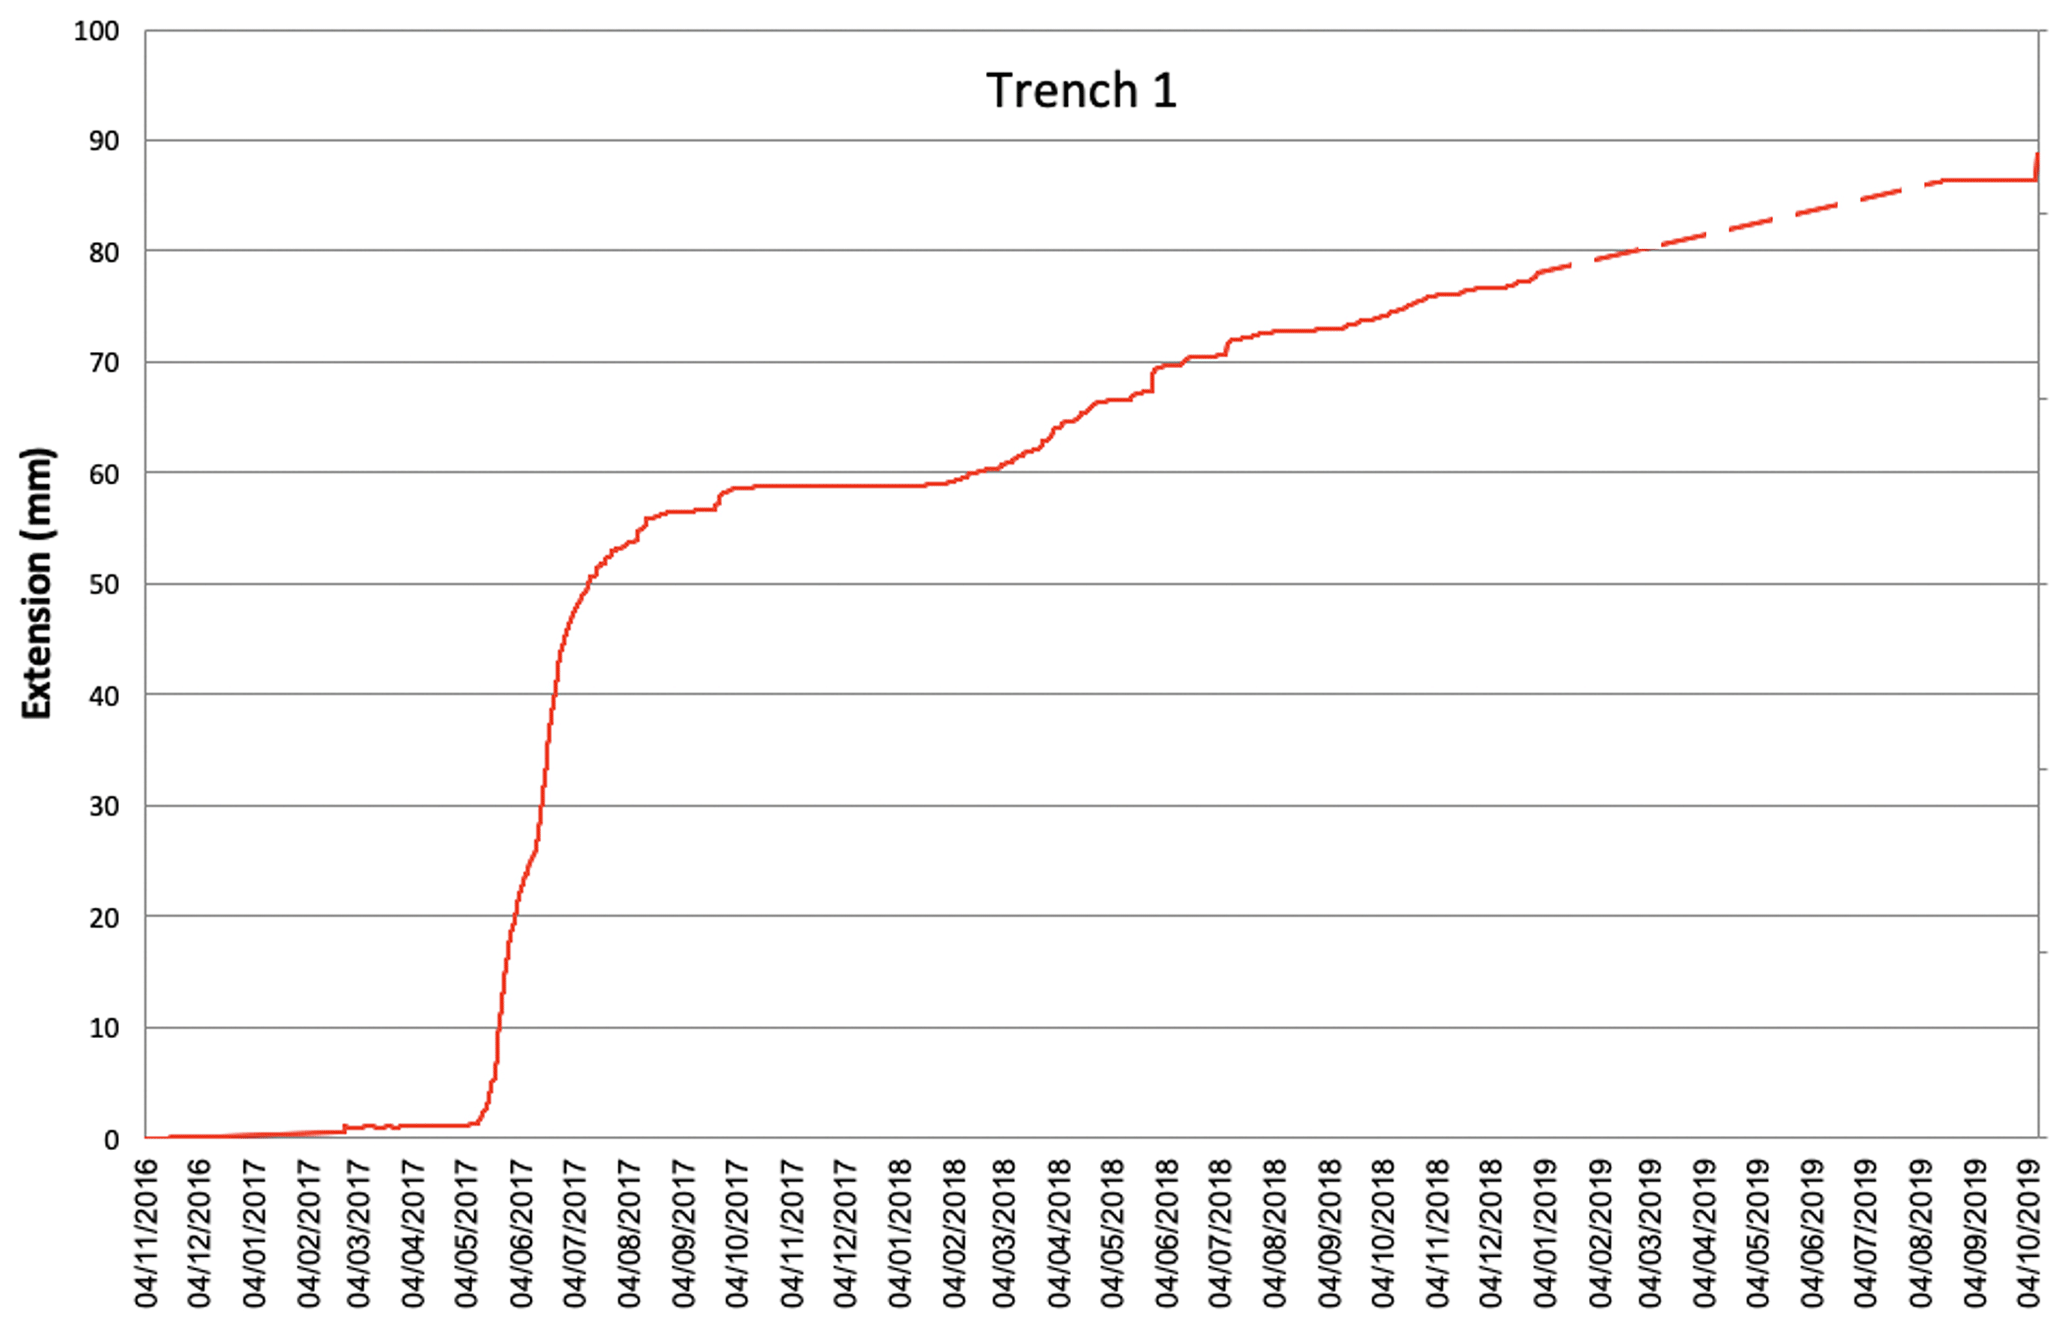
Figure 6Graph showing the readings of the incremental extension (in mm), associated with landslide surface displacement, recorded by station no.1 from November 2016 to October 2019.
From 3 October 2017, extension ceased until 16 January 2018. This date marks the beginning of another period of slight extension, lasting until 6 March 2018. From this date on, another interval of extension rate increase was recorded, although it was much less pronounced than the previous one. This increase lasted until 22 May 2018, marked by a rate of 0.12 mm/d. From the end of May 2018 to October 2019, extension was linear with a rate of 0.04 mm/d, with a data gap between 30 December 2018 and 13 August 2019 due to a technical problem. This slower creep-like movement was accompanied by the development of small sinkholes and fractures within the landslide body, which occurred some tens of meters downslope of Trench 1.
Regarding extensometer no. 2, data are shown over a 28.5-month interval (from 18 May 2017 to 30 September 2019) (Fig. 7). Here, the total amount of extension was 19.14 mm, with an average extension rate of 0.02 mm/d (that is 8.17 mm/yr). From the beginning until 24 October 2017, there was a steady slight extension, followed by a period of high deformation expressed, in the graph, by a line with an upward convexity, indicating initially a strong increase and later on a gradual decrease in the extension rate. This period lasted until 27 February 2018 and was characterized by an average rate of 0.16 mm/d, followed by another increase for 1 month and then by a steady extension until 15 November 2018. Thereafter, until 29 January 2019, a new increase in the extension rate was observed, after which extension ceased.
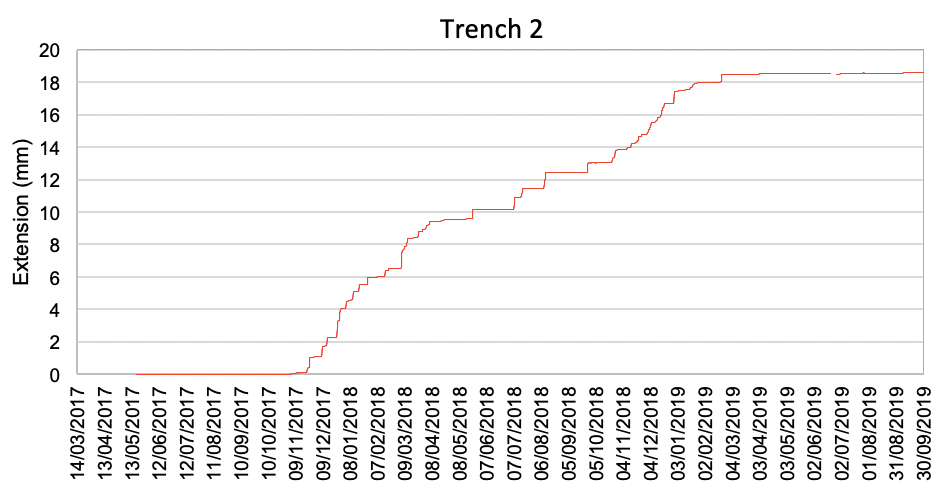
Figure 7Graph showing the readings of the incremental extension (in mm), associated with landslide surface displacement, and recorded from May 2017 to September 2019 by station no. 2.
4.2 Meteorological data
The amount of rainfall shows important variations (Fig. 8). Rainy days are mostly characterized by amounts within 10–20 mm/d. Peaks of 40–50 mm/d were recorded on 7 September 2017, 5 February 2018, 12 February 2018, 26 September 2018, 23 May 2020 and 18 June 2020. Peaks between 51–60 mm/d occurred on 6 December 2017, 5 March 2018 and 1 December 2019. The highest peaks, above 70 mm/d, took place on 22 October 2018 and 25 July 2019. Periods of particularly heavy rain were recorded from 19 January 2018 to 12 May 2018 and from 22 September 2018 to 16 January 2019. From the middle of April to 25 September 2018, there was a gap in the data due to technical problems.
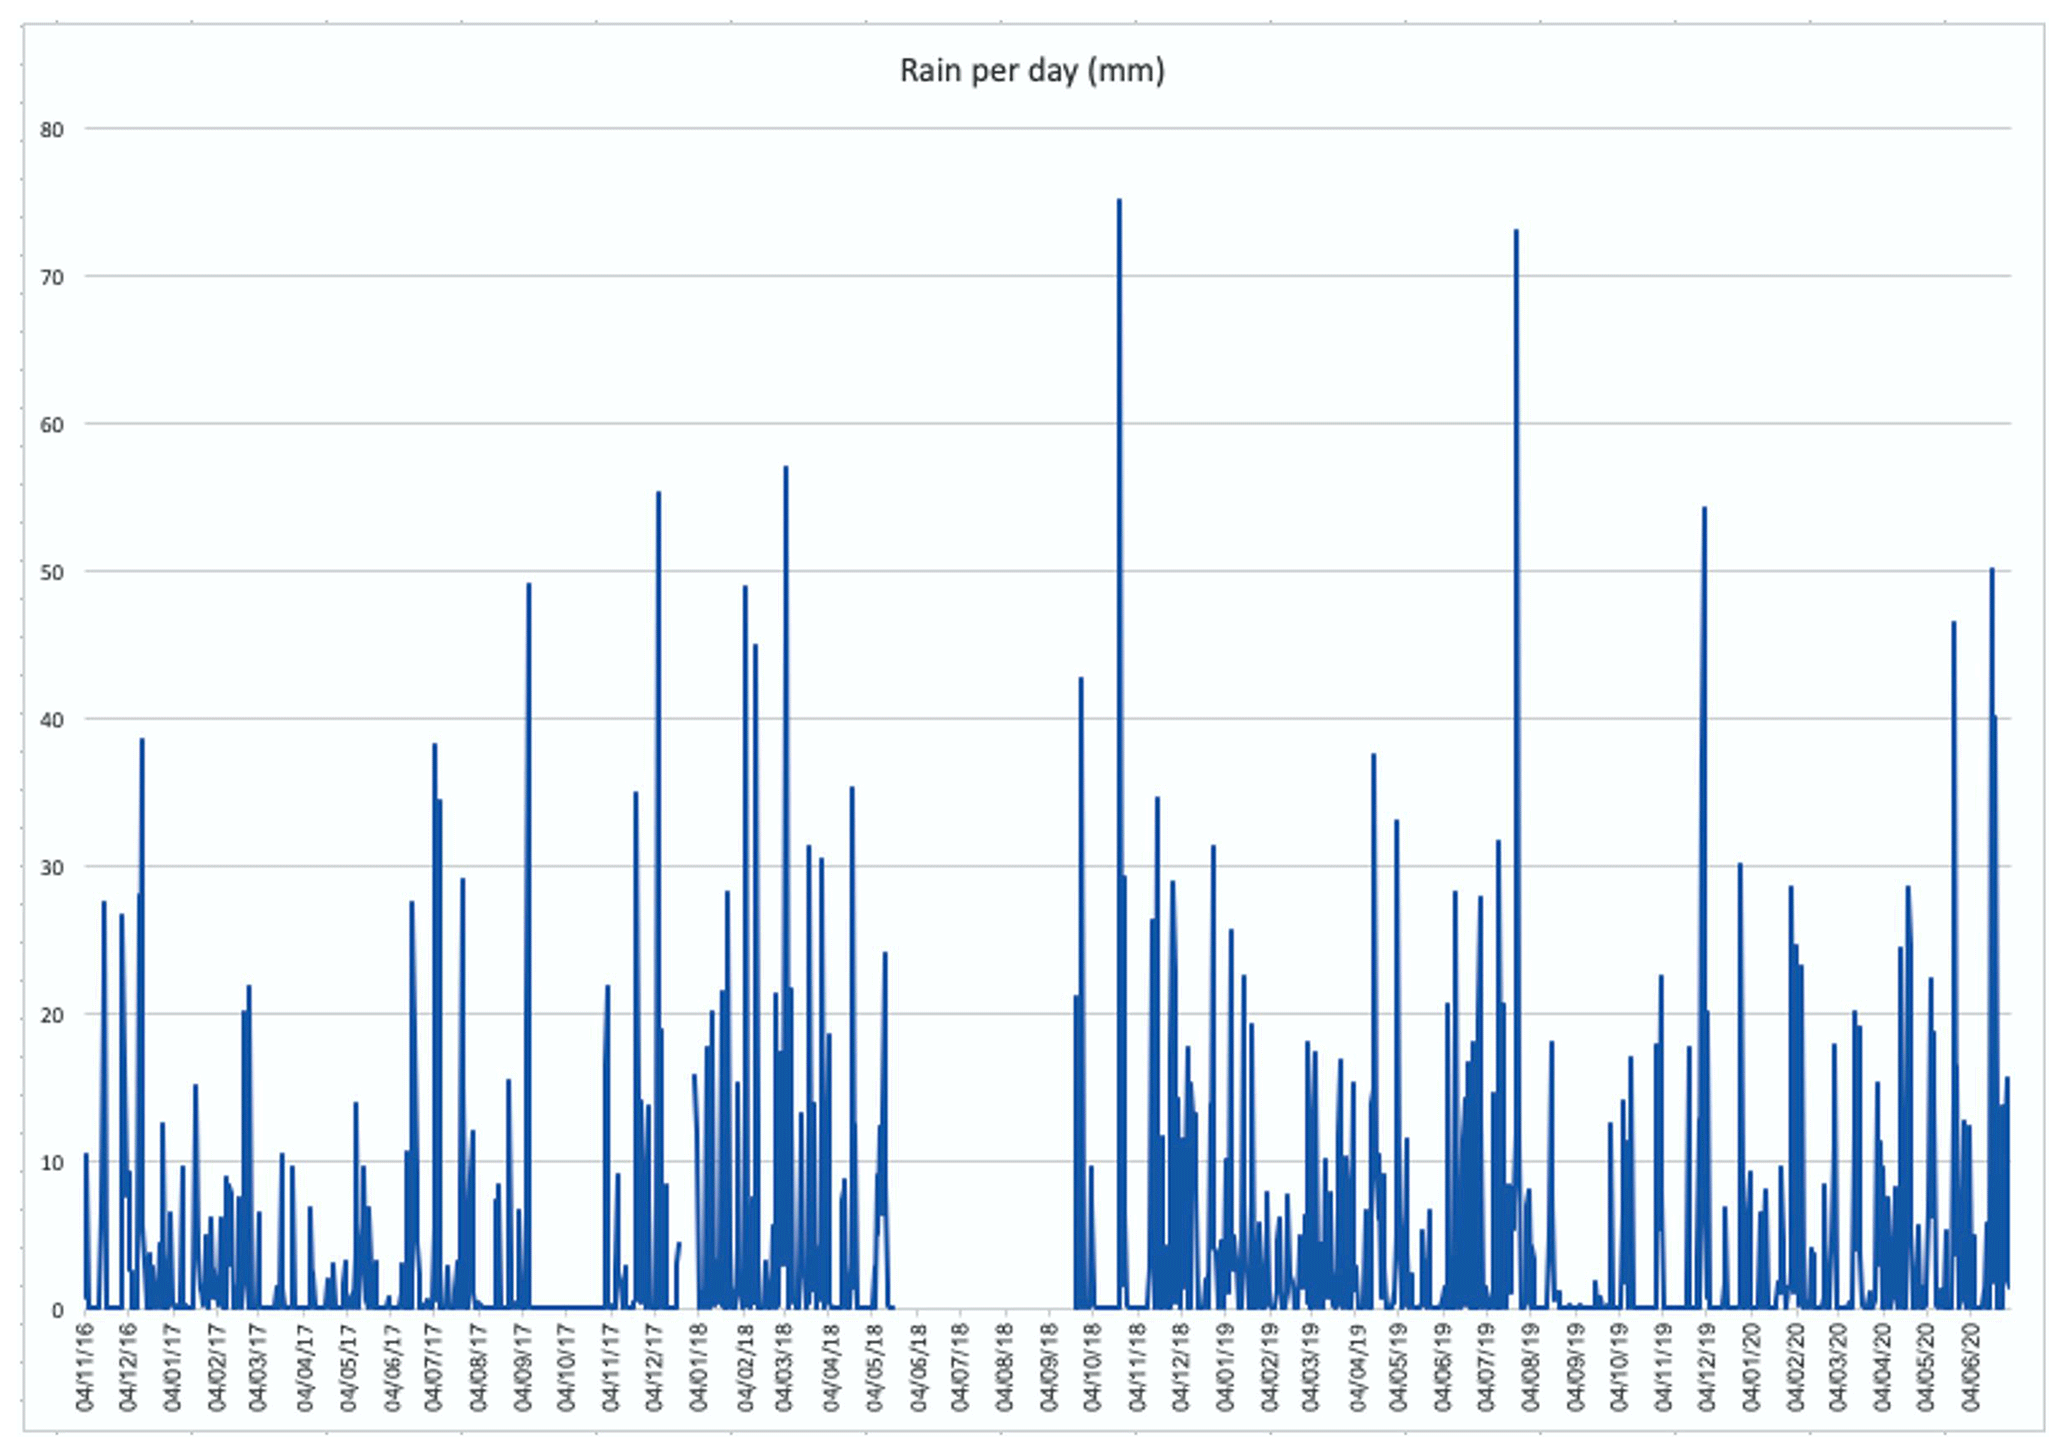
Figure 8Amount of rainfall recorded near the landslide, from 4 November 2016 to 30 June 2020.
As regards temperatures (T), these show a double fluctuation (Fig. 9); the short-term fluctuation took place within a frequency of 5–20 d, whereas the long-term fluctuation developed every 12 months. At Trench 1, in the first period of observations, T at the data logger, near the ground surface, gradually decreased to 3 ∘C on 22 February 2017, though there was a gap in data, due to a technical problem, from mid- December 2017 to mid-February 2017. Then, T increased until it peaked at 22.9 ∘C on 15 August 2017. From this date until 2 February 2018, there was a gradual decrease, until a minimum of 5.5 ∘C was reached. Then T increased again and reached a maximum of 22.4 ∘C on 10 August 2018. T then decreased down to 0.9 ∘C on 27 December 2018. At Trench 2 the variations in T were similar to those at Trench 1, although the absolute values were sometimes higher, on the order of 1–2 ∘C.
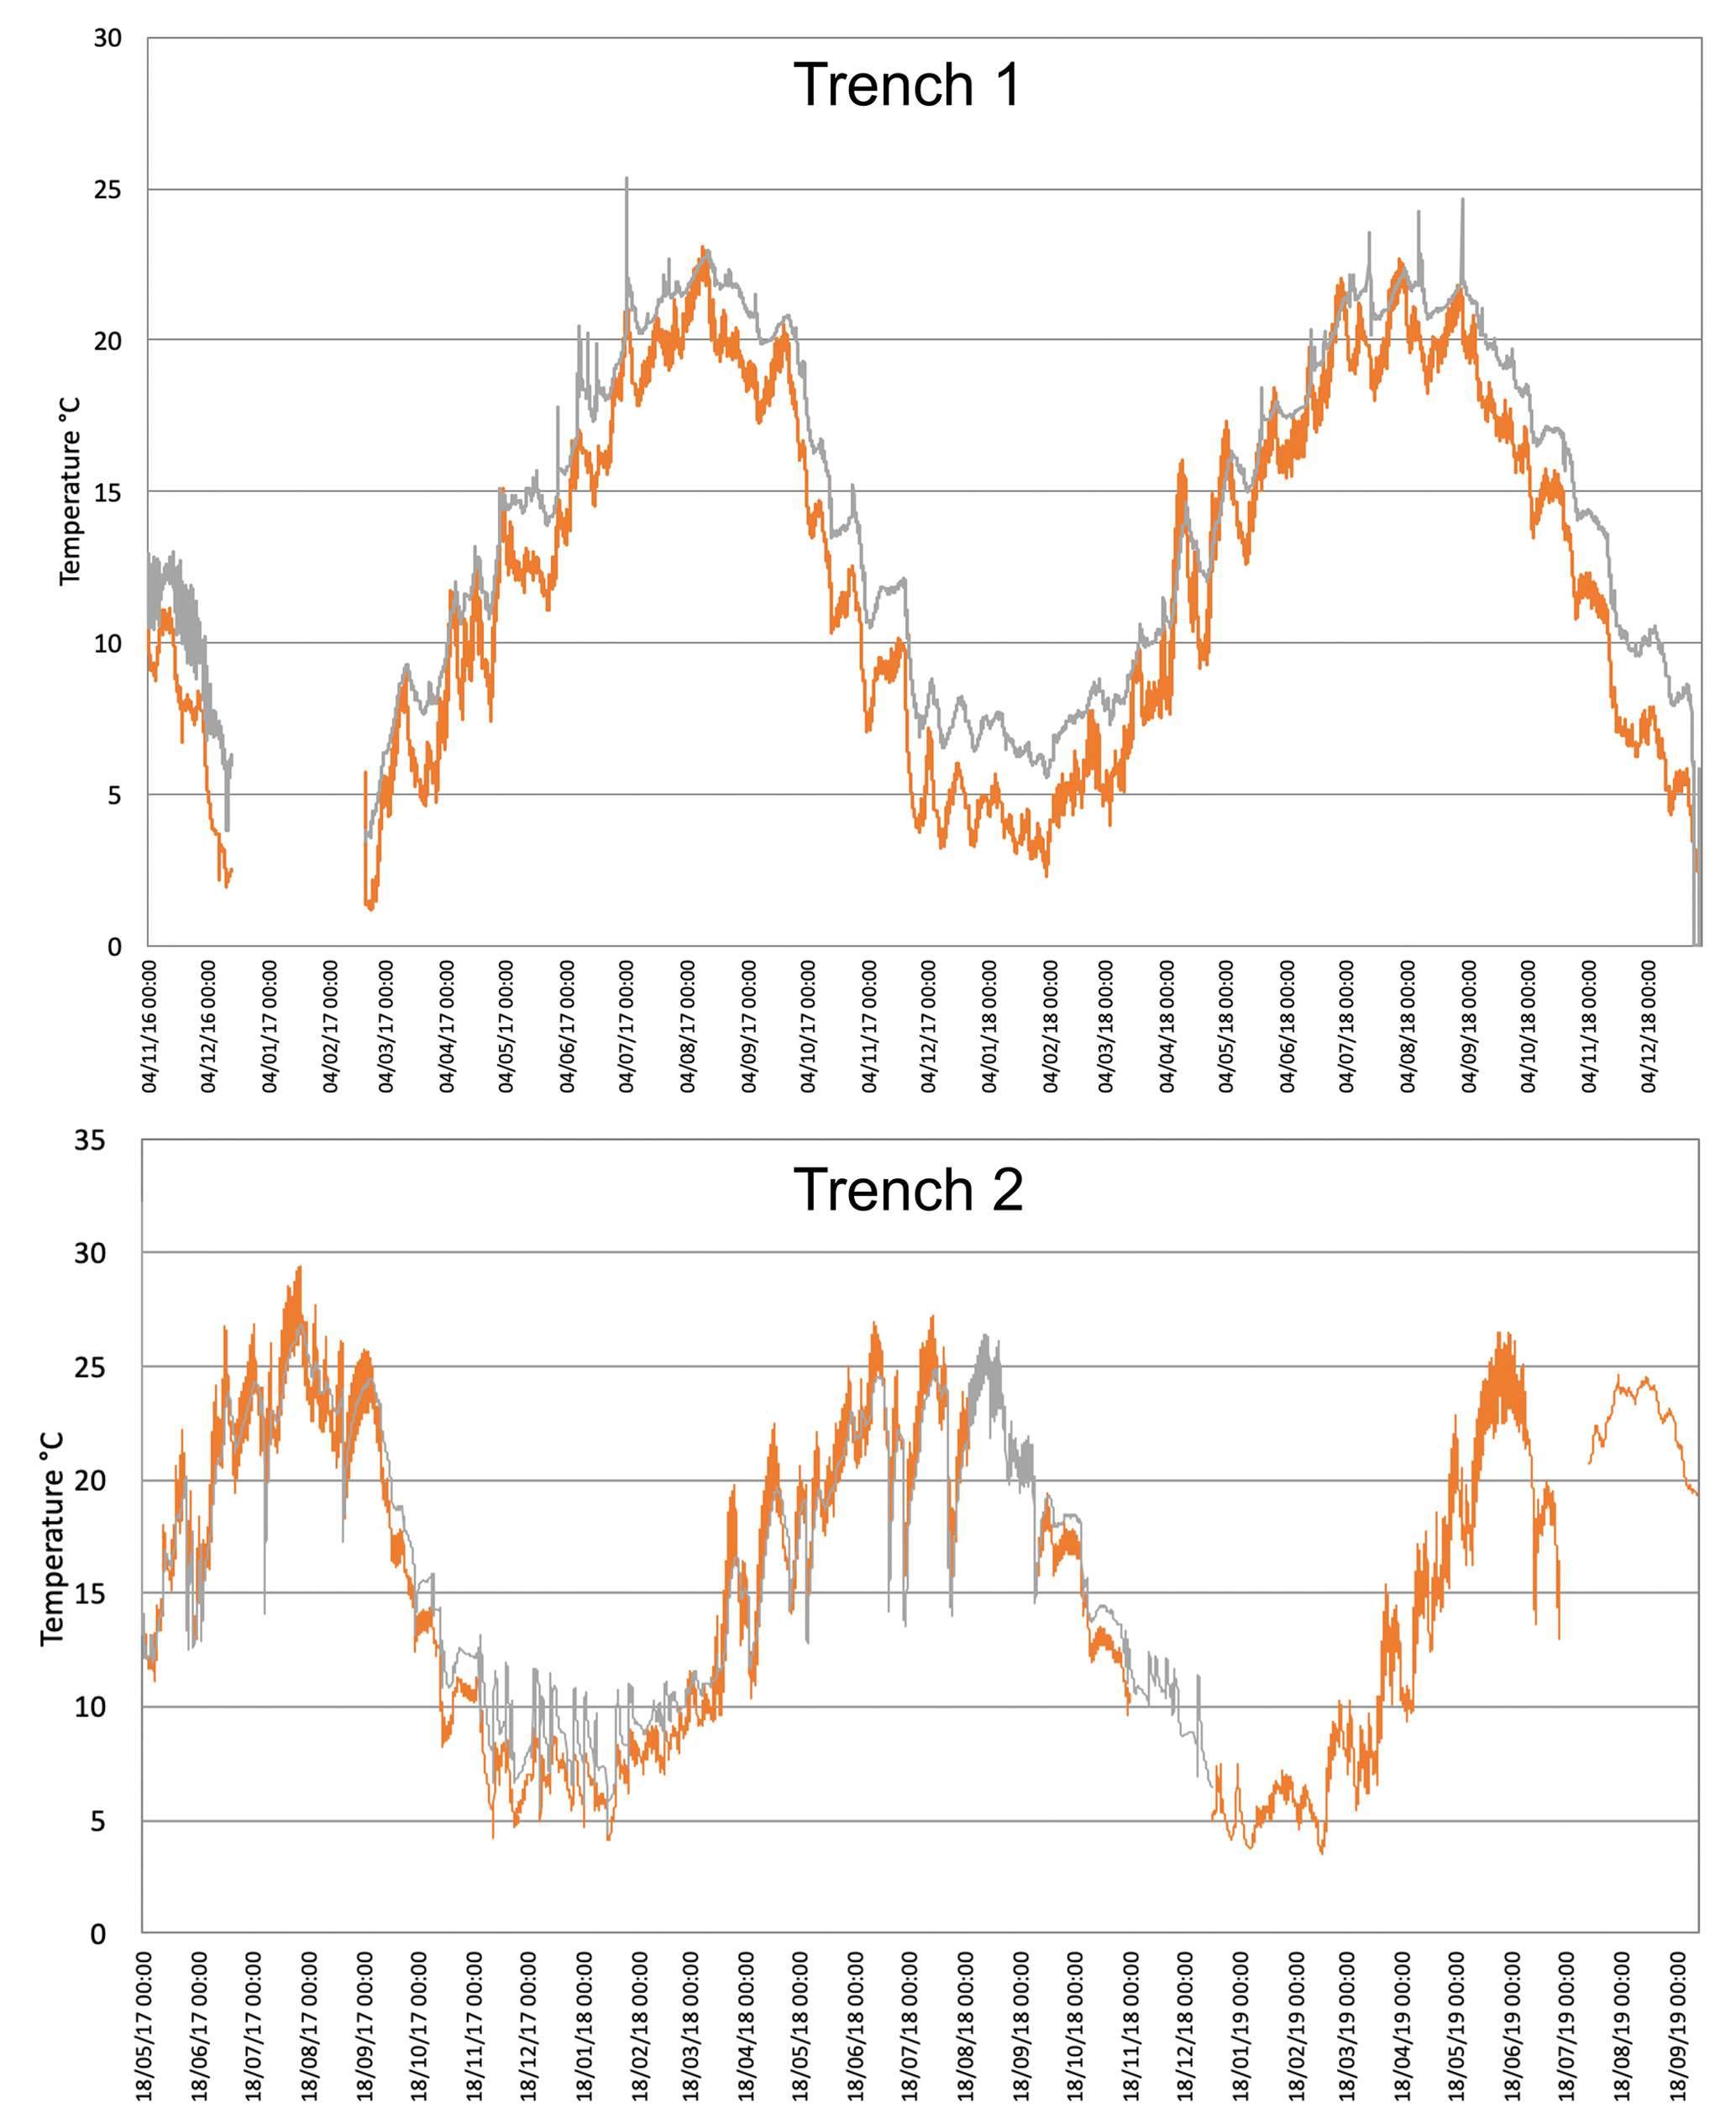
Figure 9Temperatures recorded at Trench 1 from November 2016 to December 2018 and at Trench 2 from May 2017 to September 2019. The grey line represents the variations in temperature of the extensometer wire, inside the instrument, whereas the orange line shows temperature variations at the data logger that is near the ground surface (time zone: UTC).
The T of the wire inside the instrument recorded the same pattern of variations, although smoothed, with T systematically higher, on the order of 3–4 ∘C at Trench 1 and with a much smaller difference at Trench 2 (Fig. 9). This different pattern can be due to the fact that in Trench 2 there is a greater circulation of water than in the other trench, and thus the temperature tends to be more balanced due the thermal conductivity of water being better than that of air.
4.3 Lake level data
From the beginning of our measurements (1 January 2017) until 20 February 2017, there was a continuous emptying of the reservoir, the level of which dropped down to a minimum of 410 m a.s.l. (Fig. 10). Thereafter, the reservoir was filled again, to a maximum of 510 m on 5 August 2017, followed by a further increase on 12 September 2017, up to 511 m. From this date on, there was a decrease in the lake level until 29 February 2018, when it reached an altitude of 443 m. Then, it increased again reaching the altitude of 510 m on 30 June 2018. Later on, a new period of level decrease lasted until 31 March 2019, when the lake level reached 414 m. Over the next month there was an oscillation with an increase of 35 m followed by a decrease. From 23 April 2019, a lake level increase was recorded, which ended on 26 July 2019, reaching an altitude of 507 m. Thereafter, a new period of lake level decrease took place, until 29 April 2020 when it reached 419 m.
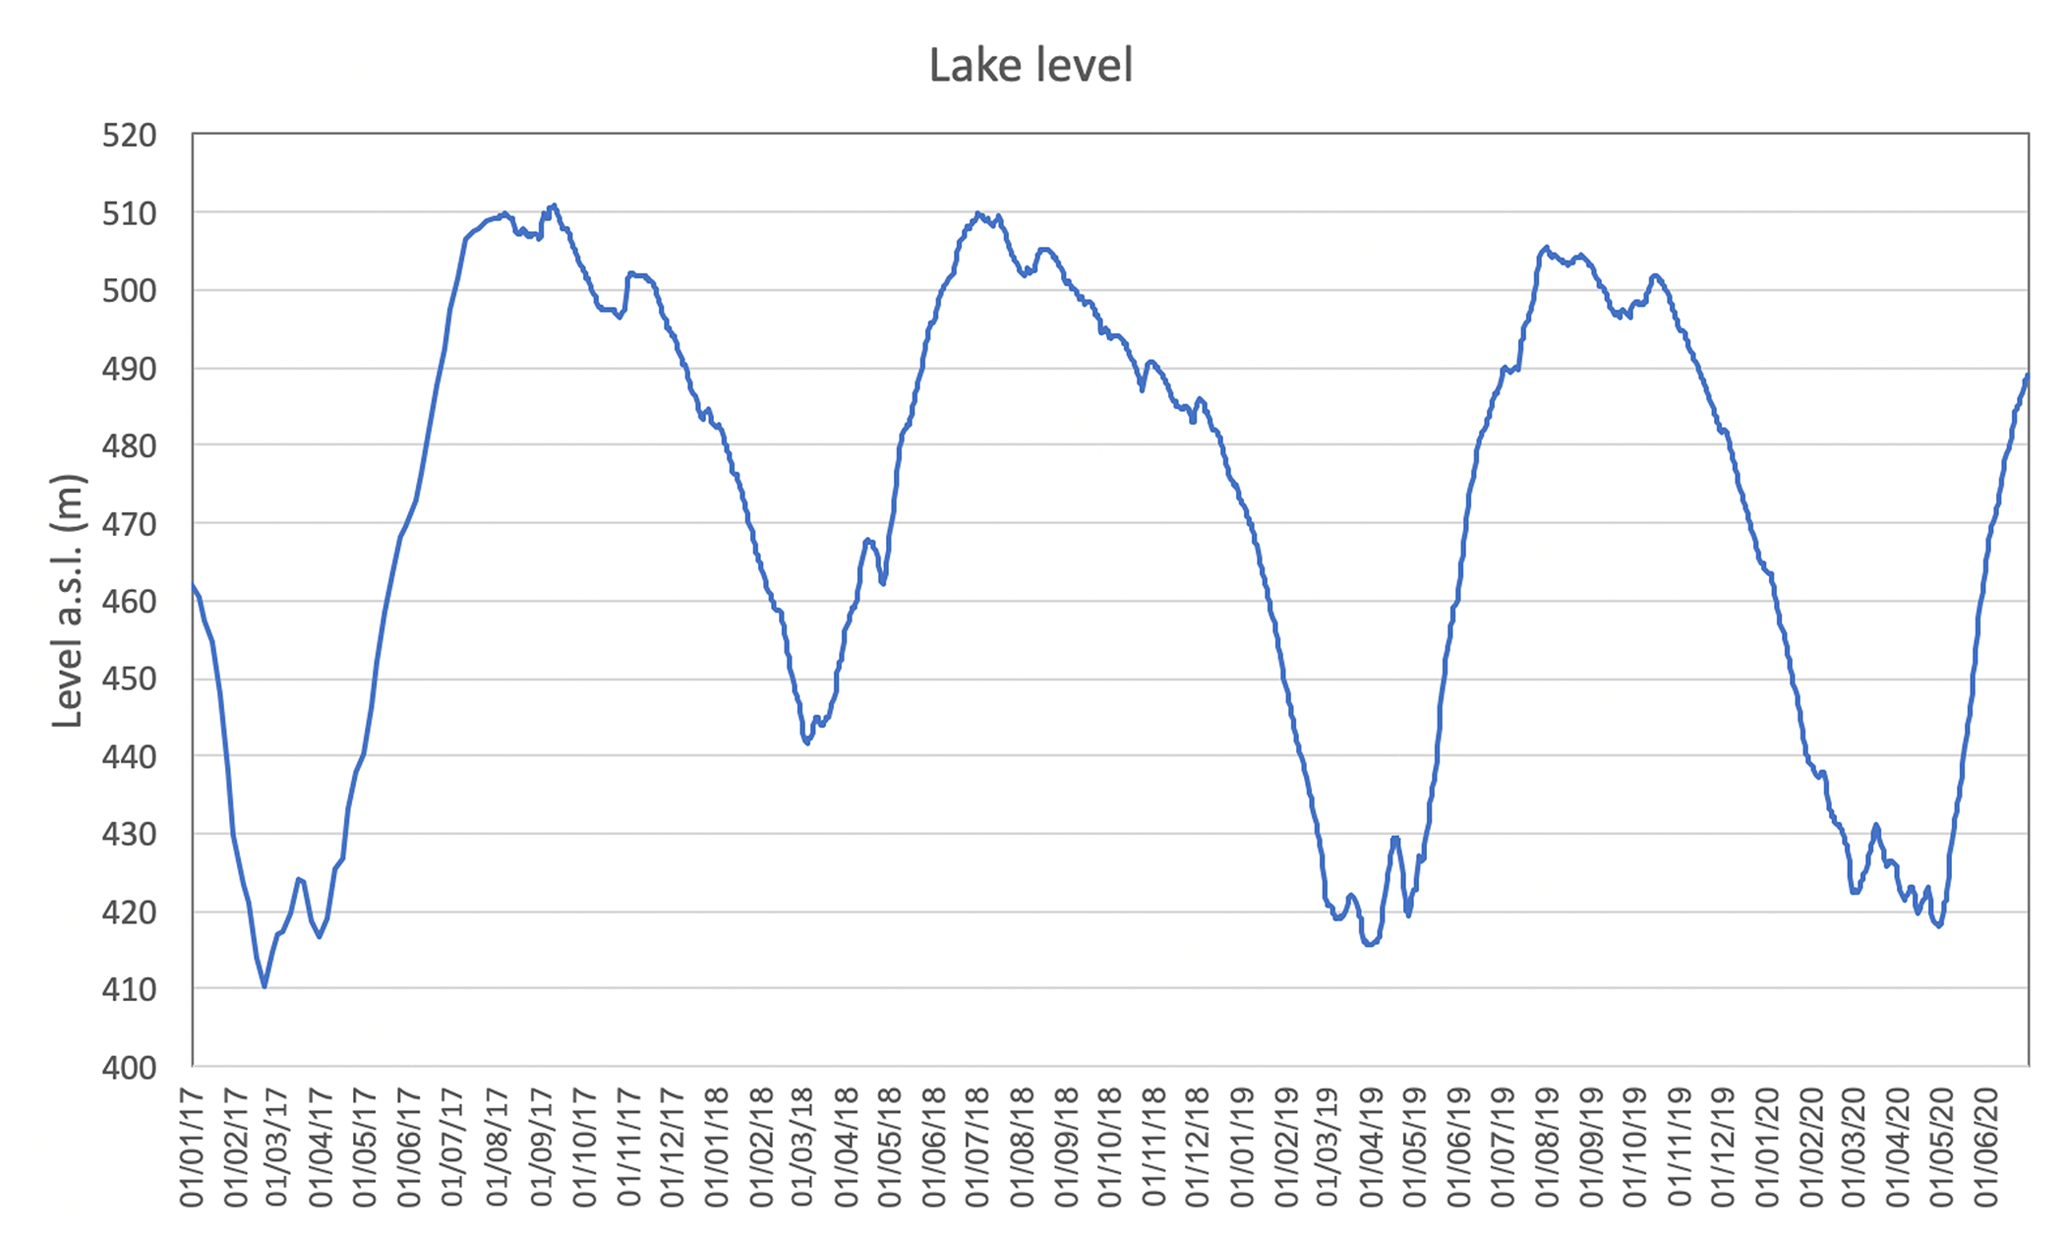
Figure 10Variations in the level of the Enguri artificial water reservoir from 1 January 2017 to 30 June 2020.
5.1 Correlation of slope deformation – lake level – rainfall
Here, we briefly discuss all the data, which we have combined in the graphs of Fig. 11, so as to provide a more immediate interpretation. In these graphs we also report the rainfall cumulated per month in order to better quantify its possible influence. At extensometer no. 1, the total amount of extension was 88.7 mm in 35 months, yielding an average extension rate of 0.08 mm/d. Extension peaked from 16 May 2017 to 8 August 2017, with a total extension of 52 mm that corresponds to a rate of 0.61 mm/d, about 8 times the average extension rate during the whole measurement period. This extension rate increase follows the almost complete drawdown of the lake (which went down to the lowest level on 21 February 2017) and the ensuing period of lake level infilling, with a 100 m water level increase. A delay of about 1 month can be recognized between the lake level increase and the extension rate increase, but the shape and duration of the period of extension increase mimic exactly the shape and duration of the lake infilling (segments between arrows in Fig. 11), suggesting a strong correlation. Another interval of extension rate increase, although much smoother than the previous one, is recognizable during a period after 6 March 2018, at the same time as a 67 m increase in the water level. During the third period of lake filling and refilling, due to technical problems at the extensometer, possible further rate variations were not recorded. During periods of water level lowering the extension rate instead tends to decrease to the lowest values.

Figure 11Graphs showing the combination of all data collected at Trench 1 (a) and Trench 2 (b). Note that rainfall is expressed as cumulated monthly precipitation. The arrows point to the segments of the extension and lake level curves that show similar shapes with a short lag.
At extensometer 1, there is no correlation between rainfall amounts and extension rate values in the period November 2016–April 2017, during which the extension curve is subhorizontal in spite of rainfall variations. Similarly, there is no correlation between rain and extension when there is the strongest extension increase in May–August 2017 because this follows a period of low rain precipitation. On the contrary, this extension rate increase perfectly matches, after 1 month, the lake level increase. The other period of extension increase from February to May 2018 coincides with the second lake level increase, but it also follows a period of rainfall intensification (November 2017–February 2018). We suggest that, in this case, cumulated rainfall might have contributed to increasing the extension rate owing to water infiltration into the slope, though this is masked by lake level increase and we do not have data on the variation in water saturation in the landslide slope.
At extensometer no. 2, the total amount of extension was 19.14 mm in 28.5 months, with an average extension rate of 0.02 mm/d. There is no correlation between the amount of rainfall and extension rate values in the period May–October 2017, during which the extension curve is subhorizontal in spite of rainfall variations. Extension increased, from 31 October 2017 to 1 April 2018, to 0.13 mm/d, corresponding to a 5-month interval of increased deformation, in a very similar way to at extensometer no. 1, over a 3-month period. It is worth noting that the extension curves derived from the two extensometers have a similar shape, but at extensometer no. 2 the curve is shifted onward by 4 to 6 months. This period of extension increase coincides with the lake level decrease, but it also coincides with a period of rainfall increase. We suggest that these accelerated movements at extensometer no. 2 may have been triggered by the previous movements within the landslide sector where extensometer no. 1 is located, as will be highlighted in the following section, in possible combination with rain infiltration in the slope. At extensometer no. 2, the extension curve is still steep in the following period until July 2018, which is coincident with a lake level increase, followed by a further extension rate increase until January 2019, in correspondence to lake level decrease and strong rainfall.
As documented by Tibaldi et al. (2019), based on the analysis of the Quaternary geological deposits of the area and on the presence of the high head scarp, the landslide area had already been subject to slope failure events during prehistoric times. As a consequence of this, the processes that have taken place along and across the slope during lake level variations have been affecting an already-destabilized slope, which is expected to be more sensitive to variations in the conditions at its toe. In general, the presence of artificial lakes can trigger possible seepage processes accompanied by an increase in pore water pressure in the slope deposits with the effect of reducing their shear strength. At the same time, the presence of a water basin may lead to stabilization of the submerged part of the slope (Paronuzzi et al., 2013). In transient conditions, lake filling or drawdown can trigger landslides (Schuster, 1979; Kenney, 1992; Zhu et al., 2011). In a similar way to the Enguri case, pre-existing, ancient landslides were reactivated during the filling of the water reservoir at the Włocławek dam in Poland (Kaczmarek et al., 2015). This cause–effect relation is even more apparent where bank-forming materials have a high permeability, like in the study area, in which the slope is mostly made of debris and highly fractured materials; within highly permeable deposits, a reservoir level increase can trigger a rapid reservoir-induced water inflow that reduces both the strength and the factor of safety. This occurred, for example, at the October 1963 Vajont landslide in NE Italy; as documented by Paronuzzi et al. (2013), among the factors triggering the disaster, a predominant role was played by reservoir level increase and by the presence of an already-existing landslide. Another example comes from the Byford Creek landslide, located above the Clyde artificial reservoir in New Zealand, where lake filling produced a major increase in the extension rate, followed by long-term creep movements (Macfarlane, 2009).
To summarize the above, our data show that, at least during the first period of extension increase at extensometer no. 1, the slope still has a high sensitivity to water infilling operations more than 40 years after the construction of the Enguri reservoir. The presence of highly permeable deposits in the lower part of a slope, as is the case at the Khoko landslide, represents a key aspect to be considered for the assessment of hydrogeological hazard. In such a case, during reservoir level increase, the water pore pressure effects on shear strength prevail over the stabilizing and buttressing effects induced by the water body, resulting in an acceleration in slope movements. For the other periods of extension increase, an effect of rainfall intensification cannot be excluded, whereas extensometer no. 2 may also have reacted to deformation of the slope part where the other extensometer is located.
5.2 Behavior of the landslide and slip planes
The hypothesis introduced in the previous section proposes that during the first and greatest lake level increase, there was an increment in water pore pressure within the slope with a consequent decrease in the shear strength. This seems to have produced an increase in extension at the two trenches with a time offset. Another possibility is that the lake level increase triggered slope deformation only at the landslide sector where extensometer no. 1 is located, whereas the other landslide portion, where extensometer no. 2 is located, initially remained stable, but, later on, deformation was also triggered there. The different patterns observed at the two trenches may be explained in terms of the fact that they are located in two different sectors of the general landslide, which can move separately. The possible presence of different sectors within the general landslide body is suggested by underground data and by GPS data. Based on the results summarized in Fig. 4, a number of possible slip planes affect the landslide, from shallow to deeper ones. Moreover, the slip planes modeled through our static analysis are of two types: slip planes that initiate at the head scarp and prolong downward to the valley bottom (now covered by the lake) and slip planes that run from the head scarp to half of the slope, reaching the present lake's coastline. The presence of multiple slip planes at different depths is also supported by the documented ruptures of piezometers at different depths. These slip planes clearly correspond to different portions of the landslide that might move, at least in part, autonomously from each other. GPS stations were installed in the upper part of the landslide and were operational during most of the 2016–2019 observation period (Ospanov and Krivchenko, 2021). Four GPS stations are characterized by motion vectors with the same cumulated magnitude of movement (160–183 mm) and the same orientation (the central four arrows in Fig. 12), whereas the other two GPS stations show different magnitudes of movement (48 mm at the GPS station located in the west and 80 mm at the GPS station located in the east in Fig. 12) and different, opposite orientations. Based on these data and geomorphological evidence, we suggest the possible presence of three main landslide sectors: two corresponding to shallower landslides (A and B in Fig. 12) and one that is deeper (C in Fig. 12).
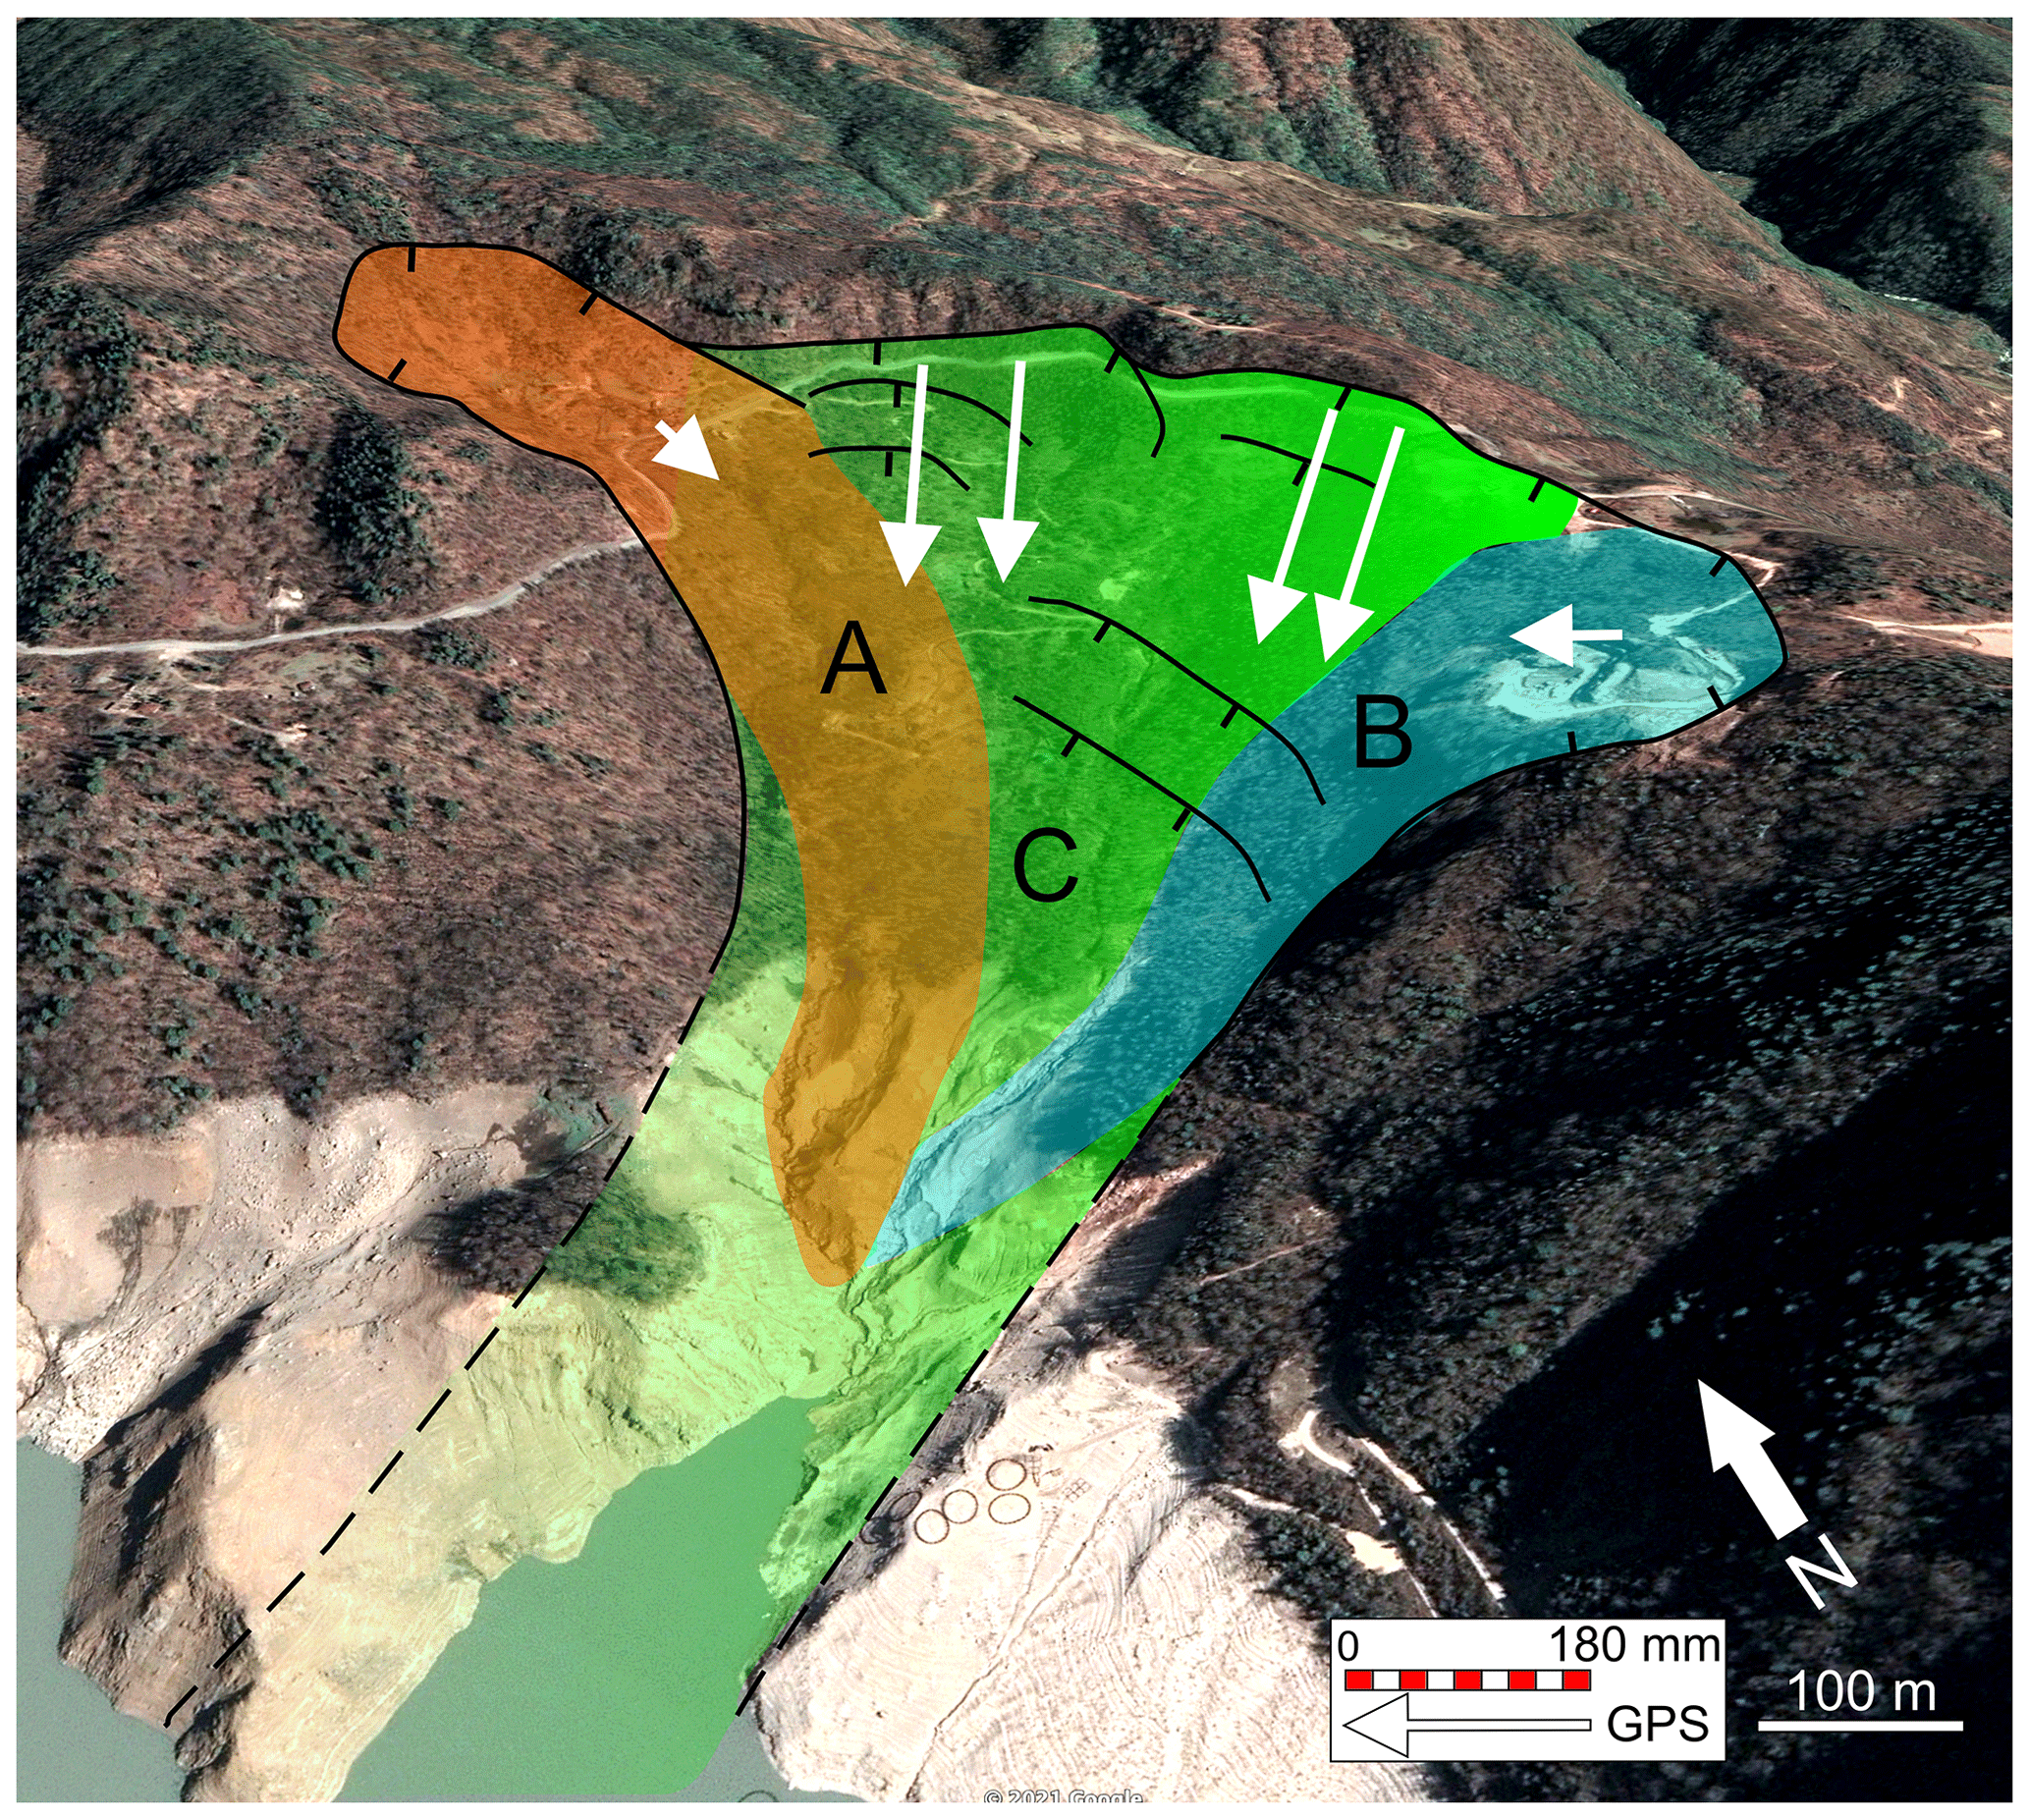
Figure 12Sketch of the possible different units that compose the general landslide onshore. The green unit C corresponds to a deeper-seated slope deformation, whereas the orange (A) and the blue (B) units are shallower bodies. White arrows represent GPS vectors collected by Ospanov and Krivchenko (2021). Black lines are the main scarps affecting the slope (© Google Earth 2021).
On the other hand, during the decrease in the lake level, extension increases at both trenches, as is the case, for instance, at the very beginning of 2018. This increase in extension might be due to the debuttressing of the slope toe associated with the emptying of the lake, resulting in a more widespread mobilization of the landslide and probable inception of slip along the deeper planes. As already suggested in the previous section, we cannot rule out the possibility that water infiltration due to periods of increased rainfall might also have contributed to increasing the extension rate.
The databases showcased in this work are available for download from the UniData Repository (Milan, Italy) at https://www.unidata.unimib.it/?indagine=deformation-and-meteorological-data-of-the-khoko-landslide-enguri-republic-of-georgia-2016-2020 (last access: 25 May 2021), under the DOI https://doi.org/10.20366/unimib/unidata/SI384-2.0 (Tibaldi et al., 2020). The extension dataset is provided in two separate files, for Trench 1 and for Trench 2, in tab format (extension data with frequency sampling of 60 min) together with air temperature near the ground surface (frequency sampling of 60 min) and temperature of the extensometer wire in the interior of the instrument (frequency sampling of 60 min). At the same web link the file of meteorological data (frequency sampling of 1 d) and lake level variations (frequency sampling every 5 d until 30 July 2017 and then every 1 d) is available.
At the major Khoko landslide, located on the eastern side of the Enguri artificial water reservoir, a 4-year-long campaign of measurement, by way of two digital extensometers, enables documenting the activity of the mass movement, at a rate of 8.2 to 30.8 mm/yr depending on the site of measurement. During this period, we observed a correlation between the greatest, most rapid infilling of the lake and an increase in the deformation rate of the slope. Deformation of the landslide at extensometer no. 1, therefore, appears to have been controlled by variations in hydraulic load, induced mainly by lake oscillations. There is a systematic delay between human-induced lake oscillation and the response of the landslide mass, quantifiable as about 1 month at extensometer no. 1. Increase in extension at extensometer no. 2 may, in turn, have been triggered by the previous deformation that occurred in the landslide sector where the other extensometer is located. These results, together with the different slip rates at the two instruments, the presence of different slip planes at various depths, and the different orientations and amount of movement measured at GPS stations located in the landslide, suggest that the Khoko landslide is composed of more than one unstable block, each of which can behave in a different way. Moreover, a possible correlation with heavier rainfall has been observed for some periods of increased extension, and thus we cannot rule out the possible contribution of water infiltration in the slope.
This overall monitoring effort will help individuate possible future accelerations of deformation at the unstable mass overlooking the Enguri artificial reservoir. Anyway, for a better comprehension of the instability of the whole slope, we recommend the installation of new inclinometers on the central and lower part of the slope.
AT coordinated the research and wrote most of the paper. PO designed and maintained the sensor network. FPM and FLB contributed to the geological and geomorphological mapping of the landslide area. NT coordinated and contributed to collecting extension data at the extensometers. LM and JC provided meteorological and lake level data.
The authors declare that they have no conflict of interest.
Publisher’s note: Copernicus Publications remains neutral with regard to jurisdictional claims in published maps and institutional affiliations.
We are indebted to the Ministry of Regional Development and Infrastructure of Georgia which helped us to obtain the permission to work along the Jvari–Khaishi–Mestia road. We also wish to thank the four anonymous reviewers for their valuable and helpful comments and suggestions.
This research was conducted with financial help from the NATO project SfP G4934 “Georgia Hydropower Security”, the International Lithosphere Program – Task Force II, and project 216758 of the Shota Rustaveli National Science Foundation. Satellite images were provided in the framework of the European Space Agency project no. 32309 “Active tectonics and seismic hazard of southwest Caucasus by remotely-sensed and seismological data”.
This paper was edited by Giulio G.R. Iovine and reviewed by four anonymous referees.
Bertolini, G., Guida, M., and Pizziolo, M.: Landslides in Emilia-Romagna region (Italy): strategies for hazard assessment and risk management, Landslides, 2, 302–312, 2005.
Bitelli, G., Dubbini, M., and Zanutta, A.: Terrestrial laser scanning and digital photogrammetry techniques to monitor landslide bodies, International Archives of Photogrammetry, Remote Sensing and Spatial Information Sciences, 35, 246–251, 2004.
Casagli, N., Tibaldi, A., Merri, A., Del Ventisette, C., Apuani, T., Guerri, L., Fortuny-Guasch J., and Tarchi, D.: Deformation of Stromboli Volcano (Italy) during the 2007 eruption revealed by radar interferometry, numerical modelling and structural geological field data, J. Volcanol. Geoth. Res., 182, 182–200, 2009.
Fell, R., Ho, K. K., Lacasse, S., and Leroi, E.: A framework for landslide risk assessment and management, Landslide Risk Management, Taylor and Francis, London, 3–25, 2005.
Froude, M. J. and Petley, D. N.: Global fatal landslide occurrence from 2004 to 2016, Nat. Hazards Earth Syst. Sci., 18, 2161–2181, https://doi.org/10.5194/nhess-18-2161-2018, 2018.
Gulen L. and EMME WP2 Team: Active faults and seismic sources of the Middle East region: earthquake model of the Middle East (EMME) project, in: Abstracts of the AGU Fall Meeting, San Francisco, California, 5–9 December 2011, 2011.
Kaczmarek, H., Tyszkowski, S., and Banach, M.: Landslide development at the shores of a dam reservoir (Włocławek, Poland), based on 40 years of research, Environ. Earth Sci., 74, 4247–4259, 2015.
Kenney, T. C.: Slope stability in artificial reservoirs: influence of reservoir level, selected cases, and possible solutions, in: Proceedings of the meeting on the 1963 Vajont landslide, edited by: Semenza, E. and Melidoro, G., 17–19 September 1986, Ferrara, Cansiglio and Vajont, Grafica Ferrarese, Ferrara, Italy, 67–85, 1992.
Koçyigit, A., Yılmaz, A., Adamia, S., and Kuloshvili, S.: Neotectonics of East Anatolia Plateau (Turkey) and Lesser Caucasus: Implication for transition from thrusting to strike-slip faulting, Geodin. Acta, 14, 177–195, 2001.
Liu S. T.: Deformation measurements during the construction of large dam projects, Chinese Journal of Underground Space and Engineering, 6.Z2, 1346–1348, 2006.
Macfarlane, D. F.: Observations and predictions of the behaviour of large, slow-moving landslides in schist, Clyde Dam reservoir, New Zealand, Eng. Geol., 109, 5–15, 2009.
Meisina, C., Zucca, F., Notti, D., Colombo, A., Cucchi, A., Savio, G., Giannico, C., and Bianchi, M.: Choice of surveying methods for landslides monitoring, in: Landslides and engineered slopes: from the past to the future, Proceedings of the tenth international symposium on landslides and engineered slopes, Taylor & Francis, Xi'an, 2008.
Ospanov N. S. and Krivchenko, A. A.: Description of a 2-Year, High-Resolution Geodetic Monitoring of the Khoko Landslide, Enguri Reservoir, Georgia, in: Building Knowledge for Geohazard Assessment and Management in the Caucasus and other Orogenic Regions, edited by: Bonali, F. L., Pasquarè Mariotto F, and Tsereteli N.: NATO Science for Peace and Security Series C: Environmental Security, Springer Nature, Switzerland, 301–316, https://doi.org/10.1007/978-94-024-2046-3_16, 2021.
Paronuzzi, P., Rigo, E., and Bolla, A.: Influence of filling–drawdown cycles of the Vajont reservoir on Mt. Toc slope stability, Geomorphology, 191, 75–93, 2013.
Pasquaré, F., Tormey, D., Vezzoli, L., Okrostsvaridze, A., and Tutberidze, B.: Mitigating the consequences of extreme events on strategic facilities: Evaluation of volcanic and seismic risk affecting the Caspian oil and gas pipelines in the Republic of Georgia, J. Environ. Man., 92, 1774–1782, 2011.
Pasquaré Mariotto, F. and Tibaldi, A.: Inversion kinematics at deep-seated gravity slope deformations revealed by trenching techniques, Nat. Hazards Earth Syst. Sci., 16, 663–674, https://doi.org/10.5194/nhess-16-663-2016, 2016.
Reilinger, R. E., McClusky, S. C., Oral, M. B., King, R. W., Toksoz, M. N., Barka, A. A., Kinik, I., Lenk, O., and Sanli, I.: Global Positioning System measurements of present-day crustal movements in the Arabia-Africa-Eurasia plate collision zone, J. Geophys. Res., 102, 9983–9999, 1997.
Reilinger, R. E., McClusky, S. C., Vernant, P., Lawrence, S., Ergintav, S., Cakmak, R., Ozener, H., Kadirov, F., Guliev, I., Stepanian, R., Nadariya, M., Hahubia, G., Mahmoud, S., Sakr, K., Arrajehi, A., Paradissis, D., Al-Aydrus, A., Prilepin, M., Guseva, T., Evren, E., Dmirotsa, A., Filikov, S. V., Gomez, F., Al-Ghazzi, R., and Karam, G.: GPS constraints on continental deformation in the Africa-Arabia-Eurasia continental collision zone and implications for the dynamics of plate interactions, J. Geophys. Res., 111, B05411, https://doi.org/10.1029/2005JB004051, 2006.
Schuster, R. L.: Reservoir-induced landslides, Bulletin of the International Association of Engineering Geology, 20, 8–15, 1979.
Spiker, E. C. and Gori, P.: National landslide hazards mitigation strategy, a framework for loss reduction (No. 1244), US Geological Survey, Reston, Virginia, 56 pp., 2003.
Tibaldi, A. and Pasquaré F.: Quaternary deformations along the “Engadine–Gruf tectonic system”, Swiss–Italian border, J. Quaternary Sci., 23, 475–487, 2008.
Tibaldi, A., Rovida, A., and Corazzato, C.: A giant deep-seated slope deformation in the Italian Alps studied by paleoseismological and morphometric techniques, Geomorphology, 58, 27–47, 2004.
Tibaldi, A., Corazzato, C., Rust, D., Bonali, F. L., Pasquaré Mariotto, F., Korzhenkov, A. M., Oppizzi P., and Bonzanigo, L.: Tectonic and gravity-induced deformation along the active Talas–Fergana Fault, Tien Shan, Kyrgyzstan, Tectonophysics, 657, 38–62, 2015.
Tibaldi, A., Alania, V., Bonali, F. L., Enukidze, O., Tsereteli, N., Kvavadze, N., and Varazanashvili, O.: Active inversion tectonics, simple shear folding and back-thrusting at Rioni Basin, Georgia, J. Struct. Geol., 96, 35–53, 2017a.
Tibaldi, A., Russo, E., Bonali, F. L., Alania, V., Chabukiani, A., Enukidze, O., and Tsereteli, N.: 3-D anatomy of an active fault propagation fold: a multidisciplinary case study from Tsaishi (Georgia), western Caucasus, Tectonophysics, 717, 253–269, 2017b.
Tibaldi, A., Korzhenkov, A.M., Pasquaré Mariotto, F., Rust, D., and Tsereteli, N.: NATO and earth scientists: An ongoing collaboration to assess geohazards and contribute to societal security in Central Asia and the Caucasus, Episodes, 41, 193–205, 2018.
Tibaldi, A., Oppizzi, P., Gierke, J., Oommen, T., Tsereteli, N., and Gogoladze, Z.: Landslides near Enguri dam (Caucasus, Georgia) and possible seismotectonic effects, Nat. Hazards Earth Syst. Sci., 19, 71–91, https://doi.org/10.5194/nhess-19-71-2019, 2019.
Tibaldi, A., Oppizzi, P., Bonali, F. L., Pasquarè Mariotto, F., Tsereteli, N., and Mebonia, L.: Deformation and meteorological data of the Khoko landslide, Enguri, Republic of Georgia, UniData – Bicocca Data Archive, Milan. Study Number SI384, Data file version 1.0, https://doi.org/10.20366/unimib/unidata/SI384-2.0, 2020.
Tsereteli, N., Tibaldi, A., Alania, V., Gventsadse, A., Enukidze, O., Varazanashvili, O., and Müller B. I. R.: Active tectonics of central-western Caucasus, Georgia, Tectonophysics, 691, 328–344, 2016.
Varazanashvili, O., Tsereteli, N., Bonali, F. L., Arabidze, V., Russo, E., Pasquaré Mariotto, F., Gogoladze, Z., Tibaldi, A., Kvavadze, N., and Oppizzi, P.: GeoInt: the first macroseismic intensity database for the Republic of Georgia, J. Seismol., 22, 625–667, https://doi.org/10.1007/s10950-017-9726-5, 2018.
Zhu, D., Yan, E., Hu, G., and Lin, Y.: Revival deformation mechanism of Hefeng Landslide in the Three Gorges Reservoir based on FLAC3D software, Procedia Engineer., 15, 2847–2851, 2011.