the Creative Commons Attribution 4.0 License.
the Creative Commons Attribution 4.0 License.
 | 06 Jul 2021
A historical reconstruction of cropland in China from 1900 to 2016
Xiaobin Jin
Lijuan Miao
Xuhong Yang
A spatially explicit cropland distribution time-series dataset is the basis for the accurate assessment of biogeochemical processes in terrestrial ecosystems and their feedback to the climate system; however, this type of dataset is lacking in China. Existing cropland maps have a coarse resolution, are intermittently covered, or the data are inconsistent. We reconstructed a continuously covered cropland distribution dataset in China spanning from 1900 to 2016 by assimilating multiple data sources. In total, national cropland acreage expanded from 77.72 Mha in 1900 to a peak of 151.00 Mha in 1979, but it consistently decreased thereafter to 134.92 Mha in 2016. The cropland was primarily distributed in three historically cultivated plains in China: the Sichuan Plain, the Northern China Plain, and the Northeast China Plain. Cropland abandonment was approximately 43.12 Mha: it was mainly concentrated in the Northern China Plain and the Sichuan Plain and occurred during the 1990–2010 period. Cropland expansion was over 74.37 Mha: it was primarily found in the southeast, northern central, and northeast regions of China and occurred before 1950. In comparison, the national total and spatial distribution of cropland in the Food and Agriculture Organization (FAO) of the United Nations and the History Database of the Global Environment (HYDE) were distorted during the period from 1960 to 1980 due to the biased signal from the Chinese Agricultural Yearbook. We advocate that newly reconstructed cropland data, in which the bias has been corrected, should be used as the updated data for regional and global assessments, such as greenhouse gas emission accounting studies and food production simulations. The cropland dataset is available via an open-data repository (https://doi.org/10.6084/m9.figshare.13356680; Yu et al., 2020).
- Article
(5978 KB) - Full-text XML
-
Supplement
(694 KB) - BibTeX
- EndNote


Land use and cover change (LUCC) has transformed over one-third of the planet's surface, altering regional and global climate via changes in biogeochemical and biogeophysical processes (Foley et al., 2005; Klein Goldewijk et al., 2017). As the dominant drivers of LUCC, agricultural activities that produce food, fiber, and livestock have triggered far-ranging consequences, such as soil erosion, nutrient depletion, desertification, salinization, and acidification (FAO and ITPS, 2015; Keesstra et al., 2016; Sanderman et al., 2017). It has been reported that cropland encroachment into natural lands could alter the land–atmosphere exchange of energy and water, thereby impacting temperature, humidity, precipitation, convection, and wind (Kueppers et al., 2007). On the one hand, agricultural plants have unique biophysical characteristics that are different from natural vegetation, directly influencing local, regional, and global climate systems. On the other hand, human domination of croplands has also transformed the hydrologic and nutrient cycles through drainage, irrigation, and fertilization (Carlson et al., 2017; Castellano et al., 2019). Thus, a better understanding of spatial–temporal conversions in cropland will greatly benefit the quantification of national and global carbon budgets, carbon–climate feedback, and other land-based ecosystem functions (Yu and Lu, 2018).
During the long history of crop cultivation in China, dating back more than 7000 years, 130–176 Mha of natural lands were converted for food production (FAO, 2018; Lai et al., 2016). The land use change process has under gone unprecedented transformation due to the population boom in China, which has tripled since 1900, during which the growing demand for food and fiber has expanded agricultural activities into vast and previously undisturbed lands. Nevertheless, ineffective agricultural technology, combined with improper planning and policy failures, has deteriorated the natural ecosystem and contributed to intensive greenhouse gas (GHG) emissions. Thus, a long-term and spatially explicit cropland distribution dataset will be the foundation of an accurate assessment of the land–atmosphere interactions.
The complex cropland change in China is influenced by the country's economics, politics, culture, and topography. A typical challenge is the scarce data records, which is further aggravated by the lack of uniform standards in data surveys, and the changes in administrative boundaries that occurred before the 1960s. Many studies have focused on reconstructing historical cropland distribution in China and have produced cropland maps for a few intermittent years (Li et al., 2015, 2018; Lin et al., 2009; Liu and Tian, 2010; Wei et al., 2019; Yang et al., 2016). Among all these datasets, the research of Yang et al. (2015a, b) is prominent in providing reliable and relatively high-resolution (1 km) information on croplands in historical years using a “bottom-up” model equipped with the cellular automaton approach. Most of these products describe cropland in Boolean maps, namely each grid cell is either completely occupied by cropland or other non-crop vegetation. This approach is more suitable for mid- and high-resolution images, but a large bias will accumulate during upscaling (Yu and Lu, 2018). This has been evidenced in a previous study, which reported that abandoned croplands have been underestimated by up to 40 % during aggregation in low-resolution gridded maps (Zumkehr and Campbell, 2013).
Another approach is to use fractional coverage to describe cropland distribution in each grid cell, which is common for mid- and low-resolution gridded maps, such as the History Database of the Global Environment (HYDE v3.2) (Klein Goldewijk et al., 2017). HYDE has been widely applied in global and regional model simulations due to its unique advantage with respect to depicting cropland distribution with long-term (10 000 BCE to 2017 CE) and global coverages (e.g., Wang et al., 2020). Nonetheless, the relatively coarse resolution (5 arcmin) has restricted its applicability. Recent studies have produced high-resolution (30–300 m) cropland maps with the aid of a computer and increasingly abundant satellite images (e.g., ESA CCI, GFSAD30m). However, all of these products are either inconsistent with the official cropland data (e.g., ESA CCI, MODIS) or are not continuous (e.g., GFSAD30m in 2015; GlobeLand30 in 2000, 2010, and 2020).
To better serve the economic plans developed since 1949, data on cropland acreages have been collected using increasingly organized protocols in China. Since that time, the longest continuous records are from the Chinese Statistical Yearbook (CSY); however, the accuracy of those records has been questioned (Bi and Zheng, 2000; Feng et al., 2005; Zheng, 1991). Instead, three other critical surveys have been widely acknowledged as being relatively reliable in representing cropland areas in China: the national and official cropland estimation in 1953 (108.53 Mha; Ministry of Finance of the People's Republic of China); the second national cropland estimation (130.04 Mha), known as the First National Land Survey (FNLS), from 1985 to 1996; and the Second National Land Survey (SNLS) from 2007 to 2009 (135.38 Mha). However, the information obtained from these surveys is still inconsistent with annual land use change records (Fig. S1). Hence, there is an urgent need to elucidate the discrepancies between these datasets and to build a temporal consistent cropland acreage data series for reconstructing spatially explicit cropland maps.
In this study, we used a simple but straightforward approach to reconstruct the annual cropland density maps by harmonizing long-term tabular data and gridded images covering the period from 1900 to 2016. Our objectives are to (1) develop a continuous dataset depicting the cropland distribution in China by reconciling accuracy, temporal coverage, and spatial resolutions among different data sources; and (2) examine the distribution of cropland expansion and abandonment using the produced dataset. Cropland distribution and conversion are characterized by cropland density in each 5 km × 5 km grid cell.
2.1 Study area
This study focused on mainland China (excluding Taiwan, Hong Kong, and Macaw), which is also one of the most intensively cultivated areas in the world. Although China's administrative boundary has changed a few times since 1900, the official statistical records were generally consistent after the founding of the People's Republic of China in 1949. Thus, the data used before 1949 were summarized according to the administrative boundary defined by Yang et al. (2015b), whereas the most recent administrative boundary was used for the period after 1949.
2.2 Tabular data
It is necessary to obtain reliable cropland area time-series data before a cropland distribution map can be reconstructed using the model developed by Yu and Lu (2018). Here, data from four tabular datasets and some intermittently reported data that specifically focus on mainland China were obtained, compiled, and adjusted covering the period from 1949 to 2018 (Table 1). The first statistical dataset is from the National Land and Resources Bulletin (NLRB) provided by the Ministry of Land and Resources of China covering the period from 2001 to 2017. The NLRB has continuously updated the national-level cropland area since 2001; it is also the most authoritative report officially released by the Chinese government.
The second statistical dataset is the Land and Resources Statistical Yearbook (CLRSY) published by the Ministry of Land and Resources of China covering the period from 1996 to 2018; the CLRSY data from 2001 to 2018 were either missing or the same as the NLRB data. Therefore, the interannual changes in national cropland area documented in CLRSY for the period from 1996 to 2000 were used to extend the NLRB data back to 1996.
The third statistical dataset is the Chinese Agricultural Yearbook (CAY) provided by National Bureau of Statistics of China, which documented the annual cropland area from 1980 to 2018 at the provincial level; however, approximately 19 % of the records are missing. Thus, the CAY data were gap-filled using the linear interpolation approach and further adjusted for each province (Fig. S2). The CAY helps extend the data on cropland acreages back to 1980.
The fourth statistical dataset is the national crop production from 1949 to 2016 obtained from the CSY. The crop production data, combined with intermittently reported cropland acreage data from other studies, were used to rebuild the cropland area between 1949 and 1979 (Fig. S3, Table S1).

2.3 Satellite-based image products
Multiple sources of remote sensing products were used in this study (Table 2). The products with the highest spatial resolution are at 30 m from (1) global cropland provided by Global Food Security Analysis-Support Data (GFSAD30) Project; (2) the China Land Use and Cover Change (CNLUCC) produced by the Institute of Geographic Sciences and Natural Resources Research, Chinese Academy of Sciences; (3) the GlobeLand30 developed by the Ministry of Natural Resources of China; and (4) FROM-GLC produced by Gong et al. (2013) from Tsinghua University. In comparison, the European Space Agency Climate Change Initiative (ESA CCI) Land Cover time series and the MODIS Land Cover product (MCD12Q1 Collection 6) are at a 300 and 500 m resolution, but they cover much longer periods: 1992–2018 and 2001–2019, respectively. The other five gridded datasets were prepared by Ran et al. (2010) and Ran (2013) at a 1 km resolution and intermittently cover the period from 1980 to 2000, including the IGBP (International Geosphere–Biosphere Programme) Data and Information System, UMD Land Cover, GLC2000, CAS1990, and the WESTDC Land Cover Product 2.0 (Table 2). Additionally, the digitized 1:1 000 000 vegetation map produced by the Compiling Committee of the Vegetation Maps of China (CCVM; Hou, 2001) is also rasterized to provide cropland information from the 1980s.
Among these datasets, GFSAD30 is specifically designed by using multitemporal Landsat imagery for 3 years (2013–2015), over 100 000 reference data samples, and other auxiliary data sources. Similarly, CNLUCC was also developed from Landsat TM (Thematic Mapper) images with supplemental data from the Huanjing-1 (HJ-1) satellite. CNLUCC has been intensively interpreted using the human–computer interactive approach, specifically focusing on China, which intermittently covers the period from the 1980s to 2018 at a 30 m resolution (Liu et al., 2014). The dataset has been rigorously validated and widely applied for land use change analyses in China (Liu et al., 2003, 2010, 2014, 2002). The GlobeLand30 maps were produced from multiple sources of images by the Ministry of Natural Resources of China, including TM5 ETM+ (Thematic Mapper and Enhanced Thematic Mapper Plus) and OLI (Operational Land Imager) multispectral images of Landsat and HJ-1 (China Environment and Disaster Reduction Satellite), the 16 m resolution GF-1 (Gaofen-1, China High Resolution Satellite) multispectral image. The GlobeLand30 maps have also been intensively validated with an accuracy of over 83 % (Chen et al., 2016). In a similar fashion, FROM-GLC images were extracted from Landsat and validated with an approximate accuracy of 71 % (Gong et al., 2013; Li et al., 2017). Therefore, in the present study, GFSAD30, CNLUCC, FROM-GLC, and GlobeLand30 are the major data sources for cropland distribution reconstruction that has occurred since the 1980s.
Table 2Gridded data collected for cropland reconstruction.

a CCVM stands for the Compiling Committee of the Vegetation Maps of China. b CNLUCC stands for China Land Use and Cover Change. c RESDC stands for the Data Center for Resources and Environmental Sciences, Chinese Academy of Sciences (http://www/resdc.cn, last access: 11 November 2020).
2.4 Approach for reconstructing historical cropland acreage data at the national and provincial levels
Cropland area is defined as the area of land that has been cultivated with plants, including fallow cropland. However, discrepancies in the reported national cropland areas have been described in previous studies as well as in officially released time-series datasets (Fig. S1). Despite the large differences, the cropland areas detailed by different official agencies have generally been consistent with respect to the approaches that were used for data collection in each specific period. Thus, we made two assumptions about using the collected time-series datasets: (1) although the officially released cropland acreage datasets are systematically biased, the interannual variations are reliable; and (2) with the development of technology, cropland areas and the reported changes are increasingly reliable. Based on these assumptions, we retrospectively reconstructed information about the cropland areas year by year using tabular data and gridded maps from different sources. In this study, the officially released NLRB report in 2017 (cropland area in 2016) is used as the benchmark data, as it is also the most recent and authoritative record of provincial cropland acreage available. Therefore, the annual amount of national cropland area during historical years was reconstructed by adjusting the benchmark year data using interannual cropland change information derived from different sources, which can be divided into six periods (Fig. 1).
The first period is covered by the annual NLRB reports (2001–2017). In the NLRB, the cropland acreage has an abrupt change from 2008 to 2009, due to the systematic bias that was corrected using the SNLS in 2009 (Fig. S1). Specifically, the SNLS was launched in 2007 using state-of-the-art technologies to delineate the use of each parcel unit of the land in China. The 2-year survey built the first comprehensive database covering land use information from the county level to the national level with the aid of various airborne and spaceborne remote sensing platforms and field investigations. Therefore, we believe that the updated NLRB reports (2009–2017) are more accurate and reliable than the reports from 2001 to 2008. Apparently, the cropland areas have been systematically and substantially underestimated by 13–14 Mha during the period from 2001 to 2008 (Fig. S1). Thus, instead of using the original reported number, the interannual cropland changes from the annual NLRB reports were adopted to extend the data back to 2001. Note that the SNLS map is not accessible to the public; other contemporaneous maps with commensurate quality from multiple sources were alternatively used for spatial mapping (e.g., GFSAD30, GlobeLand30).
The second period ranges from 1996 to 2000 with cropland data obtained from the annual CLRSY released by the Ministry of Land and Resources of China. These officially reported cropland data were actually updated annually from baseline year data in 1996 and the land use change areas reported by local government. Similarly, we believe that the cropland area data from the baseline year in 1996 are systematically biased, whereas the interannual changes in the cropland area during the period from 1996 to 2000 are reliable and were used to extend the cropland data back to 1996.
The third period is from 1986 to 1995, during which the interannual changes in the cropland area were provided by the Ministry of Land and Resources of China. Similar to the 1996–2000 period, the land use changes were reported from local government and were used to extend the cropland area data back to 1986 in this study.
The fourth period ranges from 1980 to 1985, during which the national cropland area changes were derived from the gap-filled data of the CAY. The CAY data were also officially and annually updated from the cropland changes collected by the local government in each province. This helped extend the national cropland data back to 1980.
The fifth period ranges from 1949 to 1979, the data from which were specifically rebuilt using the crop production–area relationship derived from key years intermittently documented from 1949 to 1960. According to Feng et al. (2005), the cropland area data officially reported before 1960 were relatively reliable, yet the data during the period from 1960 to 1980 were distorted due to political issues (see Sect. 4.1). Similar to Feng et al. (2005), we found a high correlation between cropland area and crop production using records collected before 1960 (R2=0.92; Fig. S3, Table S1). Based on the relationship constructed, we then interpolated the cropland area data for 1949–1980 and extracted the interannual changes to extend the cropland time-series data back to 1949.
For the last period from 1900 to 1948, we used the trends extracted from the cropland data of Yang et al. (2015b) from 1887, 1933, and 1952.
Similar to the national cropland area data reconstruction, the provincial cropland area data reconstruction can also be divided into three periods. The first period is from 2013 to 2016, during which data on the provincial cropland areas were directly provided in the NLRB reports. For the periods before 2013, the provincial cropland areas were adjusted using cropland area data from 2013 as the baseline. For example, during the second period from 1980 to 2012, we first gap-filled the cropland area data in each province using linear interpolation (Fig. S2); we then adjusted the interannual variation by removing abrupt changes (Fig. S2). Due to the lack of provincial data before 1980, we proportionally adjusted the amount of cropland area in each administrative boundary using national acreage data.
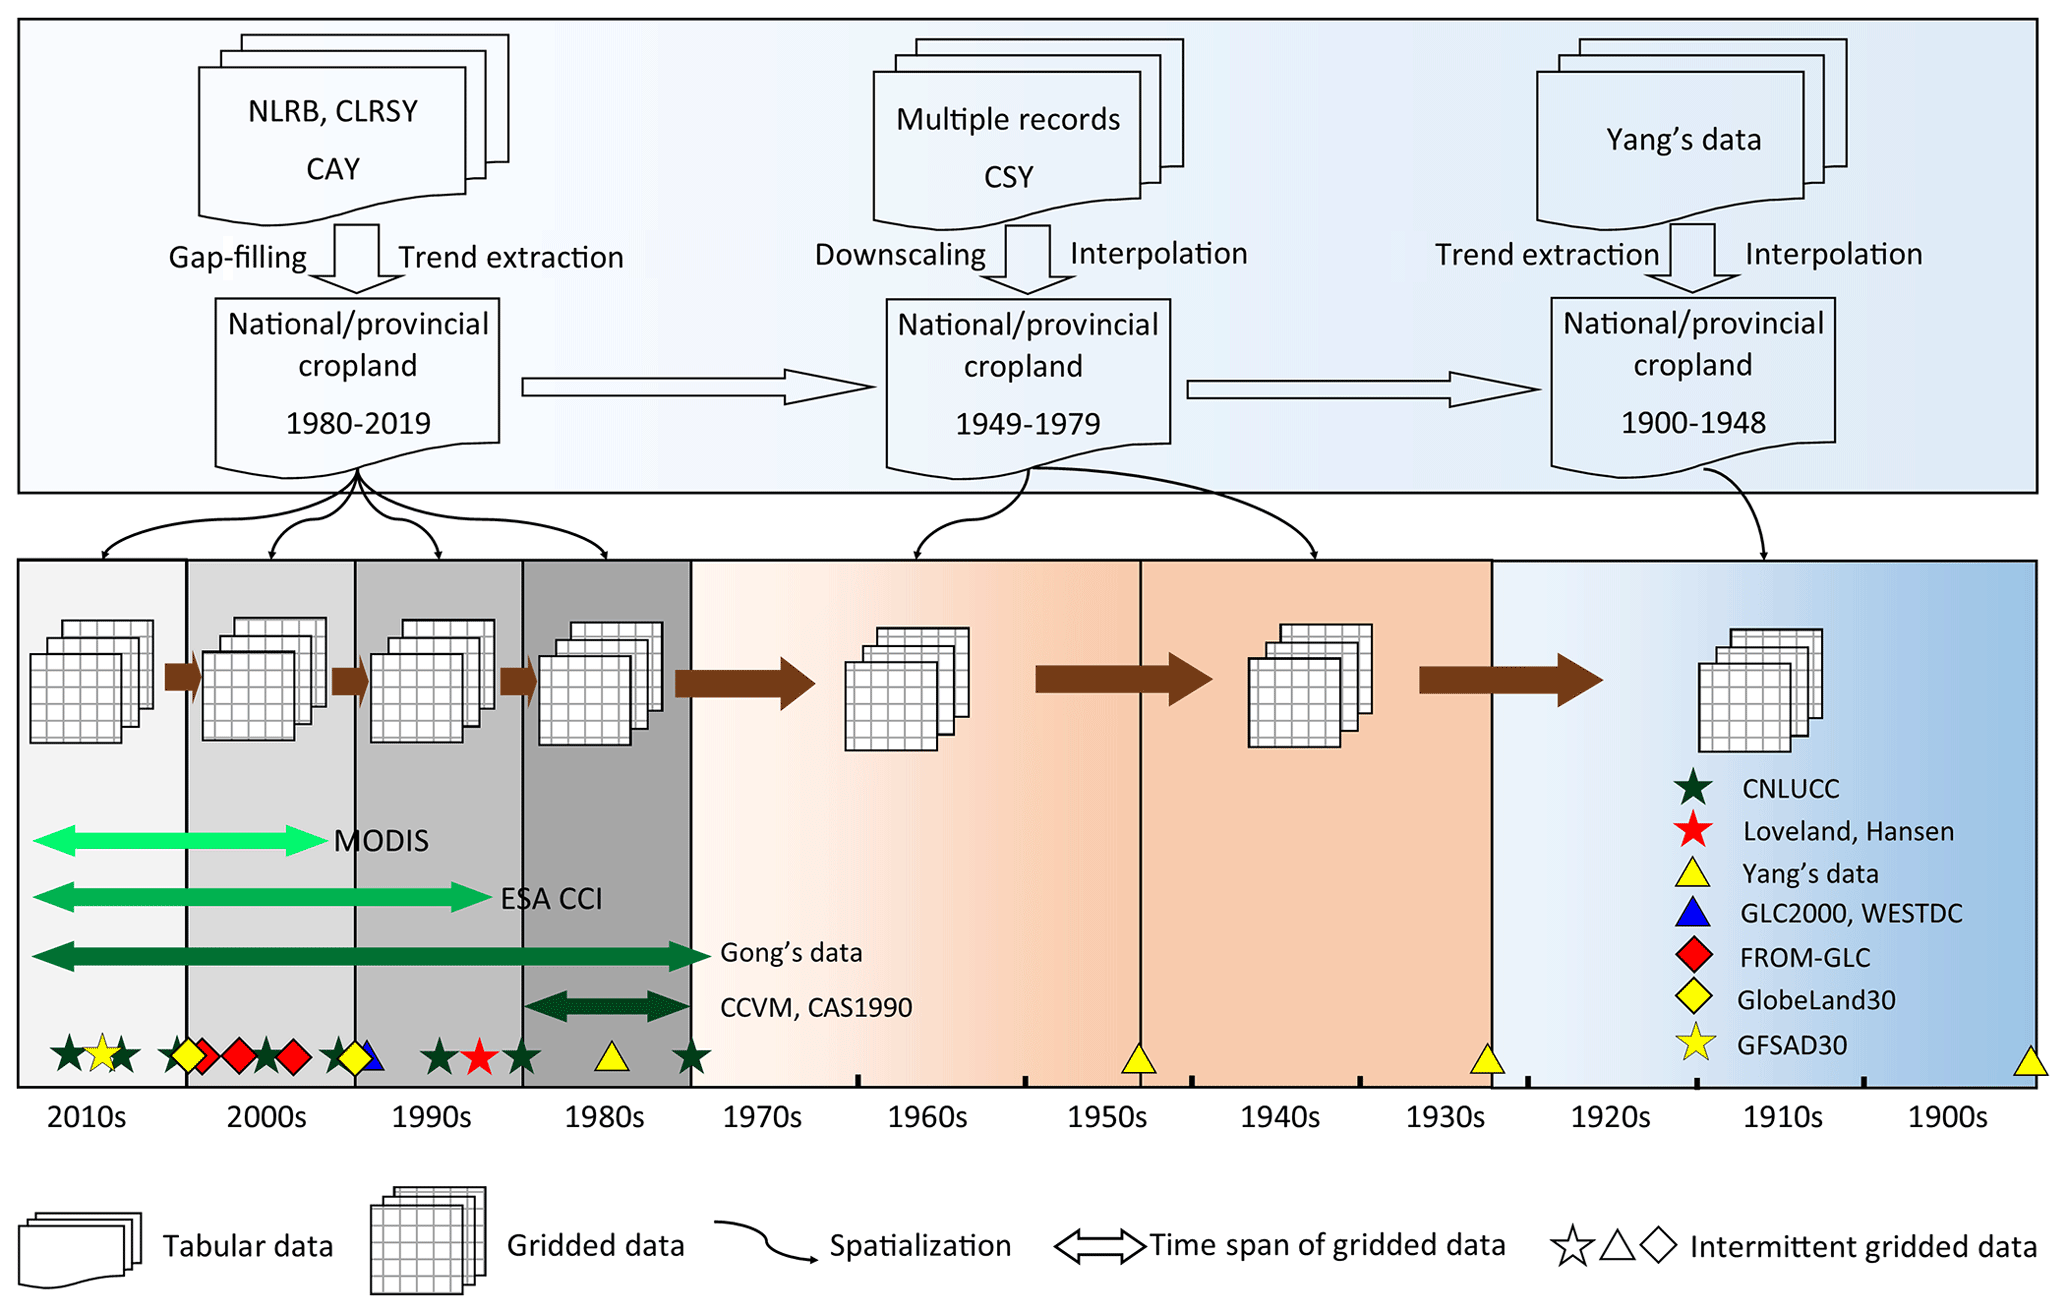
Figure 1Methodology flow chart and datasets used in the cropland reconstruction. The upper boxes are the tabular survey data, and the lower boxes are the gridded images. The following abbreviations are used in the figure: CAY denotes the Chinese Agricultural Yearbook; CSY denotes the Chinese Statistical Yearbook; NLRB denotes the National Land and Resources Bulletin; CLRSY denotes the China Land and Resources Statistical Yearbook; MODIS denotes the Moderate Resolution Imaging Spectroradiometer Land Cover Type Collection 6 (MCD12Q1); ESA CCI denotes the the European Space Agency (ESA) Climate Change Initiative Land Cover; Gong et al.'s data refers to human settlement (urban and rural) data from Gong et al. (2013); GFSAD30 denotes the Global Food Security Analysis-Support Data at 30 m; CCVM represents a 1:1 000 000 vegetation map of China; CAS1990 denotes land cover data that originated from a 1:1 000 000 land use map produced by the Institute of Geographic Sciences and Natural Resources Research, Chinese Academy of Sciences; CNLUCC represents China Land Use and Cover Change; Loveland denotes the land cover map developed by Loveland et al. (2000); Hansen denotes a land cover map produced by Hansen et al. (2000); Yang's data refers to cropland data from Yang et al. (2015b); GLC2000 denotes the Global Land Cover 2000 database from the Joint Research Centre of European Commission; WESTDC represents a land cover map compiled by the Chinese Academy of Sciences and edited by Ran (2013); FROM-GLC denotes land cover maps produced by Gong et al. (2013) from Tsinghua University; GlobeLnad30 denotes land cover maps produced by the Ministry of Natural Resources of China. Note that the map reconstructed in 1 year was used as the initial condition for the following year's cropland reconstruction.
2.5 Approach for spatializing cropland distribution in China
Based on the provincial cropland acreage reconstruction, we spatialized the cropland distribution using gridded maps as ancillary data. More specifically, we implemented the model that we previously developed to allocate cropland spatially depending on the cropland potential (possibility) (Yu and Lu, 2018). Here, we made the following two assumptions in constructing the cropland maps: (1) the national and provincial cropland areas derived from the officially released NLRB reports are more reliable than the gridded maps produced by other institutions; and (2) each gridded product provides potential distribution (possibility) of cropland but suffers from different sources of errors. This is understandable, as the officially released reports were based on the SNLS, which is, to date, the most intensive, sophisticated, and authoritative survey conducted in China. Thus, the NLRB statistics were given the highest priority to confine the cropland area in each province, whereas other gridded products were used for spatial allocation of the croplands, as they were less intensively validated and were less accurate.
Based on the above assumptions, we constructed cropland maps for each of the periods as shown in Fig. 1. Generally, the idea is to allocate a prescribed cropland area to each province with priority given to grid cells that have a higher possibility. Thus, we constructed a potential cropland map using the gridded images available during each of the periods under study. To do so, three types of gridded images were directly resampled to 100 m for analysis. The first type of gridded image was obtained from the remote sensing products, which were converted to Boolean-type data and assigned weighting factors with a higher value given to a higher-resolution image. The second type of gridded image was the weighted map created using urban and rural maps produced by Gong et al. (2019). The weighted values were the distance to the nearest urban and rural area for each grid cell, assuming that land close to human settlements is prone to be cultivated, whereas land far from settlements has a higher tendency to be abandoned. The third type is the cropland constructed in each of the previous years, which assumes that the cropland area data between years are correlated. The sum of these three types of weighted images was used as the potential cropland map. For example, in reconstructing cropland maps for 2005, we first identified all the gridded products available during the decade, including MODIS, ESA CCI, Global Cropland 30 m, and CNLUCC maps. The four types of gridded images were assigned weighting scores ranging from 1 to 4, with a higher score given to a higher-resolution map. Moreover, the reconstructed cropland in 2006 and the impervious land map in 2003 by Gong et al. (2019) were used. A ranked potential map was created by summing all of the weighted images, which was then used to determine the cropland distribution for each province. Specifically, for the pre-satellite era (1900 to 1979), the ranked map was created using the gridded map produced by Yang et al. (2015b) and the earliest year data in each of the available gridded data series (e.g., MODIS LC in 2001 and CNLUCC in the 1980s).
During this process, if the map-based cropland acreage of a province was higher than the inventory data, a certain number of 100 m cropland grid cells would be removed to keep the total cropland area consistent with the reconstructed national time-series data. The removal was prioritized to the low-ranking score grid cells. Otherwise, if the cropland area of a province was higher than it was in the previous year, the discrepancy would be added (i.e., cropland abandoned) using the ranked map with priority given to the high-ranking score grid cells. These processes trigger the occurrence of crop abandonment and expansion events. After spatializing the cropland at 100 m gridded maps, we used a 5 km window to calculate the cropland percentage (Fig. 1).
After the 5 km×5 km cropland maps were reconstructed, we compared our results with the findings reported in previously published studies and available gridded maps. Specifically, the widely used HYDE v3.2 (Klein Goldewijk et al., 2017) data were employed for spatial pattern comparisons of cropland distribution, abandonment, and expansion. As HYDE is a prominent product that has the advantage of representing long-term cropland distribution with global coverage (Yu and Lu, 2018), the comparison with HYDE will be informative for future simulations and improvements. The cropland abandonment and expansion data from our reconstructed maps were derived from a grid-by-grid comparison of the 100 m cropland maps and are presented here by upscaling to 5 km. Therefore, the abandonment year and expansion year indicate the latest conversions of cropland to non-cropland and non-cropland to cropland, respectively. Limited by the spatial resolution, HYDE-based cropland abandonment is the difference between the current maximum cropland coverage and that of 2016, whereas expansion is the difference in cropland coverage between 1900 and 2016. Thus, the HYDE abandonment year is the time in which the cropland area began to decrease in each of the 5 arcmin grids. Specifically, the HYDE-based expansion year is defined here as the date of the largest cropland increment. Therefore, the HYDE-based cropland conversion date is an approximate representation because it was not possible to obtain the exact occurrence event in each grid cell. This study seeks to correct the biases of historical cropland area data, reduce the uncertainty in cropland distribution, and provide an alternatively reliable estimate of long-term cropland maps at a relatively higher resolution than is possible with HYDE.
3.1 Changes in the historical cropland area in China
Rebuilt national cropland acreage increased from 77.48 Mha in 1900 to the first peak of 125.81 Mha by the end of the 1950s. From 1960, the national cropland area rapidly increased to its maximum size (151.00 Mha) in the early 1980s, followed by a steady and consistent decline thereafter. We compared the national cropland area rebuilt in this study with other reports, surveys, and published results (Fig. 2). The time-series datasets are generally consistent with respect to overall trends, although the interannual changes and amplitudes varied greatly between the studies. Our reconstructed cropland acreage data and HYDE data, which are also the two datasets with full coverage of the entire study period, are consistent with trends seen before the 1930s and after the 1990s (Fig. 2). Conspicuously, the discrepancy between the two datasets increased to about 30–40 Mha from the 1940s to the 1980s. Note that HYDE was built using Food and Agriculture Organization (FAO) statistics; thus, the trends in the two datasets are similar (Fig. 2). Nevertheless, the HYDE and FAO trends are inconsistent with our reconstructed data and other intermittently reported studies from 1960 to 1990. It is also noteworthy that abnormal cropland augments were found in the time-series data of FAO and HYDE in the 1980s, the NLRB in 2009, and FAO in 2015 (Fig. 2).
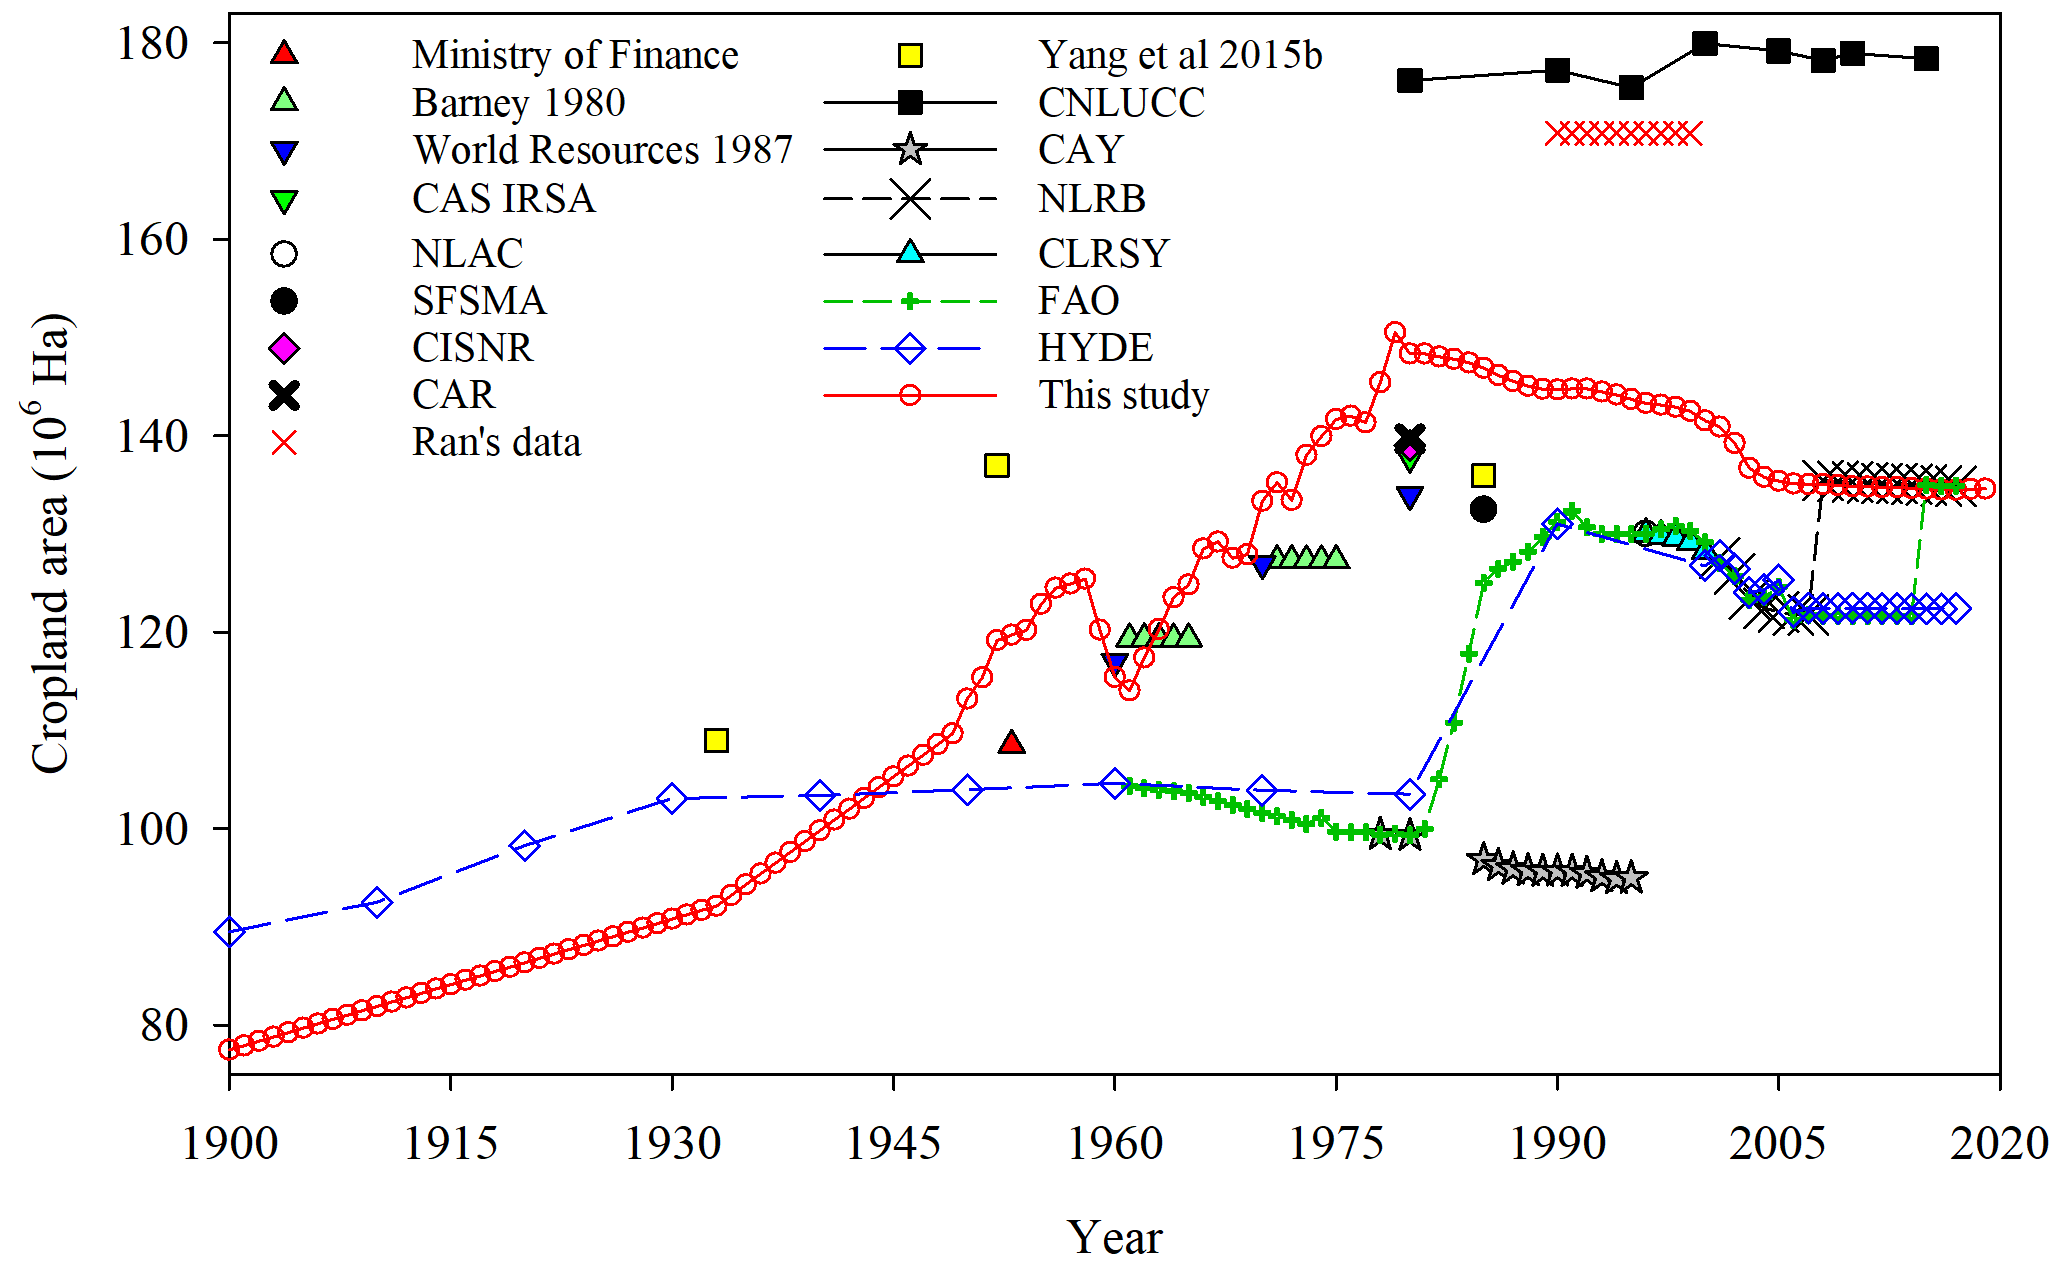
Figure 2Comparisons of national cropland area data from different sources. The abbreviations used in the figure are as follows: Barney 1980 denotes the number from Barney (1981); World Resources 1987 refers to World Resource Institute (1987); NLAC denotes the National Land Administration of China; SFSMA denotes the Soil Fertility Station of the Ministry of Agriculture; CAS IRSA refers to the Institute of Remote Sensing and Digital Earth, Chinese Academy of Sciences; CISNR denotes the Committee of Integrated Survey of Natural Resources; CAR denotes the Committee of Agricultural Regionalization; NLRB refers to the National Land and Resources Bulletin; CLRSY denotes the China Land and Resources Statistical Yearbook; Ran's data refers to the average of the five datasets prepared by Ran et al. (2010) and Ran (2013), including the IGBP Data and Information System, UMD Land Cover, GLC2000, CAS1990, and the WESTDC Land Cover Product 2.0; CNLUCC denotes the China Land Use and Cover Change dataset obtained from the Data Center for Resources and Environmental Sciences, Chinese Academy of Sciences.
We compared the provincial cropland areas and coverage percentages using data derived from HYDE, Yang et al. (2015b), and our study with officially released NLRB data (Fig. 3). Obviously, the HYDE and Yang et al. (2015b) cropland acreages were moderately underestimated in the high-cropland provinces (e.g., Heilongjiang Province) (Fig. 3a; R2=0.88, slope = 0.75–0.78), whereas GFSAD30m generally overestimated cropland distribution in most of the provinces (Fig. 3a; R2=0.87, slope = 1.1). In comparison, the coverage percentages are also consistent between the datasets (Fig. 3b, c, d). In a similar fashion to the cropland acreage, GFSAD30m tends to overestimate the cropland percentage in the high-cropland-coverage provinces (Fig. 3c). Surprisingly, the cropland percentage from Yang et al. (2015b) is highly consistent with the percentages obtained in our study, although the two datasets were independently constructed (Fig. 3d; R2=0.96, slope = 1.00).

Figure 3Comparison of cropland acreage (a) and percentage (b) in each province among different gridded maps and inventory data. HYDE data represent the average cropland area from 2000 to 2016; GFSAD30m and Yang et al. (2015b) were compared with NLRB and reconstructed cropland area in 2015 and 1985, respectively. The black solid line is the 1:1 line, and the colored dash lines are the linear regression lines.
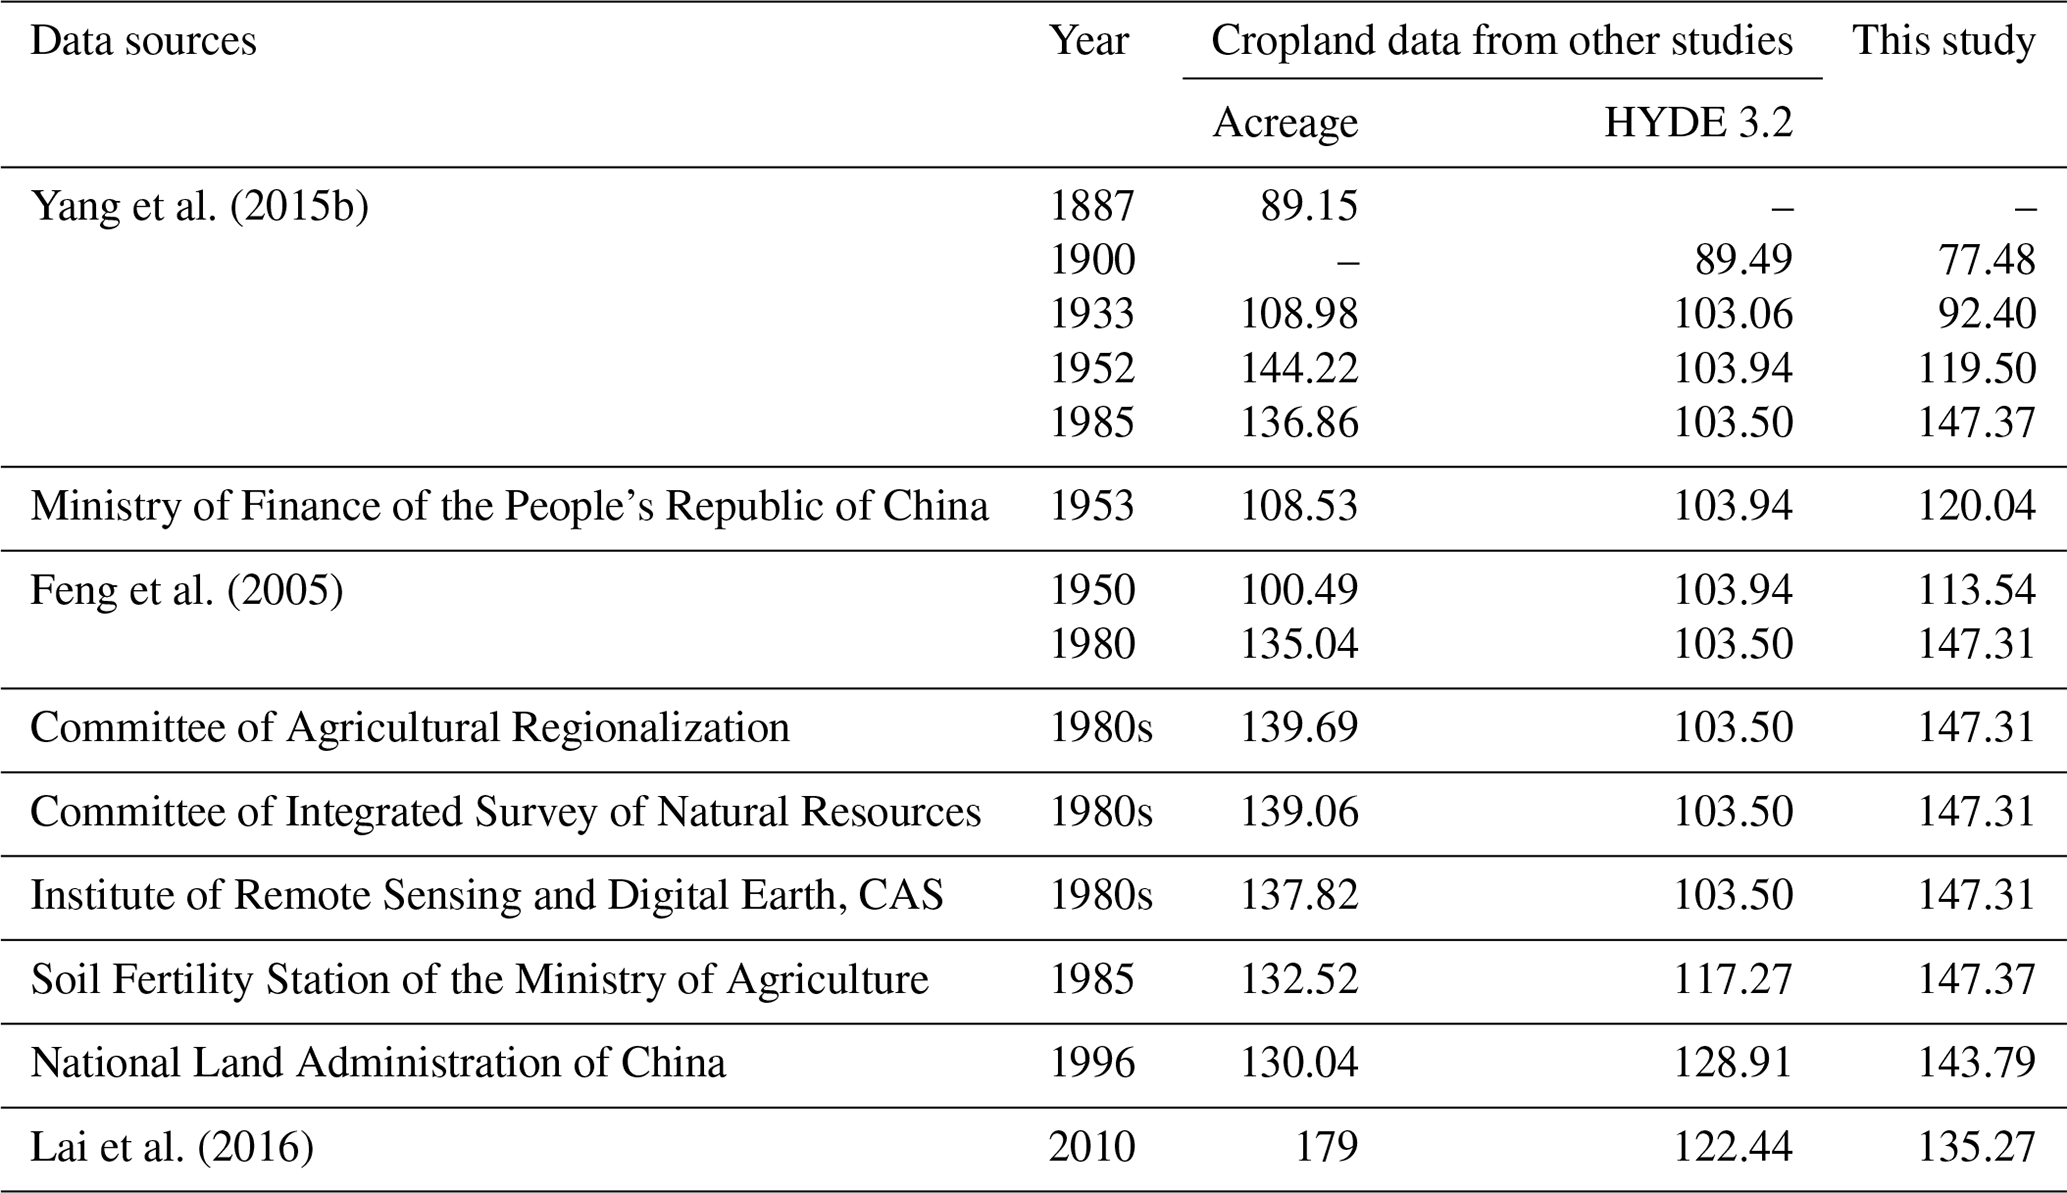
We also compared the national cropland acreages from our results and HYDE with other studies on intermittently reported cropland (Table 3). In comparison to the relatively steady cropland of about 103–104 Mha from HYDE during the period from the 1930s to the 1980s, the intermittently reported croplands were about 100–144 Mha. Our reconstructed croplands are generally higher than the intermittently reported croplands, except for the period before 1953. Specifically, the trends derived from the croplands of Yang et al. (2015b) in 1887 (89.15 Mha), 1933 (108.98 Mha), and 1952 (144.22 Mha) were used to reconstructed the cropland for the period from 1900 to 1948, producing cropland areas of 77.48 and 92.40 Mha in 1900 and 1933, respectively (Table 3).
Table 3Estimates of total cropland area (million hectares) in China from this study, HYDE 3.2, and other studies.
3.2 Spatial patterns of cropland distribution during different periods in China
We compared the cropland distribution in sets of decades beginning with 1900. Our reconstructed maps showed that the cropland was primarily distributed in three historically cultivated plains in China: the Sichuan Plain, the Northern China Plain, and the Northeast China Plain (Fig. 4). Remarkably, the cropland acreage in the HYDE maps is much lower in the Sichuan Plain and the Northeast China Plain, whereas the croplands are much more extensively distributed throughout the rest of China (Fig. 4).
We also compared the cropland change in each of the studied decades by simply calculating the coverage differences. The cropland change patterns were also similar between our study and the HYDE maps, although the discrepancies were found in different periods and at different locations. For example, during the period from 1930 to 1960, the HYDE maps detected large-scale cropland loss between the Yellow River and the Yangtze River. Nevertheless, our data revealed that the region was dominated by intensive cropland expansion during the same period. Moreover, in contrast to the cropland loss found in parts of Northeast China during 1930–1990, our reconstructed maps showed cropland expansion in the corresponding areas (Fig. 4). For the most recent decades, intensive cropland expansion was found in Northwest China and central Northeast China from our reconstructed maps (Fig. 4h). These changes were less often captured in the HYDE maps (Fig. 4q).
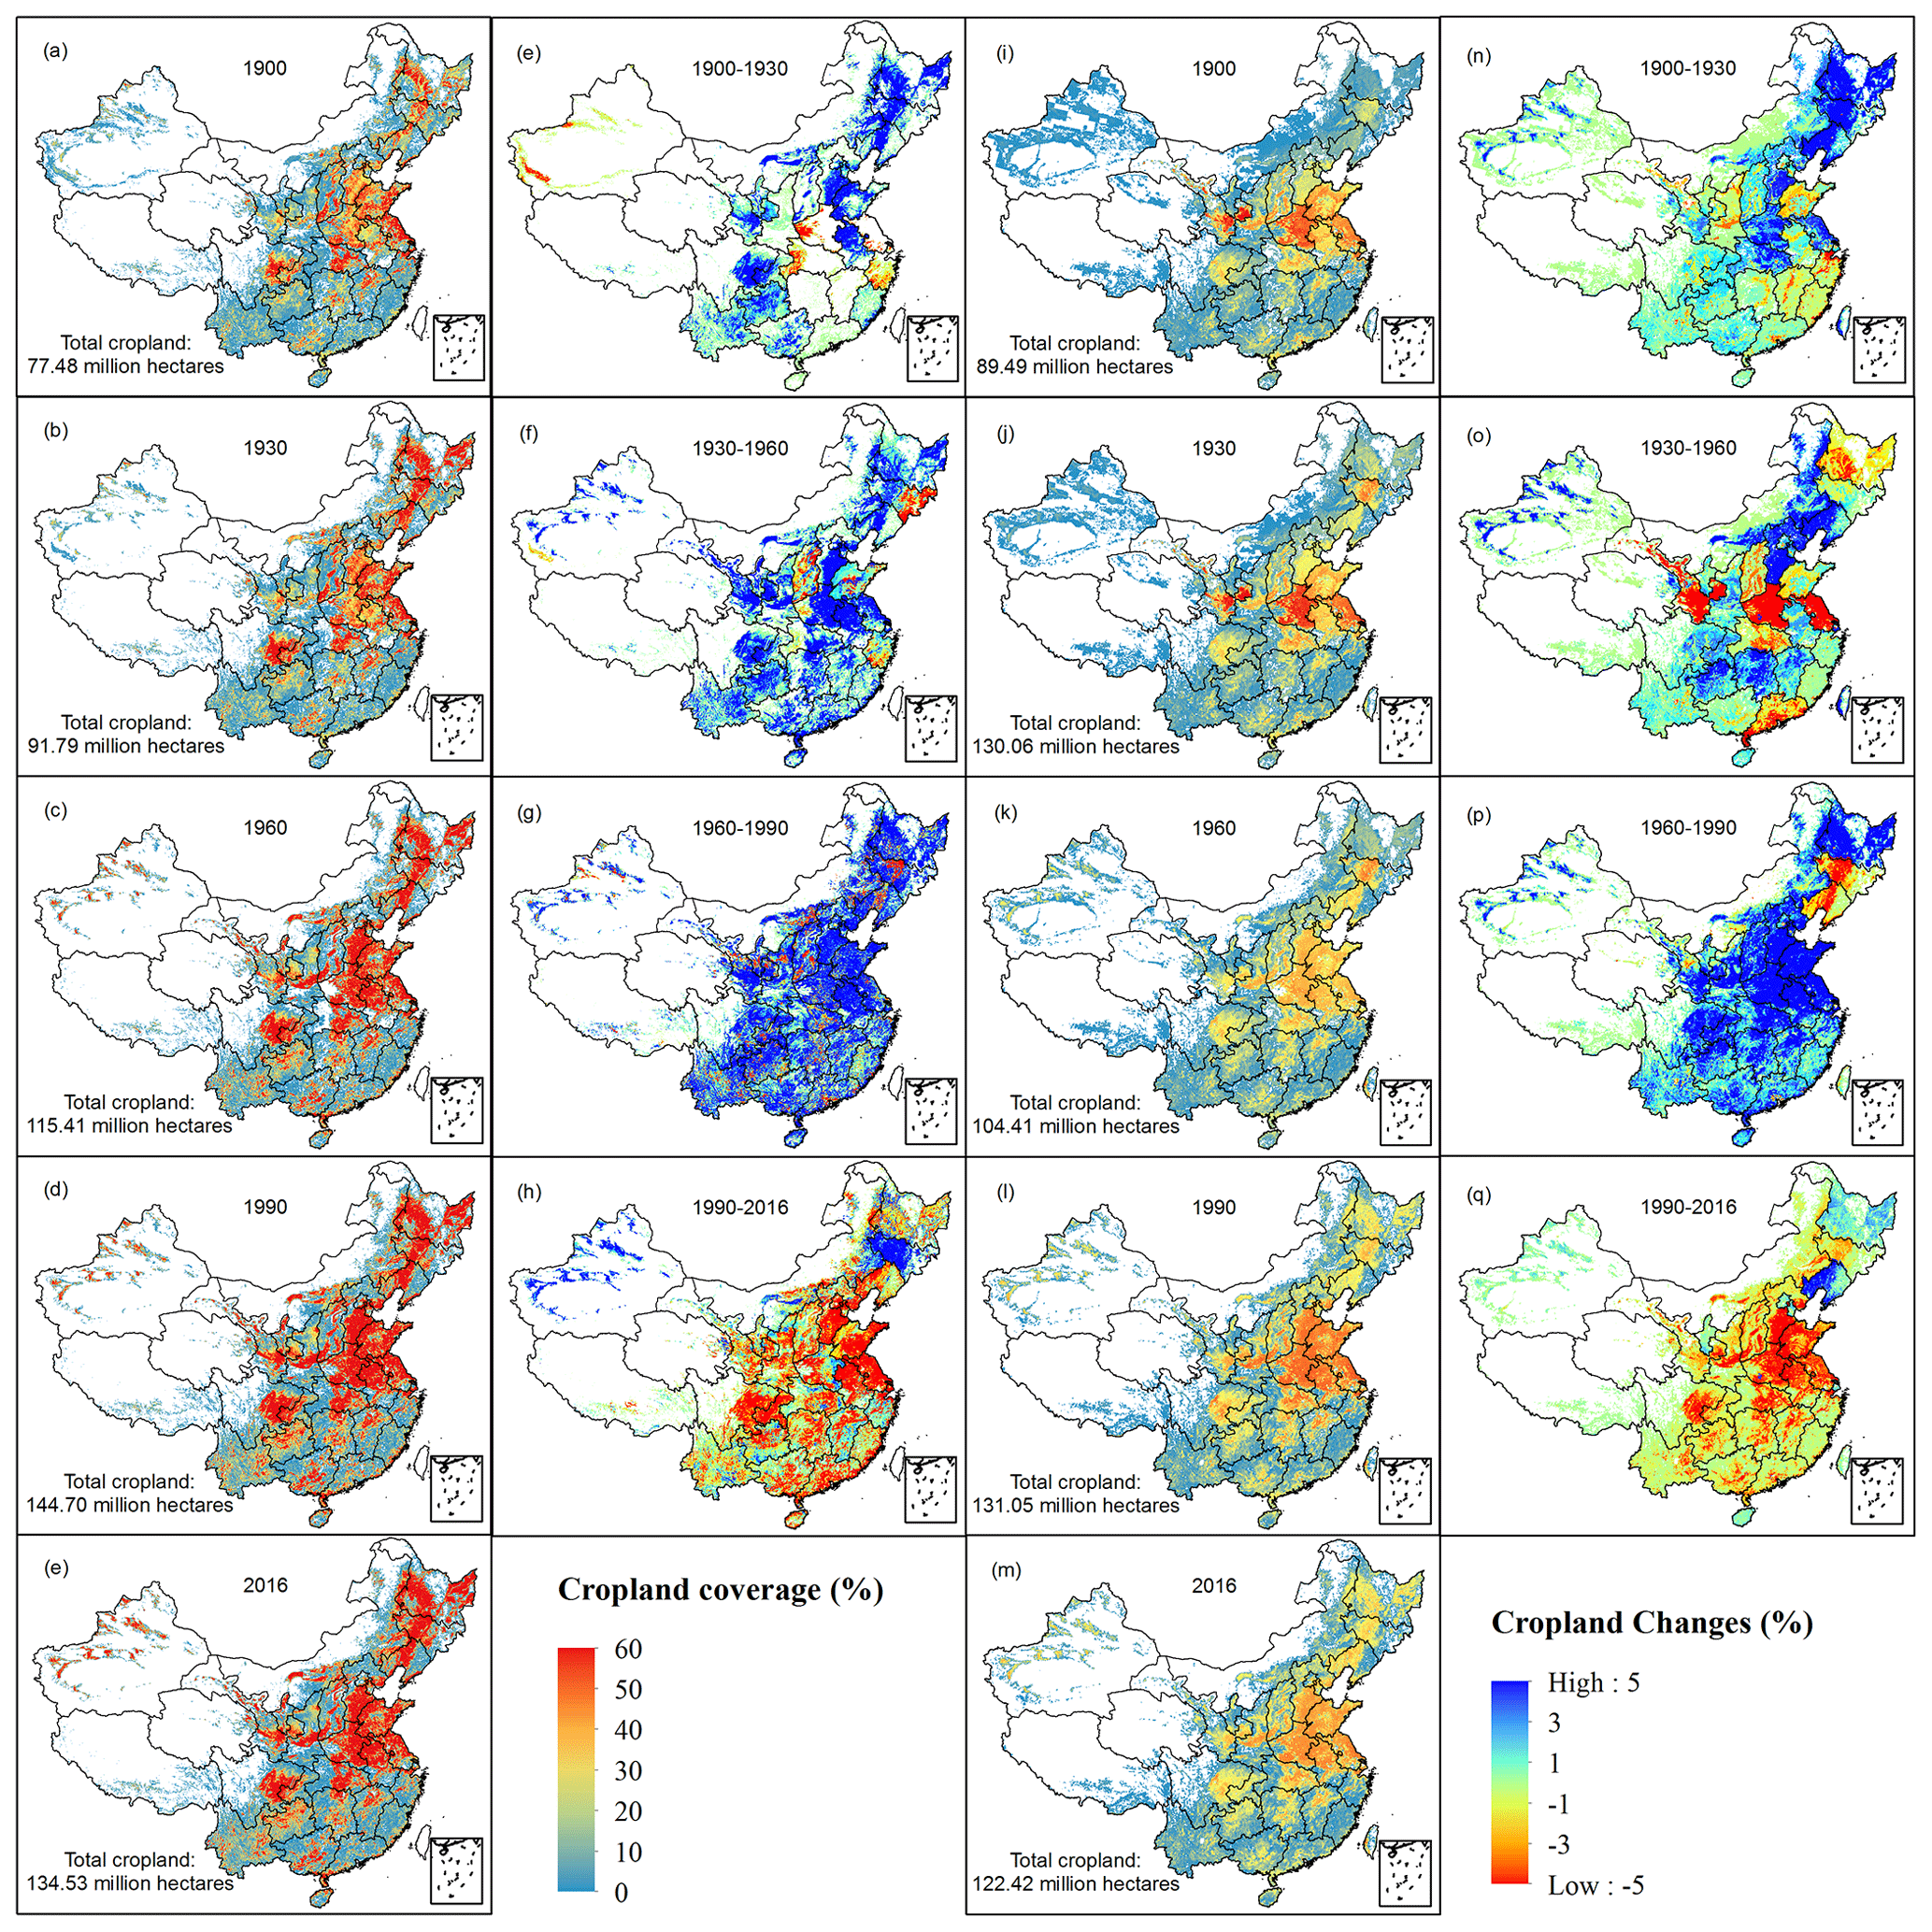
Figure 4Cropland coverage and changes during different periods in China (left two columns) and HYDE (right two columns), excluding Taiwan, Hong Kong, Macaw, and the islands in the South China Sea; panels (a)–(e) and (i)–(m) indicate 1900, 1930, 1960, 1990, and 2016 (from top to bottom), respectively.
3.3 Spatial patterns of cropland distribution during different periods in China
Limited by the availability of the time-series data, we analyzed and compared cropland abandonment and expansion during the 1900–2016 period, as well as the year of the onset of cropland abandonment and expansion, as derived from our reconstructed maps and the HYDE maps (Fig. 5). In general, the abandonment years mainly occurred during the 1970–2010 period (Fig. 5a, e), whereas the HYDE-based cropland abandonment year was generally 1 decade earlier than the year derived from our maps. Another distinct difference was the distribution of the early cropland abandonment (before 1930), which, in our data, was mainly found in Northeast China (Fig. 6b), in contrast to that found in central China, Northeast China, and Northwest China from the HYDE maps (Fig. 6e). In comparison to the abandonment area identified from our maps, the incidence of HYDE-based cropland abandonment was lower in the northern and southwestern regions of China, but it was higher in the northwestern and northeastern regions (Fig. 5b and f, respectively).
Conspicuously, a significant difference in the expansion years was observed between the results derived from the two datasets (Fig. 5c and g, respectively). More specifically, in our maps, cropland expansions mainly occurred in the years before 1970, whereas that it generally occurred after 1970 in the maps derived from HYDE. Furthermore, cropland expansion was much smaller in the central and southern regions of China in the HYDE maps than in our maps (Fig. 5d and h, respectively).
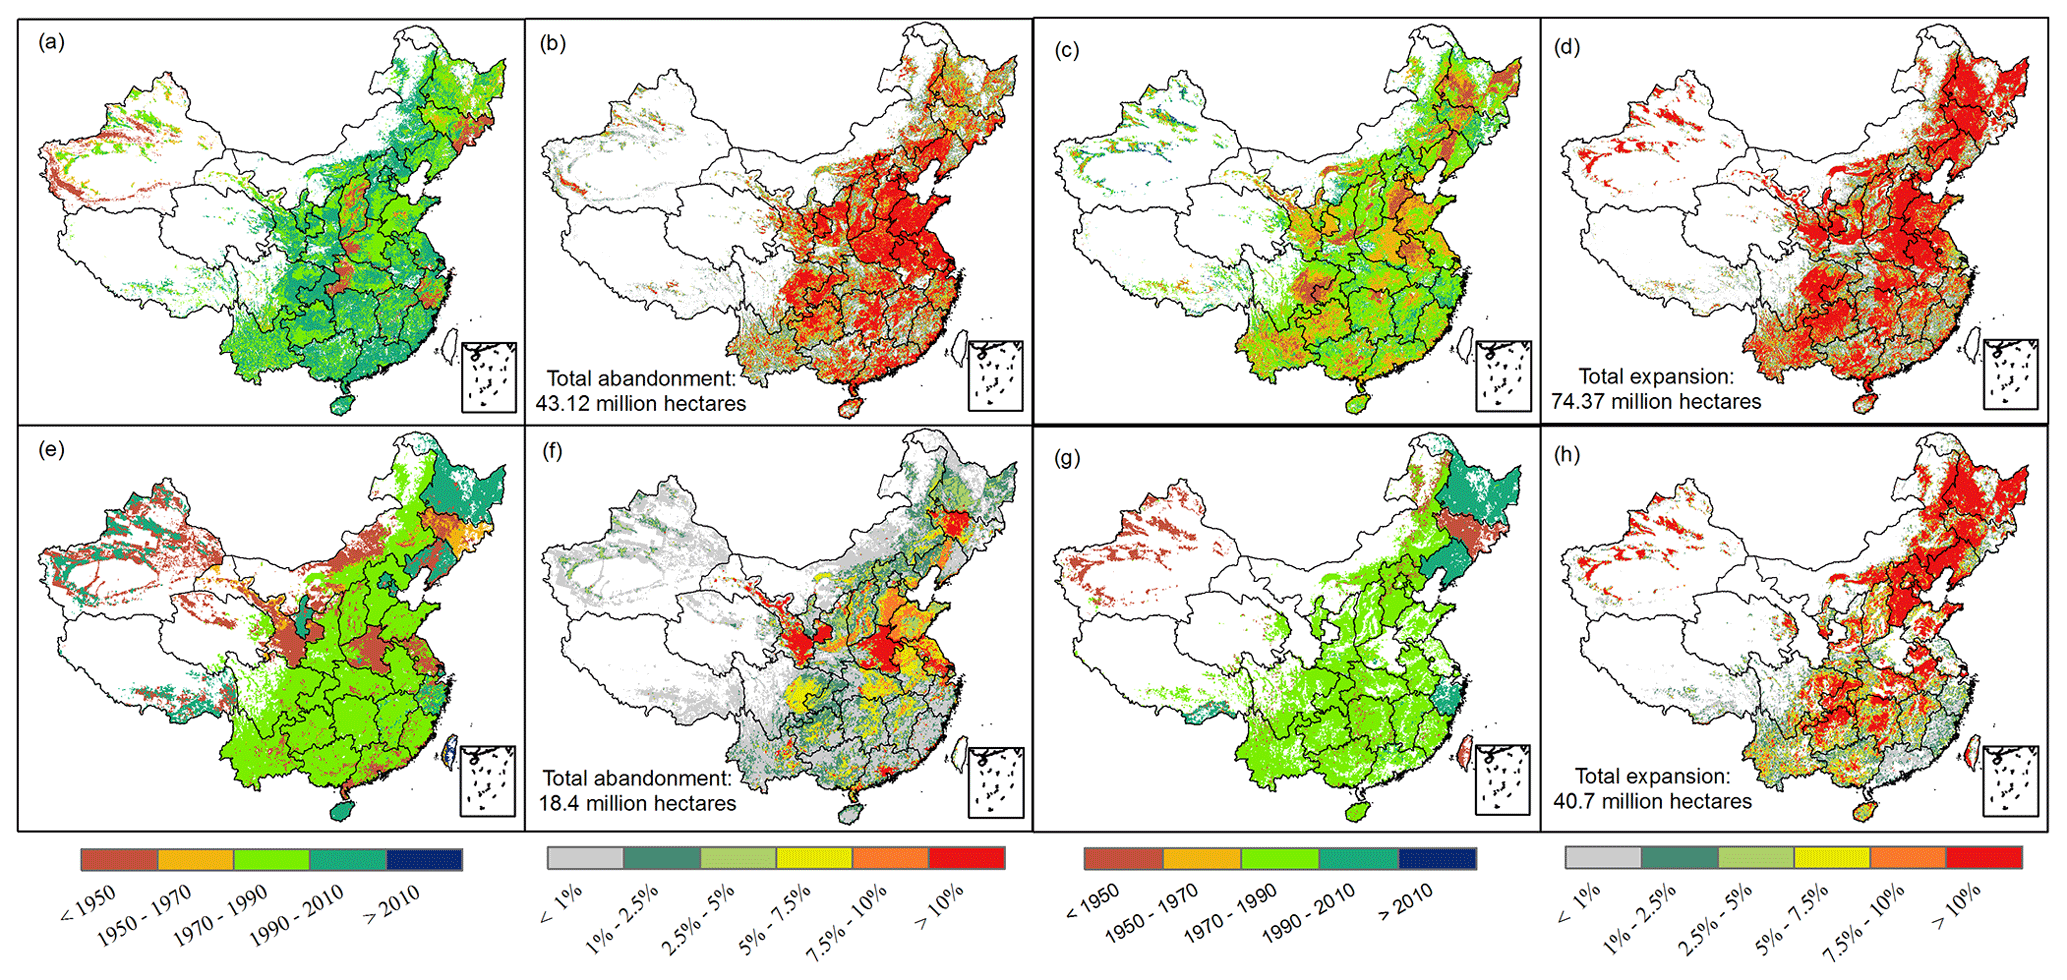
Figure 5Distribution of cropland abandonment (a, e) and expansion (c, g) year as well as abandonment (b, f) and expansion (d, h) percentage in China from 1900 to 2016 for this study (a–d) and HYDE (e–f).
All cropland data reconstructed in this study are publicly available via https://doi.org/10.6084/m9.figshare.13356680 (Yu et al., 2020).
5.1 Temporal changes in the national cropland acreage
Uncertainty about the historical cropland acreage in China is enormous due to the contradictory data reported by official agencies. Many studies have tried to reconstruct historical cropland distribution maps in China, but only a few intermittent years were available for several key years. What is lacking is a continuous cropland dataset with acreage that is consistent with the data that have been officially released. Since 1949, collections of cropland acreage data have been increasingly organized to serve the development of economic plans. The first official estimation of national cropland was 108.53 Mha conducted in 1953 by the Ministry of Finance of the People's Republic of China. However, the methods used in the land survey have several drawbacks (Zheng, 1991). First, the units used in the land survey differed between locations. The traditional metric units used in China were not unified and referred to different lengths in the 1950s (although all were called “Mu”), resulting in a significant discrepancy in information about the croplands been surveyed. Second, the underestimation from adopting the “production-to-acreage” extrapolation approach was due to technology and accessibility limitations in the field survey. Historically, this traditional method has been widely used in China for tax purposes. Specifically, the approach converts low-productivity croplands (e.g., steep lands, marginal lands) into less acreage (approximately one-third to one-eighth) which is surveyed by referring to a “standard-productivity” cropland (Perkins, 2017). Thus, it is highly possible that the converted acreage reported to the local government greatly underestimated the actual cropland size. Despite these limitations, this method was a benchmark used for updating cropland areas for a few decades after 1949.
The second national cropland estimation (130.04 Mha), the FNLS, was conducted during the 1985–1996 period. This 10-year land survey was the first comprehensive and systematic survey performed in China using many aerial photos and field measurements. Nevertheless, the uncertainties are still very large, as deduced from time-unmatched information between the photos and the field surveys, the low quality of the photos, and manual digitalization. Due to the awareness of the limitations of the estimation, the SNLS was conducted from 2007 to 2009 and aimed at delineating each parcel of land being used in China. The SNLS is the most recent, comprehensive survey officially conducted using integrated state-of-the-art technologies, including airborne and spaceborne remote sensing, a geographic information system, and a satellite navigation system, among others.
Based on the benchmark data provided, we found that our reconstructed cropland was about 14 Mha (11 %) higher than the area derived from FAO and HYDE for the period from 1990 to 2014. It should be noted that FAO updated the cropland acreage using official data from 2015, causing an abrupt change in the amount of cropland (Fig. 2). Surprisingly, the amount of FAO and HYDE cropland abnormally increased by 28–32 Mha from 1980 to 1990, which contradicted the 4 Mha decline in cropland acreage revealed in our reconstructed data. This may because the official data reported to FAO were from the CAY in which cropland underestimations have now been officially acknowledged. For the period after 1980, FAO abandoned the CAY data and used the CLRSY data instead, resulting in an abrupt change in the cropland acreage. A similar abrupt increase in the cropland in HYDE was inherited from FAO, which was used as the basis for the HYDE reconstruction.
In addition to the abrupt changes in the increase in cropland, we found that the FAO data on changes in cropland during the period from 1960 to 1980 were also distorted. Noticeably, in FAO, a persistent decrease in the cropland acreage was identified from 1960 to 1980, which is different from the rapid cropland expansion identified in our reconstructed data (Fig. 2). We found that the distorted trend in the FAO cropland data was rooted in the CAY data that were used: the decrease in the amount of cropland during the 1960–1980 period in the CAY data has been questioned by many studies (Feng et al., 2005; Zheng, 1991). For example, to encourage cropland expansion, an incentive policy was implemented to allow the newly cultivated lands to be free from taxation and excluded from reporting to the government for the first 3–5 years during that period (Bi and Zheng, 2000; Zheng, 1991). In reality, the newly cultivated lands were never reported to the local government (Feng et al., 2005). Moreover, many newly cultivated lands were cultivated but “concealed” due to political issues, in order to report a higher crop yield to the local government (Zheng, 1991). Therefore, the cropland area officially reported from 1960 to 1980 has been greatly distorted and should be discarded.
An alternative approach is required to reconstruct data on the national cropland acreage for the period from 1960 to 1980. Innovatively, Feng et al. (2005) found that cropland area and crop productivity were closely related, and they were used to rebuild cropland acreage for the period from 1960 to 1980. This approach is grounded in the fact that crop production was strictly controlled and allocated by the government during the planned economic period, rendering the crop production figures unlikely to be distorted and, thus, reliable as a reference. However, it should be noted that agricultural technology and climatic factors also affect crop production. Therefore, the approach should be limited to the period of the samples used, and extrapolating to other periods may cause bias. Similarly, we reconstructed national cropland acreages from the area–production relationship obtained from the intermittently reported data from multiple sources from 1949 to 1980 (R2=0.92, Fig. S3, Table S1). We then extracted the interannual changes in the cropland area and applied that to the baseline year of 1980 to reconstruct the cropland acreage from 1949 to 1979.
Consequently, we reconstructed data on historical cropland acreage by retrospectively extending the area assuming that the recent national survey and historically documented cropland changes are reliable. Our results revealed that most of the other studies have systematically underestimated the amount of cropland area by about 3–13 Mha. More importantly, HYDE and FAO data not only underestimated the cropland coverage, they also distorted the cropland changes. For example, the maximum cropland coverage was underestimated by 40 %–50 % in two of the historically cultivated plains in HYDE (i.e., the Sichuan Plain and the Northeast China Plain) (Figs. 4, S4). This is consistent with the results reported in our previous study, which found that HYDE underestimated cropland density in the intensively cultivated area of the US (Yu and Lu, 2018).
Using intensive comparisons of the distribution pattern and change trends with HYDE and FAO data, we are more confident in the reliability of our reconstructed maps because (1) the datasets used in cropland reconstruction are more reliable; and (2) the cropland distribution is more consistent with the results reported in other studies conducted in China. As previously mentioned, the HYDE maps are impacted by the distorted signals from the FAO data, whereas our maps were reconstructed from corrected tabular data. Our cropland maps also intensively assimilated the signals from satellite images. For example, the GFSAD30m product that we used is a high-resolution gridded map derived from Landsat images with assistance from over 100 000 reference data samples and other auxiliary data sources (Xiong et al., 2017; Zhong et al., 2017). Moreover, our cropland distribution is more consistent with the findings in previous studies (Li et al., 2010, 2016), which reported that HYDE underestimated the cropland area in Northeast China in the 20th century (Li et al., 2010) and most of the central and northern regions of China in 2000 (Li et al., 2010). Thus, we conclude that our reconstructed maps are more reliable than the HYDE maps in depicting cropland distribution, whereas the HYDE maps greatly underestimate the crop density in high-cropland-coverage regions (Fig. S4). As revealed in our previous study, HYDE allocated cropland to each grid cell according to the weighed maps generated from information from both social and natural indicators, such as urbanization level, population, soil suitability, climate, and topography (Klein Goldewijk et al., 2017; Yu and Lu, 2018). Therefore, HYDE maps can be used as agricultural potential and crop suitability maps, especially in the early period when satellite images were not available (Yu and Lu, 2018). Nevertheless, it should be noted that the underestimated cropland coverage and the biased change trends in HYDE require caution when used in biogeochemical simulations. In comparison, our model assimilates potential cropland distribution signals from different datasets which reduces the possibility of allocating cropland to low/no cultivation grids. Note that the reconstructed cropland maps might inherit uncertainties from the datasets used, as our model relies heavily on the availability and accuracy of these datasets. For example, the plant functional type classification system adopted in the MODIS product defines cropland with at least 60 % of the area be cultivated. By using the abovementioned product, our model may introduce uncertainty in allocating croplands in the low-cultivation areas if a finer-resolution product is not available for the period.
Overall, our study produced spatially explicit time-series cropland percentage maps that are consistent with officially released data while assimilating spatial pattern and trend information from various satellite products. Through intensive comparisons, we are confident that our data provide relatively long-term (1900–2016), moderate-resolution (5 km×5 km), and reliable (national/provincial acreages and interannual variations) sources of cropland maps.
5.2 Cropland abandonment and expansion
In this study, we simply analyzed changes in the cropland coverage for sets of decades beginning with 1900 using the first and last cropland maps of each period (Fig. 4). Both the HYDE dataset and our dataset revealed that cropland expansion was the dominant trend of land conversion for the period from 1900 to 1990, while cropland abandonment nationwide was significant for the last period from 1990 to 2016. The conspicuous cropland loss during this period was also reported in previous studies, which had been related to climate changes and socioeconomic factors (Lai et al., 2016; Liu et al., 2005; Ning et al., 2018). Consistent with the findings reported by Liu et al. (2014) and Lai et al. (2016), we also found that the cropland area decreased in the southern region of China but increased in the northern region for the last period from 1990 to 2016. However, our cropland shrinkage (−9.91 Mha) from 1990 to 2010 is different from the minor cropland increase (1.48–1.82 Mha) from the late 1980s to 2010 reported in Liu et al. (2014) and Lai et al. (2016). This may be attributed to the different cropland classification systems adopted in the two datasets. Our data only included traditional croplands, such as lands cultivated and temporally fallowed. In comparison, the data in Liu et al. (2014) and Lai et al. (2016) referred to arable land, which includes traditional cropland as well as tideland and gardens for agricultural production (e.g., fruits, vegetables, mulberries). Thus, the two studies combined suggest a decrease in traditional major crops (e.g., grains) and increases in other types of agricultural crops during the period. This is consistent with the findings of Liu et al. (2018) that documented significant reductions in grain crops based on data collected from 2341 counties in China. Surprisingly, the number of counties in which fruits, vegetables, and edible oil crops were cultivated increased from <1 % in 1990 to ∼5 % in 2010 (Liu et al., 2018). This change is understandable, as rapid economic development drove demand for more diversified agricultural products.
To further examine cropland expansion and abandonment during the entire period from 1900 to 2016, cropland conversions were identified using two approaches specific for each of the two cropland datasets. For our reconstructed cropland, the expansion occurred in the grid cells that were converted from non-cropland in 1900 to cropland in 2016, whereas abandonments are seen in the grid cells that were historically cultivated but were converted to non-cropland in 2016. The abandonment and expansion grid cells were aggregated from 100 m Boolean-type data to 5 km percentage maps. In comparison, as cropland areas were described as a coverage fraction in the HYDE dataset, cropland conversions were directly extracted by comparing the difference between the maximum coverage and the coverage in 2016 (abandonment), and the difference between 1900 and 2016 (expansion). In total, we found that the abandoned and expanded cropland areas were 43.12 and 74.37 Mha in China from 1900 to 2016, respectively; in the HYDE dataset, it was 18.4 and 40.7 Mha, respectively, for the same time period. In general, HYDE underestimated cropland abandonment and expansion by over 11 and 33 Mha, respectively.
Both datasets showed that abandoned croplands were centered in the northern region of China, although the magnitude differed by location (Fig. 5b, f). The largest discrepancy is the most intensive cropland abandonment derived from the two datasets. The high cropland abandonment found from the HYDE dataset was concentrated in the northwestern (Shaanxi Province), central (Henan Province), and northeastern (Jilin Province) regions of China, which were not detected in our maps (Fig. 5b, f). In comparison, the high cropland abandonment found from our maps in the southwestern and northern regions of China was missing in the HYDE dataset. The difference may be related to the approach used. The cropland abandonment year indicates the most recent year that the conversion occurred from our reconstructed maps, whereas the HYDE abandonment year represents the date that the cropland coverage began to decrease.
From the implementation of the Grain for Green Project in 1999, a total of 26.62 Mha of cropland was converted back to woodland by 2016; 86 % of this conversion occurred in the 1990s and the 2000s (National Forestry and Grassland Administration of China, NFGAC, 2018). This is also visible from the rapid cropland decline in our reconstructed time-series data (Fig. 2) and is consistent with the large-scale cropland abandonment after 1990 (Fig. 4). Ning et al. (2018) reported that ∼2.04 Mha of cropland was converted to other types of land use, and ∼1.55 Mha of other land was converted to cropland, resulting in a net loss of 0.49 Mha (0.36 %) of cropland area from 2010 to 2015. This is similar to our study's finding: based on statistics from NLRB, we found that the conversions between cropland and non-cropland were 1.85 and 1.58 Mha, respectively, leading to a net loss of 0.27 Mha (0.2 %) during the period.
Cropland expansion timing and magnitude significantly differed between the two datasets used (Fig. 5c, g). Our dataset revealed a more evident cropland expansion in the southern and central regions of China. Moreover, the timing of the cropland expansion pattern is vastly different: our map showed a much earlier cropland reclamation over the entire study area, except for the northwestern and the central northeastern regions of China. This great discrepancy can be primarily attributed to the methods that were implemented. Our 5 km expansion percentage map was resampled using a grid-by-grid comparison of the 100 m Boolean-type data. For HYDE, it is impossible to directly time the expansion from the 5 arcmin (∼8 km) cropland percentage map. Alternatively, in this study, the occurrence of the largest cropland expansion was used to represent the rough date of expansion in HYDE. Thus, the dominant HYDE-based cropland expansion that was detected occurred in the 1970–1990 period, which is consistent with the abrupt change in the increase in the amount of cropland (Fig. 2), but is a misleading signal, as we explained. Instead, the expansion-year map produced from our data indicates the latest year of conversion from non-cropland to cropland, which primarily occurred before 1970 (Fig. 5c). Our data showed that the most significant cropland expansion since 1990 was found in the northwestern region of China (i.e., Xinjiang Province), which is the reclaimed cropland in the dry region assisted by the development of oasis agriculture (Han, 2009; Ning et al., 2018). Despite the noticeable cropland abandonment in the northwestern region (Fig. 5a), a more intensive reclamation resulted in a substantial net increase of cropland in that area. It is important to note that the other hot spot of recent cropland expansion is located in the Northeast China Plain, which is also documented in other studies (Xia et al., 2016; Zhang et al., 2018). The intensive cropland reclamation might have triggered a significant amount of carbon emissions, as the region is well known for its high carbon storage; our updated cropland maps are expected to be helpful for such an assessment.
Specifically, we found that the cropland abandonment and expansion in the mid-eastern region of Inner Mongolia are consistent with the results reported in Dong et al. (2011). The region experienced rapid land cover conversions due to conflicts between the increasing demand for food and the pressure for environmental protection. Although a net area of 1.2 Mha of cropland was reclaimed in the region from 1990 to 2005, the land conversions shifted from being expansion-dominated to being abandonment-dominated after 2000 (Dong et al., 2011). This might be attributed to the implementation of the Grain for Green policy. Accordingly, our abandonment and expansion maps showed that new cultivations occurred in the region in the 1990s. Thus, government policy incentives, improvements in farming techniques, and increases in the population are the three major drivers of recent cropland expansion in China. For example, the Chinese government sponsored the improvement of irrigation projects and agricultural mechanization, resulting in subsequent agricultural development in the provinces in central China since the 2000s, which can be seen in the maps reconstructed in this study (Fig. 5c).
Although a large degree of uncertainty remains in HYDE land use maps, they have been widely used by the global change modeling community (e.g., Van Oost et al., 2007; Tian et al., 2013; Wang et al., 2020). However, the HYDE cropland maps might cause significant bias if they are used in regional and local biogeochemical simulations. Based on the HYDE maps, Wang et al. (2020) and Zhang et al. (2020) estimated N2O emissions globally and in China's croplands from 1961 and 1949, respectively. However, we expected that the N2O emission results might have been biased, as fertilizer was applied in a smaller cropland area (e.g., 103.99 Mha in HYDE vs. 132.29 Mha in our data during the 1960–1980 period). Moreover, although the underestimation of cropland was only 10 % during the recent period from 1990 to 2016 (126.34 Mha in HYDE vs. 138.94 Mha in our data), the use of nitrogen as a fertilizer has increased more than threefold during this period (Gu et al., 2017). Thus, the nutrient cycles and water pollution levels need to be reassessed using updated cropland maps. Hence, the improved cropland maps we reconstructed in this study are expected to help reduce the bias and obtain more accurate biogeochemical simulations.
The supplement related to this article is available online at: https://doi.org/10.5194/essd-13-3203-2021-supplement.
ZY designed the work. XJ and XY provided cropland maps in 1887, 1933, 1952, and 1985 for reconstruction of the dataset. ZY, XJ, XY, and LM reviewed and edited the text. ZY prepared the manuscript and wrote the final paper with contributions from all coauthors.
The authors declare that they have no conflict of interest.
Publisher's note: Copernicus Publications remains neutral with regard to jurisdictional claims in published maps and institutional affiliations.
We greatly acknowledge data entry assistance from Yanli Dong and Jing Guo. The CNLUCC dataset is provided by the Data Center for Resources and Environmental Sciences, Chinese Academy of Sciences (RESDC; http://www/resdc.cn, last access: 11 November 2020).
This research has been supported by the National Natural Science Foundation of China (grant no. 32001166), the Jiangsu Key Laboratory of Agricultural Meteorology Foundation (grant no. JKLAM2004), and the Nanjing University of Information Science and Technology (grant no. 2019r059).
This paper was edited by David Carlson and reviewed by Xin Deng and three anonymous referees.
Barney, G. O.: The Global 2000 Report to the President. Entering the twenty first century: a report (Vol. 1), Seven Locks Press, Arlington, 1981.
Bartholomé, E. and Belward, A. S.: GLC2000: A new approach to global land cover mapping from earth observation data, Int. J. Remote Sens., 26, 1959–1977, https://doi.org/10.1080/01431160412331291297, 2005.
Bi, Y. and Zheng, Z.: The actual changes of cultivated area since the founding of new china, Resour. Sci., 22, 8–12, 2000 (in Chinese).
Carlson, K. M., Gerber, J. S., Mueller, N. D., Herrero, M., MacDonald, G. K., Brauman, K. A., Havlik, P., O'Connell, C. S., Johnson, J. A., Saatchi, S., and West, P. C.: Greenhouse gas emissions intensity of global croplands, Nat. Clim. Chang., 7, 63–68, https://doi.org/10.1038/nclimate3158, 2017.
Castellano, M. J., Archontoulis, S. V., Helmers, M. J., Poffenbarger, H. J., and Six, J.: Sustainable intensification of agricultural drainage, Nat. Sustain., 2, 914–921, https://doi.org/10.1038/s41893-019-0393-0, 2019.
Chen, J., Chen, J., and Liao, A.: Remote sensing mapping of global land cover, Science Press, Beijing, 2016 (in Chinese).
Dong, J., Liu, J., Yan, H., Tao, F., and Kuang, W.: Spatio-temporal pattern and rationality of land reclamation and cropland abandonment in Mid-eastern Inner Mongolia of China in 1990–2005, Environ. Monit. Assess., 179, 137–153, https://doi.org/10.1007/s10661-010-1724-9, 2011.
FAO: FAOSTAT database collections, Food Agric. Organ., United Nations. available at: http://faostat.fao.org (last access: 1 December 2020), 2018.
FAO and ITPS: Status of the World's Soil Resources (SWSR), Status World's Soil Resour., FAO and ITPS, Rome, 2015.
Feng, Z., Liu, B., and Yang, Y.: A Study of the Changing Trend of Chinese Cultivated Land Amount and Data Reconstructing: 1949–2003, J. Nat. Resour., 1, 35–43, 2005 (in Chinese).
Foley, J. A., DeFries, R., Asner, G. P., Barford, C., Bonan, G., Carpenter, S. R., Chapin, F. S., Coe, M. T., Daily, G. C., Gibbs, H. K., Helkowski, J. H., Holloway, T., Howard, E. A., Kucharik, C. J., Monfreda, C., Patz, J. A., Prentice, I. C., Ramankutty, N., and Snyder, P. K.: Global consequences of land use, Science, 309, 570–574, https://doi.org/10.1126/science.1111772, 2005.
Gong, P., Wang, J., Yu, L., Zhao, Y., Zhao, Y., Liang, L., Niu, Z., Huang, X., Fu, H., Liu, S., Li, C., Li, X., Fu, W., Liu, C., Xu, Y., Wang, X., Cheng, Q., Hu, L., Yao, W., Zhang, H., Zhu, P., Zhao, Z., Zhang, H., Zheng, Y., Ji, L., Zhang, Y., Chen, H., Yan, A., Guo, J., Yu, L., Wang, L., Liu, X., Shi, T., Zhu, M., Chen, Y., Yang, G., Tang, P., Xu, B., Giri, C., Clinton, N., Zhu, Z., Chen, J., and Chen, J.: Finer resolution observation and monitoring of global land cover: First mapping results with Landsat TM and ETM+ data, Int. J. Remote Sens., 34, 2607–2654, https://doi.org/10.1080/01431161.2012.748992, 2013.
Gong, P., Liu, H., Zhang, M., Li, C., Wang, J., Huang, H., Clinton, N., Ji, L., Li, W., Bai, Y., Chen, B., Xu, B., Zhu, Z., Yuan, C., Ping Suen, H., Guo, J., Xu, N., Li, W., Zhao, Y., Yang, J., Yu, C., Wang, X., Fu, H., Yu, L., Dronova, I., Hui, F., Cheng, X., Shi, X., Xiao, F., Liu, Q., and Song, L.: Stable classification with limited sample: transferring a 30-m resolution sample set collected in 2015 to mapping 10-m resolution global land cover in 2017, Sci. Bull., 64, 370–373, https://doi.org/10.1016/j.scib.2019.03.002, 2019.
Gu, B., Ju, X., Chang, S. X., Ge, Y., and Chang, J.: Nitrogen use efficiencies in Chinese agricultural systems and implications for food security and environmental protection, Reg. Environ. Chang., 17, 1217–1227, https://doi.org/10.1007/s10113-016-1101-5, 2017.
Han, C.: The oasis evolution under human activities of arid Xinjiang in China, in: Second International Conference on Earth Observation for Global Changes, 9 October 2009, Chengdu, China, 7471, 74710P, 2009.
Hansen, M. C., Sohlberg, R., Defries, R. S., and Townshend, J. R. G.: Global land cover classification at 1 km spatial resolution using a classification tree approach, Int. J. Remote Sens., 21, 1331–1364, https://doi.org/10.1080/014311600210209, 2000.
Hou, X.: Vegetation atlas of China, Chinese Academy of Science, the Editorial Board of Vegetation Map of China, Sci. Press, Beijing, 113–124, 2001.
Jun, C., Ban, Y., and Li, S.: Open access to Earth land-cover map, Nature, 514, 434, https://doi.org/10.1038/514434c, 2014.
Keesstra, S. D., Bouma, J., Wallinga, J., Tittonell, P., Smith, P., Cerdà, A., Montanarella, L., Quinton, J. N., Pachepsky, Y., van der Putten, W. H., Bardgett, R. D., Moolenaar, S., Mol, G., Jansen, B., and Fresco, L. O.: The significance of soils and soil science towards realization of the United Nations Sustainable Development Goals, SOIL, 2, 111–128, https://doi.org/10.5194/soil-2-111-2016, 2016.
Klein Goldewijk, K., Beusen, A., Doelman, J., and Stehfest, E.: Anthropogenic land use estimates for the Holocene – HYDE 3.2, Earth Syst. Sci. Data, 9, 927–953, https://doi.org/10.5194/essd-9-927-2017, 2017.
Kueppers, L. M., Snyder, M. A., and Sloan, L. C.: Irrigation cooling effect: Regional climate forcing by land-use change, Geophys. Res. Lett., 34, https://doi.org/10.1029/2006GL028679, 2007.
Lai, L., Huang, X., Yang, H., Chuai, X., Zhang, M., Zhong, T., Chen, Z., Chen, Y., Wang, X., and Thompson, J. R.: Carbon emissions from land-use change and management in China between 1990 and 2010, Sci. Adv., 2, e1601063, https://doi.org/10.1126/sciadv.1601063, 2016.
Li, B. B., Fang, X. Q., Ye, Y., and Zhang, X. Z.: Accuracy assessment of global historical cropland datasets based on regional reconstructed historical data-A case study in Northeast China, Sci. China Earth Sci., 53, 1689–1699, https://doi.org/10.1007/s11430-010-4053-5, 2010.
Li, C., Gong, P., Wang, J., Zhu, Z., Biging, G. S., Yuan, C., Hu, T., Zhang, H., Wang, Q., Li, X., Liu, X., Xu, Y., Guo, J., Liu, C., Hackman, K. O., Zhang, M., Cheng, Y., Yu, L., Yang, J., Huang, H., and Clinton, N.: The first all-season sample set for mapping global land cover with Landsat-8 data, Sci. Bull., 62, 508–515, https://doi.org/10.1016/j.scib.2017.03.011, 2017.
Li, M., He, F., Li, S., and Yang, F.: Reconstruction of the cropland cover changes in eastern China between the 10th century and 13th century using historical documents, Sci. Rep.-UK, 8, 13552, https://doi.org/10.1038/s41598-018-31807-6, 2018.
Li, S., Zhang, Y., and He, F.: Reconstruction of cropland distribution in Qinghai and Tibet for the past one hundred years and its spatiotemporal changes, Prog. Geogr., 34, 197–206, 2015.
Li, S., He, F., and Zhang, X.: A spatially explicit reconstruction of cropland cover in China from 1661 to 1996, Reg. Environ. Chang., 16, 417–428, https://doi.org/10.1007/s10113-014-0751-4, 2016.
Lin, S., Zheng, J., and He, F.: Gridding cropland data reconstruction over the agricultural region of China in 1820, J. Geogr. Sci., 19, 36–48, https://doi.org/10.1007/s11442-009-0036-x, 2009.
Liu, J., Liu, M., Zhuang, D., Zhang, Z., and Deng, X.: Study on spatial pattern of land-use change in China during 1995–2000, Sci. China Ser. D, 46, 373–384, https://doi.org/10.1360/03yd9033#citeas, 2003.
Liu, J., Zhang, Z., Xu, X., Kuang, W., Zhou, W., Zhang, S., Li, R., Yan, C., Yu, D., Wu, S., and Jiang, N.: Spatial patterns and driving forces of land use change in China during the early 21st century, J. Geogr. Sci., 20, 483–494, https://doi.org/10.1007/s11442-010-0483-4, 2010.
Liu, J., Kuang, W., Zhang, Z., Xu, X., Qin, Y., Ning, J., Zhou, W., Zhang, S., Li, R., Yan, C., Wu, S., Shi, X., Jiang, N., Yu, D., Pan, X., and Chi, W.: Spatiotemporal characteristics, patterns, and causes of land-use changes in China since the late 1980s, J. Geogr. Sci., 24, 195–210, https://doi.org/10.1007/s11442-014-1082-6, 2014.
Liu, J. Y., Deng, X. Z., Liu, M. L., and Zhang, S. W.: Study on the spatial patterns of land-use change and analyses of driving forces in Northeastern China during 1990–2000, Chinese Geogr. Sci., 12, 299–308, https://doi.org/10.1007/s11769-002-0033-9, 2002.
Liu, M. and Tian, H.: China's land cover and land use change from 1700 to 2005: Estimations from high-resolution satellite data and historical archives, Global Biogeochem. Cycles, 24, GB3003, https://doi.org/10.1029/2009GB003687, 2010.
Liu, X., Wang, J., Liu, M., and Meng, B.: Spatial heterogeneity of the driving forces of cropland change in China, Sci. China Ser. D, 48, 2231–2240, https://doi.org/10.1360/04yd0195, 2005.
Liu, Z., Yang, P., Wu, W., and You, L.: Spatiotemporal changes of cropping structure in China during 1980–2011, J. Geogr. Sci., 28, 1659–1671, https://doi.org/10.1007/s11442-018-1535-4, 2018.
Loveland, T. R., Reed, B. C., Ohlen, D. O., Brown, J. F., Zhu, Z., Yang, L., and Merchant, J. W.: Development of a global land cover characteristics database and IGBP DISCover from 1 km AVHRR data, Int. J. Remote Sens., 21, 1303–1330, https://doi.org/10.1080/014311600210191, 2000.
NFGAC: China Forestry Statistical Yearbook 2017, China Forestry Publishing House, Beijing, 2018.
Ning, J., Liu, J., Kuang, W., Xu, X., Zhang, S., Yan, C., Li, R., Wu, S., Hu, Y., Du, G., Chi, W., Pan, T., and Ning, J.: Spatiotemporal patterns and characteristics of land-use change in China during 2010–2015, J. Geogr. Sci., 28, 547–562, https://doi.org/10.1007/s11442-018-1490-0, 2018.
Perkins, D. H.: Agricultural development in China 1368–1968, Routledge, New York, 2017.
Ran, Y.: Land cover products of China, Natl. Tibet. Plateau Data Cent., https://doi.org/10.3972/westdc.007.2013.db, 2013.
Ran, Y., Li, X., and Lu, L.: Evaluation of four remote sensing based land cover products over China, Int. J. Remote Sens., 31, 391–401, 2010.
Sanderman, J., Hengl, T., and Fiske, G. J.: Soil carbon debt of 12,000 years of human land use, P. Natl. Acad. Sci. USA, 114, 9575–9580, https://doi.org/10.1073/pnas.1706103114, 2017.
Tian, H., Chen, G., Lu, C., Xu, X., Ren, W., Banger, K., Zhang, B., Tao, B., Pan, S., Liu, M., and Zhang, C.: Global land-atmosphere exchange of methane and nitrous oxide: magnitude and spatiotemporal patterns, Biogeosciences Discuss., 10, 19811–19865, https://doi.org/10.5194/bgd-10-19811-2013, 2013.
Van Oost, K., Quine, T. A., Govers, G., De Gryze, S., Six, J., Harden, J. W., Ritchie, J. C., McCarty, G. W., Heckrath, G., Kosmas, C., Giraldez, J. V., Marques Da Silva, J. R., and Merckx, R.: The impact of agricultural soil erosion on the global carbon cycle, Science, 318, 626–629, https://doi.org/10.1126/science.1145724, 2007.
Wang, Q., Zhou, F., Shang, Z., Ciais, P., Winiwarter, W., Jackson, R. B., Tubiello, F. N., Janssens-Maenhout, G., Tian, H., Cui, X., Canadell, J. G., Piao, S., and Tao, S.: Data-driven estimates of global nitrous oxide emissions from croplands, Natl. Sci. Rev., 7, 441–452, https://doi.org/10.1093/nsr/nwz087, 2020.
Wei, X., Ye, Y., Zhang, Q., Li, B., and Wei, Z.: Reconstruction of cropland change in North China Plain Area over the past 300 years, Glob. Planet. Change, 176, 60–70, https://doi.org/10.1016/j.gloplacha.2019.01.010, 2019.
World Resource Institute: World Resources 1987, Basic Books, New York, 1987.
Xia, T., Wu, W., Zhou, Q., Verburg, P. H., Yu, Q., Yang, P., and Ye, L.: Model-based analysis of spatio-temporal changes in land use in Northeast China, J. Geogr. Sci., 26, 171–187, https://doi.org/10.1007/s11442-016-1261-8, 2016.
Xiong, J., Thenkabail, P. S., Tilton, J. C., Gumma, M. K., Teluguntla, P., Oliphant, A., Congalton, R. G., Yadav, K., and Gorelick, N.: Nominal 30-m cropland extent map of continental Africa by integrating pixel-based and object-based algorithms using Sentinel-2 and Landsat-8 data on google earth engine, Remote Sens., 9, 1065, https://doi.org/10.3390/rs9101065, 2017.
Yang, X., Guo, B., Jin, X., Long, Y., and Zhou, Y.: Reconstructing spatial distribution of historical cropland in China's traditional cultivated region: Methods and case study, Chinese Geogr. Sci., 25, 629–643, https://doi.org/10.1007/s11769-015-0753-2, 2015a.
Yang, X., Jin, X., Guo, B., Long, Y., and Zhou, Y.: Research on reconstructing spatial distribution of historical cropland over 300 years in traditional cultivated regions of China, Glob. Planet. Change, 128, 90–102, https://doi.org/10.1016/j.gloplacha.2015.02.007, 2015b.
Yang, X., Jin, X., Du, X., Xiang, X., Han, J., Shan, W., Fan, Y., and Zhou, Y.: Multi-agent model-based historical cropland spatial pattern reconstruction for 1661–1952, Shandong Province, China, Glob. Planet. Change, 143, 175–188, https://doi.org/10.1016/j.gloplacha.2016.06.010, 2016.
Yu, Z. and Lu, C.: Historical cropland expansion and abandonment in the continental U.S. during 1850 to 2016, Glob. Ecol. Biogeogr., 27, 322–333, https://doi.org/10.1111/geb.12697, 2018.
Yu, Z., Jin, X., Miao, L., and Yang, X.: Cropland coverage in China from 1900 to 2016 [data set], Figshare, https://doi.org/10.6084/m9.figshare.13356680, 2020.
Zhang, J., Tian, H., Shi, H., Zhang, J., Wang, X., Pan, S., and Yang, J.: Increased greenhouse gas emissions intensity of major croplands in China: Implications for food security and climate change mitigation, Glob. Chang. Biol., 26, 6116–6133, https://doi.org/10.1111/gcb.15290, 2020.
Zhang, L., Wang, C., Li, X., Zhang, H., Li, W., and Jiang, L.: Impacts of agricultural expansion (1910s–2010s) on the water cycle in the Songneng Plain, Northeast China, Remote Sens., 10, 1108, https://doi.org/10.3390/rs10071108, 2018.
Zheng, Z.: China's Cropland and it's contribution to economics development, Territ. Nat. Resour. Study, 1, 1–7, 1991 (in Chinese).
Zhong, Y., Giri, C., Thenkabail, P. S., Teluguntla, P., Congalton, G. R., Yadav, K., Oliphant, J. A., Xiong, J., Poehnelt, J., and Smith, C.: NASA Making Earth System Data Records for Use in Research Environments (MEaSUREs) Global Food Security-support Analysis Data (GFSAD) Cropland Extent 2015 South America 30 m V001 [data set], NASA EOSDIS L. Process. DAAC, https://doi.org/10.5067/MEaSUREs/GFSAD/GFSAD30SACE.001, 2017.
Zumkehr, A. and Campbell, J. E.: Historical U.S. cropland areas and the potential for bioenergy production on abandoned croplands, Environ. Sci. Technol., 47, 3840–3847, https://doi.org/10.1021/es3033132, 2013.