the Creative Commons Attribution 4.0 License.
the Creative Commons Attribution 4.0 License.
 | 02 Jul 2021
UAV-based very high resolution point cloud, digital surface model and orthomosaic of the Chã das Caldeiras lava fields (Fogo, Cabo Verde)
Pedro Pina
Ricardo Ramalho
Rui Fernandes
Fogo in the Cabo Verde archipelago off western Africa is one of the most prominent and active ocean island volcanoes on Earth, posing an important hazard both to local populations and at a regional level. The last eruption took place between 23 November 2014 and 8 February 2015 in the Chã das Caldeiras area at an elevation close to 1800 The eruptive episode gave origin to extensive lava flows that almost fully destroyed the settlements of Bangaeira, Portela and Ilhéu de Losna. During December 2016 a survey of the Chã das Caldeiras area was conducted using a fixed-wing unmanned aerial vehicle (UAV) and real-time kinematic (RTK) global navigation satellite system (GNSS), with the objective of improving the terrain models and visible imagery derived from satellite platforms, from metric to decimetric resolution and accuracy. The main result is a very high resolution and quality 3D point cloud with a root mean square error of 0.08 m in X, 0.11 m in Y and 0.12 m in Z, which fully covers the most recent lava flows. The survey comprises an area of 23.9 km2 and used 2909 calibrated images with an average ground sampling distance of 7.2 cm. The dense point cloud, digital surface models and orthomosaics with 25 and 10 cm resolutions, a 50 cm spaced elevation contour shapefile, and a 3D texture mesh, as well as the full aerial survey dataset are provided. The delineation of the 2014/15 lava flows covers an area of 4.53 km2, which is smaller but more accurate than the previous estimates from 4.8 to 4.97 km2. The difference in the calculated area, when compared to previously reported values, is due to a more detailed mapping of the flow geometry and to the exclusion of the areas corresponding to kīpukas (outcrops surrounded by lava flows). Our study provides a very high resolution dataset of the areas affected by Fogo's latest eruption and is a case study supporting the advantageous use of UAV aerial photography surveys in disaster-prone areas. This dataset provides accurate baseline data for future eruptions, allowing for different applications in Earth system sciences, such as hydrology, ecology and spatial modelling, as well as to planning. The dataset is available for download at https://doi.org/10.5281/zenodo.4718520 (Vieira et al., 2021).
- Article
(34184 KB) - Full-text XML
- BibTeX
- EndNote


Detailed knowledge of volcanic eruptions and their products, evolution and impacts is of paramount importance for hazard assessment and for advancing our capability to forecast the likely behaviour of future eruptions. Volcanic eruptions may result in considerable loss of life and lasting damage to infrastructures, particularly on small developing island states like Cabo Verde, where they are likely to have disproportionate impacts, on account of the more limited resources and geographical isolation (Komorowski et al., 2016). A study commissioned by the United Nations Development Programme in Cabo Verde stresses that an improvement in the assessment of hazards on the island of Fogo can only be achieved from a detailed analysis and the modelling of the lava flows (Fonseca et al., 2014). Accordingly, realistic volcanic hazard assessments in such areas greatly benefit from very high resolution datasets from which detailed volcanological, geophysical and environmental parameters can be inferred. In particular, very high resolution digital terrain datasets of recently erupted lava fields may also be used to plan mitigation and reconstruction strategies. They also allow for very high resolution mapping of small-scale features, such as pressure ridges, fractures, lava types and kīpukas (i.e. small “islands” – interior elevations surrounded by lava) that contribute to process studies and to a better understanding of the eruption and post-eruption landscape dynamics. The usefulness of such datasets is greatly enhanced when these are freely available to governmental agencies, decision-making bodies and the scientific community alike.
Digital elevation models (DEMs) and the dissemination of geographical information systems have changed the way the terrain is characterized, analysed, monitored and modelled, especially since the 1990s. DEMs have been produced from dense collections of topographic points, manned aircraft photogrammetry, digitizing of topographic maps (Stevens et al., 1999), satellite remote sensing (Baldi et al., 2002; Kerle, 2002; Diefenbach et al., 2013), light detection and ranging (lidar; Mouginis-Mark and Garbeil, 2005; Mazzarini et al., 2007; Favalli et al., 2009; Fornaciai et al., 2010), and radar interferometry (InSAR; Rowland et al., 1999; Poland, 2014). The technological developments and decreasing cost of unmanned aerial vehicles (UAV), accompanied by the development of advanced photogrammetry algorithms involving image matching and structure from motion (SfM) and computing power, originated a significant methodological leap that greatly affected practices in Earth surface sciences (James et al., 2019). The recent development of real-time kinematic (RTK) global navigation satellite system (GNSS) UAVs results in even faster in situ workflows and in the production of highly accurate models. As a result, very accurate and high quality DEMs and orthomosaics have become increasingly used in the Earth sciences, allowing for centimetric to decimetric resolutions even over large areas (Favalli et al., 2018).
Several recent reviews have been produced showing the applicability of UAV-based topographical surveys in volcanological research. Dering et al. (2019) present a review on UAV-based photogrammetry for mapping dikes in very high resolution, emphasizing best practices. A recent summary about the use of small UAVs for collecting immediate and real-time aerial data in volcanic environments during and after an eruption is provided by Jordan (2019), highlighting the UAVs' advantages for mapping, sample collection, thermal imaging, magnetic surveys and slope stability studies and as platforms for carrying outgassing measurement sensors. James et al. (2020) present a complete review of applications of UAV to volcanology.
Unfortunately, despite the increasing use of UAV-based surveys, most of them remain inaccessible and lacking in their potential for reuse and for wider applications. Hence, making high-quality datasets available in open-access format is essential. In line with this and with the needs indicated above, in the remit of the project FIRE (Fogo Island volcano: multidisciplinary Research on 2014/15 Eruption), an extensive aerial photography survey using a survey-grade unmanned aerial vehicle was conducted in the Chã das Caldeiras area on the island of Fogo (Cabo Verde) in December 2016. The main objectives were generating a very high resolution (< 50 cm) digital surface model (DSM) and orthomosaic of the lava field to be used as baseline data for assessment of the eruption impacts, support to geological mapping and studies of the lava flow field, as well as for modelling lava flow dynamics. The data presented here are the result of that campaign and comprise the most detailed and updated terrain survey of the area. The survey comprises very high resolution DSMs and digital orthomosaics (10 and 25 cm), accompanied by the dense point cloud and the 2014/15 lava flow delineation, as well as by the full survey dataset.
The island of Fogo is 1 of 10 islands of Cabo Verde, an archipelago located off the west African coast, about 600 km from Senegal (Fig. 1). Fogo is one of the most prominent and active ocean island volcanoes on Earth, posing an important hazard to local populations and at a regional level (Day et al., 1999; Heleno da Silva et al., 1999; Ramalho et al., 2015; Eisele et al., 2015; Jenkins et al., 2017). Crucially, Fogo is the site of recurring volcanic activity, with a record of at least 27 historical eruptions since the island was discovered in the mid-fifteenth century, yielding a mean recurrence interval between eruptions of about 20 years, with individual intervals ranging from 1 to 94 years (Ribeiro, 1954; Torres et al., 1998; Day et al., 1999; Mata et al., 2017). The latest events occurred in 1995 and in 2014/15, both extruding extensive lava fields at the Chã das Caldeiras, a summit depression lying at approximately 1800 m in altitude (Fig. 1). The settlements of Bangaeira, Portela and Ilhéu de Losna located in Chã das Caldeiras were almost fully destroyed in the 2014/15 eruption. Fortunately, there were no casualties.
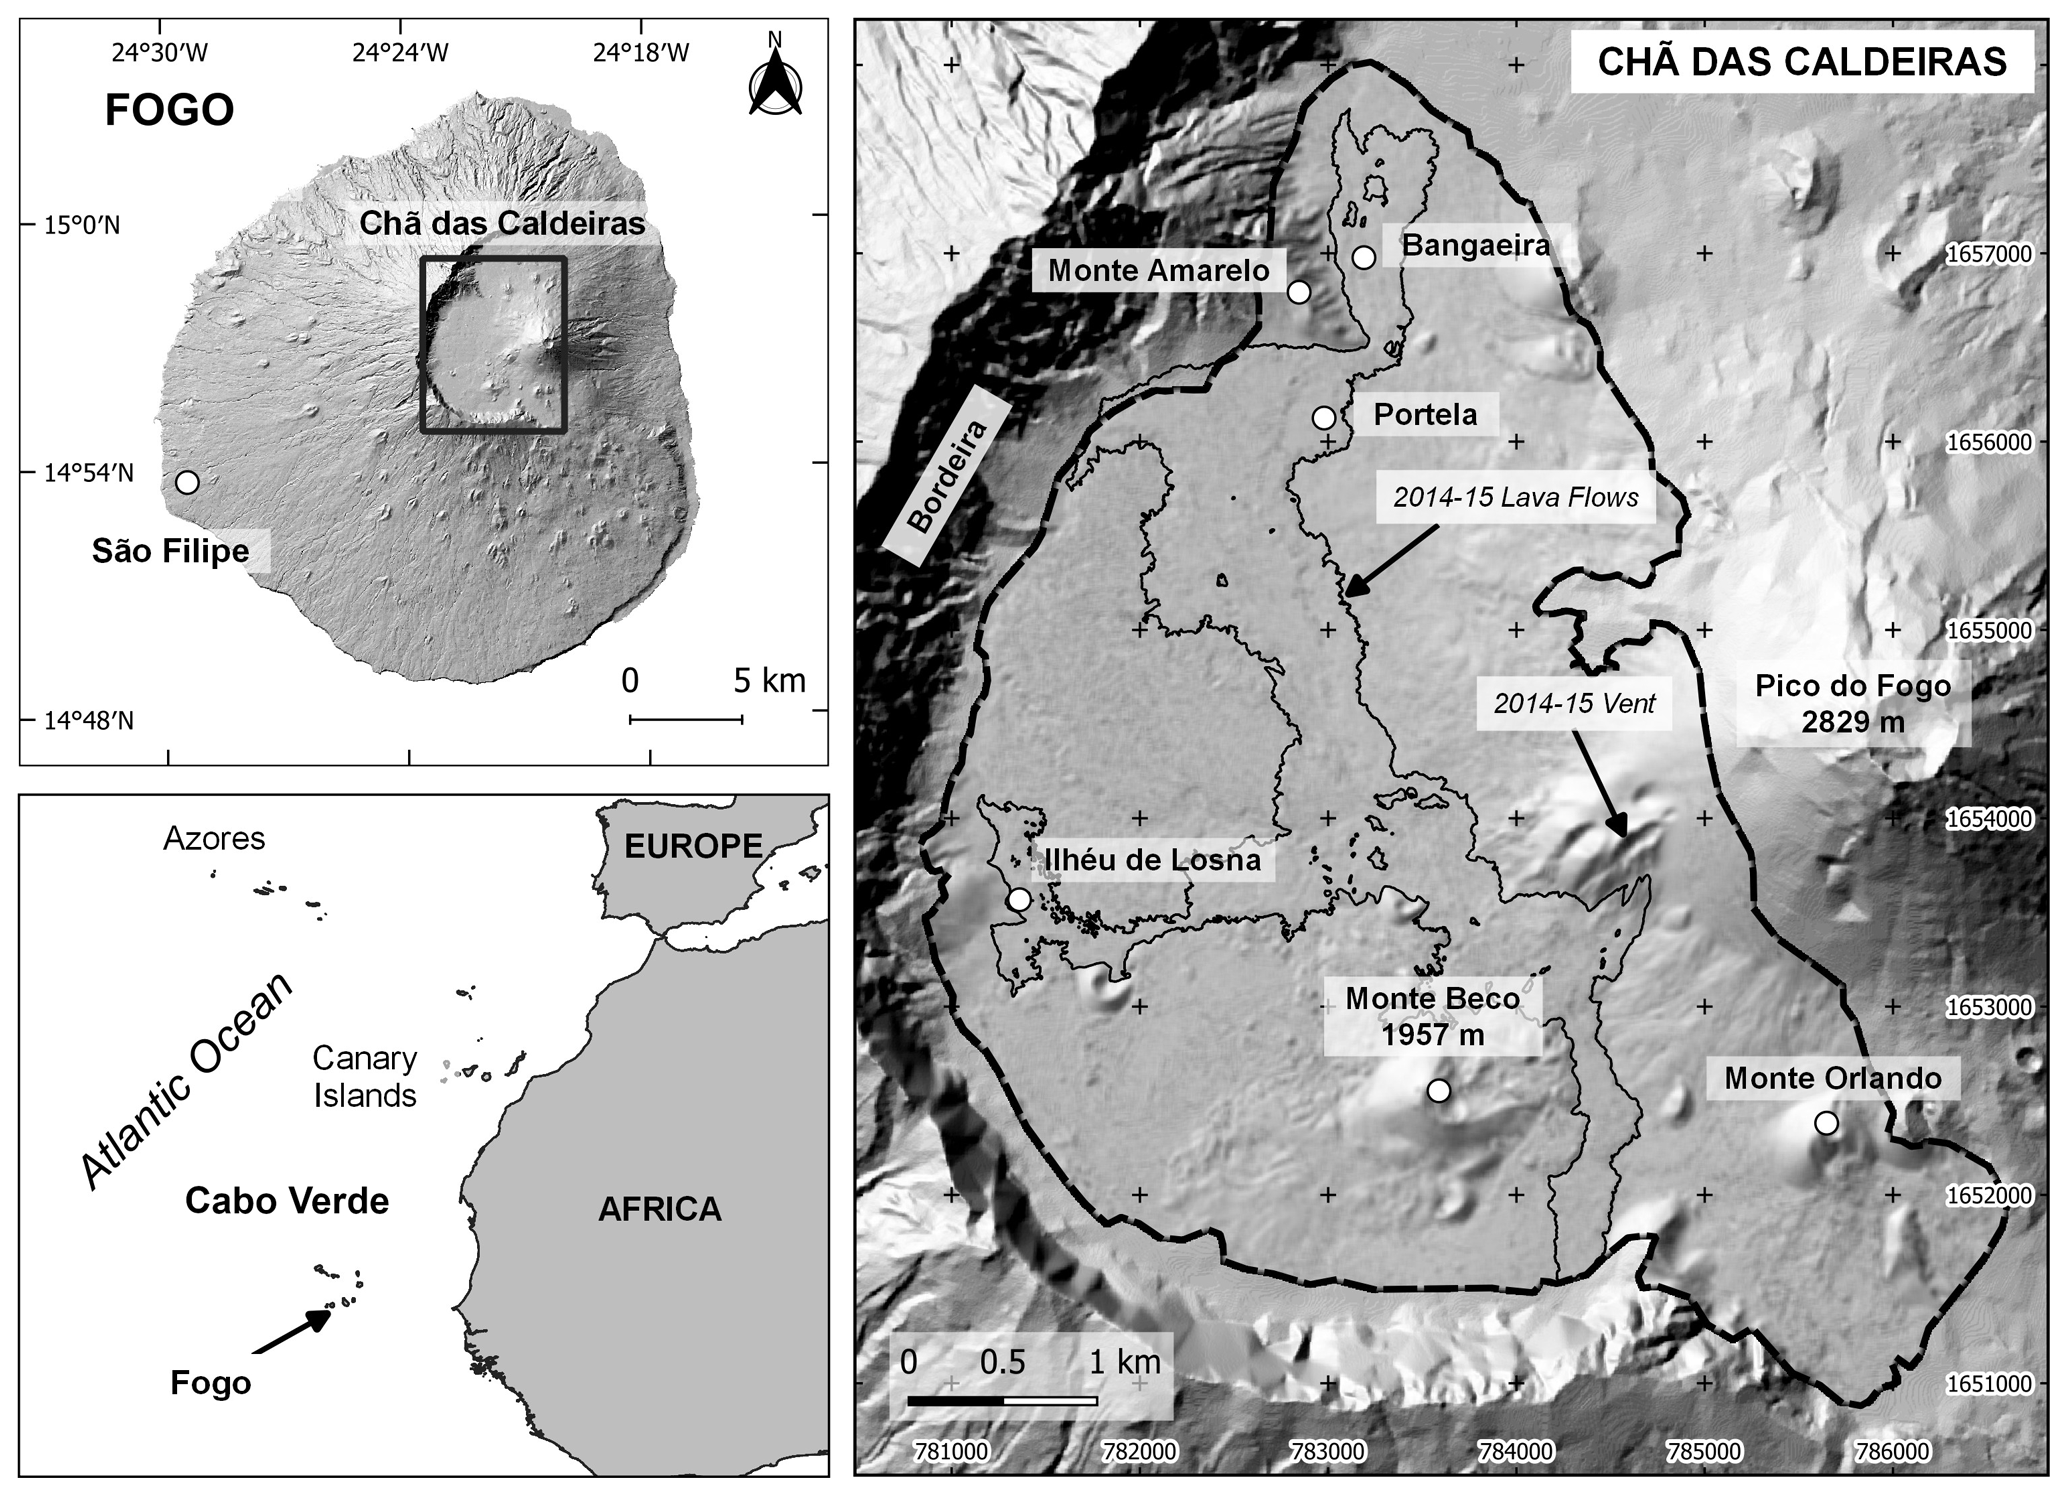
Figure 1Location of the Chã das Caldeiras and of the surveyed area (dashed line) on Fogo (Cabo Verde). The 2014/15 lava flows are limited by a thin black line. Shaded relief derived from the DEMFI (2010) 5 m DEM.
Cabo Verde islands are regarded as the type example of a volcanic archipelago formed in a stationary plate environment relative to its hotspot, which probably explains the arcuate distribution of its islands (Fig. 1; Burke and Wilson 1972; Lodge and Helffrich, 2006; Ramalho et al., 2010a, b, c; Ramalho, 2011). In more detail, this arcuate geometry is defined by two island chains: a “northern” one, from São Nicolau to Santo Antão, and a “eastern-to-southern” one, from Sal to Brava. There is no evident hotspot track, but there is a morphological suggestion of an age progression in the eastern-to-southern chain, from east (oldest islands) to west (youngest islands) (see Ramalho, 2011). Fogo is located close to the southern terminus of this latter chain and is the only island in the archipelago with historical (i.e. last 500 years) eruptions (Bebiano, 1932; Ribeiro, 1954; Machado, 1965; Day et al., 1999; Faria and Fonseca, 2014).
Fogo is a large ocean island volcano showing a conical shape with a diameter of about 30 (at sea level) and rising to an elevation of 2829 m, approximately 7 km above the surrounding seafloor. Structurally, the island is a compound volcano, featuring a “Somma–Vesuvius” association, with a younger stratovolcano – Pico do Fogo – rising from the central depression – Chã das Caldeiras – of an older collapsed volcano, sometimes referred to as Monte Amarelo (Ribeiro, 1954; Day et al., 1999). This depression is open to the east, being bounded on the remaining three sides by a horseshoe-shaped steep rock wall, over 1000 m high, called Bordeira (Fig. 1). This morphology is interpreted either as a gravitational-collapse headwall (Day et al., 1999; Paris et al., 2011) or as volcanic caldera walls, whose eastern portion later experienced a gravitational flank failure (Torres et al., 1998; Brum da Silveira et al., 1997a, b; Madeira et al., 2008). Notwithstanding the different interpretations, it is clear that the opening to the east resulted from a massive flank failure (Le Bas et al., 2007; Masson et al., 2008; Barrett et al., 2019b). Moreover, field evidence attesting to the impact of a megatsunami triggered by Fogo's flank failure has been documented in the neighbouring islands of Santiago (Paris et al., 2011, 2018; Ramalho et al., 2015) and Maio (Madeira et al., 2020), confirming the catastrophic nature of the collapse and suggesting a 65–84 kyr age for this event.
Pico do Fogo, currently the highest point in the island, is a large and roughly symmetrical strato-cone that grew on top of the collapse scar, partially infilling this feature (Ribeiro, 1954; Torres et al., 1998; Brum da Silveira et al., 1997a, b; Day et al., 1999). Historical records suggest that all historic eruptions were extruded from adventitious vents located at the base and lower flanks of Pico do Fogo, or at Chã das Caldeiras and the eastern flank of the island, in the periphery of this strato-cone (Ribeiro, 1954; Torres et al., 1998; Brum da Silveira et al., 1997a, b). This is the case of the 1951, 1995 and 2014/15 eruptions, which had vents located in the northwestern, southwestern and southern flanks of Pico do Fogo, close to its base at Chã das Caldeiras.
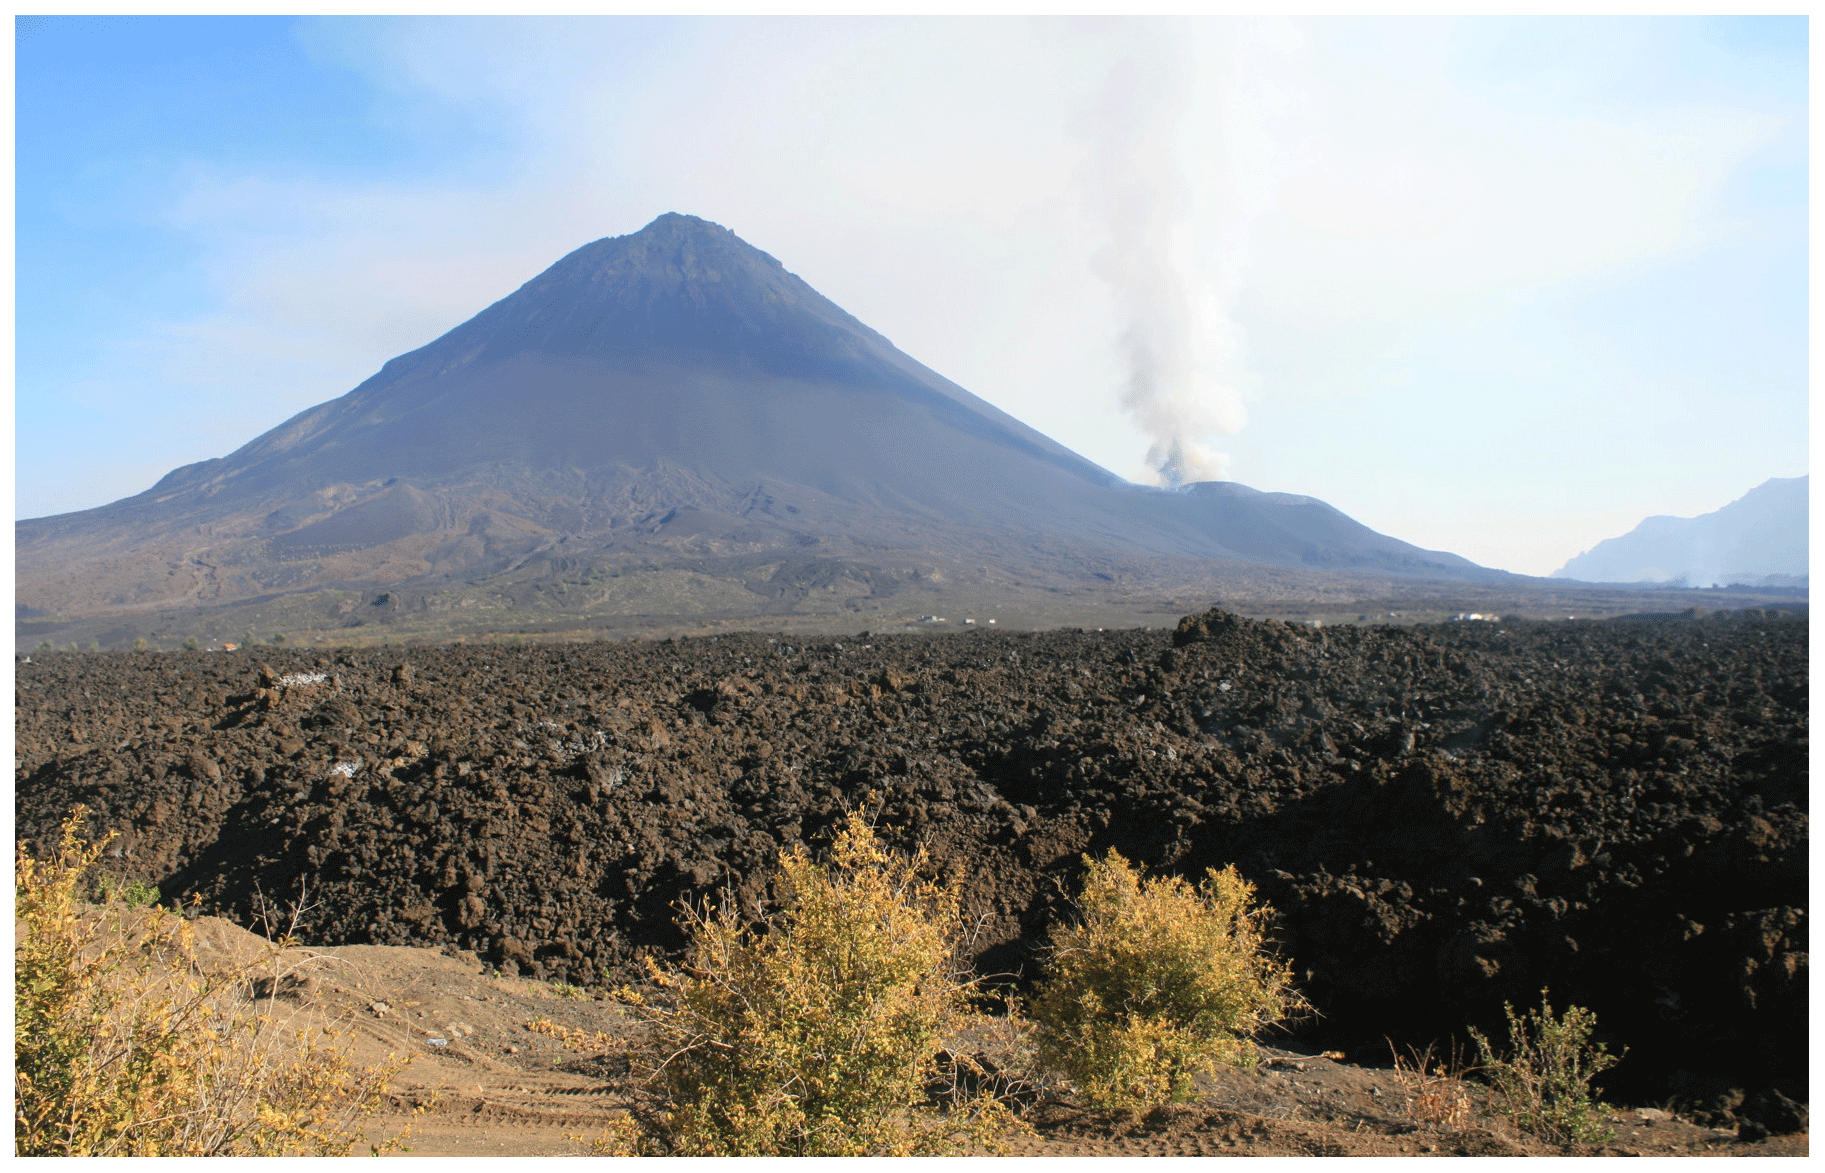
Figure 2The Chã das Caldeiras and Pico do Fogo during the 2014/15 eruption. View towards the southeast with the `a`ā lava flows of 2014/15 in the foreground, evidencing a very irregular and inaccessible surface. The active volcanic vent is visible on the SW flank of the Pico do Fogo.
Chã das Caldeiras (Fig. 2) is thus a lava-infilled, high-altitude summit depression, which resulted from the gradual accumulation and ponding of lava flows (and pyroclasts) that erupted from Pico do Fogo and its adventitious/satellite cones, against the vertical walls of Bordeira. Morphologically, the Chã can be divided into two large semi-circular sectors: a southern larger one, with an approximately 3 km radius and with an elevation of 1780 m, and a northern one, with a shorter radius of approximately 1 km and with a mean elevation of 1650 m. These two sectors, which are roughly separated by the prominent Monte Amarelo spur, have been interpreted as two coalescent volcanic calderas by Torres et al. (1998), Brum da Silveira et al. (1997a, b) and Madeira et al. (2008). Chã das Caldeiras is generally a flat landscape, punctuated by a few volcanic cones and extensively covered by `a`ā and pāhoehoe lava flows and ash and lapilli deposits, which make it a rough and challenging terrain for mapping. In particular, the extensive `a`ā lava flow lobes of the 2014/15, 1995 and 1951 eruptions covered large portions of Chã, resulting in wide swaths of virtually inaccessible rocky surfaces, given their roughness. Hummocky landscapes also exist, generally corresponding to older `a`ā lava flow fields with large, scattered, rafted blocks of spatter sequences on their surface (resulting from the gravitational collapse of strombolian cones and subsequent transport by lava flows), which are now partially buried under a blanket of lapilli and ash that smoothed the surface. A good example of such surfaces can be found to the east and particularly to the west of the Monte Beco cone, being genetically associated with this vent. The foot and slopes of Pico do Fogo, in contrast, are extensively covered by a thick blanket of lapilli and ash, resulting in a very smooth and uniform conical surface. Despite this cover, fanned leveed channel morphologies can also be recognized at the foot of Pico do Fogo, corresponding to buried lava flow fans and alluvial fans. Overall, vegetation is scarce and is mostly confined to the talus surfaces accumulated at the foot of Bordeira, where a thin soil exists, or to some scattered vineyards along ash-covered slopes.
Human settlement at Chã das Caldeiras started towards the end of the nineteenth century (Ribeiro, 1954). The area is cooler and more humid than the rest of the island, with frequent fog condensation and occasional frosts, providing ideal conditions for the planting of orchards and vineyards. Attracted by the prospect of more prosperous agriculture, people gradually settled the Chã, mostly in the vicinities of Monte Amarelo. There, springs and ephemeral streamflow from the larger canyons draining Bordeira allowed easier access to water. Here people established the settlements of Portela, Boca Fonte and later Bangaeira, which slowly and gradually grew until the 1995 eruption. Then, Boca Fonte was all but destroyed and the main access road to these settlements was blocked by the advancing flows (Jenkins et al., 2017). After the 1995 eruption, the prospect of an additional income provided by a burgeoning wine industry and the rapidly growing flow of tourists that came to see the volcano fuelled the rapid growth of Portela and Bangaeira, with the population reaching as much as ∼ 1500 resident inhabitants by 2014 (Fonseca et al., 2014; Jenkins et al., 2017). The 2014/15 eruption had a profound impact on these villages, as the advancing lava flows either razed or buried up to 90 % of the existing buildings and covered large swaths of agricultural land. Gradually, however, reconstruction is taking place, both through new constructions over the recent lava flows and by the painstaking reclamation of lava-buried but structurally intact buildings.
The latest eruption on Fogo started on the 23 November 2014 and lasted until the 8 February 2015, with magma erupting from a 700 m long NE–SW-trending fissure on the SE flank of the 1995 crater, on the SW flank of Pico do Fogo (Vieira et al., 2016; Mata et al., 2017; González et al., 2015). Reportedly, the eruption started with vigorous fire-fountain activity, which quickly evolved to a more explosive strombolian style, forming a crater row roughly parallel to the 1995 fissure. Later, the eruption was characterized by simultaneous or alternating Hawaiian, strombolian and vulcanian eruptive styles (from the different craters of the fissure) lasting for several days and by an almost constant emission of lava from the lowermost terminus of the vent (Mata et al., 2017). These formed two initial thick `a`ā flow lobes: the first advanced towards the southwest and eventually stalled after 1.7 km, at the foot of the caldera wall; the second progressed intermittently 3 km to the northeast, towards the village of Portela, razing a large portion of the settlement (Mata et al., 2017; Jenkins et al., 2017). During the later stages of the eruption, this flow lobe was reactivated, producing more fluid `a`ā and pāhoehoe breakouts to the west and north, the latter of which destroyed most of what was left of the Portela settlement and descended to the village of Bangaeira, causing widespread destruction there (Mata et al., 2017; Jenkins et al., 2017).
Remote sensing techniques have been used by several authors to study the Fogo eruption of 2014/15. Cappello et al. (2016) used the HOTSAT satellite volcano thermal monitoring system for the analysis of Moderate Resolution Imaging Spectroradiometer (MODIS) and Spinning Enhanced Visible and InfraRed Imager (SEVIRI) data to determine the location of the hotspot, lava thermal flux and effusion rate. Validation of numerical simulations was performed using Landsat 8 OLI and EO-1 ALI images and field observations.
Bagnardi et al. (2016) used very high resolution tri-stereo optical imagery acquired by the Pléiades-1 satellite constellation and generated a 1 m resolution DEM. The model accuracy was calculated from differential GPS (dGPS) solutions from 19 ground control points. The mean offsets obtained were −7.6 m (easting) and −1.3 m (northing), with standard deviations of 0.4 and 0.3 m, respectively. The mean height difference (MHD) was −2.84 m, and the standard deviation (SD) was 0.51 m. The authors also generated a DEM using spaceborne synthetic aperture radar (SAR) data from the TanDEM-X mission, generating a 5 m/pixel model with an MHD of −0.1 m and SD of 1.12 m. They have also evaluated coarser-resolution public DEMs against the ground control points (GCPs): the SRTM (30 m) shows an MHD of −3.5 m and an SD of 3.64 m, and the ASTER GDEM (30 m) resulted in an MHD of −8.56 m and in an SD of 5.74 m. From the Pléiades-1 post-eruption topography they subtracted the heights from the pre-eruption DEM. Height differences indicate a lava volume of 45.83 ± 0.02 × 10⁶ m3, emplaced over an area of 4.8 km2 at a mean rate of 6.8 m3 s−1.
Richter et al. (2016) performed lava flow simulations based on field topographic mapping and satellite remote sensing analysis. They produced a topographic model of the 2014/15 lava flows from combined terrestrial laser scanner (TLS) and photogrammetric data obtained from 77 oblique images obtained with Canon EOS Rebel 15.1 MP DSLR cameras. The resulting DEM represents the conditions on 16 January 2015 and shows a 5 m resolution and an RMSE of 1.08 m in relation to a pre-eruptive 5 m/pixel DEM produced by GRAFCAN in a mapping campaign in 2003/04. The comparison of both allowed the estimation of a lava volume of 43.7 ± 5.2 × 10⁶ m3. TerraSAR-X imagery was used to assess the lava flow model performance. The authors highlight the need for up-to-date topographic information because lava flow hazards change as a result of topographic modifications.
More recently, Bignami et al. (2020) combined 21 images from Sentinel-1, COSMO-SkyMed, Landsat 8 (L8) and Earth Observing-1 missions from November 2014 to January 2015 to retrieve lava flow patterns. They applied an automatic change detection technique for estimating the lava field and its temporal evolution, combining the SAR intensity and the interferometric SAR coherence. The area coverage of the lava flow obtained by visual analysis (L8 and EO-1) was estimated at 4.97 km2 as in Cappello et al. (2016), very close to the 4.8 km2 estimated by Bagnardi et al. (2016) and the 4.85 km2 estimated using terrestrial laser scanner (TLS) data combined with structure from motion data by Richter et al. (2016).
The DEMs produced previously show spatial resolutions of 1 to 5 m and metric accuracies. In this paper we present and make public a new dataset that fills the gap from the metric to the decimetric scale and provides a new tool for multiple applications in various fields of Earth and environmental sciences and planning.
4.1 UAV surveying
The survey of the Chã das Caldeiras area took place from 12 to 16 December 2016 with a team of four members: two working on the UAV flight operations and two on collecting ground control points. The campaign was conducted roughly 20 months after the end of the eruption of 2014/15, when the lava flows had already cooled substantially. At the time, some of the few houses at the Chã das Caldeiras had been reoccupied, despite that being forbidden and hazardous, mainly due to gas emissions. Hence, the team stayed at the village of São Filipe and travelled daily to the survey area.
Table 1Synthesis of flight characteristics and photos excluded from the modelling due to lack of calibration or manually disabled in the pre-processing.
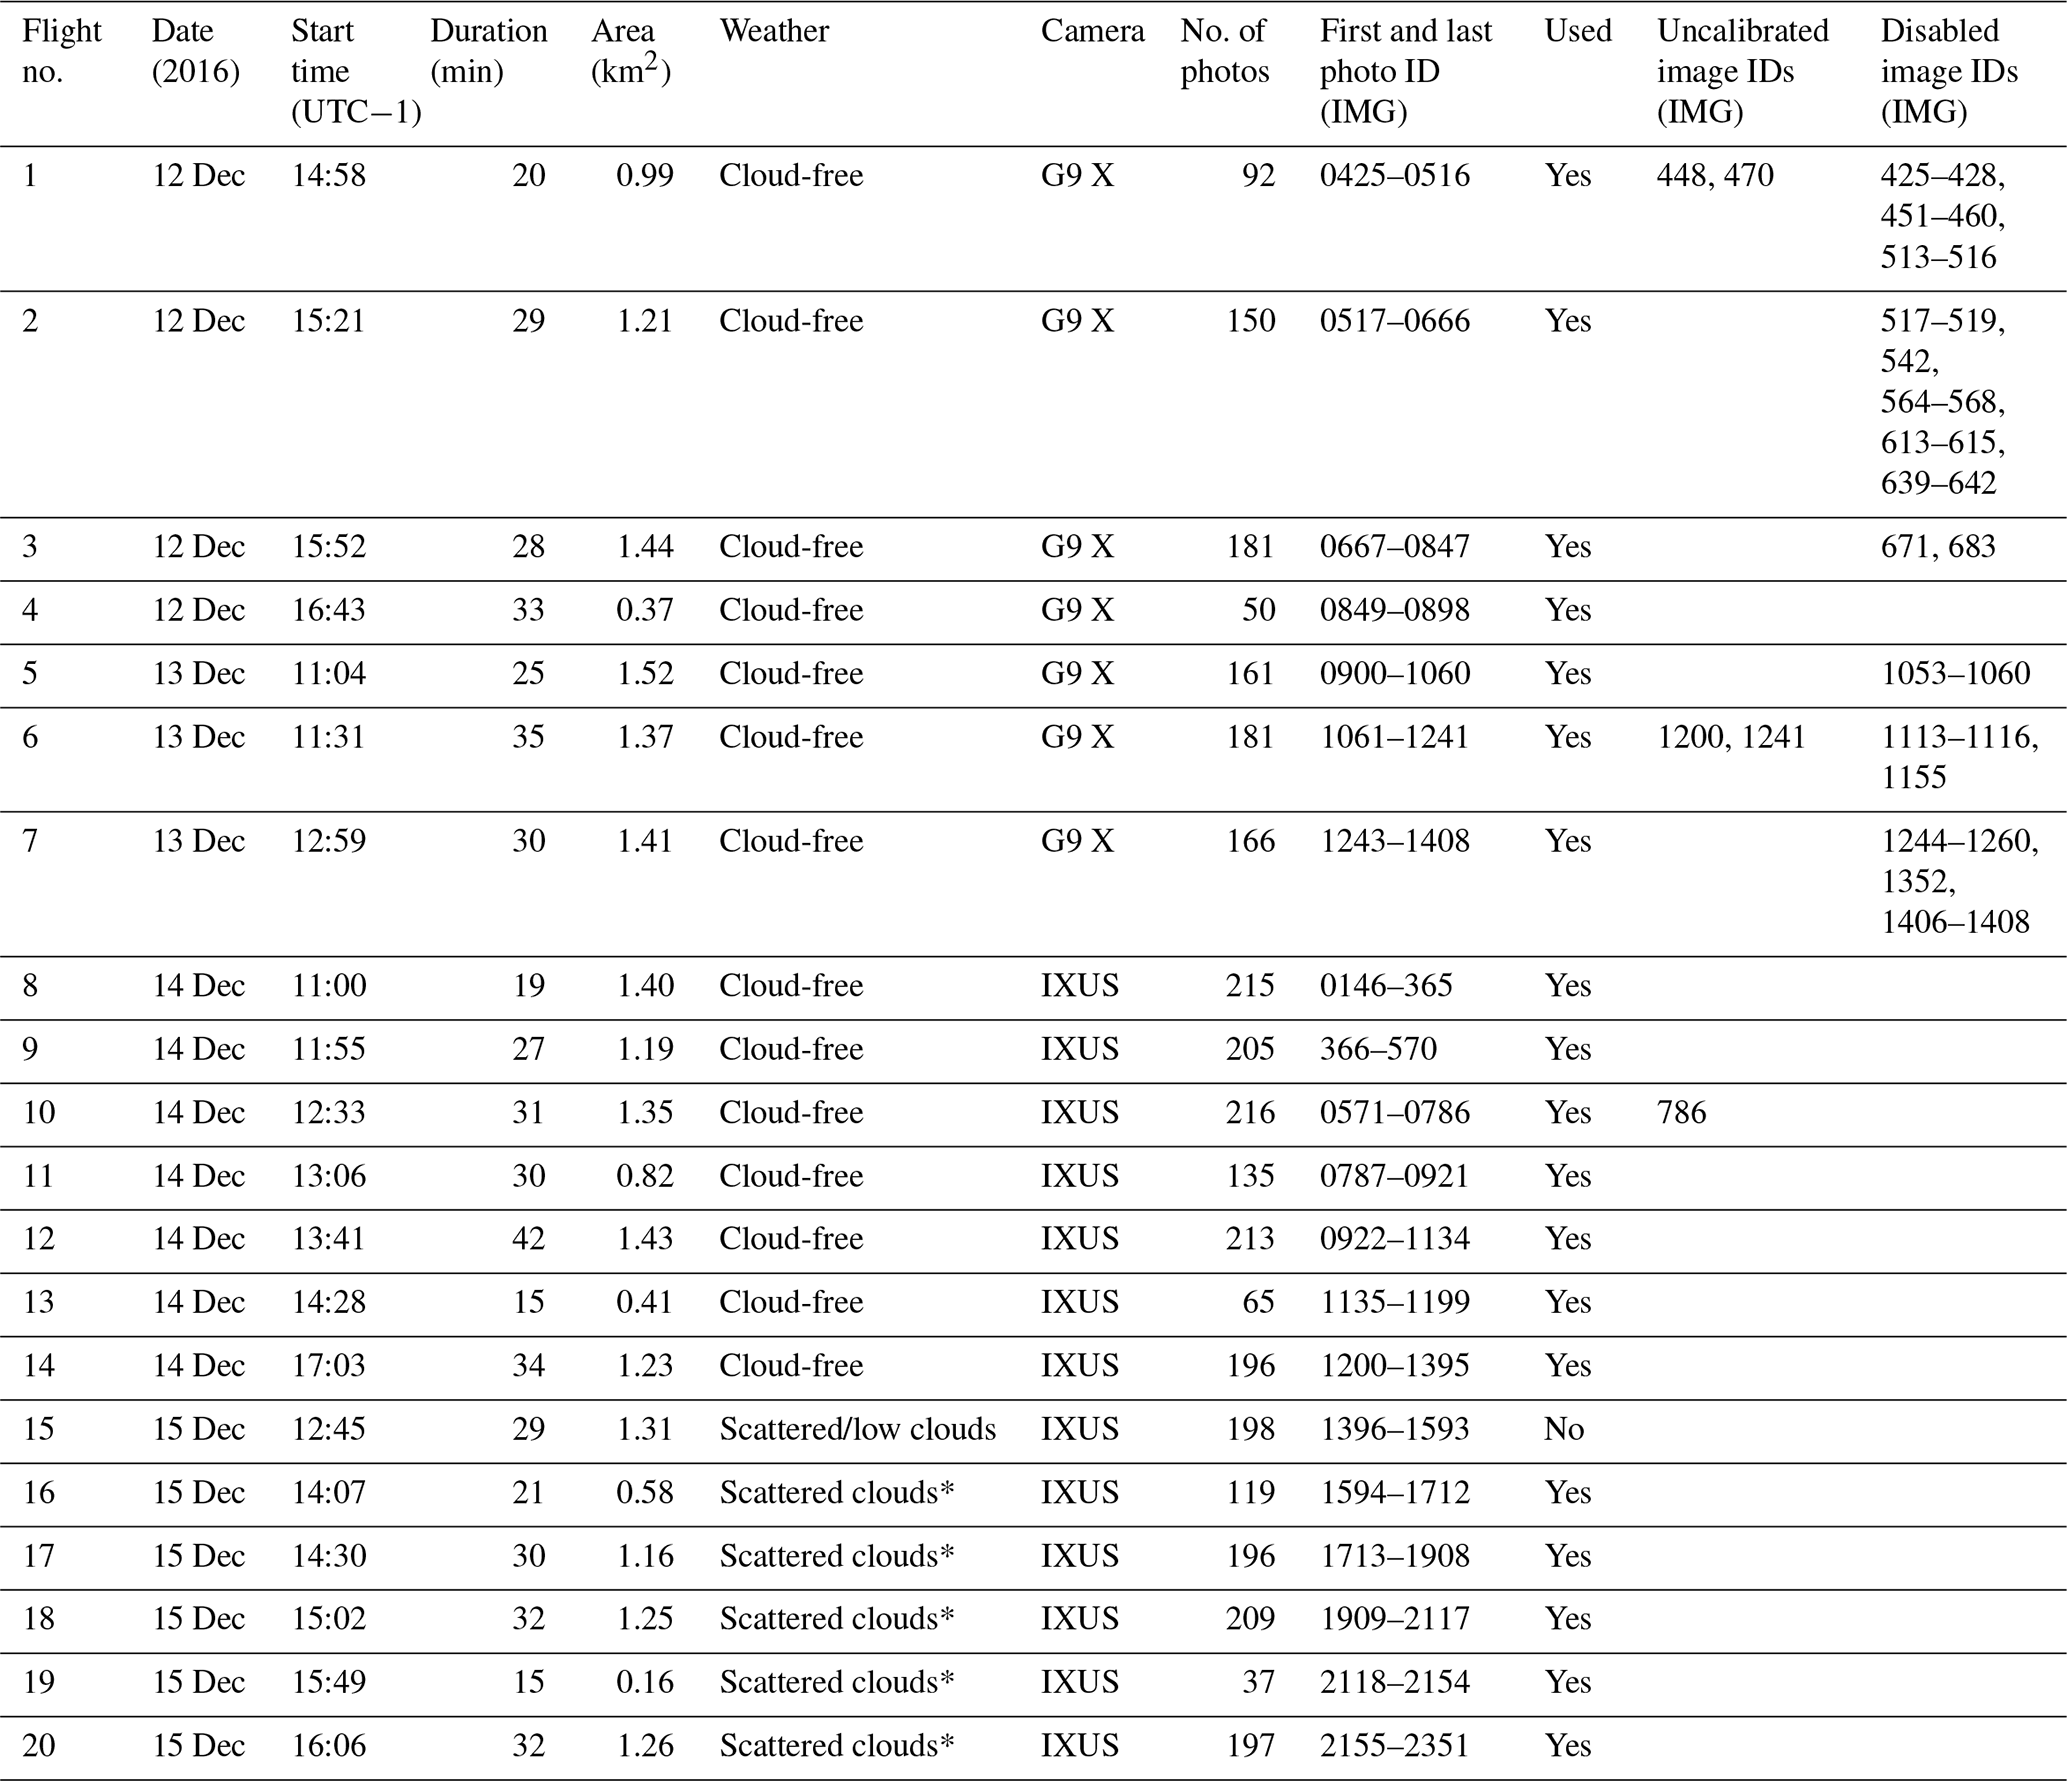
* Illumination problems, probably due to light scattering associated with fog entering the caldera from the NE and the dark wall of the Bordeira in the S and W, resulting in
striping.
The main logistical issues were (i) the weather, which in December frequently features high winds and low visibility (clouds) in the Chã das Caldeiras; (ii) finding good landing sites for the UAV; (iii) coping with the 1000 m high vertical rock wall of the Bordeira and its potential influence on the positioning and communications system of the UAV; and (iv) collecting enough high-quality ground control points. The weather during the campaign showed mostly clear skies and no wind in the first days but deteriorated towards the end, with low clouds affecting the illumination conditions and limiting the flights in the last 2 d (Table 1).
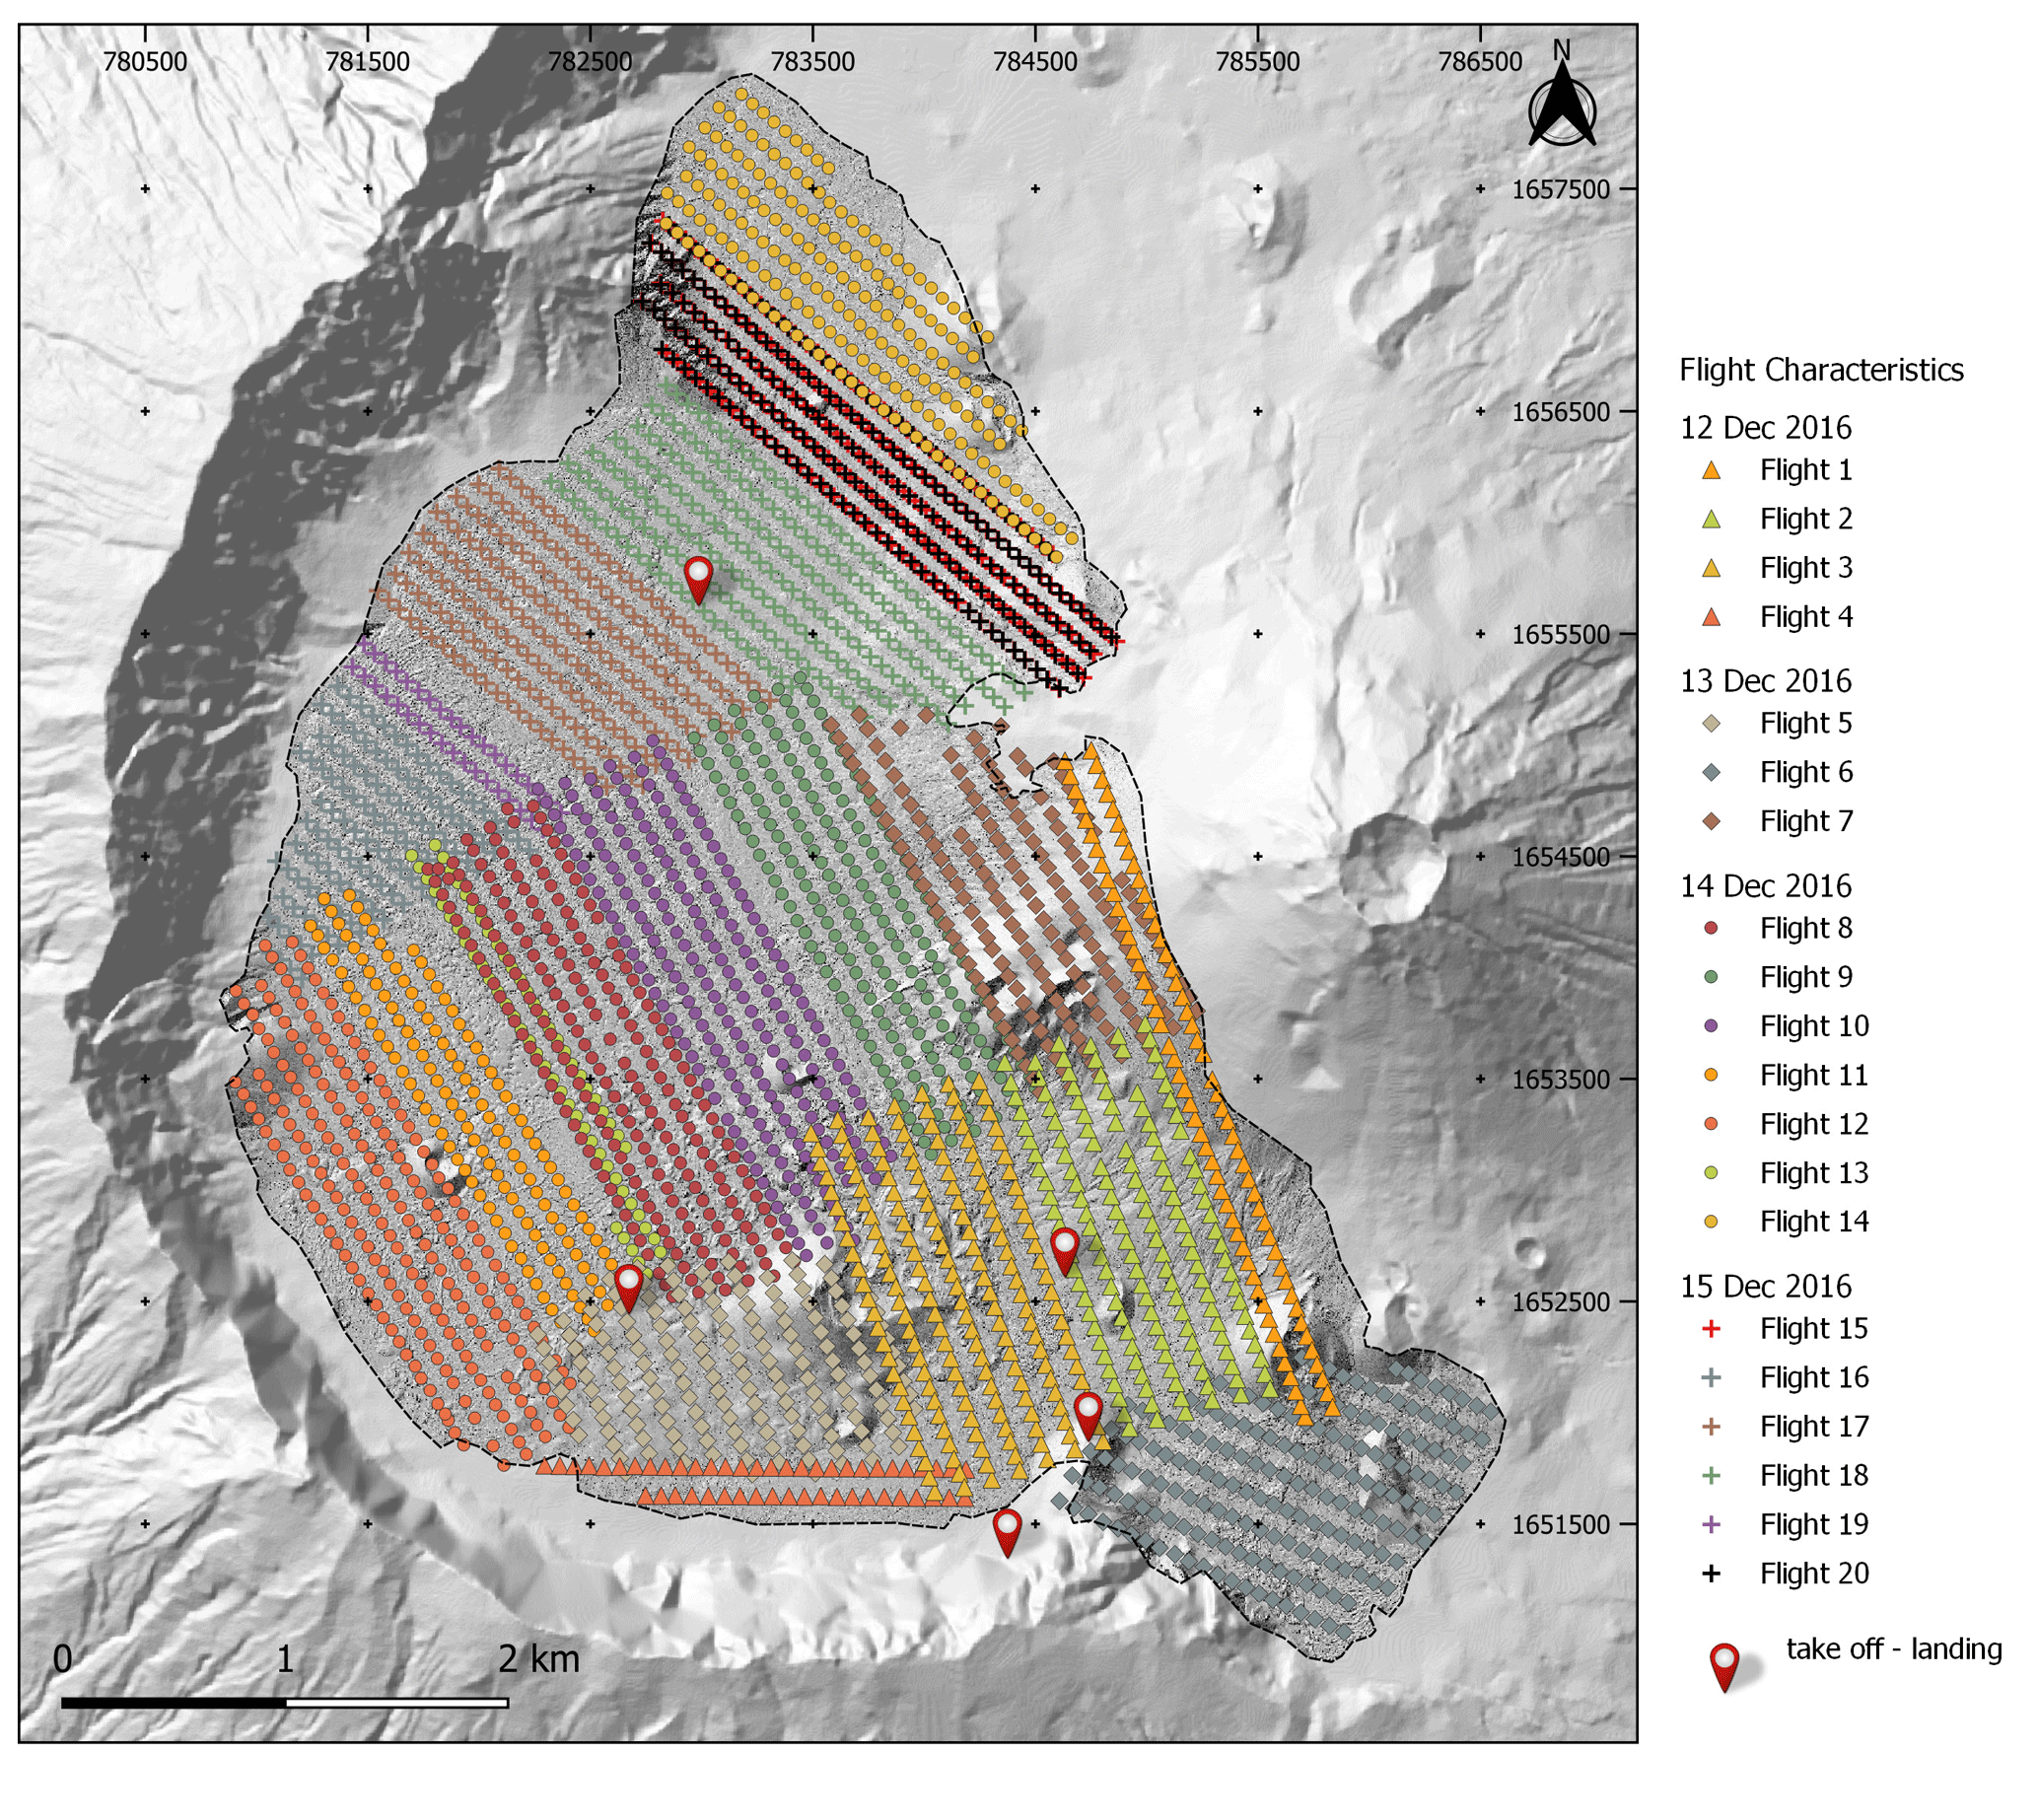
Figure 3General characteristics of the aerial survey of the Chã das Caldeiras with the geolocation of the photographs according to the flights and take-off and landing locations. Shaded inside the survey area from the DSM produced here. Shaded relief outside the survey area from the DEMFI (2010) 5 m DEM.
The survey was conducted using a fixed-wing UAV SenseFly eBee Classic, with a 96 cm wingspan and under 0.7 kg take-off weight. The model has an internal GPS, pitot probe, barometer and ground distance sensor and allows for flights with wind speeds of up to 45 km h−1, flight durations of up to 50 min and a radio link distance of up to 3 km. Two cameras were used: a 16 MP Canon PowerShot G9 X in the initial flights, which had a critical failure, and a backup 12 MP Canon IXUS 127 HS which was used subsequently (Table 1). Flight planning was carried out with eMotion 2, with flights at an average height of 190 (above the ground surface), resulting in an average ground sampling distance of ca. 6–7 cm. The images were collected with a longitudinal overlap of 60 % and a lateral overlap of 65 %. This setup was a compromise between (i) the aim to map features below ca. 50 cm, (ii) maintaining flights under a 200 m height from the ground surface for better control, (iii) the time available for the surveying and (iv) battery limitations of the UAV.
Take-off with the eBee is performed by hand, but landing needs several tens of metres of approach area and a smooth landing surface in order to not damage the EPP UAV body. This was a significant limitation to the survey, since the area of the Chã das Caldeiras is mostly covered by very rough lava surfaces, with scarce smooth ash and lapilli cover sites. Given these constraints, five sites allowing for good landing conditions were selected (Fig. 3): (i) 14.93477∘ N, 24.35407∘ W; (ii) 14.928092∘ N, 24.353165∘ W; (iii) 14.92339∘ N, 24.356605∘ W; (iv) 14.9334999∘ N, 24.3722831∘ W; and (v) 14.962204∘ N, 24.3690256∘ W.
The survey consisted of 20 flights with a design that results from the initial planning modified during the fieldwork. The results do not show the ideal spatial setup or homogenous illumination conditions, but it was the best solution given the logistical constraints (Table 1). This was due to the following problems: sparse location of the take-off and landing sites, changes in wind speed affecting power consumption, unexpected cloud advection and low visibility during some days, duration of daylight, fast-changing shadowing effect from the Bordeira rock wall and Pico do Fogo, battery limitations (due to heat and high risk of damaging the UAV in case of a need to crash-land over lava flows, we decided to avoid flights of over 35 min), and long distances between landing sites. The survey consisted of over 2900 aerial photos and was on a total surveyed area of 24 km2 (Fig. 3).
4.2 Ground control points
Coordinates of ground control points (GCPs) were measured at markers distributed in the field prior to the survey and at easily identifiable points, such as large boulders and building edges. The measurements were obtained in December 2016 using a Leica Viva (GS08) dual-frequency GNSS rover in RTK mode, with GNSS base stations installed at known coordinate sites in high positions (Monte Beco and Monte Amarelo, Fig. 4) and at a maximum distance of 2.3 km between base and rover. The coordinates of the base stations were obtained using the base station FGMB00CPV (Fogo – Monte Beco) of the Instituto Nacional de Gestão do Território (INGT). The collection of each GCP was carried out once the positioning accuracy stabilized below 2 cm. Extra GCPs were collected in February 2017 in small boulders selected in the preliminary orthophoto mosaic, with the objective of improving georeferencing quality. These points were obtained by post-processing using FGMB00VCPV. The accuracy of the GNSS positioning is about 3 cm plus the uncertainty in the precise positioning of the rover in relation to the terrain feature, which we estimate to be of about 5–10 cm. The GCP coordinates are provided in the dataset, with the coordinate system WGS 84/UTM Zone 26N.
4.3 Point cloud, orthophoto mosaic and digital surface model
Aerial image processing was performed using Pix4Dmapper 4.5.6, commercial software based on automatic feature detection, image matching and modelling using SfM algorithms. Extensive methodological reviews on the application of UAV photogrammetry using this technique are found in Westoby et al. (2012), Smith et al. (2016) and Dering et al. (2019).
The point cloud was processed using the full image scale; matching of image pairs was processed using the aerial grid/corridor model, and geometrically verified matching was processed using automatic advanced key point extraction. Pix4D does not disclose the exact algorithms used in the processing. The feature matching is based on the SIFT algorithm, with the Pix4D workflow being described in Küng et al. (2011). The advanced camera calibration was performed by (i) using the so-called alternative method, which is optimized for aerial nadir images with accurate geolocation; (ii) optimizing all internal camera parameters; (iii) optimizing all external parameters (rotation and position); and (iv) no automatic rematch. The camera optimization resulted in a 0.35 % difference between the initial and optimized internal camera parameters, with the point cloud having used 2909 out of the total 2919 images.
The point cloud densification was performed using multiscale and half-image sizes, with optimal point density and a minimum number of three matches. This option was selected after intensive testing with four and five matches, which generated large gaps in the point clouds in areas that were well-resolved with three matches. Filtering of the point cloud was attempted in CloudCompare for outlier issues in poorly resolved areas, but as outliers were removed in some areas, others which were originally well-resolved deteriorated. Hence, the full processing was conducted within Pix4D.

Figure 5Ground control points used for the model and for the accuracy evaluation (checkpoints), manual tie points used to improve the point cloud accuracy and location of the GNSS base stations set up for collecting the ground control points and tie points. Shaded relief outside the survey area from the DEMFI (2010) 5 m DEM.
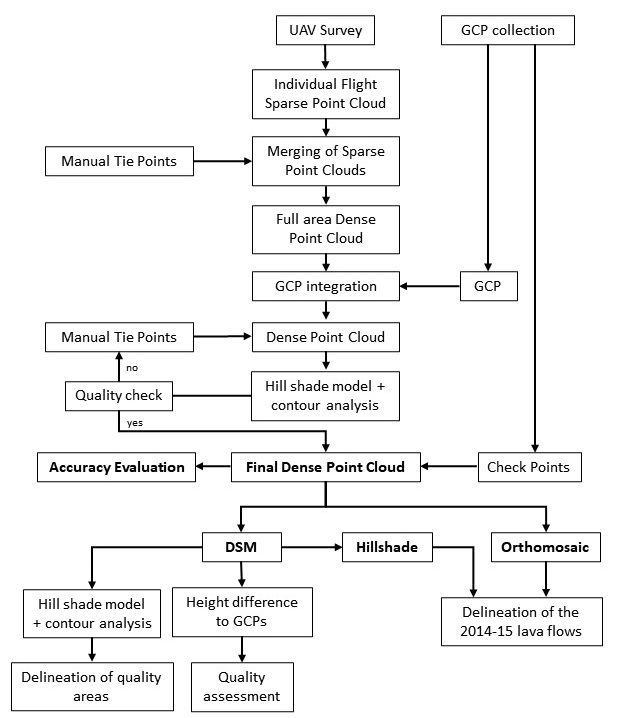
The large number of flights, large area and different illumination conditions led us to do separate processing and georeferencing of flights, with iterative project merging until the final model was obtained (Fig. 4). For this procedure, individual flights were always processed initially for the generation of the sparse point cloud. We then merged the adjacent flights performed on the same day and conducted a visual inspection of the point cloud order to identify poorly projected points in the overlapping sectors between adjacent flights. To guarantee improved matching, manual tie points (MTPs – small features visible in the images, normally allowing for an x and y accuracy better than 10 cm) were added at this stage and the model was reoptimized. Once the merge of the total surveyed area was completed, a total of 37 3D (x, y and z coordinates) and 3 2D (x and y coordinates) GCPs measured on the terrain were inserted into the point cloud (Fig. 5) and the model was reprocessed (rematched). Following this initial stage, an initial 10 cm resolution DSM was produced.
From the initial DSM, a hill shade model was created, as well as contour lines with a 50 cm elevation distance. The model and contours were used for a new detailed visual inspection of artefacts generated by the interpolation due to gaps in the point cloud or by outliers (Fig. 4). The main issues occurred in areas between adjacent flights or in sectors of very homogeneous terrain. In those sectors, more MTPs were added, until the artefacts disappeared. The procedure was performed iteratively until no artefacts were found, except those associated with the lack of matches in the point cloud, mainly associated with homogeneous surfaces covered by pyroclasts (lapilli and ash). This detailed visual inspection of the hill shade model and contours also solved issues related to different illumination conditions. Extra MTPs were further marked regularly over the point cloud to guarantee improved quality. To speed up the processing, when correcting specific sectors of the model, small processing areas were used. The full procedure involved the identification of 696 manual tie points for the whole model (Fig. 5). Each tie point was identified in at least 3 images, although usually in more, with an average number of 10 images used. The insertion of a tie point was complete when the terrain feature used for identifying the point and its modelled projection in non-marked images were overlapping. The average projection error of the MTPs was 0.99 pixels, with a standard deviation of 0.6 pixels.
The detailed report of the Pix4D project is available in the dataset and provides a detailed overview of the processing characteristics (cha_caldeiras_pix4d_report.pdf).
The DSMs with 10 and 25 cm/pixel were interpolated in Pix4D using noise filtering and sharp surface smoothing options in Pix4D, with interpolation using inverse distance weighting. This set of options allows the removal of erroneous points from the cloud by using the median elevation of neighbouring points, and it smooths small bumps in the model, preserving sharp features with only quasi-planar surfaces being flattened. After comparing the different filtering options, this was the one that produced the best results. The orthomosaics were produced with the same resolutions as those of the DSM in PIX4.
4.4 Delineation of the low-accuracy areas in the orthomosaic and DSM
Despite the workflow with integration of numerous MTPs, the final densified point cloud shows small sectors with no data in homogeneous fine ash and lapilli covers (Fig. 6). These concern surfaces outside the main aim of this work, which is the mapping of the recent lava flows. However, since the UAV survey covers an area much larger than the lava flows of 2014/15 and most of it shows a very dense point cloud and given the survey's potential application in land management and research, we decided to make available the full survey results. To provide the user with a quality zonation of the DSM, other than the evaluation of height error at GCPs, we have followed a qualitative methodology for the delineation of three quality areas. The assessment was based on the analysis of the 10 cm/pixel shaded-relief model and the 50 cm equidistance contours. These were subject to a systematic visual inspection that allowed for the manual delineation of the areas with errors in the DSM, in a procedure similar to the one used to add MTPs described in Sect. 4.3. This approach does not aim at calculating the accuracy of the DSM but rather at identifying the areas that should not be used for quantitative purposes.
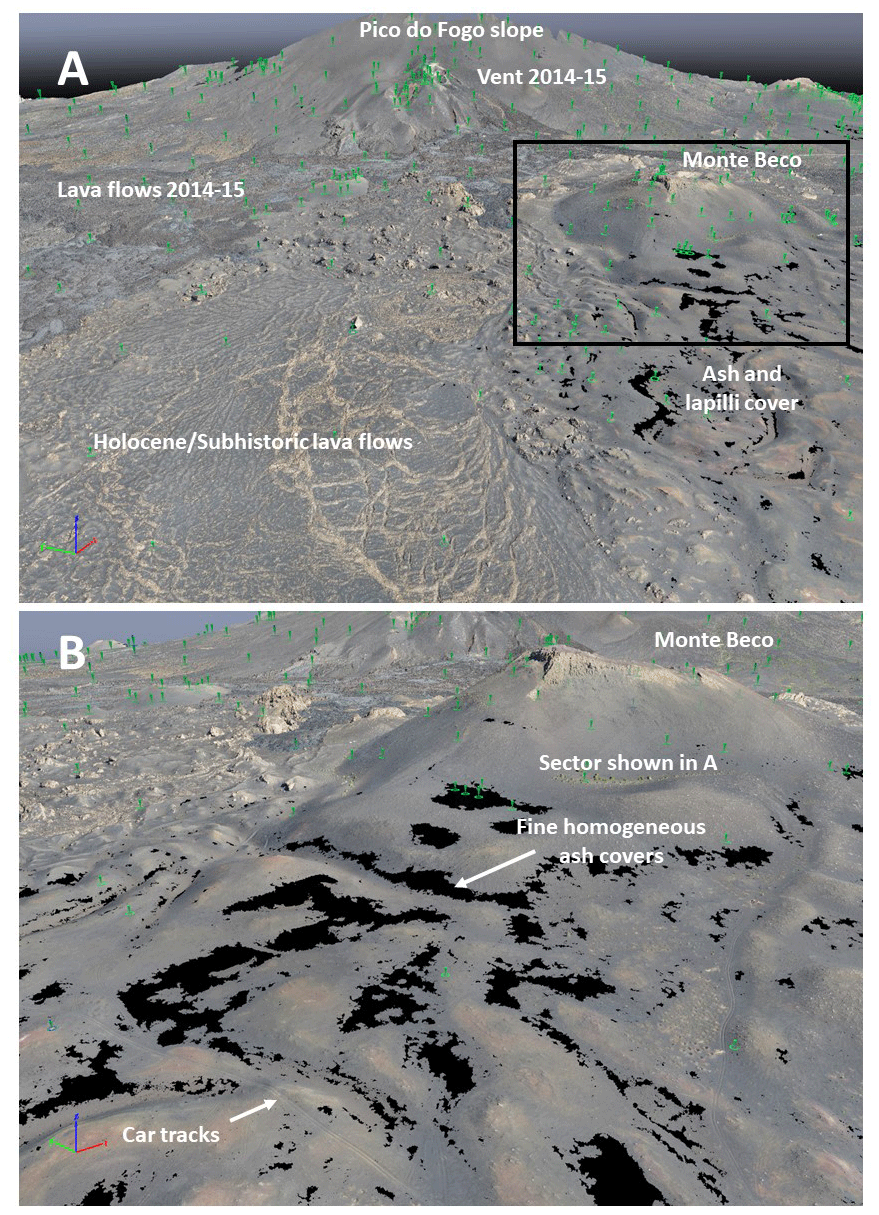
Figure 6Examples of the quality of the 3D dense point cloud. (a) Most of the point cloud shows dense point coverage and high accuracy, with the figure showing the lava fields close to Monte Beco and the small areas with gaps and low quality. (b) Low-quality areas in ash surfaces close to Monte Beco (car tracks for scale). The green pins are manual tie points. The location of the sector covered in this figure is indicated in Fig. 5.
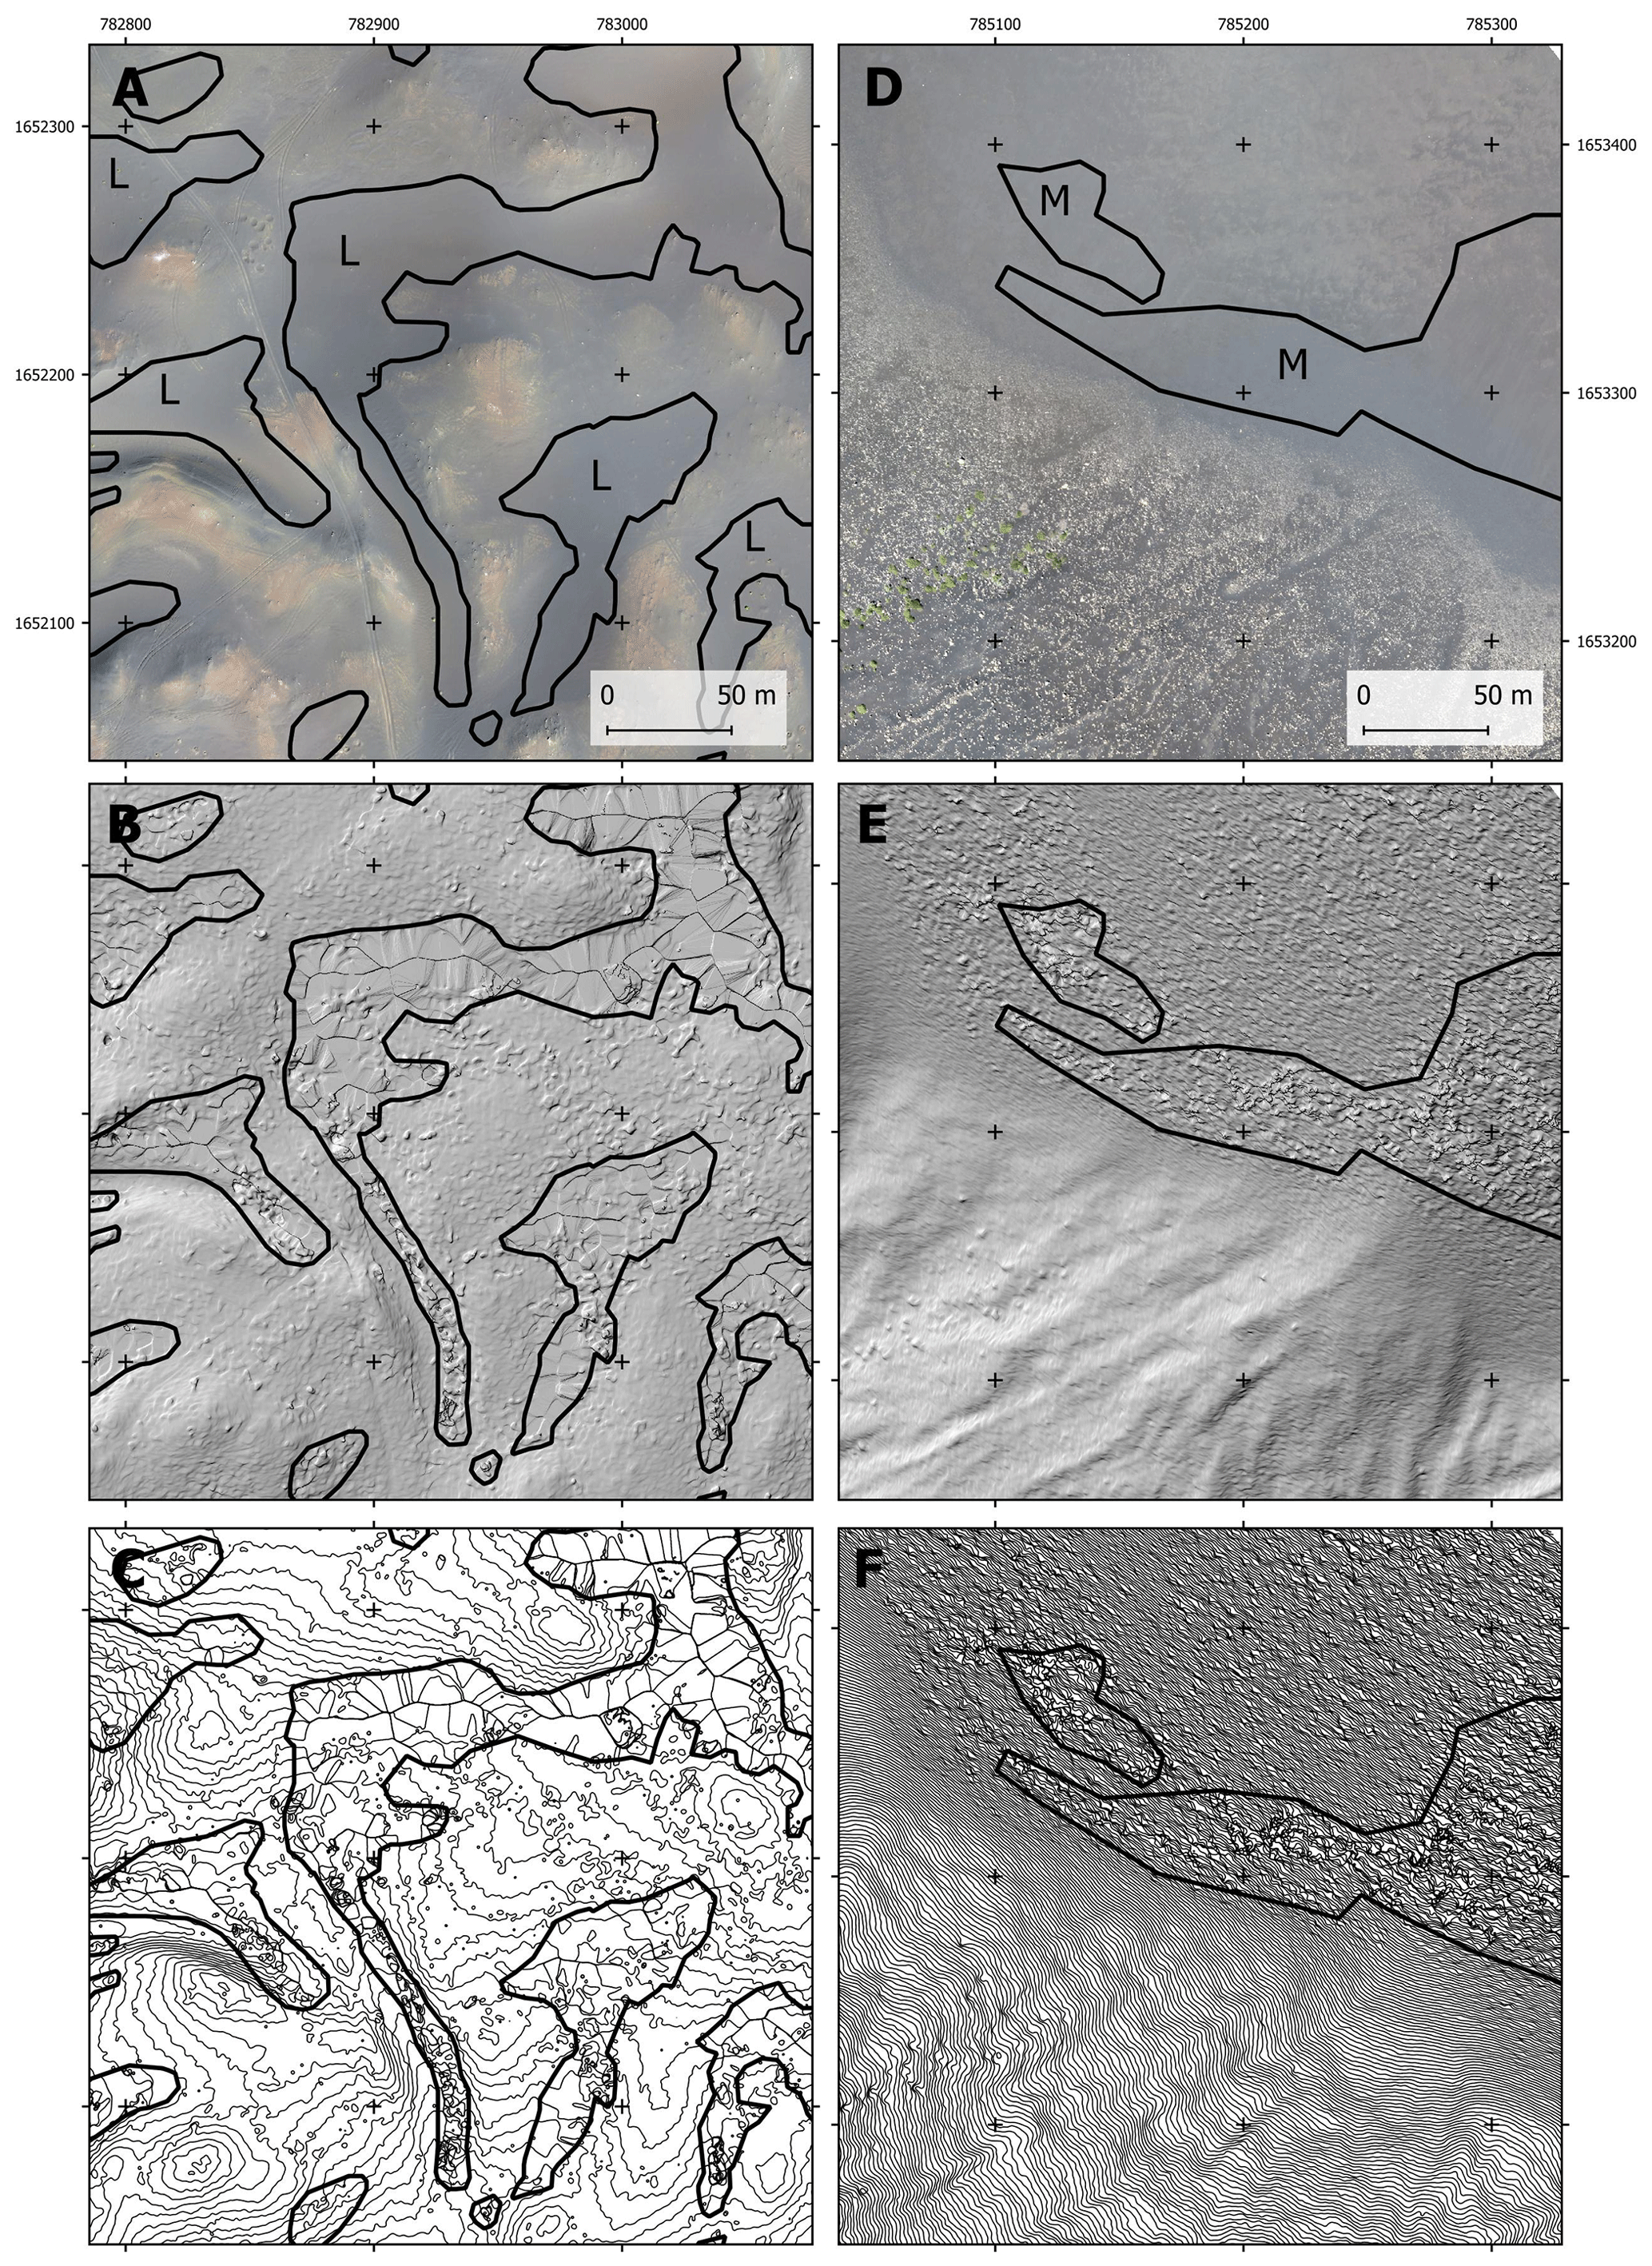
Figure 7Examples of surfaces with high, medium and low quality in the DSM. (a–c) Steep slope covered with ash with medium-quality results (M) for the digital surface model (a – orthomosaic, 10 cm; b – hill shade model, 10 cm; c – contour lines, 50 cm). The contours are very irregular in detail, but the overall slope at a coarse resolution is maintained. The area where the deposits are coarser (outside the polygon) provides a good DSM. (d–f) Irregular surfaces with linear depressions covered with ash with low-quality results (L), with orthomosaic for visualization (a – orthomosaic, 10 cm; b – hill shade model, 10 cm; c – contour lines, 50 cm). The contours are very irregular and show numerous errors. The border with the good- quality areas is sharp with good topography where the ground surface is coarser. The location of the figures is shown in Fig. 12.
The following criteria were used:
-
The high-quality areas are those where the point cloud is dense and has no relevant gaps, resulting in good interpolation with the hill shade model and contours showing regular features, describing accurately the terrain surface. These areas correspond generally to rough surfaces with numerous automatic and manual tie points, where the morphology is accurate and the point cloud has a high resolution (Figs. 6 and 7).
-
Medium-quality areas are sectors dominated by ash and lapilli, where sporadic 3D errors occur (Fig. 7a and b). These areas can be used for visualization purposes and even for quantification but with special care. Most errors in these zones are very small (decimetre scale) and can be smoothed by resampling, for example to a 1–2 m resolution. The errors are visible by small artefacts in the hill shade model and in the contour lines.
-
Low-quality areas are patches where the point cloud was poorly resolved, with numerous artefacts in the DSM as seen in the hill shade model and also in the contour lines (Fig. 7c and d). These areas cannot be used for quantification purposes and their visualization shows errors, which are sometimes significant.
4.5 Delineation of the 2014/15 lava flow field
The lava flow field of the 2014/15 eruption (Fig. 1) was digitized manually using the orthomosaic, hill shade model and contour lines and is made available in the dataset. Our knowledge of the field conditions and the high resolution of the orthomosaic allowed for the accurate delineation of the contact between the lava flows and the adjacent surfaces, which is sharp and well-defined. We have delineated both the external limit of the flows and the internal limit, when it surrounded landforms such as kīpukas. The delineation covered the full dataset, but unfortunately the UAV survey missed a small area of the lava flow with 0.007 km2 in the northwest sector of Chã das Caldeiras, close to Monte Amarelo. Therefore, that sector has been digitized using very high resolution Google Earth imagery. The delineation procedure was carried out in QGIS by manual vectorization, and an example is shown in Fig. 8.
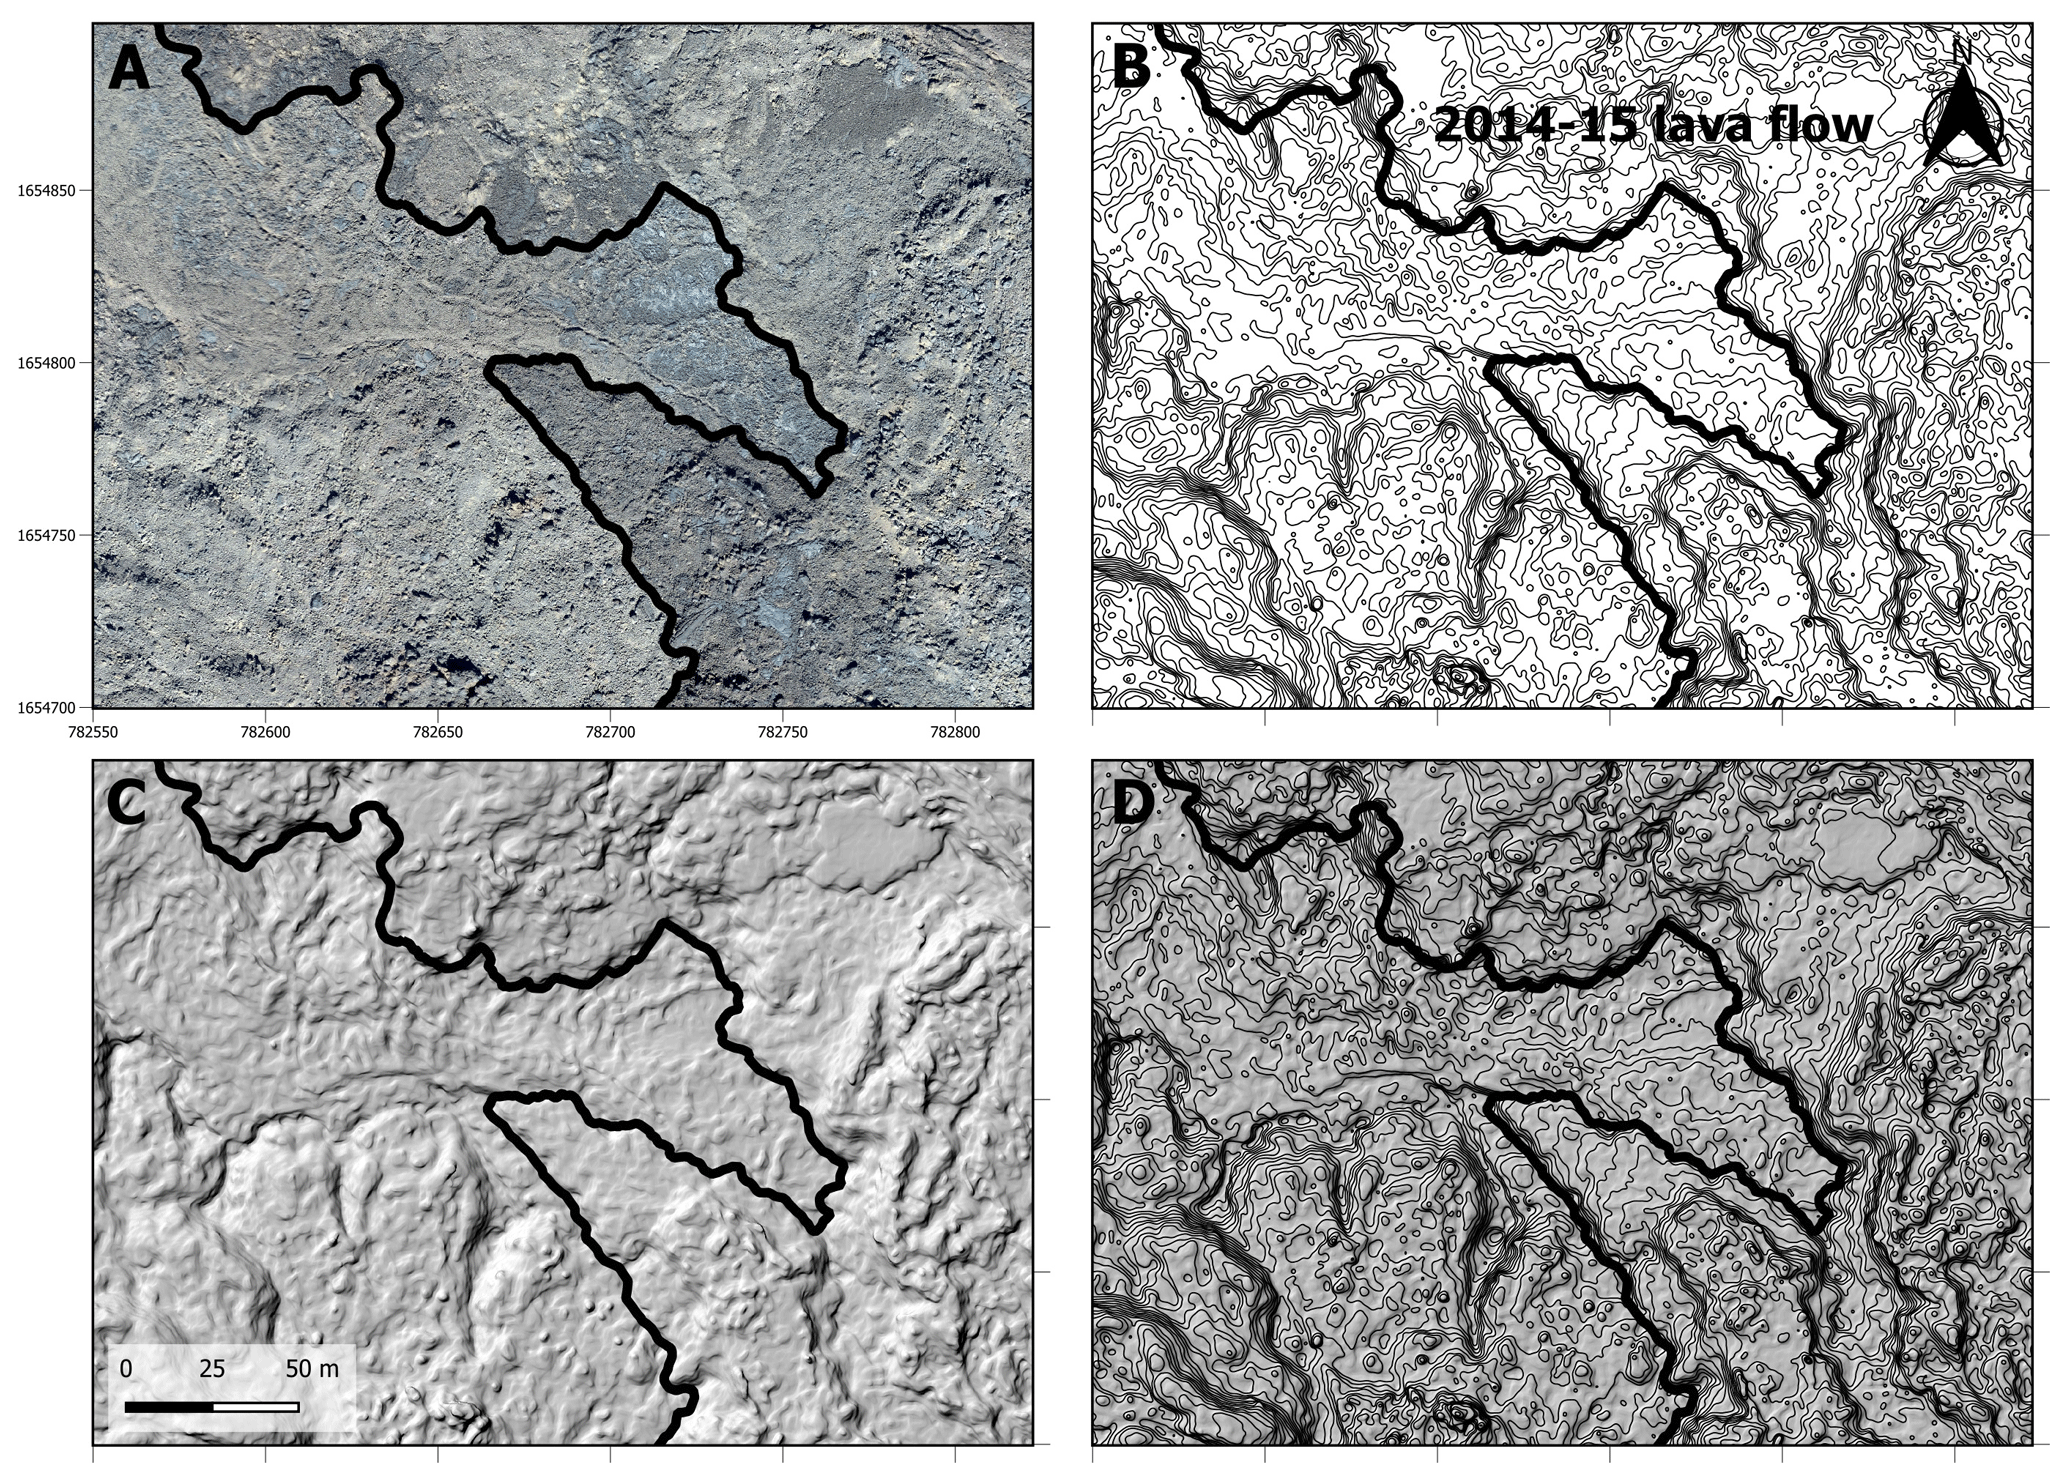
Figure 8Example of manual delineation of the lava flow by making use of the (a) orthomosaic, (b) elevation contours with 50 cm intervals, (c) hill shade model, and (d) hill shade model and elevation contours.
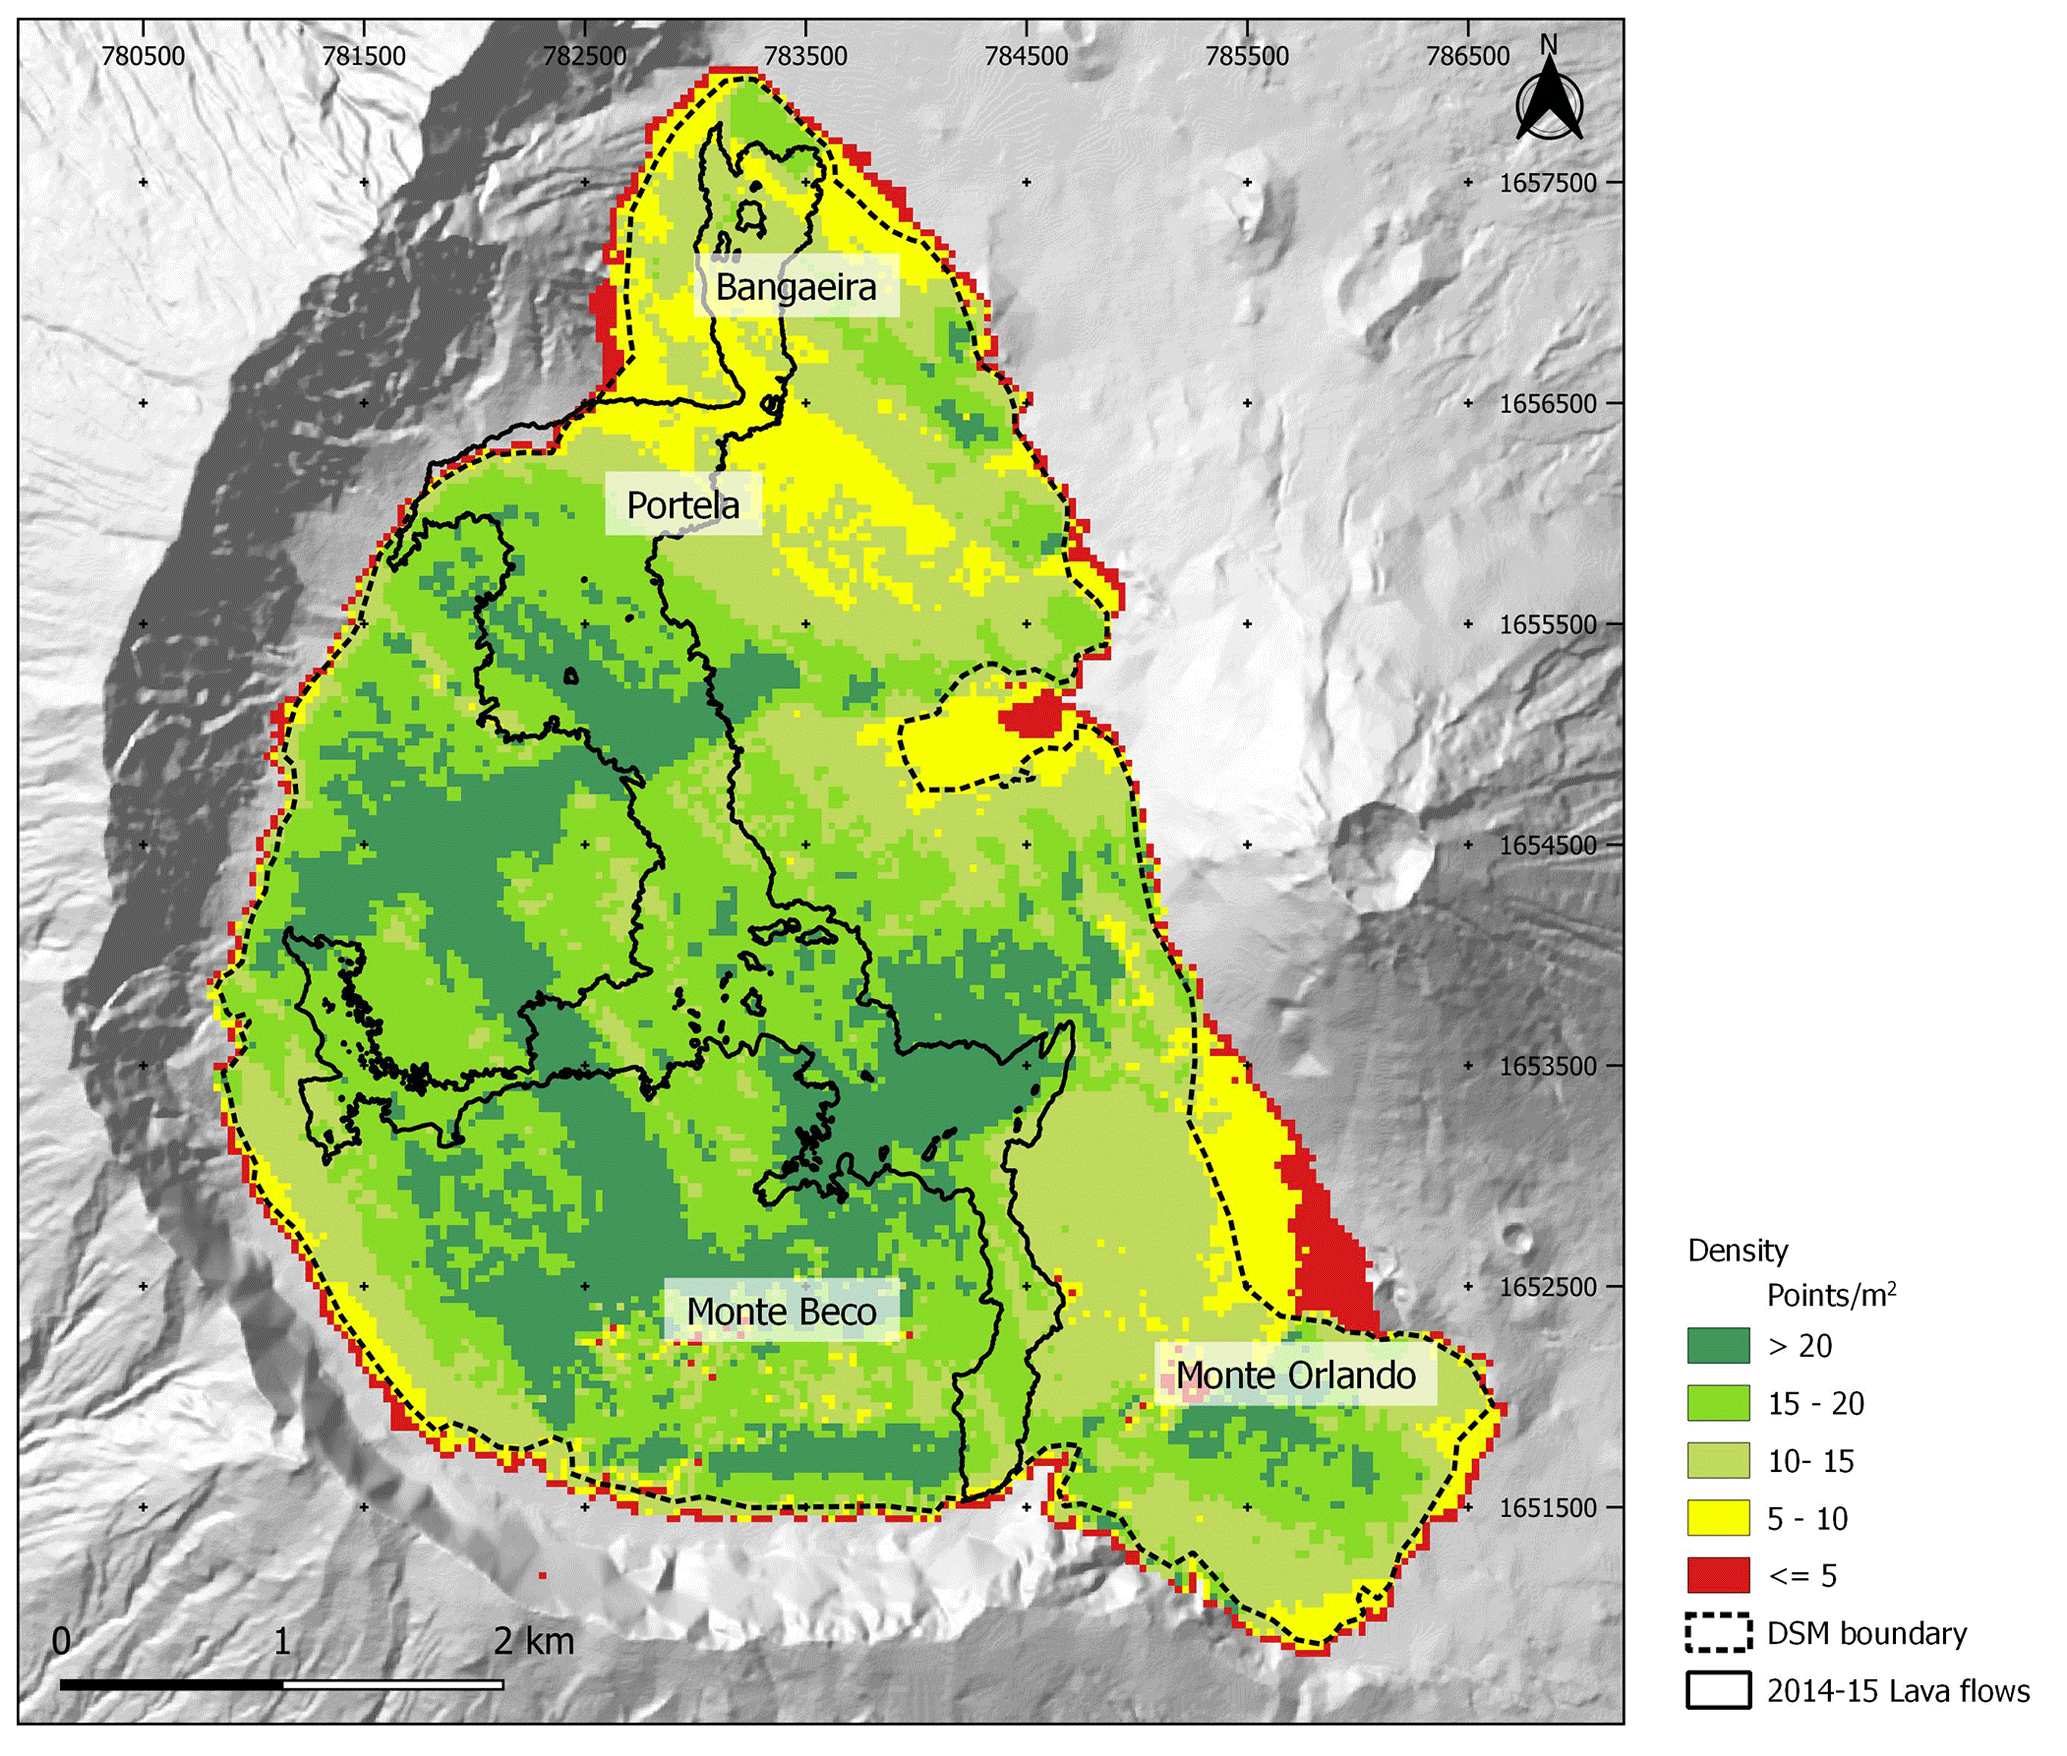
Figure 9Density of the point cloud of Chã das Caldeiras.
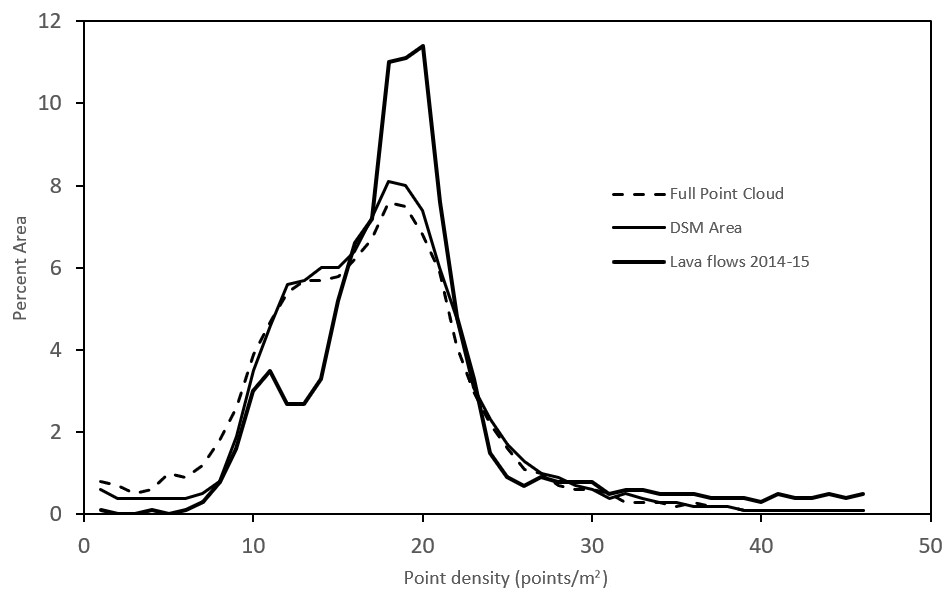
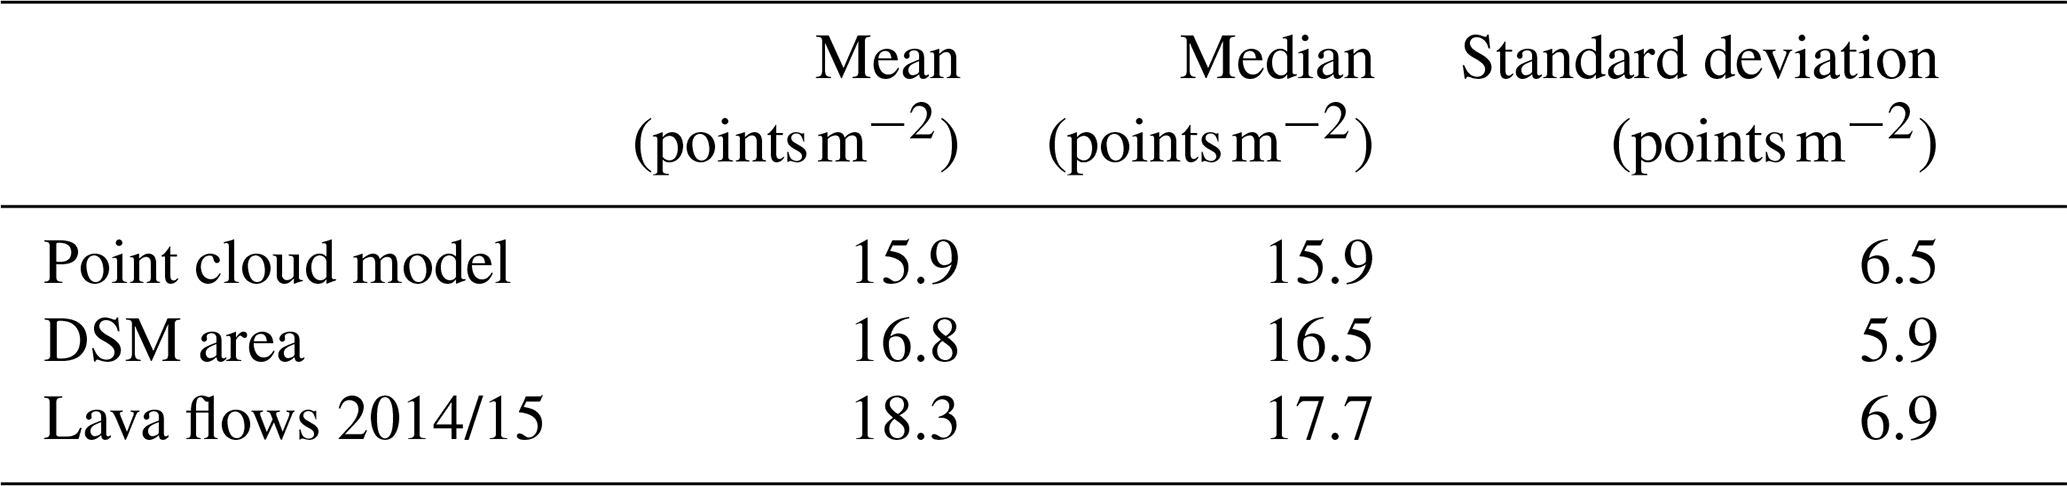
Table 2Point density in selected areas of the Chã das Caldeiras point cloud.
5.1 Point cloud
The densified point cloud covers a total area of 23.89 km2 with an average ground sampling distance of 7.17 cm and a median of 22 632 matches per calibrated image. The full point cloud has an average of 15.9 points m−2 and a standard deviation of 6.5 points m−2 (Table 2), with most of the area showing values above 15 points m−2 (Fig. 10). The least accurate areas, with less than 5 points m−2, are spatially limited and mainly located close to the limits of the survey, where there was less aerial coverage. Some small sectors west of Monte Beco and of Monte Orlando also show low density, but those are associated with very regular surfaces of ash and lapilli (see Fig. 7). The sector between Portela and Bangaeira shows a narrow NW–SE corridor with a width of around 90 m and a length of about 1200 m with 6–8 points m−2, caused by hazy conditions that reduced scene contrast. However, the topography is relatively regular, and hence the point cloud quality is good, lacking artefacts. The area of the 2014/15 lava flows shows a better overall quality of the point cloud, with a mean of 18.3 points m−2 (Table 2). This value is clearly affected by the average quality of the Portela–Bangaeira area, with most of the lava flows showing much higher densities (Fig. 9), as revealed by the bimodal histogram of Fig. 10.
The georeferencing accuracy of the point cloud was assessed using 13 independent checkpoints measured with dGPS in the field that were not used for the modelling. The point cloud RMSE is 0.08 m in X, 0.11 m in Y and 0.12 m in Z, with the projection error being always below 1.03 pixels (Table 3). This is over 1 order of magnitude better than the 1 m DEM by Bagnardi et al. (2016).
Table 3Accuracy of the densified point cloud per checkpoint in X, Y and Z.

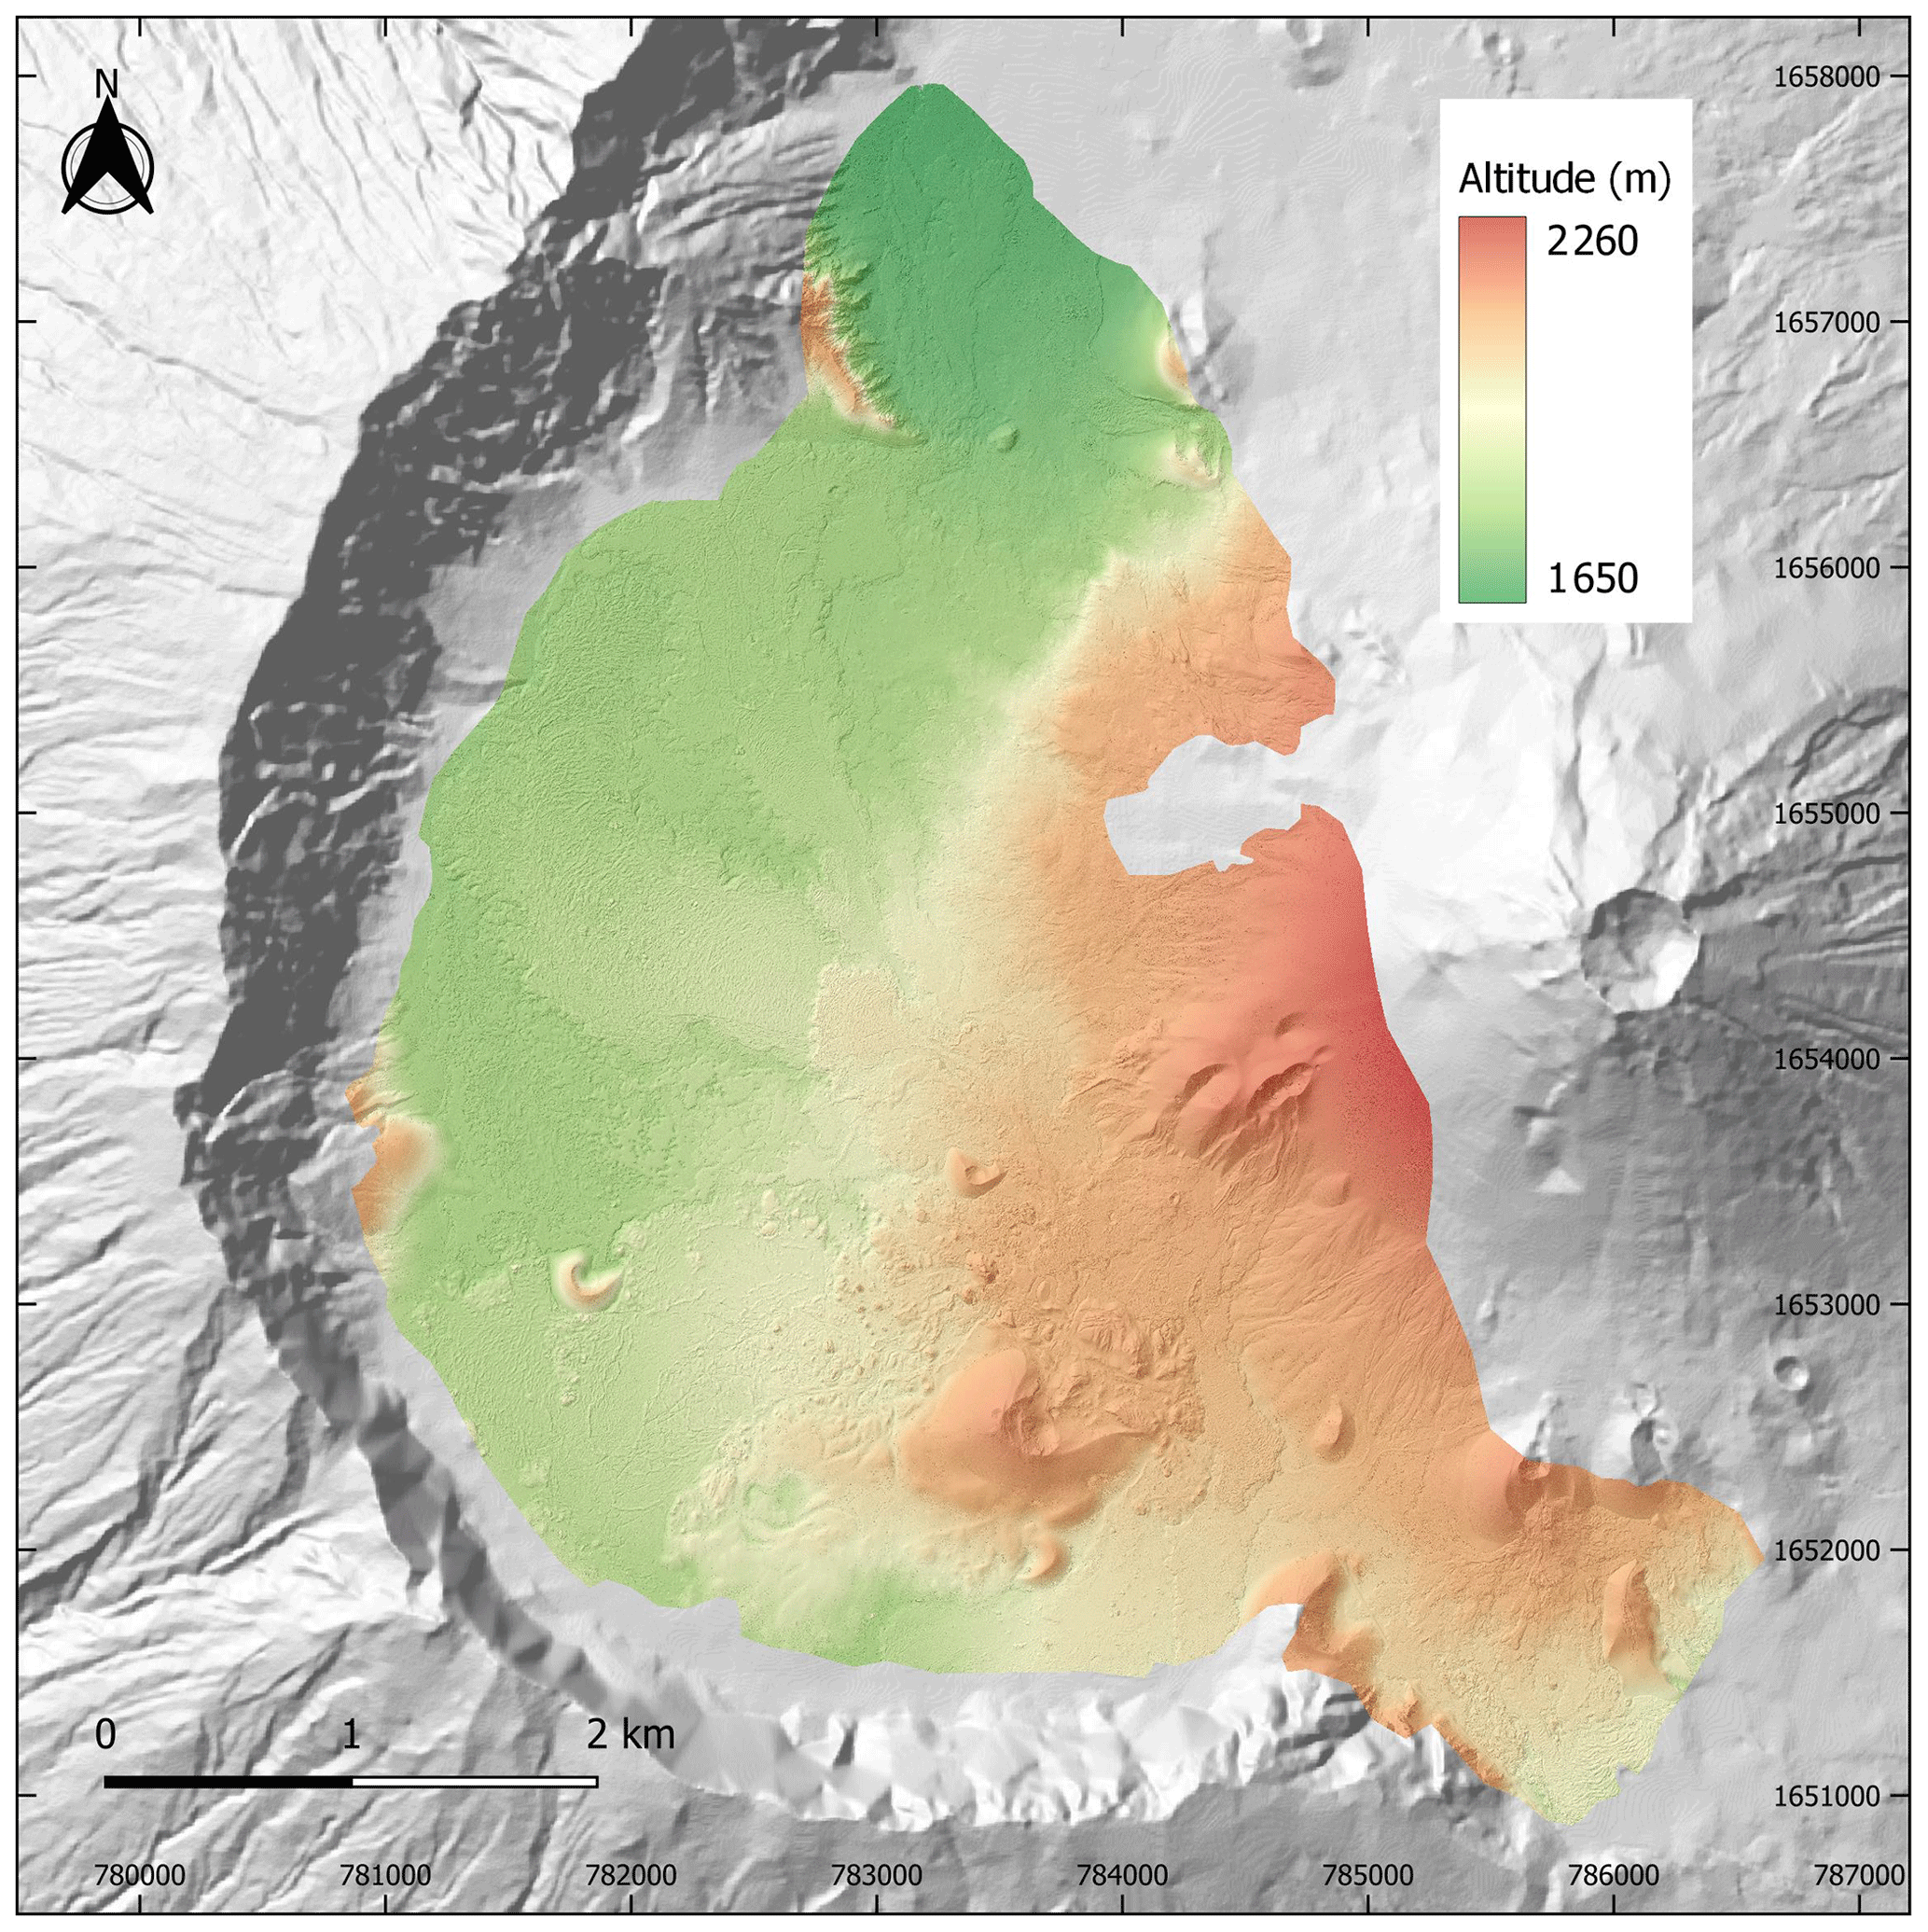
Figure 11Digital surface model of the Chã das Caldeiras with a transparency of the shaded-relief DSM. The surveyed area is overlaying the DEMFI (2010) 5 m DEM.
5.2 Digital surface model
The point cloud interpolation allowed generating DSMs and orthomosaics with 10 and 25 cm/pixel resolutions. In this paper we use the former for visualization purposes, but we recommend, for quantitative analysis, using the digital surface model and orthomosaic with 25 cm/pixel. This approach allows us to keep the root mean square error (RMSE) of the point cloud well below the pixel size (Table 3). The DSMs show very high topographic detail and allow for excellent visualization and quantification of the terrain morphometry (Fig. 11). In order to avoid the use of the areas where the point cloud shows a lower point density, the DSMs were clipped and are smaller than the original point cloud, showing mean point density statistics of 16.8 points m−2 (Table 2 and Figs. 10 and 11).
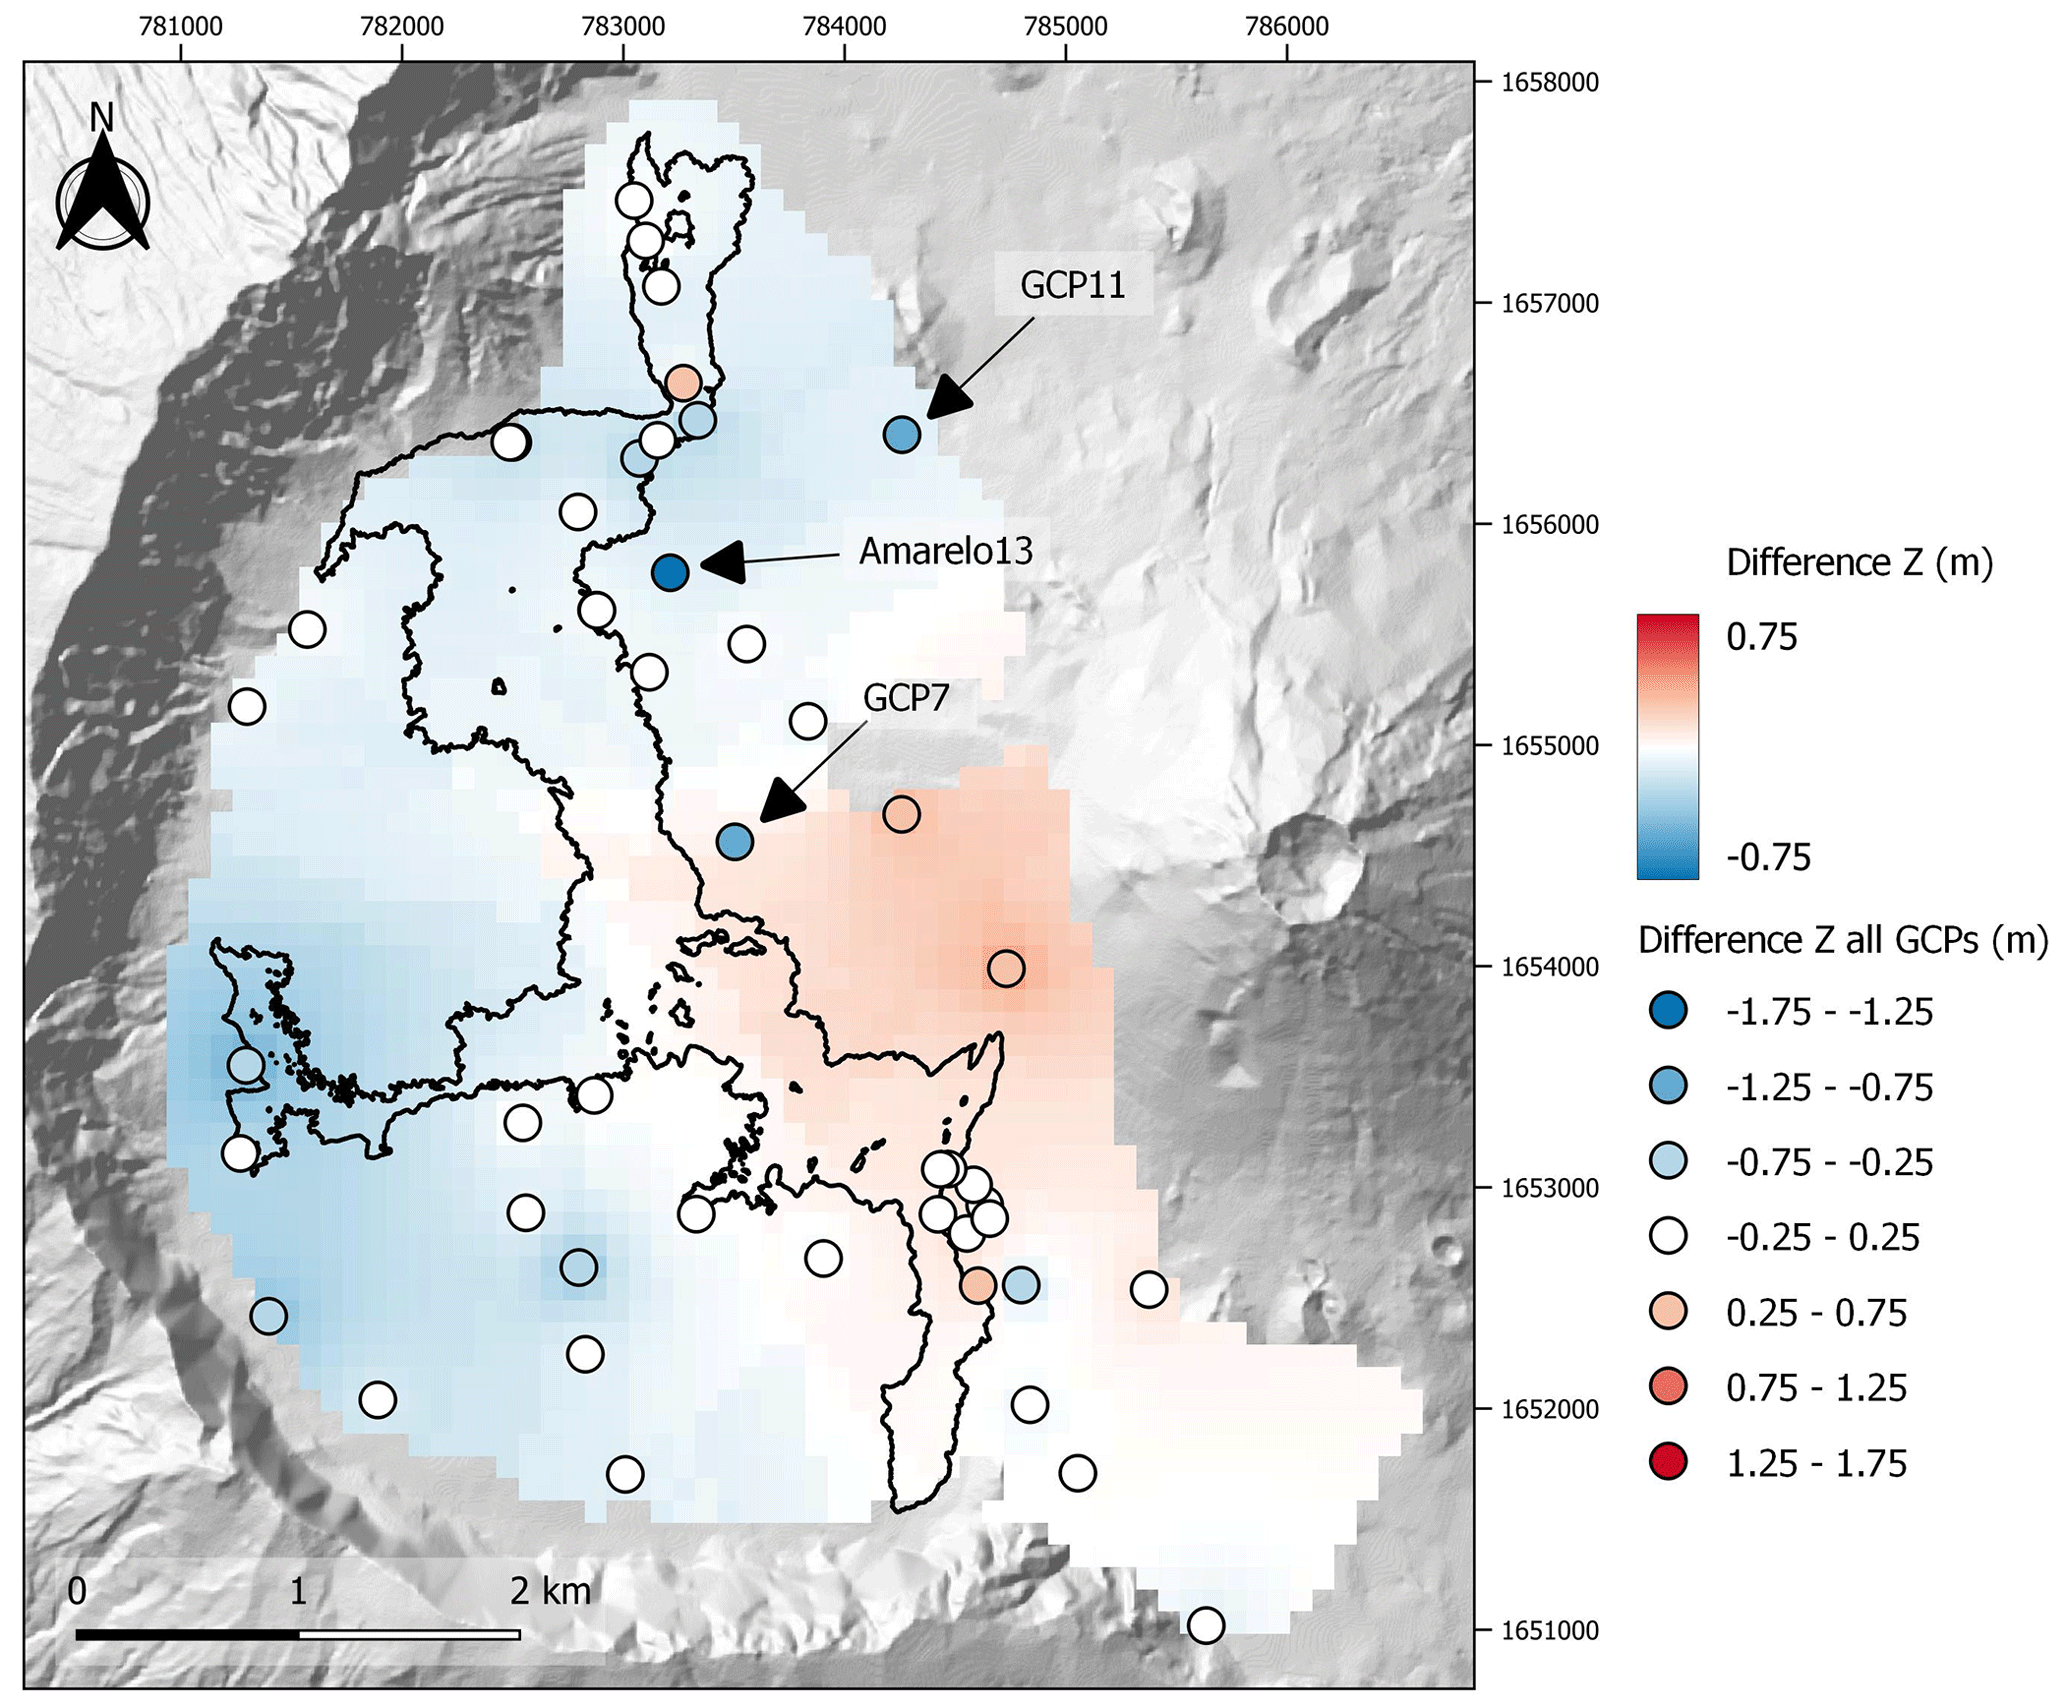
Figure 12Height differences between ground control points and the digital surface model of the Chã das Caldeiras (25 m/pixel). The interpolated surface does not consider the three outliers which were measured on the top edge of built vertical surfaces.
For evaluating the elevation accuracy of the DSMs, elevations were compared with the ground control points obtained with a differential GNSS. The results show a mean height difference of −0.13 m, an RMSE of 0.4 m and a standard deviation of 0.38 m (Table 4). Figure 12 shows the spatial distribution of the differences to the GCPs with three outliers with larger errors indicated with arrows (Amarelo13, GCP7 and GCP11). Amarelo13 and GCP7 were measured at corners in the top of walls, while GCP11 is the top of a large concrete geodetical benchmark. All these points that were accurately marked in the point cloud lay above the topographic surface, which shows a significantly lower value after the interpolation of the DSM. Hence, these GCPs may be removed from the error assessment, since they will result in excess errors. Without the outliers, the mean height difference is −0.06 m, the RMSE is 0.27 m and the standard deviation is 0.26 m (Table 4). The interpolated raster and contours in Fig. 12 show the error surfaces not accounting for the three outliers, revealing the spatial distribution of the error in elevation. Positive errors (DSM higher than the GCPs) occur mainly on the western slope of Pico do Fogo, an area with steep slopes (>15∘) and smooth surfaces. Negative errors show mainly in the western part of the area, closer to the Bordeira wall. The 2014/15 lava flows occupy an area with a mean estimated difference of −0.01 m and a standard deviation of 0.06 m, obtained from the interpolated surface from the GCP difference values. These values should be viewed with care, since there are a small number of GCPs inside the lava flows, with the only ones having been obtained in the north of the Chã das Caldeiras.
Table 4Altitude differences between the digital surface model of the Chã das Caldeiras (25 cm/pixel) and the ground control points measured with the differential GNSS in the field.
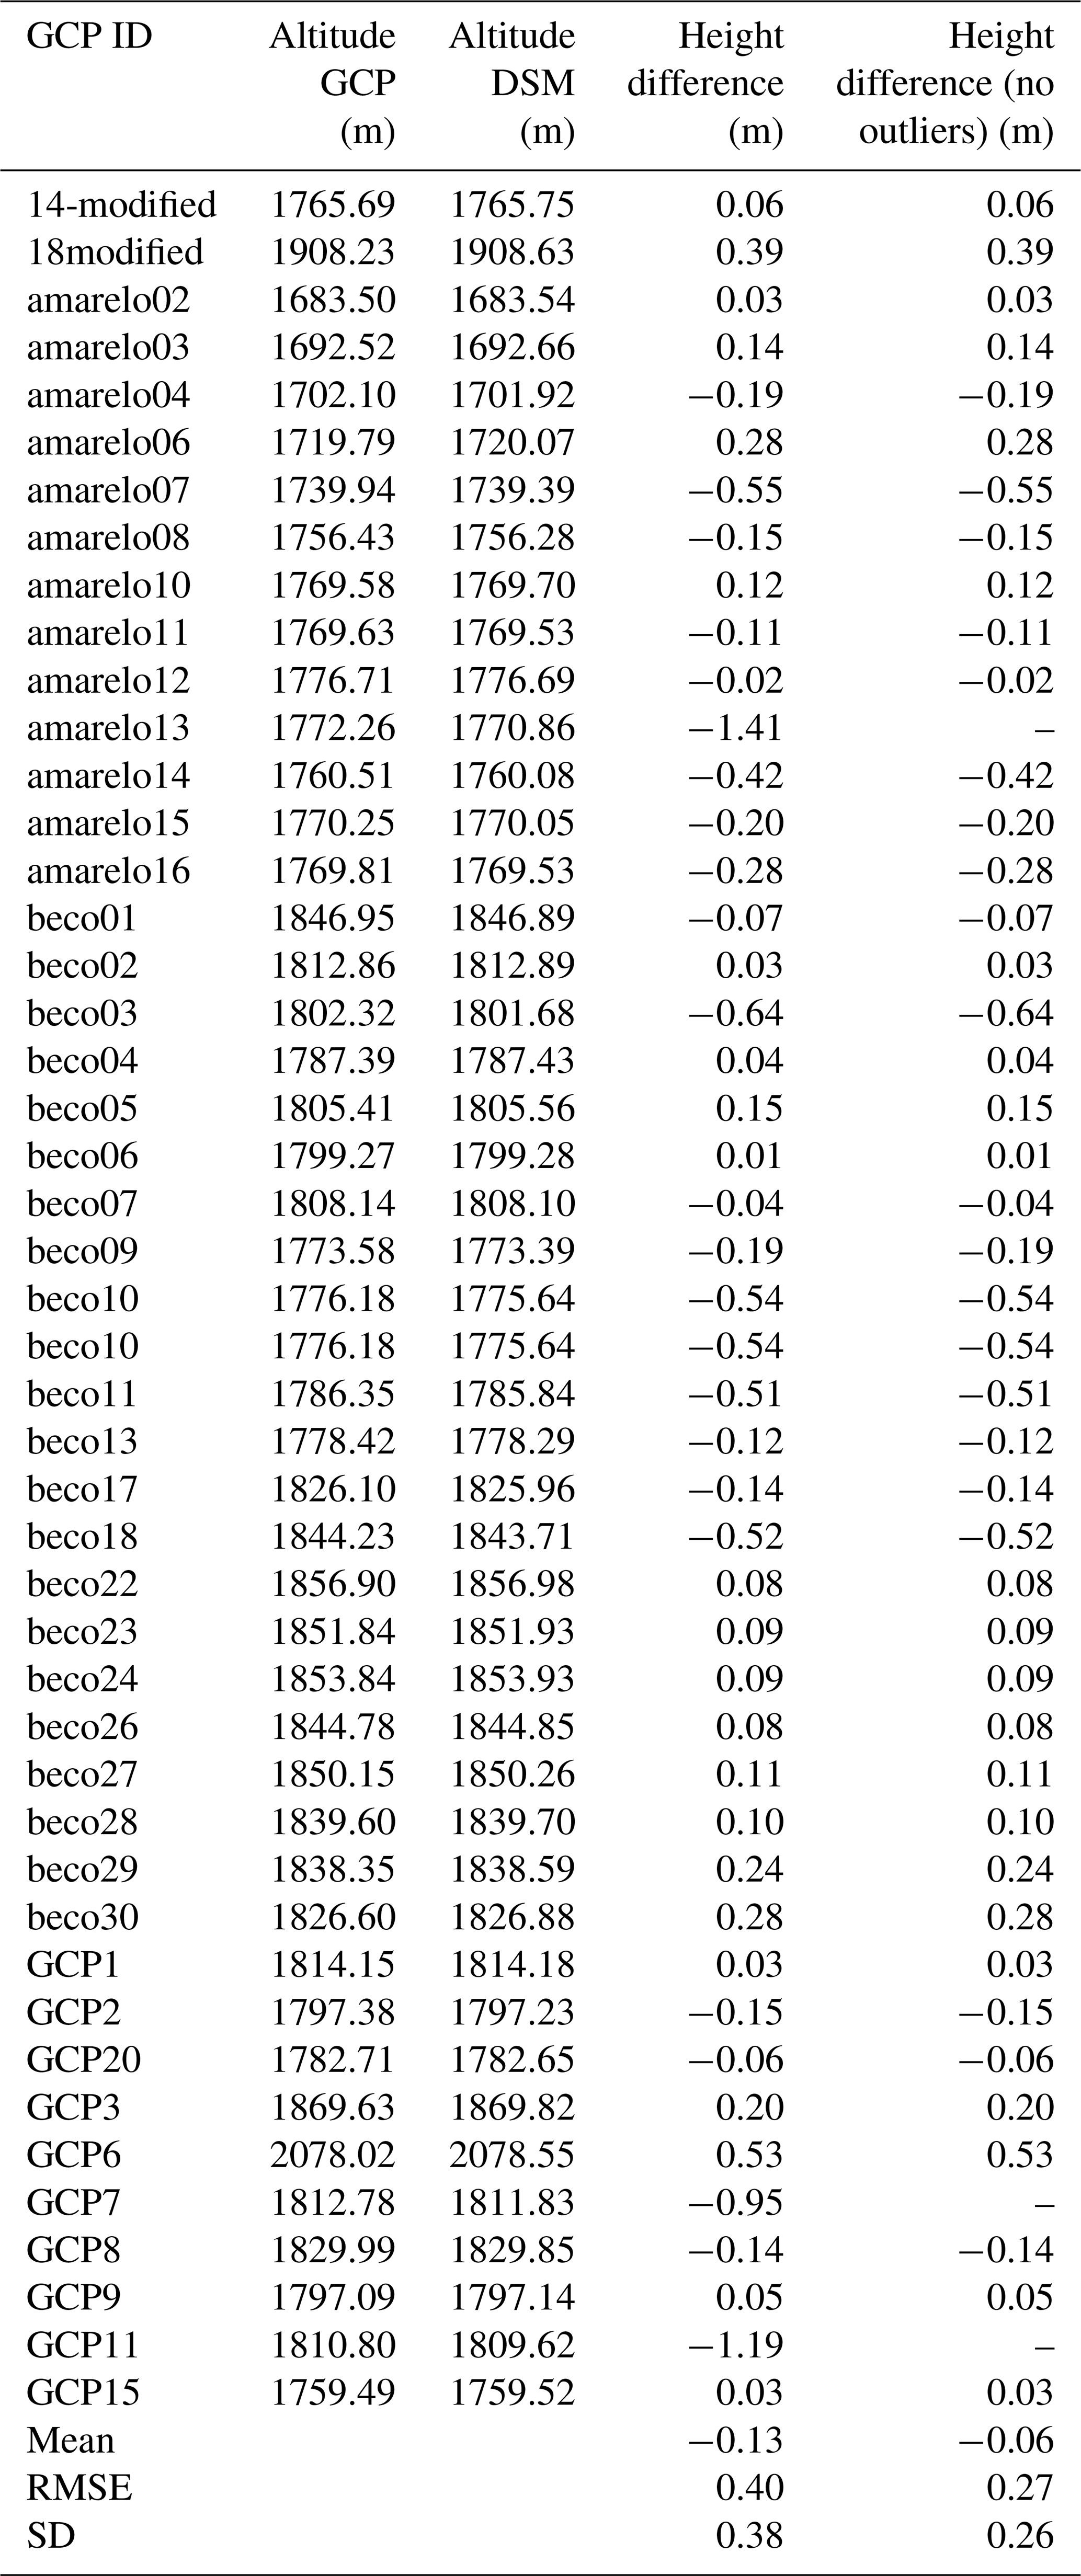
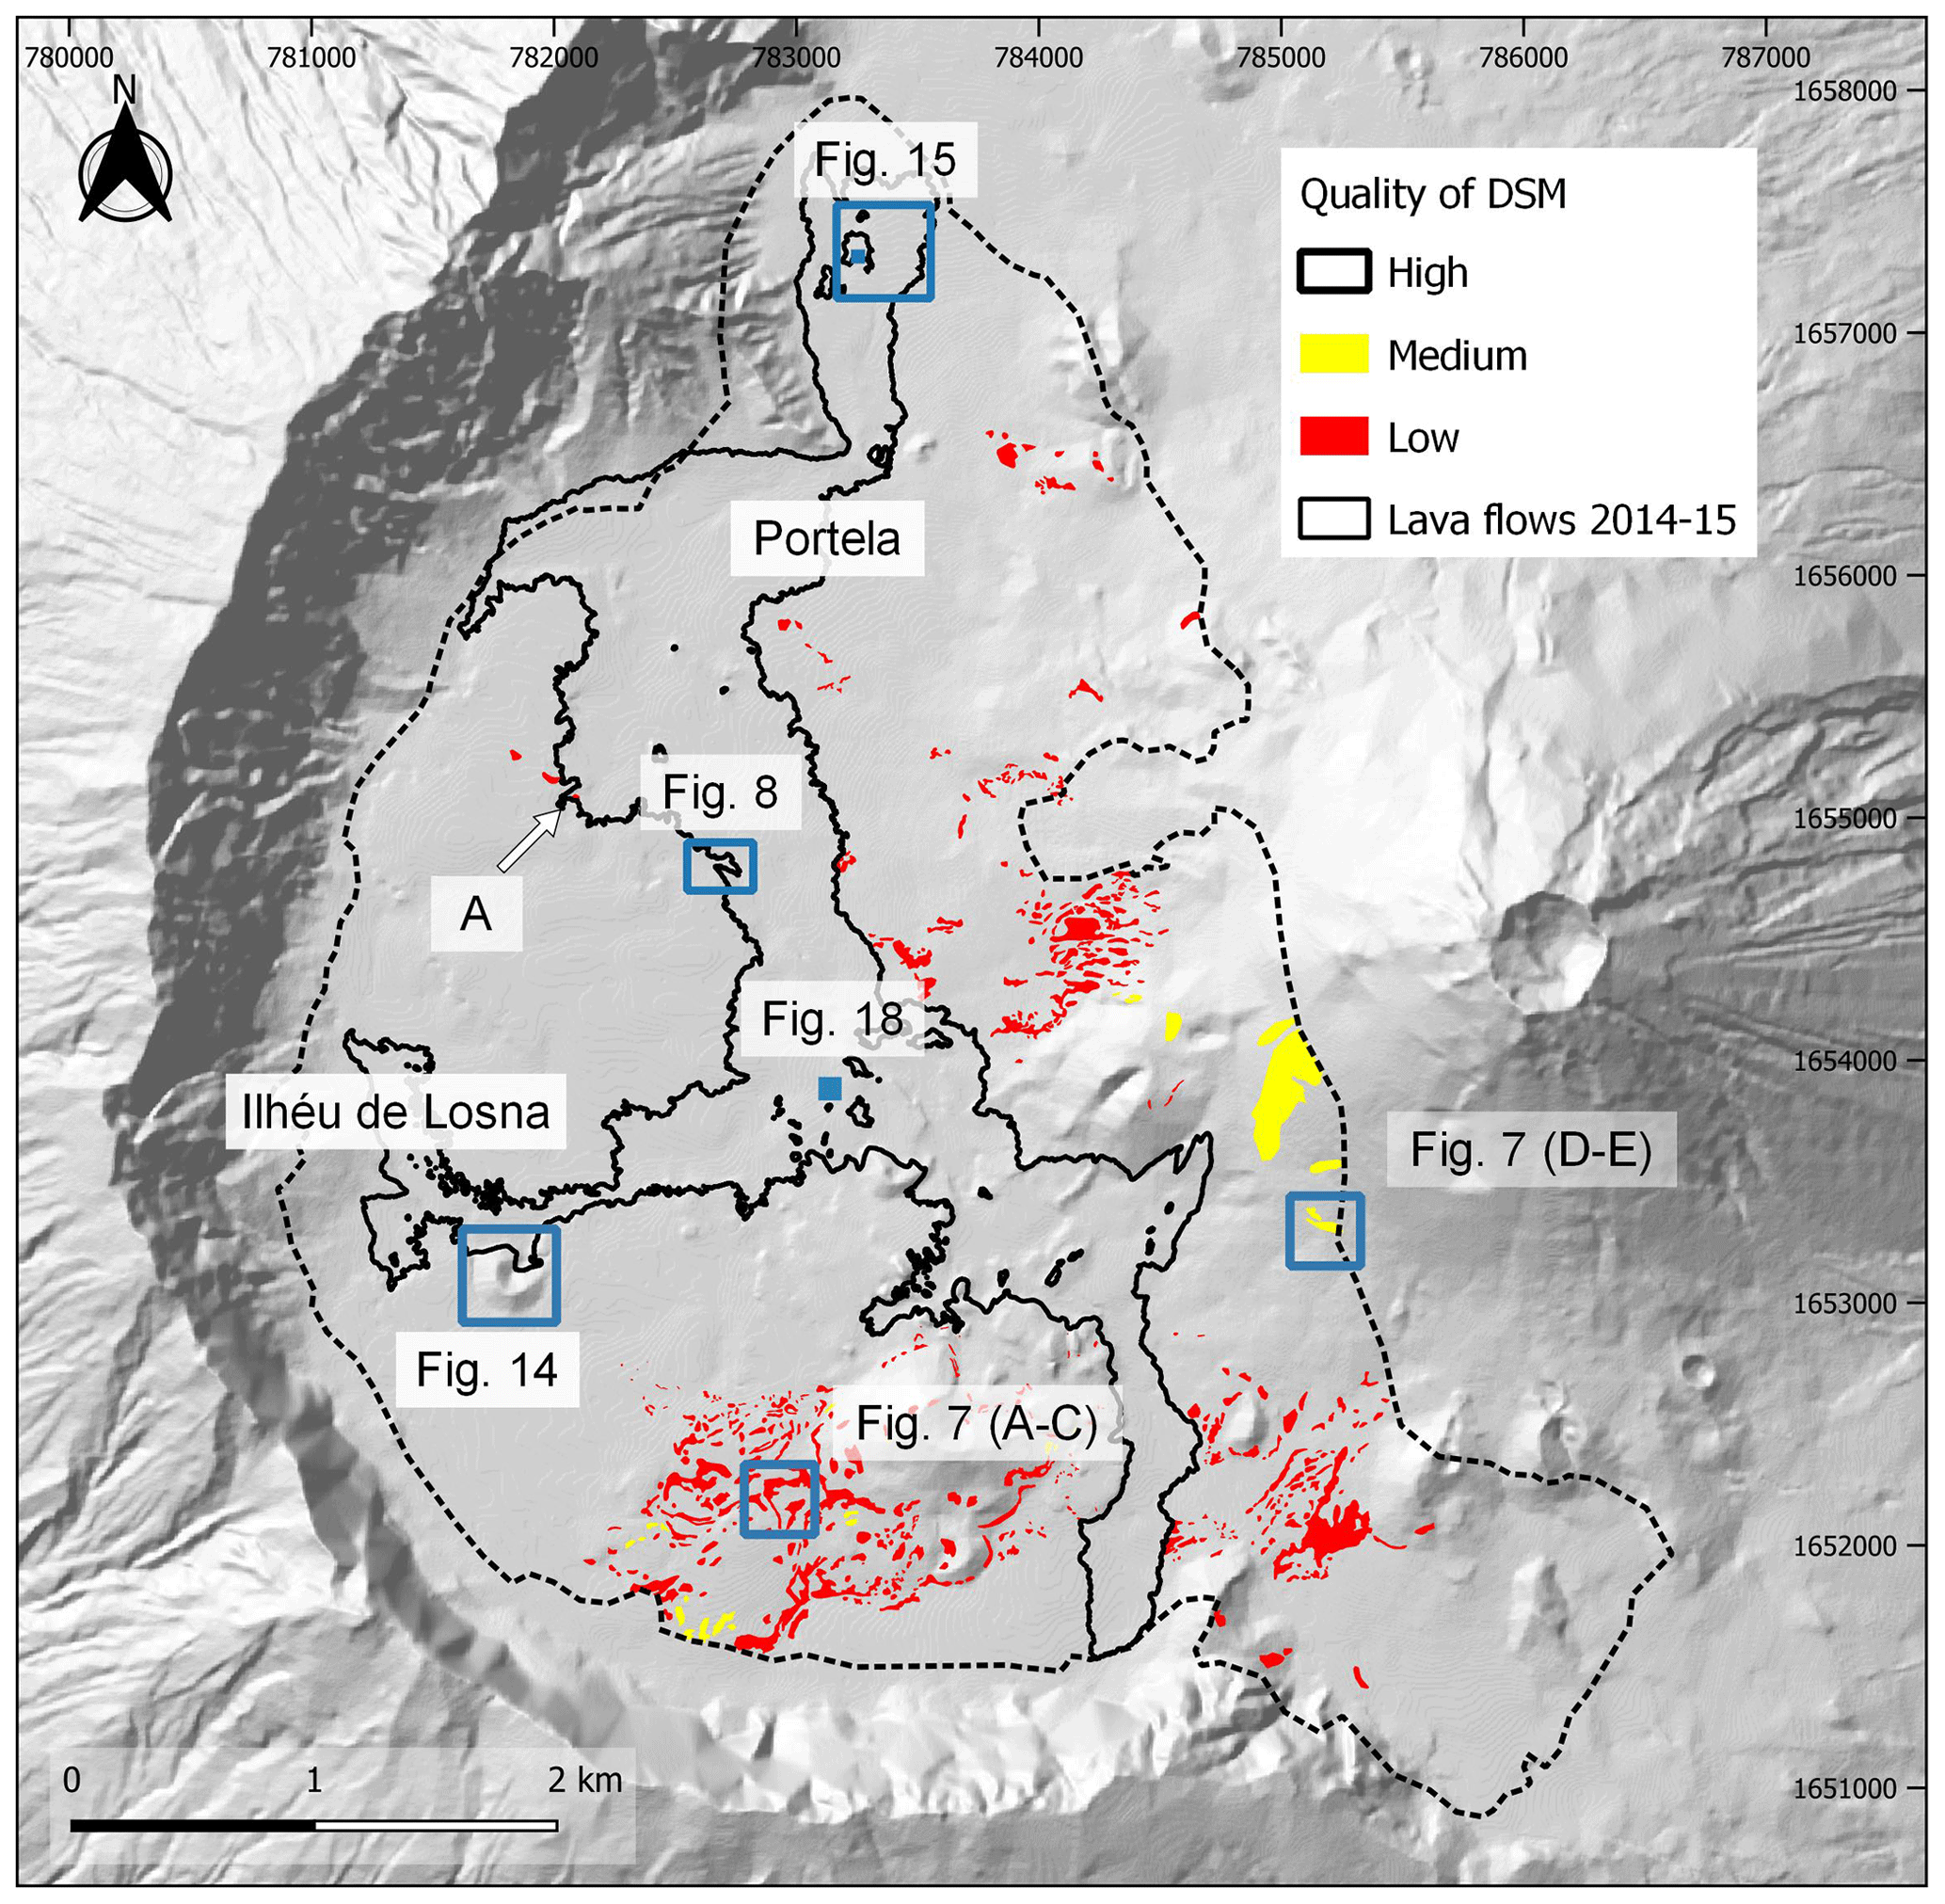
Figure 13Qualitative assessment of the quality of the digital surface model in the Chã das Caldeiras and location of the sectors shown in different figures. The letter A indicates a small sector of the recent lava flow with low quality. Shaded relief outside the surveyed area derived from the DEMFI (2010) 5 m DEM.
The qualitative assessment by visual inspection of the hill shade model and contours derived from the digital surface model allowed for identifying areas of different quality: high-quality zones cover 96.8 % of the entire survey (Fig. 13). These coincide with the areas of rough surfaces with numerous automatic tie points, with the morphology reconstruction being very accurate and the point cloud model showing a high density. The medium-quality zones are sectors dominated by ash and lapilli, where sporadic 3D errors occur, and occupy 0.66 % of the survey. The low-quality zones only occupy 2.64 % of the survey area. These situations occur in very smooth surfaces of ash and lapilli or in sectors where a small number of overlapping aerial photos exist and where the aerial photo resolution is not enough to resolve small features in the terrain. These areas are located mainly at the base of slopes, in concave areas and also at the top of Monte Beco, due to problems of photo coverage.
The 2014/15 lava flows do not show artefacts, except in a very small area of 600 m2 located midway between Portela and Ilhéu de Losna, pointed out in Fig. 13a. This minor problem was due to the lack of overlap among aerial photos, which limited the point cloud generation. Within the recent lava flows, the `a`ā lava flow fields are characterized by high rugosity and numerous features, including blocks, frequent sharp slope changes and pressure ridges, which are easily matched between aerial photographs. The pāhoehoe lava flows show a much smoother and homogeneous surface, but they have frequent fractures and lineaments. They occupy generally small sectors of the orthomosaic and are bound by very rough a'ā lavas, facilitating point matching.
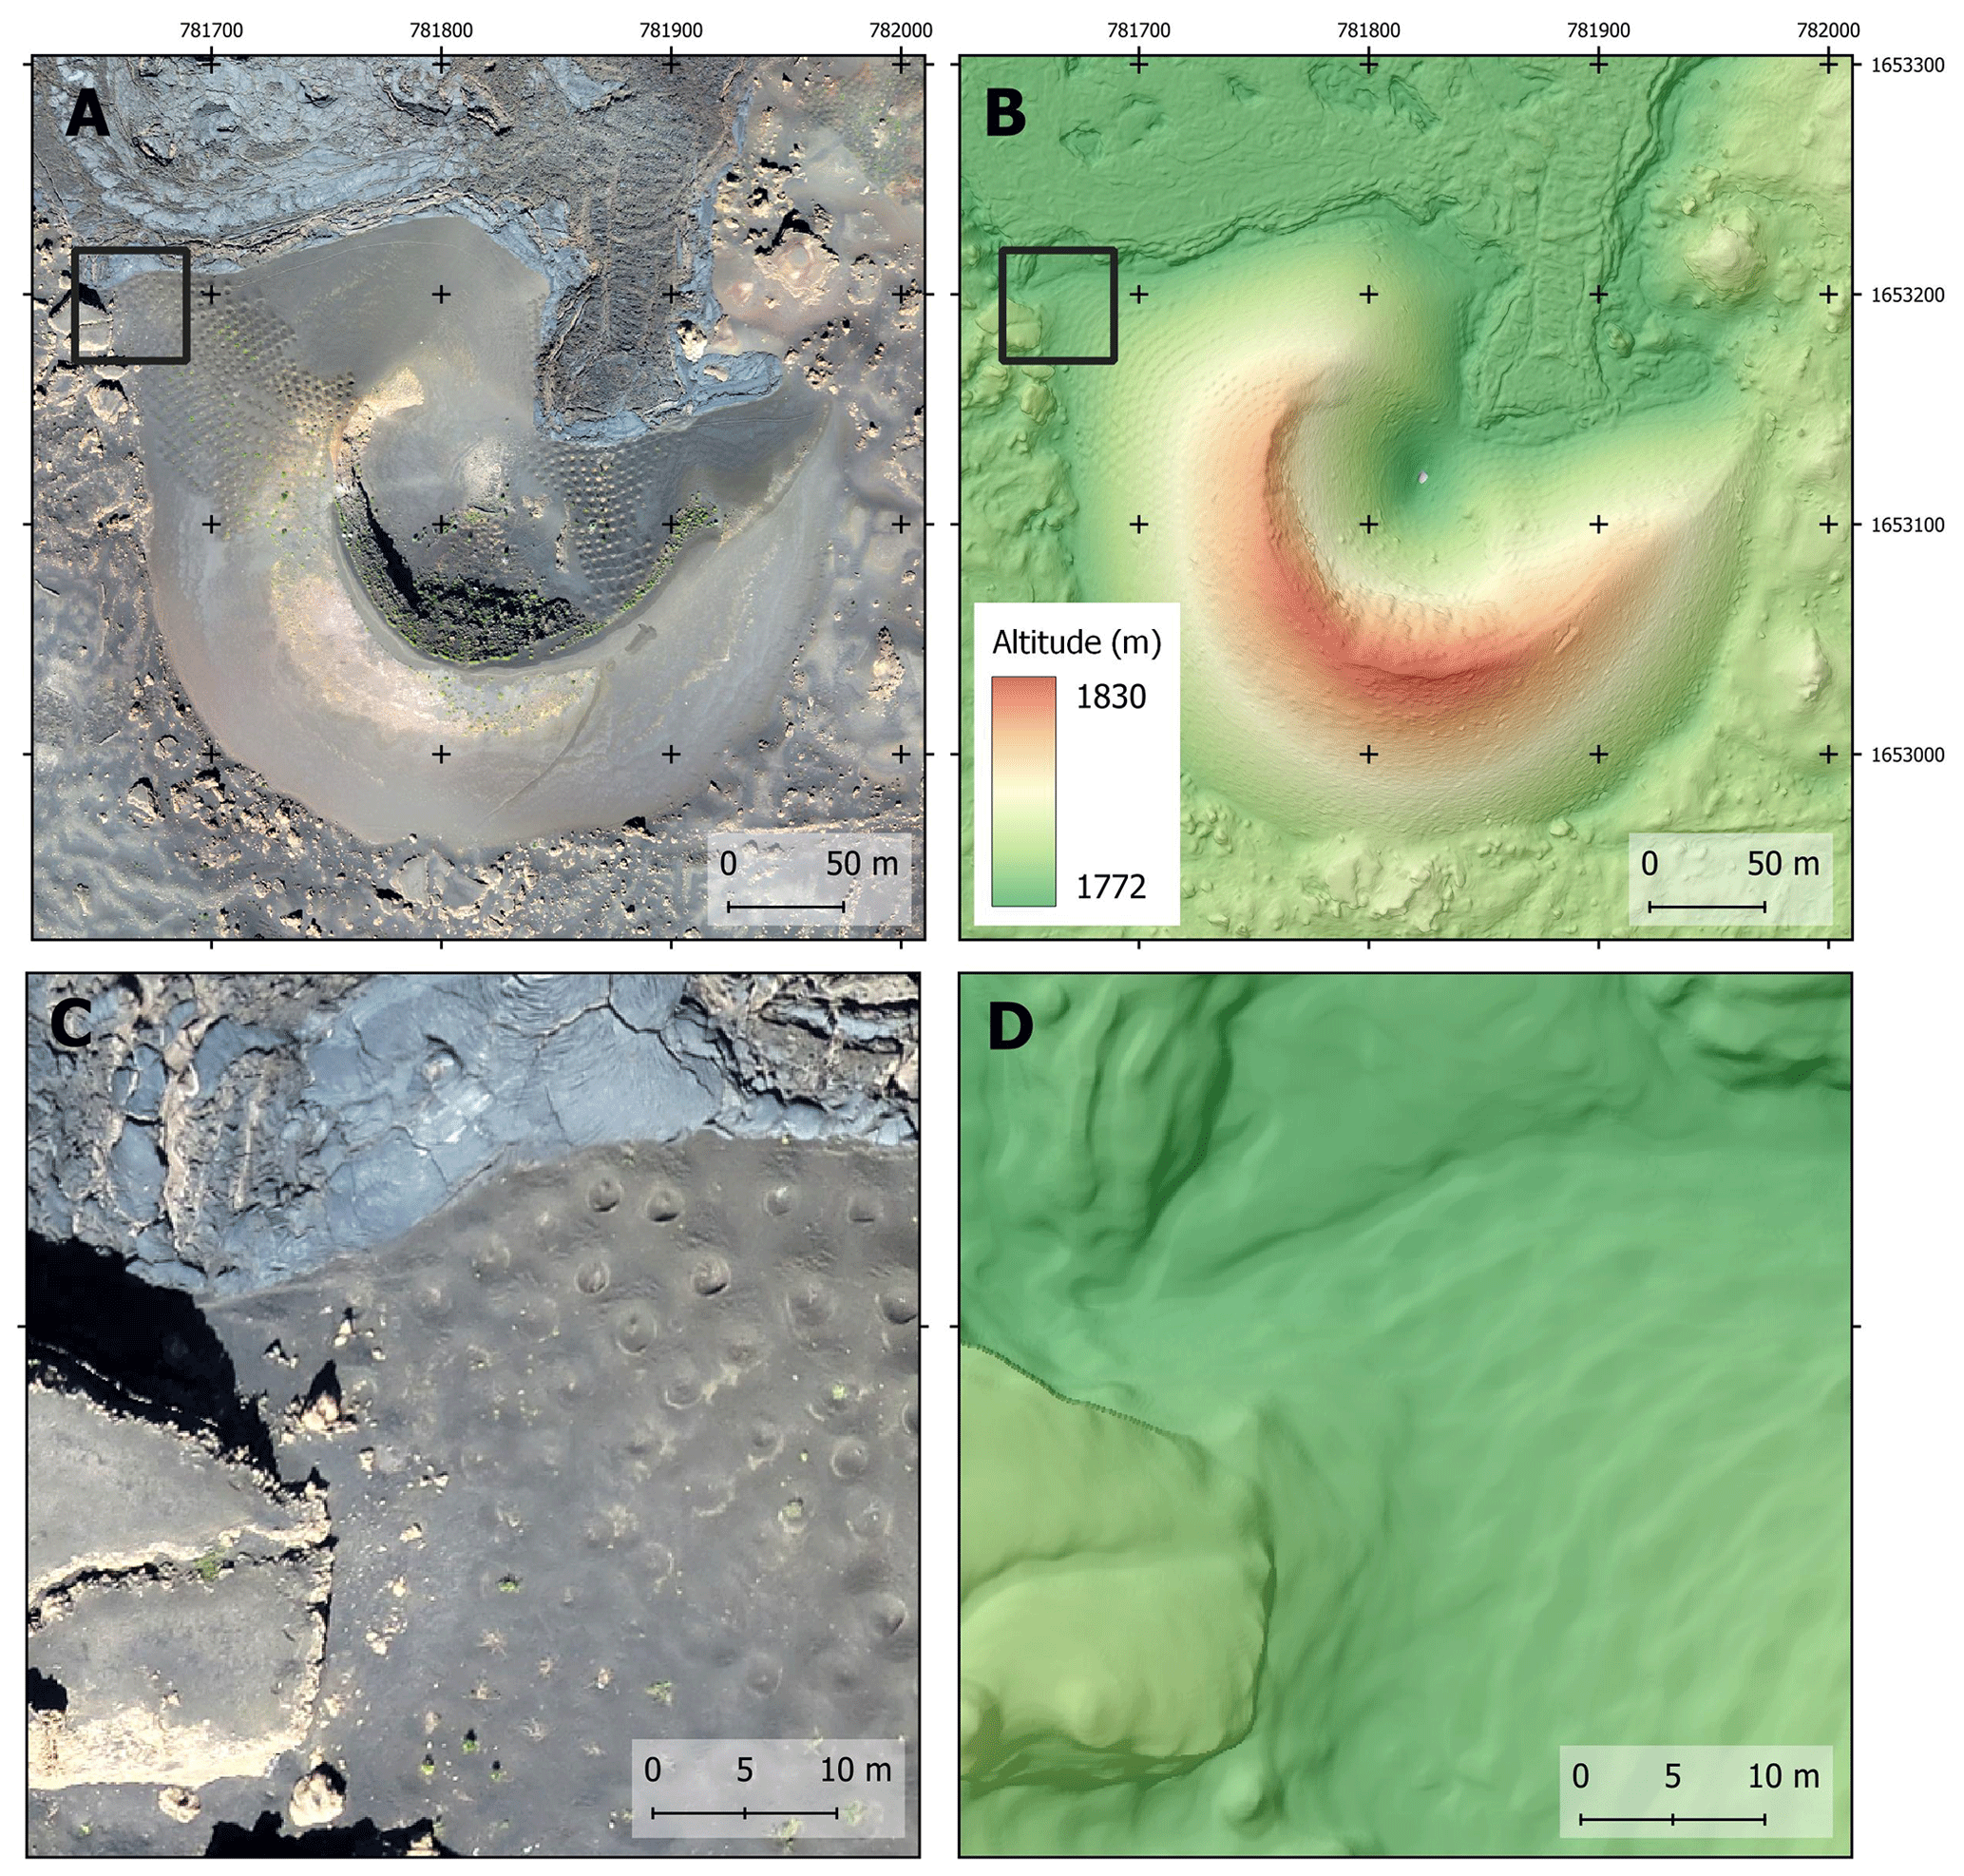
Figure 14Examples of the quality of the orthomosaic and DSM of the Chã das Caldeiras in an area of a small volcanic cone. (a, c) Orthomosaic (10 cm). (b, d) Hill shade model over DSM (10 cm).
Figure 14 shows an example of the resolution and quality of the DSM and orthomosaic. Areas with rough surfaces, such as the small volcanic cones represented, show very high quality results. The area shows a volcanic cone, a pāhoehoe lava flow in the NW sector and an `a`ā lava flow in the central part (Fig. 13a and b). The magnified sector in Fig. 14c and d shows a large boulder and a gentle slope with small holes dug to cultivate vines, as well as other small trees, which are very well represented in the DSM.
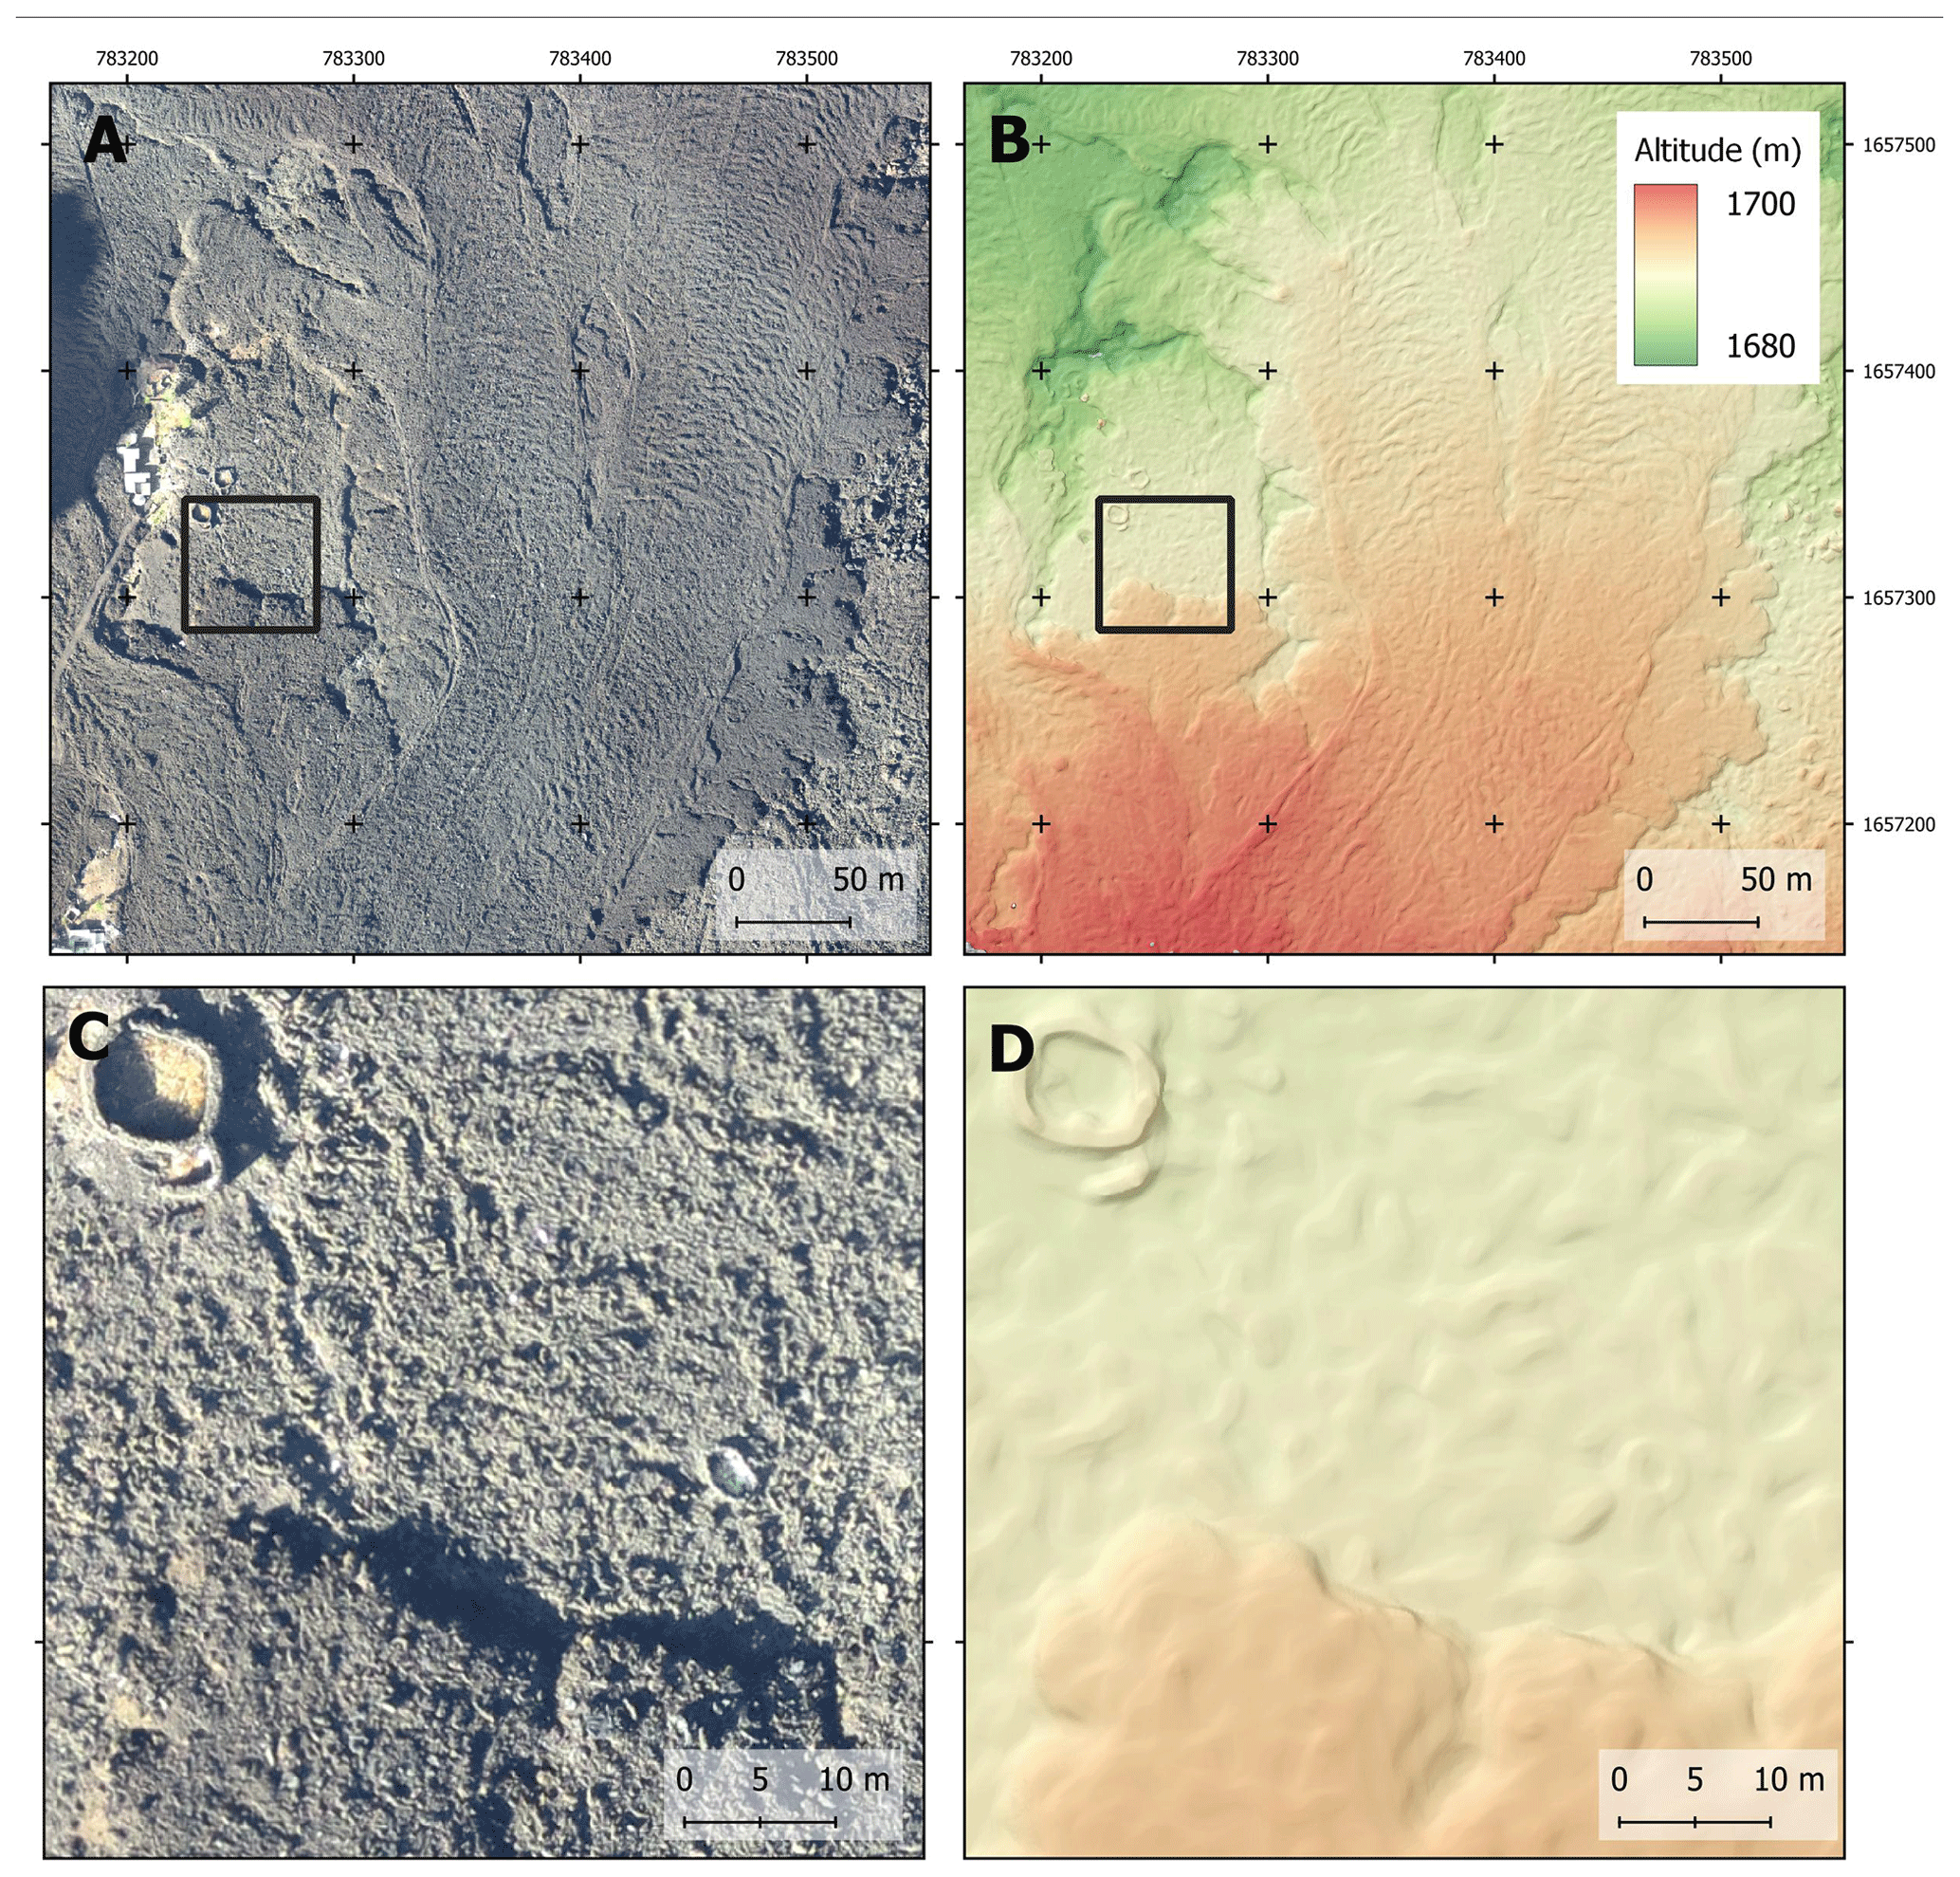
Figure 15Examples of the quality of the orthomosaic and DSM of the Chã das Caldeiras in an area of an `a`ā lava flow, showing also a circular wall structure. (a, c) Orthomosaic (10 cm). (b, d) Hill shade model over DSM (10 cm).
Figure 15 shows the `a`ā lava flows of 2014/15 close to the village of Portela at two magnifications. It is possible to depict the quality of the survey by viewing the representation of the circular wall structure, as well as the front of the lava lobe present in Fig. 15c and d.

Figure 16Digital orthophoto mosaic with a 25 cm resolution of the Chã das Caldeiras. The striping results from illumination problems, and the artefact in the south is a shadow from the Bordeira wall. The shaded relief outside the surveyed area is derived from the DEMFI (2010) 5 m DEM.
5.3 Orthophoto mosaic
The digital orthophoto mosaic is presented at 10 and 25 cm/pixel resolutions (Fig. 16). It is especially useful for accurate analysis and mapping at a high resolution of small areas. However, when analysed as a whole it shows some problems associated with shadow effects close to the Bordeira wall in the south of the Chã das Caldeiras and with varying illumination conditions in the lava flows of the northwest part of the survey, where striping occurs. These problems only affect the orthomosaic and do not generate changes in quality in the DSM. The sectors with medium quality in the point cloud do not affect the overall quality of the orthomosaic, but areas of low quality may result in small geometrical inaccuracies. This occurs in the areas with very homogeneous ash and lapilli surfaces, and the dataset with indication of the quality zones should be checked when detailed analysis is needed.
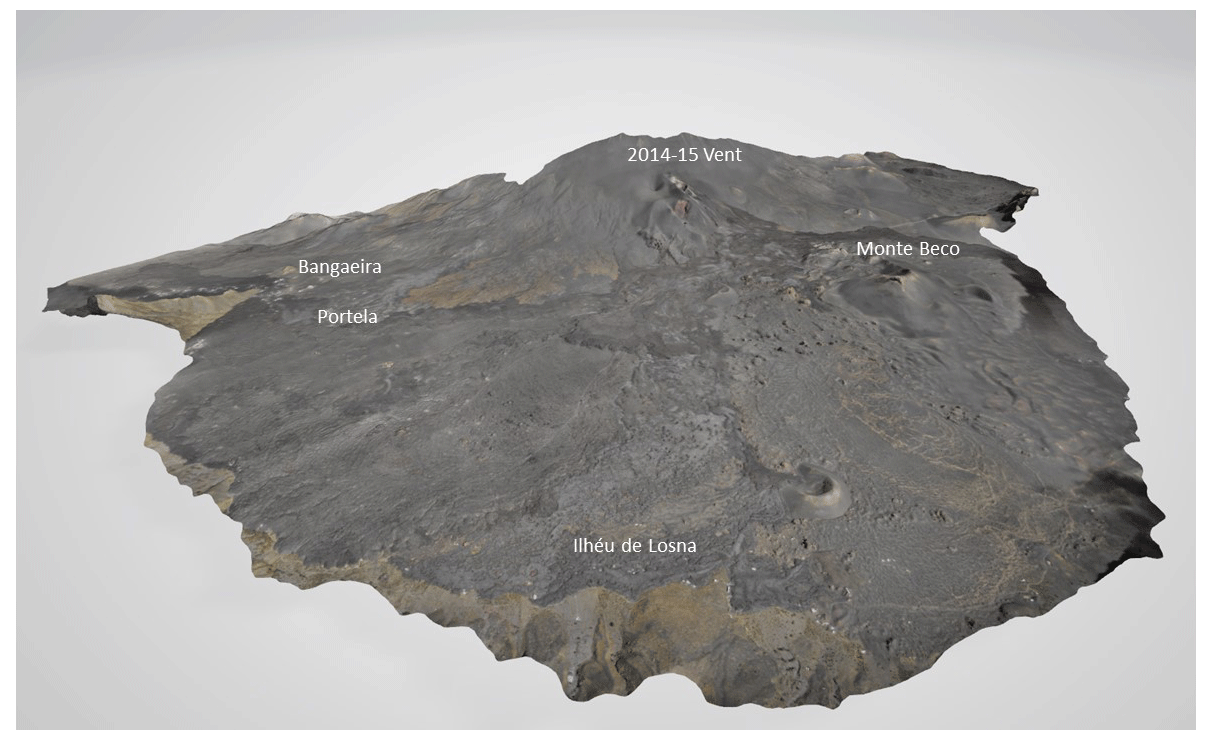
Figure 17A 3D visualization of the texture mesh of the Chã das Caldeiras from Ilhéu de Losna towards the east.

Figure 18Example of kīpukas (islands of pre-eruption material surrounded by lava) that have been identified in the present lava delineation, influencing the area estimates when compared to work from other authors. (a) Orthomosaic and (b) hill shade model over the DSM.
5.4 3D models for visualization
A 3D texture mesh (fbx) was produced for visualization purposes, allowing for the accurate visualization of the surveyed area (Fig. 17). The file is available in the dataset.
5.5 New estimates of the 2014/15 lava flow field area
The accuracy of the present survey allowed the calculation of a new 2D projected area for the delineation of the 2014/15 lava flow field. The calculated area is 4.53 km2, a number smaller than the areas calculated by other authors using coarser resolution data, which varied from 4.8 (Bagnardi et al., 2016) to 4.97 km2 (Bignami et al., 2020) (5.8 % to 8.9 %). This difference may be explained by the higher spatial resolution of our dataset that allows more accurate delineations, identifying in addition several kīpukas (Fig. 18), and also by the spatial variation effect (Chen, 1999) that results from the computation of the same areas in products with different spatial resolutions.
The data are available at Zenodo: https://doi.org/10.5281/zenodo.4718520 (Vieira et al., 2021).
The dataset consists of the following files:
-
cha_caldeiras_3d_mesh.fbx, 3D mesh in fbx format;
-
cha_caldeiras_contours_50cm.zip, compressed shapefile (shp) and auxiliary files, contour lines of the Chã das Caldeiras in December 2016 with 50 cm equidistance, interpolated from the digital surface model, CRS – EPSG:32626 WGS 84/UTM Zone 26N, elevation – ellipsoidal ITRF2014 (WGS 84);
-
cha_caldeiras_dsm_10cm_v2.zip, compressed GeoTIFF file, digital surface model of the Chã das Caldeiras in December 2016 with a 10 cm resolution, CRS – EPSG:32626 WGS 84/UTM Zone 26N, elevation – ellipsoidal ITRF2014 (WGS 84);
-
cha_caldeiras_dsm_25cm_v2.zip, compressed GeoTIFF file, digital surface model of the Chã das Caldeiras in December 2016 with a 25 cm resolution, CRS – EPSG:32626 WGS 84/UTM Zone 26N, elevation – ellipsoidal ITRF2014 (WGS 84);
-
cha_caldeiras_checkpoints.zip, compressed shapefile (shp) and auxiliary files, coordinates of the ground control points not included in the modelling and used as checkpoints for accuracy assessment, CRS – EPSG:32626 WGS 84/UTM Zone 26N;
-
cha_caldeiras_densified_point_cloud.zip, compressed densified point cloud file (las), CRS – EPSG:32626 WGS 84/UTM Zone 26N;
-
cha_caldeiras_error_assessment_areas_v2.zip compressed shapefile (shp) and auxiliary files, areas with errors in the point cloud obtained by visual analysis, 1 – low accuracy, 2 – moderate accuracy, CRS – EPSG:32626 WGS 84/UTM Zone 26N;
-
cha_caldeiras_gcps.zip, compressed shapefile (shp) and auxiliary files, coordinates of the ground control points used to georeference the model, CRS – EPSG:32626 WGS 84/UTM Zone 26N;
-
cha_caldeiras_ortho_10cm_v2.zip, compressed GeoTIFF file, RGB orthomosaic of the Chã das Caldeiras in December 2016 with a 10 cm resolution, CRS – EPSG:32626 WGS 84/UTM Zone 26N, elevation – ellipsoidal ITRF2014 (WGS 84);
-
cha_caldeiras_ortho_25cm_v2.tif, RGB orthomosaic of the Chã das Caldeiras in December 2016 with a 25 cm resolution, CRS – EPSG:32626 WGS 84/UTM Zone 26N;
-
cha_caldeiras_pix4d_report.pdf, report of the processing of the aerial imagery in Pix4D;
-
ebee_fogo_projetos.zip, compressed Pix4D project files (p4d) with the full aerial imagery of the surveys in the Chã das Caldeiras;
-
lava-2014-15.zip, compressed shapefile (shp) and auxiliary files, lava flows of the eruption of 2014/15 digitized from the original 10 cm resolution orthomosaic, CRS – EPSG:32626 WGS 84/UTM Zone 26N.
The 23.9 km2 very high resolution digital surface model and orthophoto mosaic of the Chã das Caldeiras lava fields developed from UAV surveys of December 2016 show very high detail and accuracy, with a resolution of 25 cm and RMSE of 10.3 cm. The original models at a 10 cm resolution and the imagery dataset are also made publicly available. Of the survey area, 96.8 % has provided a very high quality DSM, which due to the scarcity of vegetation and built-up areas may be used as a DEM. The areas with moderate problems occupy 0.6 % of the survey, with only 2.6 % of the area showing poor quality. The sectors with problems in the point cloud and DSM are those associated with very homogeneous ash and lapilli deposits. These areas can be easily masked out of the DSM by using the shapefiles made available in the dataset. The rough surface `a`ā lavas and the smooth pāhoehoe flows, as well as the volcanic cones, are very accurately determined.
The resulting DSM and orthomosaic constitute base datasets of high value for Earth system science, e.g. for lava flow modelling; as a baseline for future eruptive activity; for studying hydrological changes and ecological recolonization of lava flows; and for planning and risk mitigation. The products allow for accurately delineating the borders between different surfaces (lava types and other classes) and perceiving sub-metre surface features, which is less accurate or not achievable at all at a metre scale, over an area of several square kilometres. These features include pressure ridges, tumuli, flow channels, levees, dragged blocks and remains of human structures, among other smaller features such as vegetation. These highly detailed products can play a relevant role in the assessment of volcanic hazards and related research.
GV, CM, PP and RR prepared the UAV survey planning and wrote the manuscript. GV and CM conducted the UAV surveys. PP and RR handled the GNSS GCP collection. GV and CM performed the modelling. RR digitized the lava flows. RF coordinated the GNSS activities. All authors contributed to discussion and review of the manuscript.
The authors declare that they have no conflict of interest.
Publisher's note: Copernicus Publications remains neutral with regard to jurisdictional claims in published maps and institutional affiliations.
This research was conducted in the framework of the project FIRE – Fogo Island Volcano: multidisciplinary research on the 2014 eruption (FCT – PTDC/GEO-GEO/1123/2014) – funded by the Fundação para a Ciência e a Tecnologia. Ricardo Ramalho acknowledges his IF/01641/2015 contract funded by FCT. The project 3D Antártida funded the acquisition of the UAV. The INGT – Instituto Nacional de Gestão do Território – and INMG – Instituto Nacional de Meteorologia e Geofísica de Cabo Verde – are thanked for their cooperation. Pedro Almeida, Carla Candeias, Stéphanie Dumont, Bento Martins and Carlos Oliveira are thanked for their support in the collection of ground control points. Carlos Oliveira, Bruno Faria, Euda Miranda, Fátima Fernandes and Jair Rodrigues are thanked for their support to the project and field activities. Co-funding was given by FCT I.P. – UIDB/00295/2020 – CEG , FCT I.P. – UIDP/00295/2020 – CEG, FCT I.P. – UIDB/50019/2020 – IDL, and C4G – POCI-01-0145-FEDER-02215. The reviews by the referees Bianca Wagner, Moritz Kirsch, Pablo J. Gonzalez and Samuel Thiele and the public interactive comment by Gaia Stucky de Quay provided very welcome and thorough reviews of the original manuscript, which significantly contributed to its final form. We thank them for the detailed commentaries.
This research has been supported by the Fundação para a Ciência e a Tecnologia (grant nos. PTDC/GEO-GEO/1123/2014, UIDB/00295/2020 – CEG, UIDP/00295/2020 – CEG, UIDB/50019/2020 – IDL, and C4G – POCI-01-0145-FEDER-02215).
This paper was edited by Jens Klump and reviewed by Samuel Thiele, Moritz Kirsch, Bianca Wagner and Pablo J. Gonzalez.
Bagnardi, M., González, P. J., and Hooper, A.: High-resolution digital elevation model from tri-stereo Pleiades-1 satellite imagery for lava flow volume estimates at Fogo volcano: tri-stereo Pleiades DEM of Fogo volcano, Geophys. Res. Lett., 43, 6267–6275, https://doi.org/10.1002/2016GL069457, 2016.
Baldi, P., Bonvalot, S., Briole, P., Coltelli, M., Gwinner, K., Marsella, M., Puglisi, G., and Rémy, D.: Validation and comparison of different techniques for the derivation of digital elevation models and volcanic monitoring (Vulcano Island, Italy), Int. J. Remote Sens., 23, 4783–4800. https://doi.org/10.1080/01431160110115861, 2002.
Barrett, R., Lebas, E., Ramalho, R., Klaucke, I., Kutterolf, S., Klügel, A., Lindhorst, K., Gross, F., and Krastel, S.: Revisiting the tsunamigenic volcanic flank-collapse of Fogo Island in the Cape Verdes, offshore West Africam Geological Society, London, Special Publications, 500, 13–26, https://doi.org/10.1144/SP500-2019-187, 2019.
Bebiano, J.: A geologia do arquipélago de Cabo Verde, Comunicações dos Serviços Geológicos de Portugal, 18, 167–187, 1932.
Bignami, C., Chini, M., Amici, S., and Trasatti E.: Synergic use of multi-sensor satellite data for volcanic hazards monitoring: the Fogo (Cape Verde) 2014-2015 effusive eruption, Frontiers of Earth Science, 8, 22, https://doi.org/10.3389/feart.2020.00022, 2020.
Brum da Silveira, A., Madeira, J., and Serralheiro, A.: A estrutura da Ilha do Fogo, Cabo Verde. A Erupção Vulcânica de 1995 na Ilha do Fogo, Cabo Verde, Publ. IICT, Lisboa, 63–78, 1997a.
Brum da Silveira, A., Madeira, J., Serralheiro, A., Torres, P. C., Silva, L. C., and Mendes, M. H.: O controlo estrutural da erupção de Abril de 1995 na Ilha do Fogo, Cabo Verde. A Erupção Vulcânica de 1995 na Ilha do Fogo, Cabo Verde, Publ. IICT, Lisboa, 51–61, 1997b.
Burke, K. and Wilson, J. T.: Is the African plate stationary?, Nature, 239, 5372, 387-390, https://doi.org/10.1038/239387b0, 1972.
Cappello, A., Ganci, G., Calvari, S., Pérez, N. M., Hernández, P. A., Silva, S. V., Cabral, J., and Negro, C. D.: Lava flow hazard modeling during the 2014–2015 Fogo eruption, Cape Verde, J. Geophys. Res.-Sol. Ea., 121, 2290–2303, https://doi.org/10.1002/2015JB012666, 2016.
Chen, J. M.: Spatial scaling of a remotely sensed surface parameter by contexture, Remote Sens. Environ., 69, 30–42, https://doi.org/10.1016/S0034-4257(99)00006-1, 1999.
Day, S. J., Heleno, S. I. N., and Fonseca, J. F. B. D.: A past giant lateral collapse and present-day flank instability of Fogo, Cape Verde Islands, J. Volcanol. Geoth. Res., 94, 191-218, https://doi.org/10.1016/S0377-0273(99)00103-1, 1999.
DEMFI: Digital Elevation Model of Fogo Island at 1 : 5000 scale, Unidade de Coordenação do Cadastro Predial (UCCP) do Ministério do Ambiente Habitação e Ordenamento do Território (MAHOT), Cabo Verde, 2010.
Dering, G. M., Micklethwaite, S., Thiele, S. T., Vollgger, S. A., and Cruden, A. R.: Review of drones, photogrammetry and emerging sensor technology for the study of dykes: Best practises and future potential, J. Volcanol. Geoth. Res., 373, 148–166, https://doi.org/10.1016/j.jvolgeores.2019.01.018, 2019.
Diefenbach, A. K., Bull, K. F., Wessels, R. L., and McGimsey, R. G.: Photogrammetric monitoring of lava dome growth during the 2009 eruption of Redoubt Volcano, J. Volcanol. Geoth. Res., 259, 308–316, https://doi.org/10.1016/j.jvolgeores.2011.12.009, 2013.
Eisele, S., Reißig, S., Freundt, A., Kutterolf, S., Nürnberg, D., Wang, K. L., and Kwasnitschka, T.: Pleistocene to Holocene offshore tephrostratigraphy of highly explosive eruptions from the southwestern Cape Verde Archipelago, Mar. Geol., 369, 233-250, https://doi.org/10.1016/j.margeo.2015.09.006, 2015.
Faria, B. and Fonseca, J. F. B. D.: Investigating volcanic hazard in Cape Verde Islands through geophysical monitoring: network description and first results, Nat. Hazards Earth Syst. Sci., 14, 485–499, https://doi.org/10.5194/nhess-14-485-2014, 2014.
Favalli, M., Fornaciai, A., and Pareschi, M. T.: LIDAR strip adjustment: Application to volcanic areas, Geomorphology, 111, 123–135, https://doi.org/10.1016/j.geomorph.2009.04.010, 2009.
Favalli, M., Fornaciai, A., Nannipieri, L., Harris, A., Calvari, S., and Lormand, C.: UAV-based remote sensing surveys of lava flow fields: a case study from Etna's 1974 channel-fed lava flows, B. Volcanol., 80, 29, https://doi.org/10.1007/s00445-018-1192-6, 2018.
Fonseca, J., Flor, A., Goncalves, A., Day, S., and Jenkyns, S.: Perigosidade vulcânica das ilhas de Cabo Verde, in: Riscos geológicos das ilhas de Cabo Verde, Municipia Final Report to Cape Verde UNDP Office, edited by: Mileu, N., Municipia, Lisbon, Portugal, 2014.
Fornaciai, A., Bisson, M., Landi, P., Mazzarini, F., and Pareschi, M. T.: A LiDAR survey of Stromboli volcano (Italy): Digital elevation model-based geomorphology and intensity analysis, Int. J. Remote Sens., 31, 12, 3177–3194, https://doi.org/10.1080/01431160903154416, 2010.
González, P. J., Bagnardi, M., Hooper, A. J., and Larsen, Y., Marinkovic, P., Samsonov, S. V., Wright, T. J.: The 2014–2015 eruption of Fogo volcano: Geodetic modeling of Sentinel-1 TOPS interferometry, Geophys. Res. Lett., 42, 9239–9246, https://doi.org/10.1002/2015GL066003, 2015.
Heleno da Silva, S. I. N., Day, S. J., and Fonseca, J. F. B. D.: Fogo Volcano, Cape Verde Islands: seismicity-derived constraints on the mechanism of the 1995 eruption, J. Volcanol. Geoth. Res., 94, 219–231, https://doi.org/10.1016/S0377-0273(99)00104-3, 1999.
James, M. R., Chandler, J. H., Eltner, A., Fraser, C., Miller, P. E., Mills, J. P., Noble, T., Robson, S., and Lane, S. N.: Guidelines on the use of structure-from-motion photogrammetry in geomorphic research, Earth Surf. Proc. Land., 44, 2081–2084, https://doi.org/10.1002/esp.4637, 2019.
James, M. R., Carr, B., D'Arcy, F., Diefenbach, A., Dietterich, H., Fornaciai, A., Lev, E., Liu, E., Pieri, D., Rodgers, M., Smets, B., Terada, A., von Aulock, F., Walter, T., Wood, K., and Zorn, E.: Volcanological applications of unoccupied aircraft systems (UAS): Developments, strategies, and future challenges, Volcanica, 3, 67–114, https://doi.org/10.30909/vol.03.01.67114, 2020.
Jenkins, S. F., Day, S. J., Faria, B. V. E., and Fonseca, J. F. B. D.: Damage from lava flows: insights from the 2014–2015 eruption of Fogo, Cape Verde, Journal of Applied Volcanology, 6, 1–17, https://doi.org/10.1186/s13617-017-0057-6, 2017.
Jordan, B. R.: Collecting field data in volcanic landscapes using small UAS (sUAS)/drones, J. Volcanol. Geoth. Res., 385, 231–241, https://doi.org/10.1016/j.jvolgeores.2019.07.006, 2019.
Kerle, N.: Volume estimation of the 1998 flank collapse at Casita volcano, Nicaragua: A comparison of photogrammetric and conventional techniques, Earth Surf. Proc. Land., 27, 59–772, https://doi.org/10.1002/esp.351, 2002.
Komorowski, J. C., Morin, J., Jenkins, S., and Kelman, I.: Challenges of Volcanic Crises on Small Islands States, in: Observing the Volcano World. Advances in Volcanology (An Official Book Series of the International Association of Volcanology and Chemistry of the Earth's Interior – IAVCEI, Barcelona, Spain), edited by: Fearnley C. J., Bird D. K., Haynes K., McGuire W. J., and Jolly G., Springer, Cham, Switzerland, https://doi.org/10.1007/11157_2015_15, 2016.
Küng, O., Strecha, C., Beyeler, A., Zufferey, J.-C., Floreano, D., Fua, P., and Gervaix, F.: The Accuracy of Automatic Photogrammetric Techniques on Ultra-light UAV Imagery, Int. Arch. Photogramm., 38, 125–130, https://doi.org/10.5194/isprsarchives-XXXVIII-1-C22-125-2011, 2011.
Le Bas, T. P., Masson, D. G., Holtom, R. T., and Grevemeyer, I.: Slope failures of the flanks of the southern Cape Verde Islands, in: Submarine Mass Movements and Their Consequences. Advances in Natural and Technological Hazards Research, 27, edited by: Lykousis, V., Sakellariou, D., and Locat, J., Springer, Dordrecht, 337–345, https://doi.org/10.1007/978-1-4020-6512-5_35, 2007.
Lodge, A. and Helffrich, G.: Depleted swell root beneath the Cape Verde Islands, Geology, 34, 449-452, https://doi.org/10.1130/G22030.1, 2006.
Machado, F. and Torre de Assunção, C. F.: Carta geológica de Cabo Verde na escala de ; noticia explicativa da folha da ilha do Fogo — estudos petrográficos, Garcia de Orta, Lisboa, 13, 597–604, 1965.
Madeira, J., Brum da Silveira, A., Mata, J., Mourão, C., and Martins, S.: The role of mass movements on the geomorphologic evolution of island volcanoes: examples from Fogo and Brava in the Cape Verde archipelago, Comunicações Geológicas, 95, 93–106, 2008.
Madeira, J., Ramalho, R. S., Hoffmann, D. L., Mata, J., and Moreira, M.: A geological record of multiple Pleistocene tsunami inundations in an oceanic island: The case of Maio, Cape Verde, Sedimentology, 67, 1529–1552, https://doi.org/10.1111/sed.12612, 2020.
Masson, D. G., Le Bas, T. P., Grevemeyer, I., and Weinrebe, W.: Flank collapse and large-scale landsliding in the Cape Verde Islands, off West Africa, Geochem. Geophy. Geosy., 9, Q07015, https://doi.org/10.1029/2008GC001983, 2008.
Mata, J., Martins, S., Mattielli, N., Madeira, J., Faria, B., Ramalho, R., Silva, P., Moreira, M., Caldeira, R., Moreira, M., Rodrigues, J., and Martins, L.: The 2014–15 eruption and the short-term geochemical evolution of the Fogo volcano (Cape Verde): Evidence for small-scale mantle heterogeneity, Lithos, 288–289, 91–107, https://doi.org/10.1016/j.lithos.2017.07.001, 2017.
Mazzarini, F., Pareschi, M. T., Favalli, M., Isola, I., Tarquini, S., and Boschi, E.: Lava flow identification and aging by means of lidar intensity: Mount Etna case, J. Geophys. Res., 112, B02201, https://doi.org/10.1029/2005JB004166, 2007.
Mouginis-Mark, P. J. and Garbeil, H.: Quality of TOPSAR topographic data for volcanology studies at Kılauea Volcano, Hawaii: An assessment using airborne lidar data, Remote Sens. Environ., 96, 149–164, https://doi.org/10.1016/j.rse.2005.01.017, 2005.
Paris, R., Geichetti, T., Chevalier, J., Guillou, H., and Frank, N.: Tsunami deposits in Santiago Island (Cape Verde archipelago) as possible evidence of a massive flank failure of Fogos volcano, Sediment. Geol., 239, 129–145, https://doi.org/10.1016/j.sedgeo.2011.06.006, 2011.
Paris, R., Ramalho, R. S., Madeira, J., Ávila, S., May, S. M., Rixhon, G., Engel, M., Brückner, H., Herzog, M., Schukraft, G., and Perez-Torrado, F. J.: Mega-tsunami conglomerates and flank collapses of ocean island volcanoes, Mar. Geol., 395, 168–187, https://doi.org/10.1016/j.margeo.2017.10.004, 2018.
Poland, M. P.: Time-averaged discharge rate of subaerial lava at Kīlauea Volcano, Hawai'i, measured from TanDEM-X interferometry: Implications for magma supply and storage during 2011–2013, J. Geophys. Res.-Sol. Ea., 119, 5464–5481, https://doi.org/10.1002/2014JB011132, 2014.
Ramalho, R. A. S. (Ed.): Building the Cape Verde Islands, 1st edn., Springer, Berlin, Heidelberg, 2011.
Ramalho, R., Helffrich, D., Cosca, M.,Vance, D, Hoffmann, D., and Schmidt, D. N.: Episodic swell growth inferred from variable uplift of the Cape Verde hotspot islands, Nat. Geosci., 3, 774–777, https://doi.org/10.1038/ngeo982, 2010a.
Ramalho, R., Helffrich, D., Cosca, M., Vance, D., Hoffmann, D., and Schmidt, D. N.: Vertical movements of ocean island volcanoes: Insights from a stationary plate environment, Mar. Geol., 275, 84–95, https://doi.org/10.1016/j.margeo.2010.04.009, 2010b.
Ramalho, R. S., Helffrich, G., Schmidt, D. N., and Vance, D.: Tracers of uplift and subsidence in the Cape Verde Archipelago, J. Geol. Soc. London, 167, 519–538, https://doi.org/10.1144/0016-76492009-056, 2010c.
Ramalho, R., Winckler, G., Madeira, J., Helffrich, G. Hipólito, A., Quartau, R., Adena, K., and Schaefer, J.: Hazard potential of volcanic flank colapses raised by new megatsunami evidence, Science Advances, 1, E1500456, https://doi.org/10.1126/sciadv.1500456, 2015.
Ribeiro, O.: A ilha do Fogo e as suas erupções, Comissão Nacional para as Comemorações dos Descobrimentos Portugueses, Lisbon, Portugal, 1954.
Richter, N., Favalli, M., de Zeeuw-van Dalfsen, E., Fornaciai, A., da Silva Fernandes, R. M., Pérez, N. M., Levy, J., Victória, S. S., and Walter, T. R.: Lava flow hazard at Fogo Volcano, Cabo Verde, before and after the 2014–2015 eruption, Nat. Hazards Earth Syst. Sci., 16, 1925–1951, https://doi.org/10.5194/nhess-16-1925-2016, 2016.
Rowland, S. K., MacKay, M. E., Garbeil, H., and Mouginis-Mark, P. J.: Topographic analyses of Kīlauea Volcano, Hawai'i, from interferometric airborne radar, B. Volcanol., 61, 1–14, https://doi.org/10.1029/2019GL083501, 1999.
Smith, M. W., Carrivick, J .L., and Quincey, D. J.: Structure from motion photogrammetry in physical geography, Prog. Phys. Geog., 40, 247–275, https://doi.org/10.1016/j.geomorph.2012.08.021, 2016.
Stevens, N., Wadge, G., and Murray, J.: Lava flow volume and morphology from digitised contour maps: A case study at Mount Etna, Sicily, Geomorphology, 28, 251–261, https://doi.org/10.1016/S0169-555X(98)00115-9, 1999.
Torres, P. C., Madeira, J., Silva, L. C., Brum da Silveira, A., Serralheiro, A., and Mota Gomes, A.: Carta Geológica das Erupções Históricas da Ilha do Fogo (Cabo Verde): revisão e actualização, Comunicações do Instituto Geológico e Mineiro, 84, A193–196, 1998.
Vieira, D., Teodoro, A., and Gomes, A.: Analysing Land Surface Temperature variations during Fogo Island (Cape Verde) 2014-2015 eruption with Landsat 8 images, P. SPIE, 10005, 1000508-14, https://doi.org/10.1117/12.2241382, 2016.
Vieira, G., Mora, C., Pina, P., Ramalho, R., and Fernandes, R.: Digital surface model and orthomosaic of the Chã das Caldeiras lava fields (Fogo Island, Cape Verde, December 2016) (Version 1.3.0), Zenodo [Data set], https://doi.org/10.5281/zenodo.4718520, 2021.
Westoby, M. J., Brasington, J., Glasser, N. F., Hambrey, M. J., and Reynolds, J. M.: “Structure-from-Motion” photogrammetry: A low-cost, effective tool for geoscience applications, Geomorphology, 179, 300–314, https://doi.org/10.1016/j.geomorph.2012.08.021, 2012.