the Creative Commons Attribution 4.0 License.
the Creative Commons Attribution 4.0 License.
 | 17 Jun 2021
Glacier changes in the Chhombo Chhu Watershed of the Tista basin between 1975 and 2018, the Sikkim Himalaya, India
Arindam Chowdhury
Milap Chand Sharma
Manasi Debnath
Glaciers of the Tista basin represent an important water source for mountain communities and a large population downstream. The article presents observable changes in the Chhombo Chhu Watershed (CCW) glacier area of the Tista basin, the Sikkim Himalaya. The CCW contains 74 glaciers (> 0.02 km2) with a mean glacier size of 0.61 km2. We determined changes in glaciers from the declassified Hexagon Keyhole-9 (KH-9) (1975), Landsat 5 Thematic Mapper (TM) (1989), Landsat 7 Enhanced Thematic Mapper Plus (ETM+) (2000), Landsat 5 TM (2010), and Sentinel-2A (2018) images. The total glacier area in 1975 was 62.6 ± 0.7 km2; and by 2018, the area had decreased to 44.8 ± 1.5 km2, an area loss of 17.9 ± 1.7 km2 (0.42 ± 0.04 km2 a−1). Clean glaciers exhibited more area loss of 11.8 ± 1.2 km2 (0.27 ± 0.03 km2 a−1) than partially debris-covered and maximally debris-covered glaciers. The area loss is 5.0 ± 0.4 km2 (0.12 ± 0.01 km2 a−1) for partially covered glaciers and 1.0 ± 0.1 km2 (−0.02 ± 0.002 km2 a−1) for maximally covered glaciers. The glacier area loss in the CCW of the Sikkim Himalaya is 0.62 ± 0.5 km2 a−1 during 2000–2010, and it is 0.77 ± 0.6 km2 a−1 during 2010–2018. Field investigations of selected glaciers and climatic records also support the glacier recession in the CCW due to a significant increase in temperature (0.25 ∘C a−1) and more or less static precipitation since 1995. The dataset is now available from the Zenodo web portal: https://doi.org/10.5281/zenodo.4457183 (Chowdhury et al., 2021).
- Article
(14569 KB) - Full-text XML
- BibTeX
- EndNote


The best manifestation of climate change, either positive or negative, is the advance and retreat of glaciers. Both these processes are time-dependent, for they will be determined by the size of a glacier and related influencing factors. Response of negative mass balance is shown in the frontal area as recession supported by identifiable landforms. Glaciers play an important role as response indicators of climate change (Bahuguna et al., 2014).
Most of the Himalayan glaciers are losing mass at different rates, such as Khatling glacier in the Garhwal Himalaya and Zemu glacier in the Sikkim Himalaya, which are retreating at the rate of 88 ± 0.3 m a−1 and 9.1 m a−1, respectively (Raj et al., 2017; Rashid and Majeed, 2020). Exceptional trends in glaciers in the central and western part of the Karakoram Himalaya also prevail (Bajracharya and Shrestha, 2011; Hewitt, 2011; Mehta, 2011). However, the future stability of such a trend in glacier status is debatable under different climate scenarios (Ruosteenoja et al., 2003; Immerzeel, 2008). Since 1901, a significant rise in daily maximum temperature of 1 ∘C in northeast India and a basin-wide warming trend of 0.6 ∘C in the Brahmaputra basin have been documented (Dash et al., 2007; Immerzeel, 2008). Moreover, the station-based meteorological data from the northeastern part of India and Sikkim indicate that the changes in rainfall and temperature patterns are seasonal and site-specific (Sreekesh and Debnath, 2016; Kumar et al., 2020). Future climate projection scenarios have reported a substantial rise in temperature and imbalances in precipitation regimes that may aggravate the risk of future glacier melt run-off security within the Hindu Kush Himalaya (HKH) and peripheral Asian countries (Kumar et al., 2006).
Most importantly, the run-off from the glaciers of the HKH region supports a vast population of about 1.3 billion people in its downstream basins of Asian countries (Williams, 2013; Wahid et al., 2014). Therefore, changes in glacier melt run-off will directly or indirectly affect roughly a fifth of the world's population (Wahid et al., 2014). The ongoing changes in the glaciers and snow cover due to global climate change can markedly affect hydrological regimes in high-elevation mountain catchments in the HKH. Thus, the sensitivity of glacier-fed mountain channels to climate change is a high-risk factor for hydroelectric power stations, sediment supply over the flood plain, etc. The upper Tista basin that constitutes the Sikkim Himalaya has vast potential for hydropower development and has a 5353 MW installed capacity that is 60 % of the basin's total hydropower potential (Khawas, 2016; Rahaman and Mamun, 2020). Many hydropower projects are already under construction, and some are planned to be established in North Sikkim (EDPS, 2019).
The Tista is a trans-boundary river, sustaining a sizable population both in and at the distal reaches of the mountain (Rudra, 2018; Rahaman and Mamun, 2020). Our change analysis of the cryospheric parameter could help in long-term planning along the river course, given the current trend.
Even orographic variation determines the amount of precipitation in the form of rainfall and snowfall in the Himalayan region (Singh and Kumar, 1997). Similarly, glacier distribution and anomalies in glacier changes also depend on the local topography and local climate over the HKH region (Kääb et al., 2007; Hewitt, 2011; Brahmbhatt et al., 2017; Ojha et al., 2017). Additionally, glacier responses vary as per the glacier's surface topography (debris-covered or clean-ice ablation zone), presence of supraglacial and proglacial ponds, surface temperature, the morphology of glaciers, surrounding potential debris supply zone, etc. (Sakai et al., 2000; Scherler et al., 2011; Ojha et al., 2017; Salerno et al., 2017; Olson and Rupper, 2019; Tsutaki et al., 2019). These widely varied parameters motivated us to conduct catchment-based monitoring of glaciers in the Sikkim Himalaya covering the last couple of decades.
Unfortunately, the monitoring of glacier variability has generally been lacking in the eastern Himalaya, and little attention has been paid to assessing the catchment-based glacier status. Few studies have been conducted on the Bhutan Himalaya, the entire Sikkim Himalaya, and the Changme Khangpu basin in the Sikkim Himalaya. The Chhombo Chhu Watershed (CCW), containing a large number of glaciers of Sikkim, is still being unravelled. Hence this study has focused on three primary objectives: (i) preparation of a detailed glacier inventory for the CCW in the Sikkim Himalaya using the Sentinel-2A MultiSpectral Instrument (MSI) (2018), (ii) analysis of the glacier area changes since 1975, and (iii) impact of topographic and non-topographic (climatic factors) parameters.
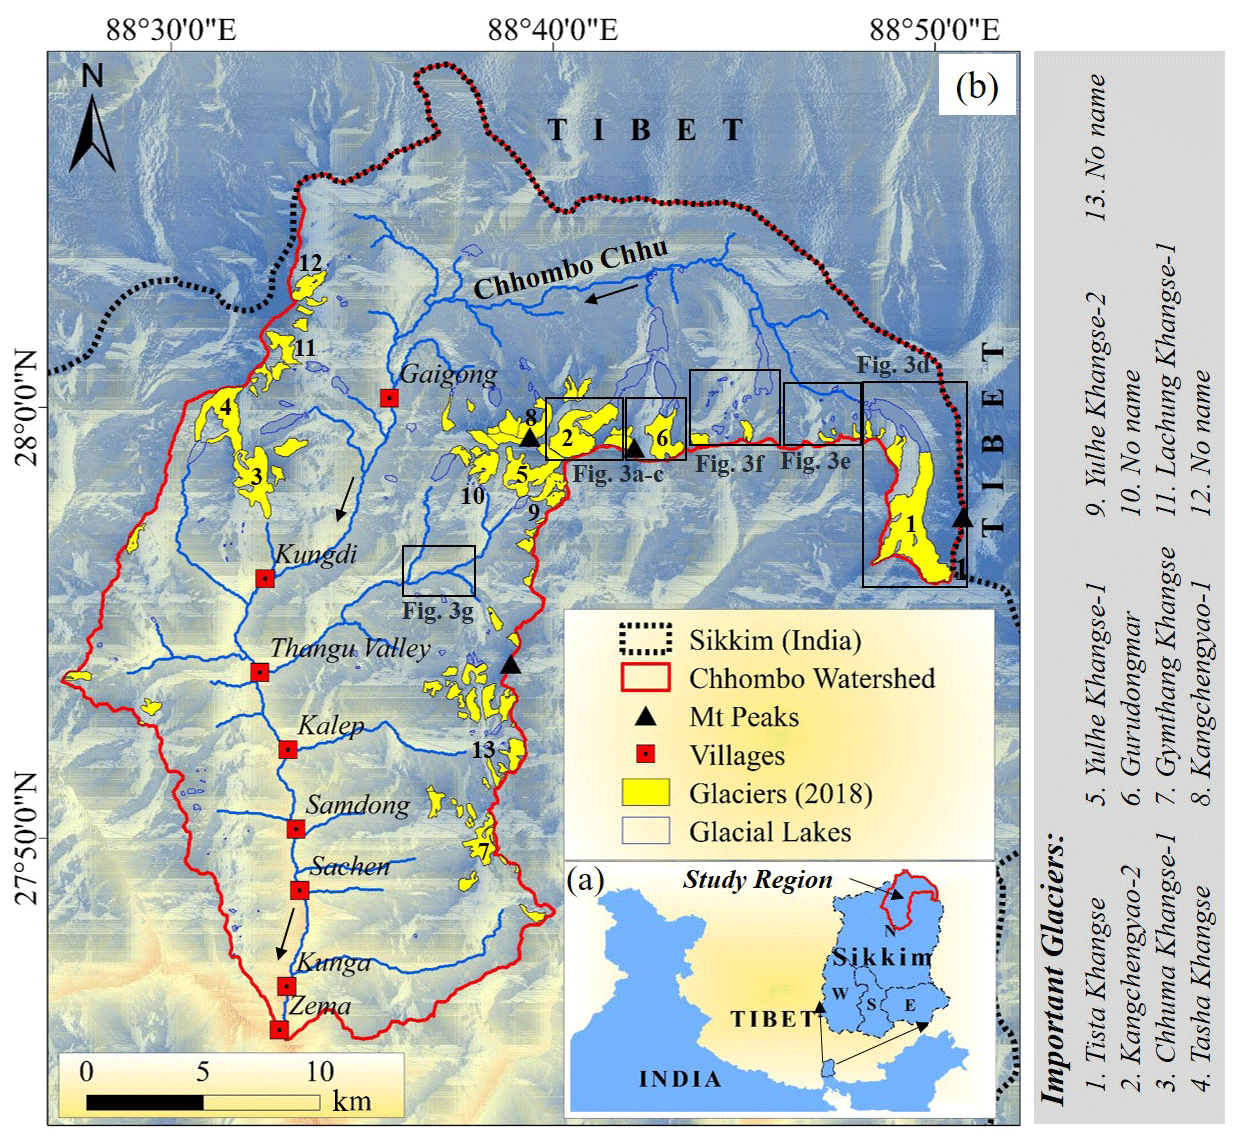
Figure 1(a) Location of the Chhombo Chhu Watershed in the eastern Himalaya. The watershed boundary is marked in red in the inset within Sikkim. (b) Glacier and glacial lake distribution in the CCW in the Sikkim Himalaya. Black boxes represent the field measurement sites in 2017–2018. The base map used here is a Shuttle Radar Topography Mission (SRTM) DEM.
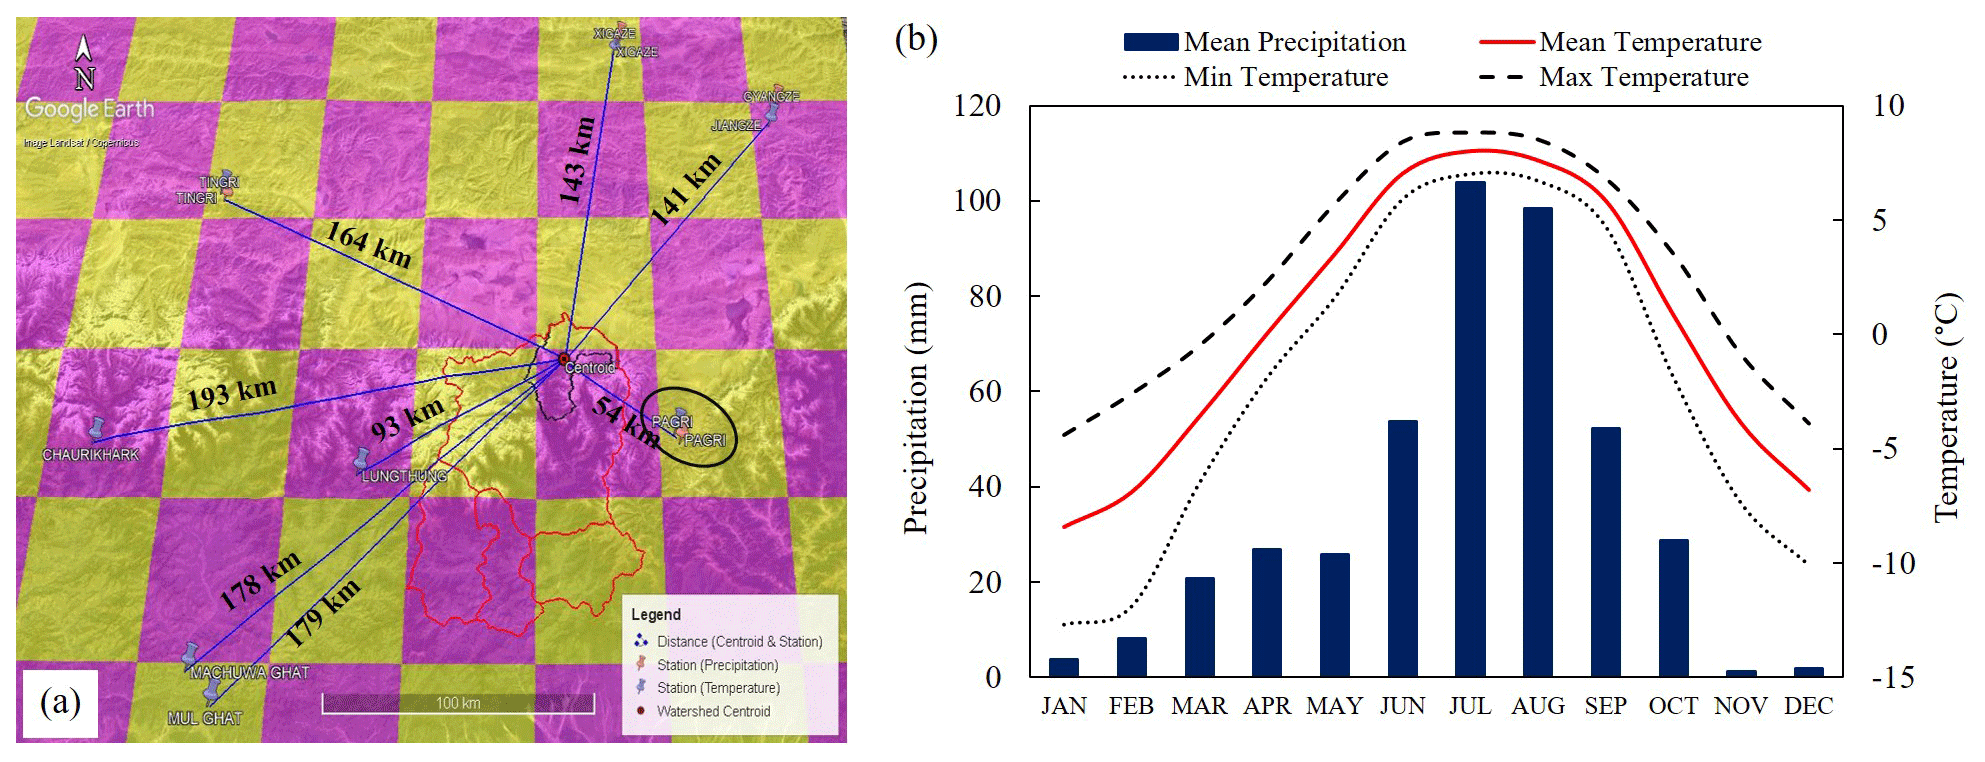
Figure 2(a) Location of meteorological stations overlaid on Google Earth platform and their respective distance (km) to the centroid of the CCW. The red and blue place marks represent the individual stations for precipitation and temperature data presented in this study. The black oval represents Pagri Meteorological Station (PMS). Pink and yellow checked boxes represent the gridded cells of Climatic Research Unit (CRU) data. (b) Climograph of the CCW, the Sikkim Himalaya, representing the mean monthly temperature and precipitation data from 1960 to 2013; data source: (http://www.cru.uea.ac.uk/data, last access: 13 June 2020).
The Chhombo Chhu Watershed (chhu literally means water, but streams in the Himalayan Tibetan language are termed chhu, and a lake is tso or chho) is located (27∘45′19.2′′ to 28∘7′41.2′′ N, 88∘26′49.9′′ to 88∘50′45.9′′ E) in the upper Tista basin in Sikkim in the eastern Himalaya (Fig. 1). It covers a total surface area of 694.5 km2, ranging in altitude from ∼ 2680 to 7073 m above sea level (m a.s.l.). The Chhombo Chhu originates from Khangchung Tso, a proglacial lake fed by the Tista Khangse glacier in the extreme northeast part of this watershed. Many other glaciers feed lakes, such as Tso Lhamo and Gurudongmar, supplying meltwater throughout the year to the Chhombo Chhu, which drains through the Thangu valley to join Lachen Chhu at Zema (2680 m a.s.l.). Finally, the Lachen Chhu and Lachung Chhu form a confluence at Chungthang (1535 m a.s.l.), hereafter known as the Tista, an important tributary of the Brahmaputra in the eastern Himalaya (CISMHE, 2007; Basnett et al., 2013; Debnath et al., 2018). Some of the important glaciers in this watershed are Tista Khangse (TK), Gurudongmar, Kangchengyao, Chhuma Khangse, Tasha Khangse, and Yulhe Khangse.
Table 1Different datasets used in this current study for the analysis and its characteristics.
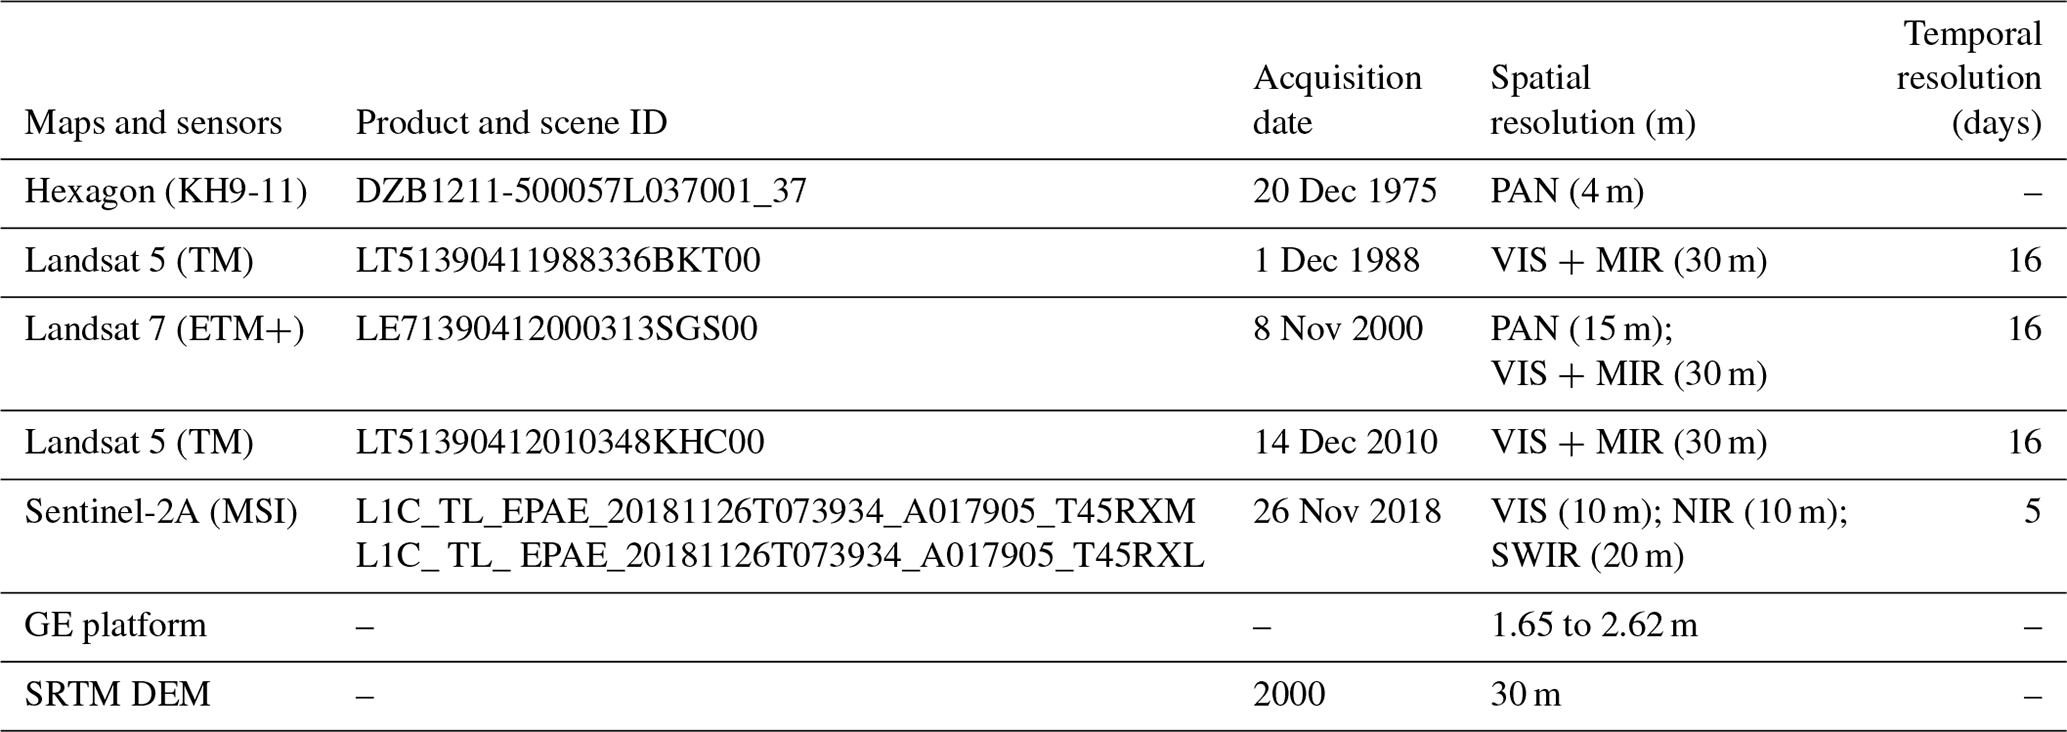
Note the following abbreviations: KH, Keyhole; GE, Google Earth; SRTM DEM, Shuttle Radar Topography Mission digital elevation model; TM, Thematic Mapper; ETM+, Enhanced Thematic Mapper Plus; MSI, MultiSpectral Instrument; PAN, panchromatic; VIS, visible; MIR, mid-infrared; NIR, near-infrared; SWIR, short-wave infrared.
It is now known that the climate of the Sikkim Himalaya is influenced by the triple system, primarily dominated by the Indian summer monsoon (ISM) that is the main source of precipitation (Racoviteanu et al., 2015), and additionally receives occasional precipitation through the northeast (winter) monsoon and hardly any from mid-latitude westerlies (Murari et al., 2014; Kumar et al., 2020). At the higher elevations, most of the precipitation is in the form of snow at any time of the year. Two types of climatic conditions govern the study region (CCW); i.e. the higher reaches of the mountain to the north of the Thangu valley and the northern slope of the Kangchengyao Massif is dominated by the cold semi-arid desert climate, whereas the lower part of the watershed from Thangu is characterized by a temperate climate. The higher reaches of the mountain system to the north are an extension of the Trans-Himalaya of the Tibet region. They have a comparatively cold semi-arid desert-type climate, similar to that of the Ladakh region in the west (Brazel and Marcus, 1991), and are nearly devoid of vegetation, except for the trim shrubs close to the lakes Gurudongmar and Tso Lhamo. Glaciers on the northern slope of the Kangchengyao Massif are in a rain-shadow area, having scanty precipitation, whereas the glaciers on the southern slopes of the massif receive abundant precipitation from the ISM during June–September. Therefore, it is assumed that the glaciers of the Sikkim Himalaya are generally formed by summer accumulation irrespective of the western Himalaya and Karakoram region (Ageta and Higuchi, 1984). The climograph (Fig. 2b) shows a long-term average temperature that does not exceed 10 ∘C, whereas mean monthly precipitation ranges from 1.3 to 104 mm based on the nearest meteorological station data of Pagri (54 km from the centroid of the basin) (Fig. 2a).
3.1 Data sources
A variety of remotely sensed satellite images, with different temporal and multispectral resolutions and medium to high spatial resolution, are used to delineate glacier outlines and for change detection analysis in the study region (Table 1). For this study, these images are selectively chosen only for the end of the ablation period, with minimal seasonal snow and cloud coverage (November to December) and a vertical solar position to avoid shadows (Chand and Sharma, 2015). These images include the panchromatic declassified Hexagon (KH9-11; 1975), Landsat 5 Thematic Mapper (TM; 1988 and 2010), Landsat 7 Enhanced Thematic Mapper Plus (ETM+; 2000), and Sentinel-2A (2018) images, and they further cross-verified with the high-resolution images on the Google Earth (GE) platform. Sentinel-2A has a much better spatial resolution than any other freely available data sources for glacier analysis (Paul et al., 2020). In addition, the Survey of India (SoI) topographical sheets at a 1 : 50 000 scale with 40 m contour intervals are used for obtaining topographic information; and the Shuttle Radar Topography Mission (SRTM; 2000) digital elevation model (DEM) is used as a reference DEM for the delineation of drainage basins and extraction of glacier topographic parameters (Table 1). In our study area, it is statistically proven that the SRTM (30 m) has an overall edge over ASTER and Cartosat-1 DEMs. All the satellite images and the SRTM DEM are freely obtained from the US Geological Survey (USGS; http://earthexplorer.usgs.gov/, last access: 17 May 2020), and the monthly average temperature (∘C) and precipitation (mm) for Pagri Meteorological Station (PMS) are available from 1960–2013 from the Climatic Research Unit (CRU), University of East Anglia (http://www.cru.uea.ac.uk/data, last access: 13 June 2020).

Figure 3Field photographs (2017–2018) showing different glaciers and associated geomorphology in the study region (see Fig. 1 for location). (a) Panoramic view of glaciers in the Gurudongmar region; (b, c) closer view of Gurudongmar and Kangchengyao-2 glaciers; (d) different morphological types of glaciers in the Tista Khangse region; (e) closer view of some niche glaciers near Tista Khangse; (f) Tso Lhamo region; (g) unknown palaeo-cirque in the Lashar valley, Thangu. Note the following abbreviations: CI, clean ice; GT, glacial tarn; IF, icefall; MCF, mountain cliff face; NLM, new lateral moraine; OLM, old lateral moraine; PDCI, partially debris-covered ice; PGL, proglacial lake; TK, Tista Khangse; UCLM, unconsolidated lateral moraine. The red oval surrounding the person in (f) represents the scale of the image. (All photos courtesy of Arindam Chowdhury, taken in 2017–2018).
3.2 Radiometric and geometric correction of satellite images
Following the end of the 1960s, when Corona reached its technical limits, a series of photographic reconnaissance satellites (KH-9) with a higher spatial resolution and broader coverage were launched by the USA between 1971 and 1984 (Surazakov and Aizen, 2010). In this study, the 10 small subsets of the declassified Hexagon (KH9-11) image (original frame ∼ about 250×125 km on the ground) acquired during the KH-9 mission (1211) in 1975 is spatially georeferenced and co-registered to Sentinel-2A (S2A) (base image) using the spline transformation method (STM), along with an adjustment rectification algorithm, to reconstruct the correct image geometry that existed at the moment of film exposure. All of the semi-automated geometric calibration procedures are processed in ESRI ArcGIS 10.1 software. We have acquired 286 ground control points (GCPs) from all over the subset image that encompasses the glacier, snow-covered mountain range consisting of prominent peaks, stable river junctions and roads, unchanged lineament structures, and lakeshores and rock outcrops for image orientation (Bhambri et al., 2011). The quality of the KH9-11 image was excellent as well as nearly scratch- and noise-free. Figure 4a shows the distortion fields of KH9-11 that are noticeable in the corner areas near the mountain ridges, similar to those found in previous studies (Surazakov and Aizen, 2010) and later geometrically rectified (Fig. 4b). The horizontal shift or positional accuracy between KH-9 and S2A images is estimated at ∼ 3.8 m (∼ 0.94 pixels).
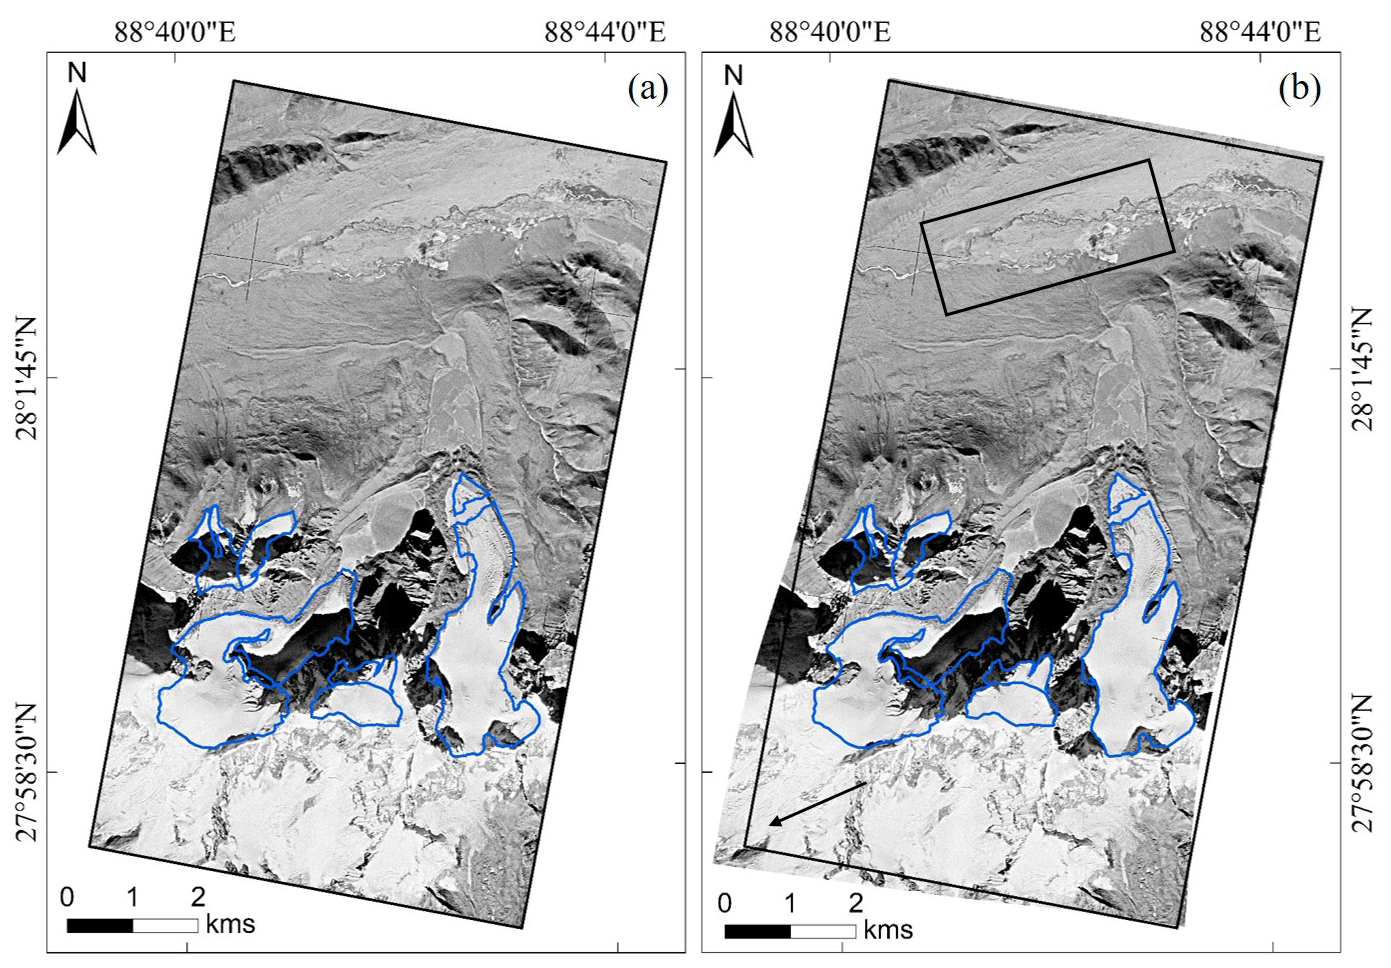
Figure 4Methods adopted for glacier mapping: (a) subset KH-9 image near the Gurudongmar region before perfect geometric rectification using spline transformation method (STM); (b) distortion fields of the same KH-9 image along the mountain ridges after geometric rectification. Note the difference in distortion was more clearly noticed near the flat areas of braided glacial streams (rectangle) in the north of Gurudongmar Tso than at the Kangchengyao Massif (arrow) in the south.
As a fundamental step in radiometric preprocessing, atmospheric corrections, and topographically induced illumination variations, all the differently dated datasets of multispectral (MS) bands of Landsat series are converted from digital numbers (DNs) into a standard meaningful physical unit such as spectral radiance (Lλ) and top-of-atmosphere (TOA) reflectance (ρp) (Chuvieco and Huete, 2009). Finally, the dark object subtraction (DOS) method is adopted for the radiometric correction of each image (Chavez, 1988) using ENVI 5.1 software. All the stacked Landsat images are co-registered with the orthorectified S2A image. The horizontal shift of Landsat TM and pan-sharpened ETM+ is calculated at ∼ 11.7 (∼ 0.39 pixels) and ∼ 10.2 m (∼ 0.68 pixels), respectively, to the base image. Finally, all the visible, NIR, and SWIR bands of the S2A image are resampled to a 10 m resolution and layer stacked in ESA SNAP 5.0 to be converted into a GeoTIFF image file for the extraction of the updated glacier inventory (2018) in the CCW.
3.3 Glacier inventory mapping
Glacier boundaries are manually delineated from the KH9-11 (1975) panchromatic scene (Fig. 4b). Algebraic algorithms for image enhancement (viz. NDVI, NDWI, and NDSI) are applied to different spectral bands of the Landsat and Sentinel-2A images to semi-automatically map clean-glacier ice (Bolch and Kamp, 2006; Racoviteanu et al., 2008, 2009; Bhambri et al., 2011). However, these algorithms could not differentiate the debris-covered glaciers correctly from the surrounding moraines or rock outcrops in the region, and therefore, they are manually digitized (Paul et al., 2004a; Racoviteanu et al., 2009; Bhambri et al., 2011; Frey et al., 2012). Additionally, high-resolution Google Earth images (≤ 5 m); Sentinel-2A images (10 m); pan-sharpened multispectral images of Landsat ETM+ (15 m); and the outcome of topographic parameters such as slope, aspect, and hill-shaded relief maps, calculated from the SRTM DEM, are used for visual rectification and checking to map the glaciers (Schmidt and Nüsser, 2012). The seasonal snow cover and shadow areas have also been eliminated. Glacier termini and glacial lakes of some important large valley glaciers (e.g. Tista Khangse, Gurudongmar, and Kangchengayao-2) are mapped during multiple field expeditions, and repeat photographs are taken between 2017 and 2018 (Fig. 3). Finally, the glacier vector outlines (≥ 0.02 km2) are prepared in our inventory (Chand and Sharma, 2015). For the minimum size threshold, the Randolph Glacier Inventory (RGI) considers 0.01 km2 the minimum size, but recent inventories have considered 0.02 km2 instead (Frey et al., 2012; Chand and Sharma, 2015).
The impact of topographic control on glacier fluctuations and distribution is statistically evaluated. We have used the morphological classification of glaciers in the watershed using the Global Land Ice Measurements from Space (GLIMS) guidelines and Glacier Atlas of India (Rau et al., 2005; Raina and Srivastava, 2008; Chand and Sharma, 2015). We have considered glaciers with more than 50 % debris cover maximally debris-covered; those with less than 50 % debris cover are called partially debris-covered for a qualitative differentiation, and debris-free glaciers are termed clean glaciers.
The classified morphological glaciers are categorized as simple-basin valley, compound-basin valley, simple mountain basin, cirque, niche, and glacieret (ice aprons and snowfields). In this study, rock glaciers are excluded.
3.4 Glacier change and uncertainty estimation
The glacier outlines for the year 1975, 1988, 2000, 2010, and 2018 are computed from satellite images of KH9-11, Landsat TM 5, Landsat ETM+, Landsat TM 5, and Sentinel-2A. Furthermore, the characteristics of glacier distribution and fluctuations are examined with the help of different statistically derived diagrams and by analysing the relationships between topographic parameters and glacier outlines. Glacier area dynamics are computed for 1975 to 2018 and divided into four different periods: 1975–1988, 1988–2000, 2000–2010, and 2010–2018. Glacier area changes are directly calculated by subtracting the total area of the recent year (2018) from the initial year (1975). Absolute and relative changes are also calculated for these periods. Figure 12 is a visual representation of different glaciers' area change in the study region.
Mapping uncertainty estimation is necessary to assess the significance of the results to avoid misinterpretation of mapping of the glacier area. For each glacier, the error is calculated based on a buffer drawn around the outlines of the glacier using ArcGIS 10.1 software as suggested by Granshaw and Fountain (2006) and Bolch et al. (2010a, b). For example, a 5 m buffer size (i.e. 0.5 pixels) is drawn around the original glacier outlines of a Sentinel-2A image. Similarly, in the case of Landsat 5 (TM), a 15 m buffer size is used for the glacier outlines. For pan-sharpened Landsat 7 ETM+ and KH9-11 images, the buffer sizes were 7.5 and 2 m, respectively. It is also observed that larger glacier outlines had relatively very small errors compared to the small glacier patches (Bolch et al., 2010a). In this study, the mapping uncertainty of the total glacier area was calculated as ±0.7 km2 (∼ 1.2 %), ±5.3 km2 (∼ 8.9 %), ±2.6 km2 (∼ 4.5 %), ±4.8 km2 (∼ 9.5 %), and ±1.5 km2 (∼ 3.4 %) for the images of KH9-11 Hexagon (1975), Landsat TM 5 (1988), pan-sharpened Landsat ETM+ (2000), Landsat TM 5 (2010), and Sentinel-2A (2018), respectively. Glacier area change uncertainty (εac) was also estimated following Eq. (1) (Hall et al., 2003):
where e1 and e2 are the estimated errors associated with the glacier area of two different time periods. In general, most of the area changes are restricted to the termini of the large glaciers rather than to the upper part of the glaciers in the study area.
3.5 Climate trend estimation
The long-term (1960–2013) CRU monthly mean temperature and precipitation data of Pagri Meteorological Station (PMS) (4330 m a.s.l.), located approximately 54 km east from the centroid of the basin (Harris et al., 2013), are incorporated for the climate trend analysis (Fig. 2a). The Mann–Kendall (MK) statistical method is employed to assess the climatic trends of mean monthly temperature and precipitation and their impact on glacier fluctuation in the study region (Kendall, 1975; Mann, 1945). A positive value of the Mann–Kendall Z statistic (ZMK) indicates an increasing trend and vice versa (Cengiz et al., 2020). The magnitude of a trend (i.e. rate of change per year) for time series analysis is carried out using Sen's slope (Q) method (Sen, 1968).
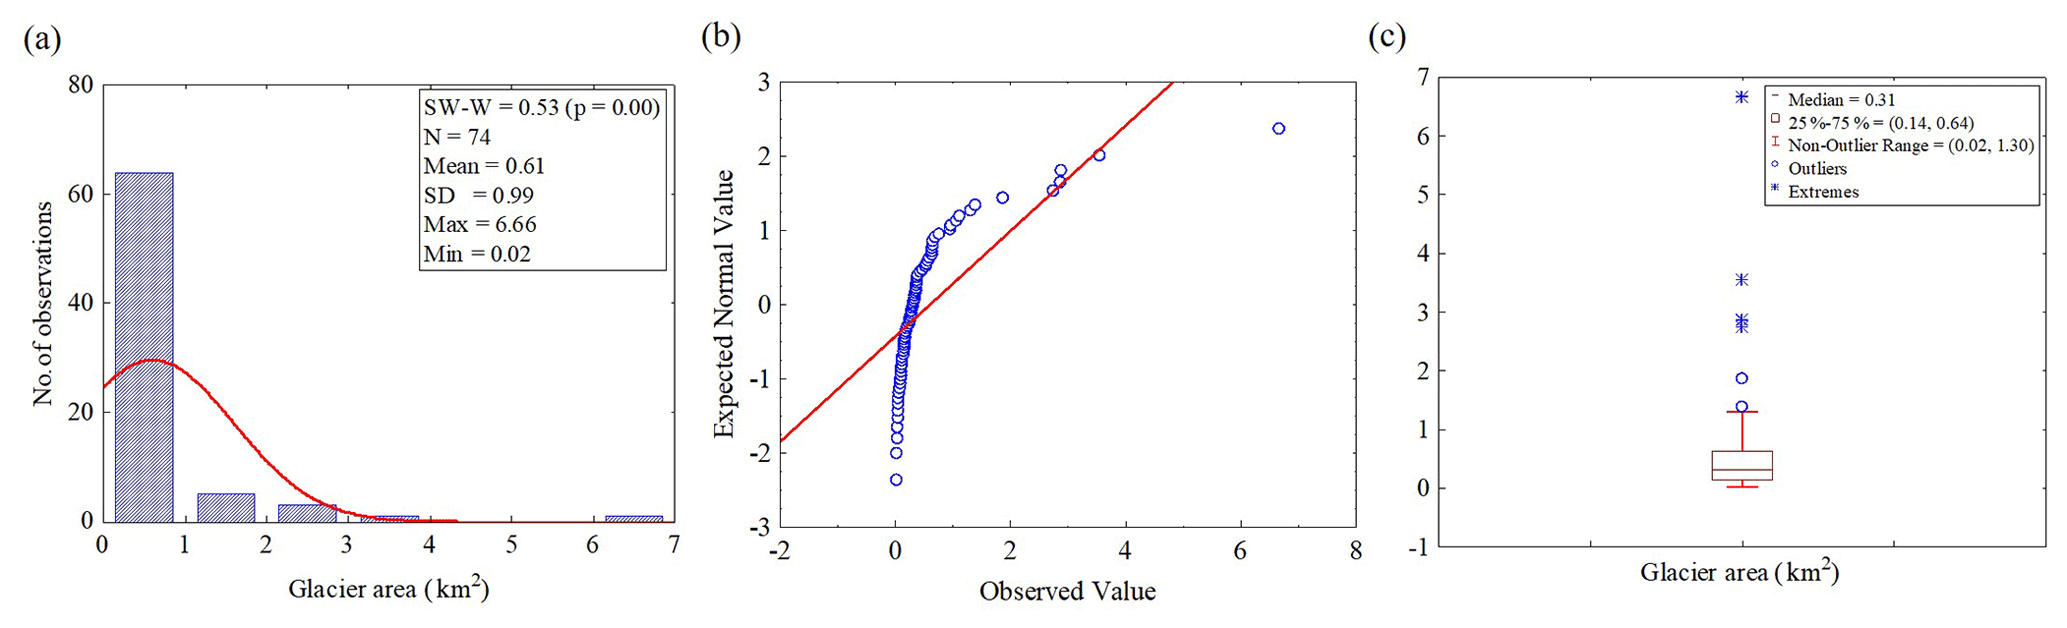
Figure 5Distribution of glaciers in the CCW of the upper Tista basin, the Sikkim Himalaya (2018): (a) histogram of glacier areal distribution, (b) normal Q–Q plot of glacier area, and (c) box-and-whisker plot of glacier surface area.
3.6 Field measurement
Field surveys are carried out during the pre-monsoon (May–June) and post-monsoon (October–December) seasons between 2017 and 2018 for the validation of maps of selected glaciers (e.g. Tista Khangse, Gurudongmar, Kangchengyao-2, and many unknown cirques and niche glaciers) of the study region. It is observed that the northern slope of the Kangchengyao Massif has a large valley glacier mostly without much debris cover except Kangchengyao-2 glacier (Fig. 3c), with enormous proglacial lakes, crevasses, and braided glacial streams. We did not measure the termini positions of the glaciers mentioned above, as these are connected with large proglacial lakes (see Fig. 1b for location). Photographs taken of recent termini positions (2017–2018) are from the outlet location of the moraine-dammed lakes (Fig. 3). The benchmark glacial lakes (i.e. Gurudongmar, Khangchung Tso, and Tso Lhamo), glaciers, and associated morphology are verified using a handheld Garmin eTrex 30× GPS with a positional accuracy of ±3 m (WAAS-enabled). The land surface temperature on the northern and southern part of the watershed for bare rocks, grasses, moraine, water, etc. is measured using the Fluke infrared thermometer. The Digi-Schmidt 2000 hammer is used to measure the relative hardness of boulders that can be used to infer the relative weathering and relative time of glacier recession from the sites.
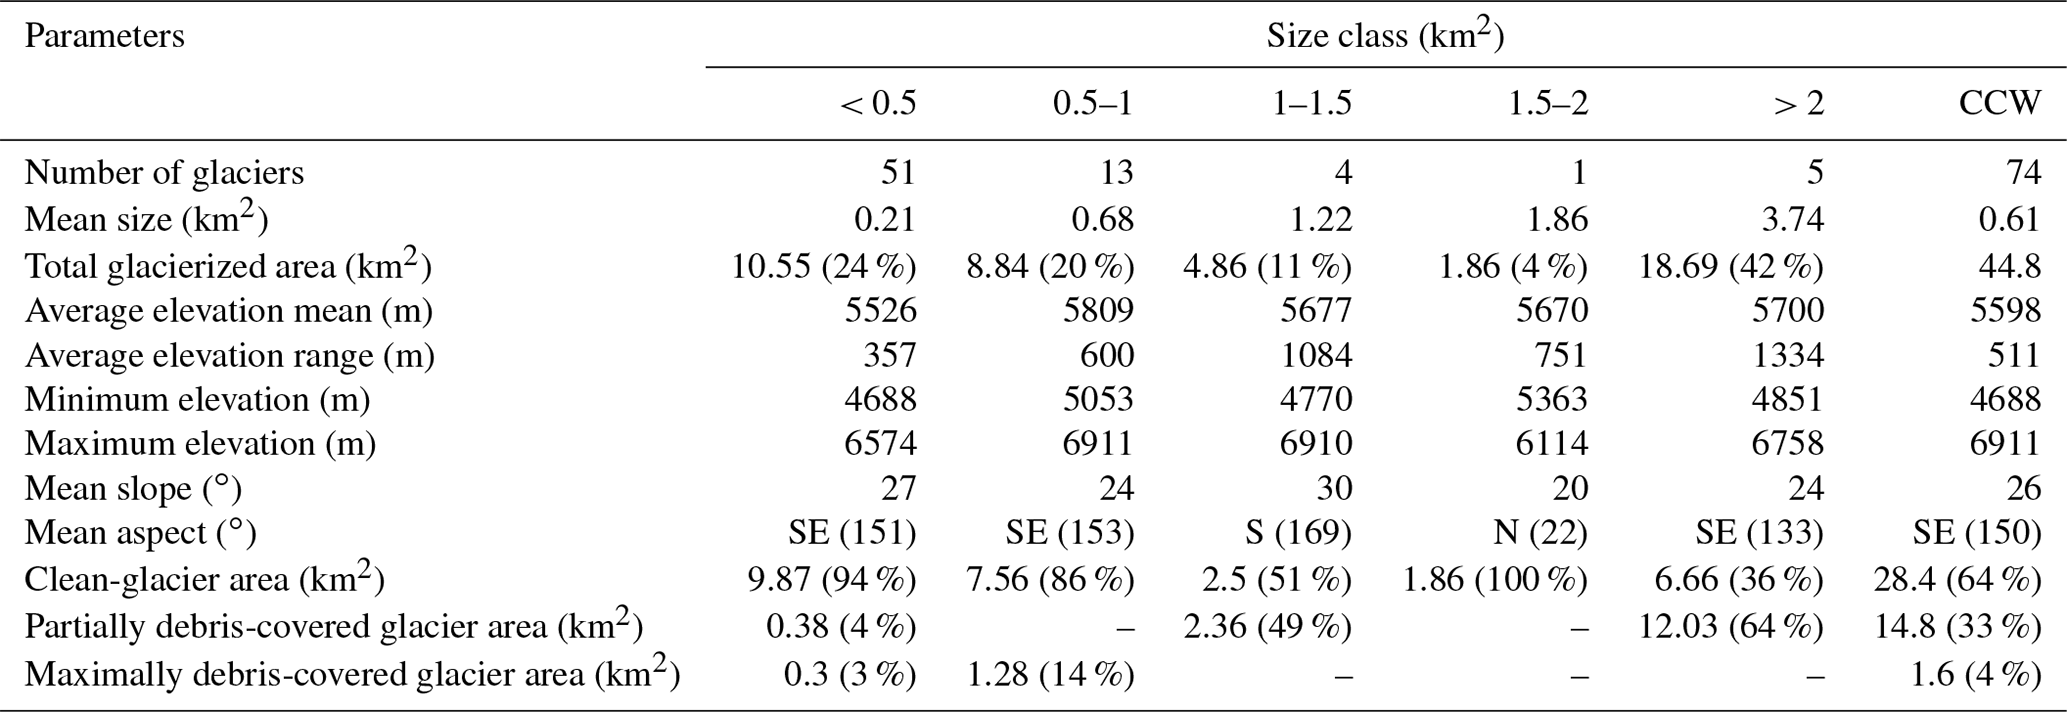
Table 2Topographic parameters according to different size classes (2018) for the CCW based on Sentinel-2A and the SRTM DEM.
4.1 Glacier inventory and its distribution in 2018
In this study, we have identified and mapped 74 glaciers larger than 0.02 km2 (minimum size threshold) using Sentinel-2A MSI (2018) and corresponding Google Earth platform images that cover an area of 44.8±1.5 km2 (Table 2). The current study is the latest glacier inventory map (2018) of the CCW in the Sikkim Himalaya (Fig. 1b). Glaciers in the CCW range from small-glacieret to large-valley types, with a size range from 0.02 to 6.7 km2. A histogram and normal Q–Q plot suggest that the glacier area in the CCW does not have a normal distribution (Fig. 5a, b). The higher values of skewness (3.96) and kurtosis (19.32) and the Shapiro–Wilk normality test (0.53) at a 0.00 significance level also confirm the previous assumption. The median size of the glacier area is 0.31 km2 in the watershed (Fig. 5c).

Figure 6Distribution of (a) number of glaciers, glacierized area, mean slope, and mean elevation as per glacier size classes and (b) elevation size classes of morphological types in relation to glacier area. Frequency distribution (in percent) of (c) glacier morphological types and (d) debris cover types.
Tista Khangse is the largest glacier with an area of 6.7 ± 0.1 km2, which contributes as a prime source and origin of the river Tista in the northeasternmost corner of the watershed in Sikkim. The glacier area is divided into five different size classes: < 0.5, 0.5–1, 1–1.5, 1.5–2, and > 2 km2 (Table 2; Fig. 6a). Out of these, the < 0.5 km2 glacier size class has the maximum number of glaciers (51) with an area of 10.55 ± 0.6 km2, followed by 13, 4, 1, and 5 glaciers in the size classes of 0.5–1, 1–1.5, 1.5–2, and > 2 km2 covering an area of 8.84 ± 0.3, 4.86 ± 0.2, 1.86 ± 0.04, and 18.7 ± 0.4 km2, respectively. The glacier size class > 2 km2 is mostly dominated by the valley (compound basin and simple basin) and mountain glaciers (simple basin). All other topographically controlled parameters according to glacier size classes are mentioned in Table 2.
Out of the 74 counts, a majority of glaciers (64) are clean, covering an area of 28.4 ± 1.1 km2, with a mean size of 0.4 km2, followed by 7 partially debris-covered and 3 maximally debris-covered glaciers, with an area of 14.8 ± 0.4 km2 and 1.6 ± 0.1 km2, respectively. The mean sizes of partially debris-covered and maximally debris-covered glaciers are 2.1 and 0.5 km2. Debris types according to size classes are tabulated in Table 2.
Based on the morphological classifications, valley (simple-basin) glaciers are the dominant types in the CCW, covering an area of 17.9 ± 0.5 km2 (40 % of the total glacierized area), followed by mountain (simple-basin) glaciers (13.3 ± 0.5 km2), valley (compound-basin) glaciers (6.4 ± 0.1 km2), glacieret (ice aprons and snowfields) (2.9 ± 0.1 km2), cirque (2.5 ± 0.1 km2), and niche (1.7 ± 0.1 km2). The mean size of different morphological types is given in Table 3. The morphological classification pattern of glaciers in Sikkim (the eastern Himalaya) is different from that in the central and western Himalayan regions (Raina and Srivastava, 2008). Most of the valley (simple-basin) glaciers are clean, with an area of 13.5 km2 (75 %), only 16 % and 9 % are partially debris-covered (2.9 km2) and maximally debris-covered (1.6 km2) glaciers, respectively. Mountain (simple-basin) glaciers are clean with an area of 7.8 km2 (59 %), but 41 % are partially debris-covered (5.5 km2). Small glaciers (viz. cirque, niche, and glacieret) are completely clean in the watershed. The distribution of glaciers according to morphological types is also shown in Fig. 9.
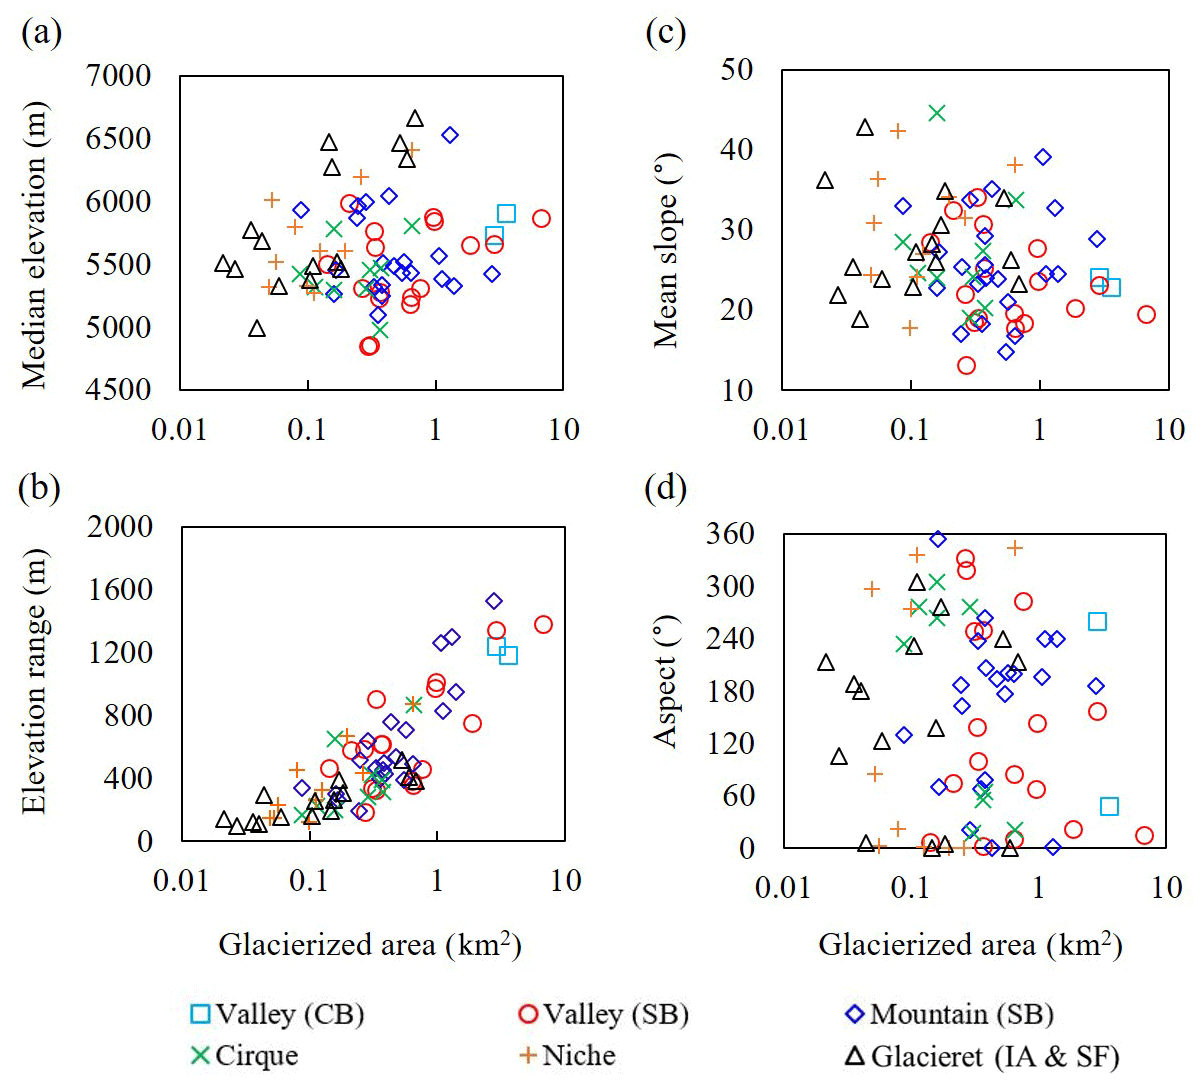
Figure 7Scatter plots showing relationships between different morphological types of glacierized area (km2) and (a) median elevation (m), (b) mean slope (∘), (c) elevation range (m), and (d) aspect (∘). Glacier characteristics are derived from the Sentinel-2A MSI and SRTM DEM.
Table 3Glacier parameters according to morphological types (2018) for the Chhombo Chhu Watershed based on Sentinel-2A and the SRTM DEM.

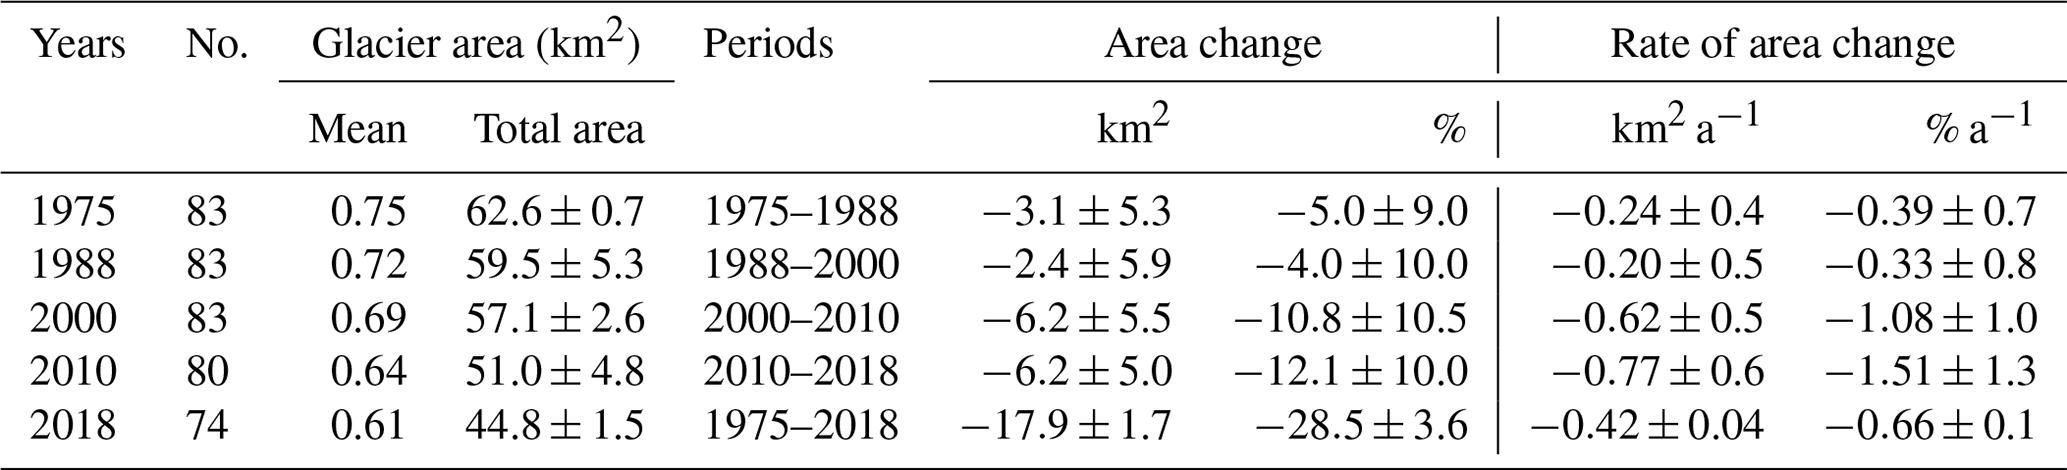
Table 4Glacier area dynamics in the total area of the Chhombo Chhu Watershed, the Sikkim Himalaya (1975–2018).
Topographic parameters such as elevation and slope also play crucial roles in the variations in regional characteristics of glacier distribution (Bhambri et al., 2011). The mean elevation of the glaciers ranges from 4846 to 6691 m, with an average of 5598 m (Fig. 6a). The mean elevation is higher than that of the other basins of the central and western Himalaya, such as the Alaknanda (5380 m), Bhagirathi (5544 m), Ravi (4828 m), Yamuna (5083 m), Sutlej (5436 m), Chenab (5064 m), Chandrabhaga (5373 m), and Indus (5404 m), and the Ladakh range (5497 m) (Bhambri et al., 2011; Frey et al., 2012; Schmidt and Nüsser, 2012; Chand and Sharma, 2015; Das and Sharma, 2018), which certainly reflects the fact that this study region located at an extreme northeast part of the Sikkim Himalaya has a cold semi-arid climatic condition. The studied glaciers have an average median elevation (5601 m) almost symmetrical to the mean elevation and range from 4846 to 6666 m, which is also a good proxy for the long-term equilibrium-line altitude (ELA) estimations based on topographic parameters (Braithwaite and Raper, 2009) (Fig. 7a). The glacier termini are located around an average minimum elevation of 5348 m with varying ranges from 4688 to 6529 m. Hence, large valley glaciers (simple basins) extend to the lower elevations, while smaller glaciers have higher termini. All other topographic parameters (minimum and maximum, average mean, and range of elevation) vary according to the size class and morphological types (Tables 2 and 3). Figure 6b shows the distribution of glaciers according to the elevation size classes and morphological types.
Glaciers in the watershed are distributed with a mean slope of 26∘, ranging from 12 to 45∘. It is evident that the larger glaciers have gentler slopes than the smaller ones, and morphologically, the mountain (simple-basin), cirque, niche, and glacieret (ice aprons and snowfields) glaciers have steeper slopes than valley (compound-basin and simple-basin) glaciers (Tables 2 and 3; Figs. 6 and 7). Similar average slopes were observed in the other basins of Sikkim in the eastern Himalaya (Racoviteanu et al., 2015; Debnath et al., 2019) and western Himalaya (Frey et al., 2012).
The area distribution by aspect sector shows that the glaciers are predominantly oriented towards the north (∼ 34 %), followed by towards the south (∼ 15 %) (Fig. 8a). Based on glacier size classes, it is found that the majority aspect is northern, except 1–1.5 km2, which has a southwest orientation (Table 2). The valley (simple-basin), cirque, and niche glaciers are mainly oriented towards the north with 54 %, 38 %, and 81 %, respectively, while the valley (compound-basin), mountain (simple-basin), and glacieret (ice aprons and snowfields) glaciers have a northeast (∼ 55 %), south (∼ 49 %), and southwest (∼ 46 %) aspect, respectively.
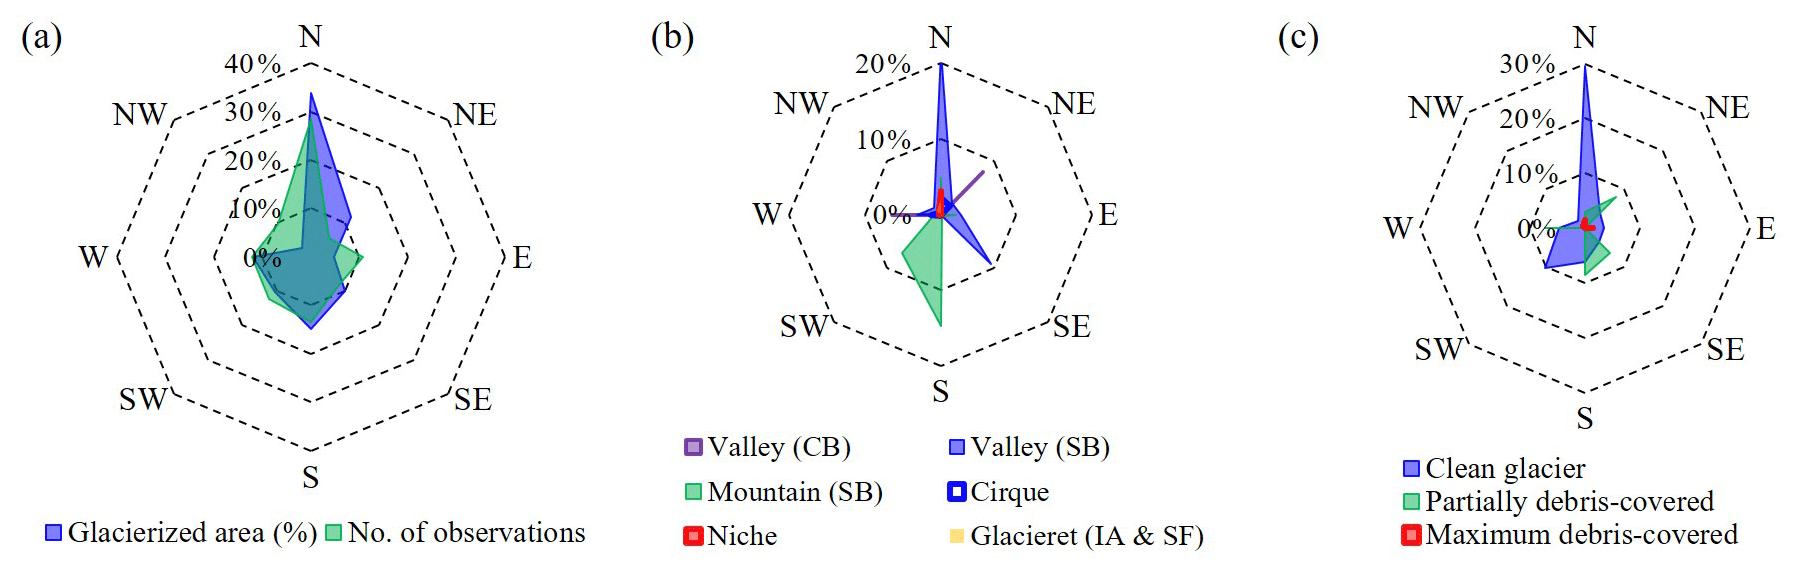
Figure 8Distribution of the glaciers (74) according to aspect in the CCW based on the Sentinel-2A MSI (26 November 2018) and SRTM DEM. (a) Glacier frequency distribution and total glacierized area in percent; (b) glacierized area (%) according to morphological types; (c) glacierized area (%) in relation to debris-covered types. All the data are as percentages (%), and on average, the glaciers in this watershed are predominantly oriented towards the N (0∘) followed by towards the S (180∘).
4.2 Glacier area change (1975–2018)
Spatio-temporal change analysis reveals that the total glacier areal coverage across the entire study region in 1975 was 62.6 ± 0.7 km2 (mean area 0.75 km2) and that, by 2018, this area had reduced to 44.8 ± 1.5 km2 (mean area 0.61 km2) (Fig. 10a). There is a total areal reduction of 17.9 ± 1.7 km2 (∼ 28.5 ± 3.6 %) over the 43-year analysis period (Table 4; Fig. 10c). The annual rate of glacier loss tends to vary over the different time frames, with an initial shrinkage rate of 0.24 ± 0.4 km2 a−1 between 1975 and 1988, which is slightly higher than from 1988 to 2000 (0.20 ± 0.5 km2 a−1). Between 2000 and 2010, the shrinking rate increased to 0.62 ± 0.5 km2 a−1 and remained higher between 2010 and 2018 (0.77 ± 0.6 km2 a−1). The overall glacier loss rate between 1975 and 2018 is 0.42 ± 0.04 km2 a−1 (∼ 0.66 ± 0.1 % a−1) (Table 4). The annual glacier loss rate exhibits a declining trend in the Ravi and Chenab basins of the northwestern Himalaya during 2001–2013 (Chand and Sharma, 2015; Brahmbhatt et al., 2017). A scatter plot compares the relationship of the area of individual glaciers recorded in 1975 and 2018. This diagram shows that the individual glacier surface area has reduced, as well as that 10 glaciers disappeared altogether over 43 years in this watershed (Fig. 10b). Only one glacier (i.e. Chhuma Khangse-1) shows fragmentation into two during 2010 and 2018 (Fig. 12a, b). The Gurudongmar Khangse, a valley (simple-basin) glacier, which was influenced by a large supraglacial lake (SGL-3) observed in 1975, later developed into a potentially dangerous moraine-dammed proglacial lake (Worni et al., 2013) and retreated from 3.7 ± 0.03 to 1.9 ± 0.04 km2 (−1.1 ± 0.06 % a−1) over the period between 1975 and 2018 (Fig. 12e, f).
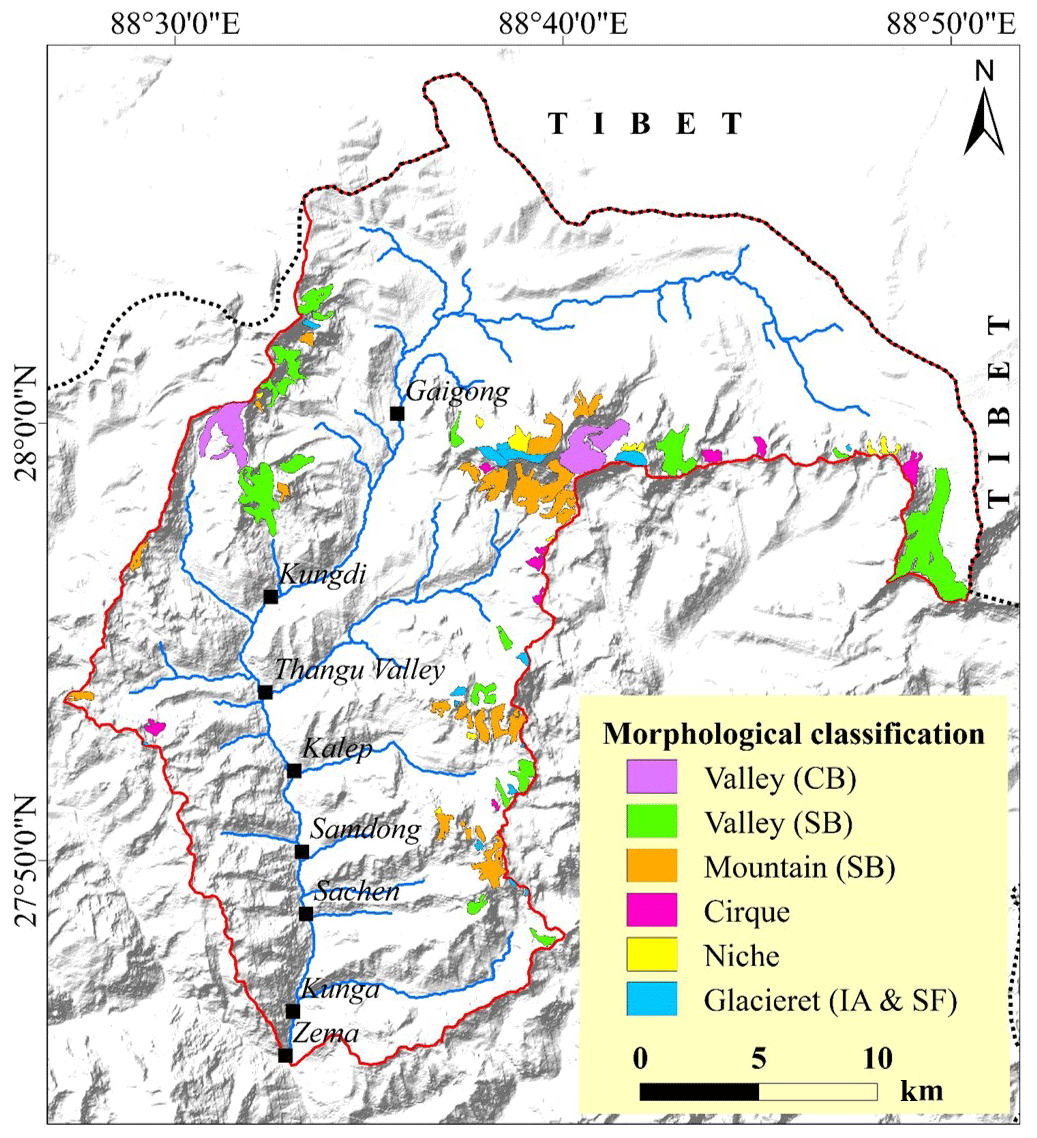
Figure 9Morphological classification of glaciers in the CCW, Sikkim Himalaya. The base map is the hill-shaded relief map of the SRTM DEM.
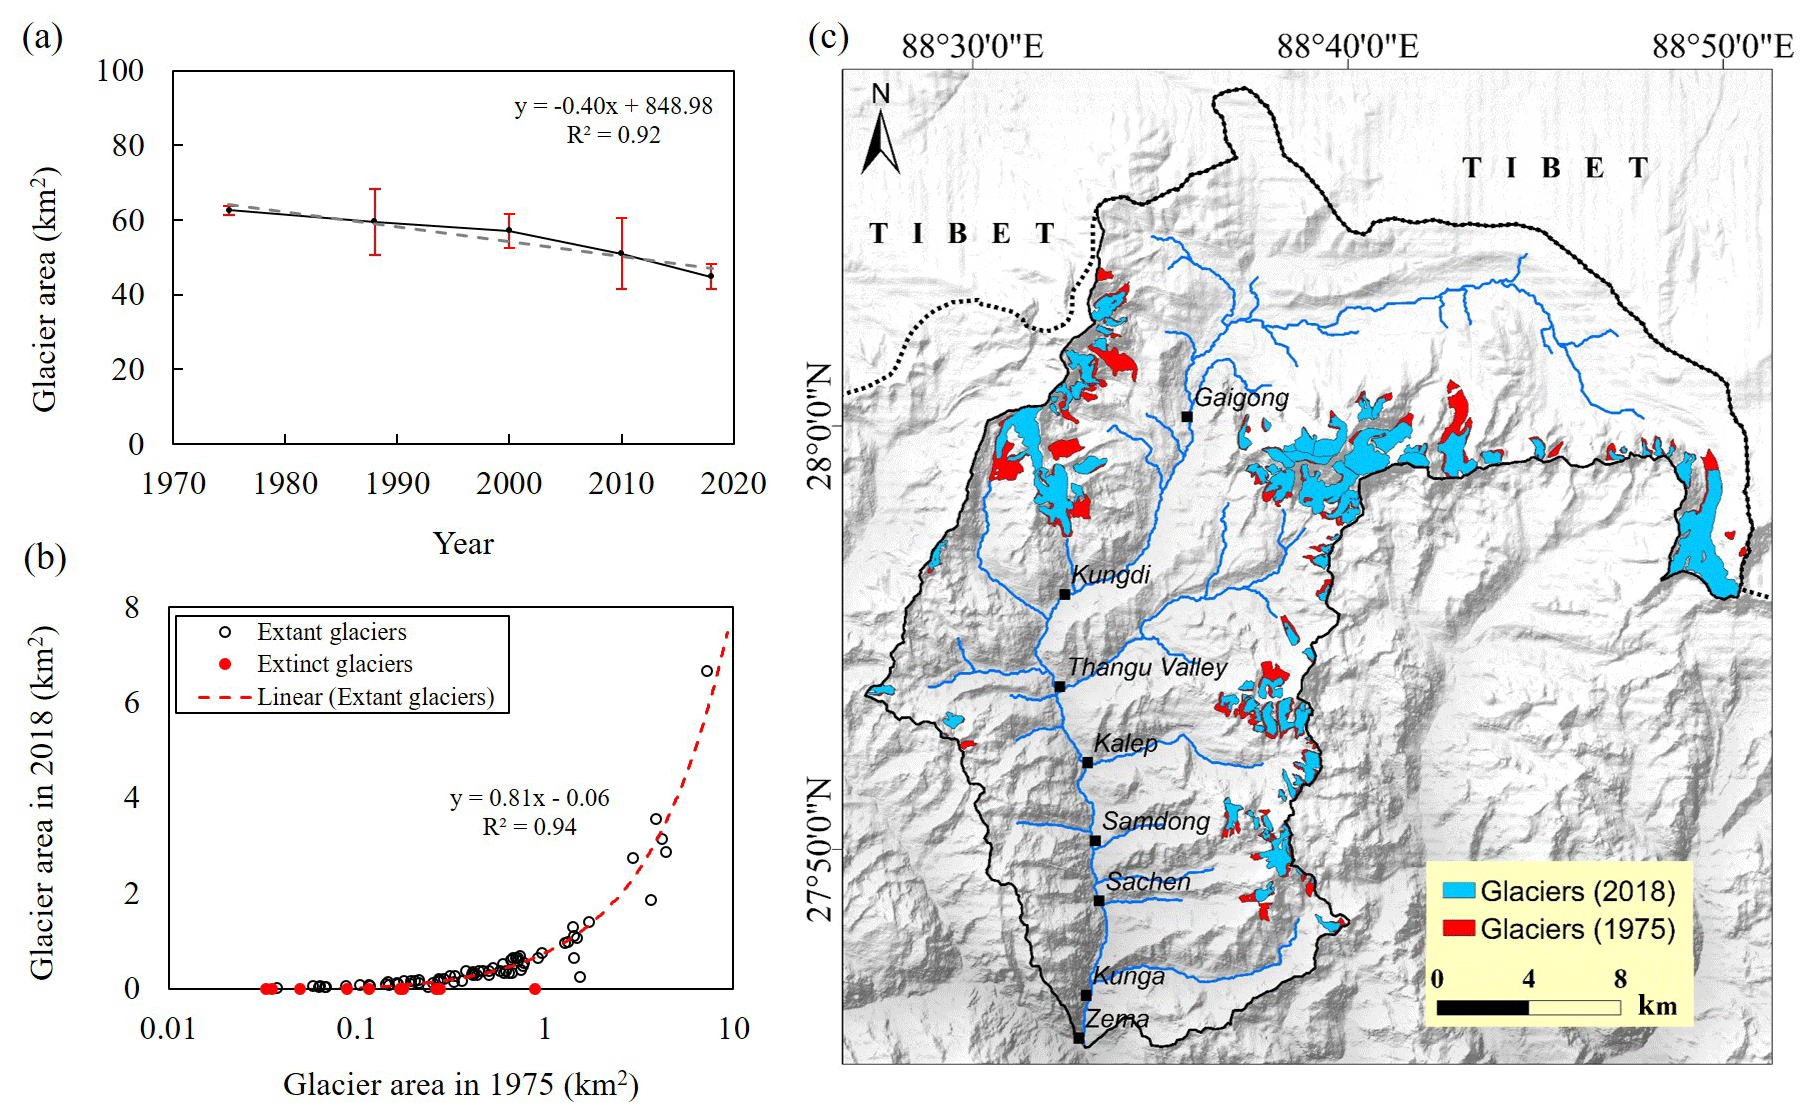
Figure 10Glacier surface areal change in the Chhombo Chhu Watershed: (a) total glacier area change (dashed grey line is exponential best-fit relationship with associated equation and R2 value). Error bars are the uncertainty (%) of respective years estimated using Eq. (1); (b) scatter plot of glacier area of 1975 and 2018. Red bullets in the graph indicate the 10 extinct glaciers during the phase of 1975–2018; (c) glacier change 1975–2018 for the study region. The base map is the hill-shaded relief map of the SRTM DEM.
Table 5Glacier area changes as per size class (1975–2018) in the CCW.
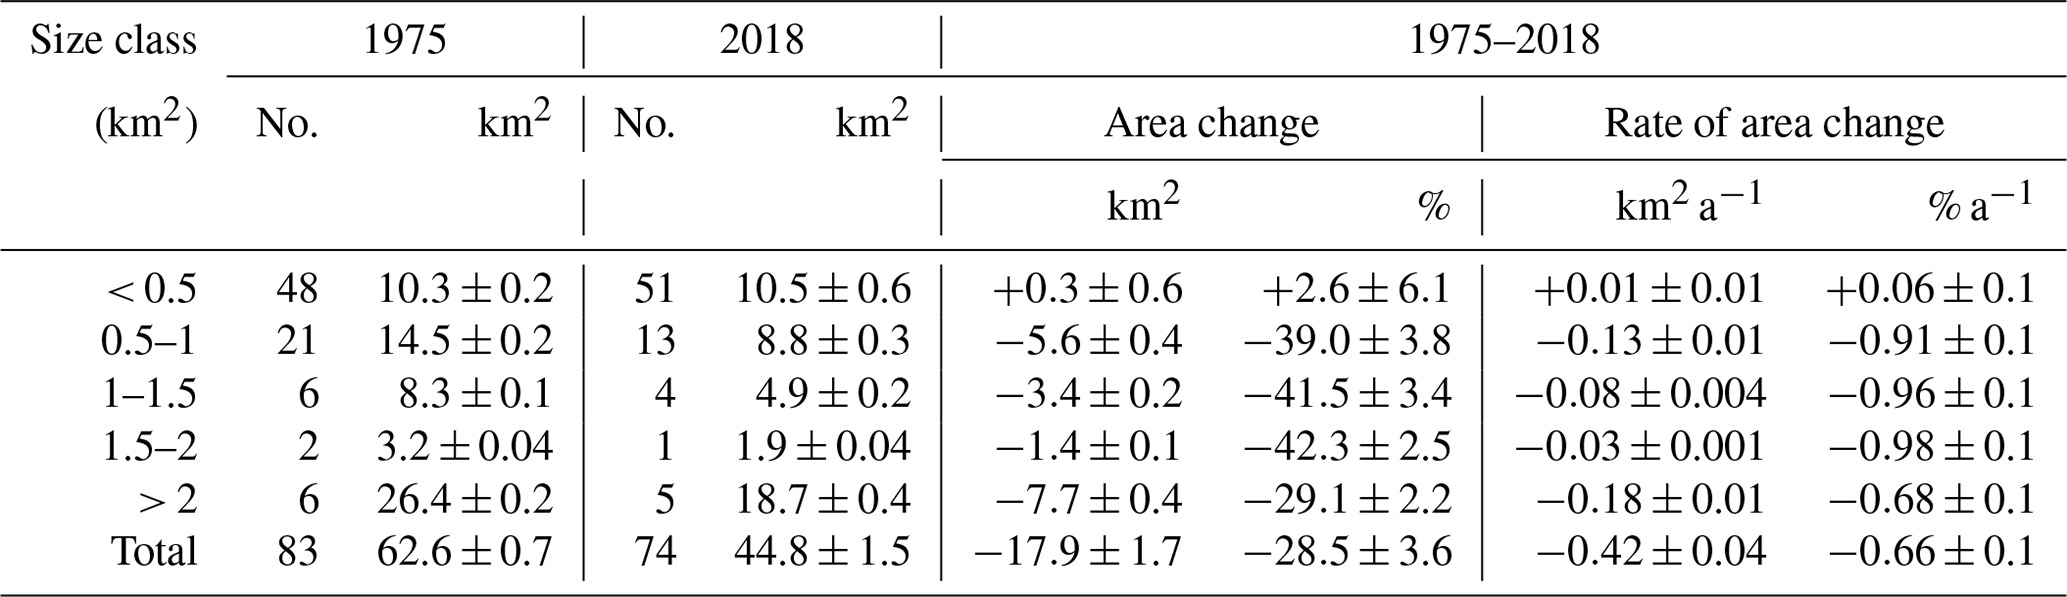
In 1975, the total number of clean glaciers was 72, which decreased to 64 in 2018. The clean-glacier area decreased from 40.3 ± 0.5 km2 (1975) to 28.4 ± 1.1 km2 (2018), with an area change of km2 (−0.27 ± 0.03 km2 a−1). The partially debris-covered glacier area also decreased from 19.8 ± 0.2 km2 (1975) to 14.8 ± 0.4 km2 (2018), an area change of −5.0 ± 0.4 km2 (−0.12 ± 0.01 km2 a−1). Similarly, the maximally debris-covered glacier area change has been −1.0 ± 0.1 (−0.02 ± 0.002 km2 a−1) since 1975 (Fig. 11e). During 1975–2018, the glacier size class of > 2 km2 lost a maximum area of km2 (−0.18 ± 0.01 km2 a−1). Due to the glaciers having a longer length and lower terminus position, they receded at a higher rate due to higher negative mass balance at the lower elevation. This is followed by the size class of 0.5–1 km2 (−5.6 ± 0.4 km2 or −0.13 ± 0.01 km2 a−1), 1–1.5 km2 ( km2 or −0.08 ± 0.004 km2 a−1), and 1.5–2 km2 (−1.4 ± 0.1 km2 or −0.03 ± 0.001 km2 a−1). On the contrary, the glacier size class of < 0.5 km2 has gained in area by +0.3 ± 0.6 km2 (+0.01 ± 0.01 km2 a−1) since 1975. But in terms of relative figures, the size class of 1.5–2 km2 lost a maximum area of −42.3 ± 2.5 % (−0.98 ± 0.1 % a−1), more than any other size class, which is shown in Table 5.
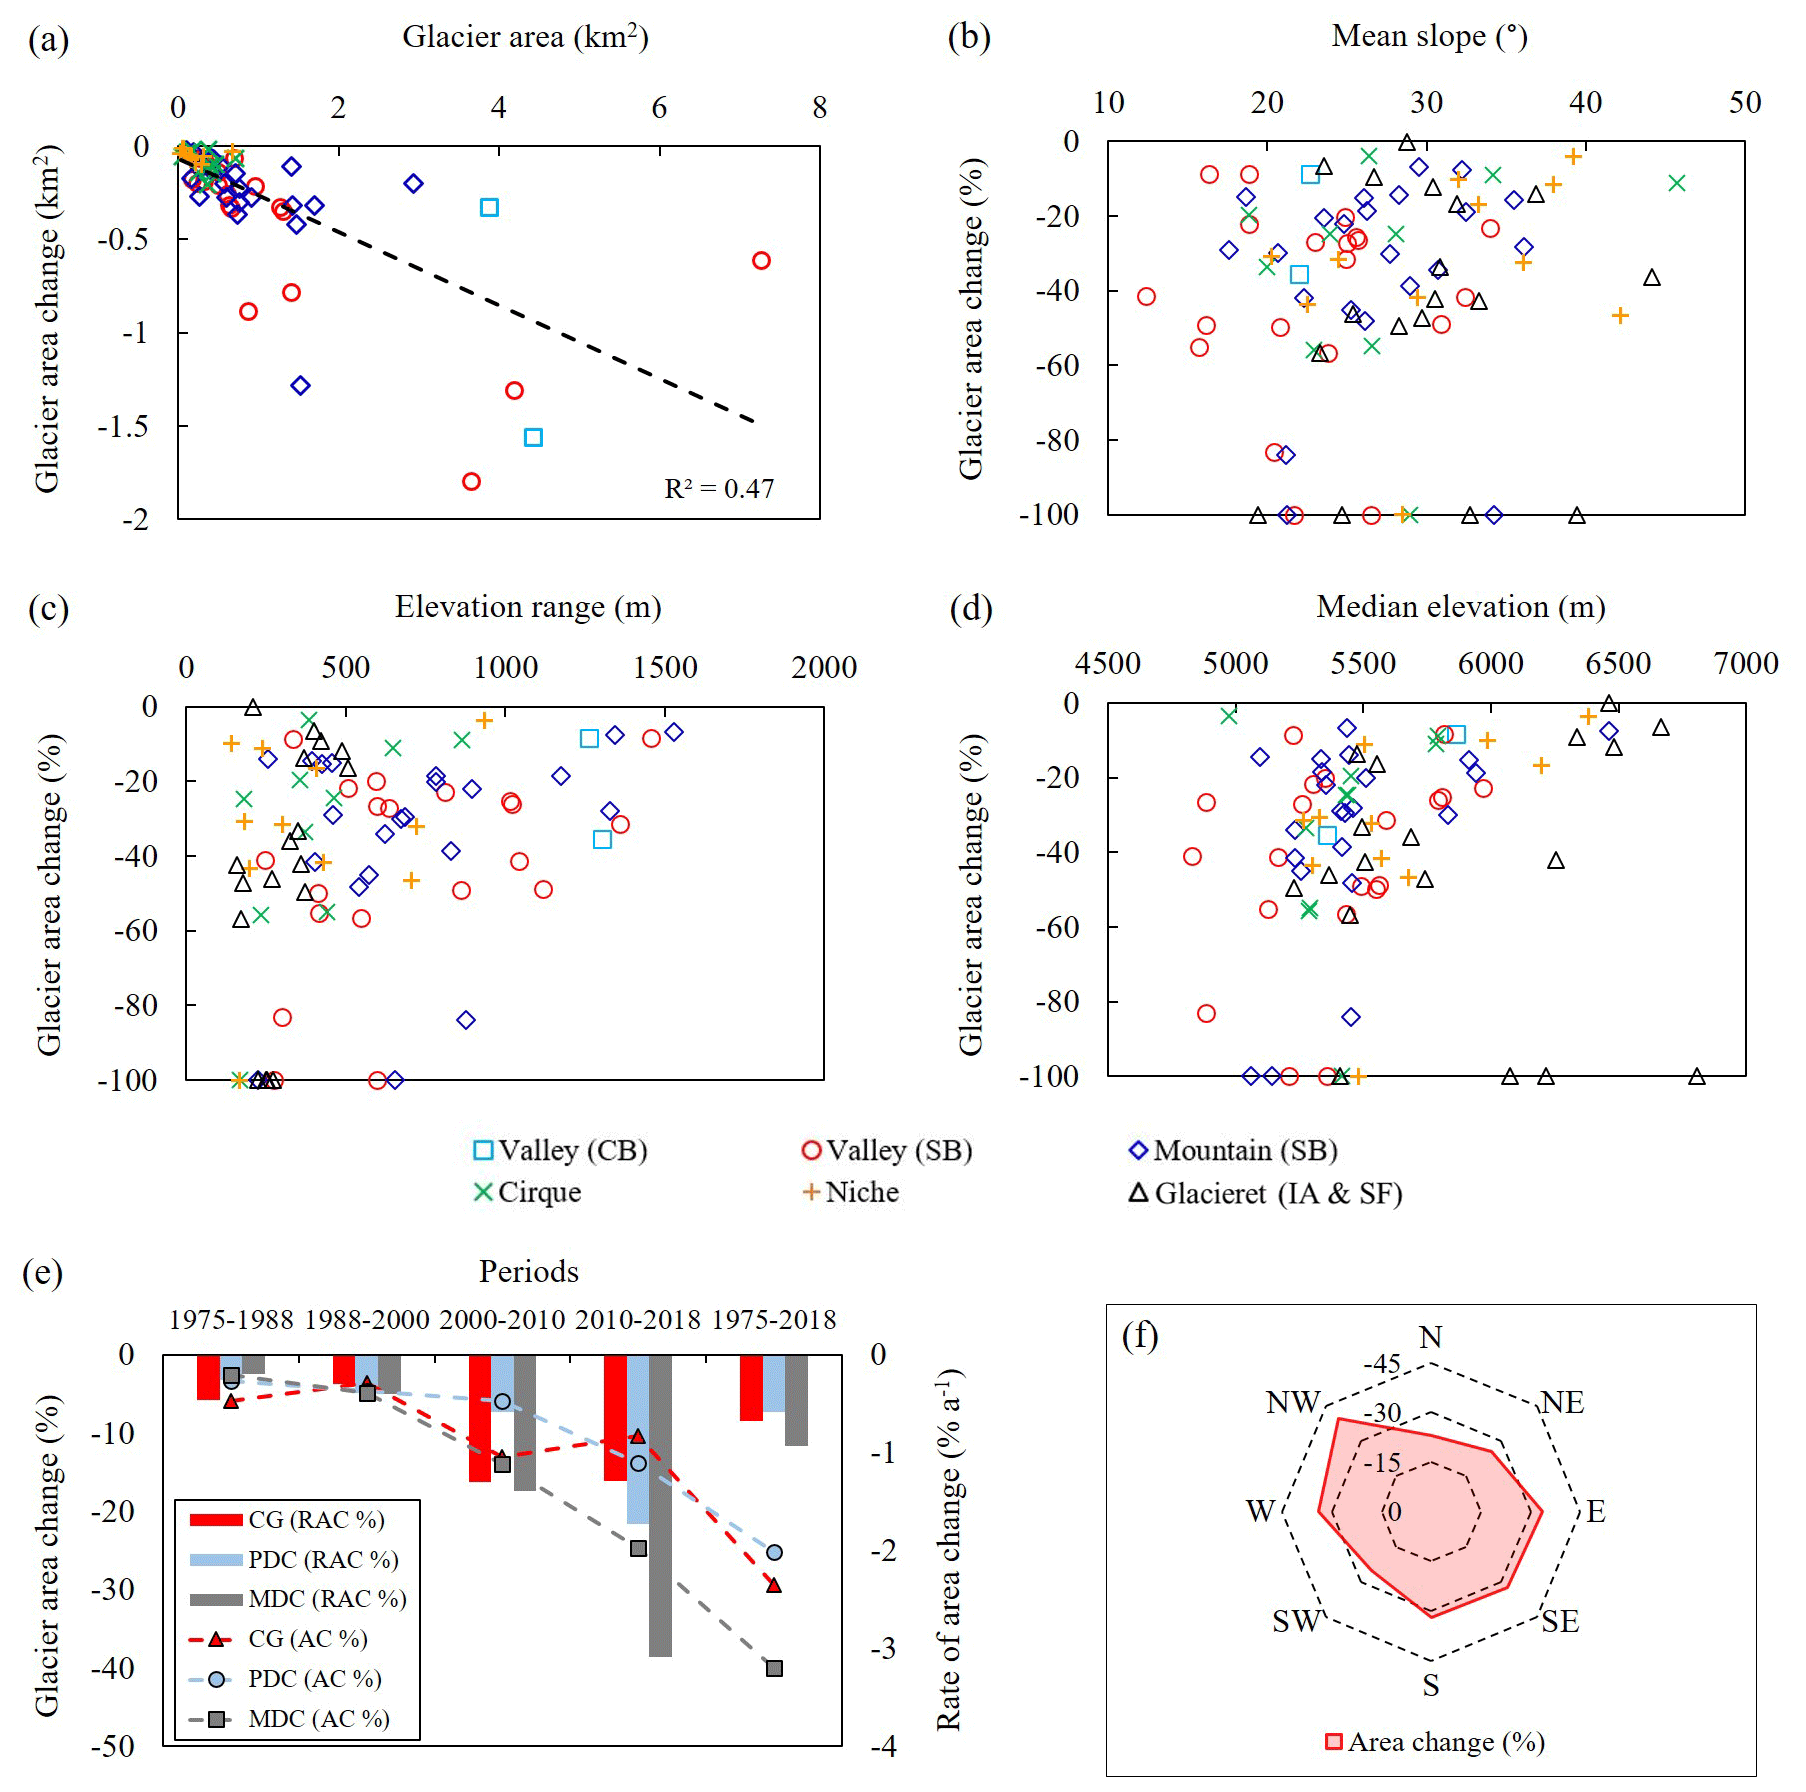
Figure 11Scatter plots showing the relationships between glacier area changes during 1975–2018 and (a) glacier area (km2), (b) mean slope (∘), (c) elevation range (m), (d) median elevation (m), (e) different periods of debris cover types, and (f) aspects (∘).
The glacier area changes according to morphological types are tabulated in Table 6. Valley (simple-basin) glaciers have lost a maximum percentage area of −8.4 ± 0.6 km2 (−0.19 ± 0.01 km2 a−1) in the watershed, more than the other glacier morphological types. It is found that the maximum glacier area loss takes place at the lower terminus elevation and at the lesser slopes of large valley (simple-basin) glaciers compared to the other morphological types (Table 6; Fig. 11b–d). For example, some notable large valley (simple-basin and compound-basin) glaciers have significantly retreated since 1975, such as Lachen Khangse-1 (∼ 100 %), Chombu Khangse (∼ 55.1 %), Gurudongmar Khangse (∼ 49.1 %), Tasha Khangse (∼ 35.3 %), Chhuma Khangse-1 (∼ 31.3 %), Kangchengyao-2 (∼ 8.4 %), and Tista Khangse (∼ 8.3 %) in the study region.
This study records the maximum percentage of glacier area recession and its annual change rates from the northwest (−39.8 ± 6.6 % or −0.93 ± 0.2 % a−1) aspect, followed by the west (−34.2 ± 3.7 % or −0.80 ± 0.1 % a−1) and east (−33.6 ± 5.2 % or −0.78 ± 0.1 % a−1) (Fig. 11f). But in terms of absolute area change, glaciers with a northern aspect lost a maximum area of −4.6 ± 0.5 km2, followed by glaciers with a south (−3.1 ± 0.3 km2), west (−2.8 ± 0.2 km2), southeast (−2.2 ± 0.2 km2), and northeast (−1.8 ± 0.1 km2) aspect. Since 1975, the glaciers with a mean slope of between 15 and 30∘ exhibit a relatively higher retreat rate (Fig. 11b). All these above factors suggest that the glacier's response to climate change is largely controlled by individual glacier morphology, clean-ice and debris cover characteristics and their associated topographical parameters (e.g. size, length, slope; minimum, mean, and range of elevation; and orientation) on their surfaces within the study region.
Table 6Glacier area changes according to morphological types (1975–2018) in the CCW.
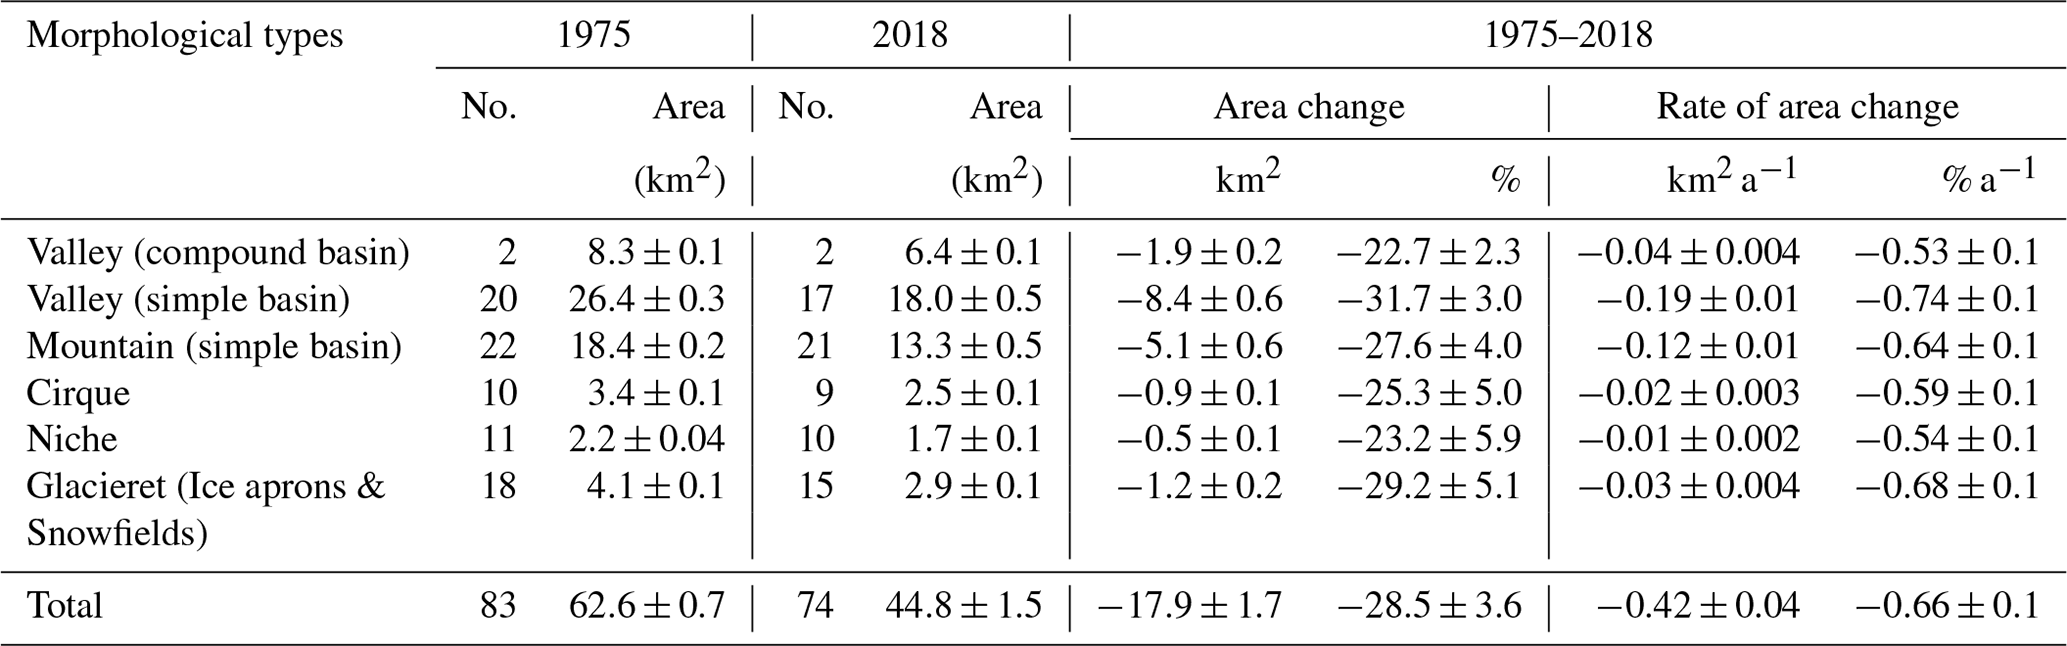
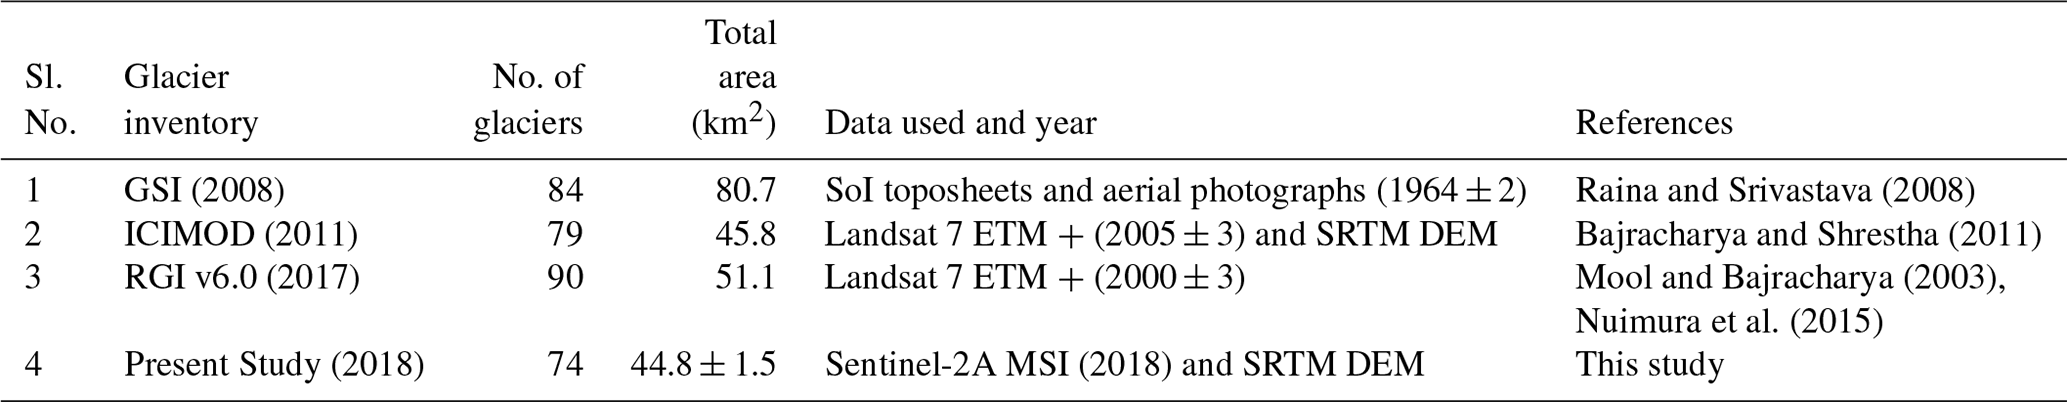
Table 7Comparison of glacier inventory within the study region (CCW).
5.1 Comparative evaluation of glacier inventory in the Chhombo Chhu Watershed
The present study is an up-to-date glacier inventory (2018) for the CCW in the Sikkim Himalaya based on the higher-resolution Sentinel-2A MSI satellite image, Google Earth imagery, and field-based observations. We have identified 74 glaciers with a total area of 44.8 ± 1.5 km2 in the CCW for 2018, and this result was compared with some recently published work of the Geological Survey of India (GSI) (Raina and Srivastava, 2008), primarily based on the SoI topographical sheets and aerial photographs. We also compared our results with the glacier outlines compiled by ICIMOD (Bajracharya and Shrestha, 2011) and RGI v6.0 (Mool and Bajracharya, 2003; Nuimura et al., 2015). Table 7 shows that the results of the observed total glacier count and the glaciers' area in this current study (2018) were very different from the ICIMOD (2005 ± 3) database (79 glaciers covering a total area of 45.8 km2) almost a decade later. In comparison with RGI v6.0 (2000 ± 3) glacier inventory data (90 glaciers covering a total area of 51.1 km2), glacier count was overestimated (by 7 glaciers) and the total area was underestimated (−6 km2) in the CCW. The major reasons for these different results in the RGI v6.0 database were due to misinterpretation of a single-glacier domain (based on slope, aspect, and glacier divide) resulting in multiple outlines derived from automated mapping. RGI v6.0 did not delineate some glacier boundaries, mainly in the western part of the watershed (e.g. Lachung Khangse and other unnamed glaciers) (Fig. 13a, b).
The GSI glacier inventory presented an overestimated total glacierized area (84 glaciers covering a total area of 80.7 km2) compared to our estimated area in 1975 (a decade later) using the KH-9 image. The possible reasons for this overestimation were due to topographic map scale limitations (1 : 50 000) and uncertainties in glacier outlines due to seasonal snow and debris cover (Raina and Srivastava, 2008; Chand and Sharma, 2015). A previous study by Bhambri and Bolch (2009) also found certain inaccuracies with these topographic maps, originally derived from aerial photographs acquired during March–June (1964 ± 2), when seasonal snow can create a problem for the correct delineation of glaciers. Thus, many earlier researchers reported similar disadvantages, such as (i) misinterpretation of clean and debris-covered glaciers derived from automated mapping, (ii) misclassification of seasonal snow as glaciers, (iii) temporal and spatial differences in acquired images and the mapping period, and (iv) division of a single ice mass into multiple-glacier domains and vice versa without checking the local topographical distribution (i.e. slope, orientation, and glacier divide) for the delineation process (Bhambri et al., 2011; Chand and Sharma, 2015; Das and Sharma, 2018).
The number of glaciers was also reduced from 83 (1975) to 74 (2018). A similar trend is reported in the Changme Khangpu basin (−0.45 ± 0.001 km2 a−1) of Sikkim in the eastern Himalaya between 1975 and 2016 (Debnath et al., 2019).
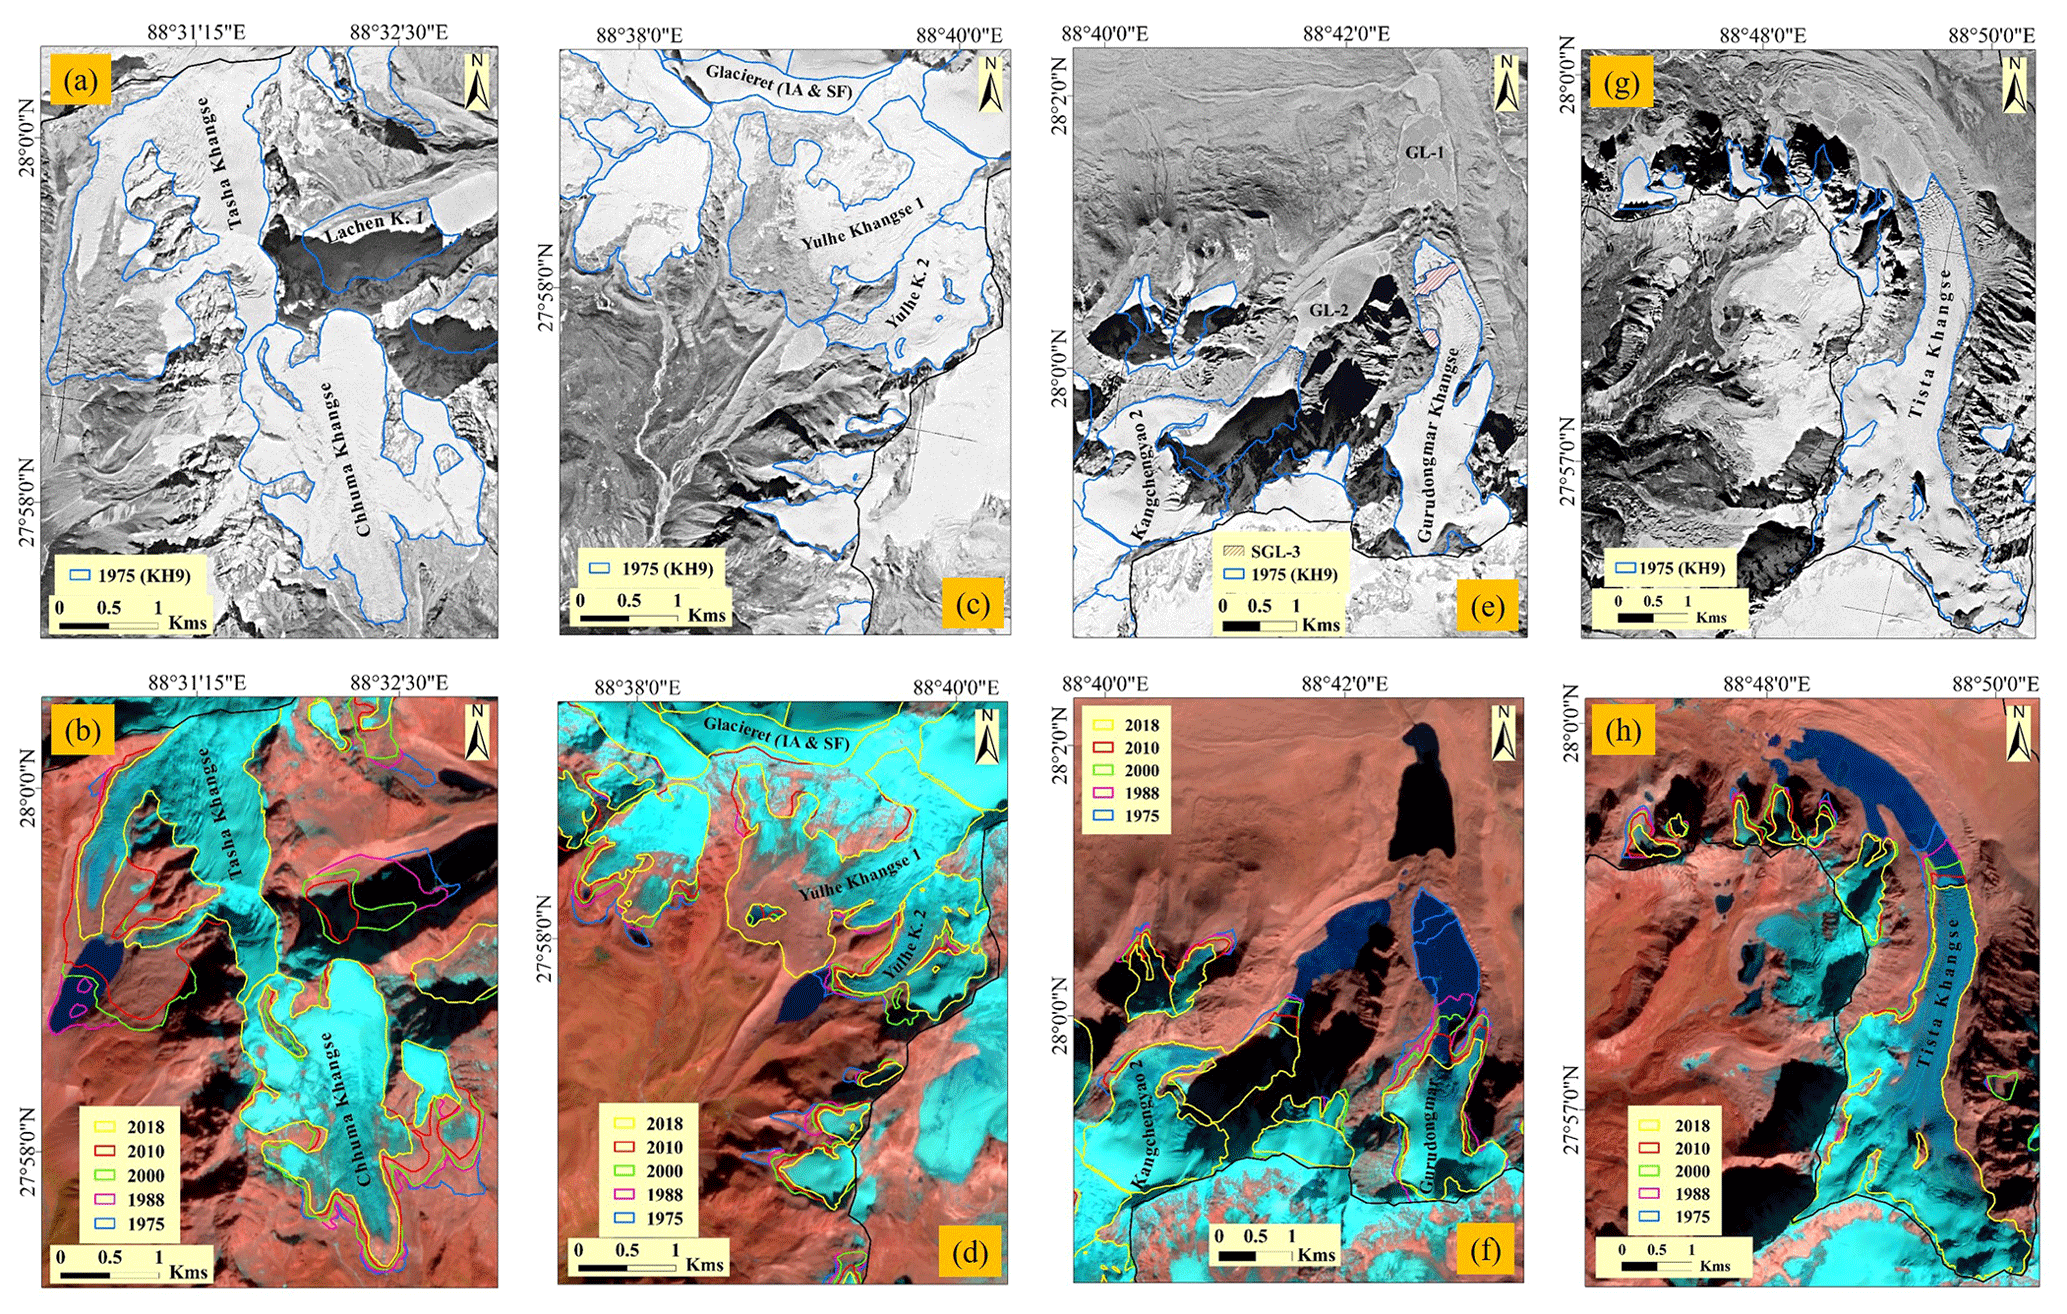
Figure 12Glacier areal change (east to west direction from the right) in the Chhombo Chhu Watershed from 1975 to 2018: (a, c, e, g) Glacier outlines (in blue) drawn on the rectified subsets of declassified Hexagon (KH-9) image (20 December 1975) based on the spline transformation method with similar-year glacier outline; (b, d, f, h) spatio-temporal areal change of different glaciers in the watershed are overlaid on the Sentinel-2A MSI (2018) imagery.
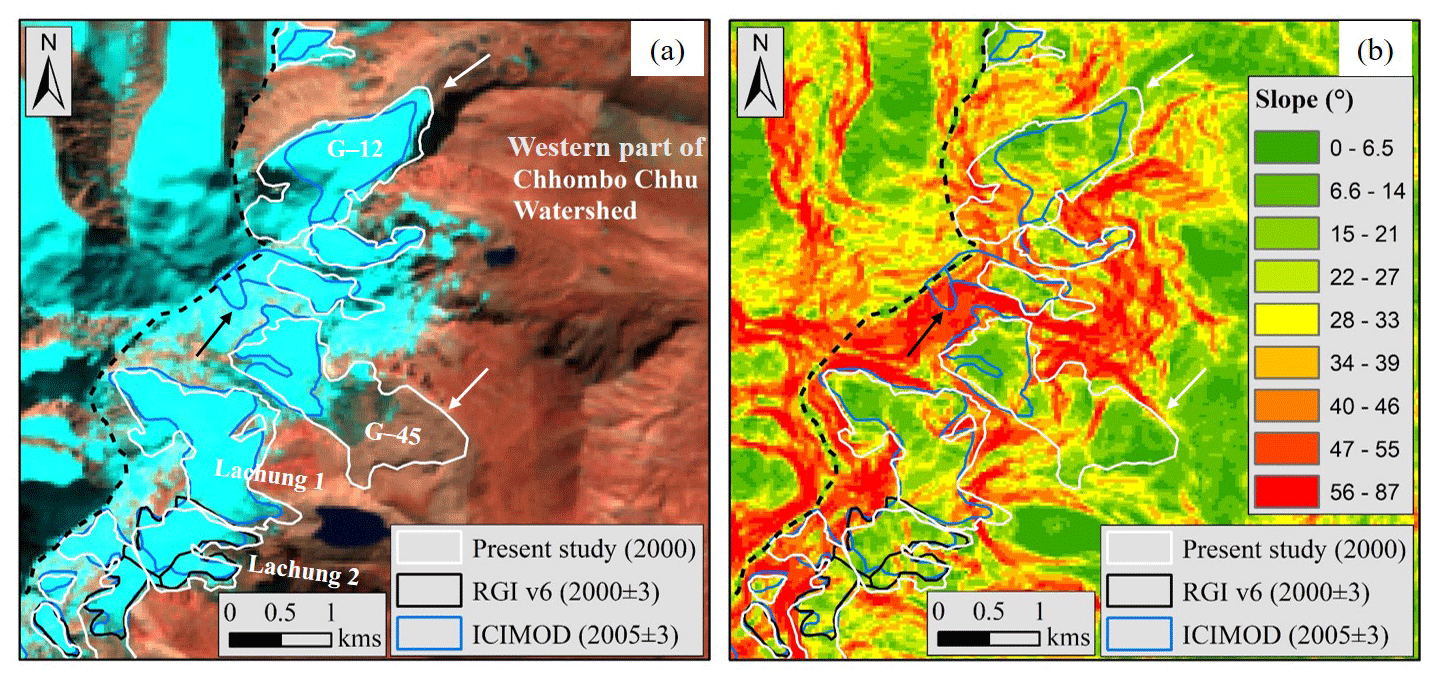
Figure 13Glacier inventory: (a) overlay of glacier outlines of different inventories on Landsat 7 ETM+ 8 November 2000 image; (b) slope map (in ∘) showing the misinterpretation of glacier boundary and ice and sub-watershed divides. Dashed black lines represent the watershed divide.
5.2 Topographic controls on area changes
The spatio-temporal fluctuations of the glacier are solely dependent on the local topographic parameters such as glacier size, elevation (minimum, maximum, mean, and range), slope and orientation, and debris cover patterns under existing similar climatic conditions. The high mountain divide (i.e. Kangchengyao–Pauhunri Massif) plays a significant role in imposing strong topographic influences between the northbound and southbound glacier fluctuations in the region. Glacier size is also a determining factor for area change. The area of size class (< 0.5 km2) has gained mainly due to the fragmentation and area reduction of existing glaciers in the watershed (Table 5). The overall tendency of glacier area loss for the class < 2 km2 reveals that small-size glaciers are more sensitive to and good indicators of climate change. This is because of their faster response to relatively short-term climate variations (Paul et al., 2004b). We also found a positive correlation (R2=0.47) between glacier area and absolute glacier area change (Fig. 11a). About 12.1 % of the total glaciers with an area of 2.1 km2 have entirely disappeared, and 1.2 % of individual glaciers have formed out of fragmentation from the main glacier mass in the study region since 1975.
The debris cover characteristics play a significant role in the glacier area change in this study as well. This study observed that the number of clean glaciers is dominant in the CCW of the Sikkim Himalaya. The clean-glacier area changed at a higher rate of −0.27 ± 0.03 km2 a−1 than the partially debris-covered (−0.12 ± 0.01 km2 a−1) and maximally debris-covered (−0.02 ± 0.002 km2 a−1) glaciers. In this study, partially debris-covered glaciers exist on the southern (∼ 25 %) slope, whereas such debris coverage is insignificant for the north-facing glaciers, as most of these (∼ 26 %) are clean glaciers, and such kinds of observations are also found in the Bhutan Himalaya by Kääb (2005). This intensive debris supply probably originated from the surrounding steep rock faces of the glaciers on the southern slopes (Frey et al., 2012), which in turn insulate the debris-covered glacier ice to form several dynamic thermokarst features such as depressions and supraglacial ponds in the lower part of the glacier tongues (Kääb, 2005). This study observed that a relatively gentle slope with lower elevations in the ablation areas could be favourable for the abundant supply of supraglacial debris.
The difference in glacier area loss on the western (2.8 ± 0.2 km2 or 0.06 ± 0.005 km2 a−1) and eastern (1.1 ± 0.1 km2 or 0.06 ± 0.003 km2 a−1) aspects during 1975–2018 can be described as more effective melting on the western slopes taking place during the afternoon due to a combination of more incident solar radiation and warmer air temperature (Evans, 2006). Besides, the north-facing glaciers (including northwest, north, and northeast) in this region are more susceptible to area loss (7.1 ± 0.7 km2 or 0.17 ± 0.02 km2 a−1) than the south-facing glaciers (including southeast, south, and southwest), which had a total area recession of 6.9 ± 0.6 km2 or 0.16 ± 0.01 km2 a−1. North-facing glaciers are mostly clean glaciers that are highly variable with short-term temperature and precipitation changes. Moreover, direct insolation on the northern-aspect glaciers lying at the fringe of the Tibetan Plateau might have retreated faster under the rising temperature. Here, the “plateau flat surface heating” effect over the more highly elevated semi-arid terrain reported by Brazel and Marcus (1991) can be an effective controlling parameter for the larger amount of glacier area loss from the northern aspects. This is because the glaciers located at the higher elevations above 5300 m a.s.l. on the north face of the Kangchengyao–Pauhunri Massif (i.e. Gurudongmar and Tista Khangse) are an extension of the Trans-Himalaya of the Tibetan Plateau, an undulating flat surface mostly devoid of vegetation as compared to the southern part in the Thangu valley. Semi-arid more highly elevated plateau-type topography receives higher insolation and as a result has warmer land surface temperatures (Brazel and Marcus, 1991).
Our field measurements during 1–4 December 2018 (10:00 to 13:00 IST) confirms that mean infrared temperatures of rock (14 ∘C), water (2.7 ∘C), and grass (11.5 ∘C) on the flat surfaces in the proximity of the Gurudongmar lake region (> 5150 m) are higher due to more incoming solar radiation than the sloping mountainous terrain near the Thangu valley (3900 m) in the south. For example, the mean infrared temperature of rocks, water, and grasses near the Thangu valley was measured as 4.2, 5.1, and 11.3 ∘C, respectively. These recorded data reveal the concept of the plateau flat surface heating effect and a direct impact of the incident solar radiation and effects of shadows on the glacier area change on the northern aspects (Schmidt and Nüsser, 2012).
5.3 Regional comparison with other Himalayan basins
The mean glacier size of the CCW is 0.61 km2, which is almost similar to other glacierized basins of the Himalaya, e.g. Ravi (0.6 km2), Changme Khangpu (0.9 km2), and Ladakh (1 km2), but comparatively much smaller than the Chenab (1.15 km2), Jankar (1.2 km2), Zemu (1.24 km2), Shyok (1.4 km2), Baspa (1.7 km2), and Saraswati–Alaknanda (3.7 km2) basins (Bajracharya and Shrestha, 2011; Bhambri et al., 2011; Frey et al., 2012; Schmidt and Nüsser, 2012; Chand and Sharma, 2015; Mir et al., 2017; Das and Sharma, 2018; Debnath et al., 2019). The present study shows a significant total glacier area loss of 17.9 ± 1.7 km2 (28.5 ± 3.6 %) with a recession rate of 0.42 ± 0.04 km2 a−1 (0.66 ± 0.1 % a−1) from 1975 to 2018 in the CCW (Sikkim) eastern Himalaya. In the Sikkim Himalaya, a recent study by Debnath et al. (2019) reported a glacier area loss of 20.7 ± 3.3 % (0.51 ± 0.001 % a−1) in the Changme Khangpu basin between 1975 and 2016. Racoviteanu et al. (2015) revealed a glacier area loss of 20.1 ± 8 % (0.52 ± 0.2 % a−1) in the proximity to the Kanchenjunga region on the Sikkim side during 1962–2000. Garg et al. (2019) reported a comparatively much lower glacier area loss of 5.4 ± 0.9 % (0.2 ± 0.04 % a−1) for the 23 randomly selected glaciers in Sikkim (1991–2015) primarily based on medium-spatial-resolution to higher-spatial-resolution remote sensing datasets. Similarly, Basnett et al. (2013) have also reported a total loss of 3.3 ± 0.8 % (∼ 0.2 ± 0.1 % a−1) for 39 glaciers between 1989 and 2010 in the Sikkim Himalaya. These published results are comparatively much lower than those of our study because (i) a shorter time-period analysis (1990s onwards) was used and (ii) only selected glaciers were mapped for both the case studies. Further east in the Bhutan Himalaya, Bajracharya et al. (2014) estimated a comparatively higher glacier area loss of 23.3 ± 0.9 % (0.8 ± 0.03 % a−1) between the 1980s and 2010 based on a series of Landsat satellite images.
For the central Himalaya, Bolch et al. (2008) revealed a planimetric recession of 5.2 % (0.12 % a−1) in the Khumbu Himalaya of the Everest region in Nepal from 1962 to 2005 based on Corona, Landsat TM, and ASTER satellite datasets. Similarly, a glacier loss of 5.9 % (0.2 % a−1) was reported from the Tamor basin of eastern Nepal during 1970–2000 (Bajracharya and Mool, 2006). However, a significant area loss of 16.9 ± 6 % (0.44 ± 0.2 % a−1) in the Kanchenjunga region of eastern Nepal (Tamor and Arun basins) between 1962 and 2000 was also reported by Racoviteanu et al. (2015). Bhambri et al. (2011) reported a comparatively lower glacier recession of 4.6 ± 2.8 % (0.1 ± 0.1 % a−1) in the Bhagirathi and Saraswati–Alaknanda basins of the Garhwal Himalaya from 1968 to 2006 based on higher-resolution Corona and Cartosat-1 images.
In the context of the western Himalaya, Chand and Sharma (2015) reported a total glacier area recession of 4.6 ± 4.1 % (0.1 ± 0.1 % a−1) in the Ravi basin of Himachal Pradesh based on high-resolution Corona KH-4B, Landsat ETM+ pan-sharpened, and WorldView-2 imagery from 1971 to 2010/2013. Schmidt and Nüsser (2012) estimated a relative ice cover loss of 14.3 % (0.3 % a−1) in the Trans-Himalayan Kang Yatze Massif region of Ladakh during 1969–2010 based on high-resolution images (Corona, SPOT 2, WorldView-1, and Landsat series). Several other studies in the western Himalaya also revealed a total glacier area loss, of 12 ± 1.5 % in the Sindh and Lidder basins of Kashmir from 1996 to 2014 (Ali et al., 2017), 7.5 ± 2.2 % (0.2 ± 0.1 % a−1) in the Jankar Chhu Watershed of the Lahaul and Spiti valleys during 1971–2016 (Das and Sharma, 2018), 6.0 ± 0.02 % (0.1 ± 0.0004 % a−1) in the Suru sub-basin of Jammu and Kashmir between 1971 and 2017 (Shukla et al., 2020), and 8.4 % (0.3 % a−1) in Naimona'nyi region of the southwest Tibetan Plateau from 1976 to 2003 (Ye et al., 2006). However, noticeable deglaciation of 18.1 ± 4.1 % (0.5 ± 0.01 % a−1) in the Baspa basin of the Sutlej River between 1976 and 2011 using Landsat data series along with SoI toposheets and Indian remote sensing satellite (IRS) LISS-3 was reported by Mir et al. (2017). Again, in another study, Kulkarni et al. (2007) reported a much higher recession rate, of 22 % (0.6 % a−1) and 21 % (0.5 % a−1) in the Parbati and Chenab sub-basins of the Beas River and 19 % (0.5 % a−1) in the Baspa region of the Sutlej River during 1962–2001/2004 based on SoI toposheets and LISS-3 images. This overestimation of mapping glacier outlines using SoI toposheets could be the possible reason for much higher recession in the Himachal region of the western Himalaya (Bhambri et al., 2011; Chand and Sharma, 2015).
On the other hand, the glaciers of the Karakoram region behave distinctively differently from the Hindu Kush Himalaya (HKH) (Hewitt, 1969, 2005; Bahuguna et al., 2014). In another study, Bhambri et al. (2017) reported that 221 glaciers in the Karakoram region have surge-type behaviour, covering an area of 7734 ± 271 km2 (∼ 43 % of the total Karakoram glacierized area). Hewitt (2005) mentioned the probable causes of this glacier mass gain in very few areas of the central Karakoram Himalaya are the localized impact of higher elevation and relief and a different climatic anomaly involved.
The glacier area recession rate in the CCW (0.42 ± 0.04 km2 a−1) is similar to that of the Changme Khangpu basin of the Sikkim Himalaya (0.45 ± 0.001 km2 a−1). We conclude that glaciers in Sikkim (the eastern Himalaya) are retreating at a higher magnitude as compared to the counterparts (i.e. other Himalayan regions) (Bahuguna et al., 2014), and this major shift in the glacier behaviour of the Sikkim Himalaya has also been noticeable since 2000 according to this study (Table 4).
Table 8Statistical results of the Mann–Kendall test for trend analysis of long-term annual and seasonal temperature and precipitation over the period 1960–2013. Sen's slope (Q) analysis shows the rate of change in temperature (∘C a−1) and precipitation (mm a−1).
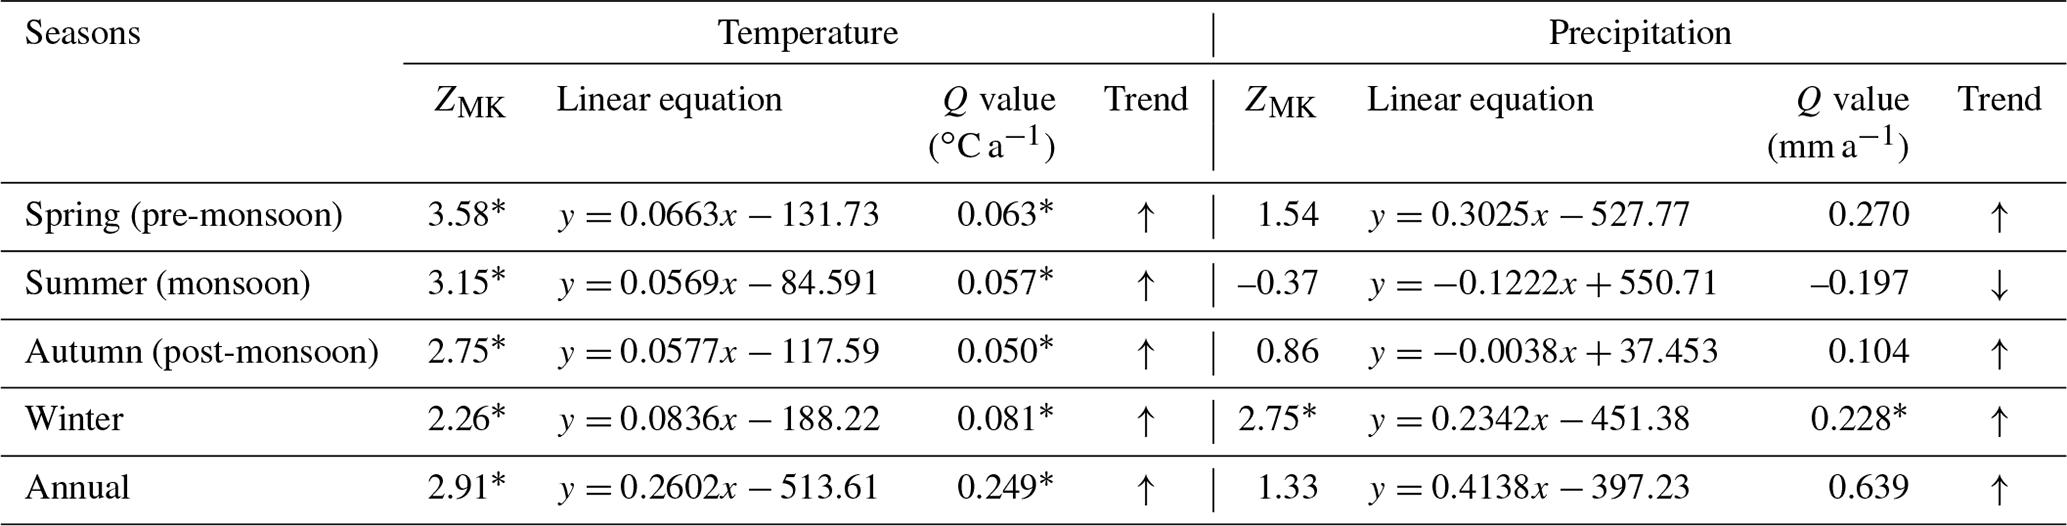
Spring is March–May; summer is June–September; autumn is October–November; winter is December–February; ↑ is an increasing trend; ↓ is a decreasing trend; * is statistically significant at the 0.05 α level of significance or 95 % confidence level.
5.4 Climate variability and its impact on glacier changes
The glaciers of the eastern Himalaya, including Sikkim, are sensitive to climate warming due to increased precipitation from the ISM and the northeast winter monsoon (Ageta and Higuchi, 1984; Benn and Owen, 1998; Murari et al., 2014). The climatic conditions of the Karakoram and western Himalaya are different from those of their counterparts (Bhambri et al., 2011). The rising temperature contributes to glacier shrinkage and thinning over the entire Tibetan Plateau (Fujita and Ageta, 2000; Yao et al., 2012) as well as in the different Himalayan regions (Ageta and Higuchi, 1984; Bhutiyani et al., 2010; Pratap et al., 2016; Das and Sharma, 2018). Table 8 shows the annual and season-wise analysis of MK, Sen's slope (Q), and linear regression tests. The mean annual temperature experienced a significant positive trend (↑) at a rate of 0.249 ∘C a−1 (0.05 significance level) between 1960–2013. It is important to note that the winter season experienced the maximum rising trend at the rate of temperature change (0.081 ∘C a−1), followed by the pre-monsoon (0.063 ∘C a−1), monsoon (0.057 ∘C a−1), and post-monsoon (0.050 ∘C a−1) seasons. Moreover, the Himalayan glaciers are quite sensitive to precipitation, directly or indirectly, through the albedo feedback mechanism on the short-wave radiation balance (Azam et al., 2018). Thus, an increasing trend (↑) in the annual precipitation (0.639 mm a−1) in the region confirms the fact of glacier shrinkage to some extent (Treichler et al., 2019). A significant rising trend (↑) in the precipitation change rate was observed during the pre-monsoon season (0.270 mm a−1), followed by winter (0.228 mm a−1; 0.05 significance level) and post-monsoon (0.104 mm a−1) seasons.

Figure 14Trends in mean annual temperature (∘C) and precipitation (mm) between 1960 and 2013 in the CCW based on Pagri Meteorological Station (PMS). Data source: http://www.cru.uea.ac.uk/data (last access: 13 June 2020).
But on the other hand, the precipitation change rate during the monsoon season experienced a decreasing trend of −0.197 mm a−1. Such significant temperature and precipitation changes have had immense impacts on glacier deglaciation in the investigated region since 1975. Figure 14 confirms that there has been a substantial increase in the temperature trend and more or less a static precipitation scenario since 1995, and the rate of glacier area loss also took place during the 2000–2010 (0.62 ± 0.5 km2 a−1) and 2010–2018 (0.77 ± 0.6 km2 a−1) time frames (Table 4). Based on dendrochronology, Yadava et al. (2015) have reported that 1996–2005 was the warmest period for the Lachen and Lachung valleys (North Sikkim) derived from mean late summer (July–September) temperature reconstruction (1852–2005 CE).
Moreover, this significant trend of decreasing precipitation during summer monsoons and warming temperature during all seasons (maximum in winter season) restricts the refreezing of precipitation to form solid ice, thus reducing the accumulation rates compared to the ablation on the existing glacier surfaces (Benn et al., 2001; Fujita and Ageta, 2000). Similarly, Basnett and Kulkarni (2019) also reported a reduction in snowfall with a declining rate of 2.81 ± 2.02 % (−0.3 ± 0.18 % a−1) over the Sikkim Himalaya during 2002–2011 due to the influence of an overall warming climate, especially the rise in winter minimum temperature, and this correlates with the findings of the present study. Thus, we can infer that glacier area shrinkage rates are also dependent on climatic factors.
Since the glacier response time is on the order of many decades and centuries, the contemporary data may not lead to any perceptible reflections immediately, but over the decades, it is also possible that the present trend of loss in the glaciers' mass may be a response to climatic conditions that existed a few centuries ago, given the mass transfer with respect to velocity, ranging from ∼ 5–25 m a−1 in most of the Himalayan glaciers.
The temporal datasets developed in this current study for glacier changes in the Chhombo Chhu Watershed of the Tista basin, the Sikkim Himalaya, India, between 1975 and 2018 can now be accessed at the Zenodo web portal: https://doi.org/10.5281/zenodo.4457183 (Chowdhury et al., 2021).
This research presents an integrated watershed-based study of glacier change across the CCW in the Sikkim Himalaya from 1975 to 2018. This glacier analysis comprises 74 glaciers with a total area of 44.8 ± 1.5 km2, including 64 clean glaciers with an area of 28.4 ± 1.1 km2 (63.4 % of total glacier area) in 2018. The mean glacier area of the watershed stands at 0.61 km2, with a dominance of small-sized glaciers. Our mapping reveals that there is a glacier area recession of 17.9 ± 1.7 km2 in the analysis period, an equivalent to 28.5 ± 3.6 % shrinkage. The overall rate of glacier area loss between 1975–2018 is 0.42 km2 a−1 (0.66 ± 0.1 % a−1) in the CCW, consistent with the other basins in the Sikkim Himalaya. The present century, i.e. 2000–2010 and 2010–2018, has witnessed higher rates of area shrinkage of 0.62 ± 0.5 km2 a−1 and 0.77 ± 0.6 km2 a−1, respectively, as compared to previous time frames between 1975–1988 (0.24 ± 0.4 km2 a−1) and 1988–2000 (0.20 ± 0.5 km2 a−1). Hence, the glaciers in the CCW of Sikkim (the eastern Himalaya) are retreating at a higher rate than those of the other parts (i.e. the western and central Himalaya). Larger glaciers (> 2 km2) have lost a greater area (7.7 ± 0.4 km2 or −0.18 ± 0.01 km2 a−1) than the small size classes since 1975. We suspect that such an anomaly might be produced by a combined effect of higher solar incidence energy, lower terminus elevation, gentle slopes, and associated warmer air temperature. Morphologically, the valley glaciers (simple basins) have lost the maximum ice cover in the CCW. As a whole, the north-facing (including northwest, north, and northeast) glaciers shrank at a higher rate of 0.17 ± 0.02 km2 a−1 than those of the other aspects. The number of clean glaciers shows a decreasing trend in loss, with a maximum area loss of 11.8 ± 1.2 km2 (∼ 0.27 ± 0.03 km2 a−1), compared to the partially and maximally debris-covered glaciers in the CCW. These factors suggest that the glacier's response to climate change is primarily controlled by glacier morphology, surface cover characteristics, and associated local topographical parameters (i.e. size, length, elevation, slope, and aspect) within the CCW. Mean annual and seasonal air temperature shows a significant positive trend since the 1960s. It appears that the rising trend of temperature during the winter season and the declining trend of precipitation in the summer season are the key driving factors behind glacier changes in the CCW. However, the time frame of our analysis is much smaller than the response time of the glaciers. In the case of the continuation of this trend into the future, similar variability in the region will undoubtedly affect the hydroelectric power projects due to the mobilization of the vast Quaternary deposits stored throughout the region on account of fluctuations in the discharge in this basin.
AC initially designed the idea, collected all primary and secondary data through different sources, went out in the field for detailed investigation and ground truth verification, prepared the final datasets and figures, and wrote the draft manuscript. MD accompanied during the field survey and laboratory activities. MCS, as a topical expert and joint supervisor, helped in conceptualizing and writing in terms of review and editing. SKD, as an academic supervisor and mentor, contributed to the entire project administration, supervision, finalizing the structure of the research article, and final editing. All the authors significantly contributed to the final form of this paper.
The authors declare that they have no conflict of interest.
We would like to thank the Forest and Environment Department, government of Sikkim, for issuing the permit for field visits. The authors are also obliged to North-Eastern Hill University (Shillong) and Jawaharlal Nehru University (New Delhi) for providing different laboratory facilities and the ArcGIS 10.1 software. We thank the USGS for providing declassified Hexagon (KH-9), Landsat TM and ETM+, Sentinel-2A MSI, and SRTM DEM data free of charge. We are also thankful to Tejashi Roy (Jawaharlal Nehru University, New Delhi) for helping in the field measurements during November 2018. Sincere thanks go to Ian Harris, University of East Anglia (UK), for providing the CRU station data and valuable suggestions. We greatly appreciate the efforts of the anonymous reviewers for constructive suggestions to improve the content and quality of our paper.
This paper was edited by Prasad Gogineni and reviewed by two anonymous referees.
Ageta, Y. and Higuchi, K.: Estimation of Mass Balance Components of a Summer-Accumulation Type Glacier in the Nepal Himalaya, Geogr. Ann. A, 66, 249–255, https://doi.org/10.1080/04353676.1984.11880113, 1984.
Ali, I., Shukla, A., and Romshoo, S. A.: Assessing linkages between spatial facies changes and dimensional variations of glaciers in the upper Indus Basin, western Himalaya, Geomorphology, 284, 115–129, https://doi.org/10.1016/j.geomorph.2017.01.005, 2017.
Azam, M. F., Wagnon, P., Berthier, E., Vincent, C., Fujita, K., and Kargel, J. S.: Review of the status and mass changes of Himalayan-Karakoram glaciers, J. Glaciol., 64, 61–74, https://doi.org/10.1017/jog.2017.86, 2018.
Bahuguna, I. M., Rathore, B. P., Brahmbhatt, R., Sharma, M. C., Dhar, S., Randhawa, S. S., Kumar, K., Romshoo, S., Shah, R. D., Ganjoo, R. K., and Ajai: Are the Himalayan glaciers retreating?, Curr. Sci. India, 106, 1008–1013, 2014.
Bajracharya, S. R. and Mool, P. K.: Impact of Global Climate Change from 1970's to 2000's on the Glaciers and Glacial Lakes in Tamor Basin, Eastern Nepal, Unpubl. Rep. ICIMOD, 2006.
Bajracharya, S. R. and Shrestha, B. (Eds.): The Status of Glaciers in the Hindu Kush–Himalayan Region, ICIMOD, Kathmandu, Nepal, 1–127, 2011.
Bajracharya, S. R., Maharjan, S. B., and Shrestha, F.: The status and decadal change of glaciers in Bhutan from the 1980's to 2010 based on satellite data, Ann. Glaciol., 55, 159–166, https://doi.org/10.3189/2014AoG66A125, 2014.
Basnett, S. and Kulkarni, A. V.: Snow Cover Changes Observed Over Sikkim Himalaya, in: Environmental Change in the Himalayan Region, edited by: Saikia, A. and Thapa, P., Springer, Cham, Switzerland, 219–232, 2019.
Basnett, S., Kulkarni, A. V., and Bolch, T.: The influence of debris cover and glacial lakes on the recession of glaciers in Sikkim Himalaya, India, J. Glaciol., 59, 1035–1046, https://doi.org/10.3189/2013JoG12J184, 2013.
Benn, D. I. and Owen, L. A.: The role of the Indian summer monsoon and the mid-latitude westerlies in Himalayan glaciation: review and speculative discussion, J. Geol. Soc. London, 155, 353–363, https://doi.org/10.1144/gsjgs.155.2.0353, 1998.
Benn, D. I., Wiseman, S., and Hands, K. A.: Growth and drainage of supraglacial lakes on debrismantled Ngozumpa Glacier, Khumbu Himal, Nepal, J. Glaciol., 47, 626–638, https://doi.org/10.3189/172756501781831729, 2001.
Bhambri, R. and Bolch, T.: Glacier mapping: A review with special reference to the Indian Himalayas, Prog. Phys. Geog., 33, 672–704, https://doi.org/10.1177/0309133309348112, 2009.
Bhambri, R., Bolch, T., Chaujar, R. K., and Kulshreshtha, S. C.: Glacier changes in the Garhwal Himalaya, India, from 1968 to 2006 based on remote sensing, J. Glaciol., 57, 543–556, https://doi.org/10.3189/002214311796905604, 2011.
Bhambri, R., Hewitt, K., Kawishwar, P., and Pratap, B.: Surge-type and surge-modified glaciers in the Karakoram, Sci. Rep.-UK, 7, 15391, https://doi.org/10.1038/s41598-017-15473-8, 2017.
Bhutiyani, M. R., Kale, V. S., and Pawar, N. J.: Climate change and the precipitation variations in the northwestern Himalaya: 1866–2006, Int. J. Climatol., 30, 535–548, https://doi.org/10.1002/joc.1920, 2010.
Bolch, T. and Kamp, U.: Glacier mapping in high mountains using DEMs, Landsat and ASTER data, in: 8th International Symposium on High Moutain Remote Sensing Cartography, La Paz, Bolivia, 37–48, available at: http://web.unbc.ca/~bolch/publications/BolcKamp06_GeoRaum.pdf (last access: 12 August 2020), 2006.
Bolch, T., Buchroithner, M., Pieczonka, T., and Kunert, A.: Planimetric and volumetric glacier changes in the Khumbu Himal, Nepal, since 1962 using Corona, Landsat TM and ASTER data, J. Glaciol., 54, 592–600, 2008.
Bolch, T., Yao, T., Kang, S., Buchroithner, M. F., Scherer, D., Maussion, F., Huintjes, E., and Schneider, C.: A glacier inventory for the western Nyainqentanglha Range and the Nam Co Basin, Tibet, and glacier changes 1976–2009, The Cryosphere, 4, 419–433, https://doi.org/10.5194/tc-4-419-2010, 2010a.
Bolch, T., Menounos, B., and Wheate, R.: Landsat-based inventory of glaciers in western Canada, 1985–2005, Remote Sens. Environ., 114, 127–137, https://doi.org/10.1016/j.rse.2009.08.015, 2010b.
Brahmbhatt, R. M., Bahuguna, I. M., Rathore, B. P., Kulkarni, A. V., Shah, R. D., Rajawat, A. S., and Kargel, J. S.: Significance of glacio-morphological factors in glacier retreat: a case study of part of Chenab basin, Himalaya, J. Mt. Sci., 14, 128–141, https://doi.org/10.1007/s11629-015-3548-0, 2017.
Braithwaite, R. J. and Raper, S. C. B.: Estimating equilibrium-line altitude (ELA) from glacier inventory data, Ann. Glaciol., 50, 127–132, 2009.
Brazel, A. J. and Marcus, M. G.: July Temperatures in Kashmir and Ladakh, India: Comparisons of Observations and General Circulation Model Simulations, Mt. Res. Dev., 11, 75–86, 1991.
Cengiz, T. M., Tabari, H., Onyutha, C., and Kisi, O.: Combined use of graphical and statistical approaches for analyzing historical precipitation changes in the Black Sea Region of Turkey, Water, 12, 705, https://doi.org/10.3390/w12030705, 2020.
Chand, P. and Sharma, M. C.: Glacier changes in the Ravi basin, North-Western Himalaya (India) during the last four decades (1971–2010/13), Global Planet. Change, 135, 133–147, https://doi.org/10.1016/j.gloplacha.2015.10.013, 2015.
Chavez, P. S.: An improved dark-object subtraction technique for atmospheric scattering correction of multispectral data, Remote Sens. Environ., 24, 459–479, https://doi.org/10.1016/0034-4257(88)90019-3, 1988.
Chowdhury, A., Sharma, M. C., De, S. K., and Debnath, M.: Glacier Inventories in the Chhombo Chhu Watershed of Tista basin, Sikkim Himalaya, India [Data set], Zenodo, https://doi.org/10.5281/zenodo.4457183, 2021.
Chuvieco, E. and Huete, A.: Fundamentals of Satellite Remote sensing, Taylor & Francis Group, LLC, 1–418, 2009.
CISMHE: Carrying Capacity Study of Teesta Basin in Sikkim: Introductory Volume, Ministry of Environment & Forests, Government of India, New Delhi, India, 1–113, 2007.
Das, S. and Sharma, M. C.: Glacier changes between 1971 and 2016 in the Jankar Chhu Watershed, Lahaul Himalaya, India, J. Glaciol., 65, 13–28, https://doi.org/10.1017/jog.2018.77, 2018.
Dash, S. K., Jenamani, R. K., Kalsi, S. R., and Panda, S. K.: Some evidence of climate change in twentieth-century India, Climatic Change, 85, 299–321, https://doi.org/10.1007/s10584-007-9305-9, 2007.
Debnath, M., Syiemlieh, H. J., Sharma, M. C., Kumar, R., Chowdhury, A., and Lal, U.: Glacial lake dynamics and lake surface temperature assessment along the Kangchengayo-Pauhunri Massif, Sikkim Himalaya, 1988–2014, Remote Sens. Appl. Soc. Environ., 9, 26–41, https://doi.org/10.1016/j.rsase.2017.11.002, 2018.
Debnath, M., Sharma, M. C., and Syiemlieh, H. J.: Glacier dynamics in Changme Khangpu basin, Sikkim Himalaya, India, between 1975 and 2016, Geosciences, 9, 259, https://doi.org/10.3390/geosciences9060259, 2019.
EDPS: Status of Ongoing and/or Completed Schemes, Energy and Power Department Government of Sikkim, available at: https://power.sikkim.gov.in/status-of-ongoing-andor-completed-schemes/ (last access: 15 November 2020), 2019.
Evans, I. S.: Local aspect asymmetry of mountain glaciation: A global survey of consistency of favoured directions for glacier numbers and altitudes, Geomorphology, 73, 166–184, https://doi.org/10.1016/j.geomorph.2005.07.009, 2006.
Frey, H., Paul, F., and Strozzi, T.: Compilation of a glacier inventory for the western Himalayas from satellite data: methods, challenges, and results, Remote Sens. Environ., 124, 832–843, https://doi.org/10.1016/j.rse.2012.06.020, 2012.
Fujita, K. and Ageta, Y.: Effect of summer accumulation on glacier mass balance on the Tibetan Plateau revealed by mass-balance model, J. Glaciol., 46, 244–252, https://doi.org/10.3189/172756500781832945, 2000.
Garg, P. K., Shukla, A., and Jasrotia, A. S.: On the strongly imbalanced state of glaciers in the Sikkim, eastern, Sci. Total Environ., 691, 16–35, https://doi.org/10.1016/j.scitotenv.2019.07.086, 2019.
Granshaw, F. D. and Fountain, A. G.: Glacier change (1958–1998) in the North Cascades National Park Complex, Washington, USA, J. Glaciol., 52, 251–256, 2006.
Hall, D. K., Bayr, K. J., Schöner, W., Bindschadler, R. A., and Chien, J. Y. L.: Consideration of the errors inherent in mapping historical glacier positions in Austria from the ground and space (1893–2001), Remote Sens. Environ., 86, 566–577, https://doi.org/10.1016/S0034-4257(03)00134-2, 2003.
Harris, I., Jones, P. D., Osborn, T. J., and Lister, D. H.: Updated high-resolution grids of monthly climatic observations – the CRU TS3.10 Dataset, Int. J. Climatol., 34, 623–642, https://doi.org/10.1002/joc.3711, 2013.
Hewitt, K.: Glacier surges in the Karakoram Himalaya (Central Asia), Can. J. Earth Sci., 6, 1009–1018, 1969.
Hewitt, K.: The Karakoram Anomaly? Glacier Expansion and the “Elevation Effect”, Karakoram Himalaya, Mt. Res. Dev., 25, 332–340, 2005.
Hewitt, K.: Glacier Change, Concentration, and Elevation Effects in the Karakoram Himalaya, Upper Indus Basin, Mt. Res. Dev., 31, 188–200, 2011.
Immerzeel, W.: Historical trends and future predictions of climate variability in the Brahmaputra basin, Int. J. Climatol., 28, 243–254, https://doi.org/10.1002/joc, 2008.
Kääb, A.: Combination of SRTM3 and repeat ASTER data for deriving alpine glacier flow velocities in the Bhutan Himalaya, Remote Sens. Environ., 94, 463–474, https://doi.org/10.1016/j.rse.2004.11.003, 2005.
Kääb, A., Chiarle, M., Raup, B., and Schneider, C.: Climate change impacts on mountain glaciers and permafrost, Global Planet. Change, 56, vii–ix, https://doi.org/10.1016/j.gloplacha.2006.07.008, 2007.
Kendall, M. G.: Rank correlation methods, edn. 4, Charles Griffin, London, UK, 1975.
Khawas, V.: Hydro-Fever in the Upper Tista Basin and Issues of Regional Environmental Security, J. Polit. Gov., 5, 49–56, 2016.
Kulkarni, A. V., Bahuguna, I. M., Rathore, B. P., Singh, S. K., Randhawa, S. S., Sood, R. K., and Dhar, S.: Glacial retreat in Himalaya using Indian Remote Sensing satellite data, Curr. Sci. India, 92, 69–74, 2007.
Kumar, K. R., Sahai, A. K., Kumar, K. K., Patwardhan, S. K., Mishra, P. K., Revadekar, J. V., Kamala, K., and Pant, G. B.: High-resolution climate change scenarios for India for the 21st century, Curr. Sci. India, 90, 334–345, 2006.
Kumar, P., Sharma, M. C., Saini, R., and Singh, G. K.: Climatic variability at Gangtok and tadong weather observatories in Sikkim, India, during 1961–2017, Sci. Rep.-UK, 10, 15177, https://doi.org/10.1038/s41598-020-71163-y, 2020.
Mann, H. B.: Nonparametric Tests Against Trend, Econometrica, 13, 245–259, https://doi.org/10.2307/1907187, 1945.
Mehta, M.: Change of Tipra Glacier in the Garhwal Himalaya, India, between 1962 and 2008, Prog. Phys. Geog., 35, 721–738, https://doi.org/10.1177/0309133311411760, 2011.
Mir, R. A., Jain, S. K., Jain, S. K., Thayyen, R. J., and Saraf, A. K.: Assessment of recent glacier changes and its controlling factors from 1976 to 2011 in Baspa Basin, Western Himalaya, Arct. Antarct. Alp. Res., 49, 621–647, https://doi.org/10.1657/AAAR0015-070, 2017.
Mool, P. K. and Bajracharya, S. R.: Inventory of glaciers, glacial lakes and the identification of potential glacial lake outburst floods (GLOFs) affected by global warming in the mountains of Himalayan region: Tista Basin, Sikkim Himalaya, India, Unpublished project report, with database on CD-ROM, prepared for APN and ICIMOD, Kathmandu, 1–136, 2003.
Murari, M. K., Owen, L. A., Dortch, J. M., Caffee, M. W., Dietsch, C., Fuchs, M., Haneberg, W. C., Sharma, M. C., and Townsend-Small, A.: Timing and climatic drivers for glaciation across monsoon-influenced regions of the HimalayaneTibetan orogen, Quaternary Sci. Rev., 88, 159–182, https://doi.org/10.1016/j.quascirev.2014.01.013, 2014.
Nuimura, T., Sakai, A., Taniguchi, K., Nagai, H., Lamsal, D., Tsutaki, S., Kozawa, A., Hoshina, Y., Takenaka, S., Omiya, S., Tsunematsu, K., Tshering, P., and Fujita, K.: The GAMDAM glacier inventory: a quality-controlled inventory of Asian glaciers, The Cryosphere, 9, 849–864, https://doi.org/10.5194/tc-9-849-2015, 2015.
Ojha, S., Fujita, K., Sakai, A., Nagai, H., and Lamsal, D.: Topographic controls on the debris-cover extent of glaciers in the Eastern Himalayas: Regional analysis using a novel high-resolution glacier inventory, Quatern. Int., 455, 82–92, https://doi.org/10.1016/j.quaint.2017.08.007, 2017.
Olson, M. and Rupper, S.: Impacts of topographic shading on direct solar radiation for valley glaciers in complex topography, The Cryosphere, 13, 29–40, https://doi.org/10.5194/tc-13-29-2019, 2019.
Paul, F., Huggel, C., and Kääb, A.: Combining satellite multispectral image data and a digital elevation model for mapping debris-covered glaciers, Remote Sens. Environ., 89, 510–518, https://doi.org/10.1016/j.rse.2003.11.007, 2004a.
Paul, F., Kääb, A., Maisch, M., Kellenberger, T., and Haeberli, W.: Rapid disintegration of Alpine glaciers observed with satellite data, Geophys. Res. Lett., 31, L21402, https://doi.org/10.1029/2004GL020816, 2004b.
Paul, F., Rastner, P., Azzoni, R. S., Diolaiuti, G., Fugazza, D., Le Bris, R., Nemec, J., Rabatel, A., Ramusovic, M., Schwaizer, G., and Smiraglia, C.: Glacier shrinkage in the Alps continues unabated as revealed by a new glacier inventory from Sentinel-2, Earth Syst. Sci. Data, 12, 1805–1821, https://doi.org/10.5194/essd-12-1805-2020, 2020.
Pratap, B., Dobhal, D. P., Bhambri, R., Mehta, M., and Tewari, V. C.: Four decades of glacier mass balance observations in the Indian Himalaya, Reg. Environ. Change, 16, 643–658, https://doi.org/10.1007/s10113-015-0791-4, 2016.
Racoviteanu, A. E., Arnaud, Y., Williams, M. W., and Ordoñez, J.: Decadal changes in glacier parameters in the Cordillera Blanca, Peru, derived from remote sensing, J. Glaciol., 54, 499–510, https://doi.org/10.3189/002214308785836922, 2008.
Racoviteanu, A. E., Paul, F., Raup, B., Khalsa, S. J. S., and Armstrong, R.: Challenges and recommendations in mapping of glacier parameters from space: Results of the 2008 global land ice measurements from space (GLIMS) workshop, Boulder, Colorado, USA, Ann. Glaciol., 50, 53–69, https://doi.org/10.3189/172756410790595804, 2009.
Racoviteanu, A. E., Arnaud, Y., Williams, M. W., and Manley, W. F.: Spatial patterns in glacier characteristics and area changes from 1962 to 2006 in the Kanchenjunga–Sikkim area, eastern Himalaya, The Cryosphere, 9, 505–523, https://doi.org/10.5194/tc-9-505-2015, 2015.
Rahaman, M. M. and Mamun, A. A.: Hydropower development along Teesta river basin: opportunities for cooperation, Water Policy, 22, 641–657, https://doi.org/10.2166/wp.2020.136, 2020.
Raina, V. K. and Srivastava, D.: Glacier Atlas of India, 1st Edn., Geological Society of India, Bangalore, India, 1–315, 2008.
Raj, K. B. G., Rao, V. V. N., Kumar, K. V., and Diwakar, P. G.: Alarming recession of glaciers in Bhilangna basin, Garhwal Himalaya, from 1965 to 2014 analysed from Corona and Cartosat data, Geomat. Nat. Haz. Risk, 8, 1424–1439, https://doi.org/10.1080/19475705.2017.1339736, 2017.
Rashid, I. and Majeed, U.: Retreat and geodetic mass changes of Zemu Glacier, Sikkim Himalaya, India, between 1931 and 2018, Reg. Environ. Change, 20, 1–13, 2020.
Rau, F., Mauz, F., Vogt, S., Khalsa, S. J. S., and Raup, B.: Glacier, Classification Guidance for the GLIMS Glacier Inventory, Version 1.0., GLIMS Regional Centre, Antarctic Peninsula, GLIMS (Global Land Ice Measurement from Space), NSIDC, 1–36, 2005.
RGI-Consortium: Randolph Glacier Inventory – A Dataset of Global Glacier Outlines: Version 6.0, Digital Media, Boulder, Colorado, USA, 2017.
Rudra, K.: Rivers of the Ganga-Brahmaputra-Meghna Delta: A Fluvial Account of Bengal, Springer Nature, Cham, Switzerland, 2018.
Ruosteenoja, K., Carter, T. R., and Tuomenvirta, H.: Future climate in world regions: an intercomparison of model-based projections for the new IPCC emissions scenarios, Edita Publishing Ltd, Helsinki, Finland, 1–81, 2003.
Sakai, A., Takeuchi, N., Fujita, K., and Nakawo, M.: Role of supraglacial ponds in the ablation process of a debris-covered glacier in the Nepal Himalayas, in: Debris-Covered Glaciers, IAHS, Washington, USA, 119–130, 2000.
Salerno, F., Thakuri, S., Tartari, G., Nuimura, T., Sunako, S., Sakai, A., and Fujita, K.: Debris-covered glacier anomaly? Morphological factors controlling changes in the mass balance, surface area, terminus position, and snow line altitude of Himalayan glaciers, Earth Planet. Sc. Lett., 471, 19–31, https://doi.org/10.1016/j.epsl.2017.04.039, 2017.
Scherler, D., Bookhagen, B., and Strecker, M. R.: Hillslope-glacier coupling: The interplay of topography and glacial dynamics in High Asia, J. Geophys. Res.-Earth, 116, F02019, https://doi.org/10.1029/2010JF001751, 2011.
Schmidt, S. and Nüsser, M.: Changes of high altitude glaciers from 1969 to 2010 in the Trans-Himalayan Kang Yatze Massif, Ladakh, Northwest India, Arct. Antarct. Alp. Res., 44, 107–121, https://doi.org/10.1657/1938-4246-44.1.107, 2012.
Sen, P. K.: Estimates of the Regression Coefficient Based on Kendall's Tau, J. Am. Stat. Assoc., 63, 1379–1389, https://doi.org/10.1080/01621459.1968.10480934, 1968.
Shukla, A., Garg, S., Mehta, M., Kumar, V., and Shukla, U. K.: Temporal inventory of glaciers in the Suru sub-basin, western Himalaya: impacts of regional climate variability, Earth Syst. Sci. Data, 12, 1245–1265, https://doi.org/10.5194/essd-12-1245-2020, 2020.
Singh, P. and Kumar, N.: Effect of orography on precipitation in the western Himalayan region, J. Hydrol., 199, 183–206, 1997.
Sreekesh, S. and Debnath, M.: Spatio-Temporal Variability of Rainfall and Temperature in Northeast India, in: Geostatistical and Geospatial Approaches for the Characterization of Natural Resources in the Environment, edited by: Raju, N. J., Springer, Cham, Switzerland, 873–879, 2016.
Surazakov, A. and Aizen, V.: Positional accuracy evaluation of declassified hexagon KH-9 mapping camera imagery, Photogramm. Eng. Rem. S., 76, 603–608, https://doi.org/10.14358/PERS.76.5.603, 2010.
Treichler, D., Kääb, A., Salzmann, N., and Xu, C.-Y.: Recent glacier and lake changes in High Mountain Asia and their relation to precipitation changes, The Cryosphere, 13, 2977–3005, https://doi.org/10.5194/tc-13-2977-2019, 2019.
Tsutaki, S., Fujita, K., Nuimura, T., Sakai, A., Sugiyama, S., Komori, J., and Tshering, P.: Contrasting thinning patterns between lake- and land-terminating glaciers in the Bhutanese Himalaya, The Cryosphere, 13, 2733–2750, https://doi.org/10.5194/tc-13-2733-2019, 2019.
Wahid, S. M., Shrestha, A. B., Murthy, M. S. R., Matin, M., Zhang, J., and Siddiqui, O.: Regional water security in the Hindu Kush Himalayan region: Role of geospatial science and tools, Int. Arch. Photogramm., 8, 1331–1340, https://doi.org/10.5194/isprsarchives-XL-8-1331-2014, 2014.
Williams, M. W.: The Status of Glaciers in the Hindu Kush-Himalayan Region, Mt. Res. Dev., 33, 114–115, 2013.
Worni, R., Huggel, C., and Stoffel, M.: Glacial lakes in the Indian Himalayas – From an area-wide glacial lake inventory to on-site and modeling based risk assessment of critical glacial lakes, Sci. Total Environ., 468–469, 71–84, https://doi.org/10.1016/j.scitotenv.2012.11.043, 2013.
Yadava, A. K., Yadav, R. R., Misra, K. G., Singh, J., and Singh, D.: Tree ring evidence of late summer warming in Sikkim, Northeast India, Quatern. Int., 371, 175–180, https://doi.org/10.1016/j.quaint.2014.12.067, 2015.
Yao, T., Thompson, L., Yang, W., Yu, W., Gao, Y., Guo, X., Yang, X., Duan, K., Zhao, H., Xu, B., Pu, J., Lu, A., Xiang, Y., Kattel, D. B., and Joswiak, D.: Different glacier status with atmospheric circulations in Tibetan Plateau and surroundings, Nat. Clim. Change, 2, 663–667, https://doi.org/10.1038/nclimate1580, 2012.
Ye, Q., Yao, T., Kang, S., Chen, F., and Wang, J.: Glacier variations in the Naimona'nyi region, western Himalaya, in the last three decades, Ann. Glaciol., 43, 385–389, 2006.