the Creative Commons Attribution 4.0 License.
the Creative Commons Attribution 4.0 License.
 | 16 Jun 2021
Hydrometeorological, glaciological and geospatial research data from the Peyto Glacier Research Basin in the Canadian Rockies
Dhiraj Pradhananga
John W. Pomeroy
Caroline Aubry-Wake
D. Scott Munro
Joseph Shea
Michael N. Demuth
Nammy Hang Kirat
Brian Menounos
Kriti Mukherjee
This paper presents hydrometeorological, glaciological and geospatial data from the Peyto Glacier Research Basin (PGRB) in the Canadian Rockies. Peyto Glacier has been of interest to glaciological and hydrological researchers since the 1960s, when it was chosen as one of five glacier basins in Canada for the study of mass and water balance during the International Hydrological Decade (IHD, 1965–1974). Intensive studies of the glacier and observations of the glacier mass balance continued after the IHD, when the initial seasonal meteorological stations were discontinued, then restarted as continuous stations in the late 1980s. The corresponding hydrometric observations were discontinued in 1977 and restarted in 2013. Datasets presented in this paper include high-resolution, co-registered digital elevation models (DEMs) derived from original air photos and lidar surveys; hourly off-glacier meteorological data recorded from 1987 to the present; precipitation data from the nearby Bow Summit weather station; and long-term hydrological and glaciological model forcing datasets derived from bias-corrected reanalysis products. These data are crucial for studying climate change and variability in the basin and understanding the hydrological responses of the basin to both glacier and climate change. The comprehensive dataset for the PGRB is a valuable and exceptionally long-standing testament to the impacts of climate change on the cryosphere in the high-mountain environment. The dataset is publicly available from Federated Research Data Repository at https://doi.org/10.20383/101.0259 (Pradhananga et al., 2020).
- Article
(28249 KB) - Full-text XML
- BibTeX
- EndNote


Peyto Glacier (Fig. 1) is located in Banff National Park, Alberta, Canada. It forms part of the Wapta Icefield in the Waputik Range. The Wapta Icefield is one of the southernmost icefield complexes of the Canadian Rocky Mountains and is a high-mountain headwater for the Columbia and Saskatchewan–Nelson river systems in western Canada. Peyto Glacier contributes runoff to the Mistaya River basin, a headwater of the North Saskatchewan River, which eventually reaches Hudson Bay via the Nelson River. Glaciers and snowpacks in these headwater systems are important sources of water that support industry, agriculture, hydropower generation, drinking water and the environment. The meltwater from this glacier and others in the region is a crucial component of streamflow during dry late-summer periods (Comeau et al., 2009; Demuth et al., 2008; Hopkinson and Young, 1998).
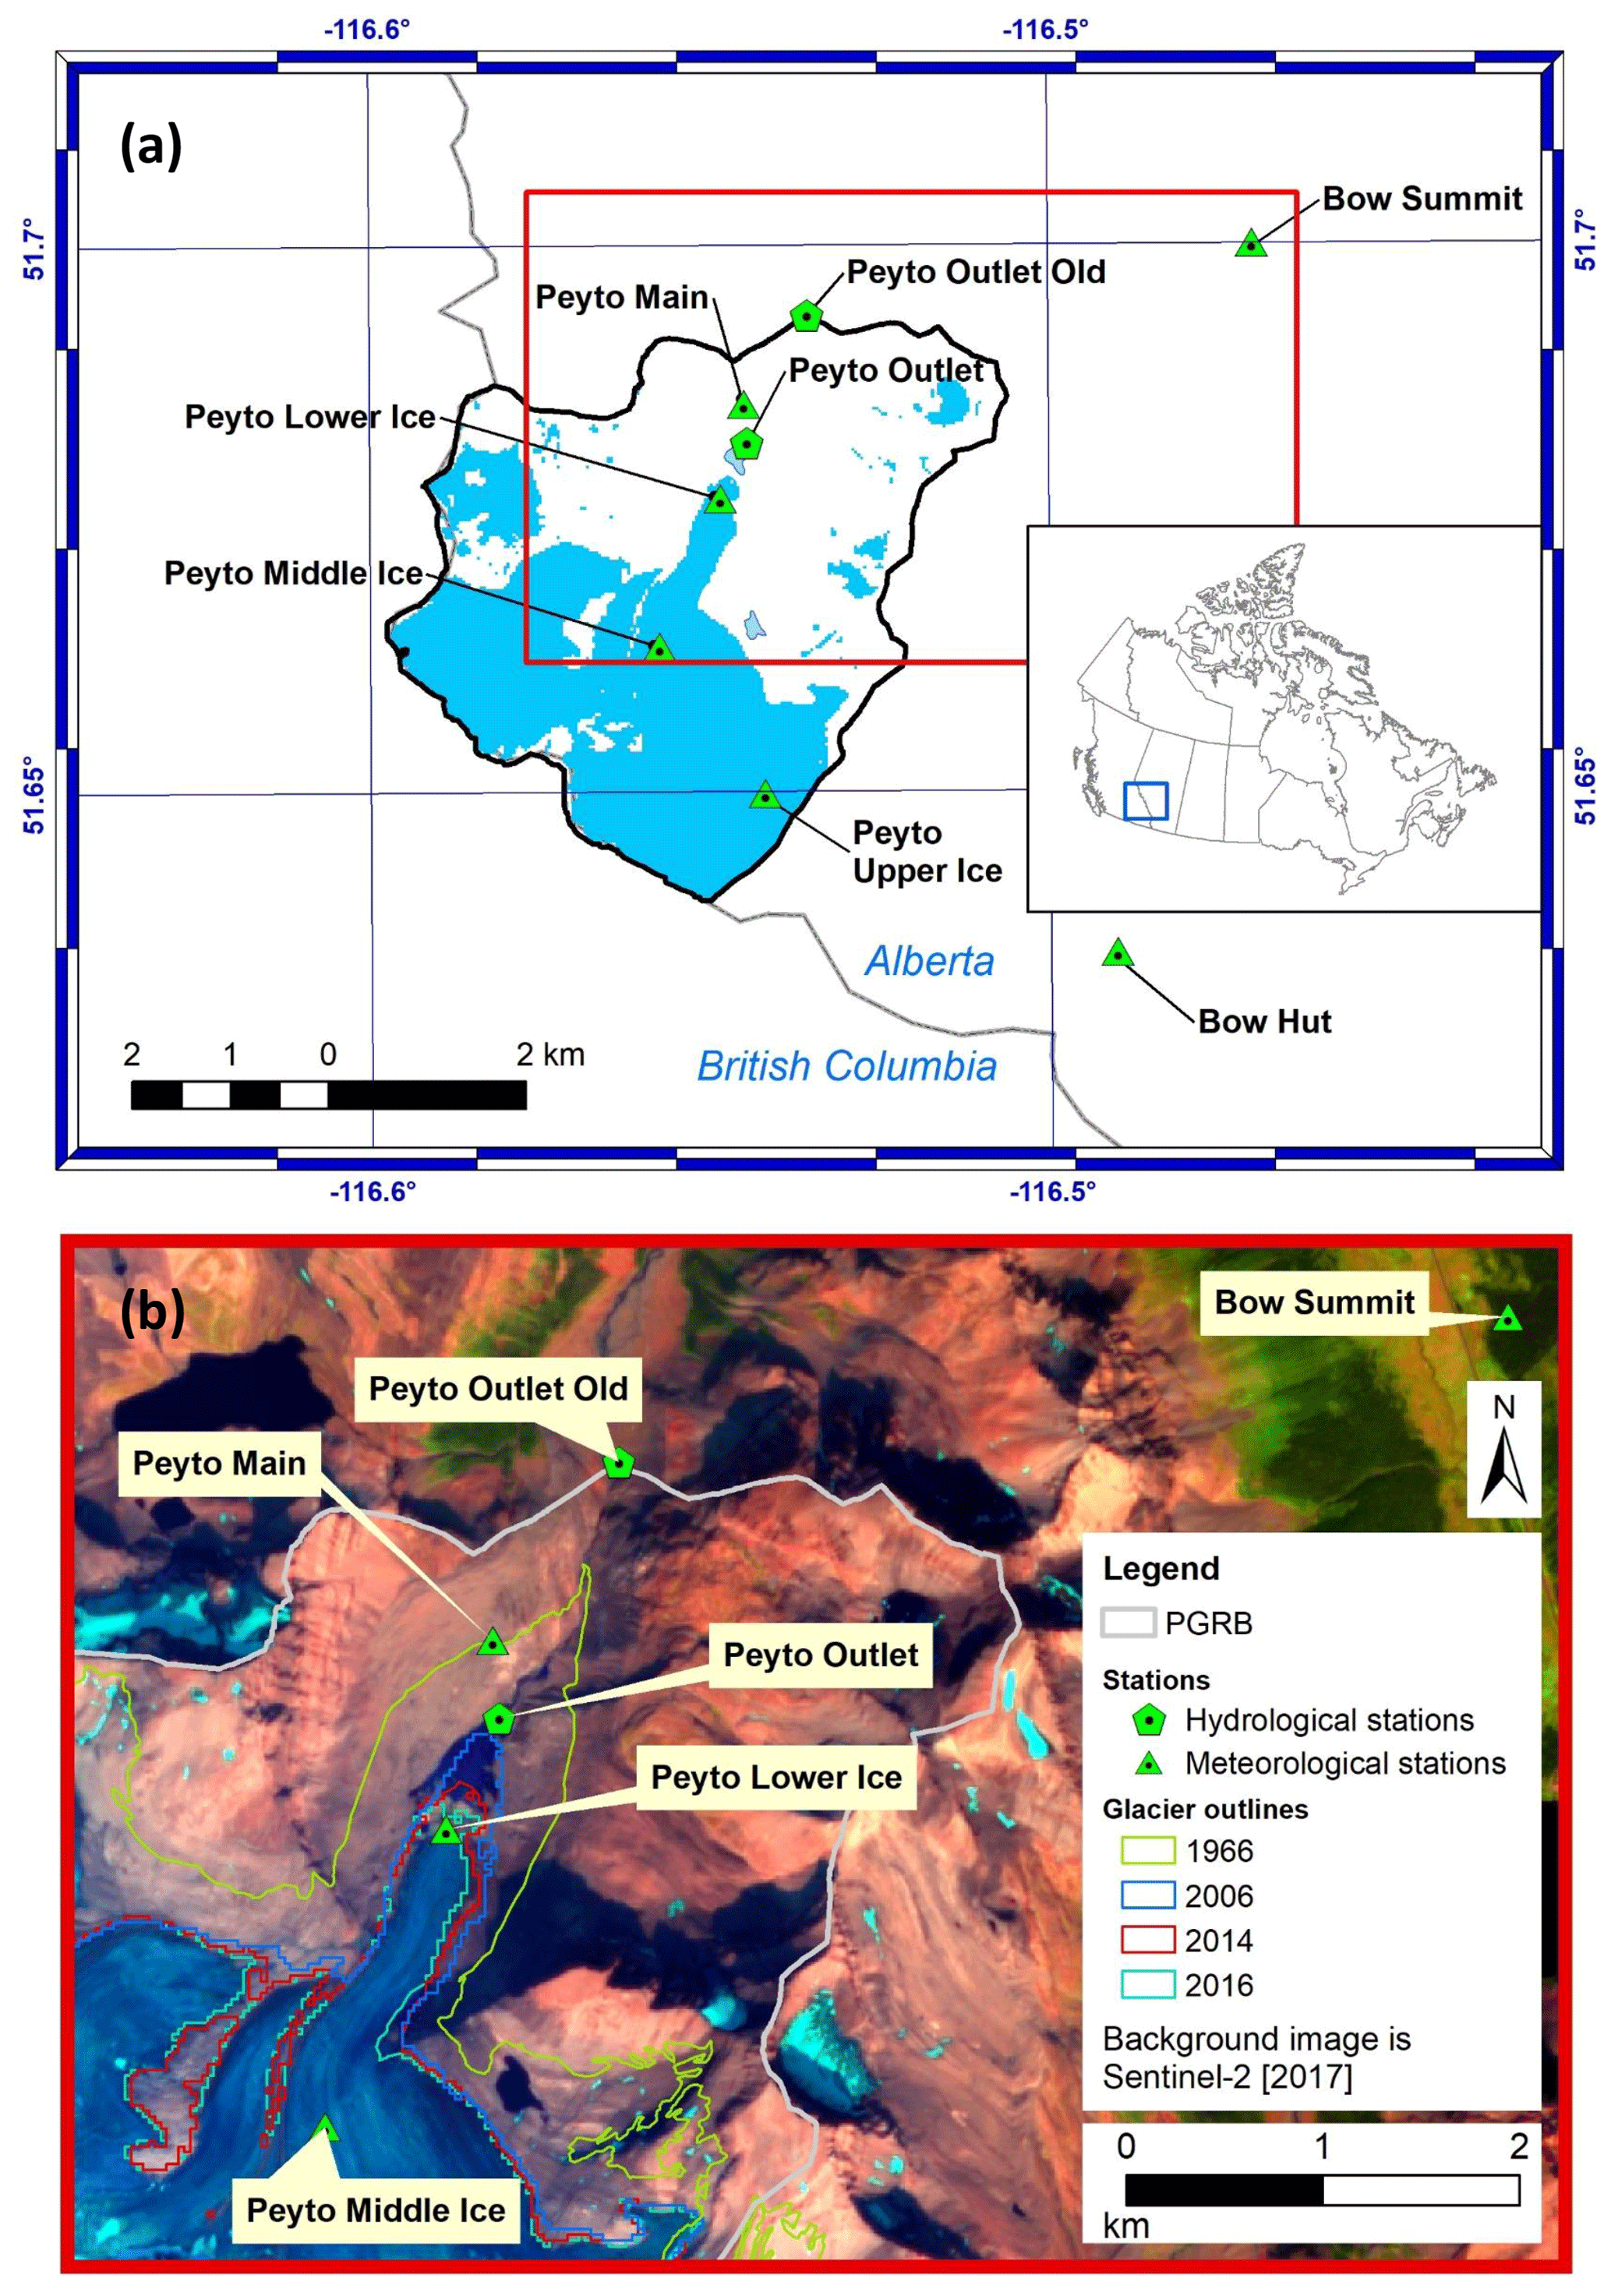
Figure 1Peyto Glacier Research Basin (PGRB). (a) Locations of PGRB and the hydrometeorological stations; blue areas are glacier within PGRB. (b) Past and present glacier extents.
The first geophysical record of Peyto Glacier goes back to a photograph taken by Walter D. Wilcox in 1896, followed by subsequent photographs and a map from the Alberta-British Columbia Interprovincial Boundary Commission Survey (Tennant and Menounos, 2013). Significant research on the glacier began in 1965, when it was selected as one of the research sites for the International Hydrological Decade (IHD). The scope and observational resources have varied since then, with more recent advances and restoration of observations (Munro, 2013). Mass balance observations continued after the IHD, but discharge observations ended in 1977. The stream gauge site was washed away by a flood in July 1983. Discharge measurements resumed in 2013, recorded by the Centre for Hydrology at the University of Saskatchewan (USask) at a new gauging site located 1.5 km upstream from the previous location. A year-round automatic weather station, operating since 1987 (Munro, 2013), was upgraded in 2013 as part of the Canadian Rockies Hydrological Observatory observation system and is now operated by USask.
Collecting continuous, high-quality data from remote and difficult-to-access alpine glacier basins can be a challenge. Lafrenière and Sharp (2003) and Rasouli et al. (2019), for example, noted the impact of power source failures on automatic weather station (AWS) records, such as to cause significant data gaps. High snow accumulation during winter can bury an AWS installed on the glacier surface, and riming can compromise instrument performance; in turn, high summer melt can cause stations to tilt or fall over. Climate data availability and accuracy in the Peyto Glacier Research Basin (PGRB) suffer from many such irregularities. Therefore, affected data must be infilled or corrected before they can be used for medium- and long-term studies.
The World Glacier Monitoring Service (WGMS) has listed Peyto Glacier as a “reference glacier” for mass balance, in consideration of its mass balance data record of over 50 years. Peyto Glacier is also one of the observing sites operated by the Geological Survey of Canada's Glacier-Climate Observing Program (Demuth and Ednie, 2016). Therefore, the PGRB can be considered an outdoor laboratory for conducting hydrological research, as proposed by Seyfried (2003); however, a single document that describes the relevant hydrometeorological datasets is needed. This paper details the meteorological forcing data that were created for driving hydrological models of Peyto Glacier, along with related hydrological and geospatial datasets used for model evaluation, mainly for three time periods: 1965–1974, 1987–2012 and 2013–2018. These datasets include historical archived data from the IHD period and recent data from both on-ice and off-ice stations. Glaciological mass balance measurements, using ablation stakes and snow pits, have been carried out continuously since the beginning of the IHD period, and a comprehensive account of the first 14 years of mass balance results appeared in Young (1981). Mass balance data reported from Peyto Glacier have been used by many researchers (Bitz and Battisti, 1999; Demuth et al., 2008; Demuth and Keller, 2006; Letréguilly, 1988; Letréguilly and Reynaud, 1989; Marshall et al., 2011; Matulla et al., 2009; Menounos et al., 2019; Østrem, 1973; Schiefer et al., 2007; Shea and Marshall, 2007; Watson et al., 2006; Watson and Luckman, 2004; Zemp et al., 2015) as reference data for the region, but the collection of data that could be used for modeling purposes has never been assembled in a single description until now.
The PGRB is in the Canadian Rockies, on the eastern side of the Continental Divide, at latitude 51.67∘ N and longitude 116.55∘ W. This heavily glacierized basin is 23.6 km2 in area, ranging in elevation from 1907 to 3152 m. It is located in a predominantly sedimentary geological region, with surrounding mountains formed from hard, resistant dolomite (Young and Stanley, 1976). The basin has been well monitored over a 55-year observational period (Shea et al., 2009). During the 1960s, the area of the glacier was 13.4 km2, but it has been continuously losing mass and area since at least the 1920s (Tennant et al., 2012), shrinking to an area of 9.87 km2 as of 2018 (Fig. 1). Repeat ground-based photography (Fig. 2) from 1902 and 2002 shows the glacier retreat that has occurred over the 20th century. A new proglacial lake has since formed at the tongue of the glacier that increases in size every year and has been informally named “Lake Munro” by USask to honor D. Scott Munro's research contribution to the glacier basin. Peyto Creek flows out of Lake Munro, draining the PGRB into Peyto Lake, thus supplying water to the Mistaya River.

Figure 2Peyto Glacier in (a) 1902 (V653/NA-1127, Vaux Family, Whyte Museum of the Canadian Rockies, https://Whyte.org, last access: 7 September 2018) and (b) 2002 (courtesy Henry Vaux Jr.).
2.1 Hydrometeorological sites
Meteorological observations were taken over the summer months (June–September) during the UNESCO IHD at the Peyto Creek Base Station adjacent to the glacier terminus, herein referred to as Peyto Main (Fig. 1). After becoming dormant in 1974, the station was re-established at the same location in September 1987. Tables 2 and 3 detail the meteorological variables and instruments used to record them during the IHD and the post-IHD period. Three meteorological stations were also established on the glacier surface for post-IHD micrometeorological studies by D. Scott Munro in different elevation zones: lower, middle and upper ice stations. These were originally positioned to represent different glacier net mass balance zones – ablation zone, equilibrium line zone and accumulation zone. Since 2012, USask has continued these stations with new instruments, but they have been relocated to accommodate changing glacier geometry and rising elevation of the equilibrium line. These data, however, are not continuous because only the lower ice station was maintained after 2013 due to rapid ice melt causing tower collapse and subsequent station burial at the higher-elevation sites. Peyto Outlet is a hydrometric station that measures glacier meltwater runoff at the outlet of Lake Munro.
The AWS sites in the PGRB are now a part of the Canadian Rockies Hydrological Observatory (https://research-groups.usask.ca/hydrology/science/research-facilities/crho.php#Overview, last access: 26 March 2021), a USask network of 35 hydrometeorological and hydrometric stations in the Canadian Rockies. They are also part of the cryospheric surface observation network (CryoNet) of the World Meteorological Organization Global Cryosphere Watch (WMO-GCW) – http://globalcryospherewatch.org/cryonet (last access: 26 March 2021). Peyto Main and Peyto Lower Ice are listed as reference CryoNet stations, whereas the others are contributing CryoNet stations of the GCW. Figure 1 and Table 1 contain the locational information, data collection periods and data elements recorded at the stations, with selected stations shown in Fig. 3. The stations are still collecting observations, and our datasets will be periodically updated from what can be described in this paper.
Table 1CryoNet station data.

Ta indicates air temperature, RH indicates relative humidity,
Ws indicates wind speed, Wd indicates wind direction, Ts indicates soil/snow/firn/ice temperature, Qsi, Qso indicates incoming
and outgoing shortwave radiation, Qli, Qlo incoming and outgoing longwave
radiation, Ppt indicates precipitation, P indicates air pressure, and Sd indicates snow depth
(SR50).
1 Station type according to CryoNet.
2 Recorded at 15 min intervals;
3 Recorded hourly until September 2008, at 30 min intervals then after.
4 Daily data for the summer months.
5 Qli measurements began in September 1998.
6 Hourly until September 2008, then at 30 min intervals to 2015 and
15 min intervals since 2015. Qsi and Qso measurements from 1999 to 2010;
Qsi measurements reinstated in 2015.
7 Snowpack glacier accumulation and ablation data are also available.
Ice stations have several data gaps, mainly in middle and upper ice station
records.
a Ta, RH, Ws, Qsi and Qli are included (with Wd, Ts, Ppt and P from Peyto Main Old) in the data repository.
b Ta, RH, Ws, Qsi and Ppt are included in the data repository.
c Ta, RH, Ws and Qsi are included in the data repository.
d Ta, RH and Ws are included in the data repository.
e Runoff is included in the data repository.
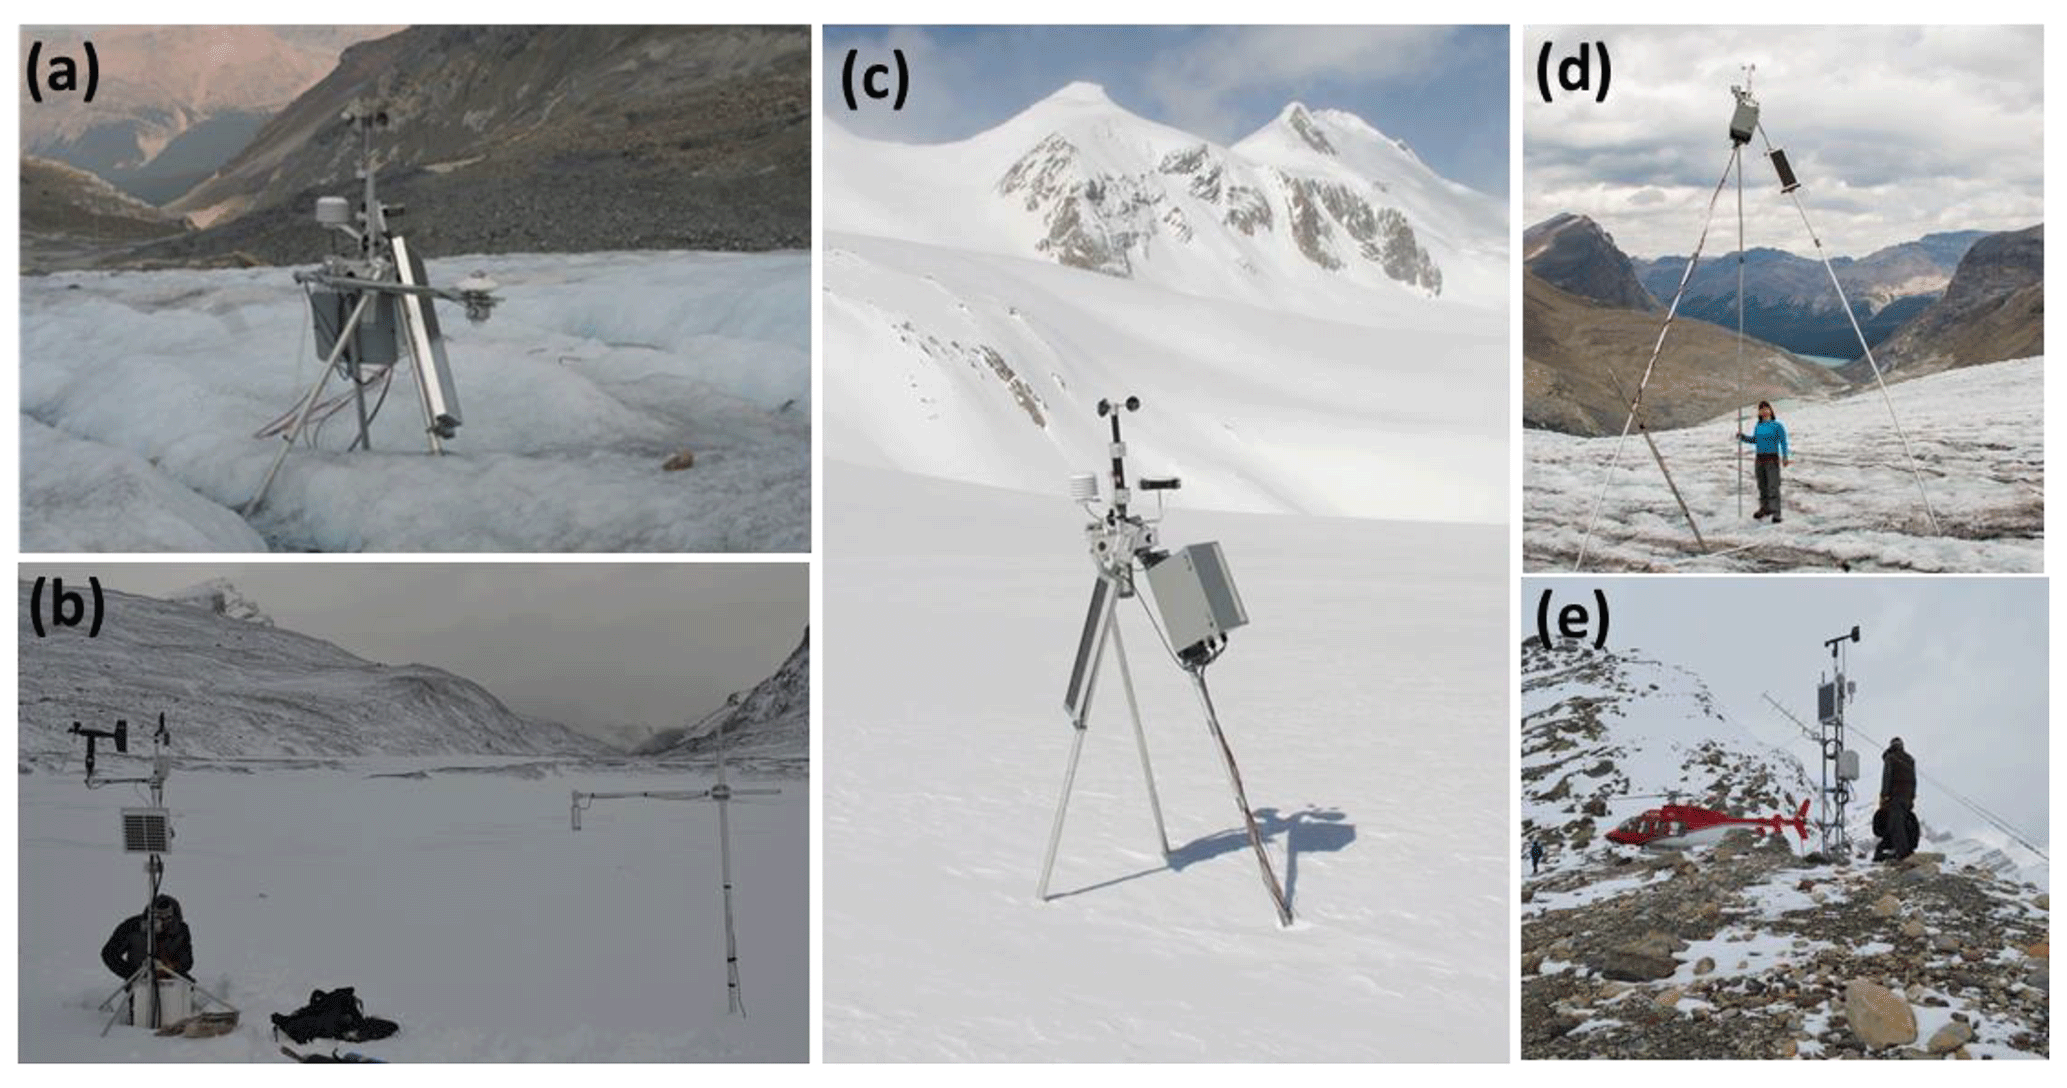
Figure 3Photographs of selected CryoNet stations in the PGRB. (a) Peyto Lower Ice (2009), (b) Peyto Lower Ice (October 2016), (c) Peyto Middle Ice (April 2006), (d) Peyto Middle Ice (September 2015) and (e) Bow Hut (October 2016). Photographs by Dhiraj Pradhananga (b, e), D. Scott Munro (a, c) and Angus Duncan (d).
Young and Stanley (1976) documented the glaciological and hydrometeorological data collected within the glacier basin during the IHD. Past studies over the glacier are also well documented in Peyto Glacier: One Century of Science (Demuth et al., 2006), which provides details on the mass balance data until 1995, along with the hypsometry of the glacier.
3.1 Meteorological data – historical and present
Young and Stanley (1976) describe meteorological and mass balance data for the period 1965–1974. Air temperature, relative humidity, global radiation, hours of bright sunshine, cloud cover, wind speed and precipitation were recorded during the summer months at a meteorological station located in the base camp (Fig. 4a) and documented as “Peyto Creek Base Station” observations. The data collection details and instruments used are described in publications of the Inland Waters Directorate of Environment Canada (Goodison, 1972; Young and Stanley, 1976).
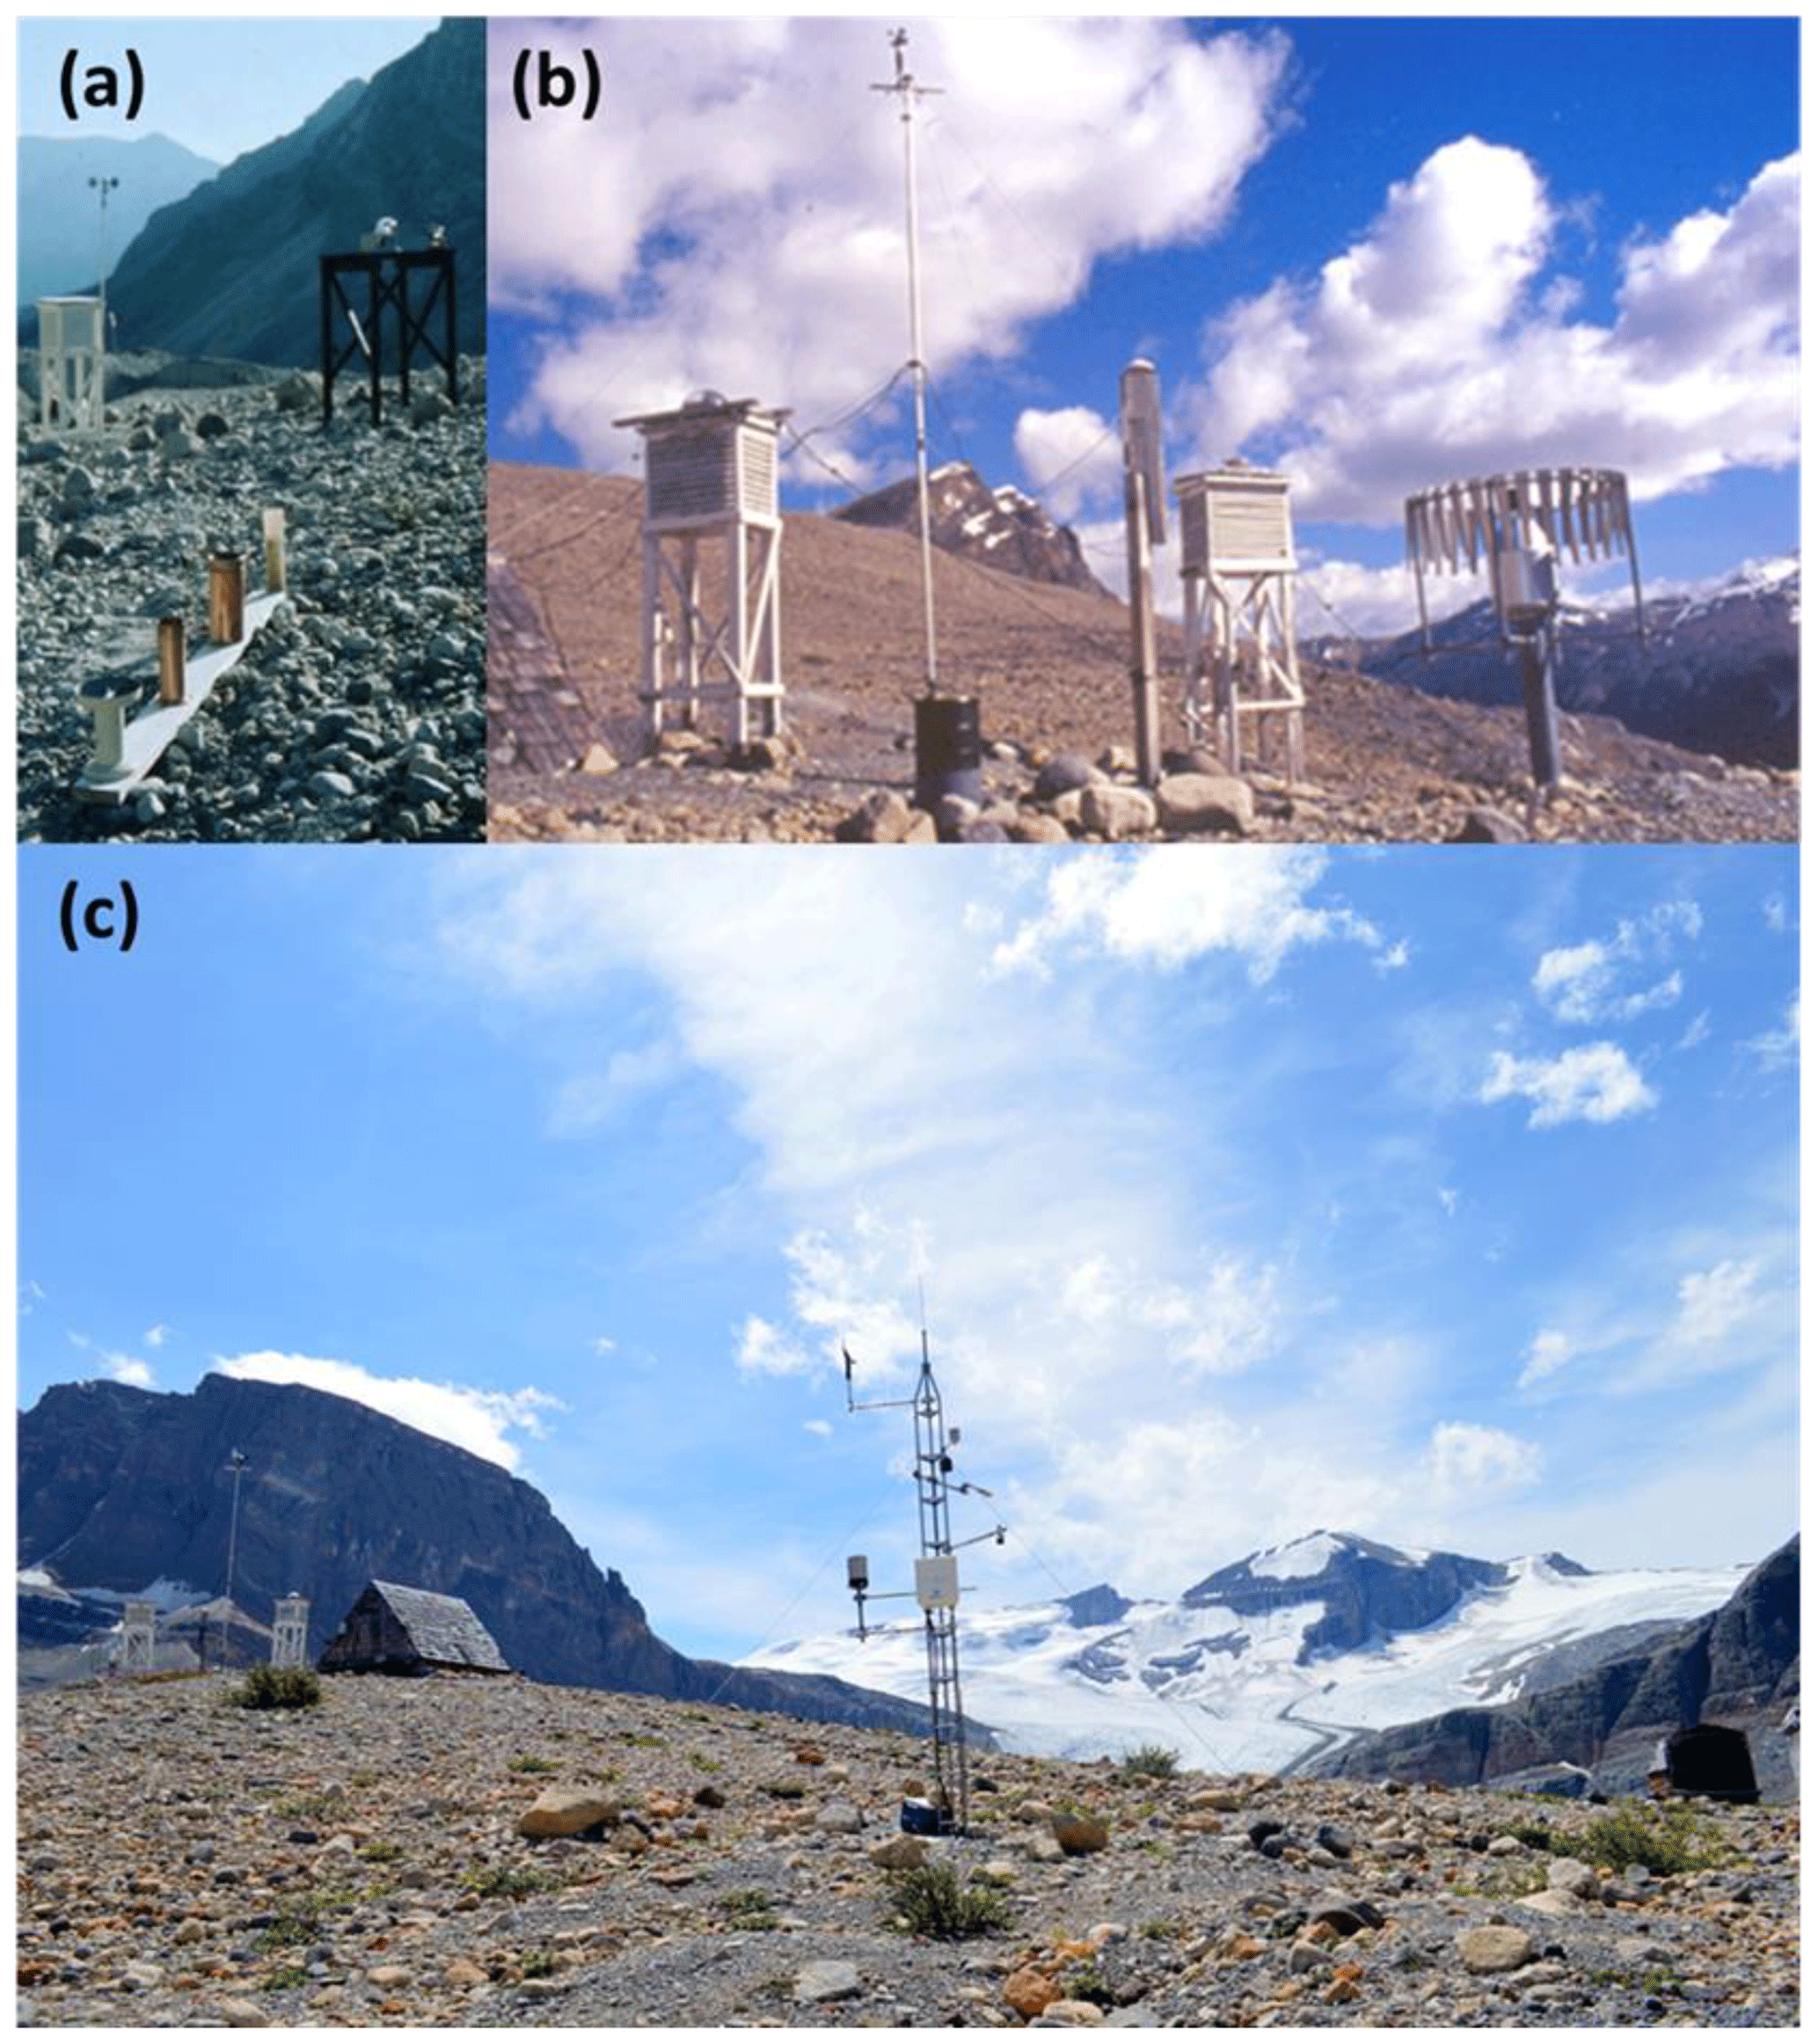
Figure 4The base camp stations: (a) Peyto Main IHD, July 1970; (b) Peyto Main Old (July 2009); (c) Peyto Main (September 2015) (Peyto Main Old in left background). Photographs by D. Scott Munro (a, b) and May Guan (c).
Automatic weather stations were subsequently installed at on- and off-glacier sites for micrometeorological studies and retained for long-term data collection. The data from Peyto Main Old (Fig. 4b) are hourly prior to September 2008 and half-hourly thereafter to 2018. The Peyto Main station (latitude: 51.51∘ N, longitude: 123.44∘ W; elevation: 2237 m) was installed near Peyto Main Old in 2013, with new instruments and settings (Table 4). Peyto Main data were recorded at 15 min intervals from 2013 to the present day. Some data (2002–2007) for Peyto Main Old were published (Munro, 2011b) in support of the IP3 Network initiative: Improving Processes & Parameterization for Prediction in Cold Regions Hydrology (IP3, 2010). The details of the IP3 Network and AWS data from the Peyto Main Old site (Table 2) are available at http://www.usask.ca/ip3/data.php (last access: 26 March 2021).
Table 2Details of hourly PGRB meteorological data referred to in Goodison (1972) and Munro (2011b). N/A indicates “not available”.
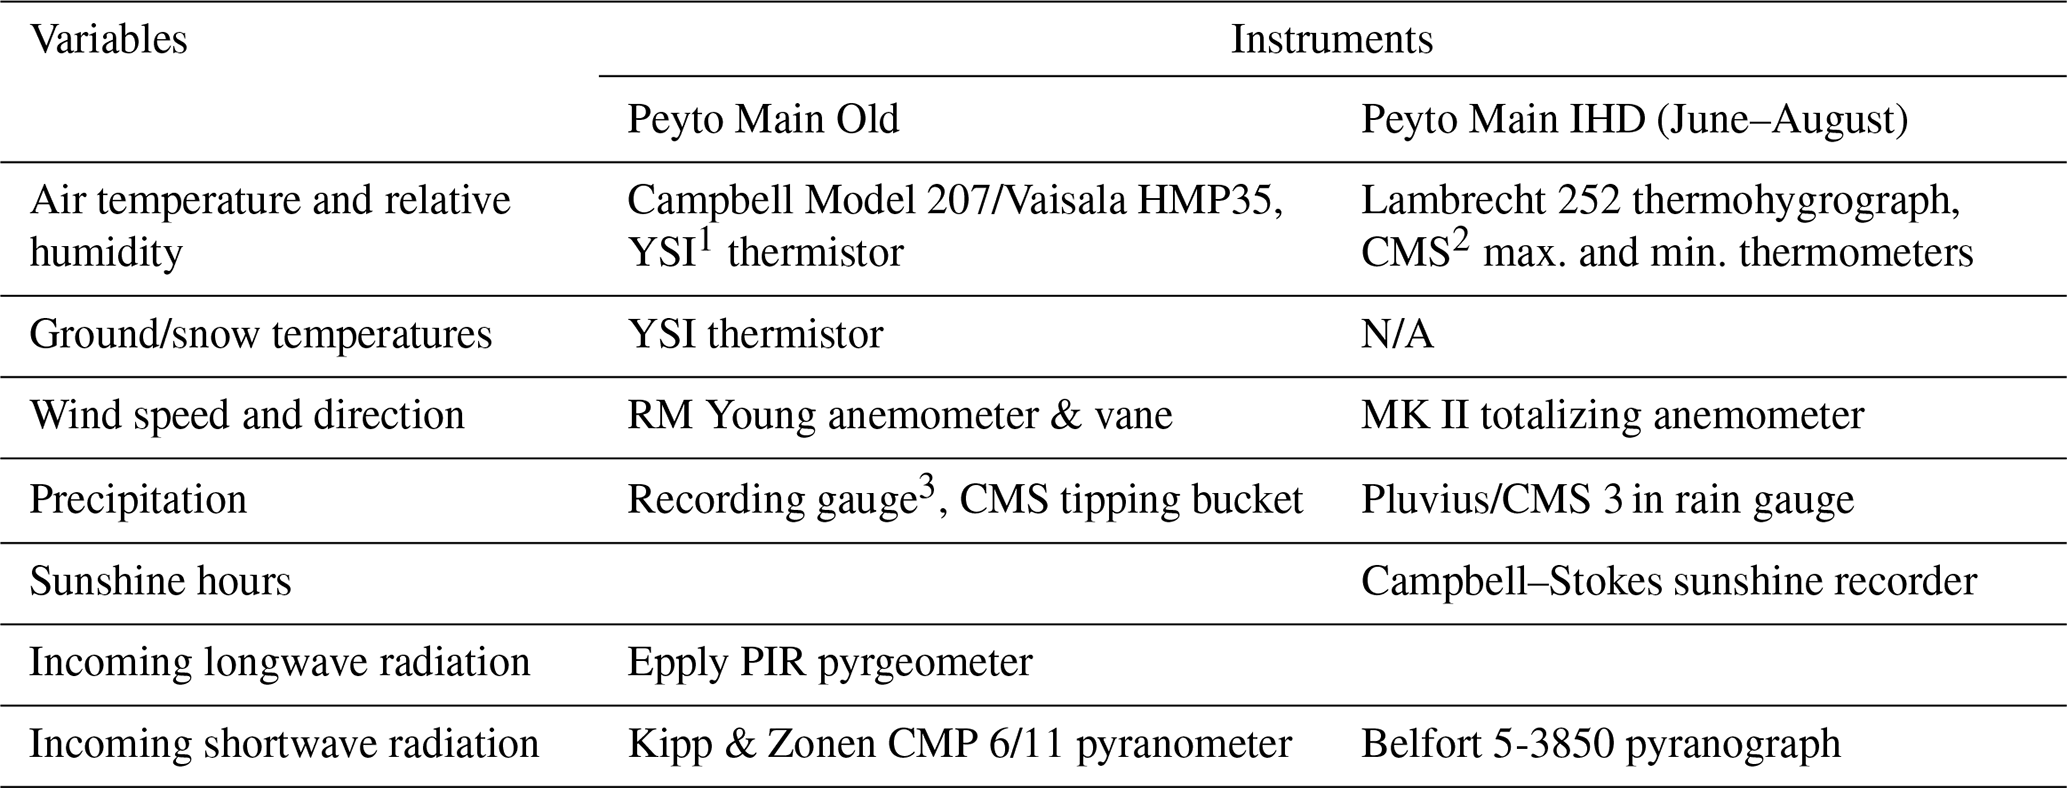
1 YSI stands for Yellow Springs Instruments. 2 CMS stands for Canadian Meteorological Service (now MSC, the Meteorological Service of Canada). 3 Geonor T-200B weighing gauge with Alter shield after April 2002. Before April 2002, an adapted Fischer–Porter weighing gauge with Alter shield was used.
USask established the Peyto Main station, equipped with new instruments (Table 3) and a new setting as a reference station for the PGRB, in July 2013 within 20 m from Peyto Main Old (Fig. 4c). It measures incoming and outgoing shortwave and longwave radiation, air temperature, humidity, wind speed, precipitation and snow depth. Figure 5 presents daily averages of these variables for the period from July 2013 to September 2019.
Table 3Meteorological measurements and instruments installed at Peyto Main.
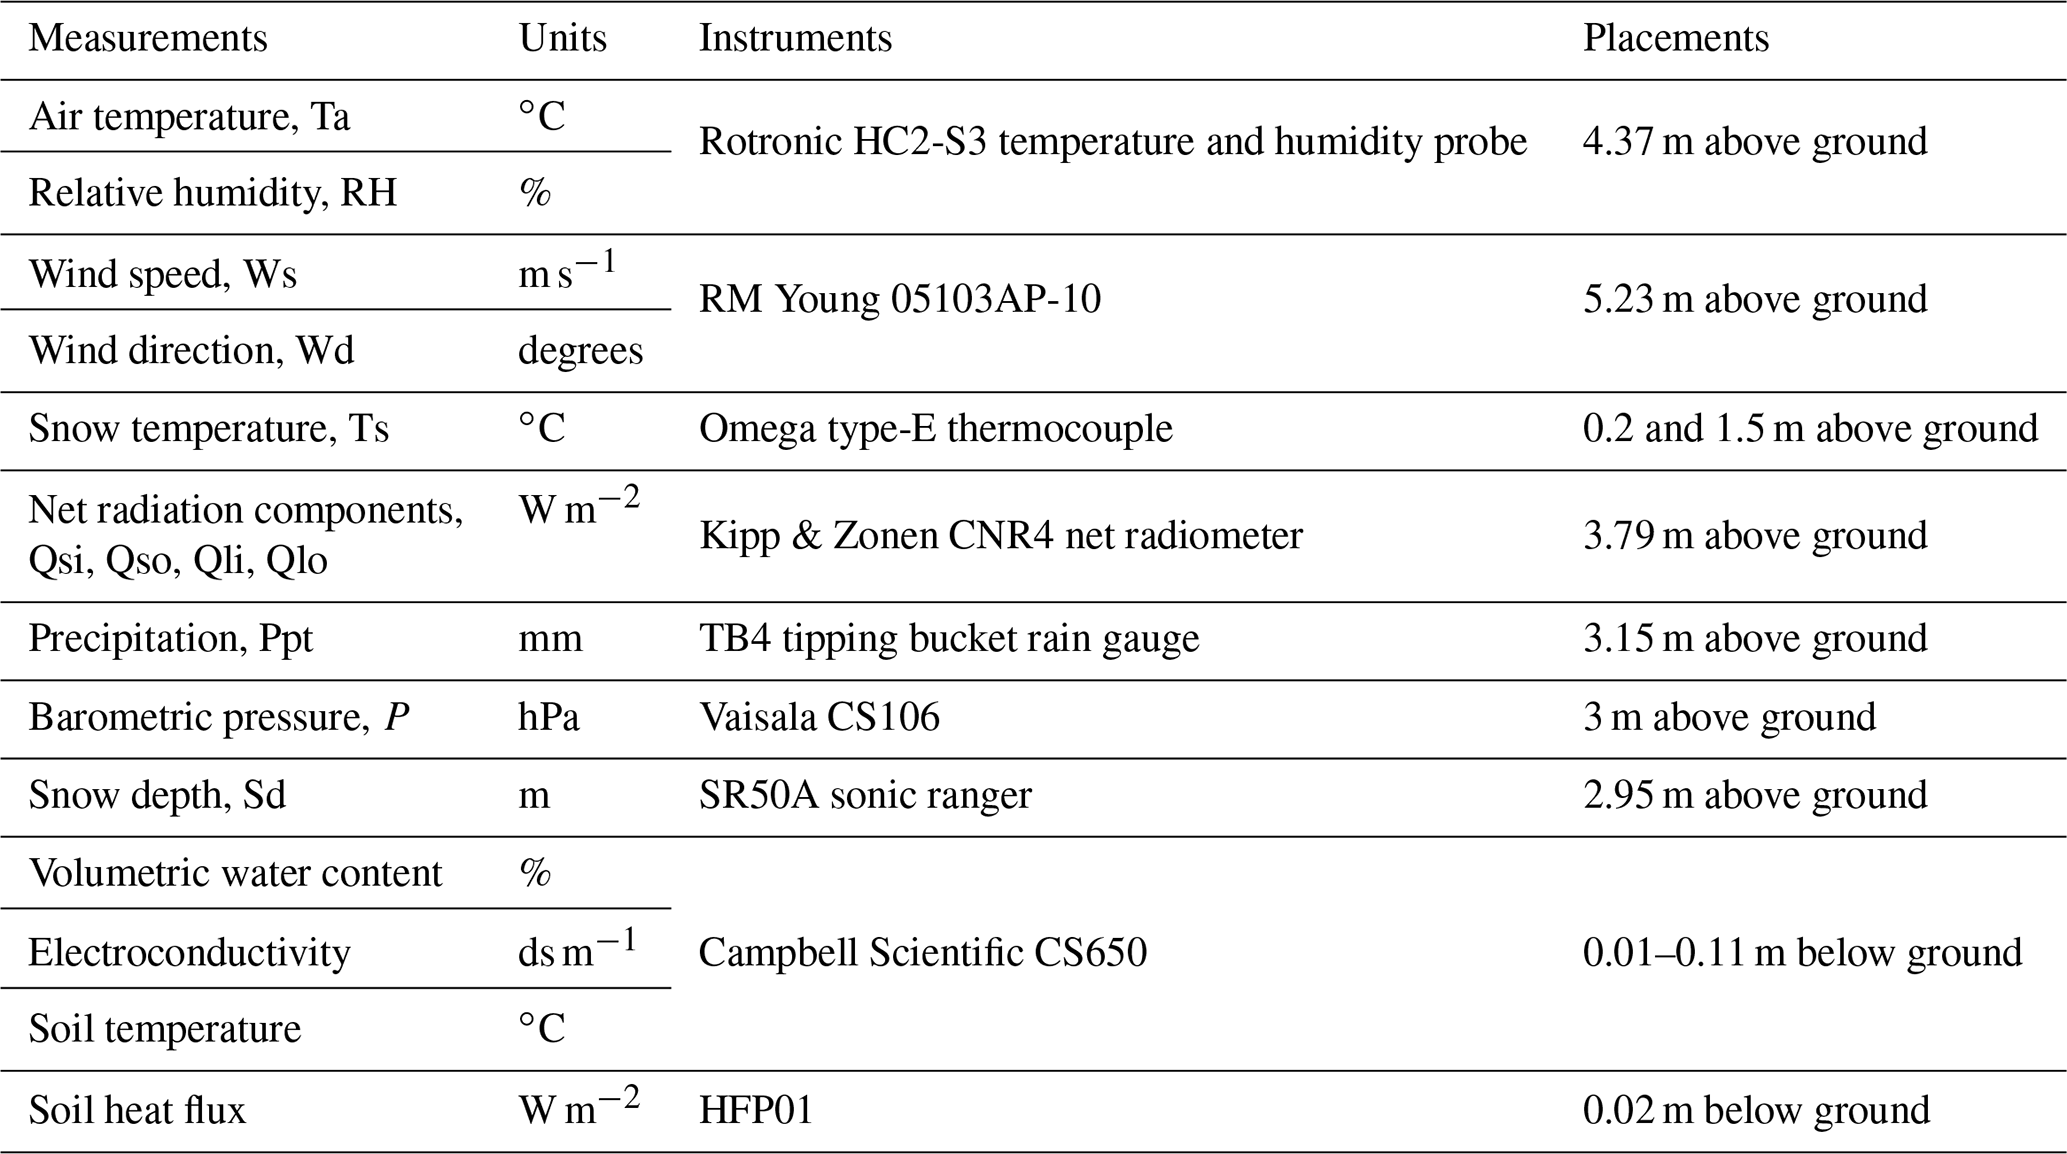

Figure 5Peyto Main plots of 24 h mean air temperature (Ta), relative humidity (RH), wind speed (Ws), incoming shortwave radiation (Qsi) and incoming longwave radiation (Qli) – August 2013 to September 2019. Yellow and dark orange in the bottom panel, respectively, are incoming shortwave and longwave radiation.
The nearest AWS outside the basin boundary is operated by USask at the Alpine Club of Canada's Bow Hut (Fig. 1), established in October 2012 and continuously monitored since then. Air temperature, humidity, wind speed and snow depth data are available from the station. The Peyto Main AWS and that at Bow Hut were connected to telemetry in 2015, thus enabling them to be monitored remotely. Near-real-time data by telemetry, extending back 1 week, can be viewed at https://research-groups.usask.ca/hydrology/data.php (last access: 26 March 2021).
Meteorological data from the Peyto Ice stations (upper, middle and lower) are not continuous because of difficulties in operating the stations on rapidly ablating glacier ice, but periods of synchronous observational data are available. The three stations were operational at the same time for brief periods between 2007 and 2013 (Table 1). Peyto Lower Ice has been maintained for a longer period than Peyto Middle Ice and Peyto Upper Ice, collecting both incoming and outgoing shortwave radiation data until August 2010. Peyto Lower Ice, Peyto Main Old and Peyto Main are currently operational. Peyto Lower Ice was updated with new instruments in October 2015. Station data availability details are listed in Table 1.
3.2 Precipitation
Precipitation at the Peyto Main Old station was measured by a Geonor T-200B, a weighing precipitation gauge with an Alter wind shield, beginning in April 2002, with a CMS tipping bucket rain gauge (TBRG) operating nearby (Fig. 4b and Table 2). However, there is reason to doubt the reliability of these records because comparisons with the new TBRG at the Peyto Main station, 20 m west of the old station (Fig. 4c), show that both the Geonor and the old TBRG recorded significantly less precipitation between June and September (Fig. 6), the Geonor catch being approximately 70 % of the new TB catch and that of the old TB much smaller. Also, despite good comparisons with June–September Bow Summit precipitation for 2014 to 2016, at a distance of just 5.5 km (Fig. 1), the Geonor persistently underestimates annual precipitation during the 6 years following 2010 (Fig. 7), even though it is 160 m above Bow Summit.
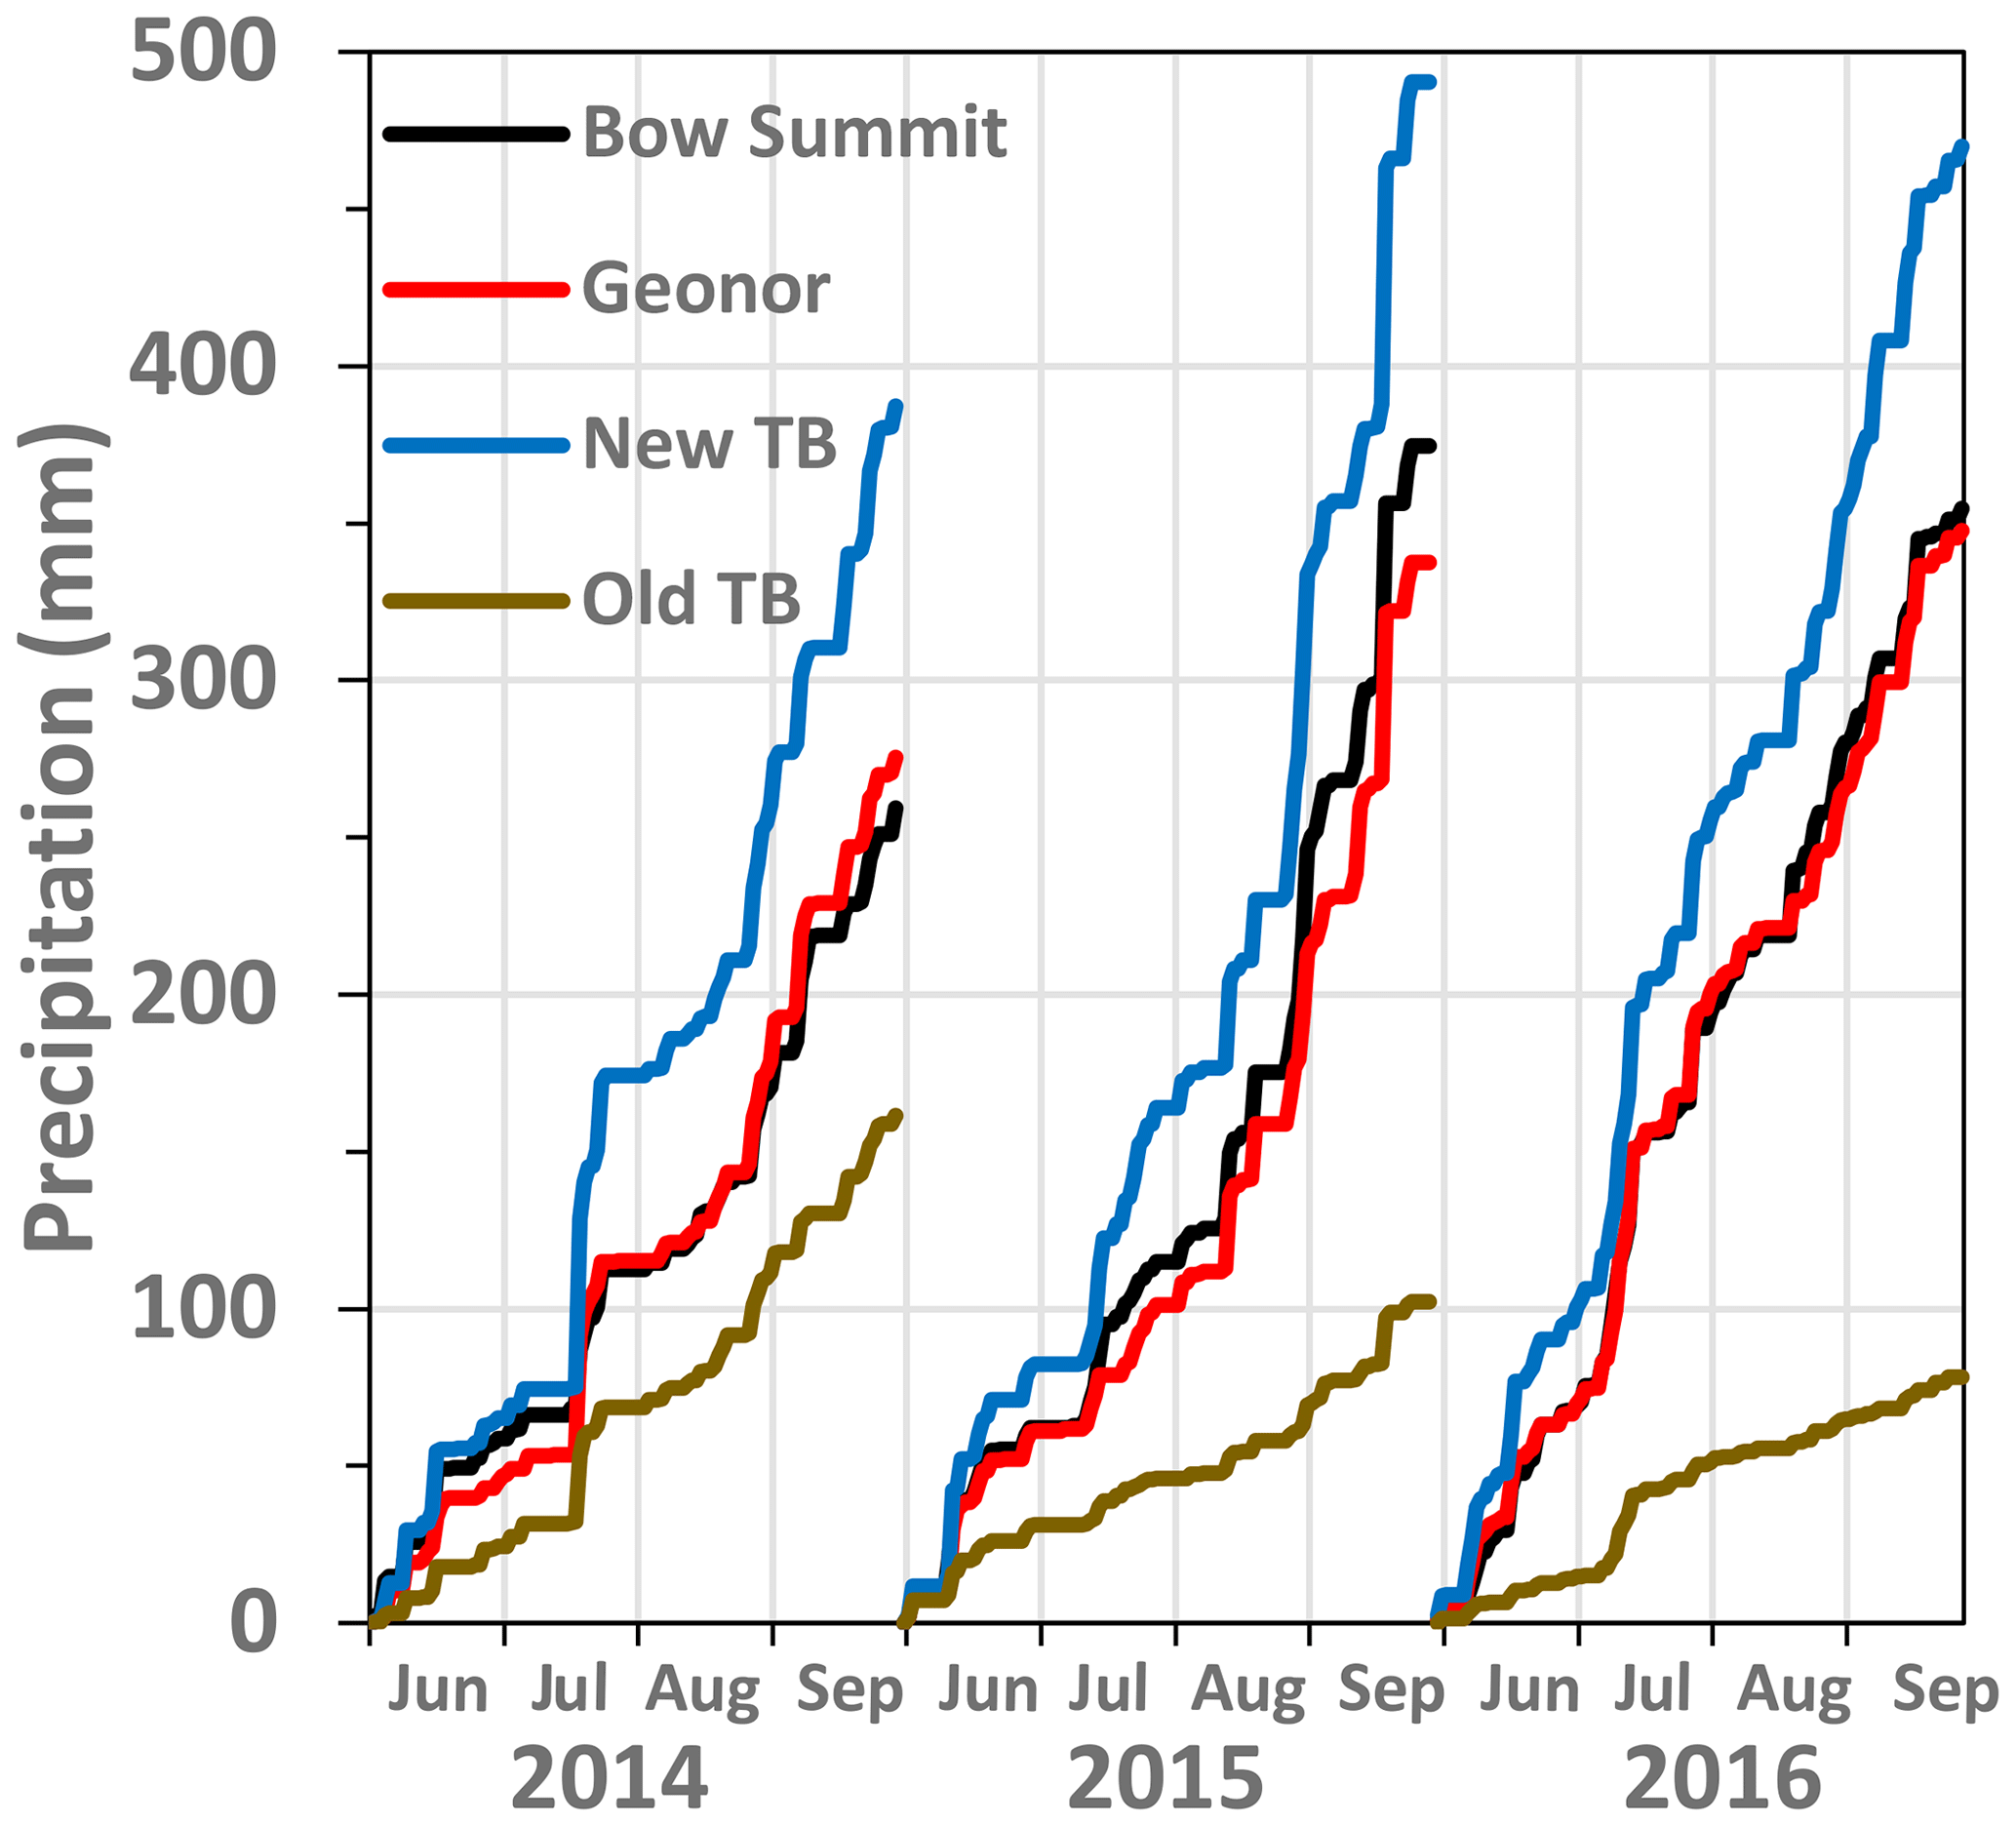
Figure 6Cumulative rainfall comparisons at the Peyto Main station and Bow Summit over the summer months.
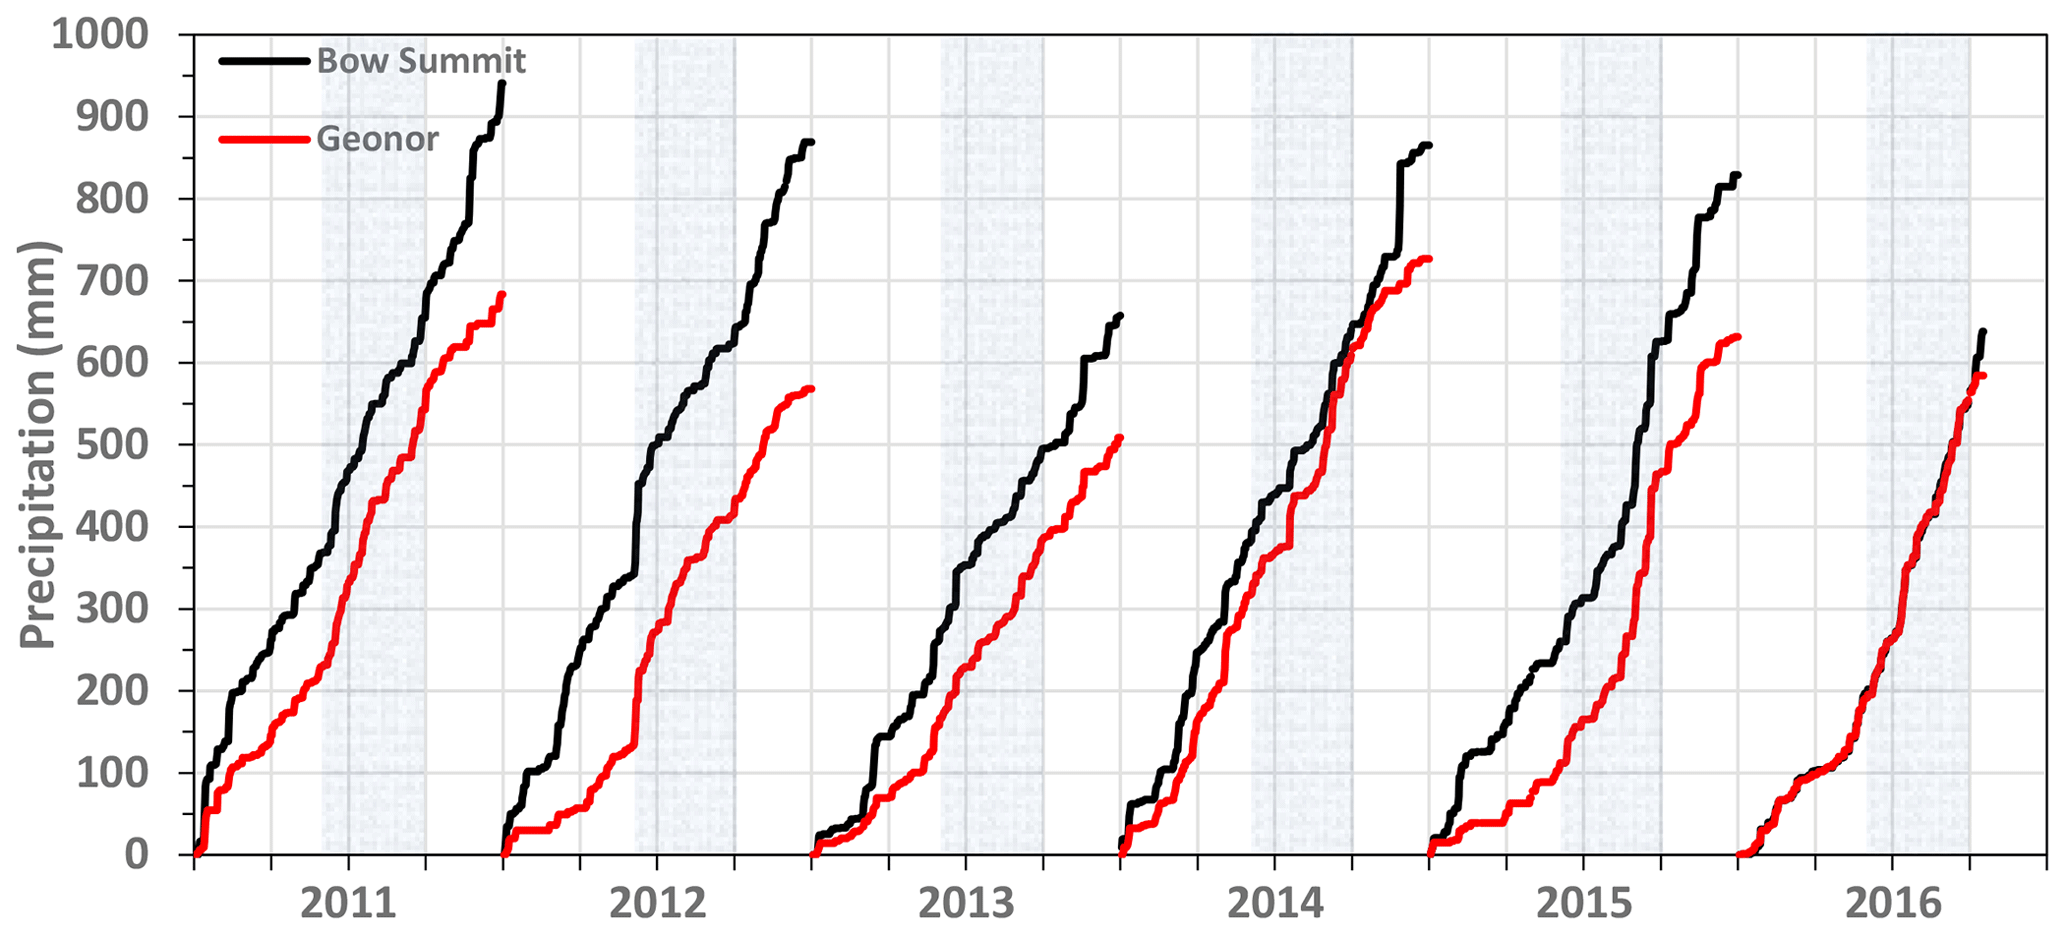
Figure 7Annual cumulative precipitation at Bow Summit and Peyto Main, 2011 to September 2016, with highlighting of main summer rainfall months.
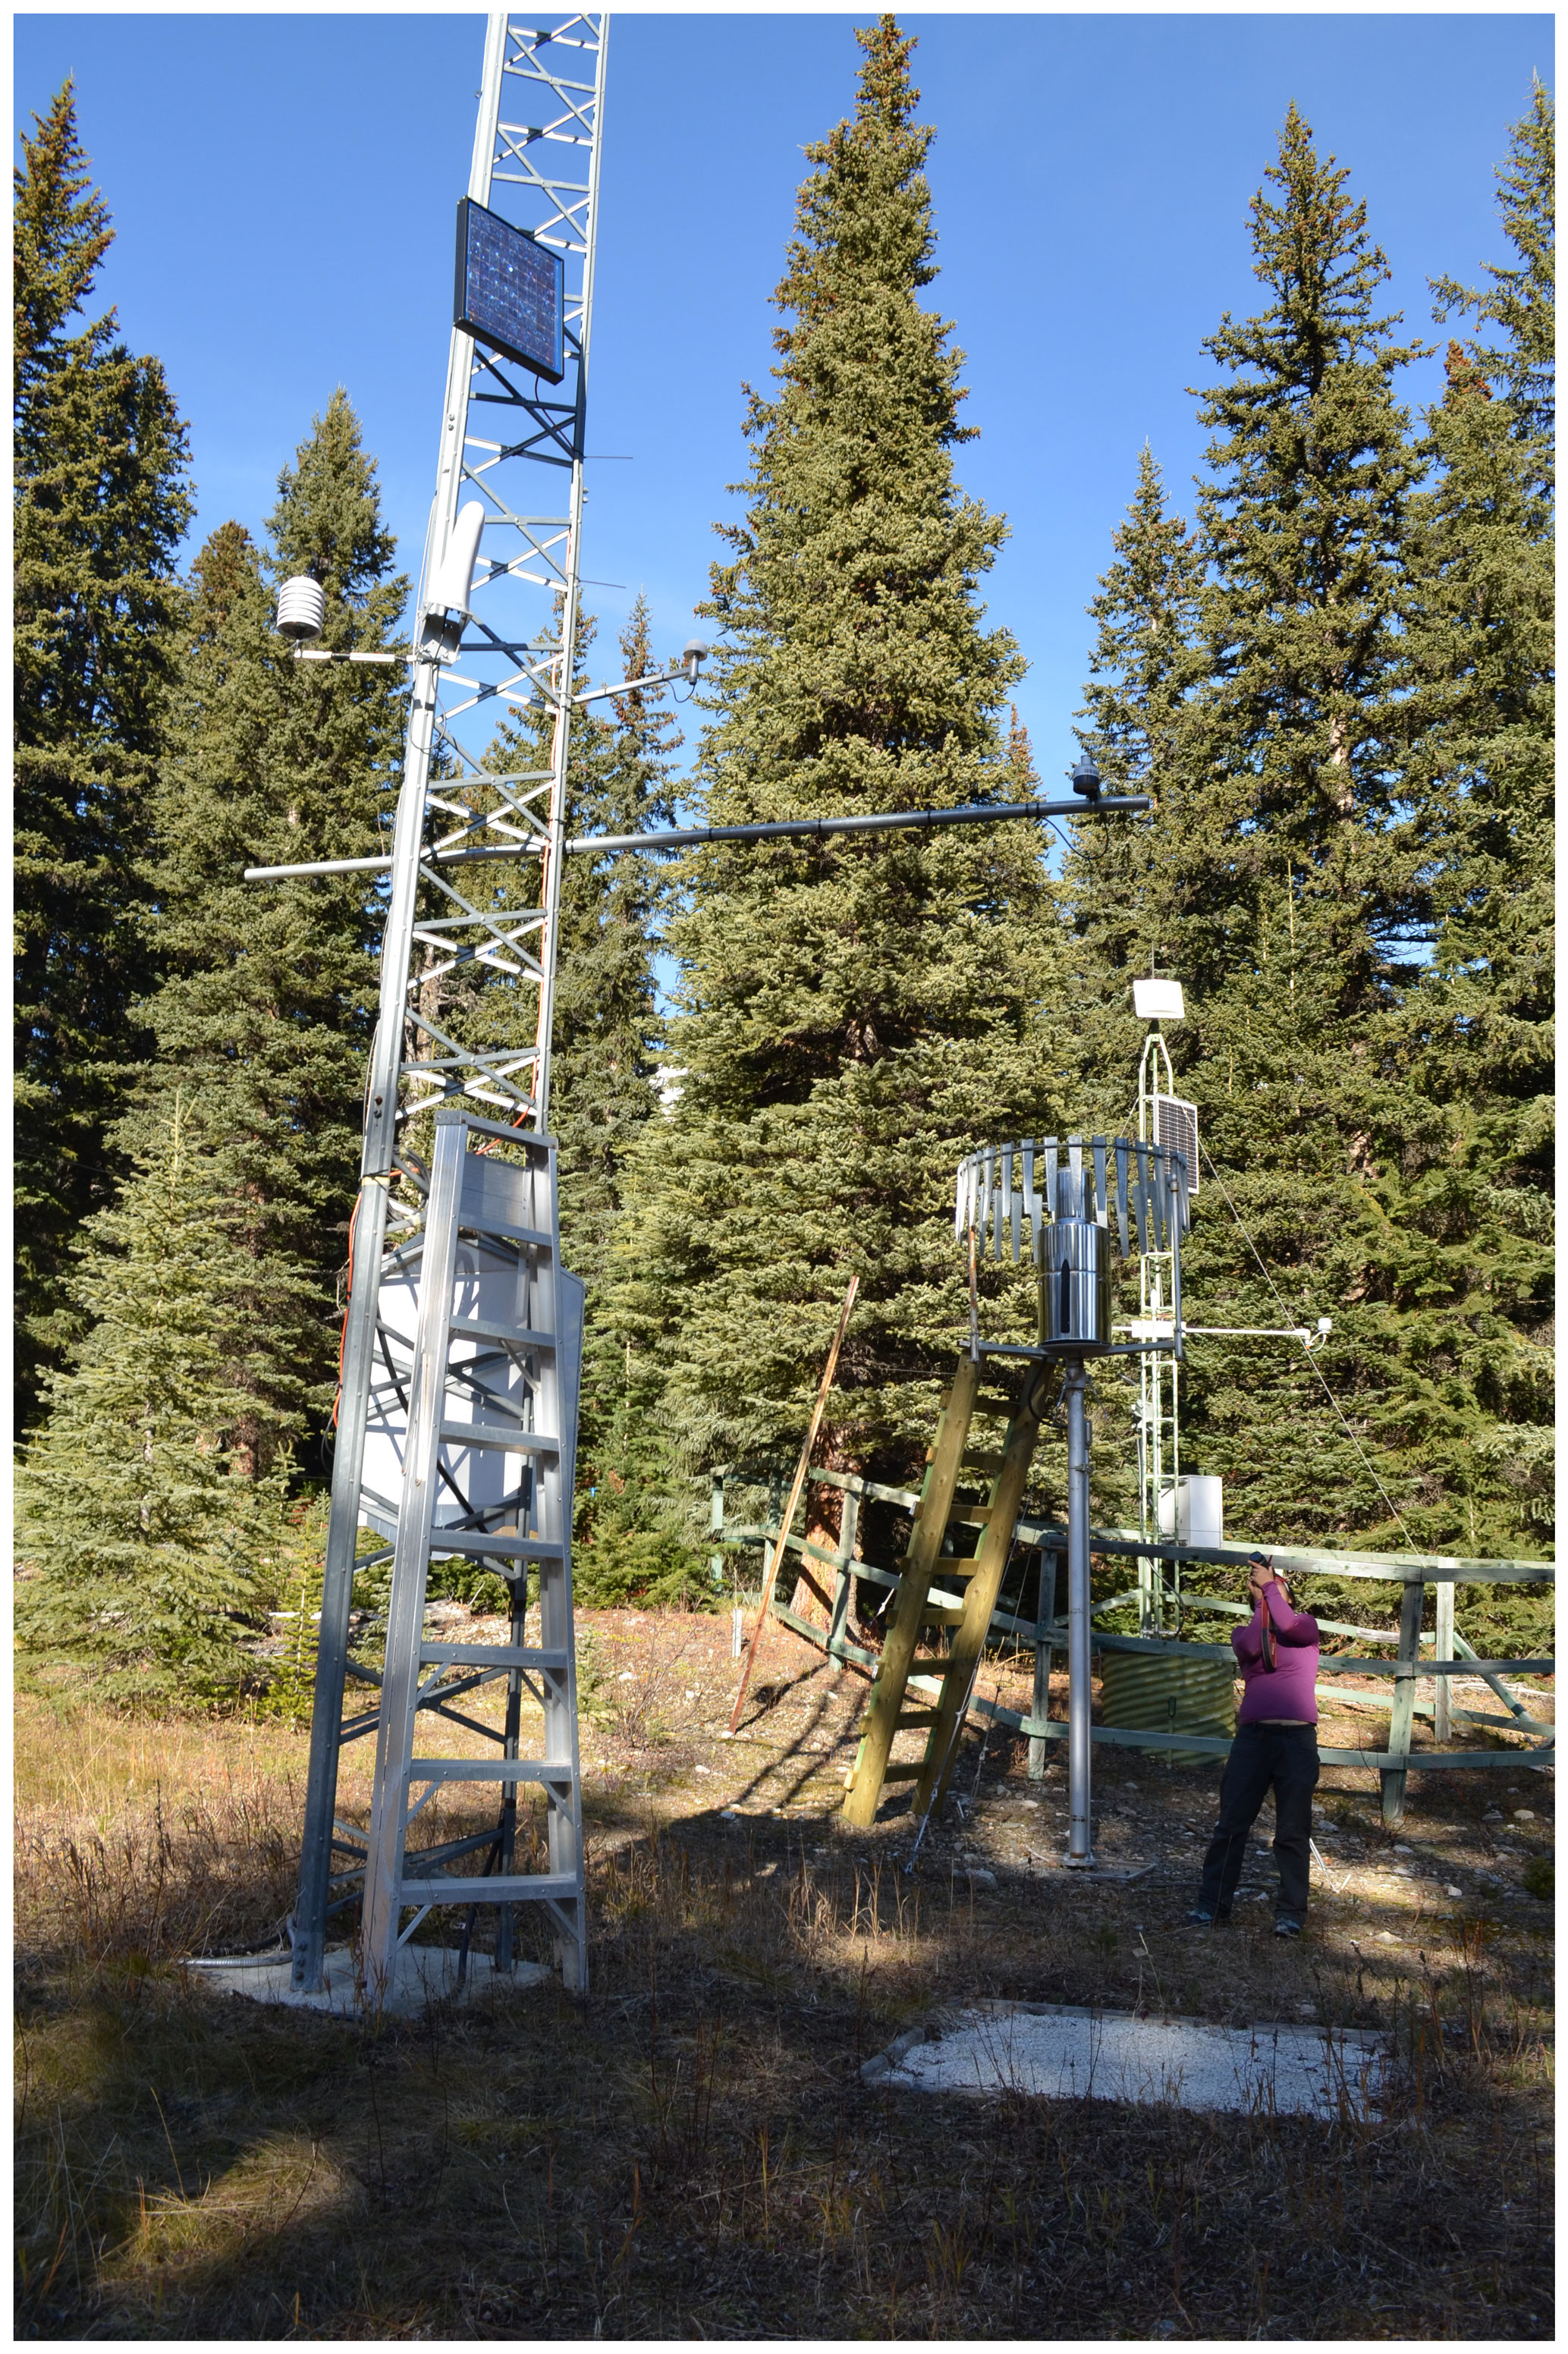
Problems with the old TB date from 2007, when a rapid decline in gauge response was noted (Munro, 2021), but the Geonor gauge response invited further investigation. Therefore, its records were first segregated according to rainfall and snowfall by applying the precipitation phase determination algorithm developed by Harder and Pomeroy (2013). Snowfall was bias corrected for wind-induced catch reduction (Smith, 2007), and rainfall was corrected with a catch efficiency of 0.95 (Pan et al., 2016). Bow Summit data were accepted as recorded because the surrounding tall trees provide sheltering but do not unload intercepted snow to the single Alter-shielded weighing precipitation gauge in the clearing centre at the site (Fig. 8), thus making it ideal for precipitation measurements.
Daily precipitation sequences were averaged over 7 years (2010–2016 inclusive) and seasonally accumulated to compare Peyto Main Geonor and Bow Summit measurements (Fig. 9). Observed precipitation accumulation is similar during the summer months between May and October, with mostly liquid precipitation occurring from June to September. Large differences, however, are found for the adjacent winter snowfall months of January–May and October–December, cumulative winter precipitation recorded at Peyto being significantly less than that at Bow Summit. Therefore, the Peyto precipitation gauge may not have been catching a large portion of the solid precipitation. It is also possible that the gauge undercatch correction procedure, originally developed to offset wind-induced catch reduction of Canadian Prairie snowfall (Smith, 2007), may require modification for use in a high-mountain environment with complex terrain wind flow. While the summer precipitation comparisons with the new TB are much closer (Fig. 6), the Peyto Main Station is 160 m higher and 5.5 km closer to the continental divide and so would be expected to receive somewhat higher precipitation than Bow Summit.

Figure 9Seasonal Bow Summit and Peyto Main cumulative precipitation from 7-year averages of daily values, 2010 to 2016 inclusive, with main summer rainfall months shaded.
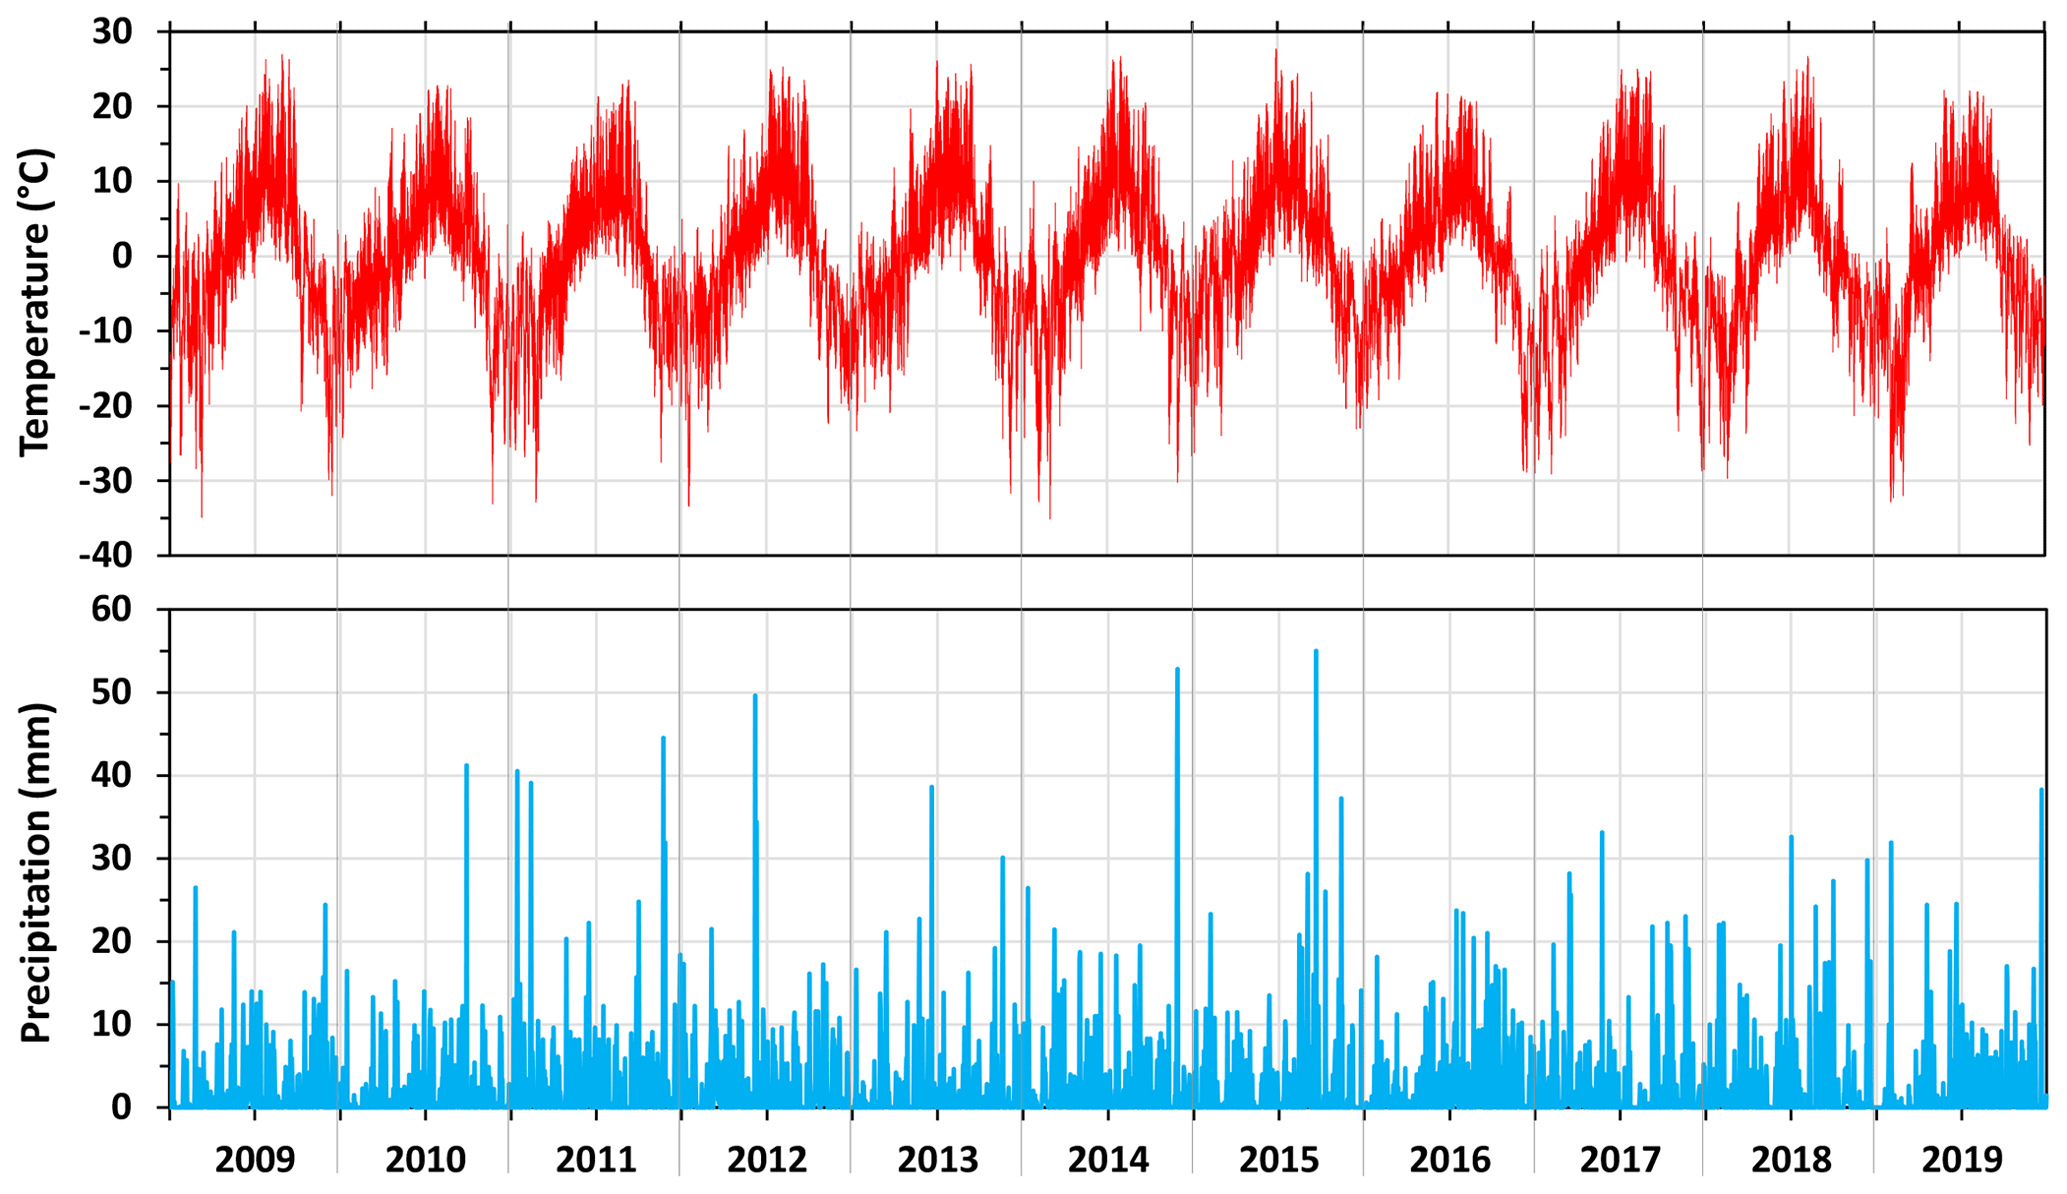
Despite reservations noted above, the precipitation data recorded at Bow Summit (51.70∘ N, 116.47∘ W; elevation 2080 m, climate ID: 3050PPF) are considered the most suitable to represent precipitation over the PGRB. Bow Summit data can be downloaded from the Alberta Climate Information Service (ACIS, http://agriculture.alberta.ca/acis/, last access: 26 March 2021). Quality-controlled hourly temperature and precipitation data are available continuously from 1 November 2008 to the present; continuous daily data are available from 23 March 2006 to the present. The hourly temperature and precipitation data from 1 January 2009 to 31 December 2019 are plotted in Fig. 10; earlier data are not sufficiently continuous to be included.
3.3 Data cleaning and gap infilling
Meteorological data recording frequency was changed from hourly to half hourly in September 2008 and to 15 min intervals in 2013 with the new USask stations (Table 1). However, quarter- and half-hourly data were aggregated to hourly intervals for archiving, thus corresponding to the AWS recording interval used prior to September 2008. Raw data were thoroughly checked for errors and obviously erroneous data removed. Missing data were filled in by either linear interpolation or linear regression to data from stations within the basin. Linear interpolation was chosen when a data gap was less than or equal to 4 h, and a regression method was applied to gaps longer than 4 h. These data cleaning processes were followed in sequence by applying various R functions, along with the Cold Regions Hydrological Model R package (CRHMr) (Shook, 2016a) for which guidance and installation details are available on GitHub https://github.com/CentreForHydrology/CRHMr (last access: 26 March 2021). The data processing steps for quality assurance and control are shown in Fig. 11.
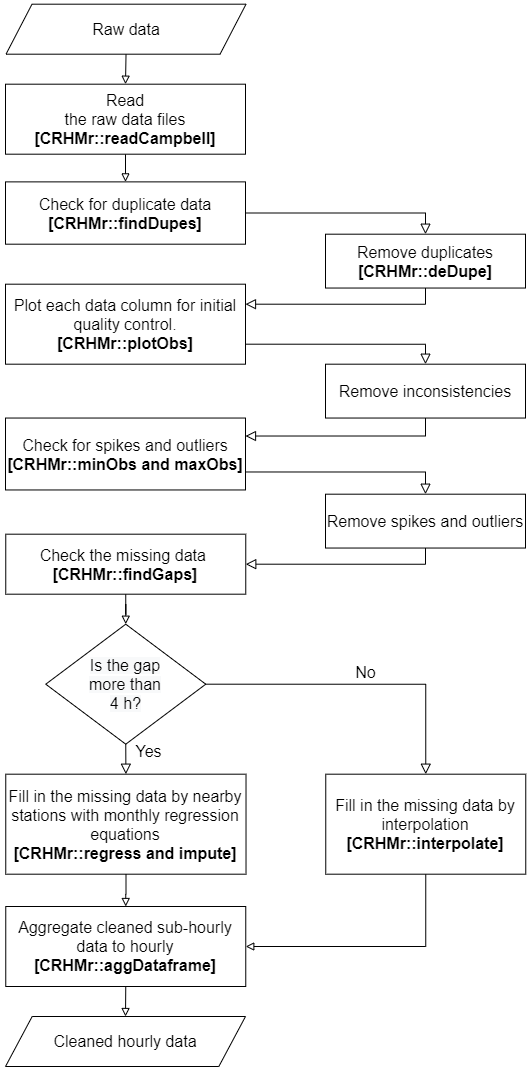
Figure 11Meteorological data cleaning process with corresponding R functions of the CRHMr package stated within brackets
Despite two data gaps 6–8 months long and five more that span periods of 15–45 d, the Peyto Main Old record is over 94 % complete between 1987 and 2018. Gap fill-ins and corrections to key elements, such as air temperature and solar radiation, were done using expert judgment by D. Scott Munro, with flags inserted to aid judgment on data suitability (Munro, 2021). Recent data from Peyto Main Old (4 October 2010 to 31 July 2018) and Peyto Main (17 July 2013 to 1 October 2019) are almost continuous, except for two short gaps in 2013 for Peyto Main Old (13 h total) and five brief gaps in 2013, 2015 and 2016 for Peyto Main (5.5 h total) – each a gap of less than 4 h. The wind speed data from Peyto Main Old are in error from 17 July 2017 to 8 March 2018. Also, the temperature and humidity probes at Peyto Main were not functioning properly for longer periods during 2016–2018. The temperature probe at Peyto Main recorded 10 ∘C less than that of Peyto Main Old from 22 November 2016 to 8 March 2018 due to a coding error in the datalogger program; the humidity probe was not functioning well from 20 September 2016 to 20 March 2017. These differences were detected by plotting the data and comparing them with data from Peyto Main Old.
Table 4 shows the regression results and Fig. 12 shows the systematic bias in Peyto Main air temperature data before and after a 10 ∘C correction. The erroneous humidity data were corrected from the Peyto Main Old station data using monthly regressions (Table 5). In addition, Peyto Main station data for all the variables were extended back to 2010 using monthly regressions with data from the Peyto Main Old station.
Table 4Regression results for Peyto Main and Peyto Main Old hourly data.
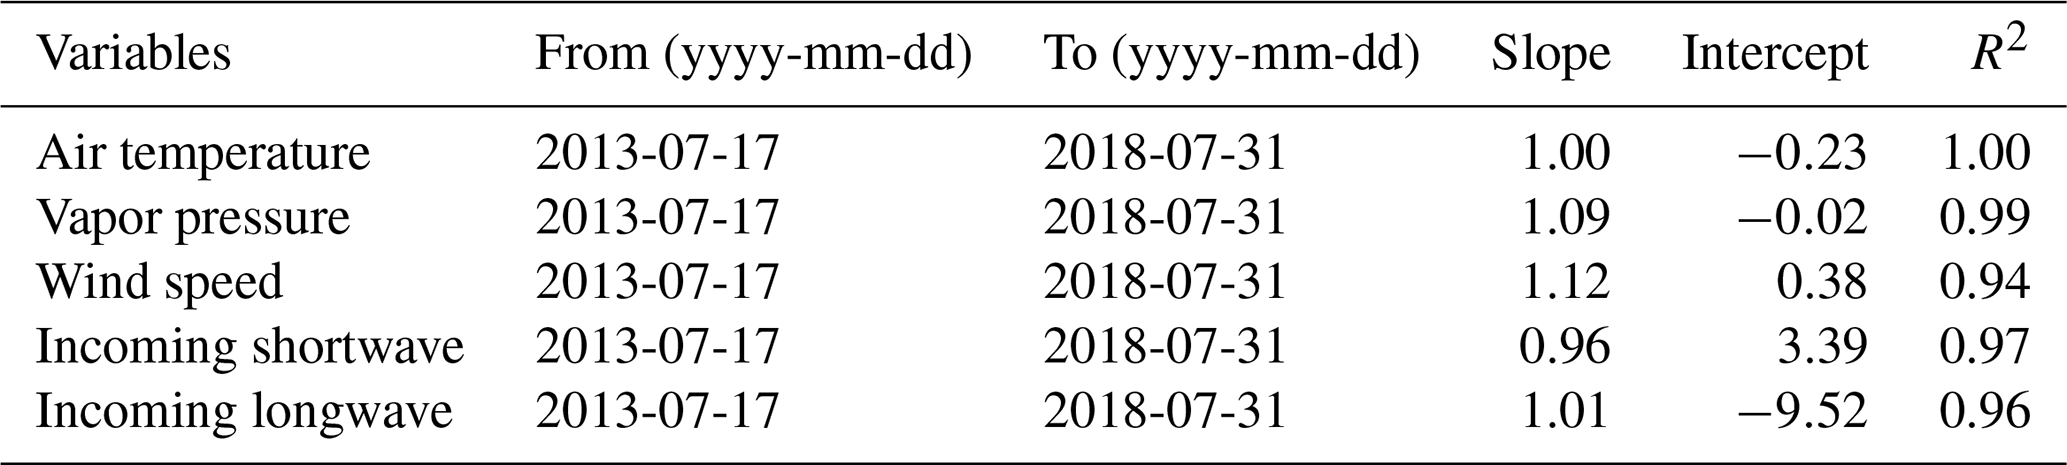
Table 5Monthly regression results for Peyto Main and Peyto Main Old hourly data.
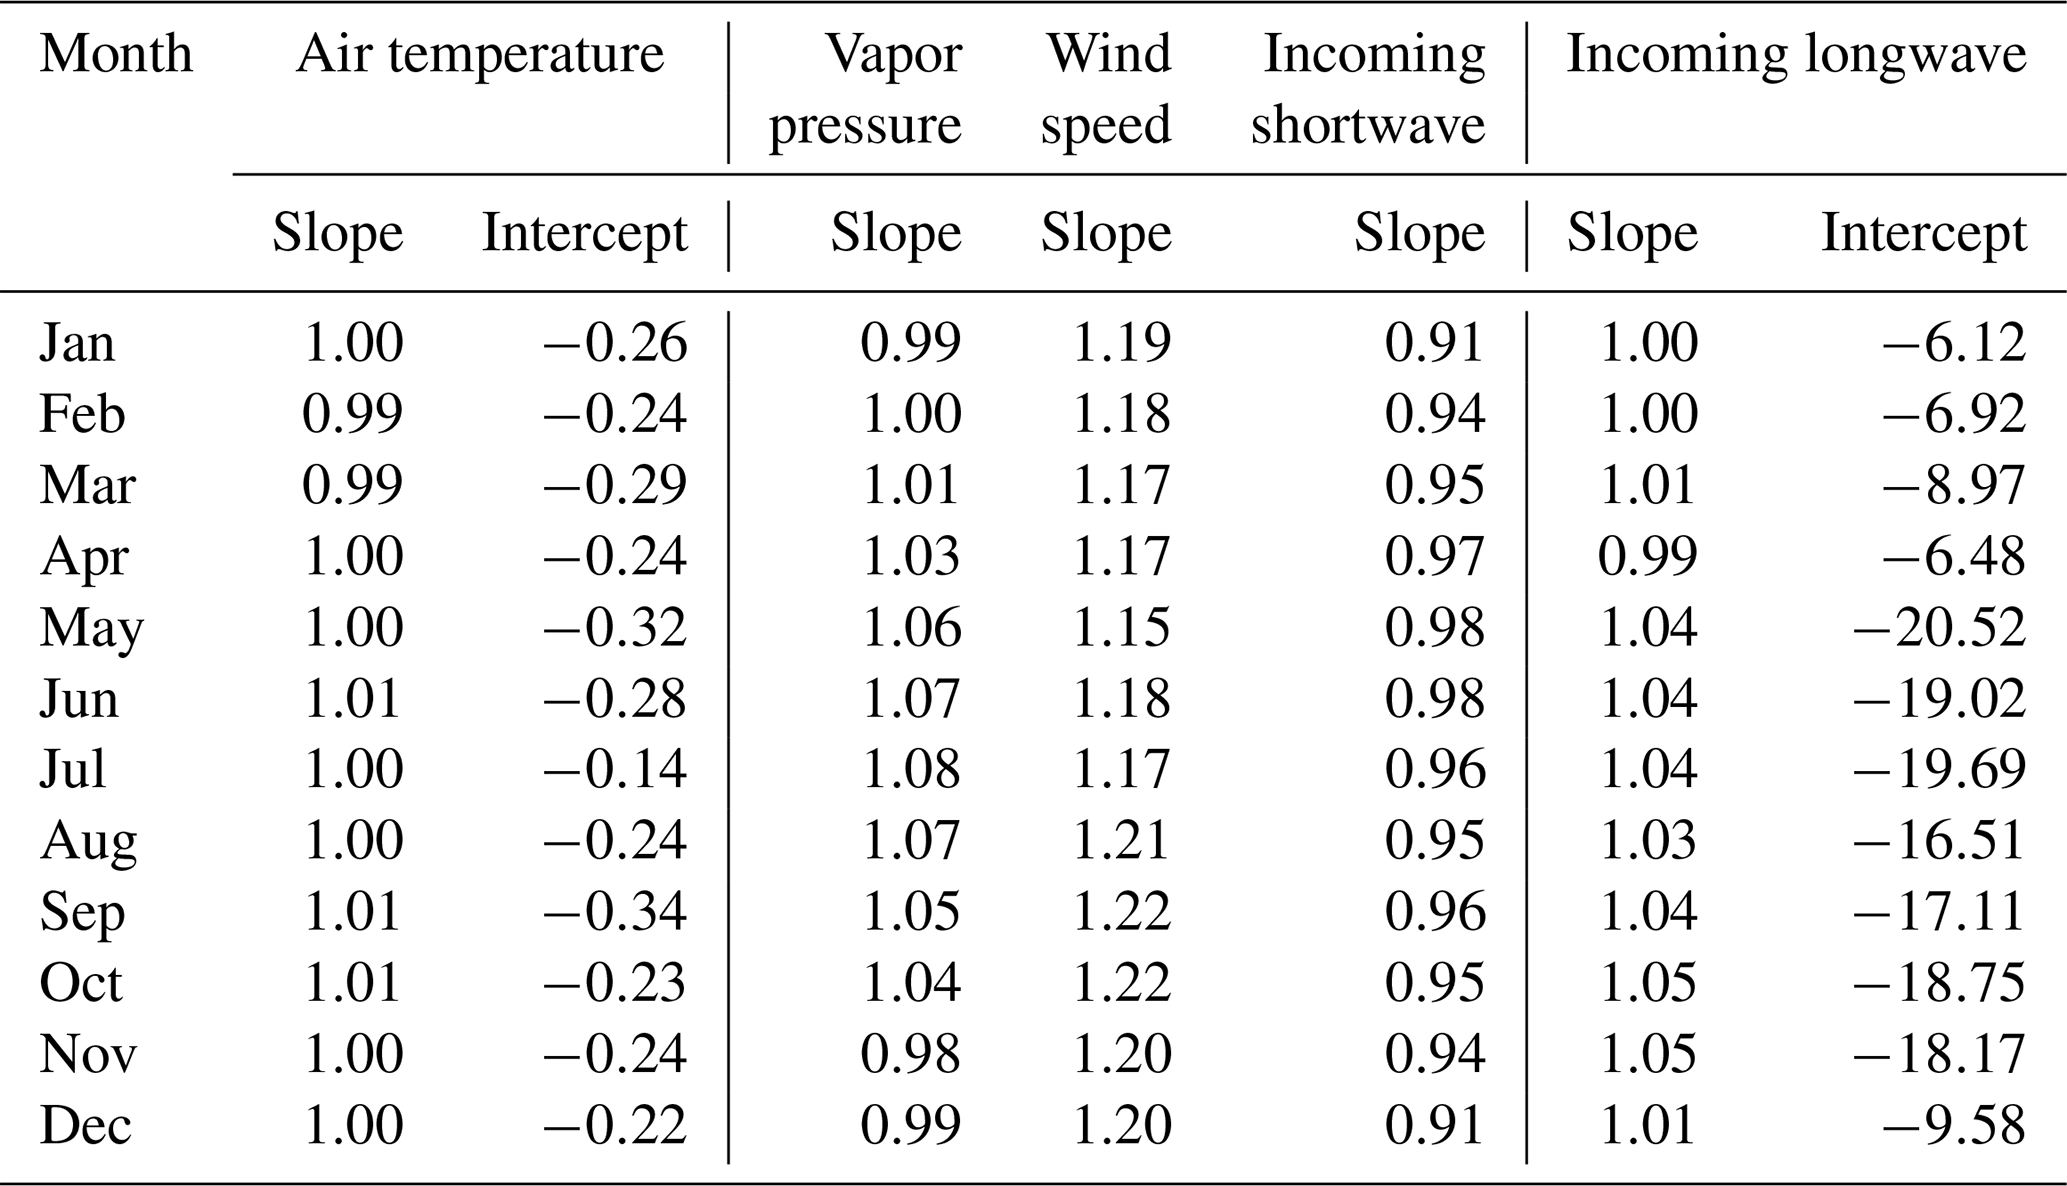
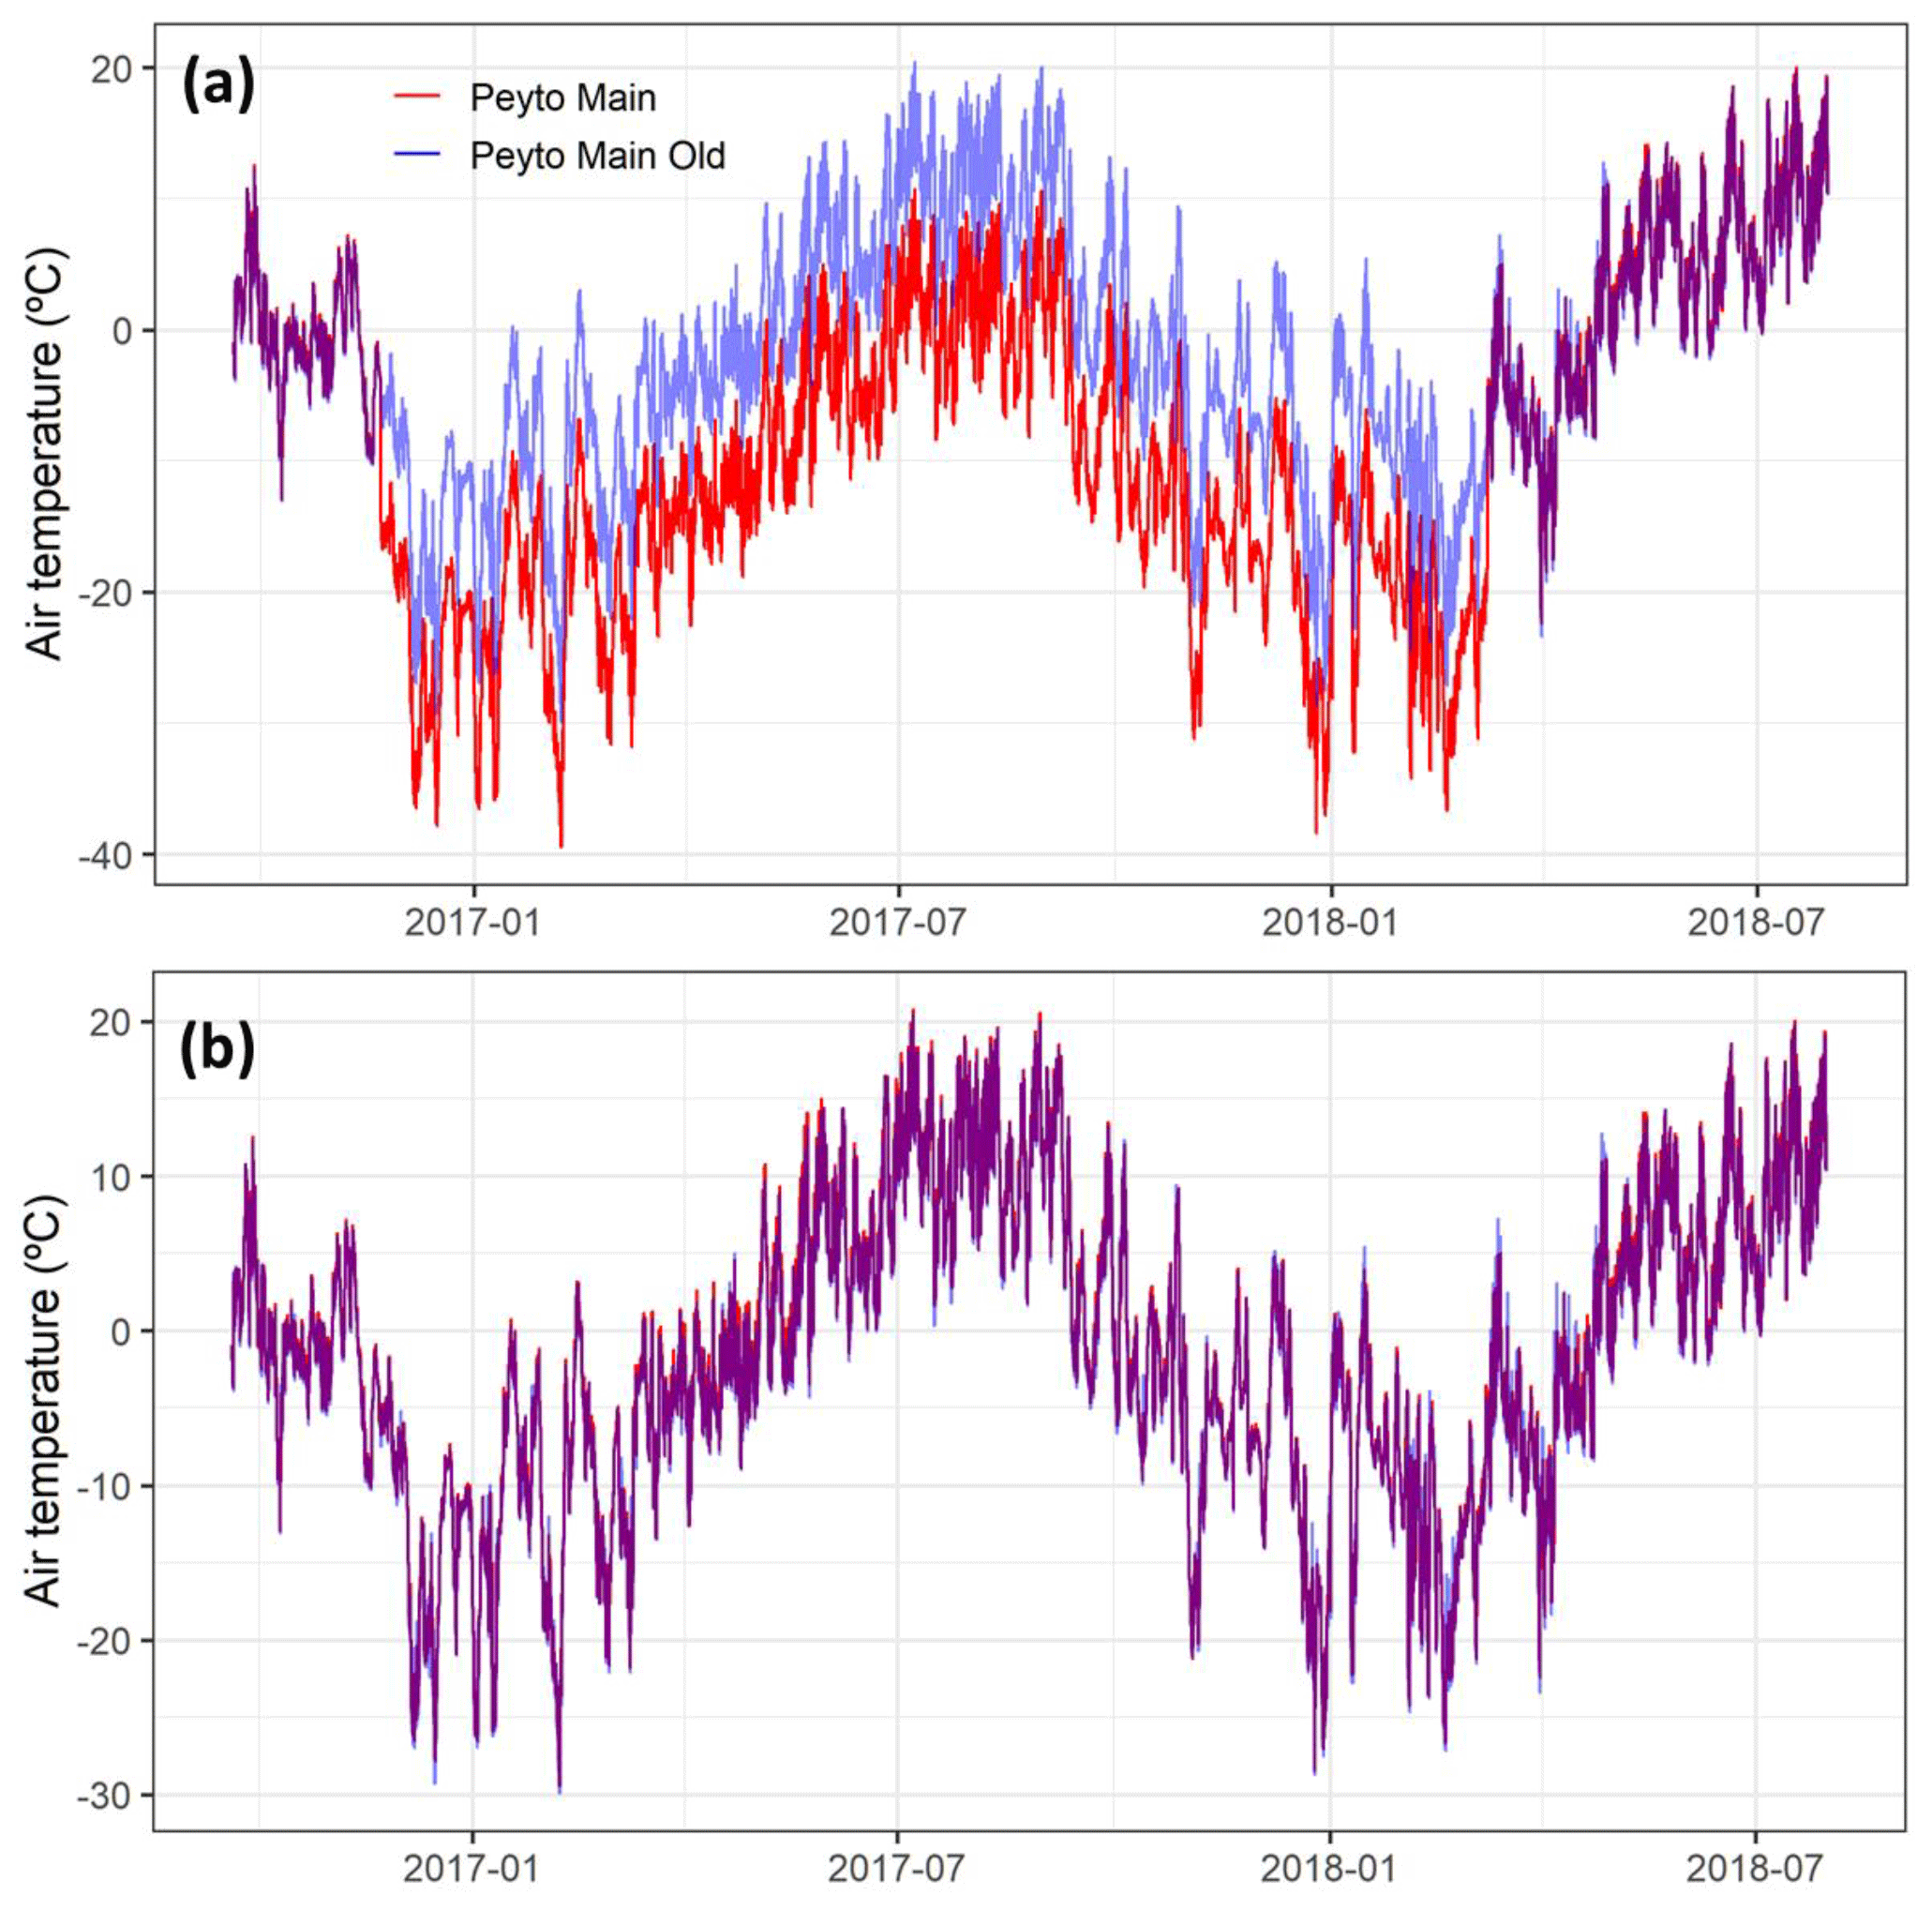
Figure 12Air temperature recorded at the Peyto Main and Main Old stations: (a) before bias correction to Peyto Main, (b) after bias correction. Overlapping values appear in purple.
3.4 Reanalysis forcing data
Bias-corrected reanalysis data are also included as model forcing data for running glaciohydrological models over long periods. Four gridded reanalysis products were bias corrected using in situ observations at the PGRB:
-
CFSR, the Climate Forecast System Reanalysis product (Saha et al., 2010).
-
ERA-Interim, the European Centre for Medium-Range Weather Forecasts Interim reanalysis product (Dee et al., 2011);
-
NARR, the North American Regional Reanalysis product (Mesinger et al., 2006); and
-
WFDEI, the Water and Global Change (WATCH) Forcing Data ERA-Interim reanalysis product (Weedon et al., 2011).
These products are available at different spatial and temporal resolutions for different time periods. CFSR, ERA-Interim and WFDEI are global datasets, whereas NARR covers only North America. ERA-Interim is available from January 1979 to 2018, with original resolution of 0.7∘ at the Equator (Dee et al., 2011). WFDEI (Weedon et al., 2011) is available at a spatial resolution of 0.5∘ × 0.5∘ from 1979 to 2016. NARR (Mesinger et al., 2006) is available at 3-hourly temporal and 32 km spatial resolution from January 1979 to January 2017. CFSR, developed by the National Centers for Environmental Prediction and the National Center for Atmospheric Research (NCEP-NCAR), is available hourly, at a horizontal resolution of 0.5∘ × 0.5∘ from 1979 to 2009 (Saha et al., 2010). A comparison of three reanalysis products showed ERA-Interim to be better than NARR and WFDEI for air temperature, vapor pressure, shortwave irradiance, longwave irradiance and precipitation, while WFDEI was best for wind speed (Pradhananga, 2020).
All gridded reanalysis data were first extracted for the Peyto Main station coordinates. ERA-Interim, WFDEI and NARR data were interpolated to hourly time periods. The R package “Reanalysis” (Shook, 2016b) was used for extracting and interpolating ERA-Interim, WFDEI and NARR datasets. Air temperature, vapor pressure, wind speed, precipitation, incoming longwave and incoming shortwave radiation data were interpolated linearly from 3 or 6 h to hourly time intervals. Total precipitation (3 or 6 h) was distributed evenly to hourly time intervals. MATLAB (MATrix LABoratory) codes (Krogh et al., 2015) were used to extract CFSR values, which were already at hourly time intervals.
The hourly data were bias corrected to the in situ observations at the Peyto Main station for air temperature, vapor pressure, wind speed, incoming shortwave and longwave radiation and those at Bow Summit for precipitation. Peyto Main precipitation data were not considered because they were unreliable, as detailed in Sect. 3.2. Precipitation data from Bow Summit were considered instead. A quantile mapping technique was used for bias correction with parameters calibrated for each month from corresponding data periods using the qmap package in R (Gudmundsson, 2016). Bias-corrected ERA-Interim data from January 1979 to August 2019 are presented in Fig. 13.
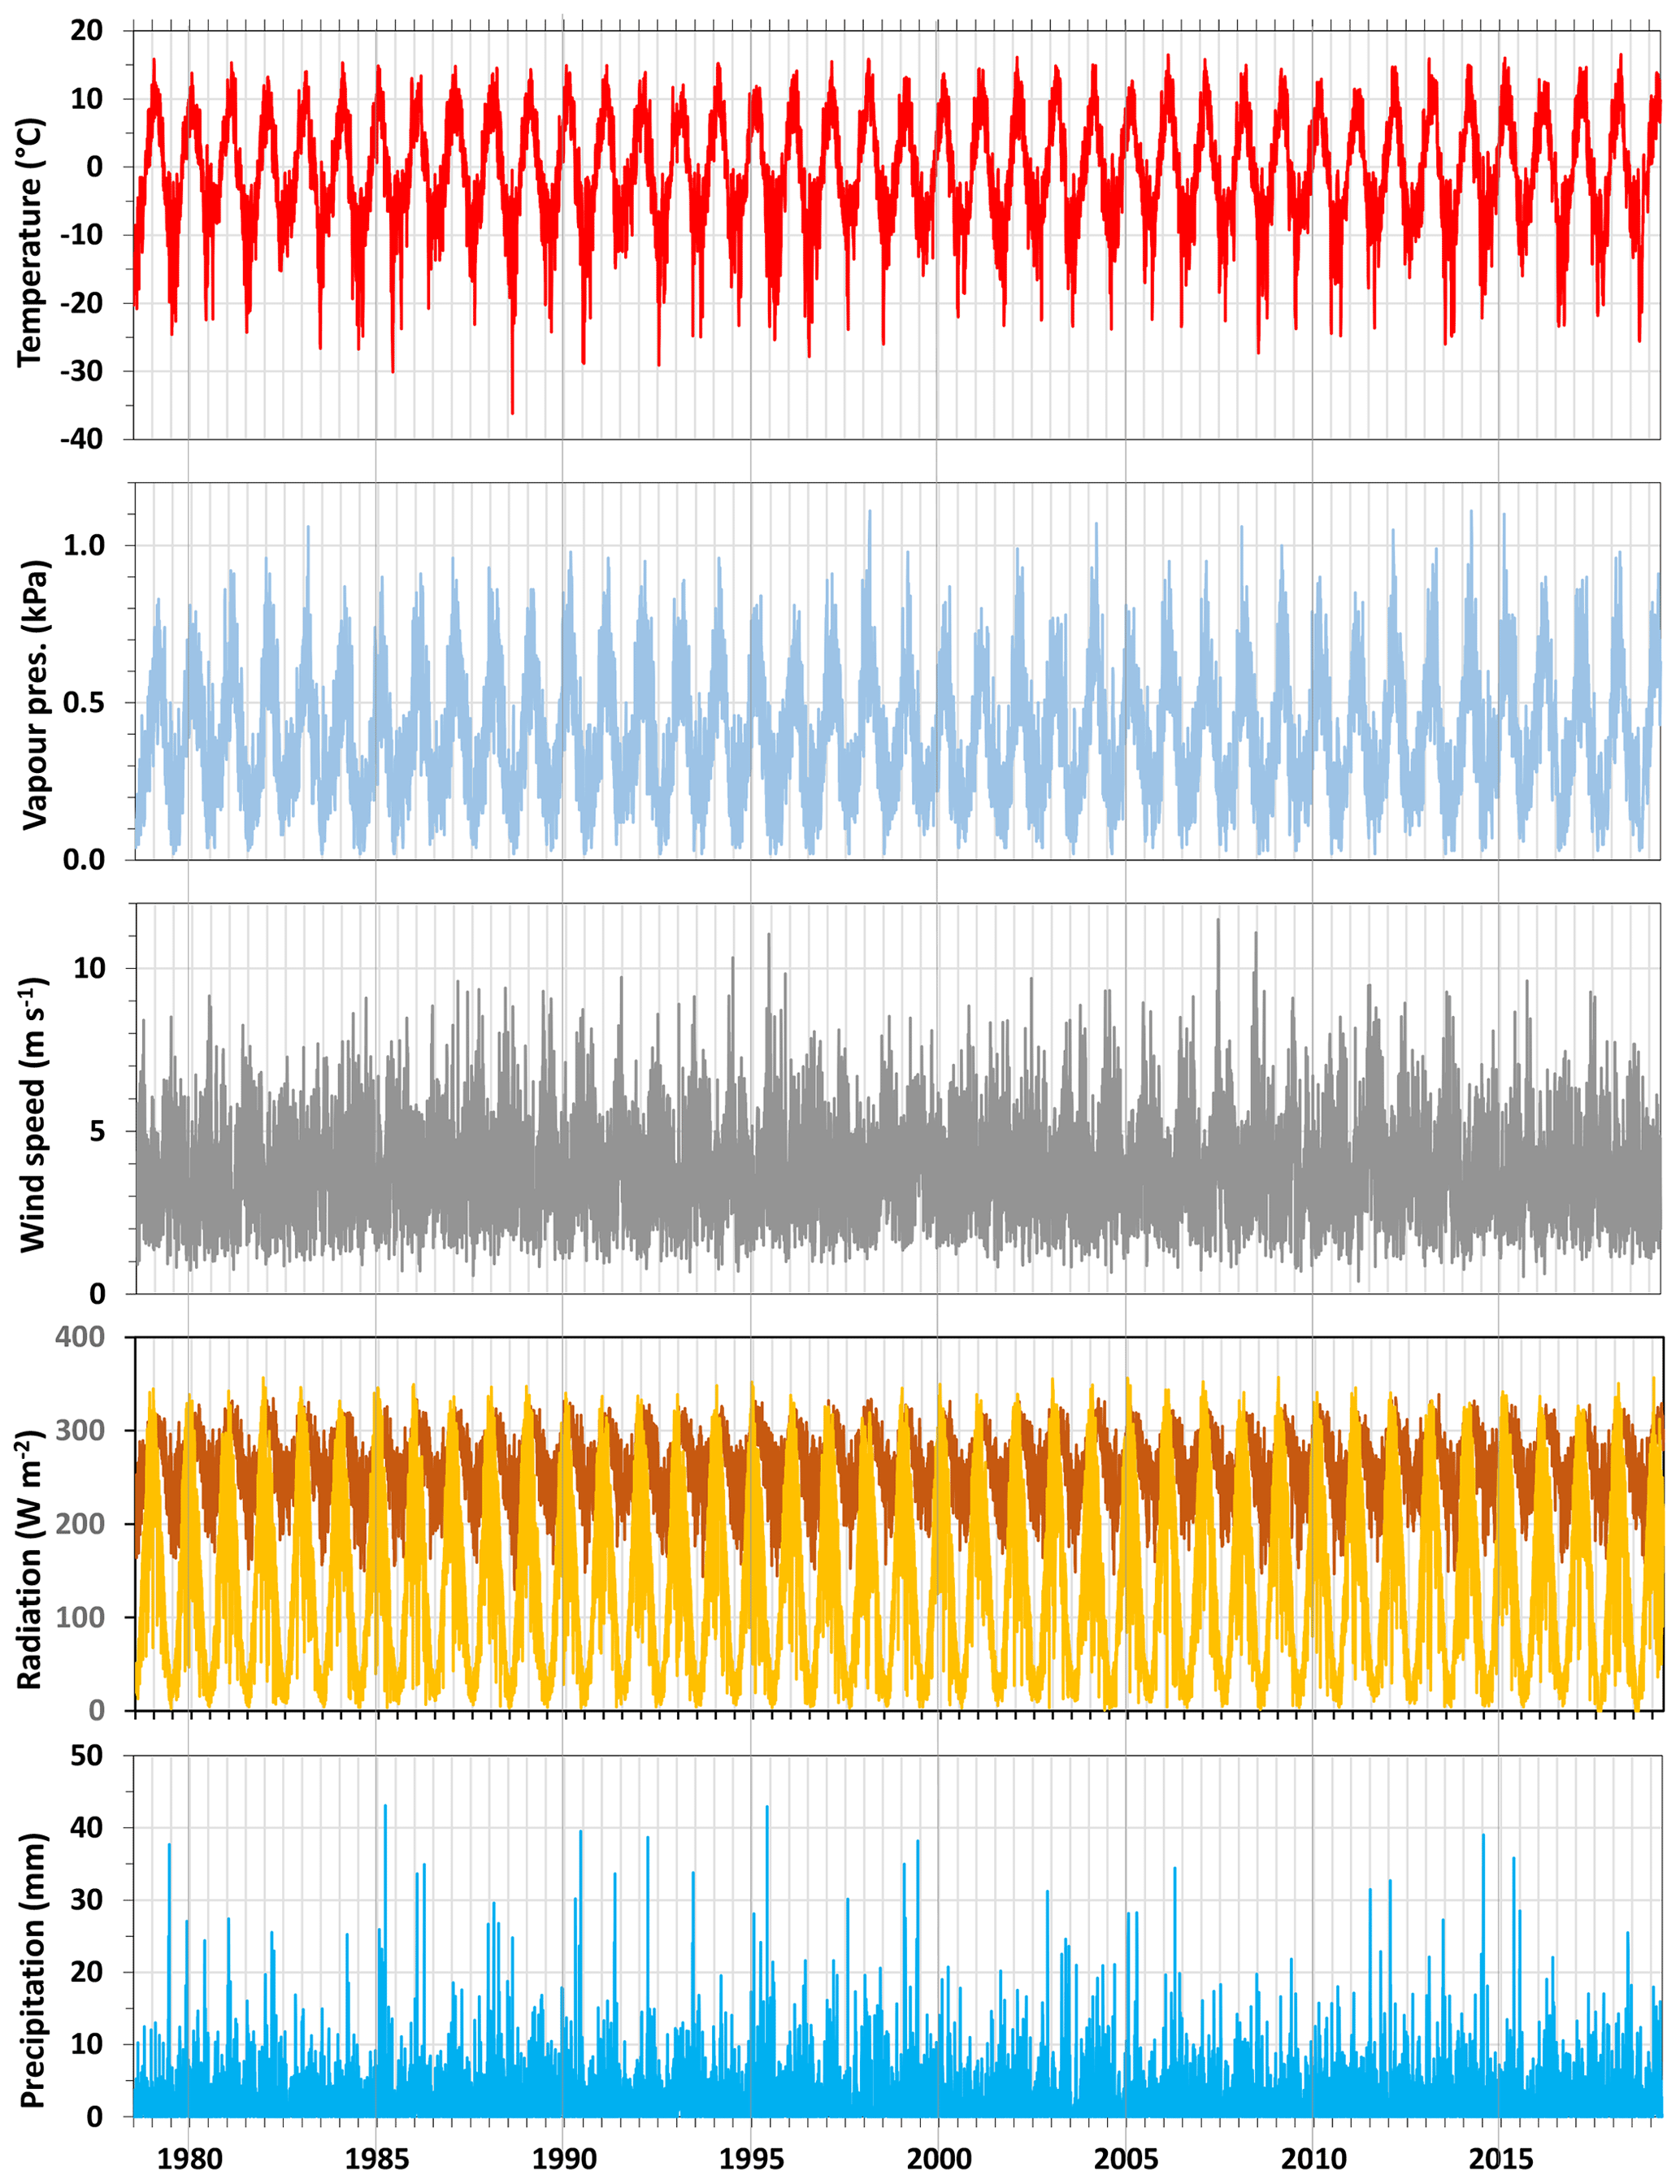
Figure 13Bias-corrected meteorological forcing data from ERA-Interim. Daily precipitation is the 24 h total, and the other data are plotted as 24 h means. Yellow and dark orange in the radiation panel, respectively, are incoming shortwave and longwave radiation.
3.5 Hydrological data – historical and present
Historical observed daily outflows from the glacier at Peyto Creek are available for 1967 to 1977 from the Water Survey of Canada (WSC, https://wateroffice.ec.gc.ca/search/real_time_e.html, last access: 26 March 2021). They are also available at 15 min intervals from 1970 to 1977 by accessing the Peyto Glacier runoff archive housed at the University of Waterloo (Munro, 2011a). The gauge station (ID 05DA008) was established in 1966 for the IHD program and maintained by the WSC. It consisted of a float-activated continuous stage recorder (Table 6) mounted on a standpipe ∼500 m from the glacier tongue at that time (Fig. 14).
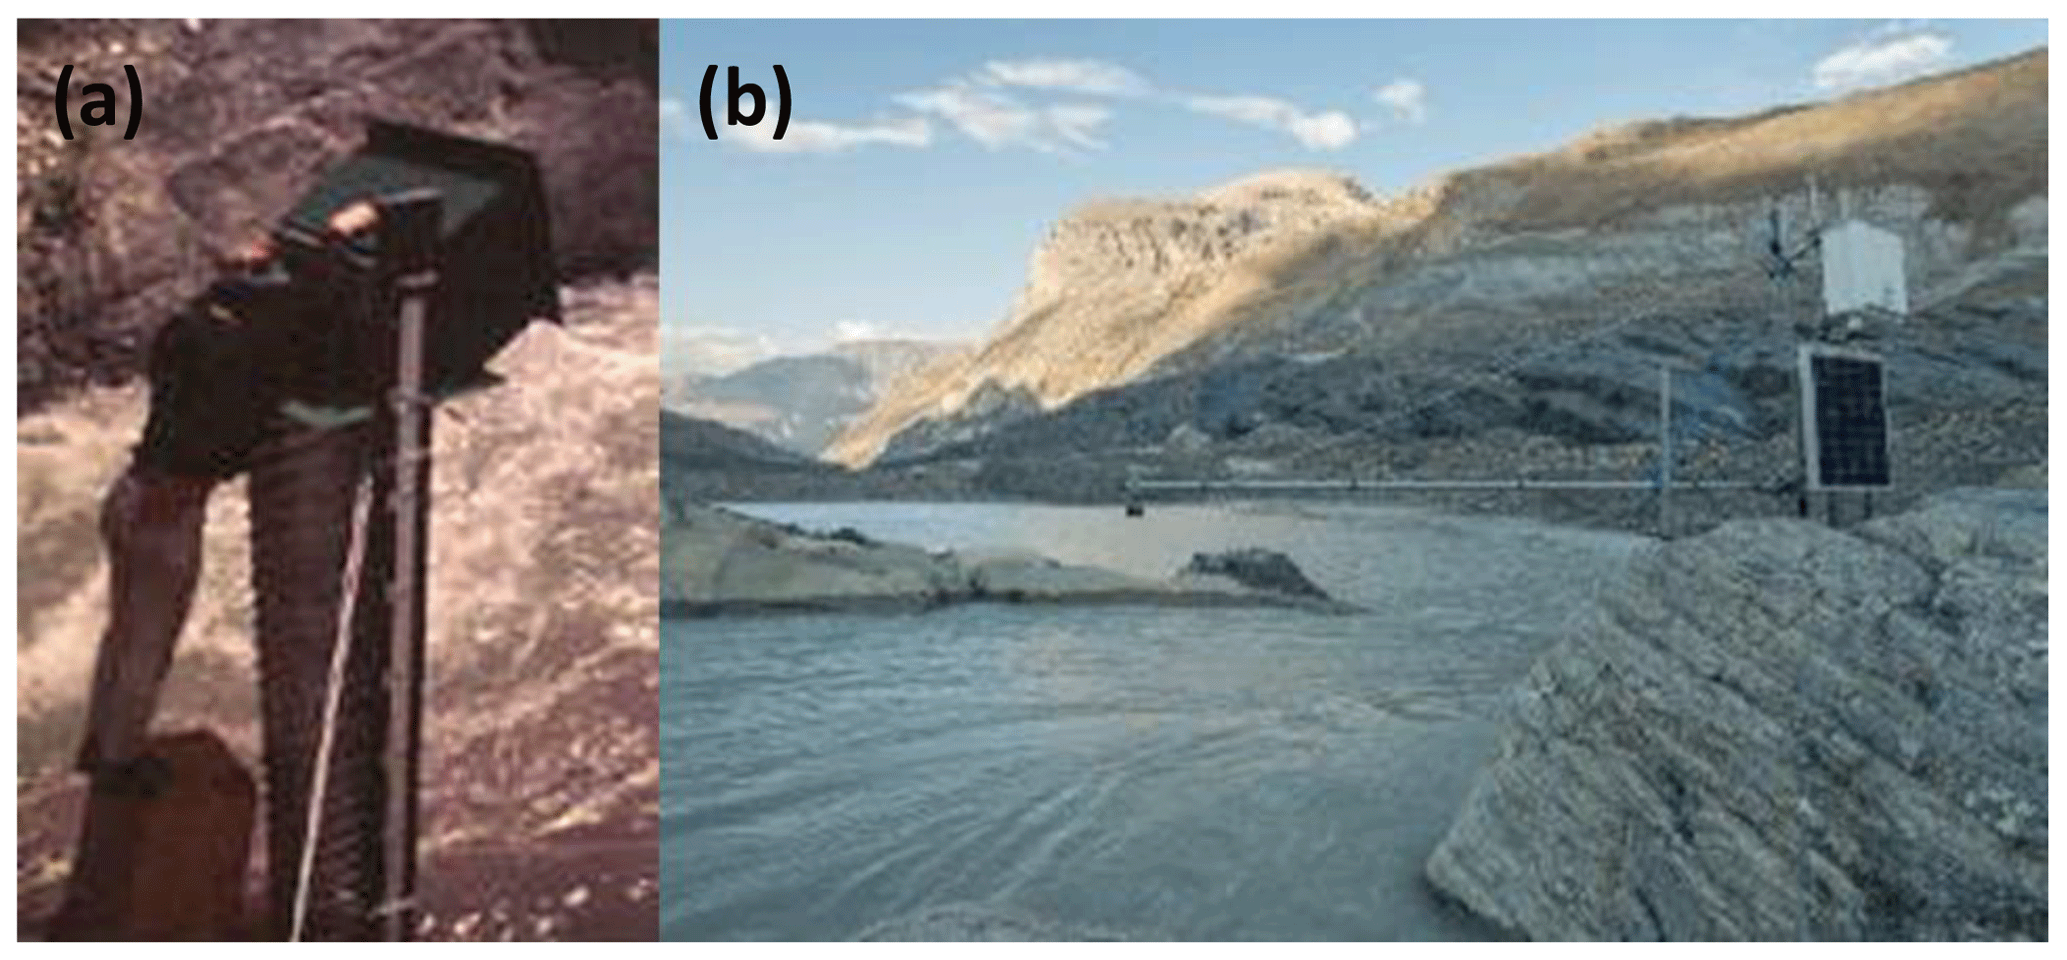
Figure 14Gauge sites: (a) old IHD hydrometric gauge on Peyto Creek, August 1970, and (b) new hydrometric station at the Lake Munro outlet. Photographs by D. Scott Munro (a) and Angus Duncan (b).
Historical discharge measurements at Peyto Creek are problematic due to unstable cross sections, occasional flash floods and lack of direct discharge measurements during high flows. Goodison (1972) reported that the discharge records from 1967 are not reliable, and the stage gauge was washed out during a flood in August 1967. As reported by Ommanney (1987), heavy precipitation and a resulting landslide in July 1983 triggered two floods. The instantaneous discharge during the first flood was estimated to be in the range of 200 to 300 m3 s−1 (Johnson and Power, 1985), and an estimated 6000 m3 of debris, approximately 3 m thick, were deposited in the valley near the gauging site. A similar event in September 2010 deposited a thick debris cover over the original gauge area, thus changing the trail into the glacier.
A new hydrometric station to resume flow measurements for Peyto Creek was installed at the outflow of Lake Munro on the bedrock near the glacier snout in 2013 by USask (Fig. 14b). It is 1.5 km upstream from the old gauging site and so redefines the gauged basin to a smaller area (Fig. 1). The new station is equipped with a Campbell Scientific sonic ranger (SR50A) to monitor the water stage. This gauge record is temperature corrected using air temperature measured below the SR50A.
In the summer of 2018, an automated salt dilution system (AutoSalt by Fathom Scientific) and a stage level logger were installed approximately 100 m downstream of the SR50A. Between 14 May 2018 and 10 September 2018, 43 streamflow discharge measurements were performed with automated and manual salt dilution. One manual streamflow measurement was conducted with an FT2 handheld acoustic Doppler velocimeter (ADV) on 1 August 2018. These measurements were used to develop a rating curve and calculate discharge for the 2018 season (Fig. 15, Sentlinger et al., 2019). The salt dilution measurements' error analysis provides an error estimate of 24.5 % for the measured discharge. The rating curve shows an inflection point at stage h=65 due to the shape of the bedrock notch. Sudden drops in the stage were observed during the early season discharge, likely due to temporary ice jamming as the stream channel was still partly snow covered.

Using the strong correlation between the SR50A water level and the level logger for the 2018 period (r=0.998, RMSE = 0.08 m), the SR50A water level is used to extend water level for the 2013–2018 melt seasons using the linear regression and then calculate streamflow based on the rating curve in Fig. 15a. The daily mean basin runoff (streamflow discharge per unit area of the basin) averaged over the historical 11-year period (1967–1977) and the present 5-year period (2013–2018) are presented in Fig. 16.
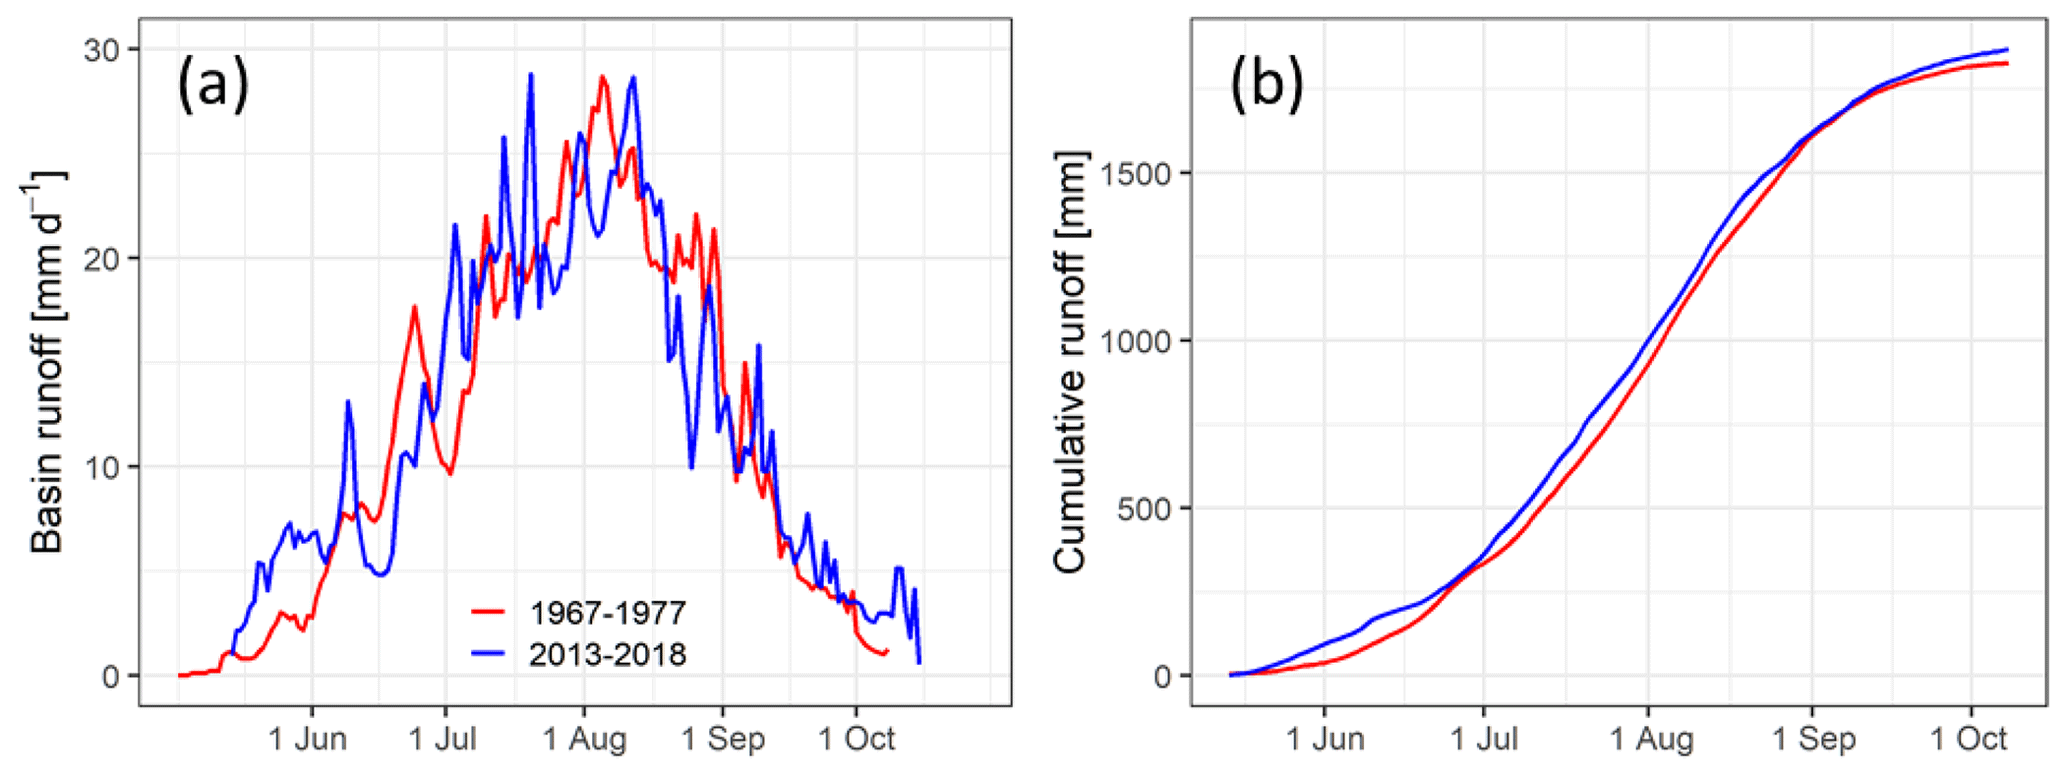
Figure 16Runoff data: (a) daily basin streamflow, expressed as a depth of runoff per day, averaged over the historical (1967–1977) and recent (2013–2018) periods; (b) cumulative annual depth of runoff averaged over the same periods.
3.6 Glaciological data
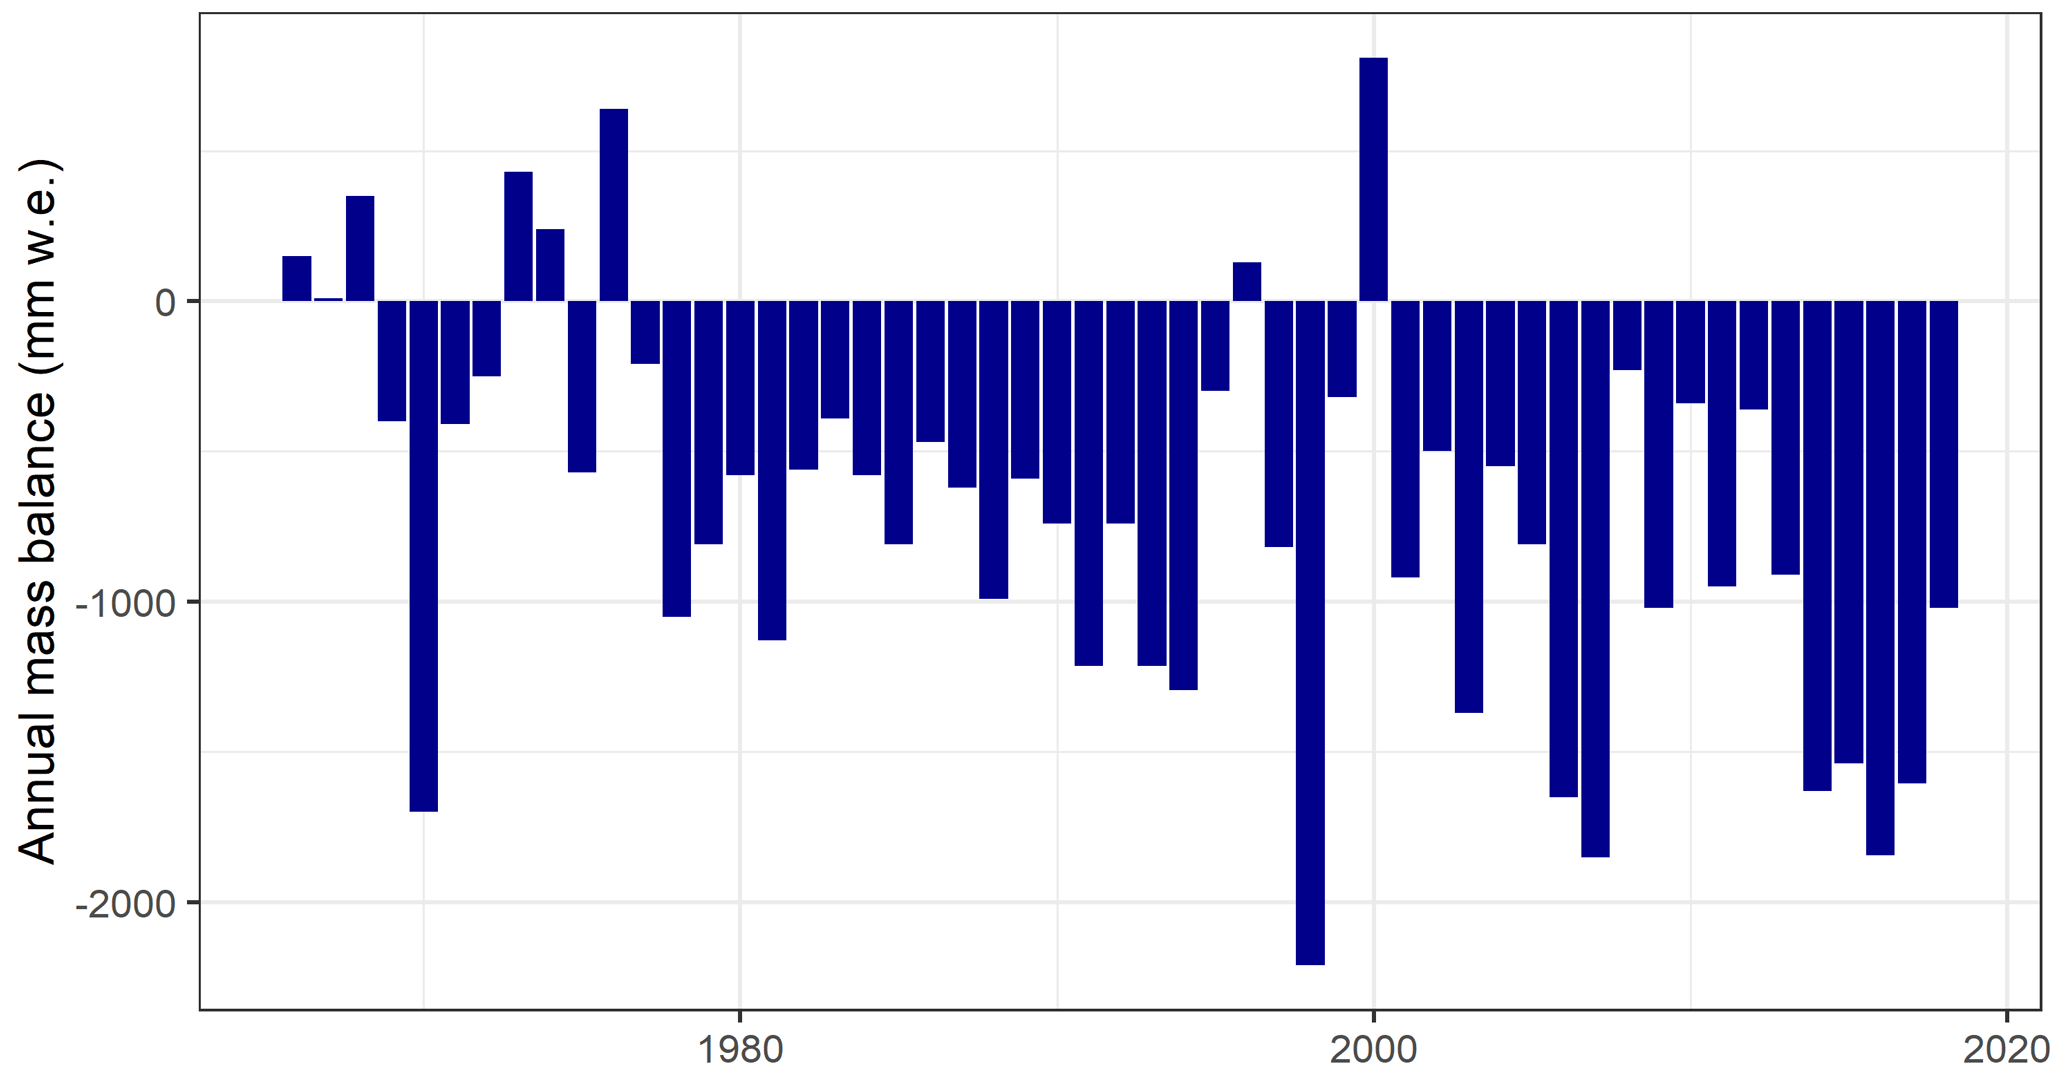
Glaciological mass balance measurements, using ablation stakes and snow pits, have been taken semi-annually by Canadian government agencies since 1965, when the IHD program began. The scheme for Peyto Glacier was first described by Østrem (1966). Mass balance data for 11 elevation bands, 100 m in width, are reported in several publications (Demuth et al., 2009; Demuth and Keller, 2006; Dyurgerov, 2002; Ommanney, 1987; Young, 1981; Young and Stanley, 1976). Recent mass balance data are reported by the national glaciological program of the Geological Survey of Canada to and are available from the WGMS (http://www.wgms.ch, last access: 26 March 2021). The WGMS (2020) has also compiled datasets from 1966 to 2018 that are plotted in Fig. 17 (1991–1992 mass balance year missing). Specific winter and summer mass balance data for 11 elevation bands covering an elevation range from 2100 to 2703 m are also available for the period 2003–2018 that are not included in this study. The winter, summer and annual point balances have been calculated for the middle of each elevation band, from 2150 to 2650 m above sea level, using a local polynomial regression technique.
The dataset does not include frontal variation, equilibrium line altitude (ELA), accumulation area ratio (AAR), glacier mass balance (winter, summer, annual) and repeat photographs, which were published by WGMS (2020) and are available at https://wgms.ch/ (last access: 26 March 2021). Radio detection and ranging (radar) measurements of ice thickness for Peyto Glacier in the 1980s were reported by Holdsworth et al. (2006). Ground-penetrating radar surveys of ice thickness across the glacier tongue in 2008–2010 were reported by Kehrl et al. (2014) in their study of volume loss from the lower Peyto Glacier area between 1966 and 2010. The dataset does not include these published ice thickness data.
It should be noted that in several instances the datasets feature variations in temporal subsets of the data. An example is the WGMS record which, for a portion of the record, utilizes data from the Dyurgerov (2002) synthesis rather than Environment Canada National Hydrology Research Institute observations compiled by Ommanney (1987). Moreover, all datasets present a mix of reference-surface mass balance data, with hypsometry held constant, and conventional mass balance data, where hypsometric changes are reflected in mass balance accounting (Cogley et al., 2011).
3.7 Geospatial data
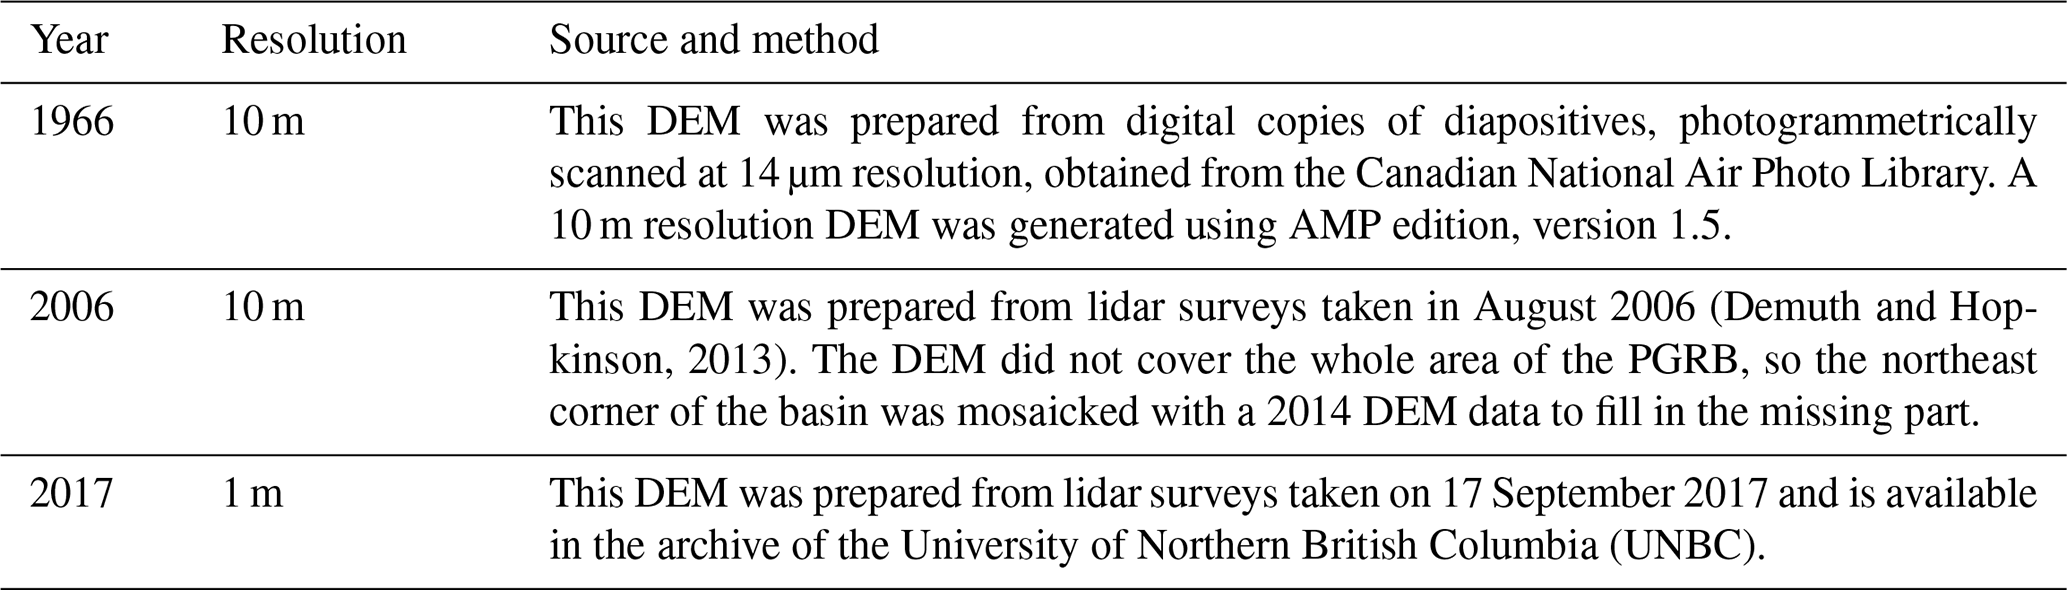
3.7.1 Digital elevation models
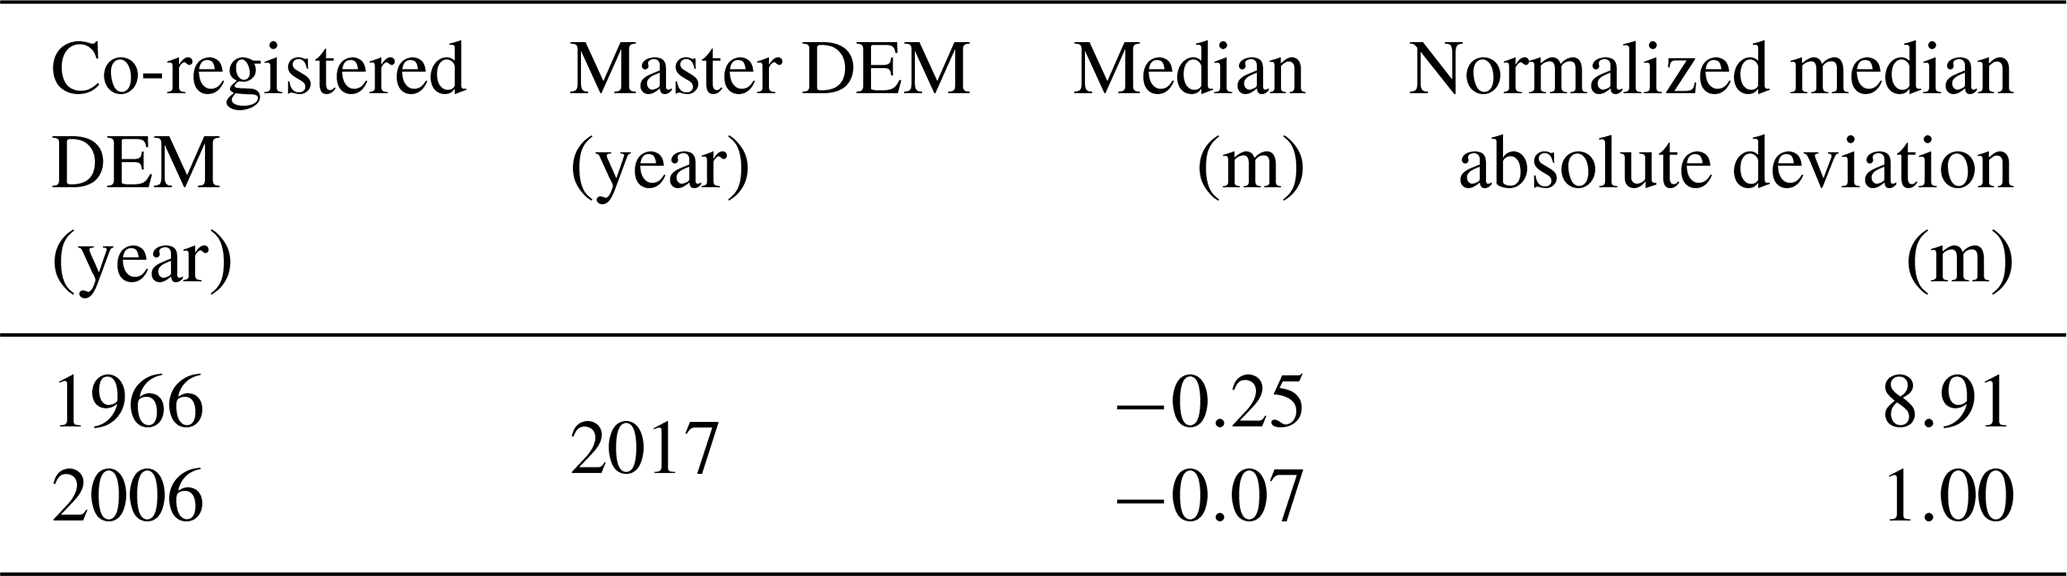
Repeat digital elevation models (DEMs) can be used to quantify surface height changes through time, which are then converted to mass change. Photogrammetric techniques have been used to construct a high-quality DEM from 1966, and airborne light detection and ranging (lidar) surveys were used to collect DEMs for 2006 (Demuth and Hopkinson, 2013) and 2017 (Pelto et al., 2019; Table 8). The 2006 DEM was obtained from the Geological Survey of Canada and the Canadian Consortium for LiDAR Environmental Applications Research. DEMs from 1966 and 2006 were co-registered to the 2017 DEM based on the algorithm proposed by Nuth and Kääb (2011) using an automated, open-source tool developed by Amaury Dehecq (https://github.com/GeoUtils, last access: 26 March 2021). DEM sources, preparation and co-registration are described below and presented in Table 8.
Generation of photogrammetric DEMs
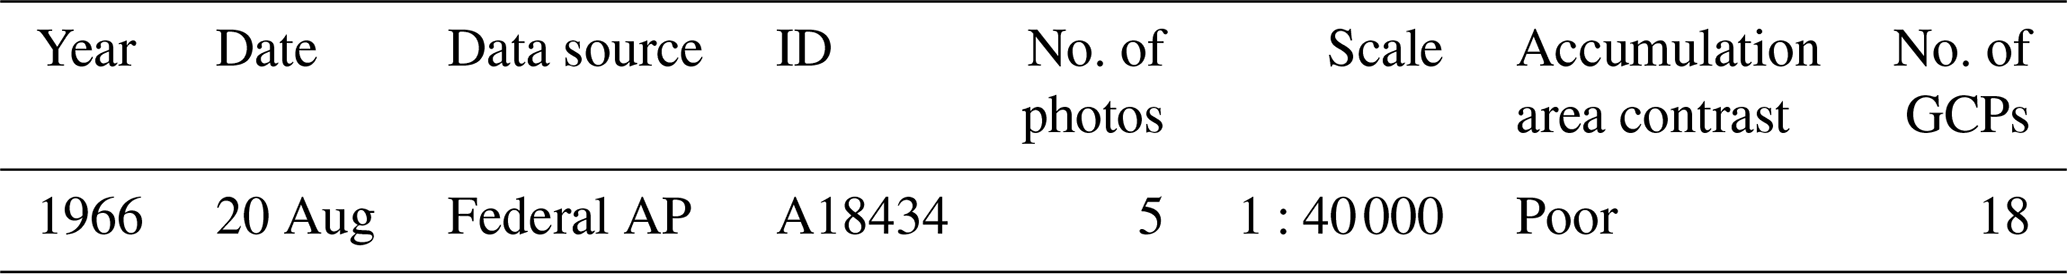
Digital copies of diapositives from the year 1966, photogrammetrically scanned at a resolution of 14 µm, were obtained from the Canadian National Air Photo Library. The photographs were taken near the end of the ablation season (Table 7). However, there was extensive fresh snow cover in the images that resulted in poor contrast in the accumulation region of the glacier.
The DEM was generated using the Agisoft Metashape Professional (AMP) edition, version 1.5. All photos were assigned to the same camera group based on the focal length, pixel size and fiducial coordinates available from the camera calibration report. Then the photos were aligned by AMP and a sparse point cloud model was produced in which camera positions and orientations are indicated. To optimize the camera positions and orientation data, some reference points (GCPs) were identified from the stable terrain surrounding the glacier, over a range of elevations. The GCP file was imported to AMP, and corresponding locations were marked on each of the photos. Finally, based on the estimated camera positions, AMP calculated depth information and a dense point cloud was generated. A DEM and an ortho image were produced from the dense point cloud.
Most of the accumulation zone of the glacier is missing from the dense point cloud because fresh snow cover resulted in poor contrast in this region. The interpolation feature available in AMP was not enabled whilst generating the DEMs, as it does not generate very accurate elevations. The spatial resolution of the DEM was chosen to be 10 m.
Generation of lidar DEM
Lidar uses a laser pulse to calculate the distance of the target from the sensor. An airborne laser survey was conducted using a Riegl Q-780 full waveform scanner and Applanix POS AV Global Navigation Satellite System (GNSS) inertial measurement unit (IMU). The laser survey trajectory data were processed using PosPac Mobile Mapping Suite (Applanix), resulting in horizontal and vertical positional accuracy typically better than ±15 cm. RiPROCESS was used to post-process the point clouds and export to a LAS (lidar data exchange file) format, a binary file to store lidar data. LASTools, available from https://rapidlasso.com/lastools/ (last access: 26 March 2021), was used to process the point cloud and generate the DEM (Pelto et al., 2019).
DEM co-registration
It is important to align the multi-temporal DEMs relative to one another so that the same point on the ground is represented at the same location in each DEM, thus enabling glacier elevation change to be measured as accurately as possible (e.g. Fig. 18). The 2017 lidar DEM was taken as the master DEM and all other DEMs (Table 8) were co-registered with respect to this DEM following the Nuth and Kääb (2011) method. The 1966 ortho image was used to mask out all the unstable areas such as glaciers, fresh snow or waterbodies. All the pixels outside this mask were classified as stable terrain, which was primarily bedrock and so excluded trees, lakes and/or waterbodies, glaciers and snow cover, and thus used for co-registration. The co-registration script available in the GitHub repository at https://github.com/GeoUtils (last access: 26 March 2021) was used to perform the task. The statistics of the elevation difference for stable terrain after the co-registration are listed in Table 9.
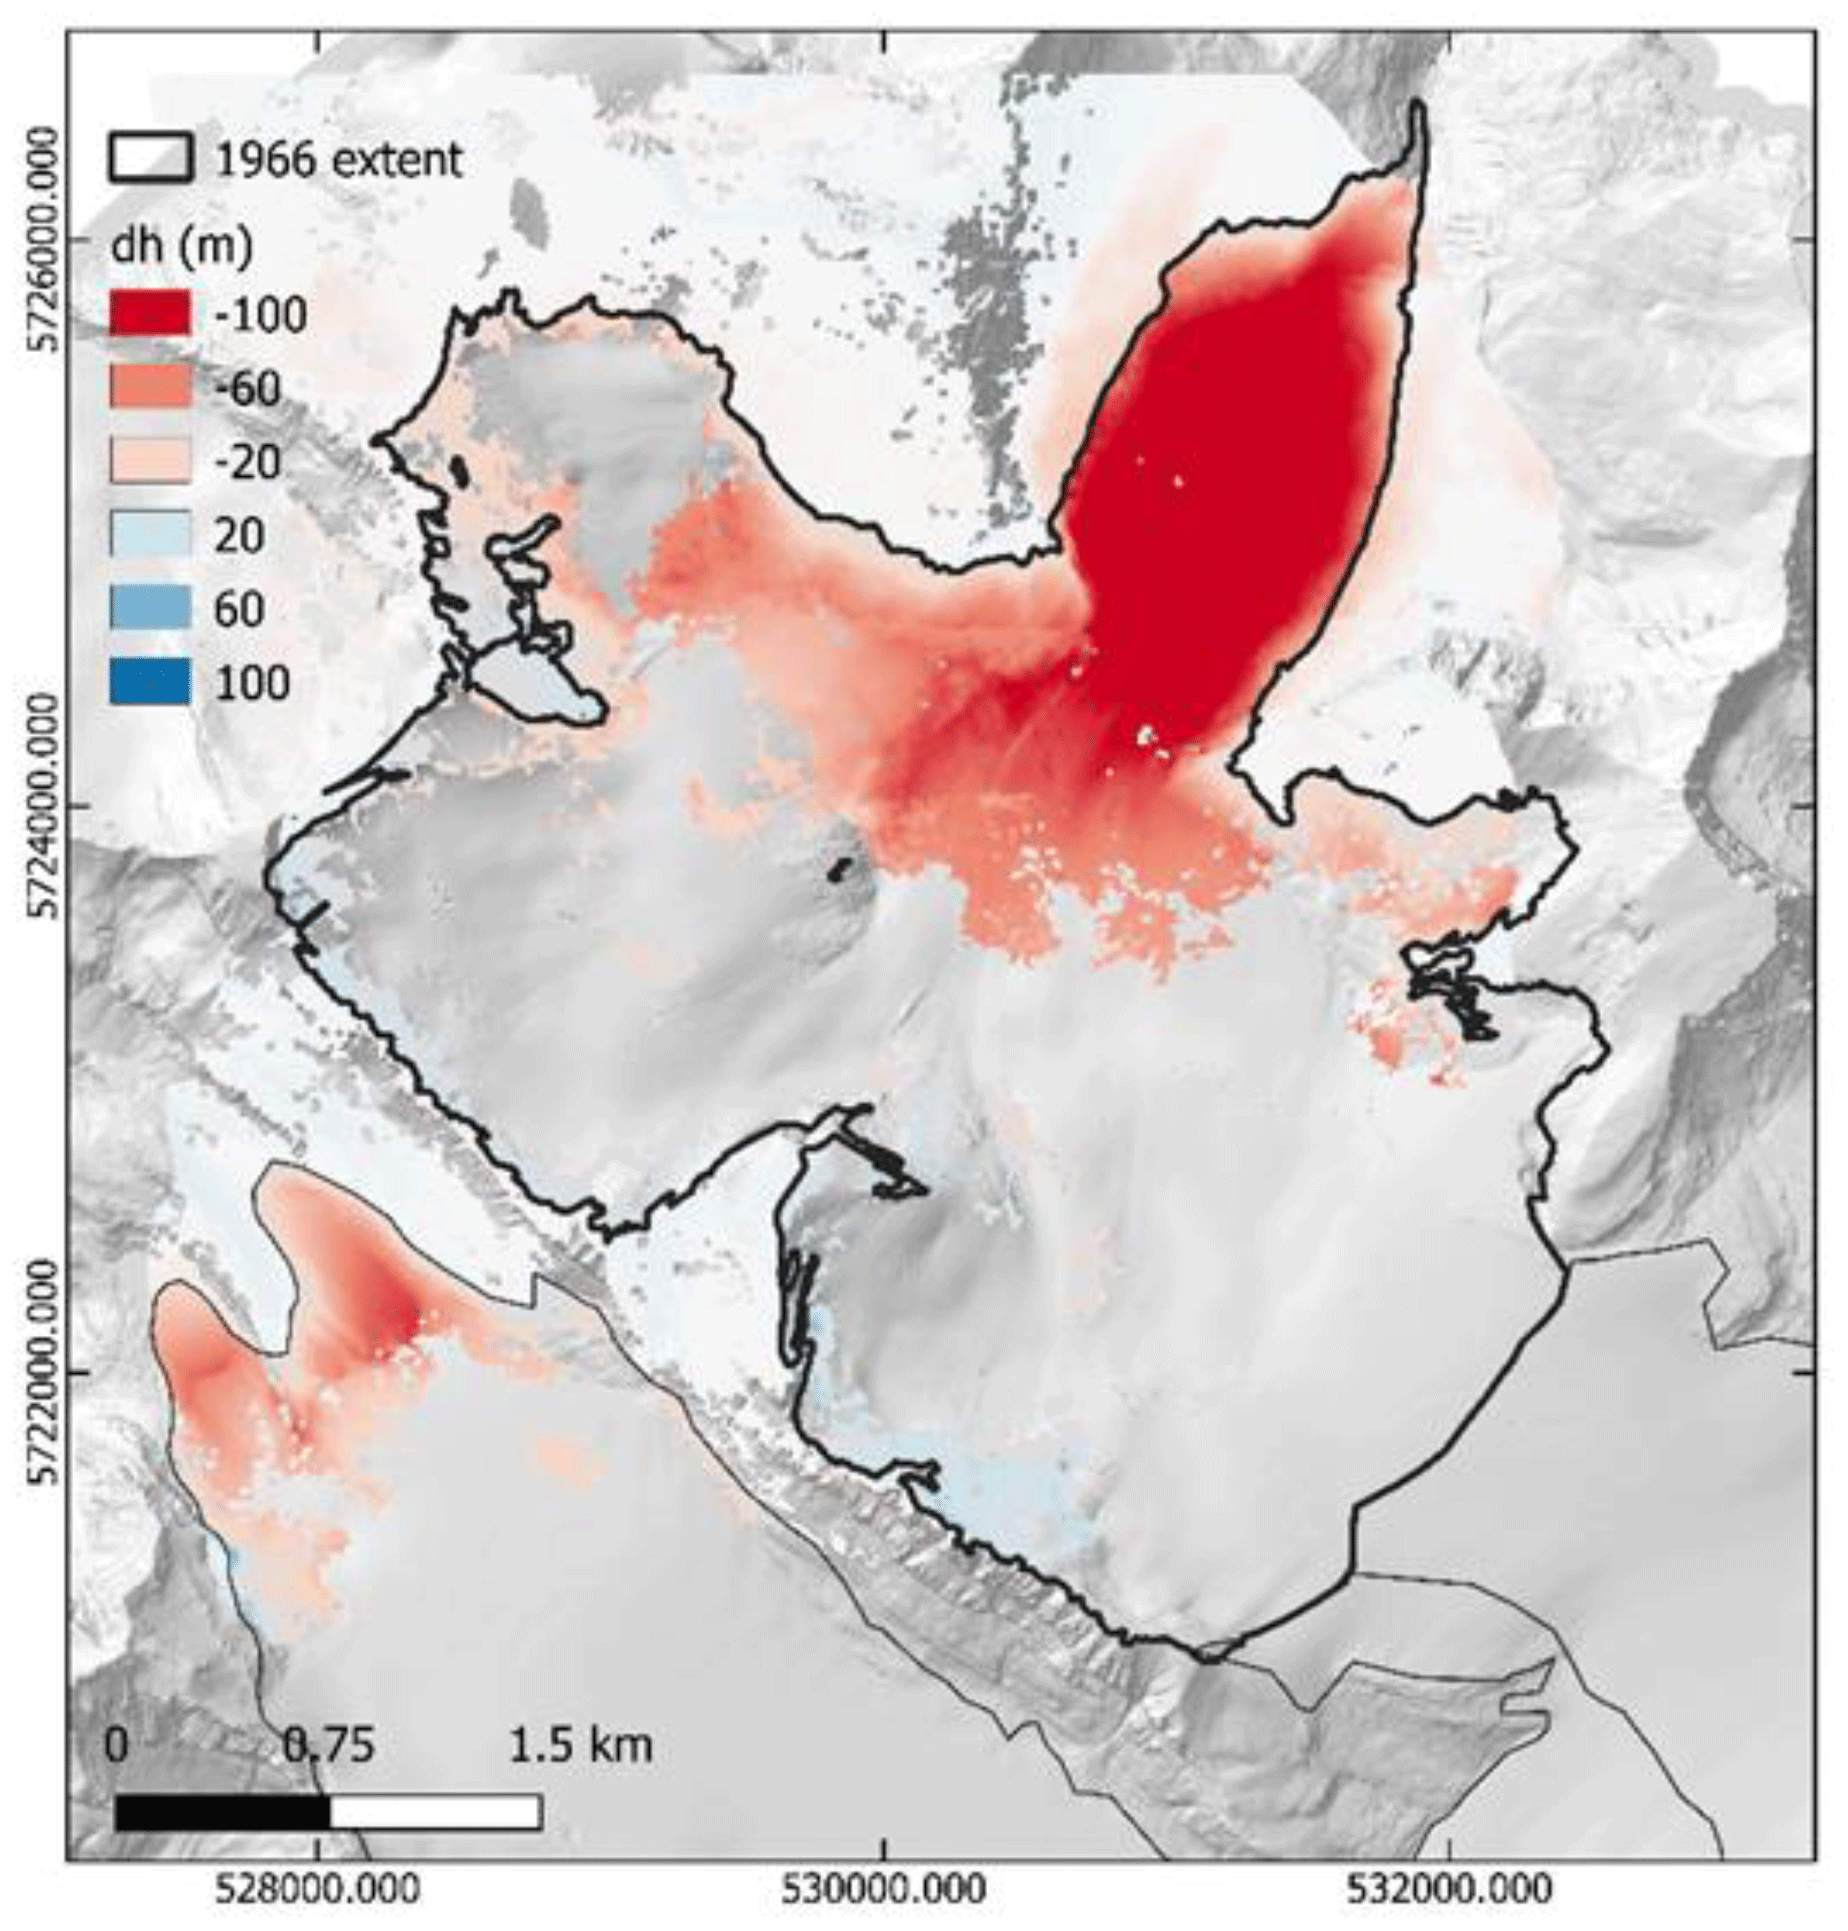
Figure 18Elevation change over Peyto Glacier, 1966–2017, inside the IHD glacier boundary.
3.7.2 Land-cover data
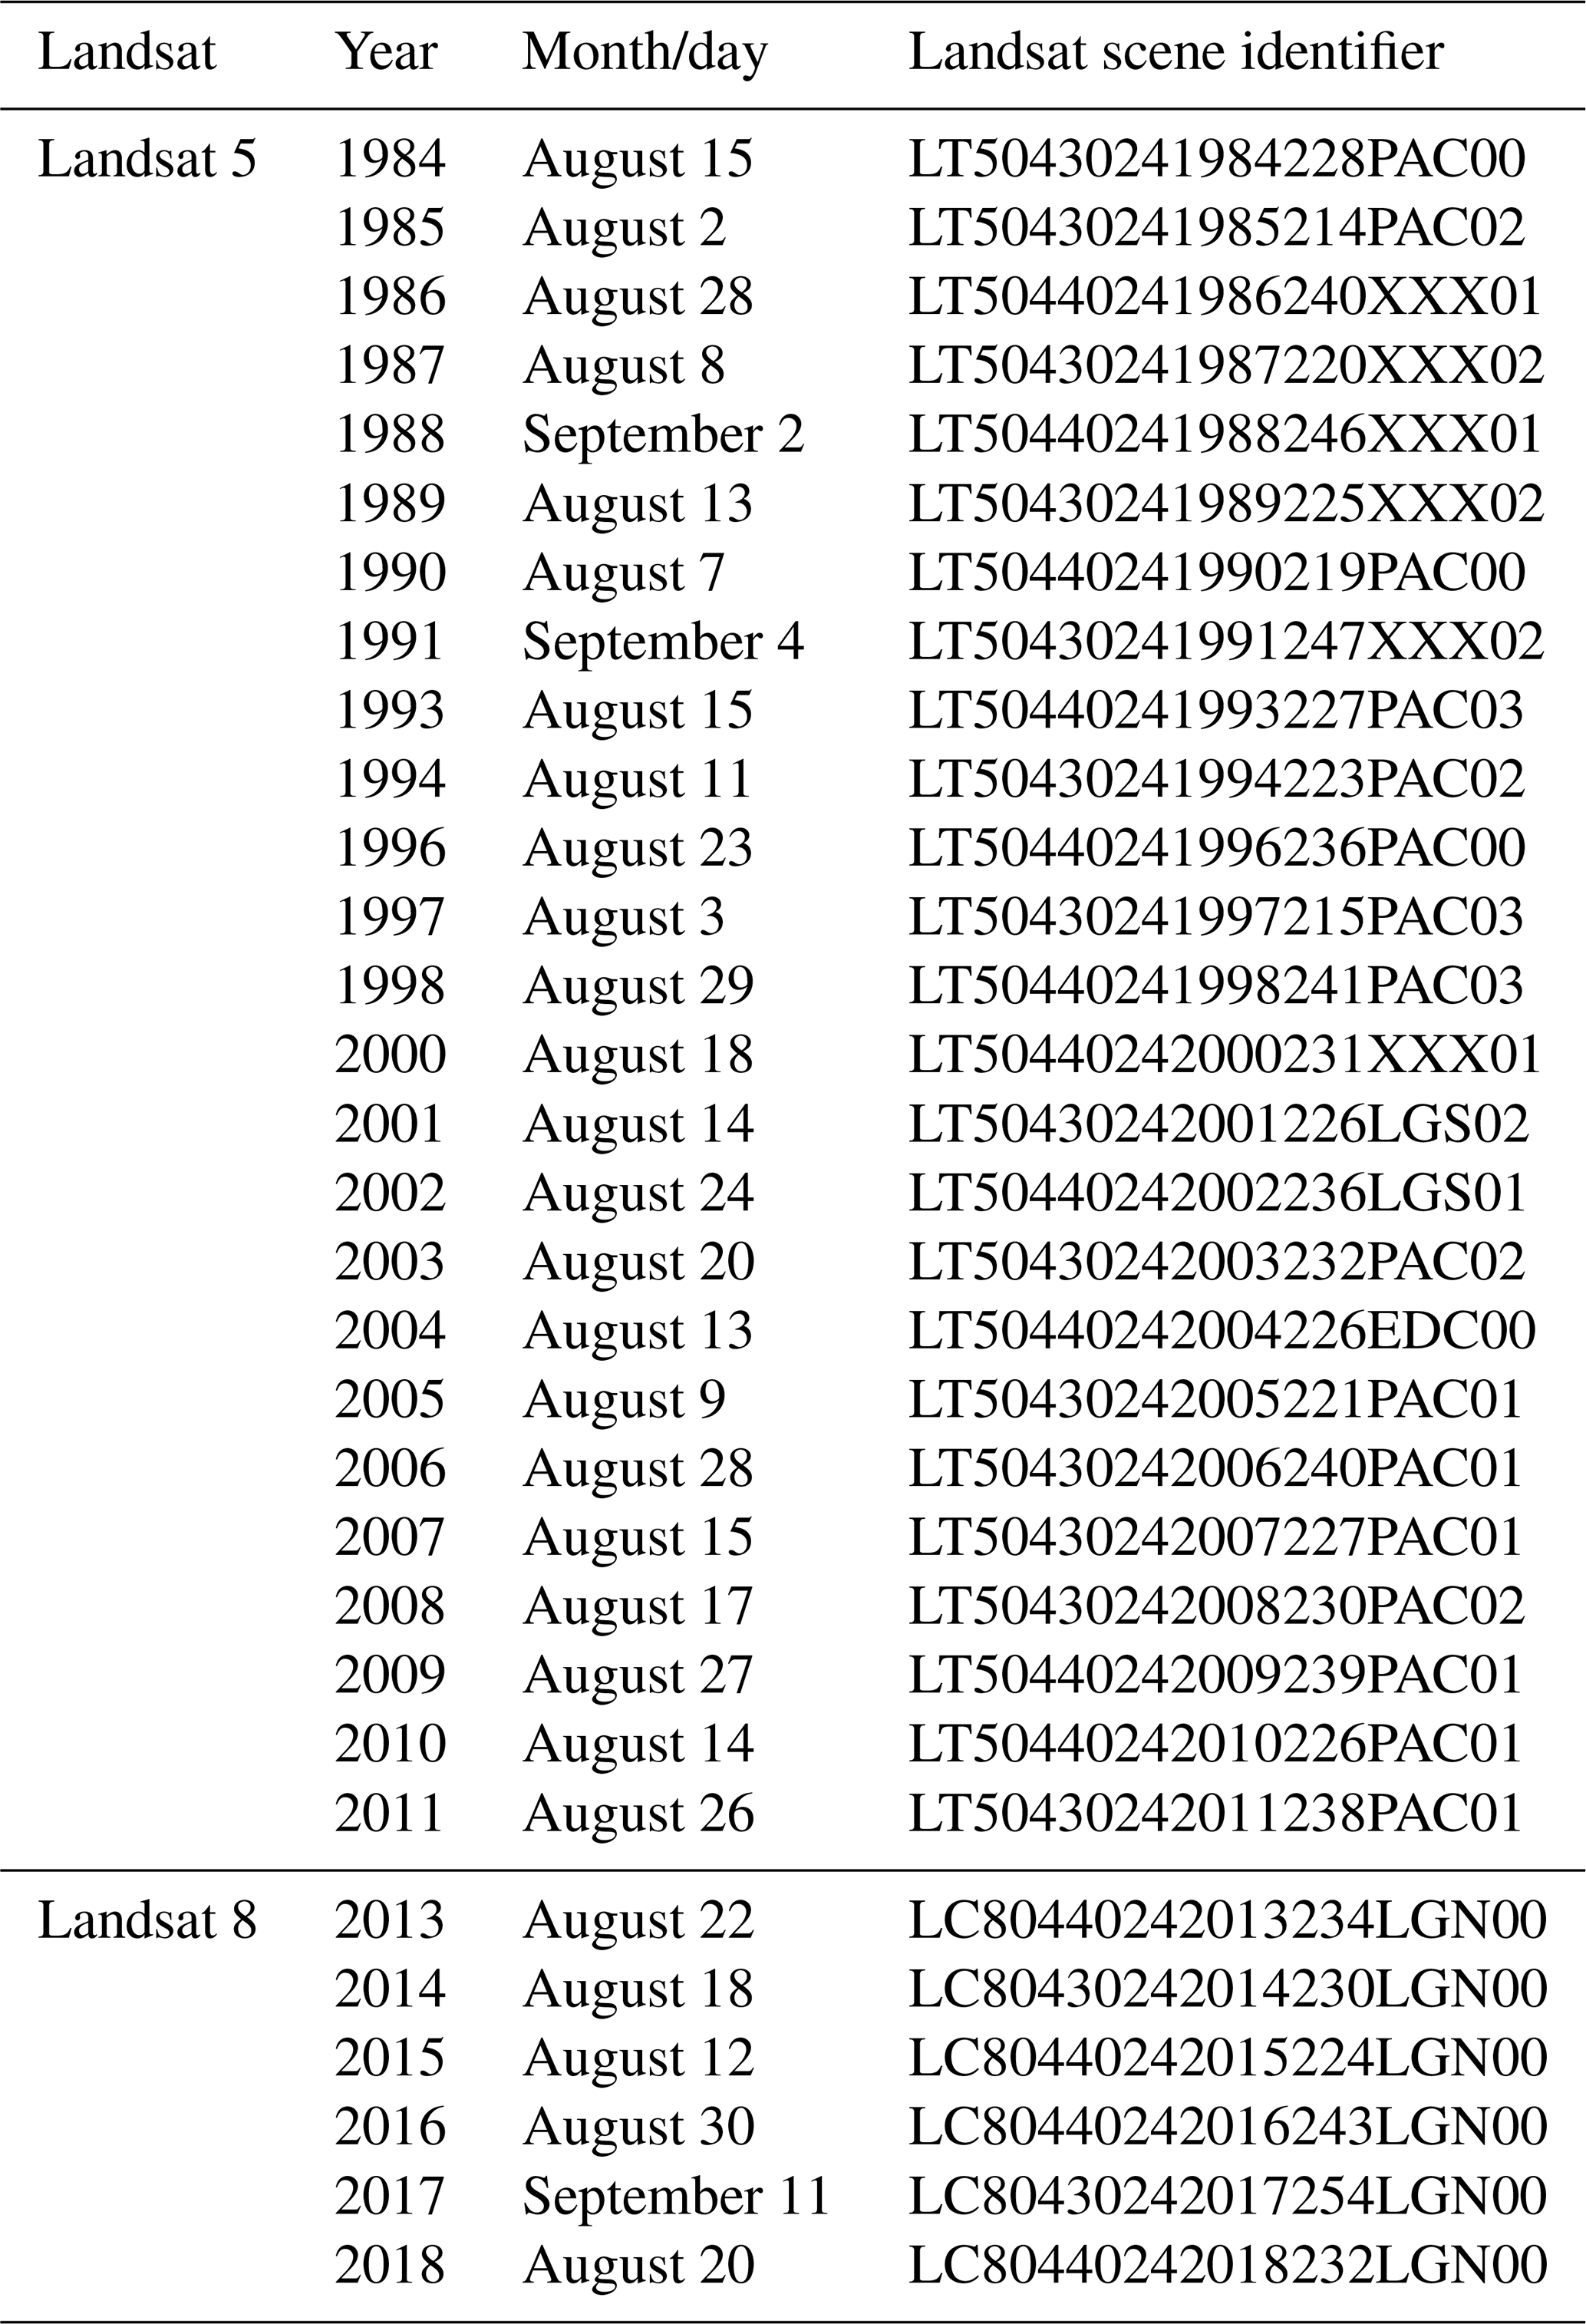
Land-cover data of PGRB were compiled from remotely sensed imagery and a topographic map. Land cover for 1966 was prepared from a georeferenced scanned topographic map of Peyto Glacier, produced from the aerial photographs of August 1966 (Sedgwick and Henoch, 1975) and land cover from 1984 to 2018 was obtained from Landsat imagery. Google Earth Engine (GEE), ESRI ArcMap and R software were used at various stages of the data preparation. GEE was also used for the initial spatial and temporal analysis of annual land-cover mapping from Landsat images, and ArcMap and R were used in refinement of the database preparation. Land-cover maps from the satellite images were prepared by classification in accordance with albedo, the normalized-difference snow index (NDSI) and the normalized-difference water index (NDWI). As datasets extracted from different sources have different projection systems, they were re-projected to WGS 84/UTM zone 11N (EPSG:32611).
Basin delineation and land-cover classification
The PGRB drainage basin was delineated from the 1966 DEM. GEE was used for the land-cover classification of Landsat images of each year, from the 1980s to the present. Land-cover information was extracted from Landsat 5 and Landsat 8 top-of-atmosphere (TOA) reflectance images. Landsat 5 images were used for the years 1984 to 2011, and Landsat 8 images from 2013 to 2018. The Landsat satellite images are freely available and accessible through GEE at 30 m spatial resolution and 16 d temporal resolution. Two criteria governed image acquisition: (a) an image date between 15 July and 15 September; (b) minimal or no cloud cover inside the PGRB boundary. Landsat images used to create land-cover classification of the PGRB appear in Table 10. Landsat 5 images were from the Thematic Mapper (TM) sensor, and Landsat 8 images from the Operational Land Imager (OLI). Images for the years 1992, 1995, 1999 and 2012 are missing due to failure to meet the criteria.
Table 10Landsat images for generating land-cover maps of the PGRB.
The use of TOA values was followed as a standard operating procedure in this work, with appropriate narrow to broadband conversion (Hall et al., 2002; Hall and Riggs, 2007; Liang, 2000; Smith, 2010), as the fact that atmospheric backscatter will inflate surface reflectance values, ice albedo values measured on Peyto Glacier as well as those obtained from atmosphere-corrected satellite images of Peyto Glacier range from 0.17 to 0.3 (Cutler, 2006), so backscatter inflation of albedo is unlikely to reach 0.4.
Four land-cover classes were identified: (1) firn/snow (accumulation area), (2) ice (ablation area), (3) bare (non-glacierized area) and (4) waterbody. Snow- and non-snow-covered areas of bare land cover were differentiated by the NDSI (Hall et al., 2002) and NDWI (Gao, 1996; McFeeters, 1996). Distinct snow and firn areas within firn/snow land cover were classified by their albedo (Liang, 2000; Smith, 2010), as snow possesses higher albedo than the ice counterpart. The NDSI, NDWI and albedo for the images were obtained from the calculation on the GEE platform. The threshold of NDSI for snow cover was kept at ≥0.4 (Hall et al., 2002; Hall and Riggs, 2007). NDWI tends to possess dynamic threshold value (Ji et al., 2009). In our case, keeping the threshold at 0.4 showed the best classification for a waterbody, as a lower value tends to misclassify ice pixels as waterbodies. Similarly, albedo with the threshold of ≥0.4 was considered to classify firn and that of less than 0.4 to classify ice within already-classified NDSI-based glacier area. Accordingly, land-cover classification proceeded as follows:
-
“Bare” indicates all snow-free non-glacierized areas identified by the NDSI lower than 0.4.
-
“Firn/snow” indicates glacierized areas with albedo greater than 0.4 and NDWI lower than 0.4.
-
“Ice” indicates glacierized areas with albedo lower than 0.4 and NDWI lower than 0.4.
-
“Waterbody” indicates areas with NDWI greater than 0.4.
After GEE export to Google Drive, the images were downloaded from the drive and converted to a shape file using the “raster to polygon” tool in ArcMap. The noise in the land-cover classification was cleaned with an elimination function on ArcMap, visual inspection and correction of few misclassified areas done manually, and finally, the files were clipped by the boundary of the PGRB.
All datasets described and presented in this paper can be openly accessed from the Federated Research Data Repository at https://doi.org/10.20383/101.0259 (Pradhananga et al., 2020). Meteorological and hydrological data are reported in Mountain Standard Time (MST). Meteorological data, both in situ and bias-corrected reanalysis products, are time series in tab-delimited .obs text files. They are readable directly by CRHMr functions (https://github.com/CentreForHydrology/CRHMr, last access: 8 January 2019) (Shook, 2016a) and any Cold Region Hydrological Model, CRHM project (https://research-groups.usask.ca/hydrology/modelling/crhm.php, last access: 26 March 2021) (Centre for Hydrology, 2021). Glacier mass balance and streamflow datasets are in .csv files. Geospatial data, co-registered DEM and land-cover shapefiles are provided in WGS 84/UTM zone 11N (EPSG:32611).
This paper describes the hydrometeorological, glaciological and geospatial data collected at the Peyto Glacier Research Basin over the past five decades from its foundation by the Government of Canada as part of its contribution to the UNESCO International Hydrological Decade. The research basin now forms part of the University of Saskatchewan Centre for Hydrology's Canadian Rockies Hydrological Observatory and so has been extensively re-instrumented and subject to intensive scientific study in the last decade. The meteorological data are from six AWS sites: three on the glacier and three near the glacier. These stations are listed as CryoNet stations of the WMO GCW and now contribute as part of the 60 water observatories in Canada to the Global Water Futures program. Near-real-time data from Peyto Main and Bow Hut are publicly accessible through telemetry at https://research-groups.usask.ca/hydrology/data.php#CanadianRockiesHydrologicalObservatory (last access: 26 March 2021).
Several examples of data cleaning approaches are presented. The Peyto Main station was operational during the summer months of the IHD and re-established as an AWS in 1987. New instruments and dataloggers were added in 2012–2013 by the Centre for Hydrology. The meteorological data include hourly air temperature, humidity, wind speed, incoming shortwave and longwave radiation and precipitation. These data are available for a period longer than three decades from the Peyto Main station and for longer than one decade from the Peyto Lower Ice station. Bias-corrected ERA-Interim (European Centre for Medium-Range Weather Forecasts Interim reanalysis), WFDEI (Water and Global Change Forcing Data ERA-Interim), NARR (North American Regional Reanalysis) and CFSR (Climate Forecast System Reanalysis) data are also included for running hydrological models over longer periods.
Glaciological mass balance data are collected semi-annually by the Natural Resources Canada's Geological Survey of Canada, published by the WGMS and updated annually. Details of these data have been described in several publications. Specific mass balance data at different elevation zones, available from 2007 to 2019, are included in this paper. On-ice station data include glacier surface elevation change due to ablation and accumulation, as measured by sonic rangers at three ice stations. The three ice stations, each in a different elevation zone, have been operational for various time periods, the first starting in 1995, with long gaps in the records becoming less frequent over time, especially after 2007. Geospatial data include information on basin boundary, drainage area, land cover (including snow, firn and ice on the glacier) and locations of hydrometric sites. Both historical and contemporary discharge data are included. The flow data and hourly surface elevation change data in different elevation zones are useful for model validation. The long-term mass balance data are a valuable research asset for model development, analysis of climate change and study of climate impacts on glacier mass balance and hydrology. This comprehensive, exceptionally long database is a testament to the dogged perseverance of scientists, working for various entities with support from various research funding schemes, who kept their eyes on the science and so have produced a rare half-century detailed documentation of the impacts of climate change on the cryosphere in a high-mountain environment.
DP cleaned, organized and corrected the data and wrote the first draft of the manuscript. JWP and DSM re-instrumented the basin and designed the data correction procedures. All authors collected and assembled data records and contributed to writing the paper. CAW contributed to hydrometric rating curve (Sect. 3.5); MND contributed to glaciological mass balance data (Sect. 3.6); NHK, JS, BM and KM contributed to geospatial data (Sect. 3.7).
The authors declare that they have no conflict of interest.
Any reference to specific equipment types or manufacturers is for informational purposes and does not represent a product endorsement.
This article is part of the special issues “Hydrometeorological data from mountain and alpine research catchments” and “Water, ecosystem, cryosphere, and climate data from the interior of Western Canada and other cold regions”. It is not associated with a conference.
More than a half century of intense field observations on a remote high-mountain glacier in the Canadian Rockies involve extraordinary dedication, perseverance, foresight and bloody-mindedness, along with the physical fortitude to take scientific measurements in inclement weather. This paper is dedicated to the many brave scientists who have taken observations on Peyto Glacier and to Gordon Young, who has not only done all of that but continues to encourage scientific examination of the glacier and of the dynamic interface of the cryosphere and the hydrosphere.
This research has been funded by the Canada First Research Excellent Fund's Global Water Futures Programme, the National Sciences and Engineering Research Council of Canada's Changing Cold Regions Network and Discovery Grants programme, the Canada Foundation for Innovation's Canadian Rockies Hydrological Observatory, the Canada Research Chairs and Canada Excellence Research Chairs programmes, the Canadian Foundation for Climate and Atmospheric Sciences IP3 and WC2N networks, Natural Resources Canada, Environment Canada, Columbia Basin Trust and BC Hydro.
This paper was edited by J. Ignacio López-Moreno and reviewed by two anonymous referees.
Bitz, C. M. and Battisti, D. S.: Interannual to decadal variability in climate and the glacier mass balance in Washington, Western Canada, and Alaska, J. Climate, 12, 3181–3196, https://doi.org/10.1175/1520-0442(1999)012<3181:ITDVIC>2.0.CO;2, 1999.
Centre for Hydrology: CRHM: The Cold Regions Hydrological Model, available at: https://research-groups.usask.ca/hydrology/modelling/crhm.php, last access: 26 March 2021.
Cogley, J. G., Hock, R., Rasmussen, L. A., Arendt, A. A., Bauder, A., Braithwaite, R. J., Jansson, P., Kaser, G., Möller, M., Nicholson, L., and Zemp, M.: Glossary of Glacier Mass Balance and Related Terms, in IHP-VII Technical Documents in Hydrology No. 86, IACS Contribution No. 2, Paris, available at: https://wgms.ch/downloads/Cogley_etal_2011.pdf (last access: 25 May 2021), 2011.
Comeau, L. E. L., Pietroniro, A., and Demuth, M. N.: Glacier contribution to the North and South Saskatchewan Rivers, Hydrol. Process., 23, 2640–2653, 2009.
Cutler, P. M.: A Reflectivity Parameterization for use in Distributed Glacier Melt Models, Based on Measurements from Peyto Glacier, Canada, in: Peyto Glacier: One Century of Science, edited by: Demuth, M. N., Munro, D. S., and Young, G. J., National Hydrology Research Institute Science Report 8, National Water Research Institute, Saskatchewan, Canada, 179–200, ISBN 0-660-17683-1, 2006.
Dee, D. P., Uppala, S. M., Simmons, A. J., Berrisford, P., Poli, P., Kobayashi, S., Andrae, U., Balmaseda, M. A., Balsamo, G., Bauer, P., Bechtold, P., Beljaars, A. C. M., van de Berg, L., Bidlot, J., Bormann, N., Delsol, C., Dragani, R., Fuentes, M., Geer, A. J., Haimberger, L., Healy, S. B., Hersbach, H., Hólm, E. V., Isaksen, L., Kållberg, P., Köhler, M., Matricardi, M., Mcnally, A. P., Monge-Sanz, B. M., Morcrette, J. J., Park, B. K., Peubey, C., de Rosnay, P., Tavolato, C., Thépaut, J. N., and Vitart, F.: The ERA-Interim reanalysis: Configuration and performance of the data assimilation system, Q. J. Roy. Meteor. Soc., 137, 553–597, https://doi.org/10.1002/qj.828, 2011.
Demuth, M., Sekerka, J., and Bertollo, S.: Glacier Mass Balance Observations for Peyto Glacier, Alberta, Canada (updated to 2007), Spatially Referenced Data Set Contribution to the National Glacier-Climate Observing System, State and Evolution of Canada's Glaciers, Geological Survey of Canada, Ottawa, 2009.
Demuth, M. N. and Ednie, M.: A glacier condition and thresholding rubric for use in assessing protected area / ecosystem functioning, (May), Geological Survey of Canada, https://doi.org/10.4095/297892, 53 pp., 2016.
Demuth, M. N. and Hopkinson, C.: Glacier elevation data derived from Airborne Laser Terrain Mapper surveys over the reference monitoring glaciers of the Canadian Western and Northern Cordillera, August, 2006, Geological Survey of Canada and the Canadian Consortium for LiDAR Environmental Applications Research, State and Evolution of Canada's Glaciers/ESS Climate Change Geoscience Programme Spatially Referenced Dataset, ESRI 3D ASCII files on archival hard drive, 2013.
Demuth, M. N. and Keller, R.: An assessment of the mass balance of Peyto glacier (1966–1995) and its relation to Recent and past-century climatic variability, in: Peyto Glacier: One Century of Science, edited by: Demuth, M. N., Munro, D. S., and Young, G. J., National Hydrology Research Institute, Saskatoon, Saskatchewan, Canada, 83–132, 2006.
Demuth, M. N., Munro, D. S., and Young, G. J. (Eds.): Peyto Glacier: one century of science, National Hydrology Research Institute, Saskatoon, Saskatchewan, Canada, 2006.
Demuth, M. N., Pinard, V., Pietroniro, A., Luckman, B. H., Hopkinson, C., Dornes, P., and Comeau, L.: Recent and past-century variations in the glacier resources of the Canadian Rocky Mountains: Nelson River system, Terra glacialis, 11, 27–52, available at: http://scholar.ulethbridge.ca/hopkinson/files/demuthetal_tg11.pdf (last access: 26 March 2021), 2008.
Dyurgerov, M.: Glacier mass balance and regime: data of measurements and analysis, edited by: Meier, M. and Armstrong, R., Institute of Arctic and Alpine Research, University of Colorado, Boulder, Colorado, 2002.
Gao, B.: NDWI – A normalized difference water index for remote sensing of vegetation liquid water from space, Remote Sens. Environ., 58, 257–266, https://doi.org/10.1016/S0034-4257(96)00067-3, 1996.
Goodison, B.: An Analysis of Climate and Runoff Events for Peyto Glacier, Alberta, Environment Canada, Ottawa, Canada, 1972.
Gudmundsson, L.: qmap: Statistical transformations for post-processing climate model output. R package version 1.0-4., R Packag. version 1.0-4, available at: https://cran.r-project.org/web/packages/qmap/qmap.pdf (last access: 26 May 2021), 2016.
Hall, D. K. and Riggs, G. A.: Accuracy assessment of the MODIS snow products, Hydrol. Process., 21, 1534–1547, https://doi.org/10.1002/hyp, 2007.
Hall, D. K., Riggs, G. A., Salomonson, V. V., DiGirolamo, N. E., and Bayr, K. J.: MODIS snow-cover products, Remote Sens. Environ., 83, 181–194, https://doi.org/10.1016/S0034-4257(02)00095-0, 2002.
Harder, P. and Pomeroy, J. W.: Estimating precipitation phase using a psychrometric energy balance method, Hydrol. Process., 27, 1901–1914, https://doi.org/10.1002/hyp.9799, 2013.
Holdsworth, G., Demuth, M. N., and Beck., T. M. H.: Radar measurements of ice thickness on Peyto Glacier, in: Peyto Glacier: One Century of Science, edited by: Demuth, M. N., Munro, D. S., and Young, G. J., National Hydrology Research Institute Science Report 8, Saskatoon, Saskatchewan, Canada, 59–82, 2006.
Hopkinson, C. and Young, G. J.: The effect of glacier wastage on the flow of the Bow River at Banff, Alberta, 1951–1993, Hydrol. Process., 12, 1745–1762, https://doi.org/10.1002/(SICI)1099-1085(199808/09)12:10/11<1745::AID-HYP692>3.0.CO;2-S, 1998.
IP3: Improving Processes & Parameterization for Prediction in Cold Regions Hydrology, IP3 Res. Netw. Data Arch, available at: http://www.usask.ca/ip3/data.php (last access: 7 July 2020), 2010.
Ji, L., Zhang, L., and Wylie, B.: Analysis of Dynamic Thresholds for the Normalized Difference Water Index, Photogramm. Eng. Remote Sens., 75, 1307–1317, available at: https://www.ingentaconnect.com/content/asprs/pers/2009/00000075/00000011/art00004?crawler=true&mimetype=application/pdf (last access: 26 May 2021), 2009.
Johnson, P. G. and Power, J. M.: Flood and landslide events, Peyto Glacier terminus, Alberta, Canada, 11–14 July 1983, J. Glaciol., 31, 86–91, 1985.
Kehrl, L. M., Hawley, R. L., Osterberg, E. C., Winski, D. A., and Lee, A. P.: Volume loss from lower Peyto Glacier, Alberta, Canada, between 1966 and 2010, J. Glaciol., 60, 51–56, https://doi.org/10.3189/2014JoG13J039, 2014.
Krogh, S. A., Pomeroy, J. W., and McPhee, J.: Physically Based Mountain Hydrological Modeling Using Reanalysis Data in Patagonia, J. Hydrometeorol., 16, 172–193, https://doi.org/10.1175/JHM-D-13-0178.1, 2015.
Lafrenière, M. and Sharp, M.: Wavelet analysis of inter-annual variability in the runoff regimes of glacial and nival stream catchments, Bow Lake, Alberta, Hydrol. Process., 17, 1093–1118, https://doi.org/10.1002/hyp.1187, 2003.
Letréguilly, A.: Relation between the mass balance of western Canadian mountain glaciers and meteorological data, J. Glaciol., 34, 11–18, 1988.
Letréguilly, A. and Reynaud, L.: Spatial patterns of mass-balance fluctuations of North American glaciers, J. Glaciol., 35, 163–168, 1989.
Liang, S.: Narrowband to broadband conversions of land surface albedo: I. Algorithms, Remote Sens. Environ., 76, 213–238, https://doi.org/10.1016/S0034-4257(00)00205-4, 2000.
Marshall, S. J., White, E. C., Demuth, M. N., Bolch, T., Wheate, R., Menounos, B., Beedle, M. J., and Shea, J. M.: Glacier Water Resources on the Eastern Slopes of the Canadian Rocky Mountains, Can. Water Resour. J., 36, 109–134, https://doi.org/10.4296/cwrj3602823, 2011.
Matulla, C., Watson, E., Wagner, S., and Schöner, W.: Downscaled GCM projections of winter and summer mass balance for Peyto Glacier, Alberta, Canada (2000–2100) from ensemble simulations with ECHAM5-MPIOM, Int. J. Climatol., 29, 1550–1559, https://doi.org/10.1002/joc.1796, 2009.
McFeeters, S. K.: The use of the Normalized Difference Water Index (NDWI) in the delineation of open water features, Int. J. Remote Sens., 17, 1425–1432, https://doi.org/10.1080/01431169608948714, 1996.
Menounos, B., Hugonnet, R., Shean, D., Gardner, A., Howat, I., Berthier, E., Pelto, B., Tennant, C., Shea, J., Noh, M., Brun, F., and Dehecq, A.: Heterogeneous Changes in Western North American Glaciers Linked to Decadal Variability in Zonal Wind Strength, Geophys. Res. Lett., 46, 200–209, https://doi.org/10.1029/2018GL080942, 2019.
Mesinger, F., DiMego, G., Kalnay, E., Mitchell, K., Shafran, P. C., Ebisuzaki, W., Jović, D., Woollen, J., Rogers, E., Berbery, E. H., Ek, M. B., Fan, Y., Grumbine, R., Higgins, W., Li, H., Lin, Y., Manikin, G., Parrish, D., and Shi, W.: North American Regional Reanalysis, B. Am. Meteorol. Soc., 87, 3, 343–360, https://doi.org/10.1175/BAMS-87-3-343, 2006.
Munro, D. S.: Delays of supraglacial runoff from differently defined microbasin areas on the Peyto Glacier, Hydrol. Process., 25, 2983–2994, https://doi.org/10.1002/hyp.8124, 2011a.
Munro, D. S.: Peyto Creek hydrometeorological database (Peyto Creek Base Camp AWS), IP3 Arch, available at: http://www.usask.ca/ip3/data.php (last access: 26 May 2021), 2011b.
Munro, D. S.: Creating a Runoff Record for an Ungauged Basin: Peyto Glacier, 2002–2007, in: Putting Prediction in Ungauged Basins into Practice, edited by: Pomeroy, J. W., Spence, C., and Whitfield, P. H., Canadian Water Resources Association, available at: http://balwois.com/wp-content/uploads/2014/02/131215-Putting-Prediction-in-Ungauged-Basins.pdf (last access: 26 May 2021), 197–204, 2013.
Munro, D. S.: The Hourly Peyto Glacier Base Camp Automatic Weather Station Record, 1987–2018, available at: https://research-groups.usask.ca/hydrology/, last access: 26 March 2021.
Nuth, C. and Kääb, A.: Co-registration and bias corrections of satellite elevation data sets for quantifying glacier thickness change, The Cryosphere, 5, 271–290, https://doi.org/10.5194/tc-5-271-2011, 2011.
Ommanney, C. S. L.: Peyto Glacier: A Compendium of Information Prepared for Parks Canada, Surface Water Division, National Hydrology Research Institute, Environment Canada, Saskatoon, Saskatchewan, NHRI Contribution No. 87062, S7N 3H5, ISSN 0838-1992, 1987.
Østrem, G.: Mass Balance Studies on Glaciers in Western Canada, 1965, Geogr. Bull., 8, 81–107, 1966.
Østrem, G.: The Transient Snowline and Glacier Mass Balance in Southern British Columbia and Alberta, Canada, Geogr. Ann. A, , 55, 93–106, https://doi.org/10.1080/04353676.1973.11879883, 1973.
Pan, X., Yang, D., Li, Y., Barr, A., Helgason, W., Hayashi, M., Marsh, P., Pomeroy, J., and Janowicz, R. J.: Bias corrections of precipitation measurements across experimental sites in different ecoclimatic regions of western Canada, The Cryosphere, 10, 2347–2360, https://doi.org/10.5194/tc-10-2347-2016, 2016.
Pelto, B. M., Menounos, B., and Marshall, S. J.: Multi-year evaluation of airborne geodetic surveys to estimate seasonal mass balance, Columbia and Rocky Mountains, Canada, The Cryosphere, 13, 1709–1727, https://doi.org/10.5194/tc-13-1709-2019, 2019.
Pradhananga, D.: Response of Canadian Rockies Glacier Hydrology to Changing Climate, University of Saskatchewan, Saskatoon, SK, Canada, available at: https://harvest.usask.ca/handle/10388/12854 (last access: 19 May 2020), 2020.
Pradhananga, D., Pomeroy, J. W., Aubry-Wake, C., Munro, D. S., Shea, J., Demuth, M. N., Kirat, N. H., Menounos, B., and Mukherjee, K.: Hydrometeorological, glaciological and geospatial research data from the Peyto Glacier Research Basin in the Canadian Rockies, Fed. Res. Data Repos., https://doi.org/10.20383/101.0259, 2020.
Rasouli, K., Pomeroy, J. W., Janowicz, J. R., Williams, T. J., and Carey, S. K.: A long-term hydrometeorological dataset (1993–2014) of a northern mountain basin: Wolf Creek Research Basin, Yukon Territory, Canada, Earth Syst. Sci. Data, 11, 89–100, https://doi.org/10.5194/essd-11-89-2019, 2019.
Saha, S., Moorthi, S., Pan, H. L., Wu, X., Wang, J., Nadiga, S., Tripp, P., Kistler, R., Woollen, J., Behringer, D., Liu, H., Stokes, D., Grumbine, R., Gayno, G., Wang, J., Hou, Y. T., Chuang, H. Y., Juang, H. M. H., Sela, J., Iredell, M., Treadon, R., Kleist, D., Van Delst, P., Keyser, D., Derber, J., Ek, M., Meng, J., Wei, H., Yang, R., Lord, S., Van Den Dool, H., Kumar, A., Wang, W., Long, C., Chelliah, M., Xue, Y., Huang, B., Schemm, J. K., Ebisuzaki, W., Lin, R., Xie, P., Chen, M., Zhou, S., Higgins, W., Zou, C. Z., Liu, Q., Chen, Y., Han, Y., Cucurull, L., Reynolds, R. W., Rutledge, G., and Goldberg, M.: The NCEP climate forecast system reanalysis, B. Am. Meteorol. Soc., 91, 1015–1057, https://doi.org/10.1175/2010BAMS3001.1, 2010.
Schiefer, E., Menounos, B., and Wheate, R.: Recent volume loss of British Columbian glaciers, Canada, Geophys. Res. Lett., 34, L16503, https://doi.org/10.1029/2007GL030780, 2007.
Sedgwick, J. K. and Henoch, W. E. S.: 1966 Peyto Glacier Map, Banff National Park, Alberta, Environment Canada, IWD 1010, 1:10,000, Inland Waters Branch, Department of Energy, Mines and Resources, Part of 82N 10/E, 1975.
Sentlinger, G., Fraser, J., and Baddock, E.: Salt Dilution Flow Measurement: Automation and Uncertainty, in HydroSenSoft, International Symposium and Exhibition on Hydro-Environment Sensors and Software, p. 8, available at: https://www.fathomscientific.com/wp-content/uploads/2018/12/HydroSense_AutoSalt_2019_V0.6.pdf (last access: 9 June 2021), 2019.
Seyfried, M. S.: Distribution and Application of Research Watershed Data, in: First Interagency Conference on Research in the Watersheds, edited by: Renard, K., McElroy, S., Gburek, W., Canfield, H., and Scott, R., USDA-ARS: Benson, Washington DC,, 573–578 2003.
Shea, J. M. and Marshall, S. J.: Atmospheric flow indices, regional climate, and glacier mass balance in the Canadian Rocky Mountains, Int. J. Climatol., 27, 233–247, https://doi.org/10.1002/joc.1398, 2007.
Shea, J. M., Moore, R. D., and Stahl, K.: Derivation of melt factors from glacier mass-balance records in western Canada, J. Glaciol., 55, 123–130, https://doi.org/10.3189/002214309788608886, 2009.
Shook, K.: CRHMr: pre- and post- processing for the Cold Regions Hydrological Modelling (CRHM) platform, GitHub, available at: https://github.com/CentreForHydrology/CRHMr (last access: 8 January 2019), 2016a.
Shook, K.: Reanalysis: Creates Cold Regions Hydrological Modelling (CRHM) platform observations files from reanalysis data, available at: https://www.usask.ca/hydrology/RPkgs.php/ (last access: 26 March 2021), 2016b.
Smith, C. D.: Correcting the Wind Bias in Snowfall Measurements Made with a Geonor T-200B Precipitation Gauge and Alter Wind Shield, CMOS Bulletin SCMO, 36, 162–167, available at: http://www.cmos.ca/uploaded/web/members/Bulletin/Vol_36/b3605.pdf#page=16, (last access: 26 May 2021), 2007.
Smith, R. B.: The heat budget of the earth's surface deduced from space, Yale Univ. Cent. Earth Obs., available at: https://yceo.yale.edu/sites/default/files/files/Surface_Heat_Budget_From_Space.pdf (last access: 15 February 2018), p. 11, 2010.
Tennant, C. and Menounos, B.: Glacier change of the Columbia Icefield, Canadian Rocky Mountains, 1919–2009, J. Glaciol., 59, 671–686, https://doi.org/10.3189/2013JoG12J135, 2013.
Tennant, C., Menounos, B., Wheate, R., and Clague, J. J.: Area change of glaciers in the Canadian Rocky Mountains, 1919 to 2006, The Cryosphere, 6, 1541–1552, https://doi.org/10.5194/tc-6-1541-2012, 2012.
Watson, E. and Luckman, B. H.: Tree-ring-based mass-balance estimates for the past 300 years at Peyto Glacier, Alberta, Canada, Quat. Res., 62, 9–18, https://doi.org/10.1016/j.yqres.2004.04.007, 2004.
Watson, E., Luckman, B. H., and Yu, B.: Long-term relationships between reconstructed seasonal mass balance at Peyto Glacier, Canada, and Pacific sea surface temperatures, Holocene, 16, 783–790, https://doi.org/10.1191/0959683606hol973ft, 2006.
Weedon, G. P., Gomes, S., Viterbo, P., Shuttleworth, W. J., Blyth, E., Österle, H., Adam, J. C., Bellouin, N., Boucher, O., and Best, M.: Creation of the WATCH Forcing Data and Its Use to Assess Global and Regional Reference Crop Evaporation over Land during the Twentieth Century, J. Hydrometeorol., 12, 823–848, https://doi.org/10.1175/2011JHM1369.1, 2011.
World Glacier Monitoring Service (WGMS): Fluctuations of Glaciers Database, World Glacier Monit. Serv. Zurich, Switzerland, https://doi.org/10.5904/wgms-fog-2020-08, 2020.
Young, G. J.: The Mass Balance of Peyto Glacier, Alberta, Canada, 1965–1978, Arct. Alp. Res., 13, 307–318, https://doi.org/10.2307/1551037, 1981.
Young, G. J. and Stanley, A. D.: Canadian Glaciers in the International Hydrological Decade Program, 1965–1974 No. 4, Peyto Glacier, Alberta – Summary of measurements, Scientific Series No. 71, Inland Waters Directorate, Water Resources Branch, Fisheries and Environment Canada, Ottawa, Canada, 1976.
Zemp, M., Frey, H., Gärtner-Roer, I., Nussbaumer, S. U., Hoelzle, M., Paul, F., Haeberli, W., Denzinger, F., Ahlstrøm, A. P., Anderson, B., Bajracharya, S., Baroni, C., Braun, L. N., Càceres, B. E., Casassa, G., Cobos, G., Dàvila, L. R., Delgado Granados, H., Demuth, M. N., Espizua, L., Fischer, A., Fujita, K., Gadek, B., Ghazanfar, A., Hagen, J. O., Holmlund, P., Karimi, N., Li, Z., Pelto, M., Pitte, P., Popovnin, V. V., Portocarrero, C. A., Prinz, R., Sangewar, C. V., Severskiy, I., Sigurdsson, O., Soruco, A., Usubaliev, R., and Vincent, C.: Historically unprecedented global glacier decline in the early 21st century, J. Glaciol., 61, 745–762, https://doi.org/10.3189/2015JoG15J017, 2015.