the Creative Commons Attribution 4.0 License.
the Creative Commons Attribution 4.0 License.
 | 01 Jun 2021
A 30 m terrace mapping in China using Landsat 8 imagery and digital elevation model based on the Google Earth Engine
Bowen Cao
Victoria Naipal
Philippe Ciais
Yuanyuan Zhao
Wei Wei
Die Chen
Zhuang Liu
Peng Gong
The construction of terraces is a key soil conservation practice on agricultural land in China providing multiple valuable ecosystem services. Accurate spatial information on terraces is needed for both management and research. In this study, the first 30 m resolution terracing map of the entire territory of China is produced by a supervised pixel-based classification using multisource and multi-temporal data based on the Google Earth Engine (GEE) platform. We extracted time-series spectral features and topographic features from Landsat 8 images and the Shuttle Radar Topography Mission digital elevation model (SRTM DEM) data, classifying cropland area (cultivated land of Globeland30) into terraced and non-terraced types through a random forest classifier. The overall accuracy and kappa coefficient were evaluated by 10 875 test samples and achieved values of 94 % and 0.72, respectively. For terrace class, the producer's accuracy (PA) was 79.945 %, and the user's accuracy (UA) was 71.149 %. The classification performed best in the Loess Plateau and southwestern China, where terraces are most numerous. Some northeastern, eastern-central, and southern areas had relatively high uncertainty. Typical errors in the mapping results are from the sloping cropland (non-terrace cropland with a slope of ≥ 5∘), low-slope terraces, and non-crop vegetation. Terraces are widely distributed in China, and the total terraced area was estimated to be 53.55 Mha (i.e., 26.43 % of China's cropland area) by pixel counting (PC) method and 58.46 ± 2.99 Mha (i.e., 28.85 % ± 1.48 % of China's cropland area) by error-matrix-based model-assisted estimation (EM) method. Elevation and slope were identified as the main features in the terrace/non-terrace classification, and multi-temporal spectral features (such as percentiles of NDVI, TIRS2, and BSI) were also essential. Terraces are more challenging to identify than other land use types because of the intra-class feature heterogeneity, interclass feature similarity, and fragmented patches, which should be the focus of future research. Our terrace mapping algorithm can be used to map large-scale terraces in other regions globally, and our terrace map will serve as a landmark for studies on multiple ecosystem service assessments including erosion control, carbon sequestration, and biodiversity conservation. The China terrace map is available to the public at https://doi.org/10.5281/zenodo.3895585 (Cao et al., 2020).
- Article
(10718 KB) - Full-text XML
- BibTeX
- EndNote


Building agricultural terraces is a widespread adaptive strategy for sustaining cropland agriculture in areas where water erosion, severe drought, mass movement, and landslides threaten crop production, soil conservation, and man-made infrastructure (Lasanta et al., 2001). Multiple ecological functions are performed by terraces, including reducing water runoff (Chow et al., 1999; Montgomery, 2007), controlling soil erosion (Sharda et al., 2002), improving land productivity (Homburg and Sandor, 2011), ensuring food security (Liu et al., 2011; Rockström and Falkenmark, 2015), and enhancing biodiversity, as well as ecosystem restoration (Tokuoka and Hashigoe, 2014; Wei et al., 2012). Terracing may reduce soil erosion rates by up to 95 % (Fu, 1989). In this way, not only soil moisture but also soil organic carbon and nutrients can be preserved. A meta-analysis for the ecosystem benefits of terracing shows that, compared to un-terraced slopes, soil on terraced slopes contains up to 28.1 % more total nitrogen and 41.7 % more soil organic matter (Wei et al., 2016). Another recent meta-analysis study on terracing and soil organic carbon sequestration revealed that terracing increased soil organic carbon (SOC) sequestration by 32.4 % for China (Chen et al., 2020).
Terraces are mainly found in mountainous and hilly regions (Wei et al., 2016). Since approximately two-thirds of China is covered by mountains, terrace farming is one of the predominant forms of cropland agriculture in China (Lü et al., 2009). In recent years, China has made water and soil loss control in sloping cropland (non-terrace cropland with a slope of ≥ 5∘) a focus of land consolidation (NDRC and MWR, 2017). One of the most common engineering measures applied in comprehensive soil conservation and improved farming projects is to transform slopes into terraces.
However, the terrace numbers and area distribution in China are poorly documented. Current terrace statistics are incomplete or outdated, and no national map exists. Accurate and detailed spatial distribution information of terraces is thus lacking. Therefore, it is essential to generate national-scale data to provide information for policy-makers to make decisions and take action in land planning and agricultural management, as well as for researchers to evaluate the value and impact of terraces on ecosystem.
Remote sensing is often used to rapidly obtain detailed land cover and land use information (Gong et al., 2013; Yu et al., 2013b), agricultural monitoring being one critical application. In recent decades, significant progress has been made in remote-sensing-based identification of cropland areas (Pittman et al., 2010; Yu et al., 2013a), specific crop types (Bargiel, 2017; Zhong et al., 2014), farming practices such as rainfed and/or irrigated cropland (Jin et al., 2016), multiple cropping (Biradar and Xiao, 2011), and fallow (Estel et al., 2015). A few studies have insofar explored the possibility of using remote sensing to map terraces. Visual interpretation based on satellite images is the conventional method (Faulkner et al., 2003; Martínez-Casasnovas et al., 2010), which is mainly based on visual characteristics and empirical knowledge to map the terraces. A few automated approaches involving object-based classification have been proposed (Diaz-Varela et al., 2014; Zhao et al., 2017), which recognize terraces based on features of individual objects. Other studies applied texture analysis methods such as Fourier transformation (Zhang et al., 2017) and gray-level co-occurrence matrix analysis (Li et al., 2013) to identify terraces. While the results seem to be promising, such studies were limited to small areas. These algorithms were low efficiency and required case-specific parameters which cannot be easily scaled to large areas.
In this study, we establish the first classification of agricultural terraces over China for the year 2018. Our method is a supervised pixel-based classification, which has been widely used for other applications, showing good performance for large-scale cropland mapping (Gumma et al., 2020; Teluguntla et al., 2018). Thus, it has potential in large-scale terrace/non-terrace classification. However, few studies have explored its application in the field. Here, we adapted and extended this approach to systematic agricultural terrace mapping.
As for the selected data for the classification of terrace/non-terrace, past studies have usually relied on images from high-resolution satellites such as WorldView (Luo et al., 2020; Zhao et al., 2017), SPOT-5 (Li et al., 2013), and Gaofen-1 (Zhang et al., 2017) and unmanned aerial vehicles (Diaz-Varela et al., 2014). Such data are expensive and are not universally accessible, making them unsuitable for large-scale applications. Medium-resolution, freely available data, such as Landsat 8 imagery, provide a more practical option, but satisfactory accuracy must be demonstrated for the research problem of terrace identification. Note that medium-resolution images have been used in many previous large-scale agricultural land cover classification studies (Massey et al., 2018; Phalke and Özdoğan, 2018).
Although the amount of data decreases when conducting classification at medium resolution compared with high-resolution images, remote-sensing-based land cover mapping at the scale of a large country like China still requires considerable data storage and processing capabilities, which is a major challenge for software packages. The Google Earth Engine (GEE) platform provides a multi-petabyte analysis-ready data catalog and high-performance, intrinsically parallel computational service (Gorelick et al., 2017). Thus, the handling of large geospatial datasets and access to substantial computational resources can be easily met by GEE, improving the efficiency of geospatial analysis. GEE has been used in the large-scale mapping of land cover and land use. For example, B. Chen et al. (2017) mapped the mangrove forests of China, Xiong et al. (2017) mapped cropland of Africa using the GEE platform, and Liu et al. (2018) produced a time-series urban land map at a global scale based on GEE. These studies have revealed that GEE can efficiently handle various classifications at the national, continental, and global scale.
In the following, we produce a 30 m resolution terrace map for China by a supervised pixel-based classification using the GEE platform, and we provide an uncertainty analysis for the mapping results, evaluate the terrace area, and identify the key features for terrace mapping.
Our mapping approach included the following steps: (1) data preprocessing, (2) feature calculation, (3) sample collection, (4) classification implementation, (5) postprocessing, and (6) accuracy evaluation. The entire mapping procedure was performed on the GEE platform (see Fig. 1). Details for each step of the mapping procedure will be provided in the following sections.

Figure 1The framework of terrace/non-terrace classification applied in the current study. The whole project was accomplished based on the GEE platform.
2.1 Data and preprocessing
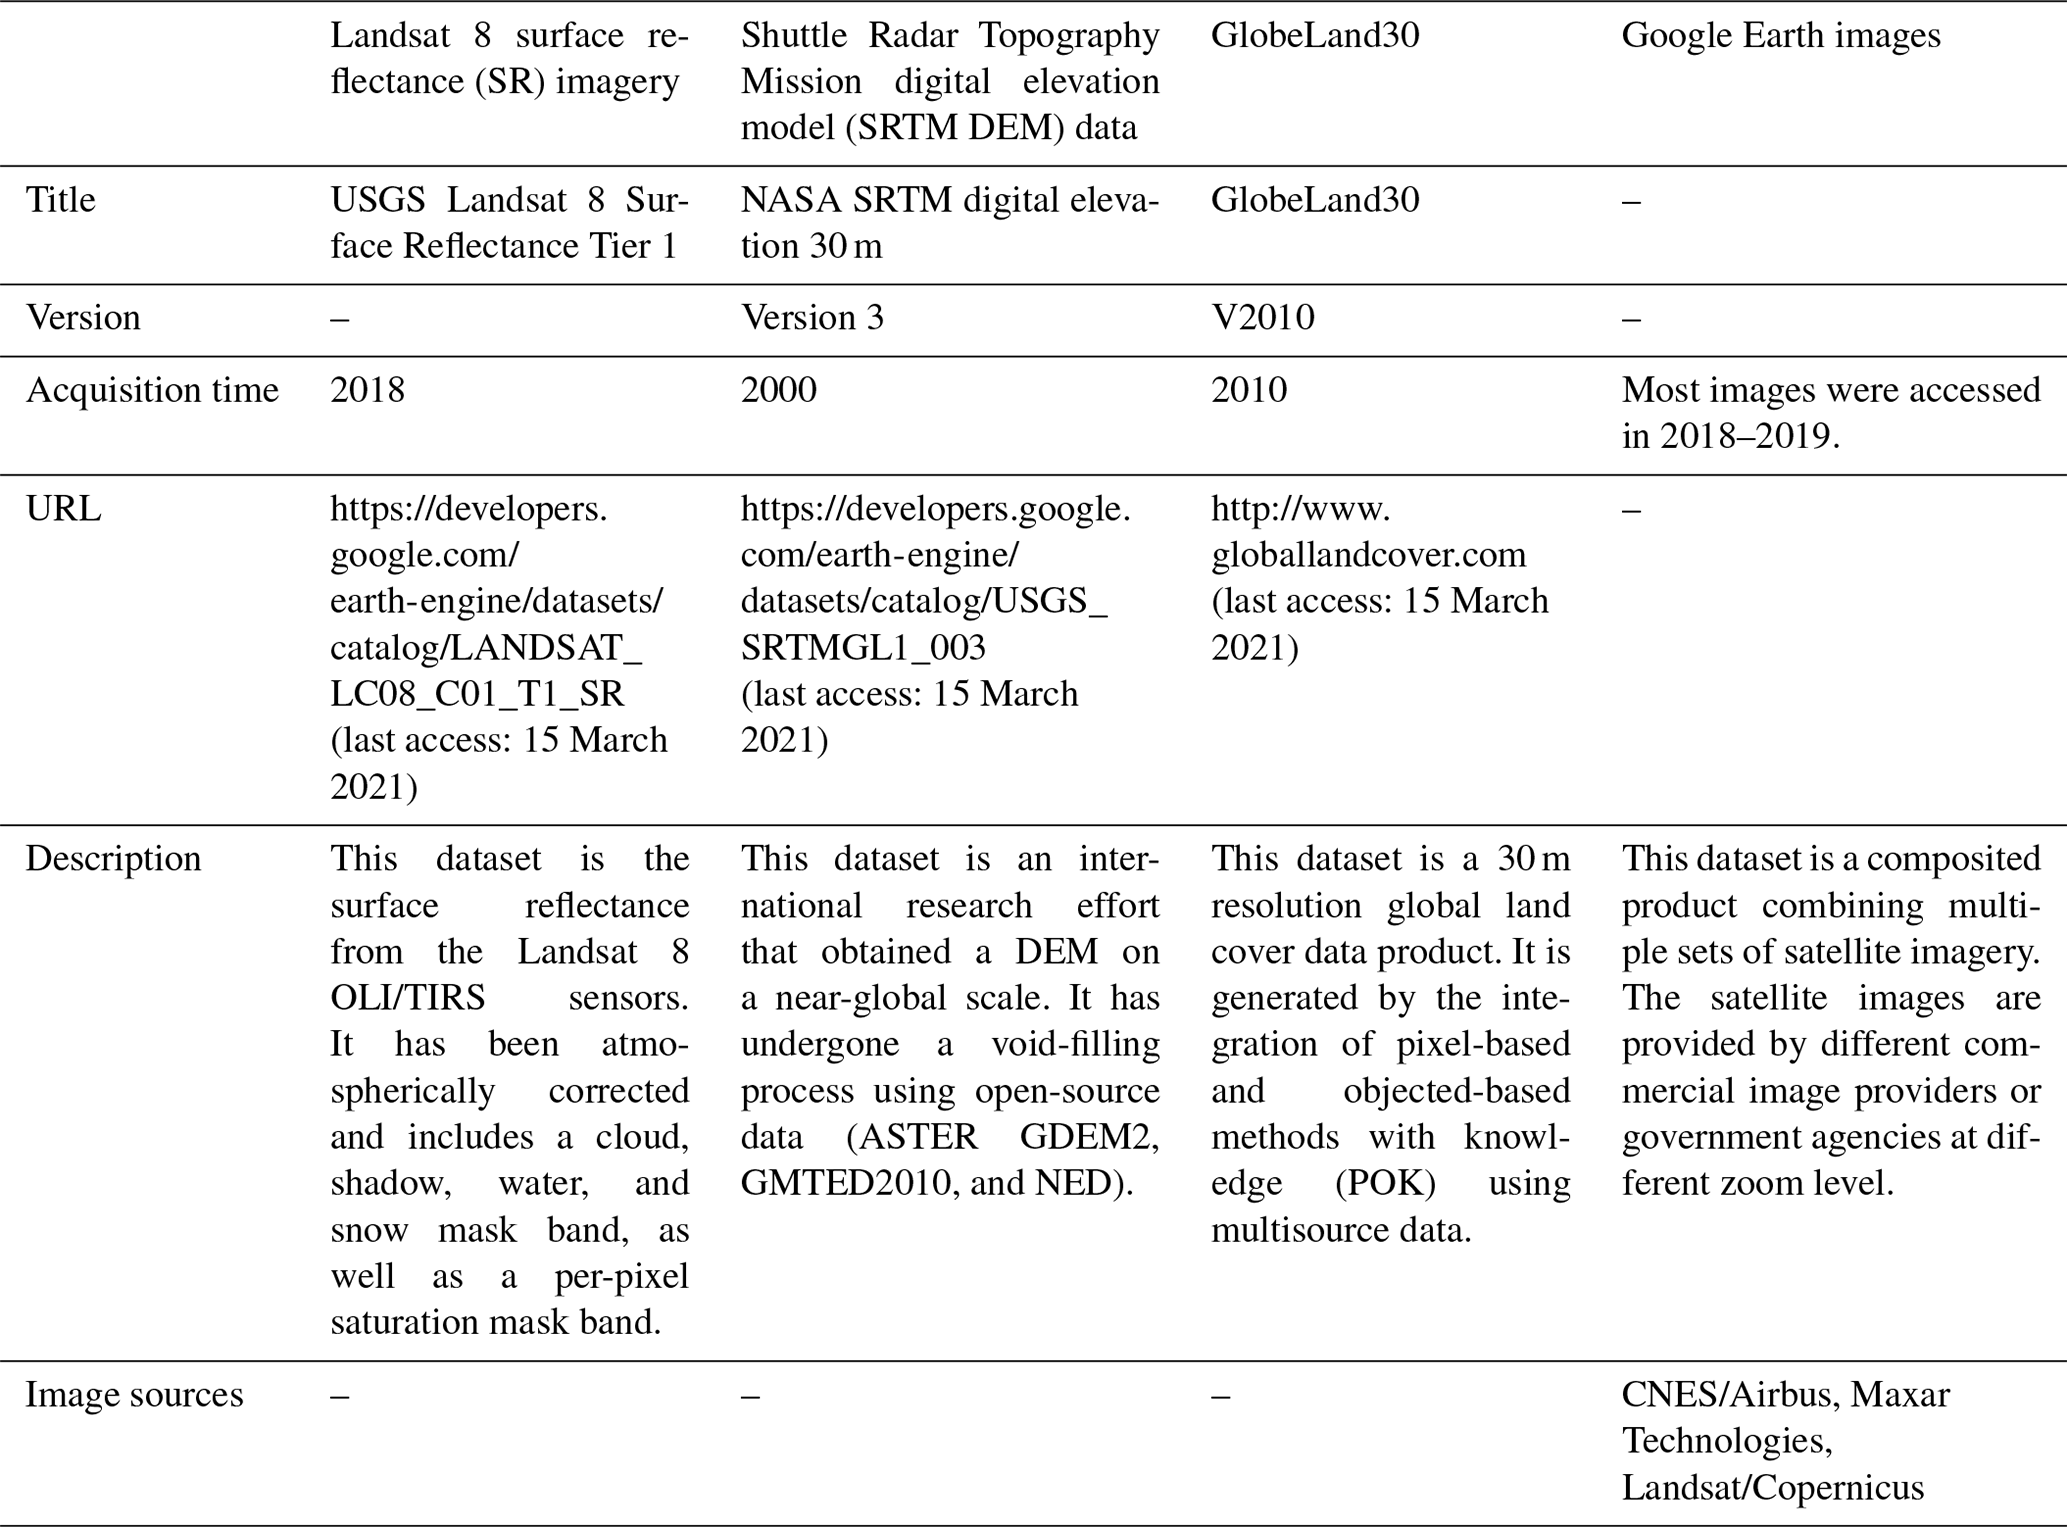
In our study, the following data were mainly used. Their detailed information is summarized in Table 1.
2.1.1 Landsat 8 surface reflectance (SR) imagery
We selected the 30 m Landsat 8 SR product accessible on GEE. This product has been atmospherically corrected and includes a cloud, shadow, water, and snow mask band produced using CFMASK, as well as a per-pixel saturation mask band (USGS, 2018). All scenes covering China acquired in 2018 were selected in our study. After obtaining the 10 196 images, we removed the clouds in each image based on the cloud mask band (the pixel quality assessment, QA, band) of Landsat 8 SR data. These cloud-free images in 2018 can cover 99.889 % of the cropland area as defined by GlobeLand30 (J. Chen et al., 2017). In the provinces with an uncovered cropland area larger than 10 km2, all scenes in 2017, preprocessed as described above, were supplemented to achieve 99.998 % of coverage of cropland areas across China.
2.1.2 Shuttle Radar Topography Mission digital elevation model (SRTM DEM) data
Topographic features being the most distinctive features of terraces, it is crucial to consider them for terrace identification. We selected the 30 m SRTM DEM data for characterizing topographic features. SRTM is an international research effort that obtained digital elevation models on a near-global scale (Farr et al., 2007). The product at 1 arcsec (30 m) resolution is available on GEE, which has undergone a void-filling process using open-source data (ASTER GDEM2, GMTED2010, and NED) (USGS, 2015). Note that the acquisition time of the SRTM DEM data is 2000, and we suppose the terrain has changed little in decades.
2.1.3 GlobeLand30
To improve terrace mapping efficiency, we limited the classification to cropland area of GlobeLand30, a well-established and widely used source of land cover information, generated by the integration of pixel-based and objected-based methods with knowledge (POK) using multisource data (Chen et al., 2015). Its accuracy for cultivated land type is above 80 % (J. Chen et al., 2017). The latest version of this land cover dataset is for 2010, which does not correspond to our classification year (2018). However, according to national survey statistics, the cropland area in China changed little in recent years. We thus accepted the use of 2010 data as a mask for our 2018 classification. GlobeLand30 was first downloaded from the website (http://www.globeland30.org, last access: 15 March 2021) and then uploaded into GEE.
2.1.4 Google Earth images
Google Earth images on GEE were used as auxiliary data for sample collection. This dataset is a composited product combining multiple sets of satellite imagery which are provided by different commercial image providers or government agencies at different zoom level (Potere, 2008). Its highest resolution can reach less than 1 m. With more detailed information (e.g., texture) provided by the high-resolution Google Earth images, we can visually distinguish the samples more accurately.
2.2 Feature calculation
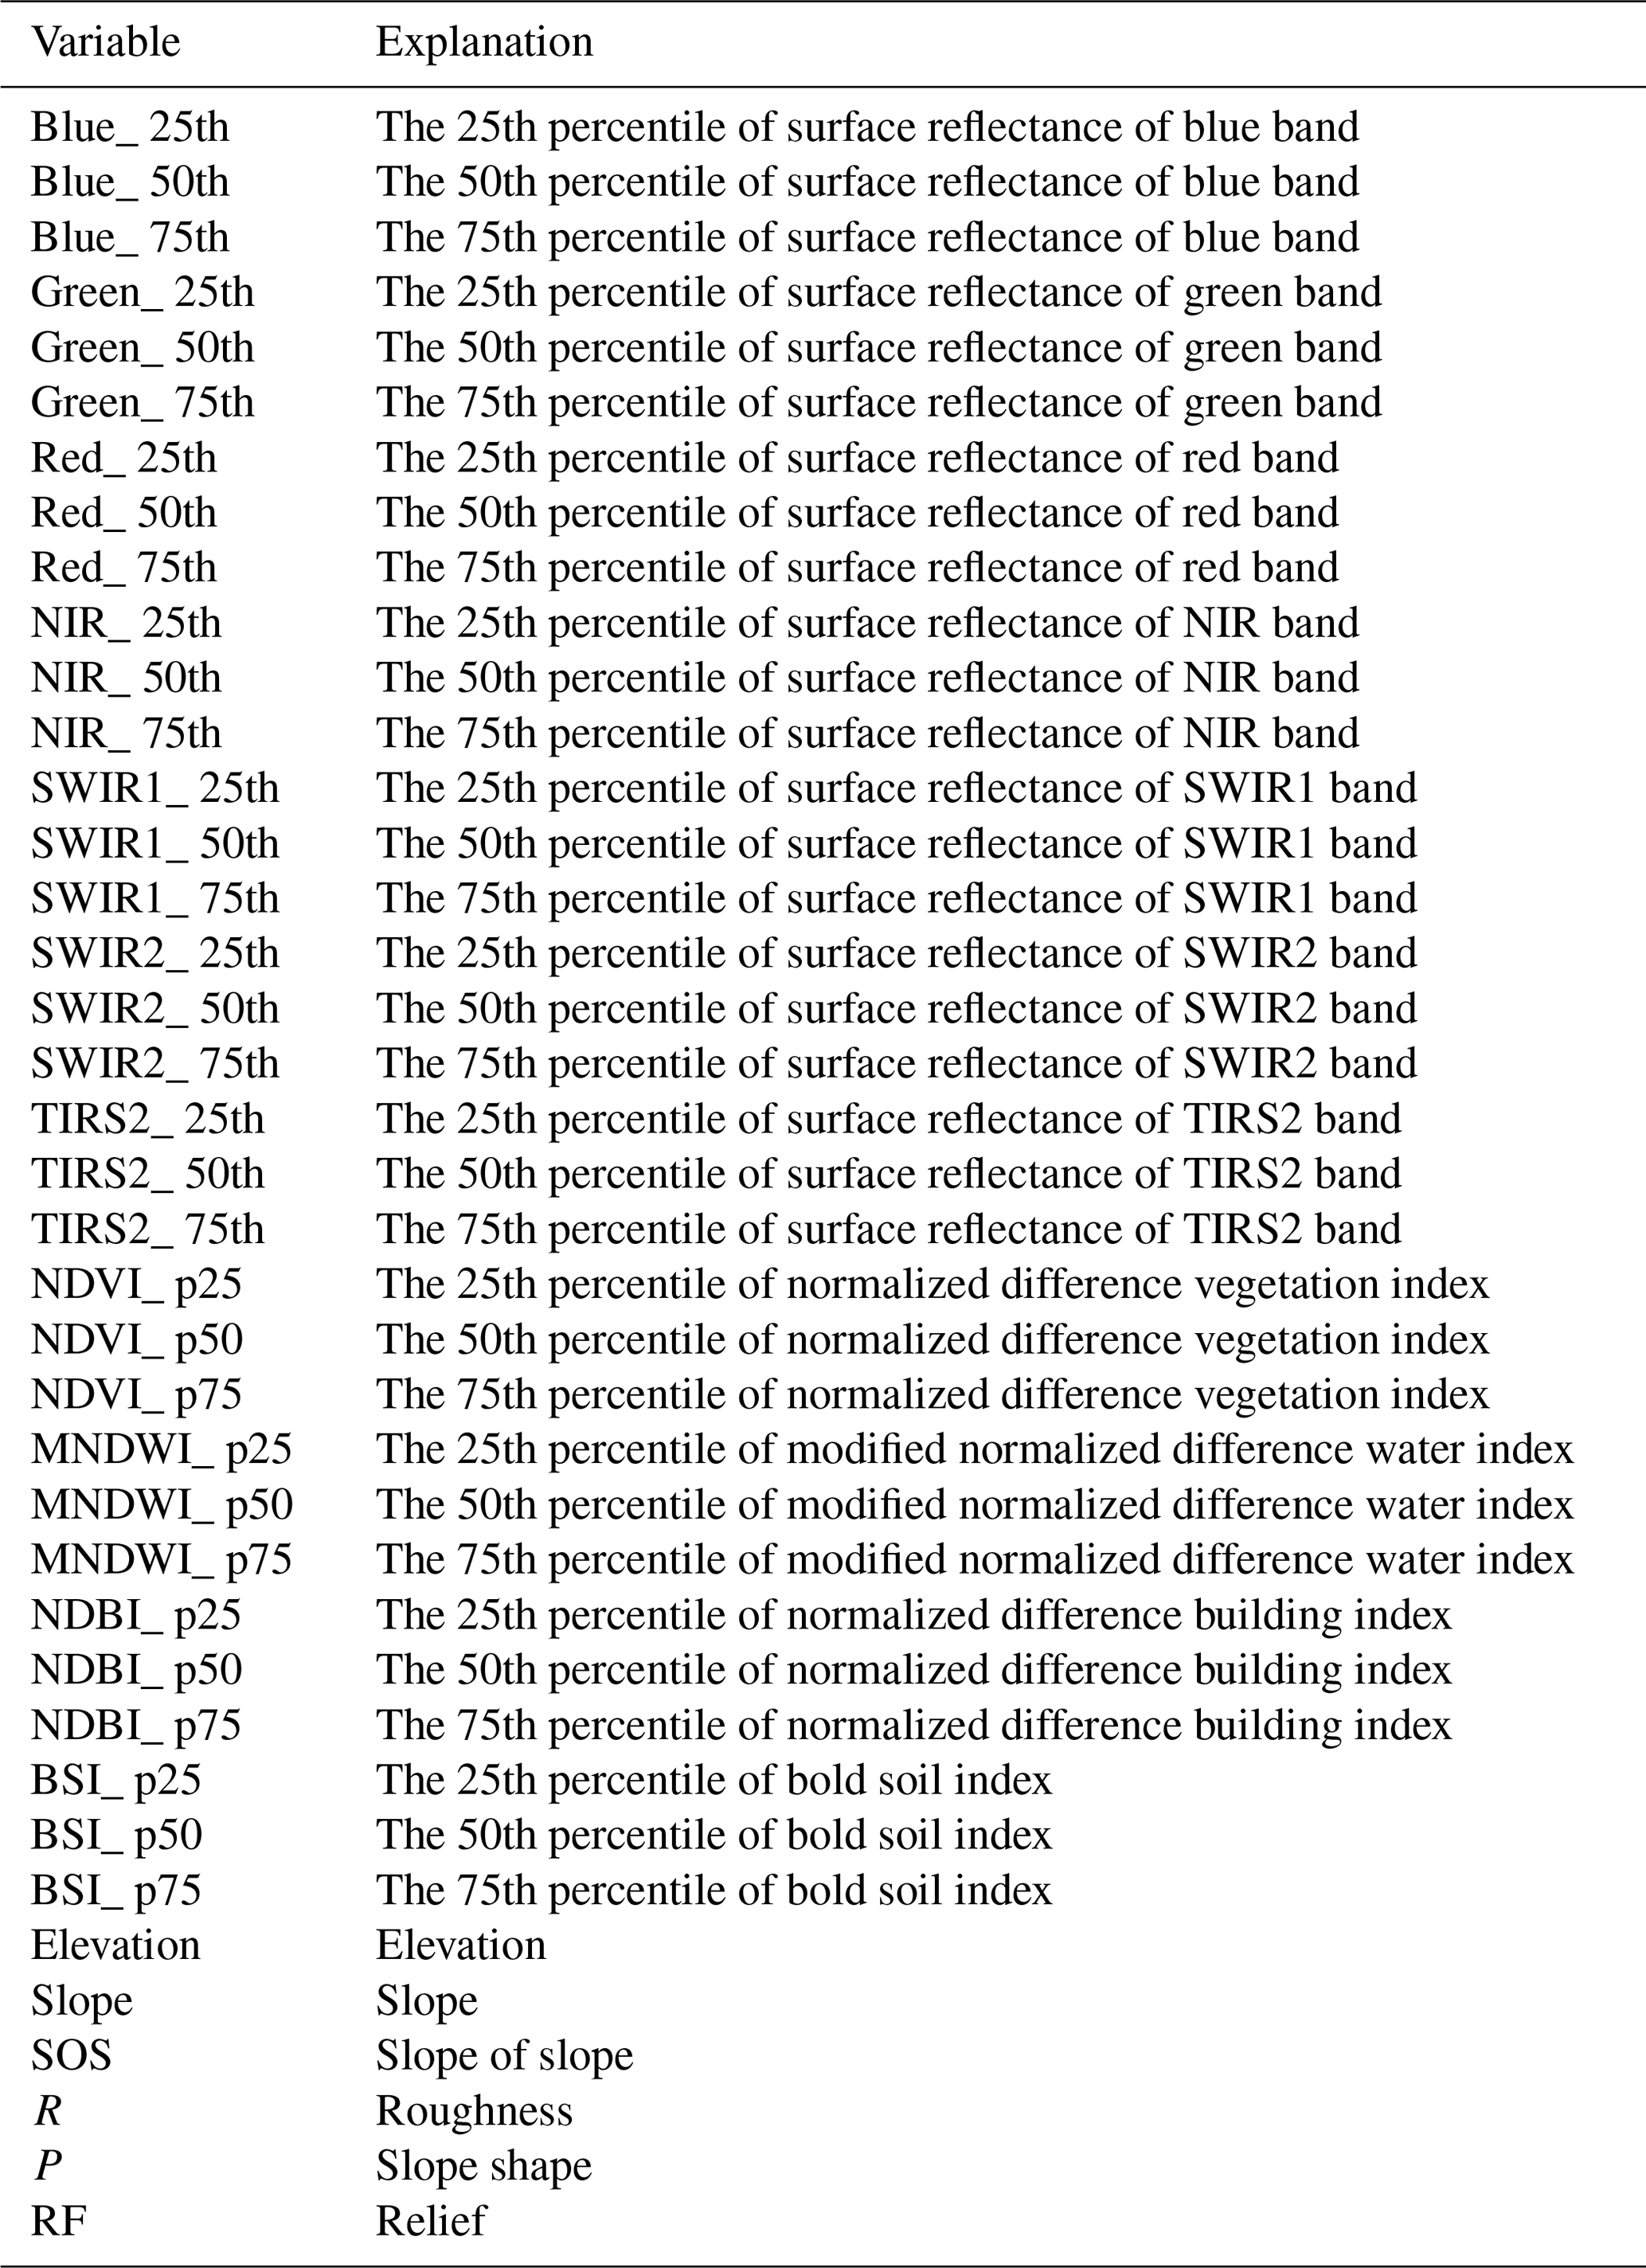
In total 39 features were calculated from the Landsat 8 SR images and the SRTM DEM data, including the 25th, 50th, and 75th percentiles of seven bands and four indexes, as well as six topographic factors (Table 2). These features will be used to distinguish the terraces and non-terraces.
Table 2Features for terrace/non-terrace classification. The type and data source of features are highlighted in bold.
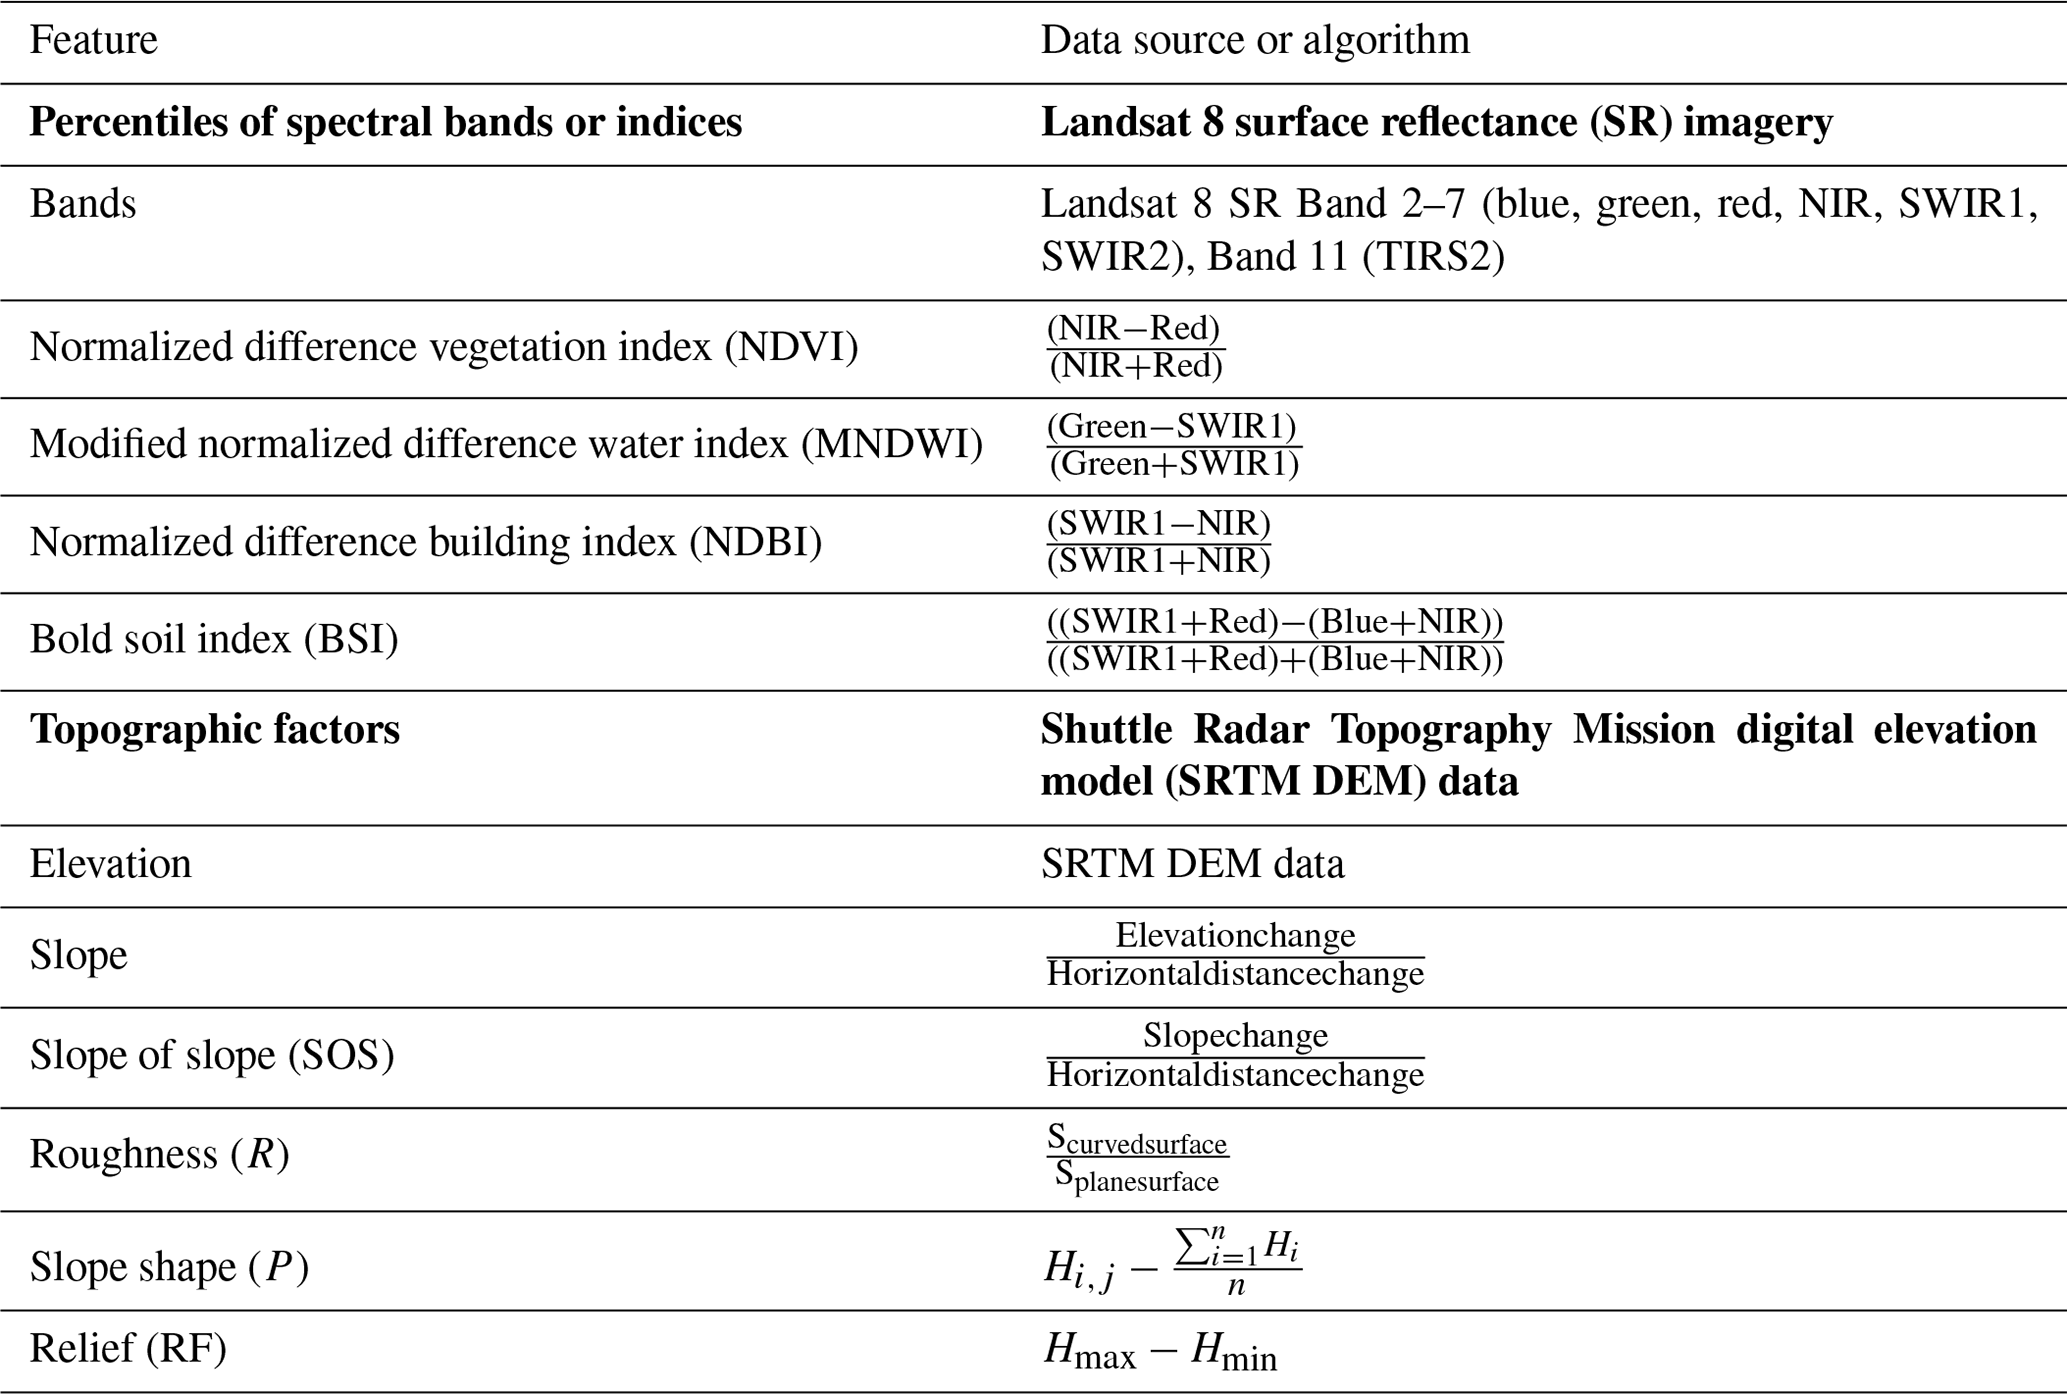
Time-series data play an important role in land cover classification, especially for cropland classification, since they can describe phenological traits (Jia et al., 2014; Knight et al., 2006; Matton et al., 2015). However, taking numerous time-series Landsat SR imagery as input for classifiers can lead to performance deterioration due to the Hughes phenomenon (i.e., the “curve of dimensionality”, accuracy decreases as dimensions increase) (Hughes, 1968). To reduce the dimension of temporal-spectral features, we extracted the percentiles of six optical bands (blue, green, red, NIR, SWIR1, and SWIR2) and one thermal infrared band (TIRS2) from the Landsat 8 time-series images during the whole year. Four important indices in land cover classification were then calculated for each Landsat image: the normalized difference vegetation index (NDVI), the normalized difference building index (NDBI), the bare soil index (BSI), and the modified normalized difference water index (MNDWI). We then calculated the percentiles of each index, and those percentiles were treated as input features for classification. The above 33 features help to identify the terraces with unique spectral characteristics.
Topographic factors are indispensable in distinguishing terraces from flat crop fields, terraces usually having a steep slope and rough terrain conditions. Therefore, we computed six commonly used topographic factors from SRTM DEM for our classification: elevation, slope, the slope of slope (SOS), roughness (R), slope shape (P), and relief (RF) (Tang et al., 2016).
2.3 Training and test sample collection
Due to China's large territory, a large number of training samples are needed to ensure classification accuracy if following the usual sample collection strategy (i.e., uniform sampling). To improve the sample collection efficiency, we designed a new strategy which collected national, regional, and local samples in the cropland area from GlobeLand30. Through reusing the national and regional samples, smaller total sample size was required, and the workload of sampling was minimized effectively. Since different geomorphologic regions have different typical terrace/non-terrace types, we first collected 801 representative (those easy to be visually interpreted) samples as national samples in each geomorphologic region (defined in Cheng et al., 2018) with a large proportion of cropland or typical terrace types (i.e., eastern hilly plains region, southeastern low-middle mountain region, north China and Inner Mongolia eastern-central mountain and plateau region, and southwestern middle and low mountain, plateau, and basin region). These samples were used for training general classification rules and identifying terraces with typical features. To classify terraces with local or confusing features, a total of 3989 local samples were added to each province to the areas with a poor classification visual effect according to the initial classification results. Cropland in some provinces has similar features, such as in Heilongjiang, Inner Mongolia, Liaoning, Jilin, Tibet, and Xinjiang. Since these provinces have a large area, setting regional samples can reduce the workload of sample collection greatly. Therefore, 54 samples in Heilongjiang were taken as regional samples and added to the sample sets of the remaining five provinces, respectively. Finally, each province has 407–609 terrace samples and 394–589 non-terrace samples. All 4790 training samples (2151 terrace samples and 2639 non-terrace samples) were collected by visual interpretation of Landsat images, SRTM DEM data, cropland extent data extracted from GlobeLand30, and Google Earth images.
All test samples were randomly generated in a hexagonal grid (icosahedral Snyder equal area discrete global grid, ISEA DGG) created using the DGGRID software (Sahr, 2019). Based on this strategy, the study area was split into 1460 equal-area regions (Fig. 2). Accurate precision evaluation requires sufficient samples for both terrace and non-terrace; however, the randomly generated terrace samples were insufficient due to their small percentage. To increase the number of terrace samples, we took the following strategy. Four samples were first generated randomly in each hexagon of China. Then, 10 random samples were supplemented into each hexagon that contained terrace samples or that surrounded hexagons with terrace samples. Finally, 10 samples were randomly added again to the hexagons with terrace samples. The sample interpretation was based on Google Earth images, Landsat images, and SRTM DEM data. We referred to Zhao et al. (2014) to conduct the interpretation and quality control. The samples were double-checked to ensure reliability. A total of 11 333 collected samples were acquired within the study area, of which 1092 samples were interpreted as terrace and 9783 samples as non-terrace. The remaining 458 samples were uncertain or seriously mixed and were excluded. The terrace test sample is zero in 12 provinces (Beijing, Hainan, Heilongjiang, Hong Kong, Jilin, Jiangsu, Macao, Shanghai, Taiwan, Tianjin, Tibet, and Xinjiang), while the terrace/non-terrace test samples are insufficient (N < 10 for either terrace or non-terrace) in 14 provinces (Liaoning, Zhejiang, and the above 12 provinces). Thus, terrace area of the 14 provinces was not analyzed in Sect. 3.3, and accuracy of the 12 provinces was not evaluated in Sect. 3.4.3.
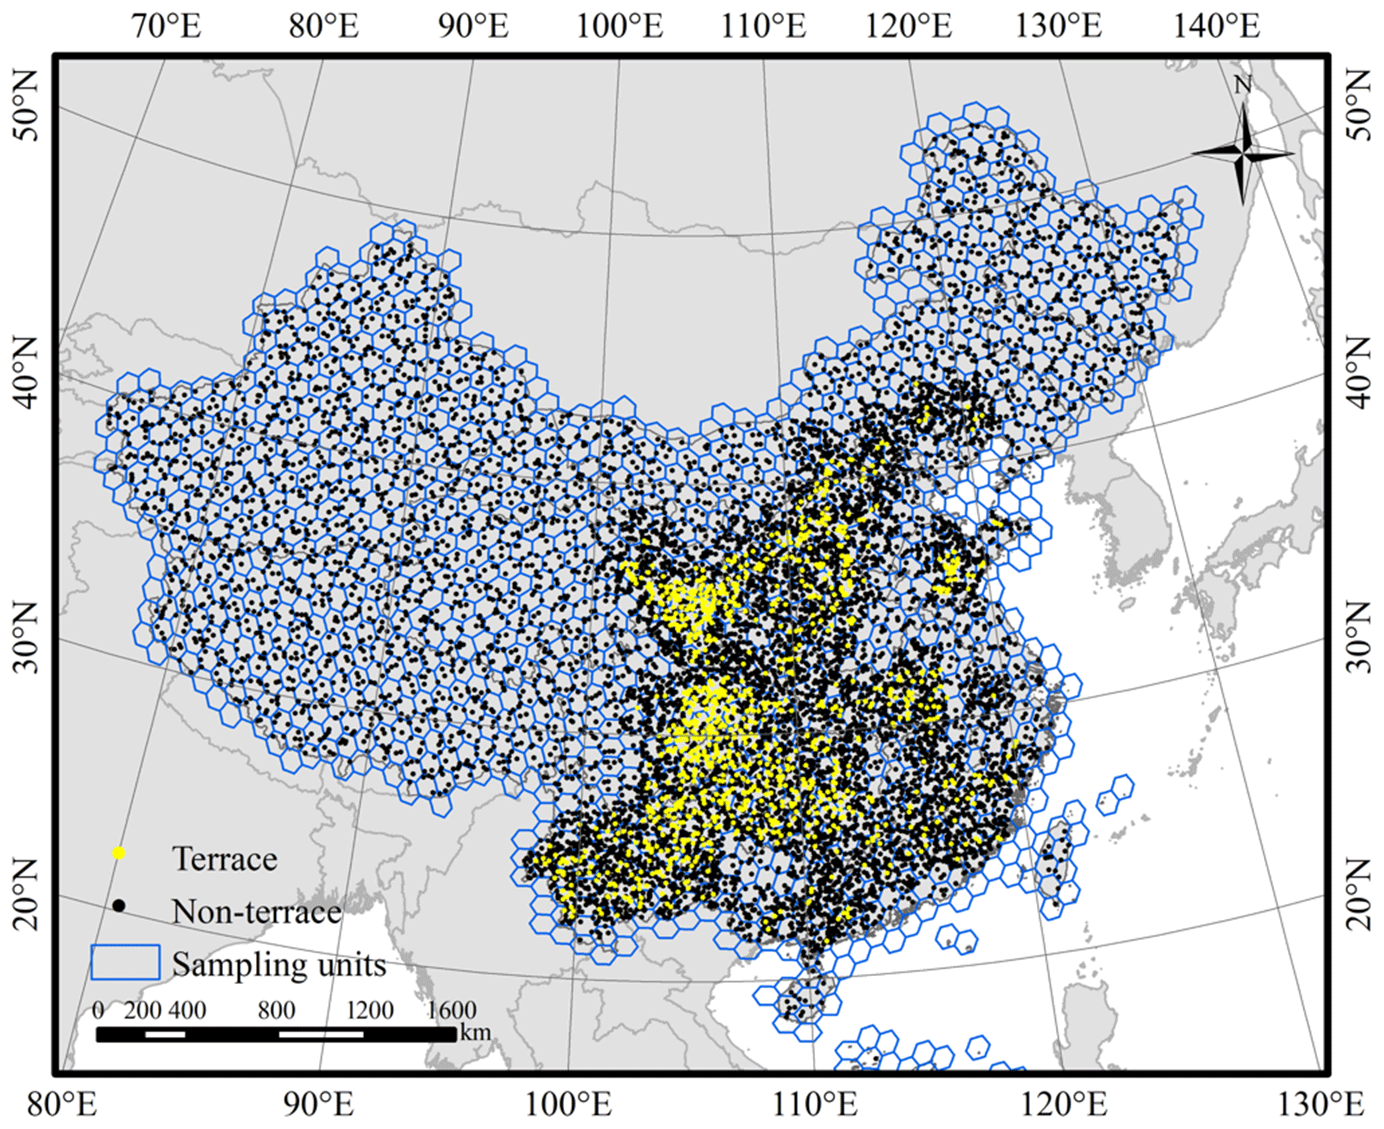
Figure 2The spatial distribution of the test samples.
2.4 Terrace/non-terrace classification
We mapped the terraces over the entirety of China using the GEE platform. Random forest was chosen as the classifier for its high precision, efficiency, and stability. It consists of multiple decision trees, all of which perform classification separately and vote for the final results. During the training process of decision tree, each tree node is split based on the most contributing feature among the randomly selected input features of the training sample subset. After training, each decision tree judges the pixel class according to the established tree rules (Breiman, 2001; Gislason et al., 2006). The two critical parameters of the random forest classifier, the number of decision trees and the number of variables per split, were set to 200 and the rounded square root of the feature number (39), respectively. The classification process comprised several steps. First, the cropland extent data were used to mask non-cropland area, which occupied 80 % of the whole study area. As a result, the classification efficiency was improved by at least 80 % through masking of non-cropland areas. Second, national, regional, and local training samples were merged to train the classifier of each province, and each random forest model was applied to classify the corresponding province. Since terraces are relatively rare and the characteristics of various terraces are quite different, performing the classification separately for each province can obtain better classification results. Finally, we mosaicked all the province maps into a complete terrace map for China.
2.5 Postprocessing
2.5.1 Mode filtering
In pixel-based classification, different objects with the same spectrum or the same objects with a different spectrum can cause a salt and pepper effect (i.e., impulse noise presenting as image speckles). Because of the irregular shape and fragmented patches of the terrace, the salt and pepper effect was serious in terrace mapping. Considering that terraces are usually small in size, we used a mode filter with a circle kernel of 1.5 pixels radius to conduct spatial filtering.
2.5.2 Sieving
By checking the mapping result, there are still lots of patches with a small size that are misclassified. Therefore, sieving was used to remove the noises after the mode filtering. We first sieved the small terrace patches and then the small non-terrace patches. The sieving threshold was set to 10 pixels in this research. Namely, terrace/non-terrace patches with an area of 10 pixels (about 9000 m2) or less were sieved.
3.1 Mapping result
Figure 3 shows the spatial distribution of China's terraces in 2018. The terraces are mainly concentrated in the plateaus, hills, and basins of China. They are most densely distributed in the Sichuan basin and the Loess Plateau (mainly in Shanxi, Shaanxi, Gansu, Qinghai, and Ningxia provinces), followed by the Yunnan–Guizhou Plateau. Terraces are also widely distributed in the central and southeast hills. The distribution of terraces is closely related to the topography; more terraces are built in regions with uneven and/or steep terrain to prevent water runoff and soil erosion. In contrast, there are few terraces on the four great plains of China (i.e., the Northeast Plain, the North China Plain, the Middle-Lower Yangtze Plain, and the Guanzhong Plain). Last, terraces are rare in the Qinghai–Tibet Plateau, the Inner Mongolian Plateau, and Xinjiang, which have small cropland areas.

Figure 3Terrace distribution across China in 2018. The map values indicate the proportion of terraces within a 1 km × 1 km grid cell except for Heilongjiang, Liaoning, and Xinjiang, where the mapping results are displayed at 5 km × 5 km resolution for clearer visual effect. Shanghai and Macao are the only two provinces have no terraces on this map. The locations of three well-known terraces shown in Fig. 4 are marked as stars in the terrace map.
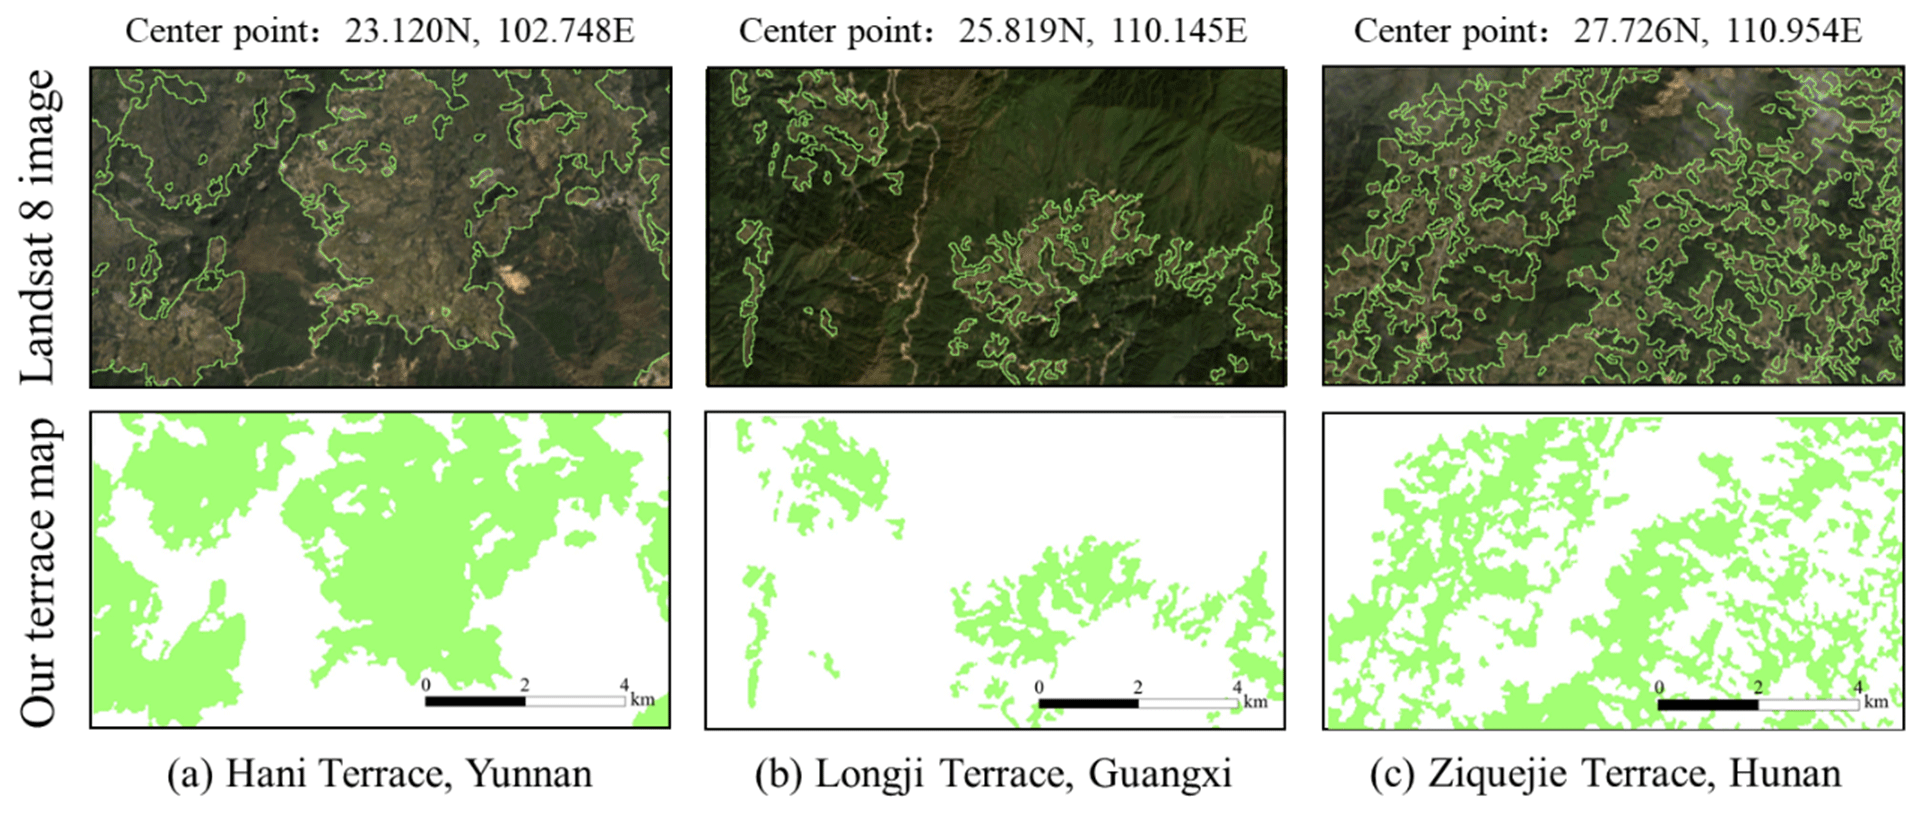
Figure 4Visual comparison between Landsat 8 images and our terrace mapping results (green represents terrace and white represents non-terrace) for three areas with well-known terracing practice (a–c). The locations of these terraces are marked as stars in Fig. 3. The green lines in Landsat 8 images are the corresponding terrace boundaries in our terrace map.
Visually, our terrace map realistically represents most of the classified areas. Figure 4a to c shows three selected cases of well-known terracing practices in China. Although they were in different provinces and different geographic environments and their types or appearances varied a lot, they were all correctly classified. The mapping results showed good visual correspondence and coincided well with the Landsat 8 images. Generally, terraces like these with typical features were accurately identified in our map.
3.2 Accuracy assessment
Our terrace map was first validated using the 10 875 collected test samples mentioned in Sect. 2.3. A confusion matrix was calculated for the classification map to evaluate its accuracy (Table 3). The terrace map had an overall accuracy (OA) of over 94 %. The producer's accuracy (PA, also referred to as “1-omission error”) of the terrace class was 79.945 %, whereas the user's accuracy (UA, also referred to as “1-commission error”) of the terrace class was 71.149 %, indicating that our results typically overestimated the quantity of terraces. The non-terrace class had both UA and PA over 96 %. We also computed the kappa coefficient (Cohen, 1960) to measure the overall classification performance, which was 0.72, indicating that the classification performs well generally.
Table 3Accuracy assessment of the 30 m terrace map by the 10 875 random test samples.
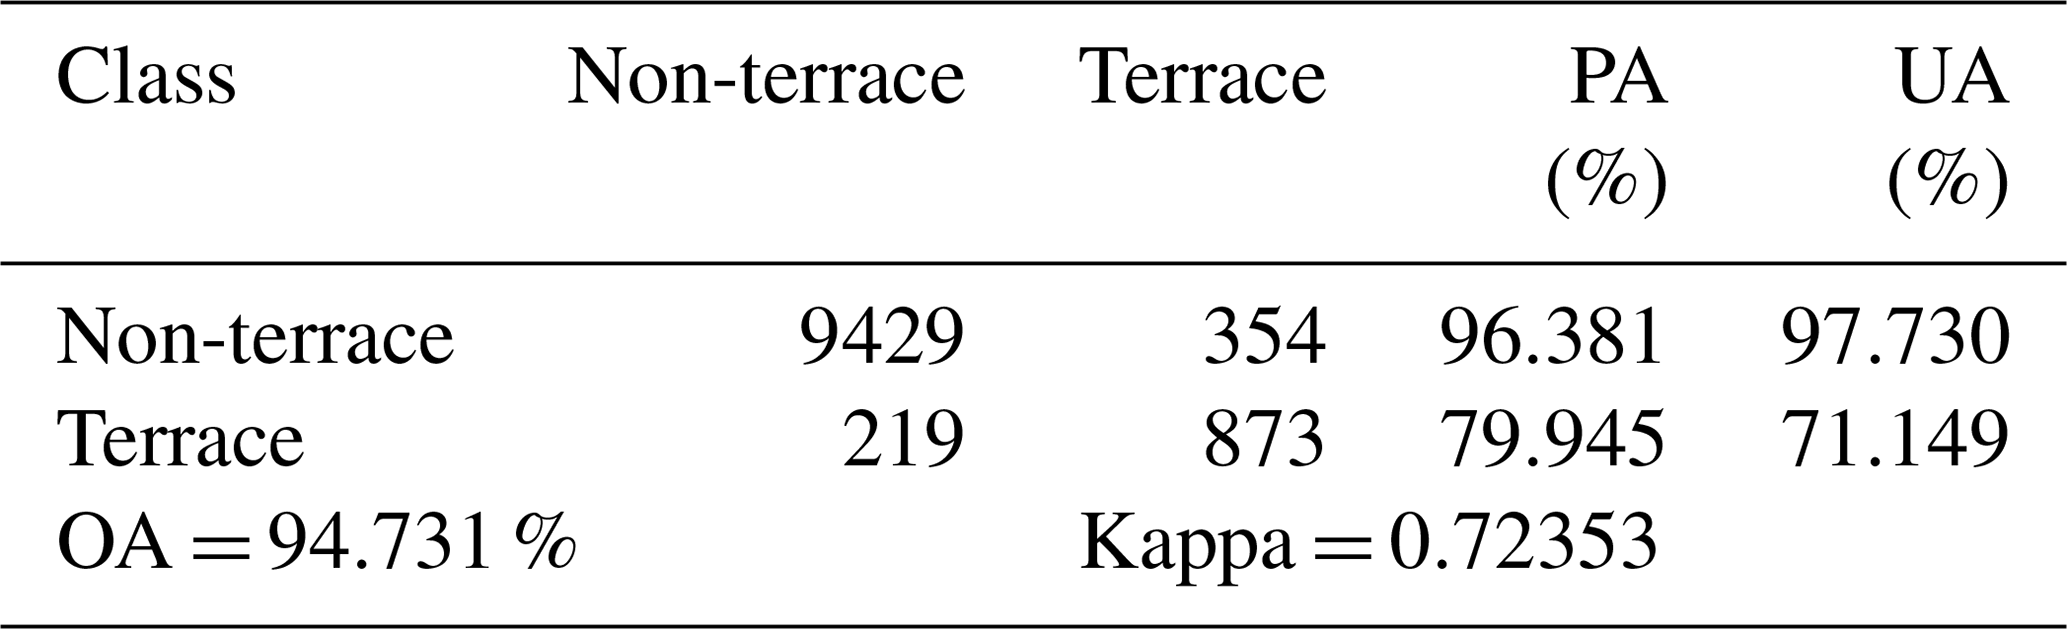
By visually checking the misclassified samples, we found that most sources of commission errors were sloping cropland, non-crop vegetation (e.g., forests, shrubs, and grasses) in the cropland extent data, and some objects near or on the terrace. The omission errors were mainly caused by the terraces that were not in the cropland extent data, low-slope terraces, and small patch terraces (terrace with an area of 10 pixels – about 9000 m2 – or less).
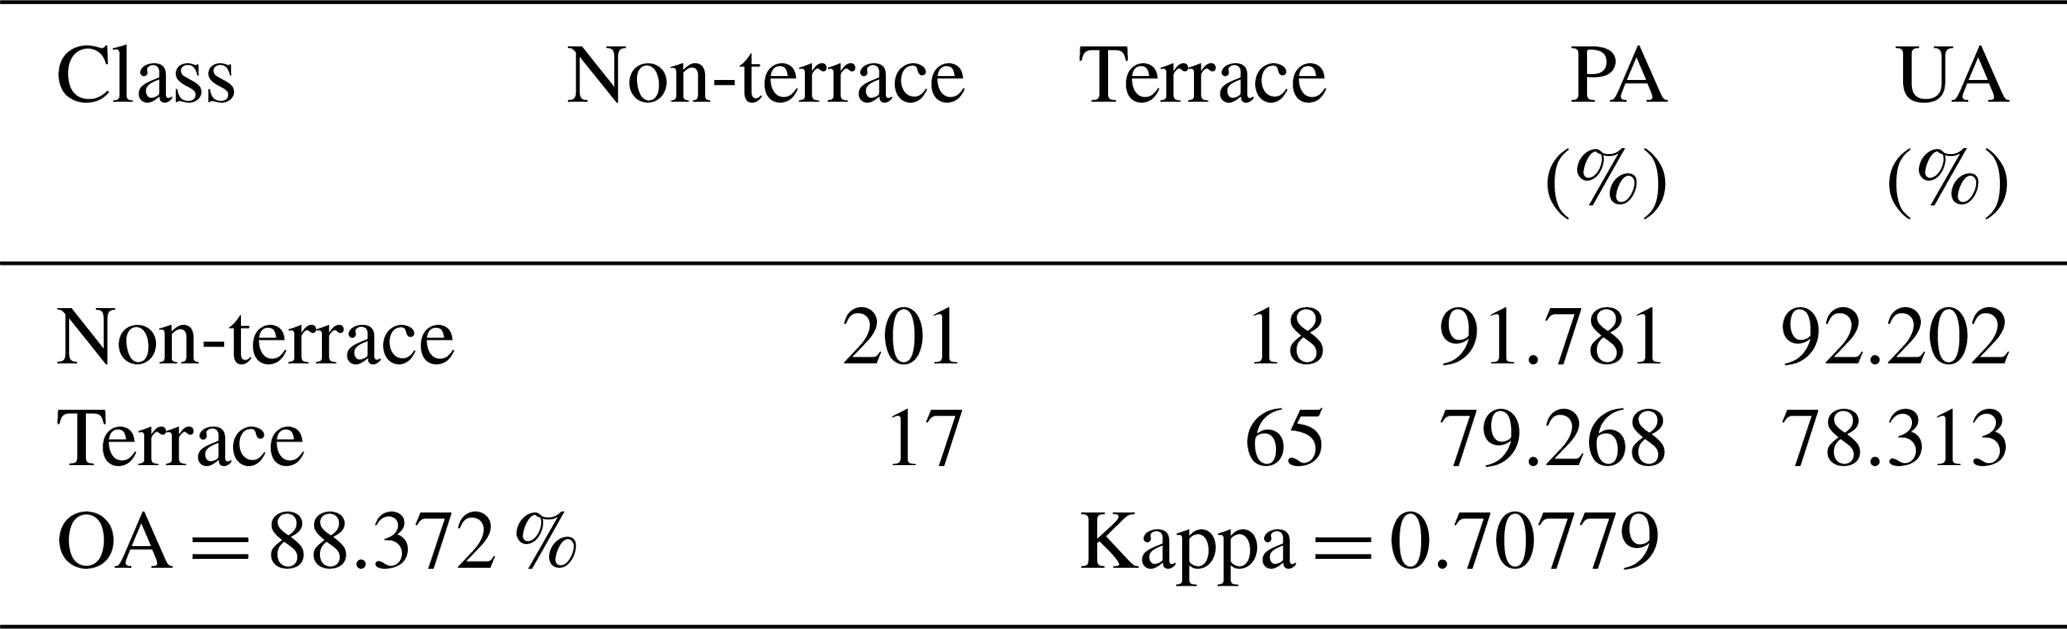
We further used another test sample set (N= 301) collected by field survey and literature study. Those samples were double-checked by a visual interpretation of Google Earth images, Landsat images, and SRTM DEM data. The accuracy evaluation result using the 301 test samples of known terraces (Table 4) was numerically similar to the above result using the 10 875 random test samples (Table 3). The Chi-square tests (Mantel, 1963) were carried out for the two PAs and UAs of terrace class, respectively, to further prove the similarity quantitatively. The p values of both tests were greater than 0.05, indicating there was no statistically significant difference between the terrace accuracies using the two test sample sets. The similarity proved the high accuracy of our terrace map again and confirmed that our random test samples and accuracy evaluation result were reliable. Note that the 301 samples were just used here for accuracy assessment verification and were not used in the following analysis.
Table 4Accuracy assessment of the 30 m terrace map by the 301 test samples of known terraces.
3.3 Area estimation
For each province with sufficient test samples (N≥10 for both terrace and non-terrace), we used three methods to estimate the terrace area based on Yu et al. (2017): (1) pixel counting (PC), (2) sample proportion (SP), and (3) error-matrix-based model-assisted estimation (EM). The PC method estimates the terrace area by summing the area of pixels classified as terrace. The SP method estimates the terrace area by multiplying the terrace test sample proportion by the total area. The EM method (see Olofsson et al., 2014, for detailed calculation procedures) combines the terrace map and test samples, which uses the sample proportion to adjust the area estimated by the PC method. Comparisons of the areas estimated by the three methods are shown in Fig. 5.
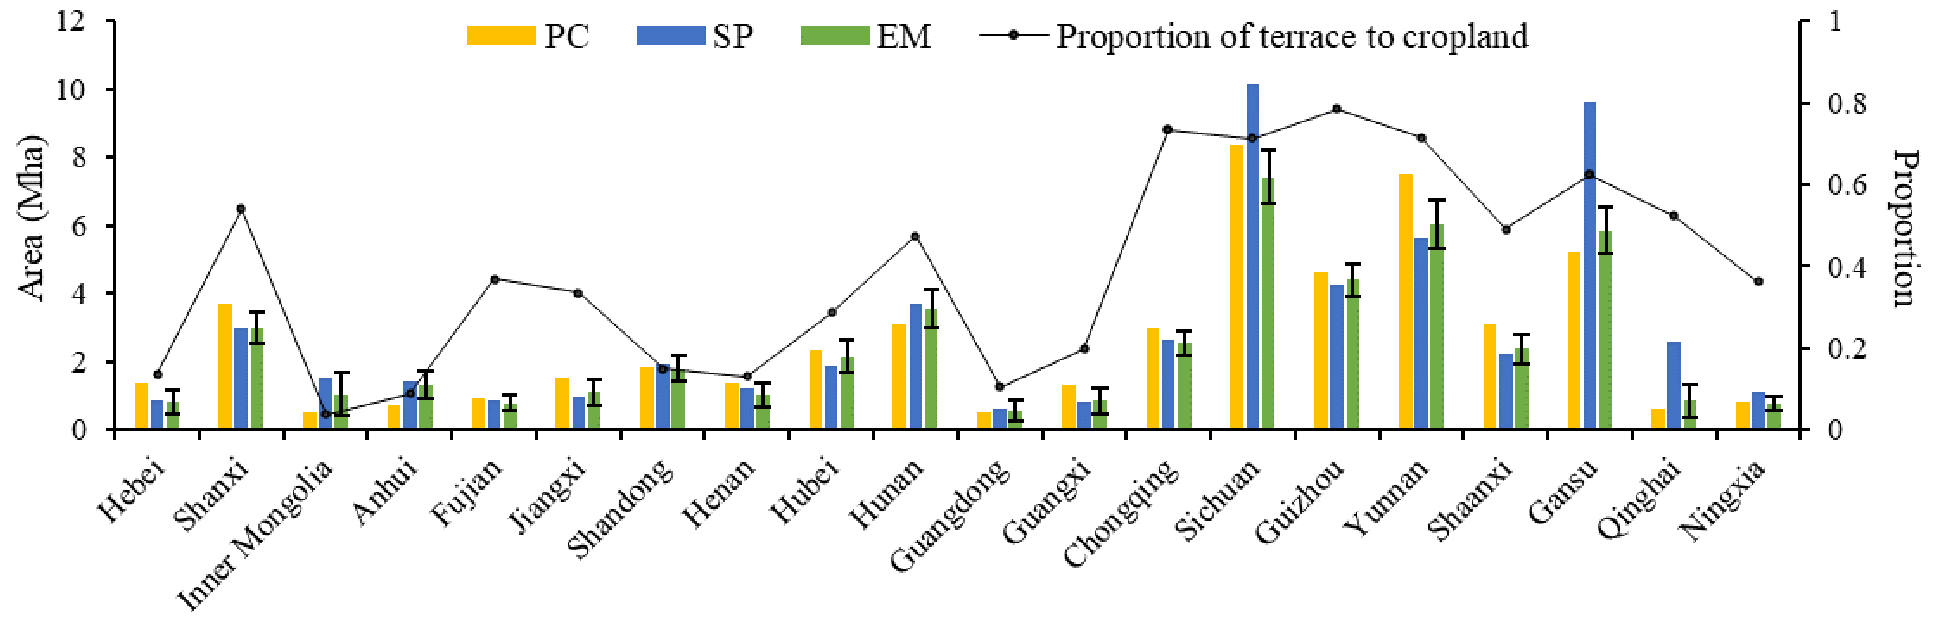
Figure 5The terrace area and proportion in different provinces of China. The error bars indicate a 95 % confidence interval. The proportion of terrace to cropland (cropland in GlobeLand30) was calculated by the pixel counting method.
According to the terrace area at the provincial level, the provinces with the largest terrace extent in China were Sichuan, Yunnan, and Gansu, whereas the terrace area was smallest in Guangdong. Guizhou, Chongqing, Yunnan, and Sichuan had the highest proportion of terraces, with more than 70 % of the cropland having been terraced. The provinces with large terrace percentages were mainly located in southwest China or the Loess Plateau. In the evaluated 20 provinces, except for Inner Mongolia, terrace proportion was also relatively low in a few eastern and southern provinces.
For most provinces, terrace area estimates from the three methods were similar. This consistency can also be regarded as a robust test for the mapping accuracy. However, the area calculated by the SP method in Sichuan, Gansu, and Qinghai was abnormally high. The outliers are mainly caused by the test sample generation strategy, which leads to a large proportion of terrace test samples in these provinces. Compared with the PC and SP methods, the EM method provides the confidence intervals for area estimates. In addition to the several provinces with a large proportion of terraces, the confidence intervals were large in Inner Mongolia because of the low accuracy.
Shanghai and Macau are the only two provinces in China that have zero terrace area by the PC method in our map. Terrace area for the other 14 provinces (Beijing, Hainan, Heilongjiang, Hong Kong, Jilin, Jiangsu, Liaoning, Macao, Shanghai, Taiwan, Tianjin, Tibet, Xinjiang, and Zhejiang) has not been analyzed due to insufficient test samples to estimate the uncertainty.
As for the total area of terraces in China for 2018, it was estimated to be 53.55 Mha by the PC method, accounting for 26.43 % of China's cropland area and 5.58 % of China's land area (about 960 Mha), and the EM method showed that the total terrace area was 58.46±2.99 Mha, i.e., 28.85 % ± 1.48 % of China's cropland area and 6.09 % ± 0.31 % of China's land area.
3.4 Uncertainty analysis
In addition to the terrace map itself, the associated map quality analysis is also important, which can provide valuable information for users to select data and indicate the limitations and future improvements. In the following subsections, the mapping uncertainty was assessed using the traditional accuracy evaluation method at the sampling unit level, terrain level, and province level, i.e., calculating the accuracy of different sampling units, terrain, and provinces. Then, the probability of terrace versus non-terrace was calculated to evaluate the uncertainty at the pixel level.
3.4.1 Sampling unit-level uncertainty
Sampling unit-level accuracy provides information about the spatial variation of uncertainty for the map (Fig. 6). The accuracy within each hexagon was evaluated based on the test samples that fall inside it. The OA was above 75 % in most hexagons (Fig. 6a). Unlike the OA, which only considers the samples correctly classified, kappa also takes the commission and omission errors into account. Figure 6b indicates that the poorly classified hexagons were mostly concentrated in the northeastern, southern, and eastern-central regions. According to Fig. 6c, the hexagons with the highest PA for terrace class were mainly located in southwest China and the Loess Plateau. Some regions in the middle and south of China had low PA, where some low-slope terraces were difficult to identify because they have similar features with flat cropland (non-terrace cropland with a slope of < 5∘). Moreover, misclassification between terraces and strip planting led to larger omission errors in the northeastern region. The distribution pattern of UA for terrace class (Fig. 6d) demonstrates that most regions had apparent overestimation except the northwestern region. In southwestern China and east of the Loess Plateau, sloping cropland and non-cropland vegetation types (e.g., forests, shrubs, and grasses) were the main commission errors. In northeastern China, confusion between terraces and strip planting also resulted in the poor UA. In central China, flat cropland led to the major overestimation. In South China, the low UA was mainly caused by both the sloping cropland and the flat cropland. However, it should be noted that the western hexagons generally contained more terrace samples, whereas some eastern hexagons or hexagons on edge had very few terrace samples (N < 2), which also could have influenced the result.

Figure 6Spatial variation of (a) OA (only calculated for hexagons with terrace test samples or with non-terrace test samples classified as terrace class), (b) kappa, (c) PA of terrace class, and (d) UA of terrace class.
3.4.2 Terrain-level uncertainty
As crucial factors in terrace/non-terrace classification, terrain has a major impact on classification accuracy. Terraces with obvious terrain features, such as specific slope and elevation, are easier to identify. The terrain-related uncertainty of our data is shown in Fig. 7. The OA showed little difference between various terrain types, and all exceeded 90 %. In contrast, kappa was more suited to judging the poorly classified terrain zones. Kappa was the lowest for regions with an elevation less than 200 m. Accordingly, these regions also had poor PA and UA (Fig. 7a). Terraces in these regions were difficult to identify because of their similar topographic features to flat cropland, and thus they were easily confused with them. As for the slope (Fig. 7b), kappa increased first and then decreased. The confusion between low-slope terraces and flat cropland caused the most omission errors and commission errors in the low-slope regions. On the other hand, the relatively low PA of the high slope regions was mainly caused by terraces not in the cropland extent data, whereas the poor UA was mainly caused by sloping cropland and non-crop vegetation types.
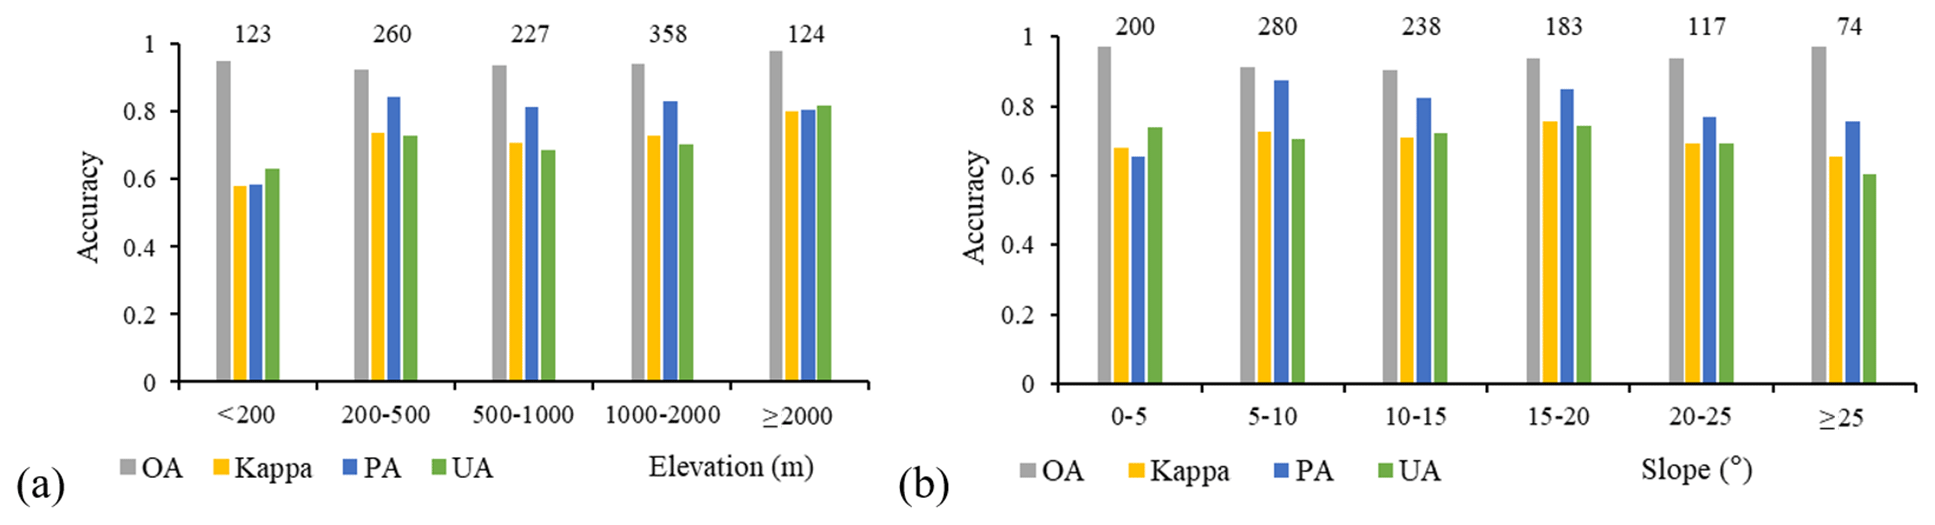
Figure 7OA, kappa, PA of terrace class, and UA of terrace class for (a) different elevation and (b) different slope. The numbers marked in the figure represent the terrace sample size within the corresponding elevation or slope range. Two test samples not covered by SRTM DEM data were not used in the terrain-related accuracy evaluation.
3.4.3 Province-level uncertainty
Since the terrace map of different provinces was classified with different training samples, we evaluated the accuracy of 22 provinces out of 34 in China, excluding 12 provinces (Beijing, Hainan, Heilongjiang, Hong Kong, Jilin, Jiangsu, Macao, Shanghai, Taiwan, Tianjin, Tibet, and Xinjiang) without terrace test samples (Fig. 8). The accuracies for Liaoning and Zhejiang may be biased because of the insufficient number of test samples (N<10 for either terrace or non-terrace), which are indicated by “*” in Fig. 8. To avoid biases, these provinces were excluded from further analyses in this study.
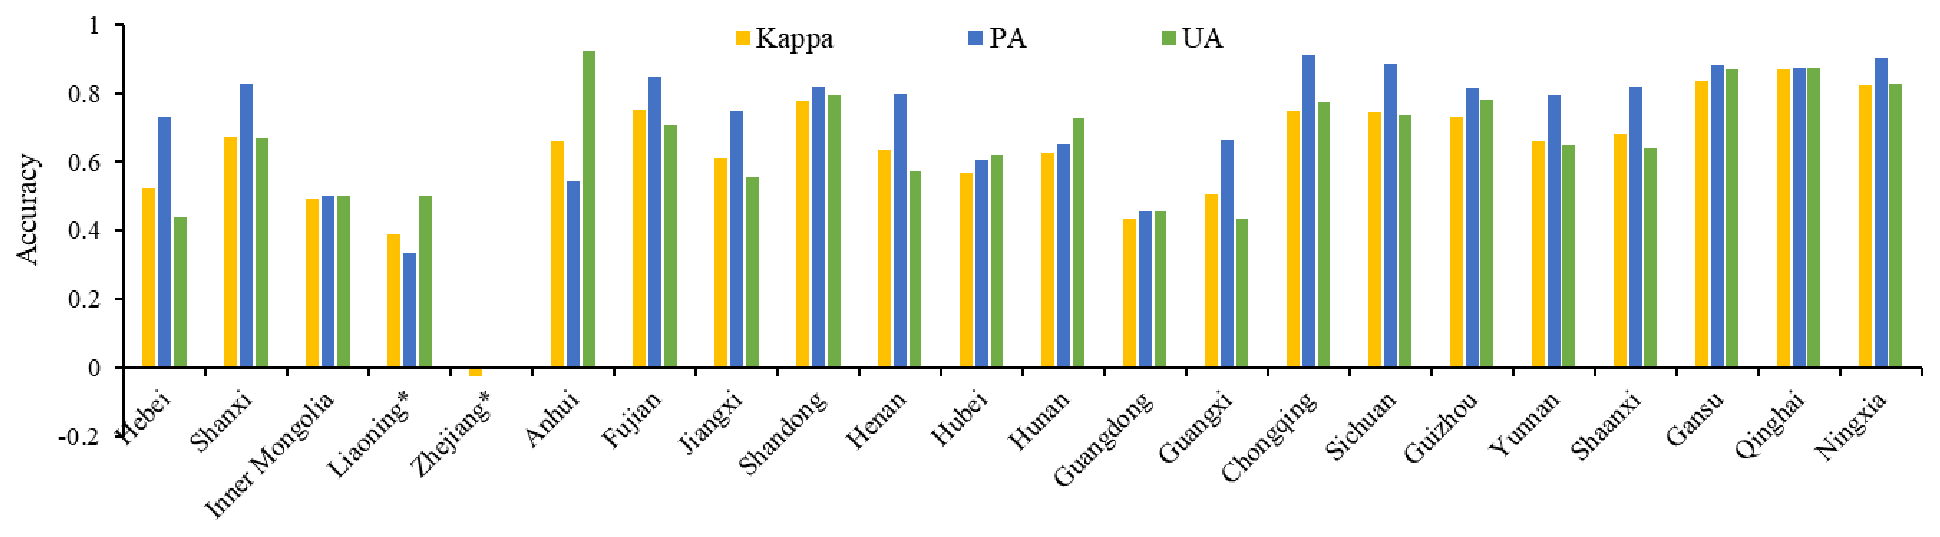
A total of 15 out of 22 assessed provinces had kappa greater than 0.6. Three northwestern provinces (Qinghai, Gansu, and Ningxia) achieved the highest kappa values; the wide terraces there were easier to identify. Shandong and Fujian also had relatively high kappa values, which are 0.78 and 0.75, respectively. Kappa values in the provinces of southwestern China and the Loess Plateau reached 0.7 except Shaanxi, Shanxi, and Yunnan, where the relatively lower accuracies were caused by the confusion with sloping cropland and non-crop vegetation types. Two of the lowest kappa values were for Liaoning and Zhejiang and were thus likely also to be influenced by the insufficient test samples. Moreover, kappa values of Guangdong, Inner Mongolia, Guangxi, and Hebei were also low. In these poorly classified provinces, commission errors predominated in Guangxi and Hebei, and both omission errors and commission errors were numerous in Zhejiang, Liaoning, Guangdong, and Inner Mongolia. Moreover, PA was higher than UA in most provinces, indicating overestimation was more serious than underestimation in general. Anhui was an exception, where omission errors were much higher because of the large proportion of low-slope terraces.
3.4.4 Pixel-level uncertainty
The random forest classifier can provide information on the pixel-level uncertainty based on the classification probability of the pixel being terraced or not. The classification uncertainty of a pixel was calculated by 1−Pmax, where Pmax was the maximum probability of being classified as terrace class and non-terrace class (Loosvelt et al., 2012). As shown in Fig. 9, the regions with the lowest uncertainty were the plains of China. Moreover, the Loess Plateau and southwestern China with large area of terraces also had relatively low uncertainty. The terraces and non-terraces there had different features in relation to each other. Thus, the classification model performed well. In contrast, the pixel-level uncertainty was higher in the southern, eastern-central, and part of the northeastern region. Here, the terraces had heterogeneous features, and some features are similar to some non-terraces, leading to the classification uncertainty. These are important sources of uncertainty that need to be addressed in future research. Although the pixel-level uncertainty results generally corresponded well with the above general accuracy evaluation results, there were some differences. In some regions with high accuracy, the pixel-level uncertainty can also be relatively high (such as northeastern Inner Mongolia, Jianghan Plain), and some low-accuracy regions can also have low pixel-level uncertainty (such as some misclassified areas in southeastern China and the Loess Plateau), which may be influenced by the small number or confused features of training samples in these regions.
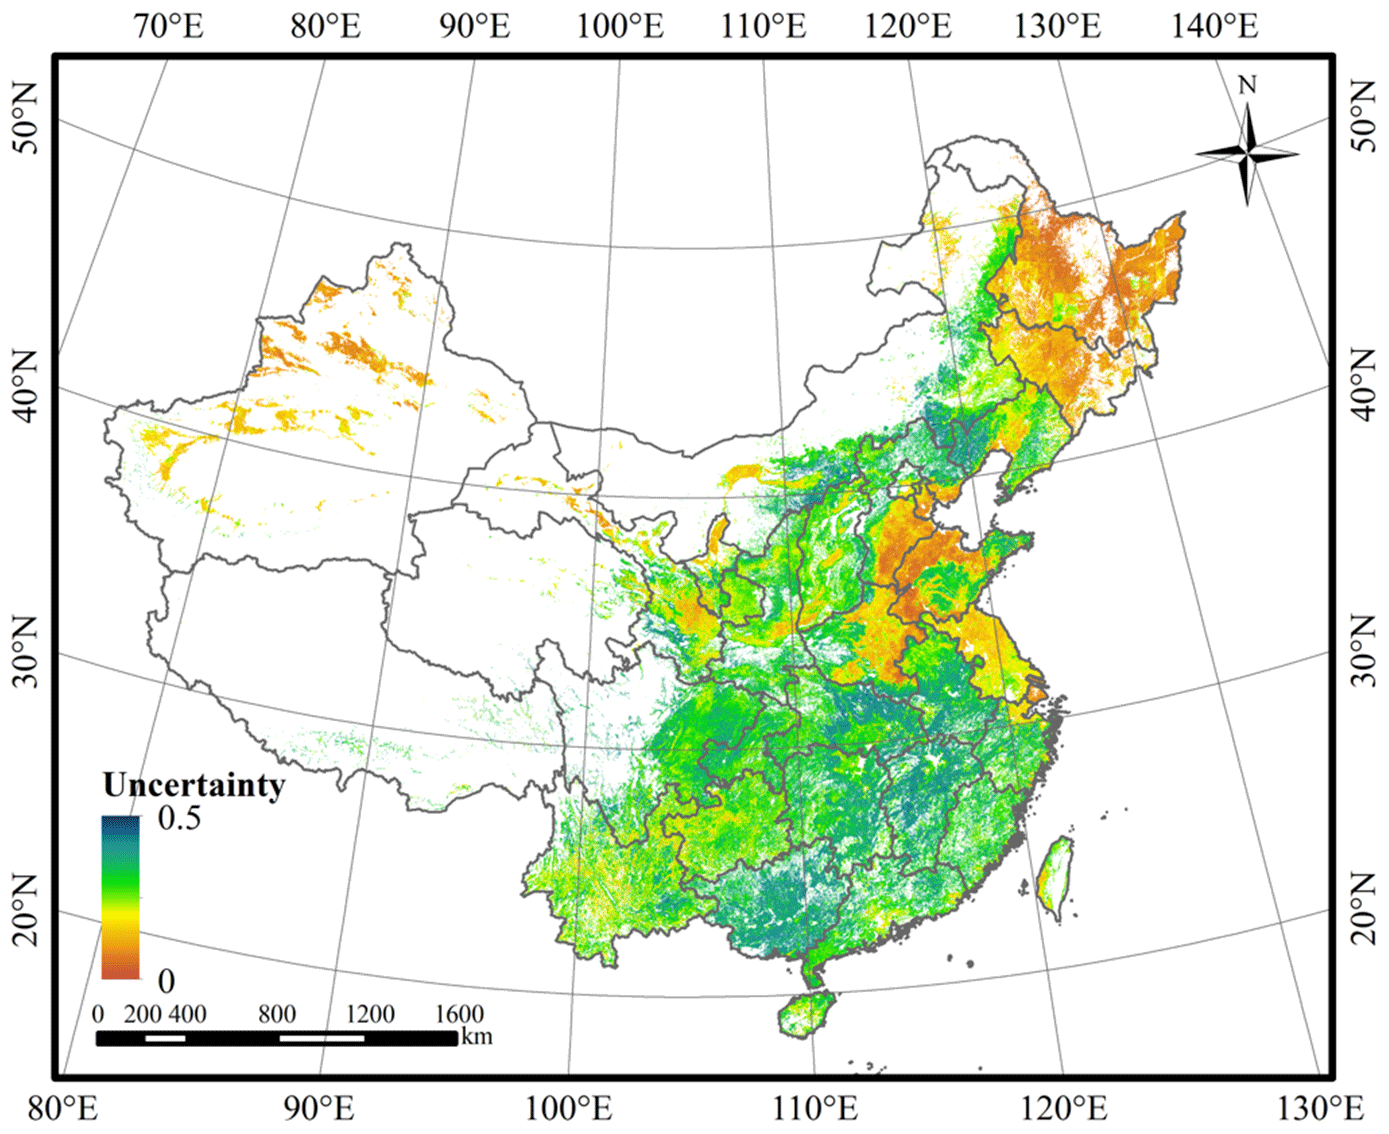
Figure 9Pixel-level uncertainty of terrace mapping results. The uncertainty map was resampled to 1 km × 1 km spatial resolution.
3.5 Feature importance evaluation
Identification of the most important features for terrace mapping is significant for further studies. The feature importance can be evaluated by the decrease in some impurity measures, such as Gini index (Louppe et al., 2013). It is related to the training samples, in which different training sample sets used to train the random forest model can obtain different importance results. To achieve a stable and reliable feature importance ranking, the importance values based on the various training sample sets for different provinces were first acquired, and then their mean and standard deviation were calculated (Fig. 10).
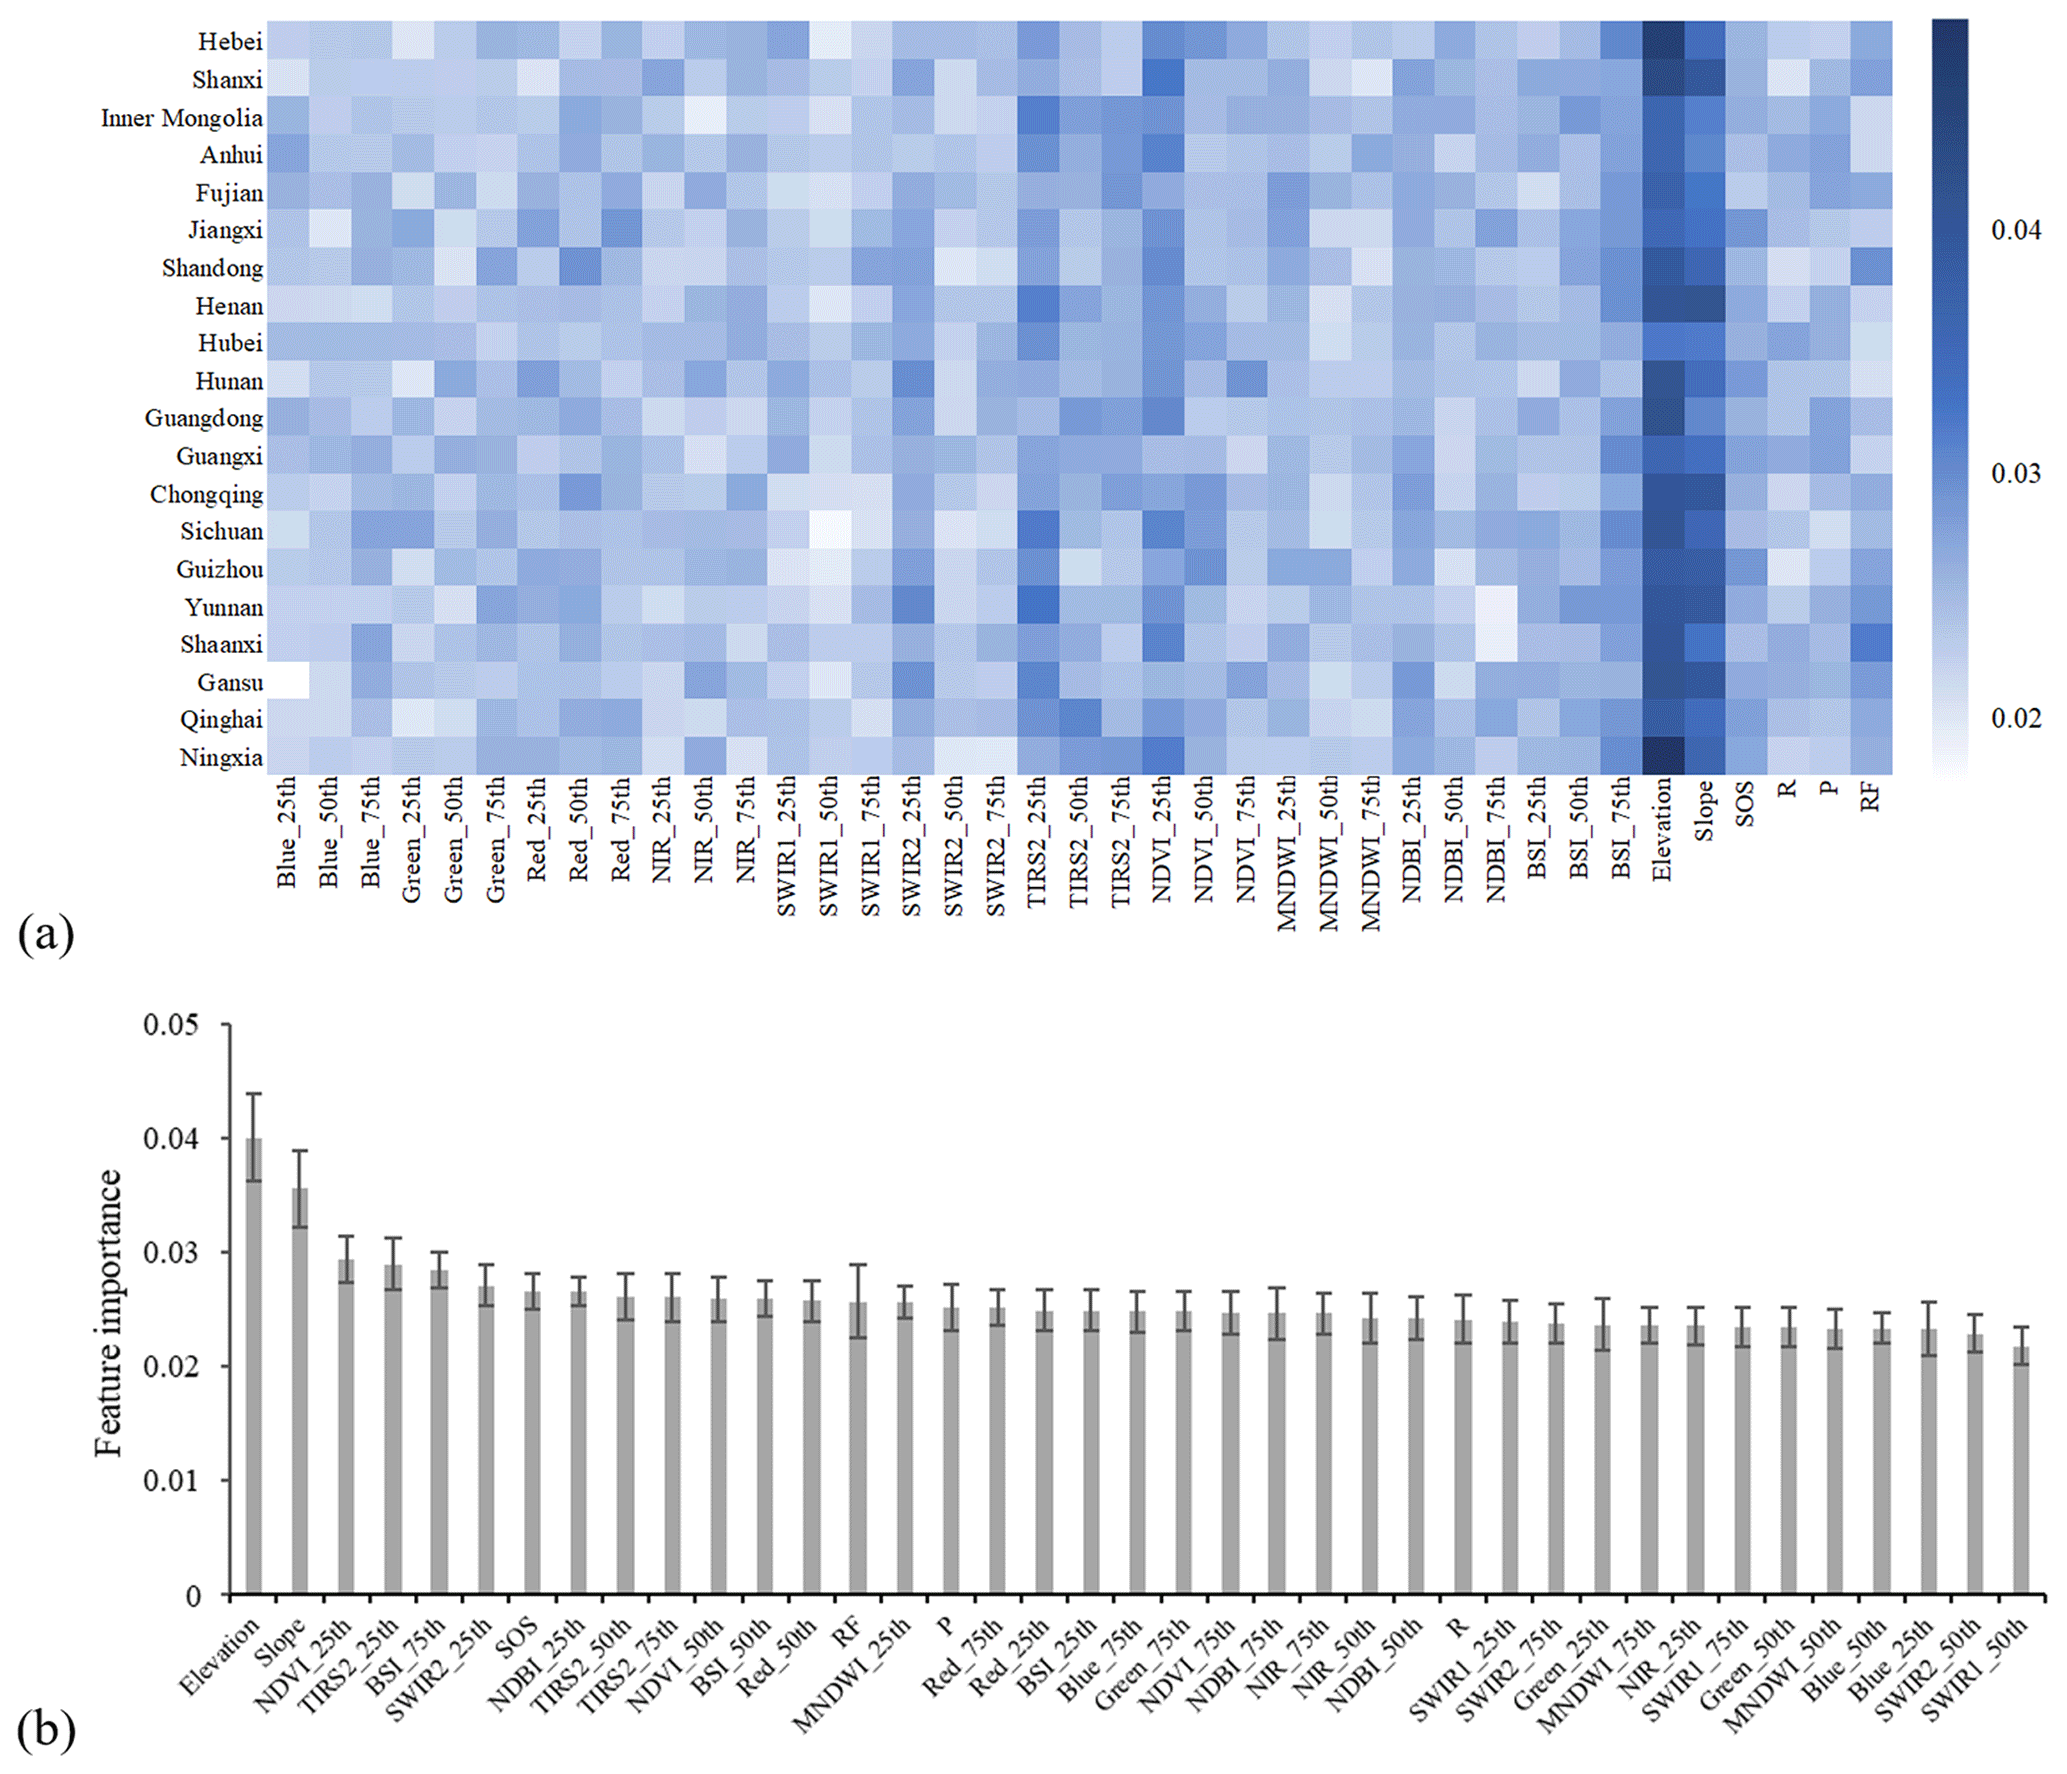
Figure 10(a) Feature importance value for different provinces and (b) average feature importance of provinces. The error bars indicate the standard deviation. The variable names were explained in Table 5.
According to Fig. 10a, most provinces show a similar feature importance pattern under our sample collection strategy. Elevation and slope had the greatest contribution to the final decision in nearly all the provinces, confirming that topographic characteristics are crucial factors for identifying terraces. In general, there were distinguishable differences between the elevation range or slope range of the terraces and those of the non-terraces. The importance of the two features was relatively low in the provinces with lots of sloping cropland or low-slope terraces. In addition to elevation and slope information, multi-temporal spectral features are necessary. For most provinces, NDVI_25th, TIRS2_25th, and BSI_75th were essential features in terrace mapping. However, there were several optical band percentiles (e.g., SWIR1_50th and SWIR2_50th) showing low importance almost in all provinces. These variables contribute little to terrace/non-terrace classification and can be removed in future studies to reduce feature dimensions and improve classification efficiency. Moreover, some features such as RF and Blue_25th displayed different importance patterns in various provinces. Therefore, the decision on whether to include these features depends on the study area.
Figure 10b shows a summary of the feature importance of terrace/non-terrace classification. Elevation ranked first, followed by slope, and their importance values were more than 20 % of the third-place feature (NDVI_25th). The top 10 features included three topographic factors (elevation, slope, and SOS), three percentiles of indexes (NDVI_25th, BSI_75th, and NDBI_25th), and four percentiles of bands (TIRS2_25th, SWIR2_25th, TIRS2_50th, and TIRS2_75th), indicating that multisource and multi-temporal features are indispensable; the integration can increase the separability and guarantee classification accuracy across different terrace landscapes. In contrast, the categories of the least important features were more consistent. A total of 8 of the last 10 features were all percentiles of bands. For the standard deviation, in addition to elevation and slope, RF and Blue_25th also had high values, implying that the importance values of these features varied greatly among different provinces.
3.6 Limitations and directions for future research
Our terrace map achieved satisfactory accuracy and good visual effect as a whole over all of China and different provinces, indicating that the terraces and non-terraces can be distinguished using 30 m resolution satellite imagery and supervised pixel-based classification. Figure 11a and b present two accurately identified cases from the terrace map. They were located in Gansu and Sichuan, with lots of terraces. It was easy to recognize them based on the Landsat images. In some other provinces, it was also easy to recognize differences between terraced and non-terraced cropland generally (Fig. 12). In our map, almost all terraces with distinctive features and large patch areas were identified well, suggesting our classification method can deal with them effectively. Here, we also quantitatively demonstrated the rationality and validity of feature selection and sampling strategy in the study. To further illustrate the usefulness of all the 39 features selected in the study, we took a terraced cropland-dominated province (Guizhou) and a non-terraced cropland-dominated province (Hubei) as examples to train the classification model based on different feature numbers and evaluate the accuracy. According to Fig. 13, OA generally showed an upward and gradually stable trend as the feature number increased in both provinces, the maximum values being reached when using 35 features in Guizhou and 39 features in Hubei, indicating features were not redundant. Therefore, we applied all features in this study. As for the sampling strategy, to further clarify the effectiveness of the national and regional training samples in the study, we compared the accuracies of classification through only using local training samples and through using national, regional and local training samples in the provinces where both local terrace and local non-terrace training sample sizes were more than 10 (Anhui, Beijing, Chongqing, Fujian, Guangdong, Guangxi, Hainan, Hebei, Henan, Hubei, Hunan, Inner Mongolia, Jiangsu, Jiangxi, Liaoning, Qinghai, Shaanxi, Shanxi, Sichuan, Taiwan, Tianjin, and Zhejiang). On the whole, adding the national and regional samples increased OA by 6.90 % in these provinces, proving our sampling strategy in the study is reliable and can be applied to other large-scale researches. However, there are still a number of limitations and difficulties in the terrace/non-terrace classification field, which are expected to be explored by future research.
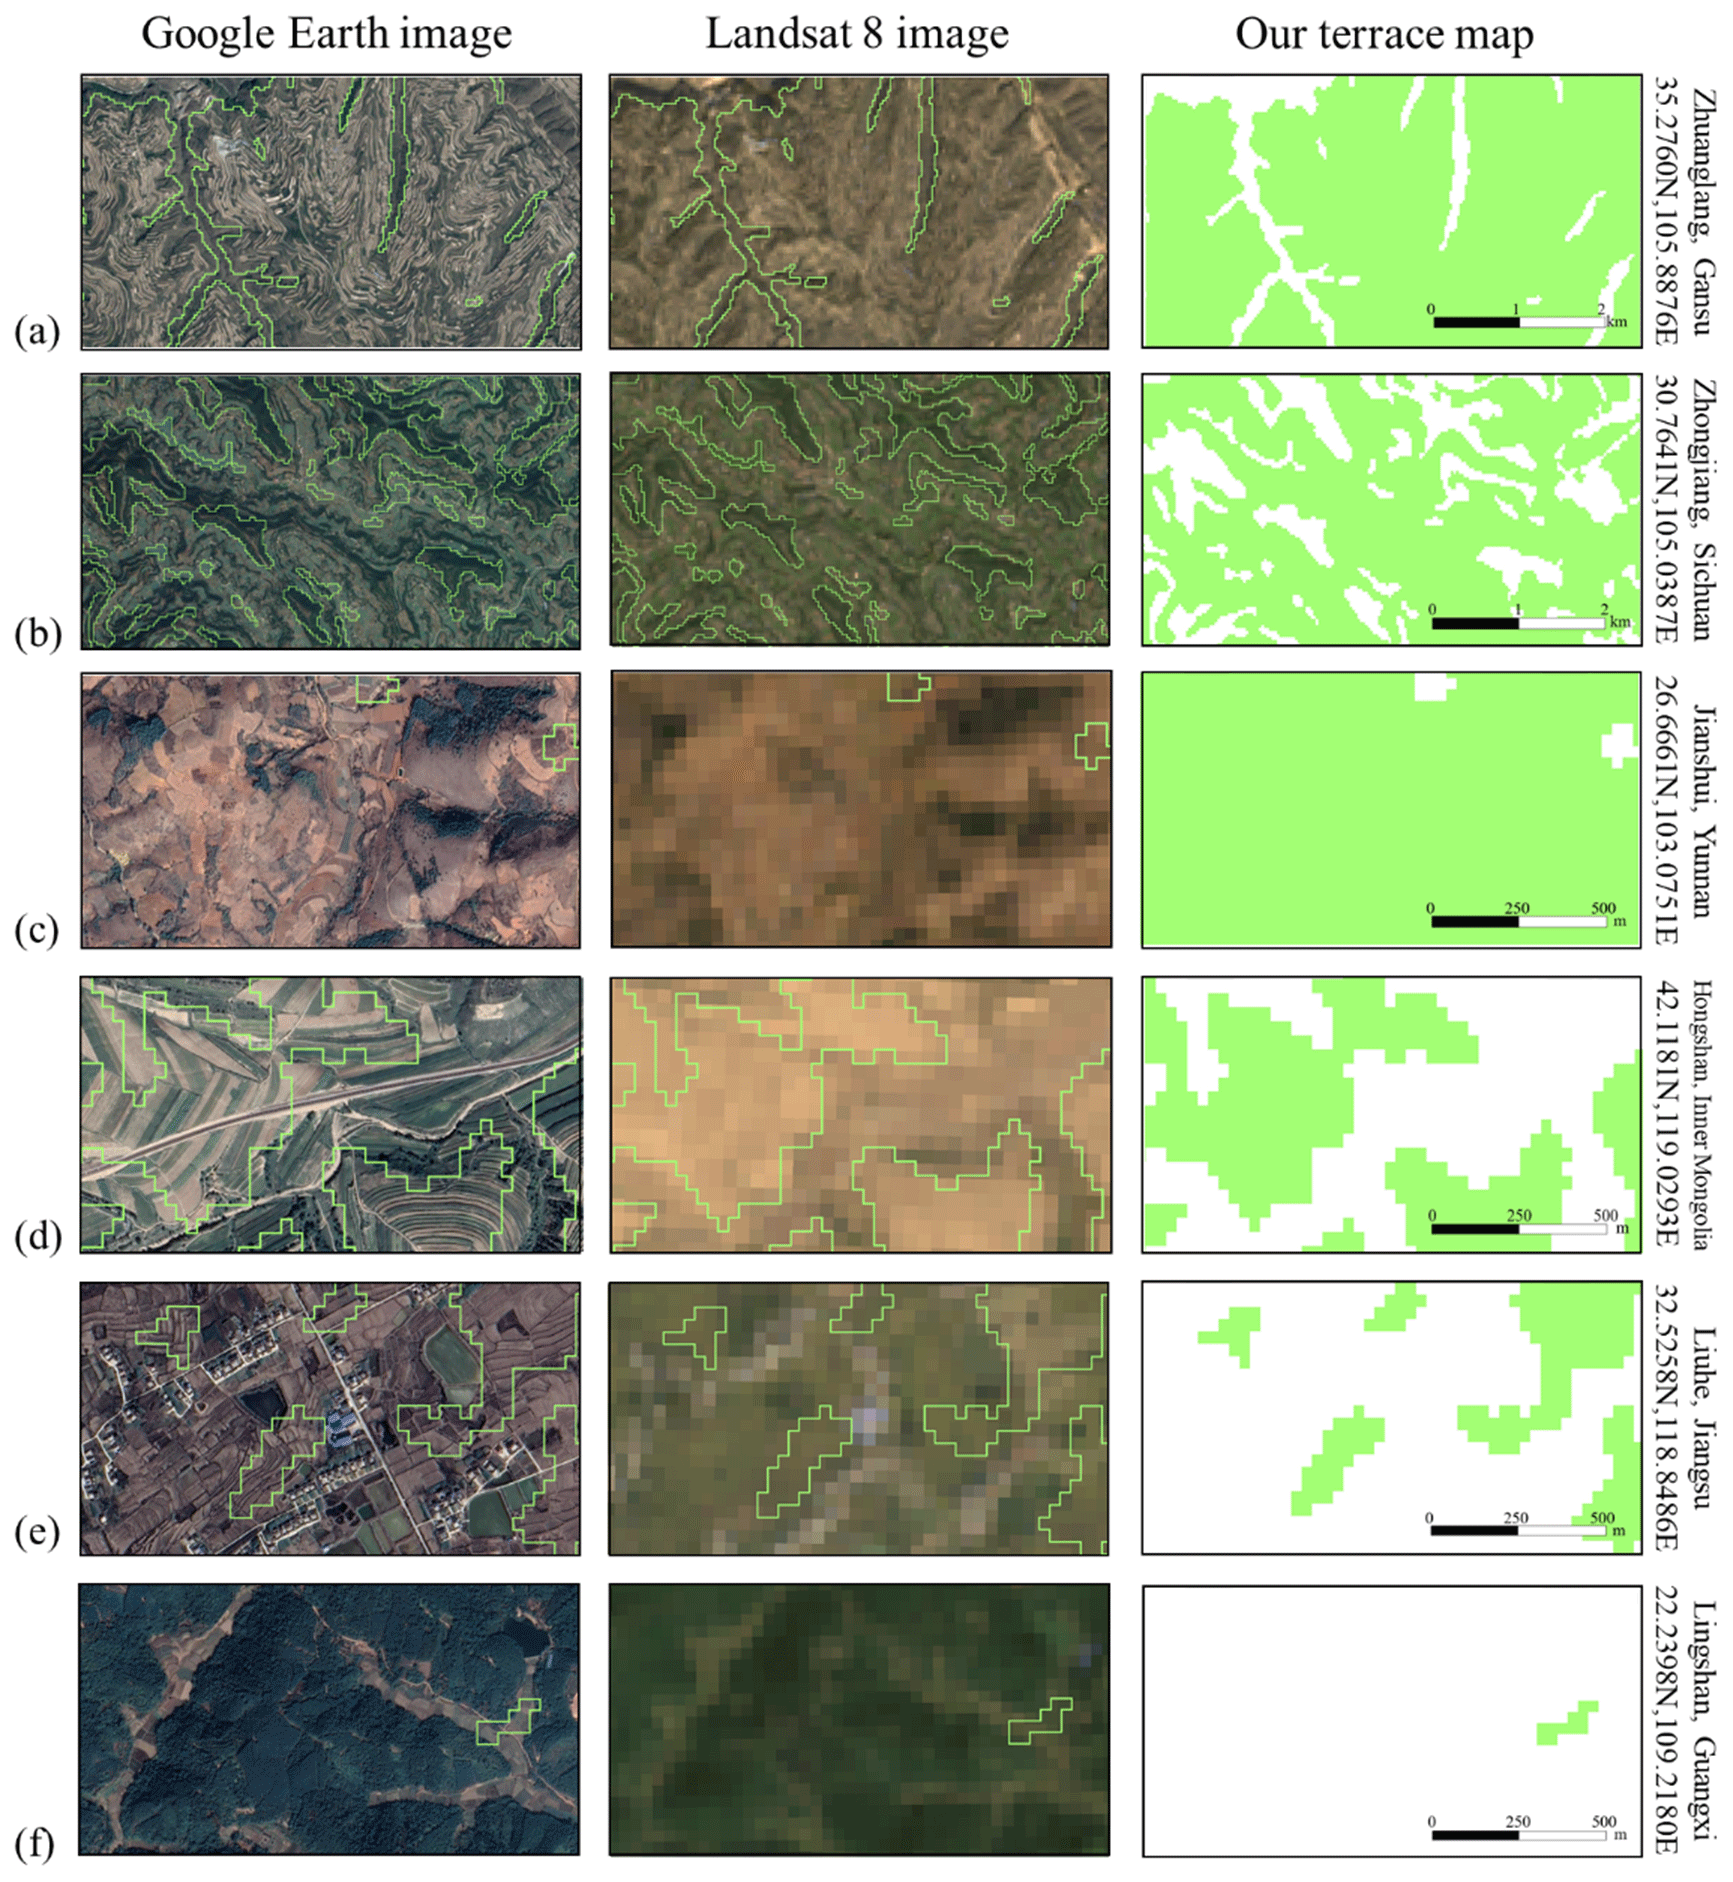
Figure 11Selected case comparison of © Google Earth images, Landsat 8 images, and our terrace map (green represents terrace and white represents non-terrace) at six different locations (a–f). Panels (a) and (b) are well-classified cases, and (c)–(f) are poorly classified cases. Note that they have different scales indicated on the right-hand plots. The green lines in Google Earth images and Landsat 8 images are the corresponding terrace boundaries in our terrace map. The geographic coordinate indicates the image center.
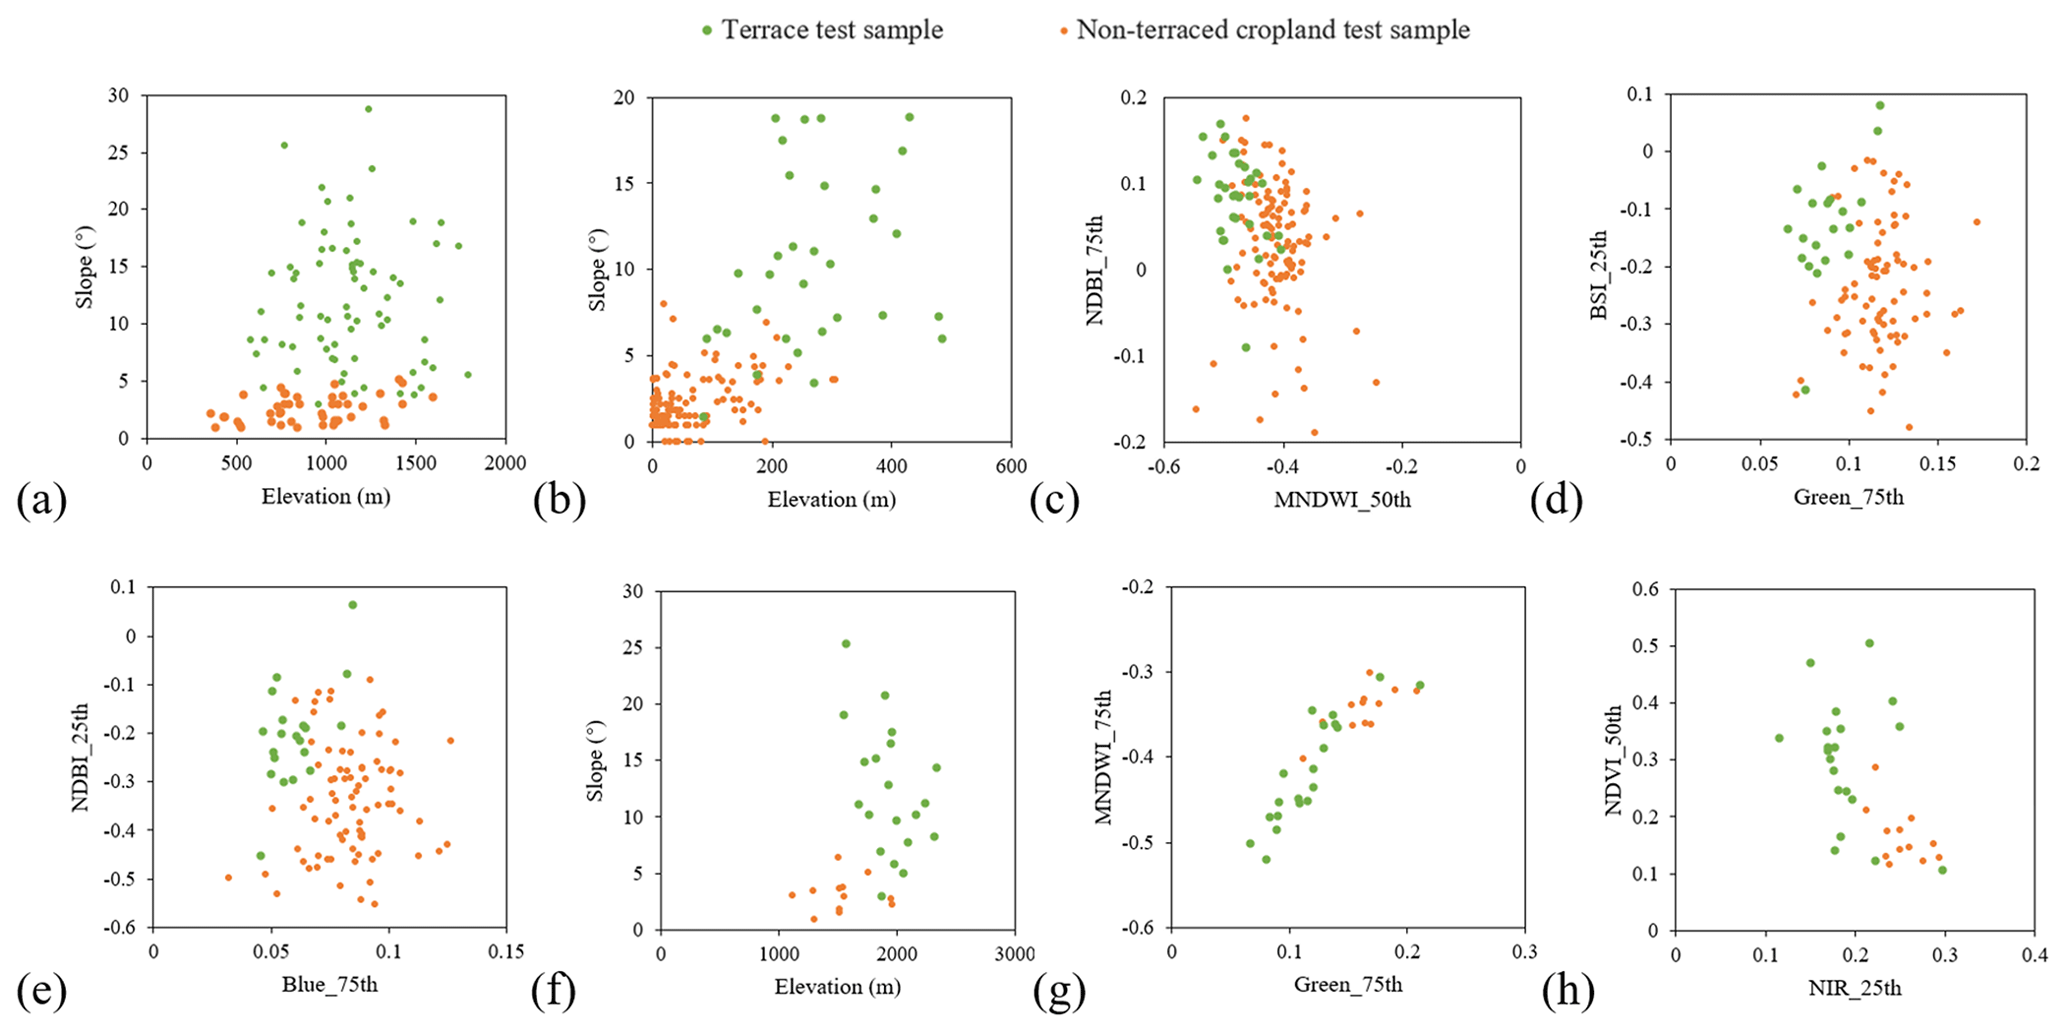
Figure 12Scatter plots for distinct features of terrace test samples and non-terraced cropland test samples in four provinces: (a) Shanxi, (b–c) Shandong, (d–e) Henan, and (f–h) Ningxia.
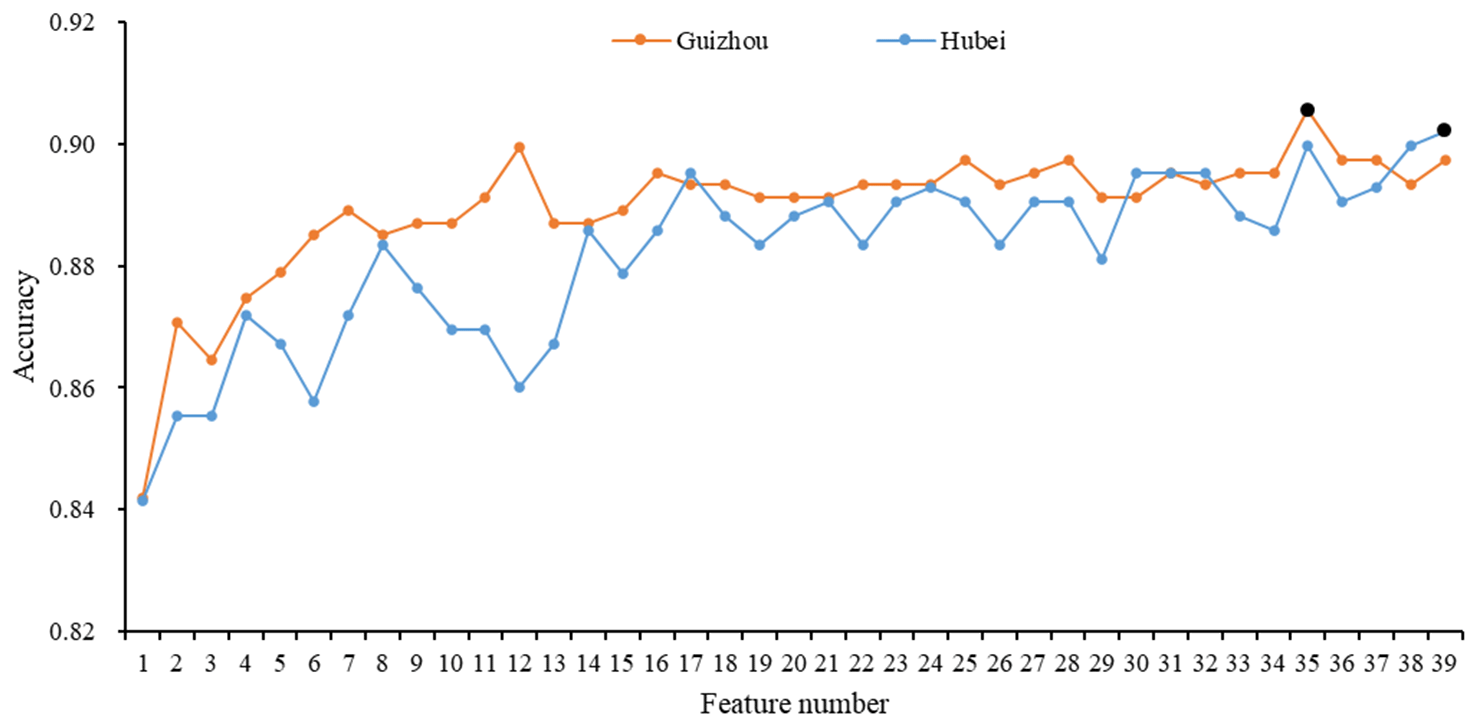
Figure 13OA for using different feature numbers in Guizhou and Hubei. The feature addition order along the horizontal axis is identical to the feature importance ranking of the province. The maximum value of accuracy is marked in black.
First, difficulties in terrace feature characterization hinder the identification. Terrace types varied across our large-scale study area, causing the spectral and topographic information from different terrace classes to vary considerably. Moreover, some terraces shared similar features with non-terraced cropland. Feature heterogeneity of different terraces and feature similarities of terraces and other land covers increased the difficulties of characterization, thus causing some typical confusion between classes, for instance, terraces and sloping cropland (Fig. 11c), terraces and strip planting (Fig. 11d), and low-slope terraces and flat cropland (Fig. 11e). In some regions, there are no apparent differences between the above terraces and non-terraces in the extracted spectral features and topographic features. The only difference between them is whether or not there are steps; however, this cannot easily be depicted by the pixel-based classification at 30 m resolution. Steps divide the continuous terrace landscape into an array of regularly sized pixels with similar features, exhibiting strong spatial autocorrelation in high-resolution remote sensing images which can be incorporated into the classification through the computation of texture measures. Several studies on land cover mapping have shown that adding textural variables can increase the mapping accuracy (Johansen et al., 2007; Masjedi et al., 2016; Rodriguez-Galiano et al., 2012). Moreover, some small-scale research has shown the effectiveness of textures in terrace/non-terrace classification (Li et al., 2013; Luo et al., 2020; Zhang et al., 2017). The ability of textures to discriminate different land cover types relates to the image spatial resolution (Chen et al., 2004). High-resolution images are required to extract texture information for terraces. Compared with the pixel-based method which only uses the direct pixel feature information alone, the object-based method aggregates a group of pixels together as an object and integrates its spatial, textural, and contextual information (Liu and Xia, 2010). For some land cover types, object-based classification has proven to be a better approach (Myint et al., 2011; Pande-Chhetri et al., 2017). Terraces are also suitable to be treated as patches. Single pixels of some terraces show no distinct features; however, the large set of characteristics for the entire terrace patch can be identified easily. The object-based classification method has also been testified in some small study areas (Diaz-Varela et al., 2014; Zhao et al., 2017). However, the parameter setting of the method is difficult for large-scale classification because different study areas usually require different parameter values to gain optimal results. So, it can be used as an optimization method in low-precision regions. Although automatic classification is prevalent and shows good performance in the classification field, it is still unsuitable for regions with a confusing landscape. In such cases, visual interpretation can be used as an assistant method. The combination of digital classification and visual interpretation has been found to increase the accuracy significantly (Raši et al., 2011; Shalaby and Tateishi, 2007). Thus, for regions with features that confuse the automatic classification system in terrace mapping, visual interpretation can be applied to provide more reliable results. In summary, combining texture features from high-resolution images and conducting object-based classification and visual interpretation in poorly classified regions are worth attempting in future research.
Second, the irregular shape and small patch size of terraces make the classification more difficult. Mixed pixels are common in medium-resolution images because of the spatial-resolution limitations and spectral heterogeneity (Fisher, 1997). This phenomenon is especially severe in terrace/non-terrace classification. The use of 30 m Landsat data in this research ensures that terraces with large areas can be detected. However, with data of this resolution it is not possible to correctly classify fragmented terrace patches (Fig. 11f). Moreover, the proportion of terraces within a pixel can cause overestimation or underestimation. Higher-resolution images can generate a more accurate classification. To better capture these small and irregular terraces, satellite images with a finer resolution are necessary. However, the hard classification (i.e., classification which gives the discrete class of land cover) will still have this problem even if the resolution is higher. Discrete classes cannot represent spatially complex areas well. In recent years, some classification studies have produced continuous fractions of land cover at the pixel scale through unmixing to address subpixel heterogeneity (Atzberger and Rembold, 2013; Deng and Wu, 2013; Xie et al., 2016). Therefore, to tackle the mixed pixel issue, future work should focus on improving the image resolution or the estimation of subpixel terrace distribution.
In addition to the above difficulties in terrace identification, both the terrain data (SRTM data) and the cropland extent data extracted from GlobeLand30 caused some limitations in the mapping results. On the one hand, the inconsistent year of terrain data and classification led to the uncertainties. Terrain may change due to land use and/or cover transformations during 2010–2018. However, relative to the vertical accuracy of terrain data, most transformations had little impact on terrain. Even if terrain changed significantly somewhere during the 8 years, the spectral features in 2018 can help with classification, and the satisfactory accuracy of our terrace map also indicated that the assumption of little terrain change was acceptable. But there is no doubt that better results could be achieved if high-resolution and high-precision terrain data in 2018 were available. On the other hand, the errors in the cropland extent data propagated into our terrace map. The omitted cropland led to some omission errors in terrace mapping. Moreover, the commission errors in the cropland extent data led to some uncertainties. Some abandoned terraces and terraces used for reforestation or afforestation in the cropland extent data were classified as terraces, and even some non-cropland vegetation not on the terraces and a few other objects near or on the terraces caused part of the commission errors. Furthermore, the non-correspondence of cropland extent data year and terrace/non-terrace classification year also had an impact on the results. Compared to using a cropland map from 2018, the major limitation of using a cropland map from 2010 is that some terraces located in the newly increased cropland area will be omitted. We quantified the omission caused by the cropland mask using the test samples. Only 119 of the total 1092 terrace test samples were located outside the cropland extent of GlobeLand30 2010, indicating that the maximum possible omission errors caused by the non-corresponding year was 10.90 %. These uncertainties can be avoided by using accurate cropland extent data. However, we had tried several other sources of the best cropland-extent data at present to limit the classification area, such as cropland of National Land Cover Database for China (NLCD-C) (Zhang et al., 2014) and Global Food Security-support Analysis Data at 30 m (GFSAD30) (Teluguntla et al., 2017), but the results were worse compared to using the GlobeLand30. We had also tried to use the high-accuracy China forest map (Li et al., 2014) to mask the reforestation or afforestation terraces and some misclassified forests, but the accuracy of terrace identification decreased due to the errors in the forest map. Thus, more accurate cropland extent data and forest extent data are urgently needed to deal with this problem.
The China terrace proportion map at 1 km resolution (calculated from 30 m resolution map) is available to the public at https://doi.org/10.5281/zenodo.3895585 (Cao et al., 2020). The map values indicate the proportion of terraces within 1 km×1 km grid cell. The China terrace map at 30 m resolution will be available after publication.
The Landsat 8 SR imagery and SRTM DEM data used in this study were available at the GEE platform. The GlobeLand30 data can be downloaded from http://www.globeland30.org (Chen et al., 2014).
In this study, the first 30 m resolution terrace map of China was developed through supervised pixel-based classification using multisource, multi-temporal data based on the Google Earth Engine (GEE) platform. The overall accuracy (OA) was 94.73 %, and kappa was 0.7235, indicating that the supervised pixel-based classification at 30 m resolution was generally feasible for large-scale terrace mapping. The classification achieved the highest accuracy in southwestern China and the Loess Plateau. The sloping cropland (non-terrace cropland with a slope of ≥ 5∘), low-slope terraces, and non-crop vegetation caused the most errors in the mapping results. Zhejiang, Liaoning, Guangdong, Inner Mongolia, and Guangxi were the five provinces with the lowest accuracy. According to our map, terraces are widely distributed in China, and most are built in southwestern China and the Loess Plateau. The total terrace area was estimated to be 58.46±2.99 Mha by the error-matrix-based model-assisted estimation (EM) method, accounting for 28.85 % ± 1.48 % of China's cropland area. Feature importance analysis indicated that elevation and slope were the most important features for terrace identification, but time-series spectral features were also necessary to achieve satisfactory results. The intra-class feature heterogeneity, interclass feature similarity, and fragmented patches make identifying terraces challenging. Thus, future research should focus on better characterizing terrace features and recognizing small patch terraces. This novel terracing map can be used for large-scale soil erosion and carbon cycle studies, as well as for assessments of multiple ecosystem services of terracing. The terrace identification tool can be extended to other regions globally but will need to be validated for those regions as terrace types can differ significantly.
BC and LY conceived the study. All authors (BC, LY, VN, PC, WL, YZ, WW, DC, ZL, and PG) contributed to the discussions, writing, and analysis of the manuscript.
The authors declare that they have no conflict of interest.
This research has been supported by the National Key R&D Program of China (grant nos. 2019YFC1510003, 2017YFA0604401, and 2019YFA0606601).
This paper was edited by David Carlson and reviewed by two anonymous referees.
Atzberger, C. and Rembold, F.: Mapping the spatial distribution of winter crops at sub-pixel level using AVHRR NDVI time series and neural nets, Remote Sens., 5, 1335–1354, https://doi.org/10.3390/rs5031335, 2013.
Bargiel, D.: A new method for crop classification combining time series of radar images and crop phenology information, Remote Sens. Environ., 198, 369–383, https://doi.org/10.1016/j.rse.2017.06.022, 2017.
Biradar, C. M. and Xiao, X.: Quantifying the area and spatial distribution of double- and triple-cropping croplands in India with multi-temporal MODIS imagery in 2005, Int. J. Remote Sens., 32, 367–386, https://doi.org/10.1080/01431160903464179, 2011.
Breiman, L.: Random forests, Mach. Learn., 45, 5–32, https://doi.org/10.1023/A:1010933404324, 2001.
Cao, B., Yu, L., Naipal, V., Ciais, P., Li, W., Zhao, Y., Wei, W., Chen, D., Liu, Z., and Gong, P.: A 30-meter terrace mapping in China using Landsat 8 imagery and digital elevation model based on the Google Earth Engine, Zenodo [data set], https://doi.org/10.5281/zenodo.3895585, 2020.
Chen, B., Xiao, X., Li, X., Pan, L., Doughty, R., Ma, J., Dong, J., Qin, Y., Zhao, B., Wu, Z., Sun, R., Lan, G., Xie, G., Clinton, N., and Giri, C.: A mangrove forest map of China in 2015: Analysis of time series Landsat 7/8 and Sentinel-1A imagery in Google Earth Engine cloud computing platform, ISPRS J. Photogramm. Remote Sens., 131, 104–140, https://doi.org/10.1016/j.isprsjprs.2017.07.011, 2017.
Chen, D., Stow, D. A., and Gong, P.: Examining the effect of spatial resolution and texture window size on classification accuracy: An urban environment case, Int. J. Remote Sens., 25, 2177–2192, https://doi.org/10.1080/01431160310001618464, 2004.
Chen, D., Wei, W., Daryanto, S., and Tarolli, P.: Does terracing enhance soil organic carbon sequestration? A national-scale data analysis in China, Sci. Total Environ., 721, 137751, https://doi.org/10.1016/j.scitotenv.2020.137751, 2020.
Chen, J., Ban, Y., and Li, S.: China: Open access to Earth land-cover map, Nature, 514, 434–434, https://doi.org/10.1038/514434c, 2014 (data available at: http://www.globeland30.org).
Chen, J., Chen, J., Liao, A., Cao, X., Chen, L., Chen, X., He, C., Han, G., Peng, S., Lu, M., Zhang, W., Tong, X., and Mills, J.: Global land cover mapping at 30 m resolution: A POK-based operational approach, ISPRS J. Photogramm, Remote Sens., 103, 7–27, https://doi.org/10.1016/j.isprsjprs.2014.09.002, 2015.
Chen, J., Liao, A., Chen, J., Peng, S., Chen, L., and Zhang, H.: 30-meter global land cover data product-GlobeLand30, Geomatics World, 24, 1–8, https://doi.org/10.3969/j.issn.1672-1586.2017.01.002, 2017.
Cheng, W., Gao, X., Ma, T., Xu, X., Chen, Y., and Zhou, C.: Spatial-temporal distribution of cropland in China based on geomorphologic regionalization during 1990–2015, Dili Xuebao/Acta Geogr. Sin., 73, 1613–1629, https://doi.org/10.11821/dlxb201809001, 2018.
Chow, T. L., Rees, H. W., and Daigle, J. L.: Effectiveness of terraces/grassed waterway systems for soil and water conservation: A field evaluation, J. Soil Water Conserv., 54, 577–583, https://doi.org/10.1016/S0016-7061(98)00046-9, 1999.
Cohen, J.: A Coefficient of Agreement for Nominal Scales, Educ. Psychol. Meas., 20, 37–46, https://doi.org/10.1177/001316446002000104, 1960.
Deng, C. and Wu, C.: A spatially adaptive spectral mixture analysis for mapping subpixel urban impervious surface distribution, Remote Sens. Environ., 133, 62–70, https://doi.org/10.1016/j.rse.2013.02.005, 2013.
Diaz-Varela, R. A., Zarco-Tejada, P. J., Angileri, V., and Loudjani, P.: Automatic identification of agricultural terraces through object-oriented analysis of very high resolution DSMs and multispectral imagery obtained from an unmanned aerial vehicle, J. Environ. Manage., 134, 117–126, https://doi.org/10.1016/j.jenvman.2014.01.006, 2014.
Estel, S., Kuemmerle, T., Alcántara, C., Levers, C., Prishchepov, A., and Hostert, P.: Mapping farmland abandonment and recultivation across Europe using MODIS NDVI time series, Remote Sens. Environ., 163, 312–325, https://doi.org/10.1016/j.rse.2015.03.028, 2015.
Farr, T. G., Rosen, P. A., Caro, E., Crippen, R., Duren, R., Hensley, S., Kobrick, M., Paller, M., Rodriguez, E., Roth, L., Seal, D., Shaffer, S., Shimada, J., Umland, J., Werner, M., Oskin, M., Burbank, D., and Alsdorf, D. E.: The shuttle radar topography mission, Rev. Geophys., 45, RG2004, https://doi.org/10.1029/2005RG000183, 2007.
Faulkner, H., Ruiz, J., Zukowskyj, P., and Downward, S.: Erosion risk associated with rapid and extensive agricultural clearances on dispersive materials in southeast Spain, Environ. Sci. Policy, 6, 115–127, https://doi.org/10.1016/S1462-9011(02)00126-0, 2003.
Fisher, P.: The pixel: A snare and a delusion, Int. J. Remote Sens., 18, 679–685, https://doi.org/10.1080/014311697219015, 1997.
Fu, B.: Soil erosion and its control in the Loess Plateau of China, Soil Use Manag., 5, 76–82, https://doi.org/10.1111/j.1475-2743.1989.tb00765.x, 1989.
Gislason, P. O., Benediktsson, J. A., and Sveinsson, J. R.: Random forests for land cover classification, Pattern Recog. Lett., 27, 294–300, https://doi.org/10.1016/j.patrec.2005.08.011, 2006.
Gong, P., Wang, J., Yu, L., Zhao, Y., Zhao, Y., Liang, L., Niu, Z., Huang, X., Fu, H., Liu, S., Li, C., Li, X., Fu, W., Liu, C., Xu, Y., Wang, X., Cheng, Q., Hu, L., Yao, W., Zhang, H., Zhu, P., Zhao, Z., Zhang, H., Zheng, Y., Ji, L., Zhang, Y., Chen, H., Yan, A., Guo, J., Yu, L., Wang, L., Liu, X., Shi, T., Zhu, M., Chen, Y., Yang, G., Tang, P., Xu, B., Giri, C., Clinton, N., Zhu, Z., Chen, J., and Chen, J.: Finer resolution observation and monitoring of global land cover: First mapping results with Landsat TM and ETM+ data, Int. J. Remote Sens., 34, 2607–2654, https://doi.org/10.1080/01431161.2012.748992, 2013.
Gorelick, N., Hancher, M., Dixon, M., Ilyushchenko, S., Thau, D., and Moore, R.: Google Earth Engine: Planetary-scale geospatial analysis for everyone, Remote Sens. Environ., 202, 18–27, https://doi.org/10.1016/j.rse.2017.06.031, 2017.
Gumma, M. K., Thenkabail, P. S., Teluguntla, P. G., Oliphant, A., Xiong, J., Giri, C., Pyla, V., Dixit, S., and Whitbread, A. M.: Agricultural cropland extent and areas of South Asia derived using Landsat satellite 30-m time-series big-data using random forest machine learning algorithms on the Google Earth Engine cloud, GIScience Remote Sens., 57, 302–322, https://doi.org/10.1080/15481603.2019.1690780, 2020.
Homburg, J. A. and Sandor, J. A.: Anthropogenic effects on soil quality of ancient agricultural systems of the American Southwest, Catena, 85, 144–154, https://doi.org/10.1016/j.catena.2010.08.005, 2011.
Hughes, G. F.: On the Mean Accuracy of Statistical Pattern Recognizers, IEEE T. Inform. Theory, 14, 55–63, https://doi.org/10.1109/TIT.1968.1054102, 1968.
Jia, K., Liang, S., Zhang, N., Wei, X., Gu, X., Zhao, X., Yao, Y., and Xie, X.: Land cover classification of finer resolution remote sensing data integrating temporal features from time series coarser resolution data, ISPRS J. Photogramm. Remote Sens., 93, 49–55, https://doi.org/10.1016/j.isprsjprs.2014.04.004, 2014.
Jin, N., Tao, B., Ren, W., Feng, M., Sun, R., He, L., Zhuang, W., and Yu, Q.: Mapping irrigated and rainfed wheat areas using multi-temporal satellite data, Remote Sens., 8, 207, https://doi.org/10.3390/rs8030207, 2016.
Johansen, K., Coops, N. C., Gergel, S. E., and Stange, Y.: Application of high spatial resolution satellite imagery for riparian and forest ecosystem classification, Remote Sens. Environ., 110, 29–44, https://doi.org/10.1016/j.rse.2007.02.014, 2007.
Knight, J. F., Lunetta, R. S., Ediriwickrema, J., and Khorram, S.: Regional scale land cover characterization using MODIS-NDVI 250 m multi-temporal imagery: A phenology-based approach, GIScience Remote Sens., 43, 1–23, https://doi.org/10.2747/1548-1603.43.1.1, 2006.
Lasanta, T., Arnáez, J., Oserín, M., and Ortigosa, L. M.: Marginal Lands and Erosion in Terraced Fields in the Mediterranean Mountains, Mt. Res. Dev., 21, 69–76, https://doi.org/10.1659/0276-4741(2001)021[0069:mlaeit]2.0.co;2, 2001.
Li, C., Wang, J., Hu, L., Yu, L., Clinton, N., Huang, H., Yang, J., and Gong, P.: A circa 2010 thirty meter resolution forest map for China, Remote Sens., 6, 5325–5343, https://doi.org/10.3390/rs6065325, 2014.
Li, Y., Gong, J., Wang, D., An, L., and Li, R.: Sloping farmland identification using hierarchical classification in the Xi-He region of China, Int. J. Remote Sens., 34, 545–562, https://doi.org/10.1080/01431161.2012.715772, 2013.
Liu, D. and Xia, F.: Assessing object-based classification: Advantages and limitations, Remote Sens. Lett., 1, 187–194, https://doi.org/10.1080/01431161003743173, 2010.
Liu, X., He, B., Li, Z., Zhang, J., Wang, L., and Wang, Z.: Influence of land terracing on agricultural and ecological environment in the loess plateau regions of China, Environ. Earth Sci., 62, 797–807, https://doi.org/10.1007/s12665-010-0567-6, 2011.
Liu, X., Hu, G., Chen, Y., Li, X., Xu, X., Li, S., Pei, F., and Wang, S.: High-resolution multi-temporal mapping of global urban land using Landsat images based on the Google Earth Engine Platform, Remote Sens. Environ., 209, 227–239, https://doi.org/10.1016/j.rse.2018.02.055, 2018.
Loosvelt, L., Peters, J., Skriver, H., Lievens, H., Van Coillie, F. M. B., De Baets, B., and Verhoest, N. E. C.: Random Forests as a tool for estimating uncertainty at pixel-level in SAR image classification, Int. J. Appl. Earth Obs., 19, 173–184, https://doi.org/10.1016/j.jag.2012.05.011, 2012.
Louppe, G., Wehenkel, L., Sutera, A., and Geurts, P.: Understanding variable importances in Forests of randomized trees, in: Advances in Neural Information Processing Systems 26, 27th Annual Conference on Neural Information Processing Systems 2013, Lake Tahoe, Nevada, USA, 5–10 December 2013, 431–439, 2013.
Lü, H., Zhu, Y., Skaggs, T. H., and Yu, Z.: Comparison of measured and simulated water storage in dryland terraces of the Loess Plateau, China, Agr. Water Manage., 96, 299–306, https://doi.org/10.1016/j.agwat.2008.08.010, 2009.
Luo, L., Li, F., Dai, Z., Yang, X., Liu, W., and Fang, X.: Terrace extraction based on remote sensing images and digital elevation model in the loess plateau, China, Earth Sci. Informatics, 13, 433–446, https://doi.org/10.1007/s12145-020-00444-x, 2020.
Mantel, N.: Chi-square tests with one degree of freedom; extensions of the Mantel-Haenszel procedure, J. Am. Stat. Assoc., 58, 690–700, https://doi.org/10.1080/01621459.1963.10500879, 1963.
Martínez-Casasnovas, J. A., Ramos, M. C., and Cots-Folch, R.: Influence of the EU CAP on terrain morphology and vineyard cultivation in the Priorat region of NE Spain, Land Use Policy, 27, 11–21, https://doi.org/10.1016/j.landusepol.2008.01.009, 2010.
Masjedi, A., Valadan Zoej, M. J., and Maghsoudi, Y.: Classification of Polarimetric SAR Images Based on Modeling Contextual Information and Using Texture Features, IEEE T. Geosci. Remote, 54, 932–943, https://doi.org/10.1109/TGRS.2015.2469691, 2016.
Massey, R., Sankey, T. T., Yadav, K., Congalton, R. G., and Tilton, J. C.: Integrating cloud-based workflows in continental-scale cropland extent classification, Remote Sens. Environ., 219, 162–179, https://doi.org/10.1016/j.rse.2018.10.013, 2018.
Matton, N., Canto, G. S., Waldner, F., Valero, S., Morin, D., Inglada, J., Arias, M., Bontemps, S., Koetz, B., and Defourny, P.: An automated method for annual cropland mapping along the season for various globally-distributed agrosystems using high spatial and temporal resolution time series, Remote Sens., 7, 13208–13232, https://doi.org/10.3390/rs71013208, 2015.
Montgomery, D. R.: Soil erosion and agricultural sustainability, P. Natl. Acad. Sci. USA, 104, 13268–13272, https://doi.org/10.1073/pnas.0611508104, 2007.
Myint, S. W., Gober, P., Brazel, A., Grossman-Clarke, S., and Weng, Q.: Per-pixel vs. object-based classification of urban land cover extraction using high spatial resolution imagery, Remote Sens. Environ., 115, 1145–1161, https://doi.org/10.1016/j.rse.2010.12.017, 2011.
NDRC and MWR: The “13th five-year plan” special construction plan for comprehensive control of soil and water loss in sloping cropland, NDRC and MWR, Beijing, China, 2017.
Olofsson, P., Foody, G. M., Herold, M., Stehman, S. V., Woodcock, C. E., and Wulder, M. A.: Good practices for estimating area and assessing accuracy of land change, Remote Sens. Environ., 148, 42–57, https://doi.org/10.1016/j.rse.2014.02.015, 2014.
Pande-Chhetri, R., Abd-Elrahman, A., Liu, T., Morton, J., and Wilhelm, V. L.: Object-based classification of wetland vegetation using very high-resolution unmanned air system imagery, Eur. J. Remote Sens., 50, 564–576, https://doi.org/10.1080/22797254.2017.1373602, 2017.
Phalke, A. R. and Özdoğan, M.: Large area cropland extent mapping with Landsat data and a generalized classifier, Remote Sens. Environ., 219, 180–195, https://doi.org/10.1016/j.rse.2018.09.025, 2018.
Pittman, K., Hansen, M. C., Becker-Reshef, I., Potapov, P. V., and Justice, C. O.: Estimating global cropland extent with multi-year MODIS data, Remote Sens., 2, 1844–1863, https://doi.org/10.3390/rs2071844, 2010.
Potere, D.: Horizontal positional accuracy of Google Earth's high-resolution imagery archive, Sensors, 8, 7973–7981, https://doi.org/10.3390/s8127973, 2008.
Raši, R., Bodart, C., Stibig, H. J., Eva, H., Beuchle, R., Carboni, S., Simonetti, D., and Achard, F.: An automated approach for segmenting and classifying a large sample of multi-date Landsat imagery for pan-tropical forest monitoring, Remote Sens. Environ., 115, 3659–3669, https://doi.org/10.1016/j.rse.2011.09.004, 2011.
Rockström, J. and Falkenmark, M.: Agriculture: Increase water harvesting in Africa, Nature, 519, 283–285, https://doi.org/10.1038/519283a, 2015.
Rodriguez-Galiano, V. F., Chica-Olmo, M., Abarca-Hernandez, F., Atkinson, P. M., and Jeganathan, C.: Random Forest classification of Mediterranean land cover using multi-seasonal imagery and multi-seasonal texture, Remote Sens. Environ., 121, 93–107, https://doi.org/10.1016/j.rse.2011.12.003, 2012.
Sahr, K.: DGGRID version 7.0: User documentation for discrete global grid software, available at: https://webpages.sou.edu/~sahrk/docs/dggridManualV70.pdf (last access: 23 May 2021), 2019.
Shalaby, A. and Tateishi, R.: Remote sensing and GIS for mapping and monitoring land cover and land-use changes in the Northwestern coastal zone of Egypt, Appl. Geogr., 27, 28–41, https://doi.org/10.1016/j.apgeog.2006.09.004, 2007.
Sharda, V. N., Juyal, G. P., and Singh, P. N.: Hydrologic and sedimentologic behavior of a Conservation Bench Terrace system in a sub-humid climate, Trans. Am. Soc. Agric. Eng., 45, 1433, https://doi.org/10.13031/2013.11030, 2002.
Tang, G., Li, F., and Liu, X.: Extraction of slope terrain factors, in: Course of digital elevation model, 3rd Edition, Science Press, Beijing, China, 134–156, 2016.
Teluguntla, P., Thenkabail, P., Oliphant, A., Xiong, J., Gumma, M. K., Congalton, R. G., Yadav, K., and Huete, A.: A 30-m landsat-derived cropland extent product of Australia and China using random forest machine learning algorithm on Google Earth Engine cloud computing platform, ISPRS J. Photogramm. Remote Sens., 144, 325–340, https://doi.org/10.1016/j.isprsjprs.2018.07.017, 2018.
USGS.: The shuttle radar topography mission (SRTM) collection user guide, available at: https://lpdaac.usgs.gov/documents/179/SRTM_User_Guide_V3.pdf (last access: 15 March 2021), 2015.
USGS: Landsat 8 surface reflectance code (LaSRC) product guide, available at: https://www.usgs.gov/media/files/land-surface-reflectance-code-lasrc-product-guide (last access: 15 March 2019), 2018.
Teluguntla, P., Thenkabail, P. S., Xiong, J., Gumma, M. K., Congalton, R. G., Oliphant, J. A., Sankey, T., Poehnelt, J., Yadav, K., Massey, R., Phalke, A., and Smith, C.: NASA Making Earth System Data Records for Use in Research Environments (MEaSUREs) Global Food Security-support Analysis Data (GFSAD) Cropland Extent 2015 Australia, New Zealand, China, Mongolia 30 m V001, NASA EOSDIS Land Processes DAAC, USGS Earth Resources Observation and Science (EROS) Center, Sioux Falls, South Dakota, USA, 2017.
Tokuoka, Y. and Hashigoe, K.: Effects of stone-walled terracing and historical forest disturbances on revegetation processes after the abandonment of mountain slope uses on the Yura Peninsula, southwestern Japan, J. Forest Res., 20, 24–34, https://doi.org/10.1007/s10310-014-0471-0, 2014.
Wei, W., Chen, L., Yang, L., Samadani, F. F., and Sun, G.: Microtopography recreation benefits ecosystem restoration, Environ. Sci. Technol., 46, 10875–10876, https://doi.org/10.1021/es303294n, 2012.
Wei, W., Chen, D., Wang, L., Daryanto, S., Chen, L., Yu, Y., Lu, Y., Sun, G., and Feng, T.: Global synthesis of the classifications, distributions, benefits and issues of terracing, Earth-Sci. Rev., 159, 388–403, https://doi.org/10.1016/j.earscirev.2016.06.010, 2016.
Xie, H., Luo, X., Xu, X., Pan, H., and Tong, X.: Automated subpixel surface water mapping from heterogeneous urban environments using Landsat 8 OLI imagery, Remote Sens., 8, 584, https://doi.org/10.3390/rs8070584, 2016.
Xiong, J., Thenkabail, P. S., Tilton, J. C., Gumma, M. K., Teluguntla, P., Oliphant, A., Congalton, R. G., Yadav, K., and Gorelick, N.: Nominal 30-m cropland extent map of continental Africa by integrating pixel-based and object-based algorithms using Sentinel-2 and Landsat-8 data on google earth engine, Remote Sens., 9, 1065, https://doi.org/10.3390/rs9101065, 2017.
Yu, L., Wang, J., Clinton, N., Xin, Q., Zhong, L., Chen, Y., and Gong, P.: FROM-GC: 30 m global cropland extent derived through multisource data integration, Int. J. Digit. Earth, 6, 521–533, https://doi.org/10.1080/17538947.2013.822574, 2013a.
Yu, L., Wang, J., and Gong, P.: Improving 30 m global land-cover map FROM-GLC with time series MODIS and auxiliary data sets: A segmentation-based approach, Int. J. Remote Sens., 34, 5851–5867, https://doi.org/10.1080/01431161.2013.798055, 2013b.
Yu, L., Li, X., Li, C., Zhao, Y., Niu, Z., Huang, H., Wang, J., Cheng, Y., Lu, H., Si, Y., Yu, C., Fu, H., and Gong, P.: Using a global reference sample set and a cropland map for area estimation in China, Sci. China Earth Sci., 60, 277–285, https://doi.org/10.1007/s11430-016-0064-5, 2017.
Zhang, Y., Shi, M., Zhao, X., Wang, X., Luo, Z., and Zhao, Y.: Methods for automatic identification and extraction of terraces from high spatial resolution satellite data (China-GF-1), Int. Soil Water Conserv. Res., 5, 17–25, https://doi.org/10.1016/j.iswcr.2017.02.002, 2017.
Zhang, Z., Wang, X., Zhao, X., Liu, B., Yi, L., Zuo, L., Wen, Q., Liu, F., Xu, J., and Hu, S.: A 2010 update of National Land Use/Cover Database of China at 1:100 000 scale using medium spatial resolution satellite images, Remote Sens. Environ., 149, 142–154, https://doi.org/10.1016/j.rse.2014.04.004, 2014.
Zhao, H., Fang, X., Ding, H., Strobl, J., Xiong, L., Na, J., and Tang, G.: Extraction of terraces on the loess plateau from high-resolution dems and imagery utilizing object-based image analysis, ISPRS Int. J. Geo-Inf., 6, 157, https://doi.org/10.3390/ijgi6060157, 2017.
Zhao, Y., Gong, P., Yu, L., Hu, L., Li, X., Li, C., Zhang, H., Zheng, Y., Wang, J., Zhao, Y., Cheng, Q., Liu, C., Liu, S., and Wang, X.: Towards a common validation sample set for global land-cover mapping. Int. J. Remote Sens., 35, 4795–4814, https://doi.org/10.1080/01431161.2014.930202, 2014.
Zhong, L., Gong, P., and Biging, G. S.: Efficient corn and soybean mapping with temporal extendability: A multi-year experiment using Landsat imagery, Remote Sens. Environ., 140, 1–13, https://doi.org/10.1016/j.rse.2013.08.023, 2014.