the Creative Commons Attribution 4.0 License.
the Creative Commons Attribution 4.0 License.
 | 08 Feb 2021
Country-level and gridded estimates of wastewater production, collection, treatment and reuse
Michelle T. H. van Vliet
Manzoor Qadir
Marc F. P. Bierkens
Continually improving and affordable wastewater management provides opportunities for both pollution reduction and clean water supply augmentation, while simultaneously promoting sustainable development and supporting the transition to a circular economy. This study aims to provide the first comprehensive and consistent global outlook on the state of domestic and manufacturing wastewater production, collection, treatment and reuse. We use a data-driven approach, collating, cross-examining and standardising country-level wastewater data from online data resources. Where unavailable, data are estimated using multiple linear regression. Country-level wastewater data are subsequently downscaled and validated at 5 arcmin (∼10 km) resolution. This study estimates global wastewater production at 359.4×10⁹ m3 yr−1, of which 63 % (225.6×10⁹ m3 yr−1) is collected and 52 % (188.1×10⁹ m3 yr−1) is treated. By extension, we estimate that 48 % of global wastewater production is released to the environment untreated, which is substantially lower than previous estimates of ∼80 %. An estimated 40.7×10⁹ m3 yr−1 of treated wastewater is intentionally reused. Substantial differences in per capita wastewater production, collection and treatment are observed across different geographic regions and by level of economic development. For example, just over 16 % of the global population in high-income countries produces 41 % of global wastewater. Treated-wastewater reuse is particularly substantial in the Middle East and North Africa (15 %) and western Europe (16 %), while comprising just 5.8 % and 5.7 % of the global population, respectively. Our database serves as a reference for understanding the global wastewater status and for identifying hotspots where untreated wastewater is released to the environment, which are found particularly in South and Southeast Asia. Importantly, our results also serve as a baseline for evaluating progress towards many policy goals that are both directly and indirectly connected to wastewater management. Our spatially explicit results available at 5 arcmin resolution are well suited for supporting more detailed hydrological analyses such as water quality modelling and large-scale water resource assessments and can be accessed at https://doi.org/10.1594/PANGAEA.918731 (Jones et al., 2020).
- Article
(4568 KB) - Full-text XML
- BibTeX
- EndNote


Clean water is essential for supporting human livelihoods, achieving sustainable development and maintaining ecosystem health. All major human activities, such as crop and livestock production, manufacturing of goods, power generation, and domestic activities rely upon the availability of water in both adequate quantities and of acceptable quality at the point of intended use (van Vliet et al., 2017; Ercin and Hoekstra, 2014). It is increasingly recognised that conventional water resources such as rainfall, snowmelt and runoff captured in lakes, rivers and aquifers are insufficient to meet human demands in water-scarce areas (Jones et al., 2019; Hanasaki et al., 2013; Kummu et al., 2016). While increases in water use efficiencies can somewhat reduce the water demand–supply gap, these approaches must be combined with supply and quality enhancement strategies (Gude, 2017). Conventional supply enhancement strategies, such as reservoir construction, surface water diversion and pipeline construction are contingent on geographic and climate factors, can face strong public opposition and often lack water quality considerations.
A growing set of viable but unconventional water resources offer enormous potential for narrowing the water demand–supply gap towards a water-secure future. Unconventional water resources encapsulate a range of strategies across different scales, from localised fog-water and rainwater harvesting to mega-scale desalination plants and wastewater treatment and reuse facilities (Jones et al., 2019; Morote et al., 2019; Qadir et al., 2020). The use of unconventional water resources has grown rapidly in the last few decades, often out of necessity, and their importance across various geographic scales is already irrefutable (Jones et al., 2019; Qadir et al., 2018). Furthermore, continually improving unconventional water resources technologies have permitted more efficient and economical “tapping” of water resources, which were previously unusable due to access constraints or the added costs related to unsuitable water quality (e.g. seawater desalination and wastewater treatment).
Wastewater is broadly defined as “used” water that has been contaminated as a result of human activities (Mateo-Sagasta et al., 2015). While agricultural runoff is rarely collected or treated (WWAP, 2017), return flows from domestic and manufacturing sources (henceforth “wastewater”) can be collected in infrastructure including piped systems (sewerage) or on-site sanitation systems (septic tanks and pit latrines). Wastewater is increasingly recognised as a reliable and cost-effective source of freshwater, particularly for agricultural applications (WWAP, 2017; Jiménez and Asano, 2008). Yet, wastewater remains an “untapped” and “undervalued” resource (WWAP, 2017). Wastewater treatment aims to improve the quality of used water sources to reduce contaminant levels below sectoral quality thresholds for intentional reuse or to minimise the environmental impacts of wastewater return flows. Treated-wastewater flows can also provide a substantial source of (clean) freshwater flows for maintenance of river flows, especially during drought (Luthy et al., 2015). Where treated-wastewater discharges form a substantial part of the river flow, de facto wastewater reuse, defined as the incidental presence of treated wastewater in a water supply, can be high (Rice et al., 2013; Beard et al., 2019). Treated wastewater can also be used for groundwater recharge, helping to preserve the viability of freshwater extraction from groundwater into the future (Qadir et al., 2015), in addition to applications in agroforestry systems (El Moussaoui et al., 2019) and aquaculture (Khalil and Hussein, 2008). In summary, wastewater treatment can improve river water quality and ecosystem health, while providing an alternative source of freshwater for human use and subsequently reducing competition for conventional water supplies.
Historically, wastewater (both treated and untreated) has been predominantly used for non-potable purposes, particularly agriculture and landscape irrigation (Qadir et al., 2007; WWAP, 2017; Zhang and Shen, 2017). Agricultural activities are expected to increasingly rely on alternative water resources, as this sector has the largest water demands globally (Wada et al., 2013). Furthermore, the agricultural sector faces reductions in conventional water resources allocation (Sato et al., 2013). The reliable supply of water, reduced need for additional fertiliser and potential for growing high-value vegetables promote wastewater irrigation in water-scarce developing countries (Sato et al., 2013). However, much of the wastewater currently reused is inadequately treated or even untreated (Qadir et al., 2010; Scott et al., 2010). Demands for wastewater are increasing at a faster pace than treatment solutions and institutions that ensure the safe distribution and management of wastewater (Sato et al., 2013). The primary challenge in promoting reuse is ensuring safety – both for human and ecosystem health – and thus ensuring that wastewater is adequately treated prior to use or environmental discharge (WWAP, 2017). This is needed to achieve the required paradigm shift in water resources management, whereby wastewater is viewed as a resource (for energy, nutrients and water) rather than as “waste” (WWAP, 2017; Qadir et al., 2020).
To understand the current state and explore the future potential of wastewater as a resource, a comprehensive and consistent global assessment of wastewater production, collection, treatment and reuse is required. This information is essential for assessing progress towards Sustainable Development Goal (SDG) 6, such as SDG 6.3 that specifically focuses on achieving water quality improvements through halving the proportion of untreated wastewater and promoting safe reuse globally. Furthermore, this information is important for identifying hotspots where improvements in wastewater management are highly necessary and when used as input data for a range of scientific assessments (e.g. stream water quality dynamics and water scarcity assessments). However, the availability of wastewater data at the continental and global scales is sparse and often outdated or from inconsistent reporting years (Sato et al., 2013). Previous studies remain limited in their approach and estimates, relying on a few data sources covering less than half of the countries across the world (Mateo-Sagasta et al., 2015; Sato et al., 2013). A recent study explored the global and regional “potential” of wastewater as a water, nutrient and energy source but did not address the collection, treatment and reuse aspects of wastewater (Qadir et al., 2020). This paper presents the first global assessment of spatially explicit wastewater production, collection, treatment and reuse, consistently combing different data sources. Country-level quantifications are downscaled to a grid level of 5 arcmin for inclusion in large-scale water resource assessments and water quality models.
2.1 Wastewater data sources
The fate of domestic and manufacturing wastewater after production can follow a number of paths (Fig. 1). Wastewater from these activities can be collected, typically in sewers, septic tanks or pit latrines, or uncollected and discharged directly to the environment (e.g. open defecation). Collected wastewater can undergo treatment, ranging from basic primary treatment (removing suspended solids) to specialised tertiary or triple-barrier treatment (nutrient removal and toxic compound removal), or can be discharged to the environment untreated (Mateo-Sagasta et al., 2015). When treated, wastewater can be released to the environment or intentionally reused as a “fit-for-purpose” water source. Untreated wastewater can similarly be discharged to the environment or intentionally used as a source of freshwater. Furthermore, both treated and untreated wastewater can be used unintentionally where wastewater is incidentally present in a water supply (“de facto reuse”).
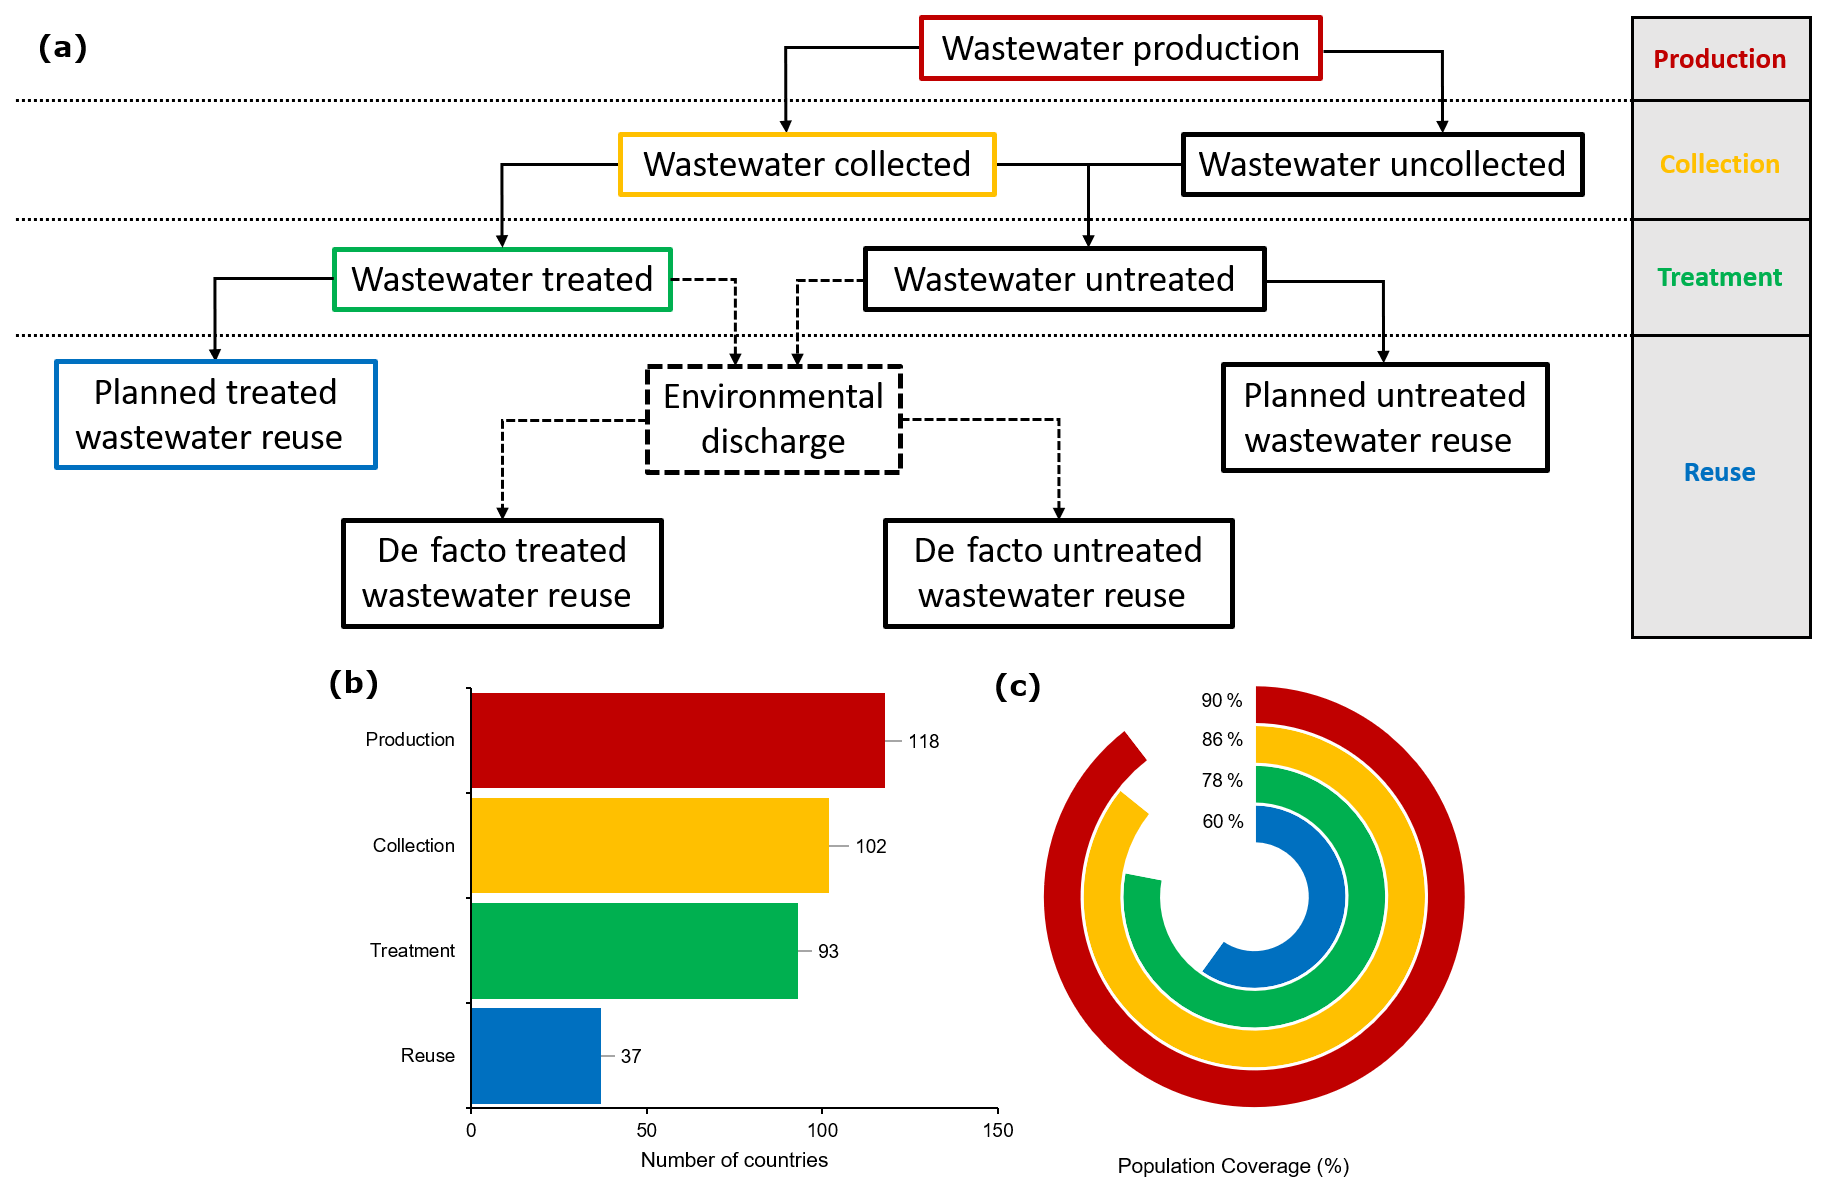
Figure 1The wastewater chain (a), including wastewater data availability with number of countries for which wastewater data are available (b) and the percentage of population coverage (i.e. the proportion of the global population for which wastewater data are available) (c).
Country-level wastewater data were collated from four online databases (Table 1): Global Water Intelligence (GWI, 2015), the Food and Agriculture Organization of the United Nations (FAO AQUASTAT, 2020), Eurostat (Eurostat, 2020) and the United Nations Statistics Division (UNSD, 2020). For consistency, the year 2015 was selected for all wastewater data. Where wastewater data from the online sources were reported in a different year (up to a maximum of 10 years, i.e. 2006 onwards), all wastewater data were standardised to 2015 based on data from the most recent reporting year (see Table 1 for the standardisation method).
Table 1Wastewater data sources and population coverage by regional and economic aspects, including the number of unique countries (in square brackets). Method for standardisation of wastewater data to 2015 and the method for compiling wastewater data from multiple sources into a single quantification per country.
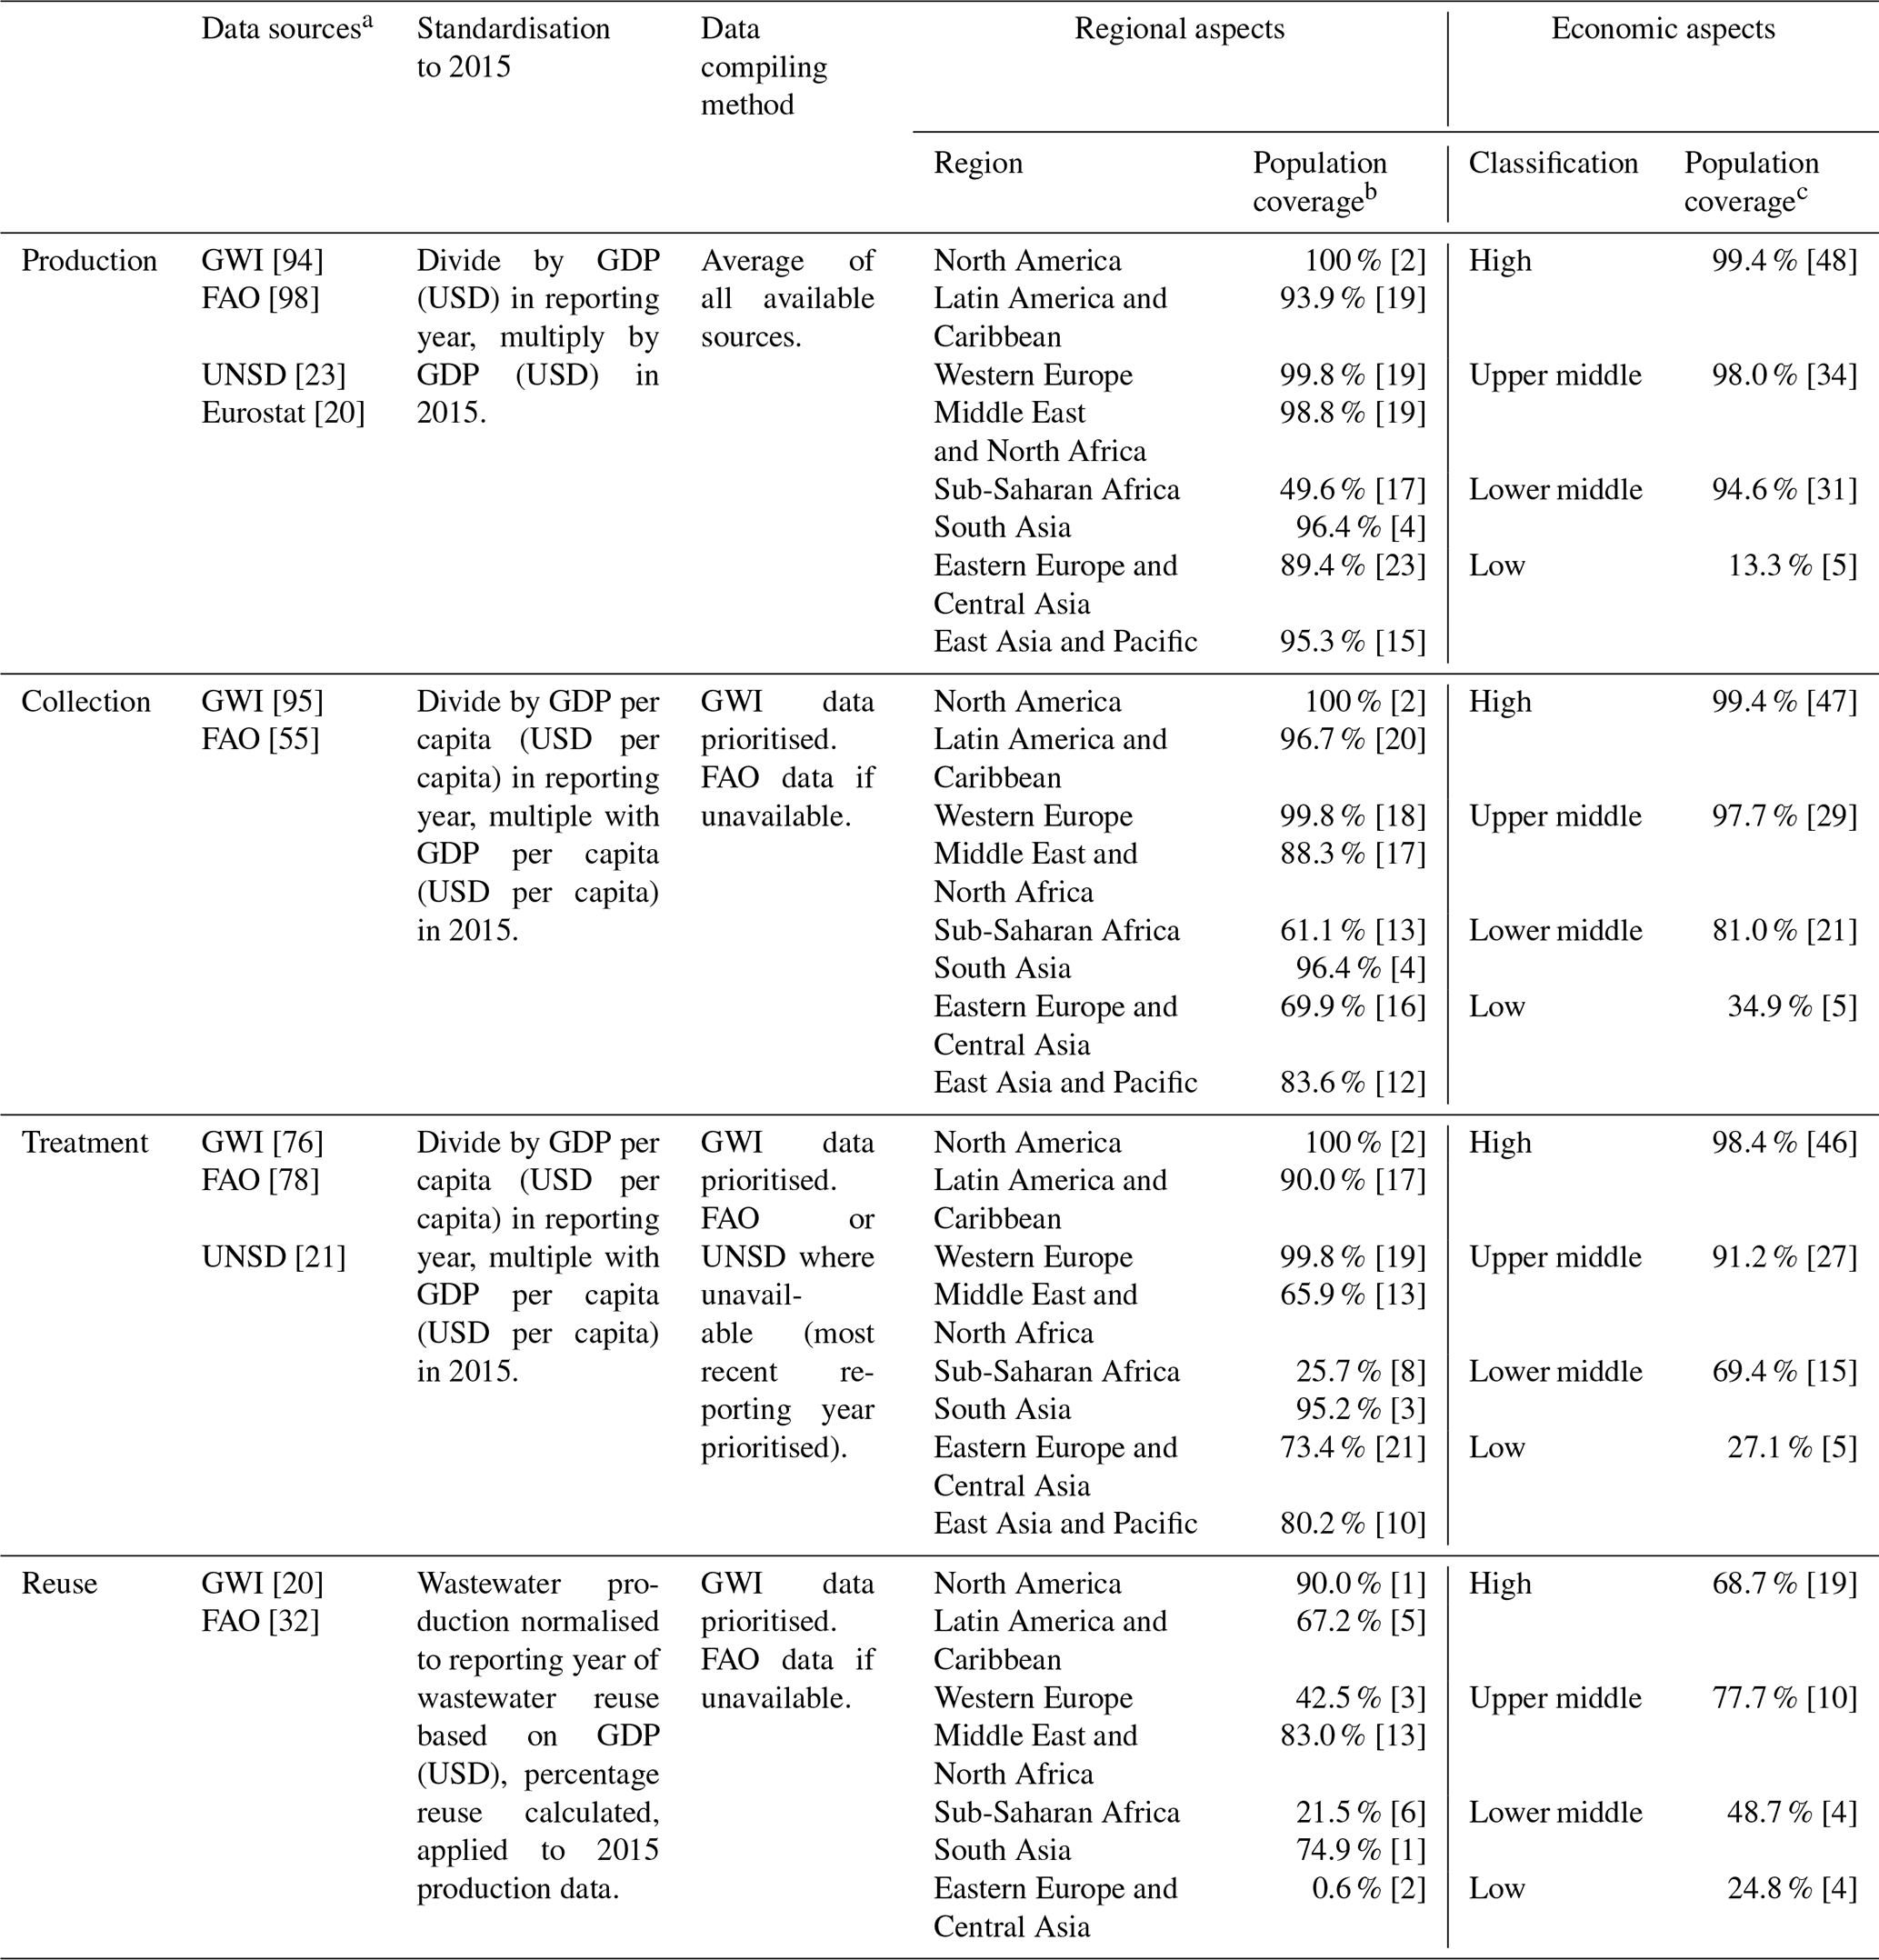
a Abbreviations for the data sources are as follows: Global Water Intelligence (GWI), Food and Agriculture Organization of the United Nations (FAO), United Nations Statistics Department (UNSD), European Union statistics office (Eurostat). b Data availability per region expressed as a percentage of the total population. Geographic region followed by the total number of countries per region in square brackets: East Asia and Pacific [38], eastern Europe and Central Asia [30], Latin America and Caribbean [41], Middle East and North Africa [21], North America [3], South Asia [8], sub-Saharan Africa [48], and western Europe [26]. c Data availability per economic classification expressed as a percentage of the total population. Total number of countries per economic classification are: high [76], upper-middle [56], lower-middle [52] and low [31] income.
Data from different sources were cross-examined to check for consistency and to remove implausible data. Where large discrepancies (>1 order of magnitude) existed between different data sources for a country, data points were excluded. For example, the GWI reports Kazakhstan to produce 6205×106 m3 yr−1, whereas the FAO reports just 411×106 m3 yr−1. Similarly, the FAO reports Moldova to produce 46.7×10⁶ m3 yr−1 compared to 672.1×10⁶ m3 yr−1 by the UNSD. In total, reported data for 11 countries were excluded for wastewater production. For wastewater collection and treatment, percentage data were cross-referenced with reported connection rates (i.e. percentage of population connected to wastewater collection and treatment). Six and seven countries were excluded for collection and treatment, respectively. For example, the GWI reports a 95.2 % collection rate for Azerbaijan, while the UNSD reports that only 32.4 % of people are connected to wastewater collection systems. Similarly, the GWI reports a 17 % treatment rate in Hong Kong SAR, whereas the UNSD reports that 93.5 % of people are connected to wastewater treatment plants. No data points were excluded for wastewater reuse. In a small number of cases where percentage values obtained were marginally illogical (i.e. wastewater collection<wastewater treatment; wastewater treatment<wastewater reuse), percentage values were set to the proceeding level in the wastewater chain (Fig. 1).
Table 1 displays the data sources and the associated number of countries with wastewater data for production, collection, treatment and reuse. The procedure for standardising data to the year 2015, when required, is presented. Wastewater production is assumed to be dependent upon both population size and per capita production (related to per capita wealth). Hence, we standardise wastewater production linearly with GDP (gross domestic product), a combined metric of population size and wealth. Conversely, wastewater collection and treatment are assumed to be more dependent on economics; hence we linearly apply GDP per capita for standardisation. The methods used to compile wastewater production, collection, treatment and reuse data from multiple sources to provide a single quantification per country are also displayed. Lastly, the population coverage in percentage terms and by the number of unique countries is displayed both per geographic region and by economic classification. The number of unique countries and the population coverage of data at each stage of the wastewater chain are also displayed in Fig. 1. Reported wastewater data were available for the majority of the world's most populous countries. This results in a high-percentage population coverage relative to the number of countries. Both the number of countries and population coverage reduces through the wastewater chain, with available wastewater data decreasing from 118 to 37 countries (90 % to 60 % population coverage) from wastewater production to wastewater reuse data.
2.2 Regression for country-level predictions
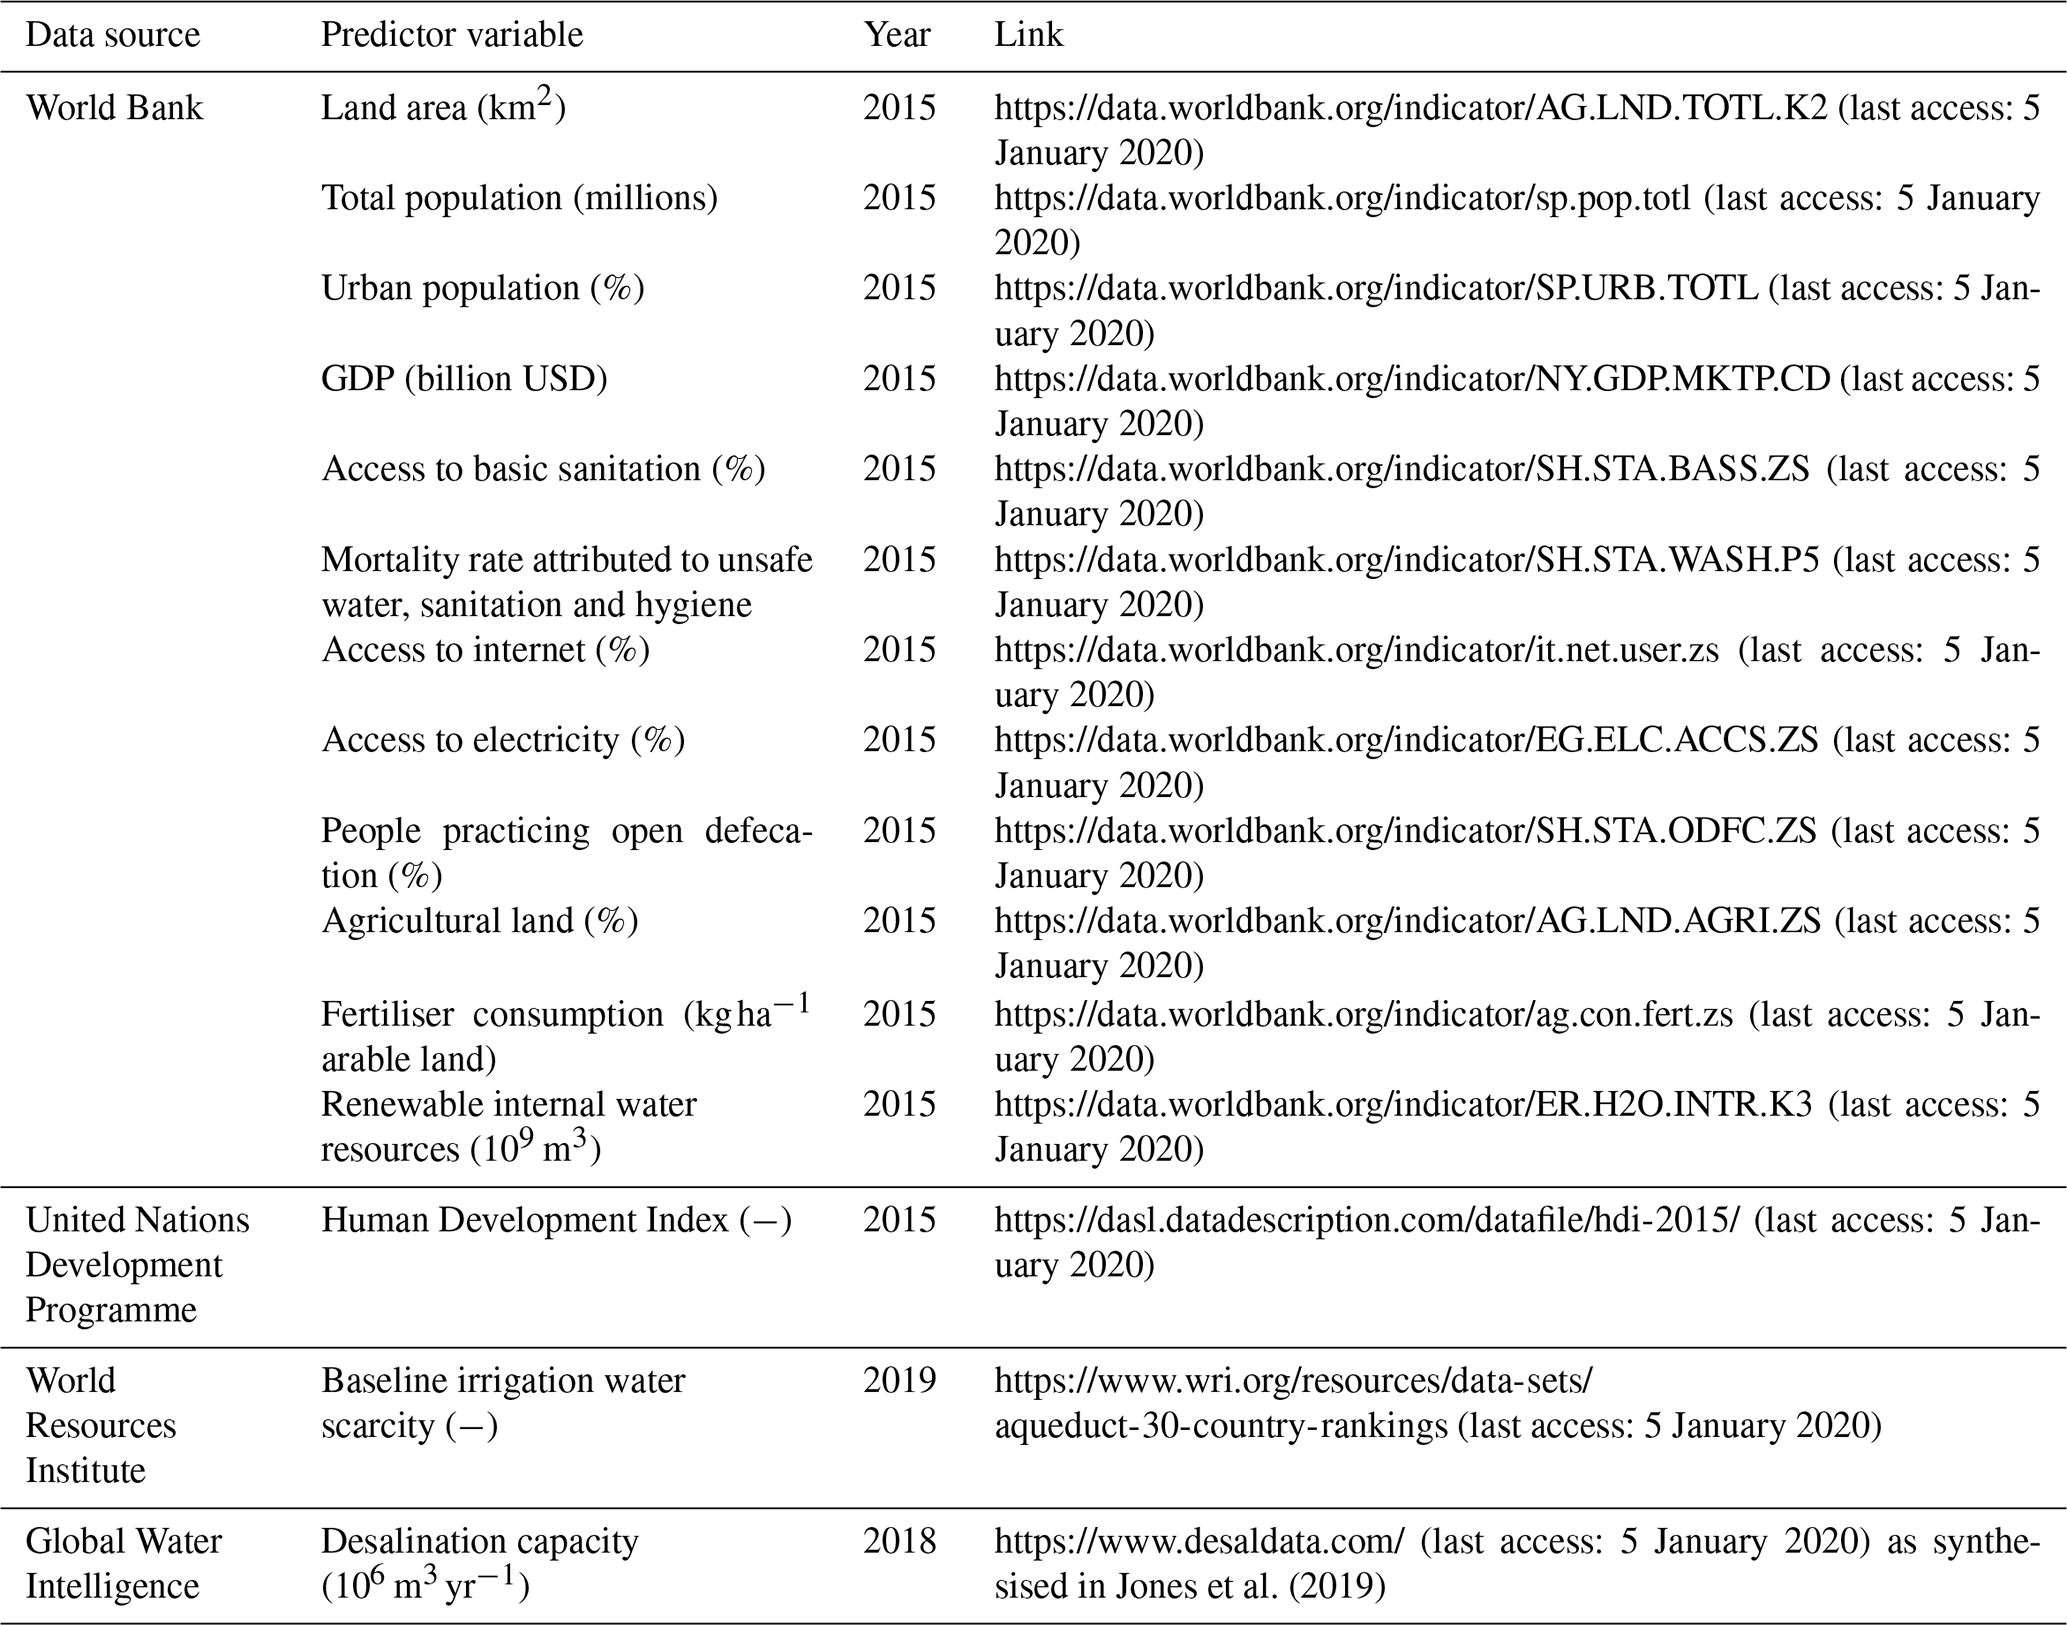
Datasets of predictor variables for regression analyses were downloaded from multiple sources (see overview Table 2). Datasets spanned a wide range of predictor variables covering social (e.g. total and urban population), economic (e.g. GDP or Human Development Index (HDI)), hydrological (e.g. irrigation water scarcity) and geographic (e.g. land area and agricultural land) dimensions. The selected predictor variables were expected to have a physical basis for correlation with wastewater production, collection, treatment or reuse. Where appropriate, datasets from these sources were combined to produce comparable metrics for countries of different populations and geographic sizes (e.g. GDP per capita in USD per capita and desalination capacity per capita in m3 yr−1 per capita). Values were taken for the year 2015, where available, or from the closest reporting year when unavailable. Irrigation water scarcity and desalination capacity were taken from 2019 and 2018, respectively. Data were transformed, either using a log or square root transformation, to reduce the skew in the independent variables and to ensure normality.
Table 2Data sources of predictor variables for wastewater production, collection, treatment and reuse regression analysis.
Multiple linear regression was used to predict country-level wastewater variables (production, collection, treatment and reuse) for countries without reported data. Stepwise elimination was used for feature selection to remove redundant predictor variables and reduce overfitting. Wastewater production was predicted in volumetric flow rate units (106 m3 yr−1). Conversely, wastewater collection, treatment and reuse were predicted as a percentage of wastewater production. Predicted values of percentages were bounded to the 0 %–100 % range (i.e. and ). Predicted percentages were subsequently applied to reported or predicted values of wastewater production to obtain wastewater collection, treatment and reuse in volumetric flow rate units. Bootstrap regression was used to quantify the uncertainty in the predictions (by geographic region, economic classification and at the global scale) at the 95th confidence level. In total, 1000 regressions with random sampling and replacement were fit to provide predictions at countries lacking data. Wastewater observations were combined with these 1000 bootstrapped predictions, with the 2.5th and 97.5th confidence intervals taken as lower and upper confidence limits, respectively.
Wastewater data (reported and predicted) are at the national level, for the 215 countries as listed by the World Bank (https://data.worldbank.org/country, last access: 5 January 2020). Wastewater data are also aggregated to eight geographic regions based on the World Bank regional classifications: (1) East Asia and Pacific, (2) eastern Europe and Central Asia, (3) Latin America and Caribbean, (4) Middle East and North Africa, (5) North America, (6) South Asia, (7) sub-Saharan Africa, and (8) western Europe. Furthermore, data are also aggregated to four economic classifications based on the World Bank Atlas method: (1) high income (>USD 12 056 GNI – gross national income – per capita), (2) upper-middle income (USD 3896 to USD 12 055), (3) lower-middle income (USD 966 to USD 3895) and (4) low income (<USD 995). Predicted wastewater data were used to supplement reported data and, where unavailable, to develop a comprehensive global outlook of wastewater production, collection, treatment and reuse.
2.3 Downscaling and validation
Country-level wastewater production, collection, treatment and reuse data were downscaled to 5 arcmin resolution (∼10 km at the Equator) based on the sum of averaged annual domestic and industrial return flow data (henceforth “return flow”). Return flows represent the water extracted for a specific sectoral purpose, but which is not consumed, and hence it returns to and dynamically interacts with surface and groundwater hydrology (de Graaf et al., 2014; Sutanudjaja et al., 2018). Return flows used for downscaling are calculated as gross − net water demands from the Water Futures and Solutions (WFaS) initiative for the years 2000–2010 (Wada et al., 2016). The WFaS water demand dataset follows the approach developed for PCR-GLOBWB (PCRaster Global Water Balance; Wada et al., 2014). Domestic return flows only occur where the urban and rural populations have access to water, whereas industrial return flows occur from all areas where water is withdrawn (Wada et al., 2014). Both domestic and industrial return flows are dependent on country-specific recycling ratios based on GDP and the level of economic development (Wada et al., 2011, 2014).
Grid cell return flow was divided by the country's total return flow to obtain the fraction per grid cell. Wastewater production was downscaled directly proportionally to return flows by multiplying the grid cell return flow fraction per grid cell with wastewater production at the country level. Wastewater collection is assigned sequentially to grid cells with the largest downscaled produced wastewater flows. Thus, collected wastewater is preferentially allocated to grid cells with the highest levels of municipal activities, where central wastewater collection (and treatment) is assumed to be most economically feasible. Wastewater treatment is assigned to grid cells only where wastewater collection exists, at an average treatment rate calculated at the country level. The treatment rate is calculated as the proportion of collected wastewater that undergoes treatment and, hence, can differ from the country-level wastewater treatment percentage (which is calculated as the proportion of produced wastewater that is treated). For the downscaling of wastewater reuse an additional criterion was introduced to represent water scarcity, a key driver of wastewater reuse. The ratio of water demand to water availability was calculated. Grid cells within a country with a treated-wastewater allocation are then ordered based off this ratio, and treated-wastewater reuse was assigned sequentially to these grid cells.
The location and design capacity of individual wastewater treatment plants were used to validate the downscaled wastewater treatment data. Reported data for 25 901 wastewater treatment plants located across Europe were obtained from the European Environment Agency (EEA, 2019). Data for a further 4283 wastewater treatment plants were obtained for the contiguous United States from the US Environmental Protection Agency (US EPA, 2020). An additional 478 wastewater treatment plants, distributed globally (excluding Europe and the US), were extracted from the GWI wastewater database (GWI, 2015). For EEA and GWI wastewater treatment plants, treatment capacity reported only in population equivalent (PE) was approximated in volume flow rate units based on the linear regression obtained for wastewater treatment plants reporting capacity in both population equivalent and volume flow rate (EEA: R2=0.80, p<0.001; GWI: R2=0.81, p<0.001). Wastewater treatment plants were assigned to their nearest grid cell, and treatment capacities were aggregated per cell. In total, wastewater treatment data were available for 22 133 unique grid cells. For validating downscaled wastewater reuse, only plants (with treatment capacity m3 yr−1) using tertiary or higher wastewater treatment technologies were considered. In total, 572 wastewater treatment plants in the EEA database met this criterion. A further 78 wastewater treatment plants, which are specifically designated as wastewater reuse facilities, were sourced from the GWI database. In total, wastewater reuse data were available for 601 grid cells. Downscaled wastewater treatment and reuse were compared to wastewater design capacities.
To account for the large variation in the treatment capacities of wastewater treatment plants considered, in addition to the geographical mismatch between where wastewater is produced and treated (i.e. wastewater treatment plants are typically located on the outskirts of urban areas), validation occurred at differing geographical scales. Wastewater treatment plant capacity was divided by wastewater production per capita to approximate the number of people that the wastewater treatment plant serves. If the population served by a wastewater plant exceeds the grid cell population, the validation extent was expanded to the directly neighbouring cells. This is allowed to occur, until the population served by the treatment plant is reached, only up to a maximum of three iterations, reflecting a radius of ∼30 km around the wastewater treatment plant. The total downscaled wastewater treated over the extended area was then compared to that of the treatment plant.
To quantify the performance of the downscaling approaches, the root-mean-square error (RMSE) and mean bias (BIAS) were calculated. Normalised values of RMSE and BIAS were calculated (nRMSE and nBIAS) by dividing by the standard deviation of the wastewater treatment plant capacity. Pearson's (r) coefficients were calculated to quantify the linear dependence, with R2 values based on both the linear and log–log relationship between downscaled and observed values also being calculated.
3.1 Regression and country-level predictions
The results of the regression analysis for wastewater production, collection, treatment and reuse are summarised in Table 3. All regression models were significant at the p<0.001 level with adjusted R2 values ranging between 0.61 and 0.89. Country-level observed versus simulated wastewater production (log 106 m3 yr−1), collection (%), treatment (%) and reuse (%) data are displayed in Fig. 2. The regression equations were applied for 97, 113, 122 and 178 countries with no or excluded data representing 10 %, 14 %, 22 % and 40 % of the global population for wastewater production, collection, treatment and reuse, respectively.
Table 3Wastewater production, collection, treatment and reuse multiple linear regression results.
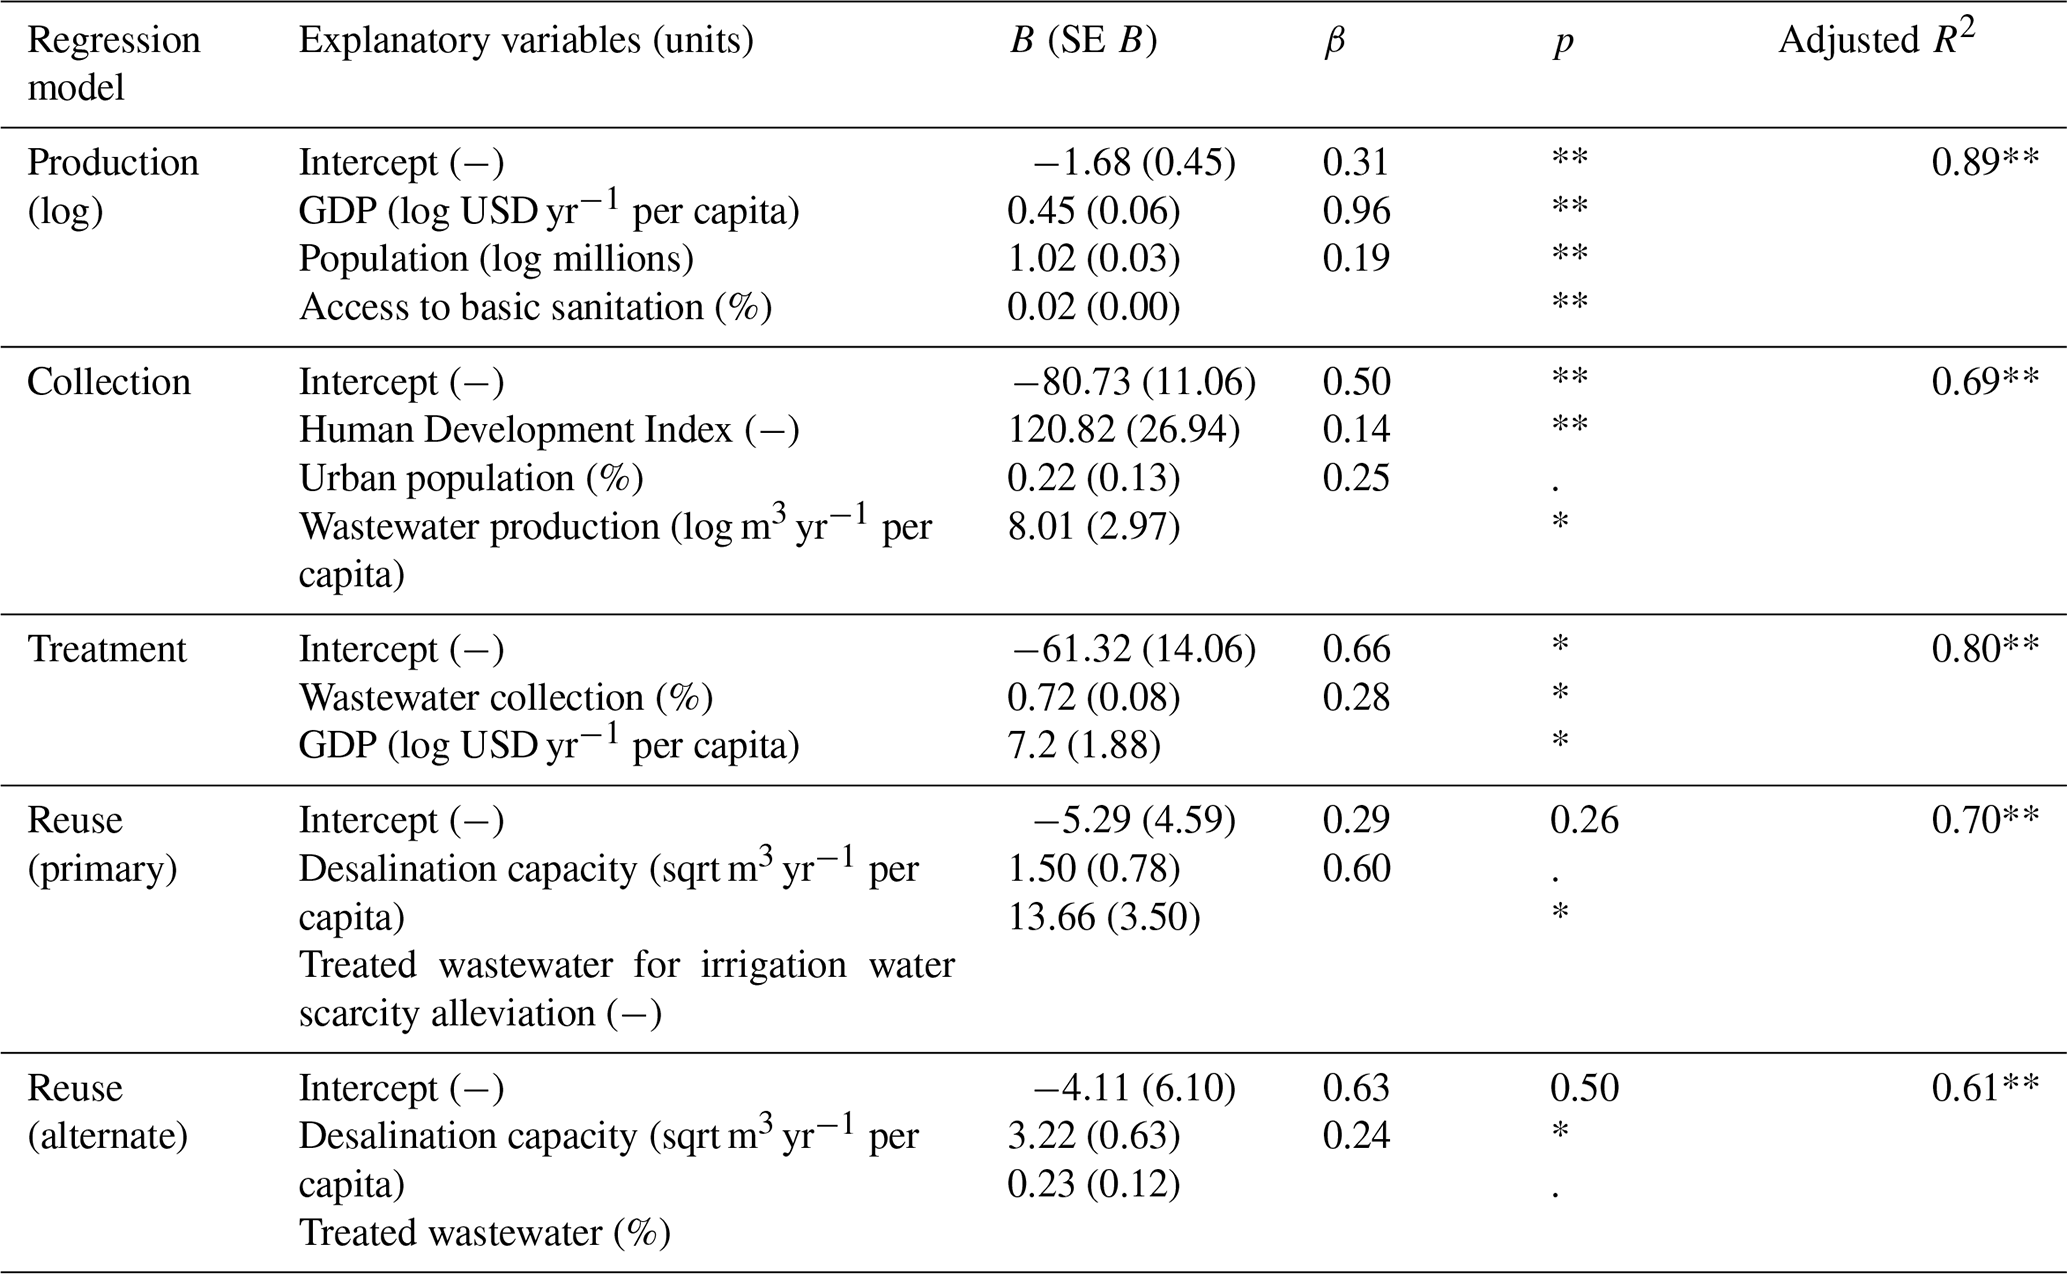
B indicates unstandardised regression weights; SE B indicates the standard error of B; β indicates standardised regression weights. Significance level represented by “**” (p<0.001), “*” (p<0.01), “.” (p<0.1) or as stated numerically.
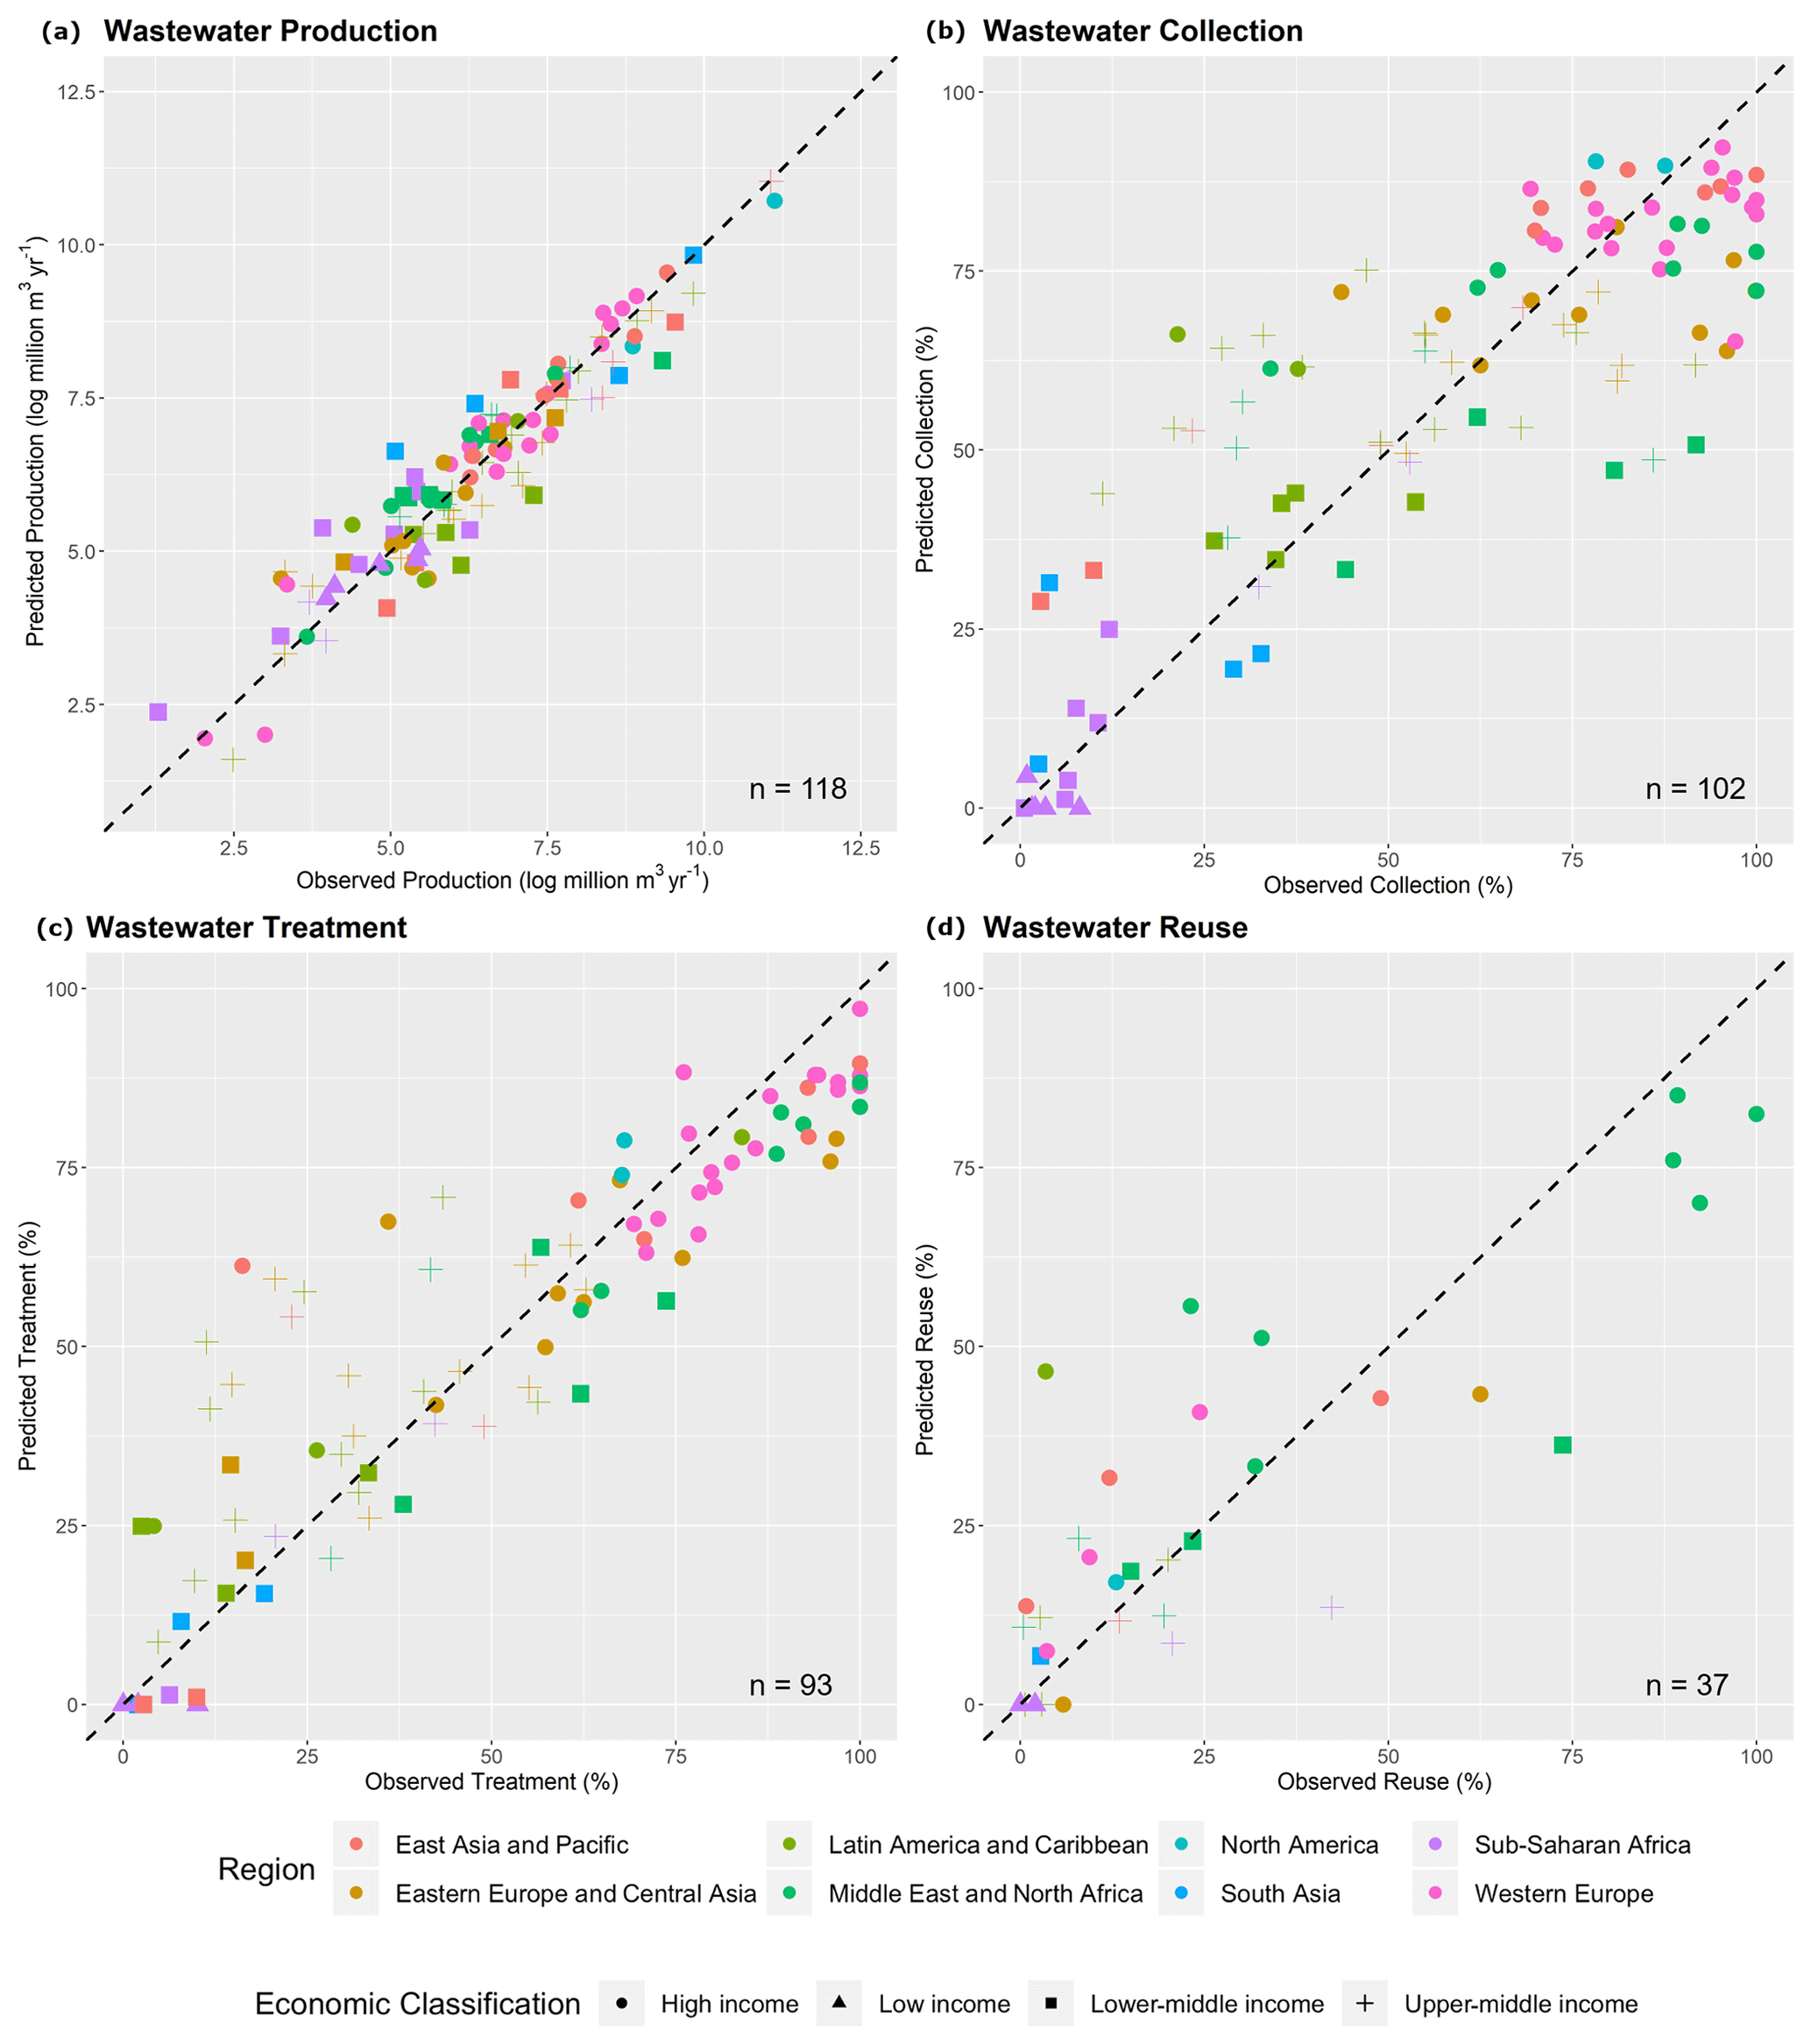
Figure 2Observed versus predicted wastewater production (a), collection (b), treatment (c) and reuse (d) from regression analysis.
Wastewater production was best predicted based on total population, GDP per capita and access to basic sanitation. A significant regression equation was found (p<0.001) with an adjusted R2 value of 0.89, with all predictor variables also significant at the p<0.001 level. While the number of people within a country was found to have the strongest influence on total wastewater production (β=0.96), the average economic output per inhabitant (β=0.31) and the level of access to wastewater services (β=0.19), such as flushing toilets to piped sewers, are important for determining the amount of wastewater produced per capita. These three factors therefore account for the combined effect of population size and variations in wastewater production per capita linked to economic and development factors in determining total wastewater production in a country. Comparing observed with predicted total wastewater production data demonstrates the overriding importance of a country's population, with wastewater production spread across multiple orders of magnitude for countries irrespective of geographical region or economic classification (Fig. 2a).
Wastewater collection was predicted (adjusted R2=0.69, p<0.001) based on the Human Development Index (HDI), urban population and wastewater production per capita. HDI, an overarching proxy for the level of development, was found to be the strongest influence over wastewater collection (β=0.50, p<0.001). Urban population (β=0.14, p<0.01) and wastewater production per capita (β=0.25, p<0.01) were also significant but less important predictor variables of wastewater collection. For urban populations, a greater proportion of a population living in urban areas resulted in higher collection rates for the country, while higher levels of wastewater production per capita corresponded to larger collection rates. The observed versus predicted wastewater collection rates are depicted in Fig. 2b, which displays the trend across different geographic zones and economic classifications.
Wastewater treatment was predicted (adjusted R2=0.80, p<0.001) based on GDP per capita (β=0.28, p<0.01) and wastewater collection (β=0.66, p<0.01). Countries with larger economic outputs per capita likely have more resources for wastewater treatment, resulting in higher overall treatment rates. As wastewater treatment is dependent upon wastewater collection, countries with higher wastewater collection rates typically also treat a greater proportion of their wastewater. Observed versus predicted wastewater treatment rates are displayed in Fig. 2c.
The amount of wastewater treated will determine the maximum potential for treated-wastewater reuse within a country. Water scarcity, particularly when driven by high irrigation water demands, is also a primary driver of wastewater reuse (Garcia and Pargament, 2015). To account for this relationship, the fraction of wastewater undergoing treatment processes and irrigation water scarcity was multiplied to give an integrated metric indicating the “availability of treated wastewater for irrigation water scarcity alleviation”. Wastewater reuse was predicted (adjusted R2=0.70, p<0.001) from this metric (β=0.60, p<0.01) in combination with the desalination capacity per capita (β=0.29, p<0.1), as an indicator of the prevalence of unconventional water resources in a country. The observed versus predicted wastewater reuse rates from this regression are displayed in Fig. 2d. Irrigation water scarcity data were unavailable for 53 countries, mostly small island nations. Here an alternate regression model was constructed based on desalination capacity per capita (β=0.63, p<0.01) and wastewater treatment (β=0.24, p<0.1) only, resulting in a slightly lower explained variance (R2=0.61). While these countries represent <1 % of the global population, this alternate regression was necessary to account for wastewater reuse occurring particularly in water-scarce small island nations. These islands typically lack renewable water resources and hence unconventional water resources such as desalinated water and treated wastewater represent a substantial proportion of the water availability (Jones et al., 2019).
3.2 Global wastewater production, collection, treatment and reuse
Globally, this study estimates that 359.4×10⁹ m3 yr−1 (358.0×10⁹–361.4×10⁹ m3 yr−1) of wastewater is produced annually, with a global average of 49.0 m3 yr−1 (48.8–49.2 m3 yr−1) per capita. Global annual wastewater collection and treatment is estimated at 225.6×10⁹ m3 yr−1 (224.4×10⁹–226.9×10⁹ m3 yr−1) and 188.1×10⁹ m3 yr−1 (186.6×10⁹–189.3×10⁹ m3 yr−1), respectively. These values indicate that approximately 63 % and 52 % of globally produced wastewater is collected and treated, respectively, with approximately 84 % of collected wastewater undergoing a treatment process. Wastewater reuse is estimated at 40.7×10⁹ m3 yr−1 (37.2×10⁹–47.0×10⁹ m3 yr−1), representing approximately 11 % of the total volume of wastewater produced. This estimate also indicates that approximately 22 % of treated wastewater undergoes intentional reuse, with the remaining 78 % (totalling 147.4×10⁹ m3 yr−1) discharged to the environment. This compares to the estimated 171.3×10⁹ m3 yr−1 of wastewater discharged directly to the environment without undergoing any form of treatment. It is worth highlighting that the vast majority of wastewater data are from reported sources, with just 2.4 %, 4.8 % and 5.2 % of global wastewater production, collection and treatment being from predicted values using regression. This occurs both due to the high population coverage and due to the missing data primarily being from developing countries, where wastewater production per capita and percentage collection and treatment rates are lower. The global quantification of wastewater reuse relies more heavily on predicted values, constituting 23.4 % of reuse volume globally. This occurs primarily due to poor data availability, particularly in countries with large populations in eastern Europe and Central Asia (e.g. Russia, Turkey and Poland) and western European countries, where wastewater treatment rates are generally high but the proportion of wastewater reused relies on simulations (e.g. Germany, Italy and Greece).
Table 4 displays wastewater production per capita (m3 yr−1 per capita) and wastewater production, collection, treatment and reuse (109 m3 yr−1), aggregated from the country data (reported + simulated) at the global scale and by region and level of economic development. Figure 3 displays wastewater data plotted at the country scale in proportional terms (m3 yr−1 per capita for production; percentage of produced wastewater for collection, treatment and reuse), facilitating direct comparisons between countries.
Table 4Wastewater production, collection, treatment and reuse (109 m3 yr−1) by region and level of economic development. The numbers in parentheses display the prediction uncertainty (2.5th and 97.5th confidence limits, in 109 m3 yr−1) on the totals based on the results of 1000 bootstrap regressions with random sampling and replacement.
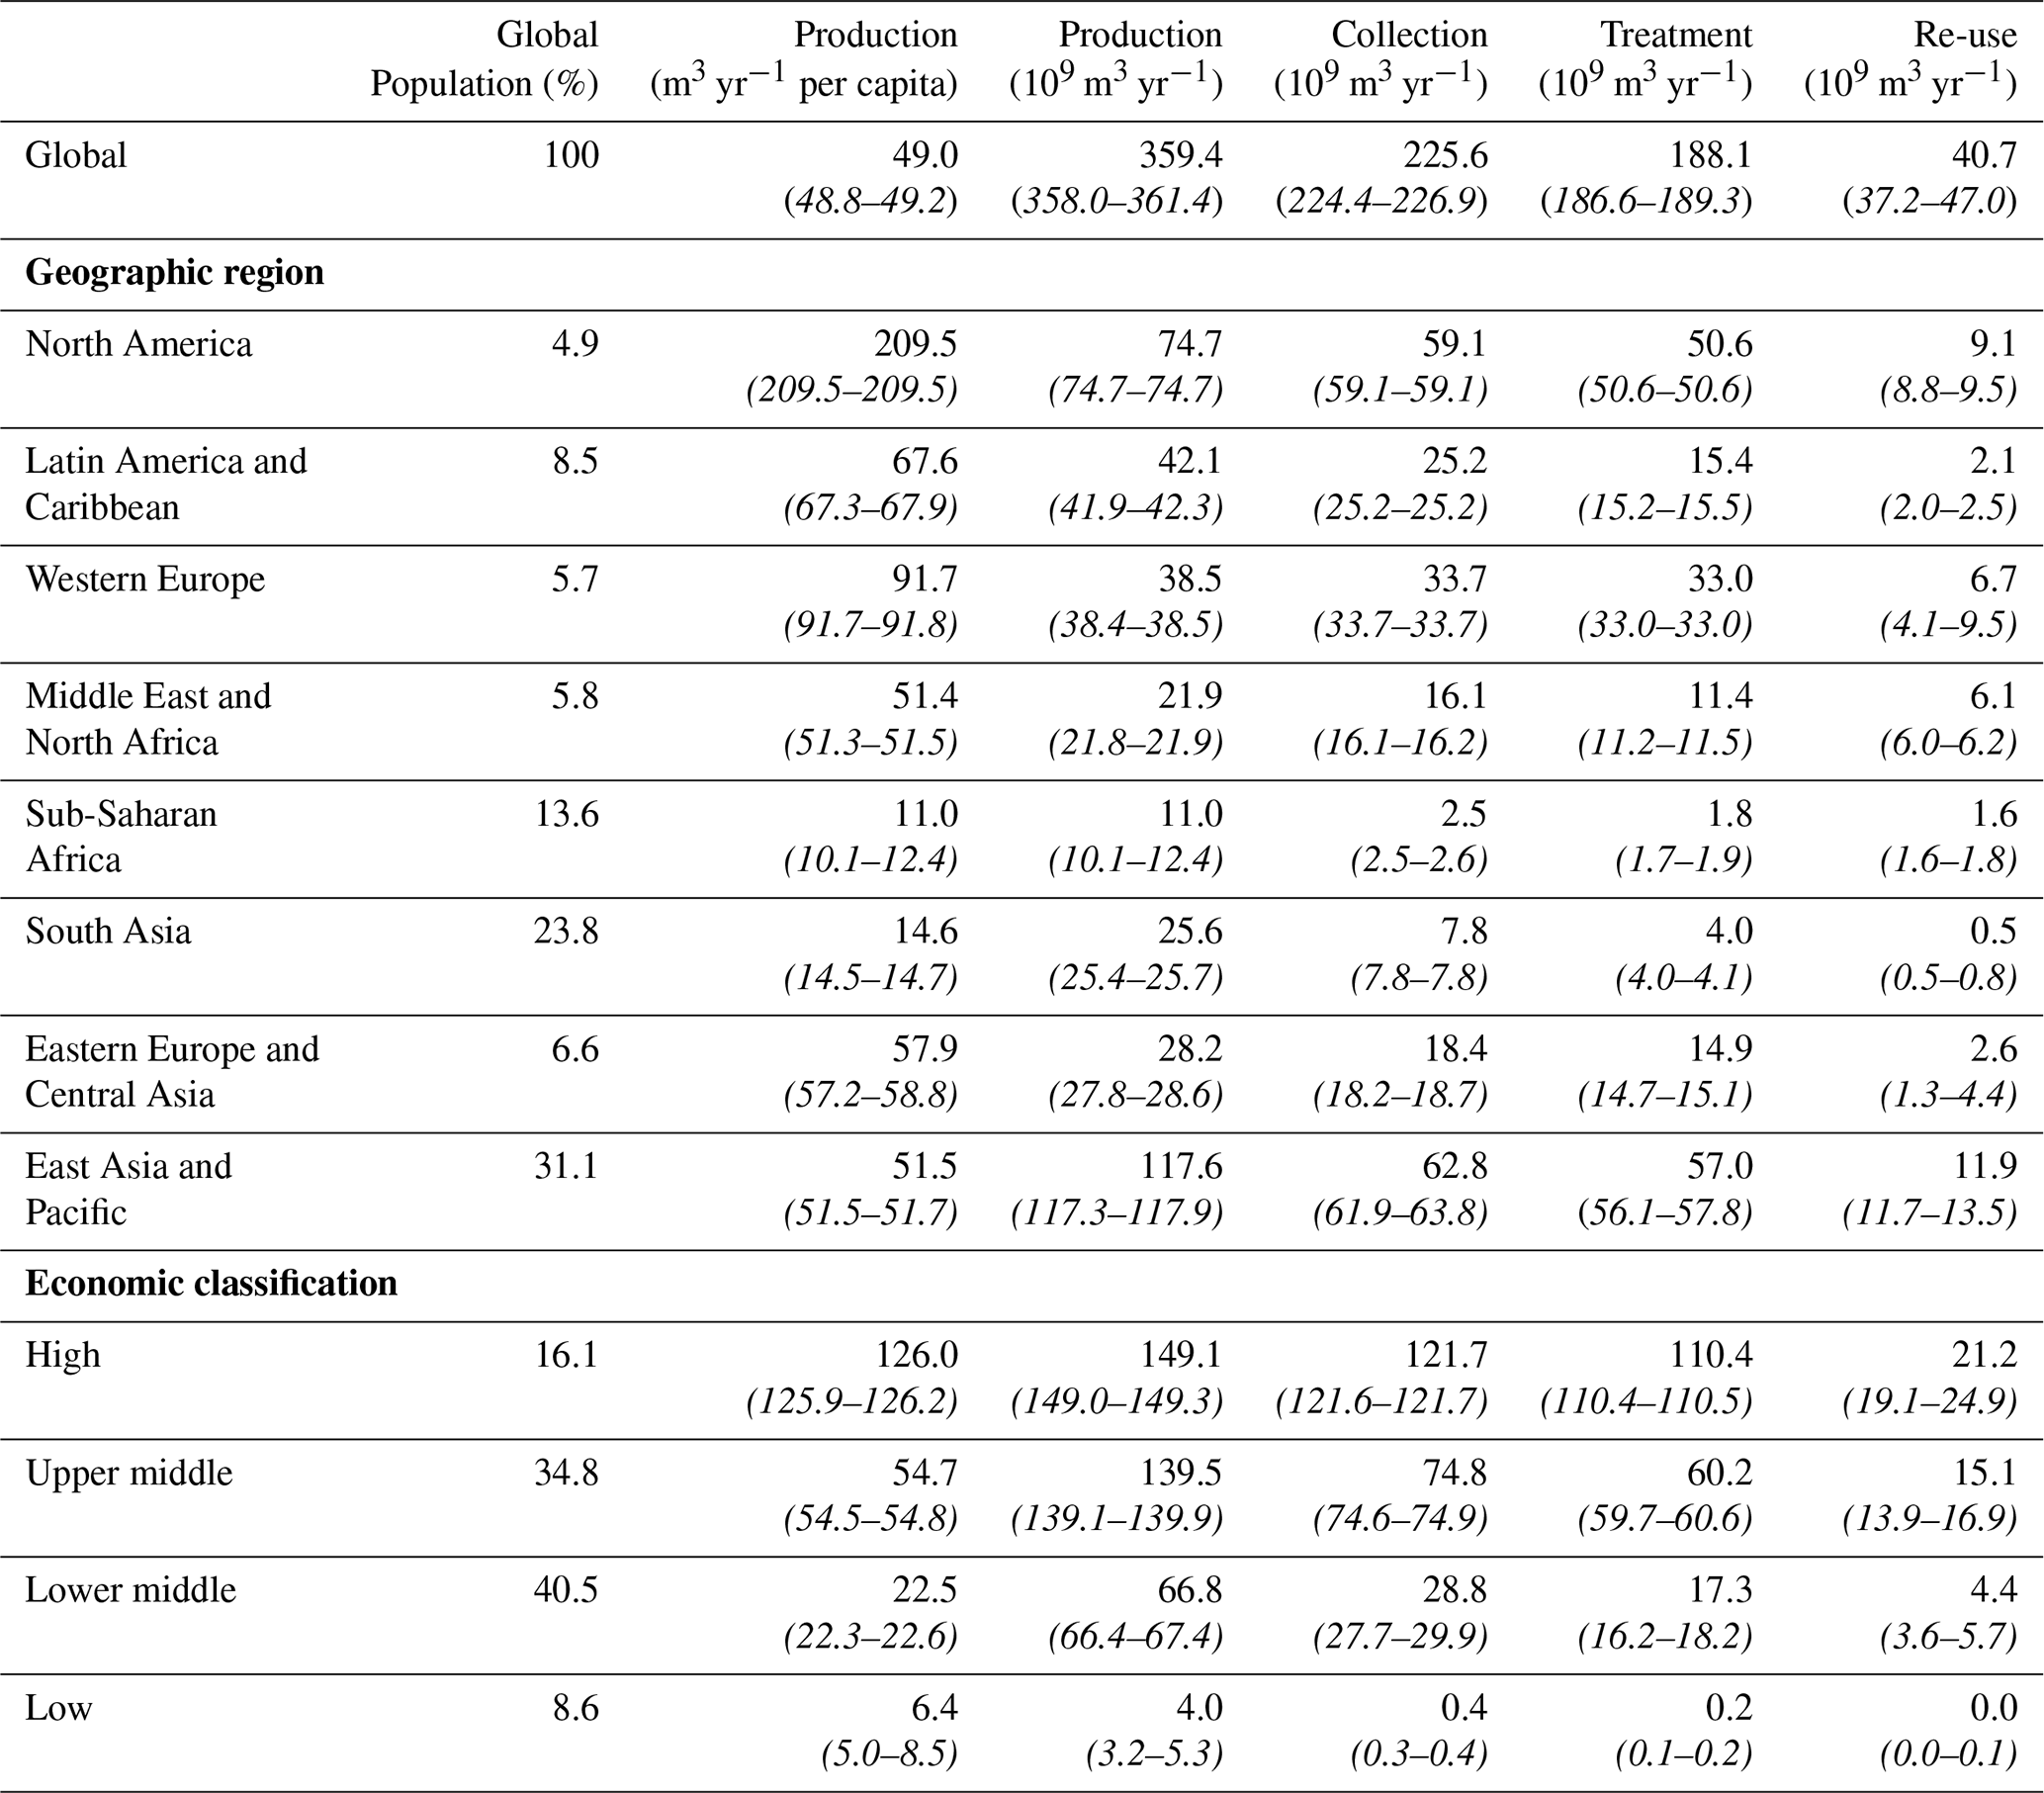

Figure 3Wastewater production (m3 yr−1 per capita) (a), collection (%) (b), treatment (%) (c) and reuse (%) (d) at the country scale.
Substantial differences in wastewater production, collection, treatment and reuse occur across different geographic regions and by the level of economic development. Wastewater production per capita is notably highest in North America at 209.5 m3 yr−1 per capita, over double that of western Europe (91.7 m3 yr−1 per capita), the next highest producing region per capita. When considering individual countries in these regions, the USA (211 m3 yr−1 per capita) and Canada (198 m3 yr−1 per capita), in addition to small, prosperous European countries (e.g. Andorra at 257 m3 yr−1 per capita, Austria at 220 m3 yr−1 per capita and Monaco at 203 m3 yr−1 per capita), are the highest producers per capita. Comparatively, the larger western European countries have lower wastewater production per capita, with Germany, the UK and France at 92, 92 and 66 m3 yr−1 per capita, respectively. Conversely, most sub-Saharan African countries produce less than 10 m3 yr−1 per capita. Wastewater production values are comparable to the World Health Organization's absolute minimum water requirements for survival of 2.7 m3 yr−1 per capita (WHO, 2011) in countries such as Niger (2.7 m3 yr−1 per capita), Burkina Faso (3.4 m3 yr−1) and Ethiopia (4.2 m3 yr−1 per capita). Aggregated for the region, sub-Saharan Africa produces approximately 20 times less wastewater than North America per capita, at 11.0 m3 yr−1 per capita.
In volumetric flow rate terms, the East Asia and Pacific region produces the most wastewater (117.6×10⁹ m3 yr−1), coinciding with the largest population share (∼31 %). Conversely, South Asia produces just ∼7 % of global wastewater despite a population share of ∼24 %, whereas the ∼5 % of people living in North America account for ∼20 % of global wastewater production. Wastewater production also varies greatly with level of economic development. The prominent discrepancies between economic classifications indicate a strong relationship between wealth and wastewater production regardless of geographic location. Wastewater production per capita more than doubles at each income classification level from low income (6.4 m3 yr−1 per capita) to high income (126.0 m3 yr−1 per capita). With respect to population size, people living in high-income countries (∼16 % global population) produce ∼42 % of global wastewater, compared to low- and lower-middle-income countries (∼50 % global population) producing ∼20 % of global wastewater.
Wastewater collection and treatment rates are highest in western Europe (88 % and 86 %, respectively) and lowest in South Asia (31 % and 16 %, respectively) and sub-Saharan Africa (23 % and 16 %, respectively). Wastewater collection is notably low in the East Asia and Pacific region, where total wastewater production is high. Conversely, wastewater collection in the Middle East and North Africa region is relatively high at 74 %, likely resulting from the lack of renewable water supplies. Wastewater treatment percentages follow similar regional patterns. Notably, wastewater treatment is substantially lower than wastewater collection in the Latin America and Caribbean and South Asia regions, potentially indicative of high rates of untreated-wastewater reuse in these regions. Wastewater collection and treatment percentages follow similar patterns as wastewater production with respect to income level, with high-income countries collecting and treating the majority of their wastewater (82 % and 74 %, respectively) down to low-income countries with small collection and treatment rates (9 % and 4 %, respectively). The proportion of collected wastewater being treated also decreases with income level, at 91 %, 73 %, 60 % and 47 % for high-, upper-middle-, lower-middle- and low-income classifications, respectively. The fact that 40 % and 53 % of collected wastewater is untreated in the lower-middle- and low-income classifications, respectively, may also be indicative of the higher prevalence of intentional untreated-wastewater reuse (whereby collected wastewater is reused without undergoing treatment).
High utilisation of treated-wastewater reuse occurs predominantly in the Middle East and North Africa, with the United Arab Emirates, Kuwait and Qatar reusing more than 80 % of their produced wastewater. Water-scarce small island developed countries, including the Cayman Islands, US Virgin Islands and Malta also have high rates of intentional treated-wastewater reuse of 78 %, 75 % and 67 %, respectively. Treated-wastewater reuse is prohibitively low in areas with low wastewater treatment rates, such as sub-Saharan Africa and South Asia. In addition, treated-wastewater reuse is also low in areas with sufficient availability of conventional water resources such as across Scandinavia (where reuse is <5 %).
In volumetric flow rate terms, intentional treated-wastewater reuse is estimated to be largest in the East Asia and Pacific region (11.9×10⁹ m3 yr−1) and North America (9.1×10⁹ m3 yr−1) and lowest in South Asia (0.5×10⁹ m3 yr−1) and sub-Saharan Africa (1.6×10⁹ m3yr−1). Conversely the Middle East and North Africa (27.8 %) and western Europe (17.5 %) dominate in percentage terms. In volumetric flow rate units, the Middle East and North Africa (15 %) and western Europe (16 %) account for almost a third of treated-wastewater reuse globally, despite only accounting for 5.8 % and 5.7 % of the global population, respectively. Approximately half (52 %) of intentional treated-wastewater reuse occurs in high-income countries, with 37 % from upper-middle-income countries. Intentional treated-wastewater reuse is contingent upon the availability of treated-wastewater resources, which is typically more prevalent in high-income countries (who both produce more wastewater per capita and treat a higher percentage of the resource). However, the proportion of treated wastewater intentionally reused is higher in the upper-middle- (25 %) and lower-middle-income (25 %) groups than in the high-income group (19 %).
3.3 Gridded wastewater production, collection, treatment and reuse
Figure 4 displays gridded wastewater production, collection, treatment and reuse, allowing for the identification of hotspot regions and zones at 5 arcmin resolution. Wastewater production occurs across the globe, with hotspots coinciding with the largest metropolitan areas (e.g. Tokyo and Mumbai) where the largest concentration of domestic and industrial activities occurs (Fig. 4a). In contrast, wastewater production is close to zero in world regions with low concentrations of people and industrial activities, such as the Sahara, inland Australia and the high-latitude climate zones (e.g. northern Canada and Russia). In countries where municipal activities are heavily concentrated in a small number of cities, such as in the Middle East and Australia, small clusters of grid cells with very high wastewater production ( m3 yr−1) occur. Wastewater collection (Fig. 4b) and treatment (Fig. 4c) are typically more concentrated in urban areas within individual countries. This is particularly prominent in South America and sub-Saharan Africa. Conversely, downscaled wastewater collection and treatment reflect wastewater production in regions where wastewater collection and treatment rates are very high, such as western Europe and Scandinavia. Wastewater reuse is constrained to the lowest area (number of grid cells), being concentrated in regions where treated-wastewater resources are available and where water scarcity issues are of particular concern.
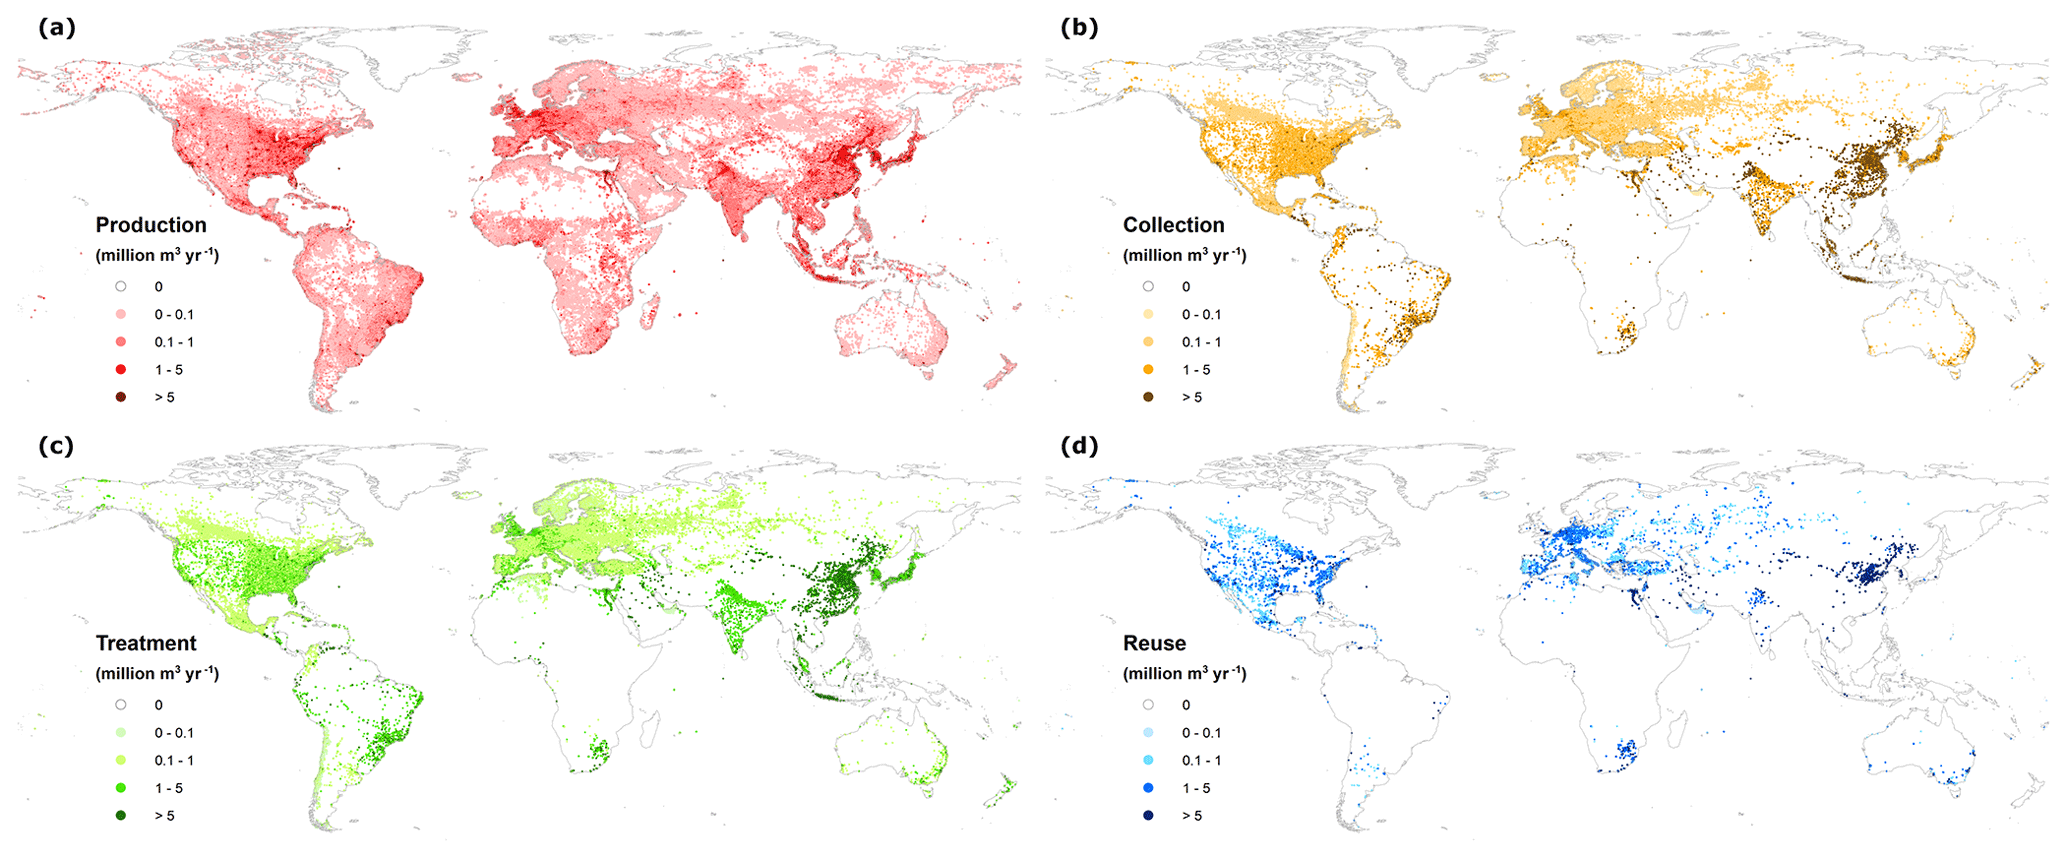
Figure 4Gridded wastewater production (a), collection (b), treatment (c) and reuse (d) (106 m3 yr−1) at 5 arcmin spatial resolution.
Figure 5a displays the global distribution of the wastewater treatment plants and designated wastewater reuse sites considered in this study. Plant capacities were compared to downscaled quantifications for validation of wastewater treatment (Fig. 5b) and wastewater reuse (Fig. 5c). Overall, a reasonable performance is obtained at most wastewater treatment and reuse plants with linear R2 values of 0.57 (p<0.001) and 0.50 (p<0.001), respectively. The observed negative normalised biases suggest that downscaled wastewater treatment (−0.32) and reuse (−0.51) were underestimated with respect to the observed treatment capacities. This may occur due to discrepancies between the design (i.e. maximum) capacity of wastewater treatment plants, which is commonly the capacity that is reported, versus the actual treated-wastewater volumes. Factors such as the construction year of wastewater treatment plant are important, as plants are constructed to be larger than current requirements in anticipation of future increases in wastewater flows. Furthermore, uncertainties in the data used as basis for downscaling wastewater production (i.e. PCR-GLOBWB return flows) directly impacts the downscaled results of wastewater treatment. For example, the underprediction of return flows in urban areas and overprediction in rural areas could lead to the overprediction of wastewater treatment in areas without treatment plants and underprediction of wastewater treatment for grid cells with large treatment capacities.
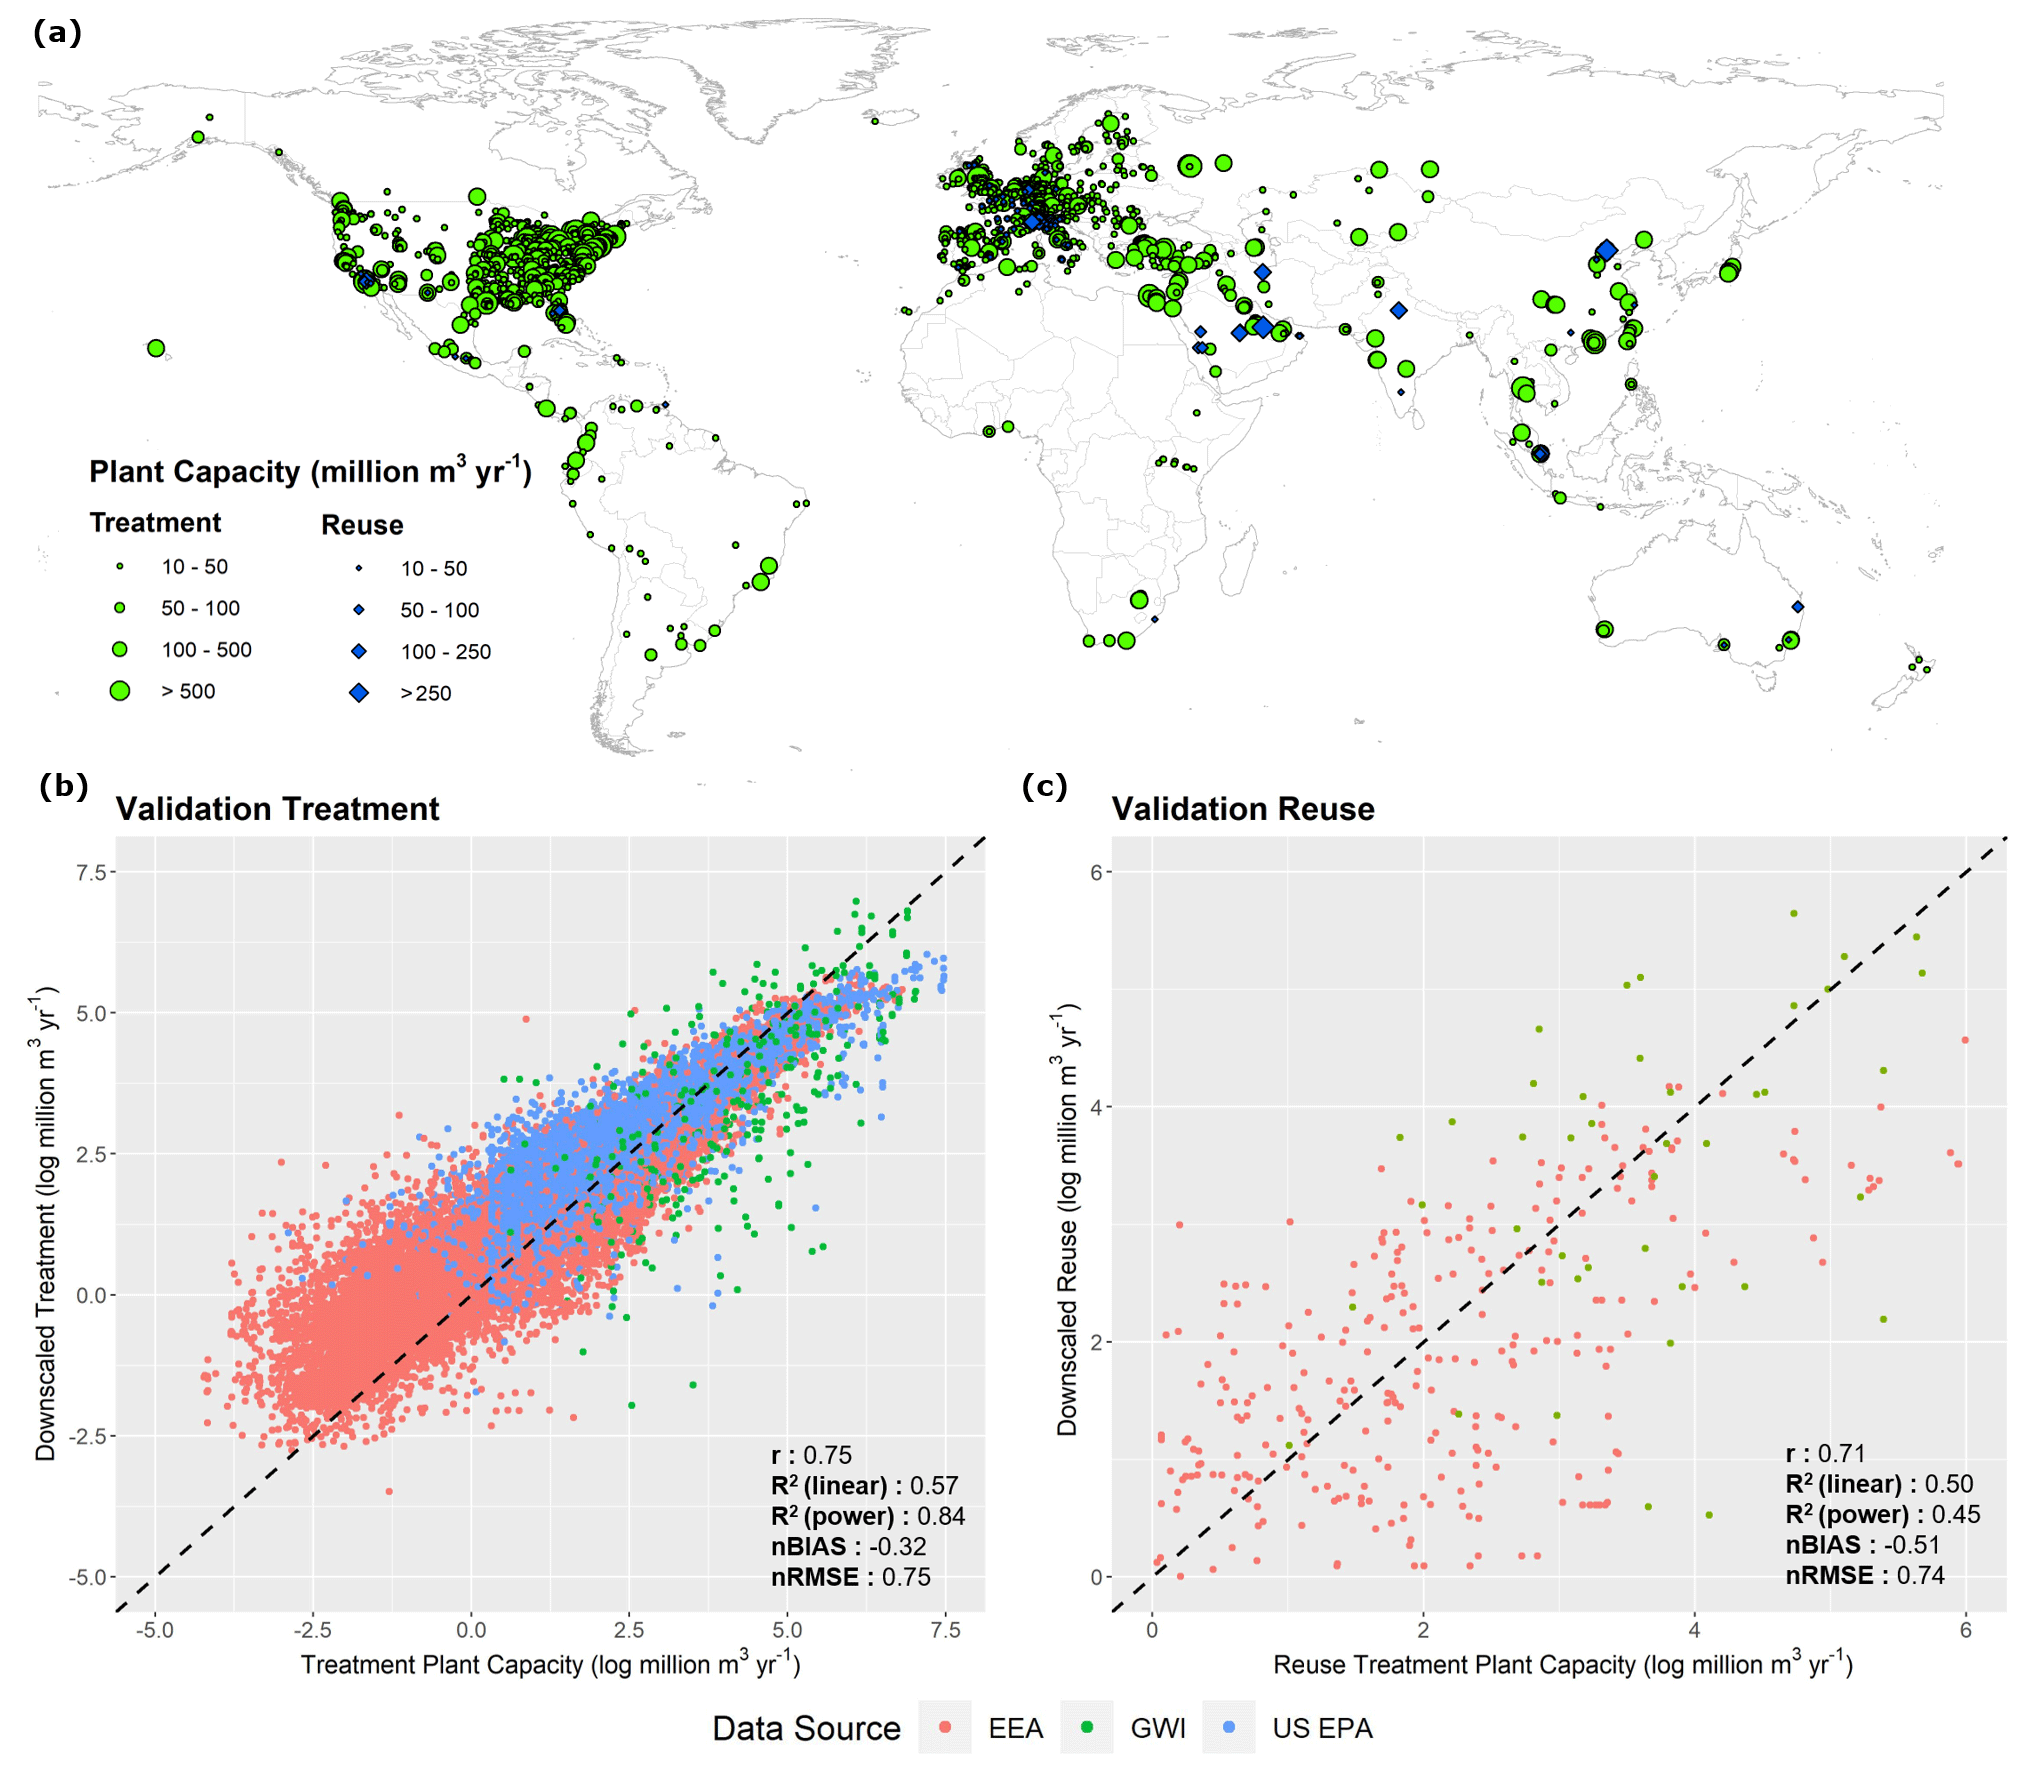
Figure 5Global distribution of wastewater treatment plants and designated wastewater reuse sites (a) and validation of downscaling approach for wastewater treatment (b) and wastewater reuse (c).
The country-level and spatially explicit (5 arcmin) wastewater production, collection, treatment and reuse datasets can be accessed at https://doi.org/10.1594/PANGAEA.918731 (Jones et al., 2020).
This study aimed to develop a consistent and comprehensive spatially explicit assessment of global domestic and industrial wastewater production, collection, treatment and reuse for the reference year of 2015. Multiple linear regression models using a diverse set of social, economic, geographic and hydrological datasets were fit for country-level wastewater data collated for a variety of sources. These relationships applied for predictions of wastewater production, collection, treatment and reuse for countries where data were unavailable. Bootstrapping with random sampling and replacement was employed to quantify prediction uncertainty. It should be noted that bootstrapping only accounts for uncertainty in the regression terms, not for uncertainties in the underpinning source data. Uncertainties associated with wastewater observations are not accounted for in this study, despite likely being substantial. Nevertheless, this study represents the first attempt to simultaneously analyse wastewater production, collection, treatment and reuse for all countries across the globe. While agricultural runoff is also a substantial source of pollution, this is outside the scope of this study. Country-level data on agricultural runoff were sparse, necessitating modelling approaches to quantify irrigation return flow by calculating net demand (e.g. based on crop composition and irrigated area per grid cell), gross irrigation demand (to account for irrigation efficiency and losses) and water withdrawals (Sutanudjaja et al., 2018). Agricultural runoff is also rarely collected or treated (UNEP, 2016) and, hence, is less applicable for inclusion in this study.
Our global quantification of wastewater production of 359.4×10⁹ m3 yr−1 (358.0×10⁹–361.4×10⁹ m3 yr−1) is broadly in accordance with previous quantifications, such as 380×109 m3 yr−1 quantified based on reported data and urban population (Qadir et al., 2020) and 450×109 m3 yr−1 quantified by modelling of return flows in WaterGAP3 (Water – Global Analysis and Prognosis; Flörke et al., 2013). Few studies were found analysing the global state of wastewater collection, treatment and reuse. Our quantification of wastewater collection, which is estimated at 225.6×10⁹ m3 yr−1 (224.4×10⁹–226.9×10⁹ m3 yr−1), can give an important indication of the amount of collected wastewater that goes untreated. At the global scale, this study estimates that wastewater treatment is 188.1×10⁹ m3 yr−1 (186.6×10⁹–189.3×10⁹ m3 yr−1), or 52 % of the produced wastewater. By extension, 48 % of produced wastewater is released to the environment without treatment (either directly or following collection). This is substantially lower than the commonly cited statistic that ∼80 % of global wastewater is released to the environment without treatment (WWAP, 2017; UNESCO, 2017). Our quantifications of wastewater treatment must be treated with caution however – particularly in the developing world – as wastewater treatment plants typically operate at capacities below the installed (and usually reported) capacities (Mateo-Sagasta et al., 2015; Murray and Drechsel, 2011) that are used for country-level estimates. Similarly, wastewater plants may be entirely non-functional (mothballed) due to a lack of funding and maintenance or have unsuitable treatment processes for the incoming wastewater, yet the associated wastewater volumes are still reported as treated (Qadir et al., 2010). Therefore, it is possible that the actual treated volume of wastewater is somewhat below our estimated 52 % and that the proportion of collected wastewater which is not treated could far exceed 16 %. “Wastewater treatment” is also a generic term that may refer to any form of wastewater treatment regardless of level (e.g. primary, secondary or tertiary), which this study does not attempt to distinguish between. This is due to different data sources reporting different levels of treatment, for instance with the GWI only reporting secondary treatment or above, while FAO AQUASTAT also includes primary treatment.
In percentage terms, wastewater treatment by economic classification is broadly in line with previous work (Sato et al., 2013), which estimates wastewater treatment to be 70 %, 38 %, 28 % and 8 % for high-income, upper-middle-income, lower-middle-income and low-income countries, respectively, compared to our quantifications of 74 %, 43 %, 26 % and 4.2 %. While similar, these estimations could potentially indicate that percentage collection and treatment have increased in the developed world but have decreased in the developing world. This could be caused by wastewater production, particularly in the developing world, rising at a faster pace than the development of collection infrastructure and treatment facilities (Sato et al., 2013). It should be noted that while the aim of wastewater collection and treatment is to reduce pollutant loadings to minimise risks to human health and the environment, these facilities can also act as point sources of pollution. Wastewater collection concentrates pollutants which can pose serious water quality issues if discharged with insufficient treatment. Furthermore, a range of emerging pollutants (e.g. pharmaceuticals, pesticides and industrial chemicals) are concentrated in wastewater collection networks (Geissen et al., 2015). These pollutants are of particular concern, as they are not typically monitored for or sufficiently removed in wastewater treatment processes, with ambiguous risks posed to human and environmental health even in low concentrations (Deblonde et al., 2011; Geissen et al., 2015). The solution is not however to collect less wastewater but to increase treatment in terms of percentage of collected wastewater, treatment level and the number of pollutants (UNEP, 2016).
The drivers behind wastewater reuse are a complex mixture of social, economic, geographic and hydrological factors, and data are highly limited globally. Nevertheless, this study represents the first attempt to quantify intentional treated-wastewater reuse at the country scale. It should be noted that this study does not aim to quantify either de facto (unintentional) treated-wastewater reuse or any form (intentional or unintentional) of untreated-wastewater reuse. The total volume of wastewater reused for human purposes is therefore likely much greater than the 40.7×10⁹ m3 yr−1 of intentional treated-wastewater reuse estimated in this study. For example, previous research has indicated that the magnitude of intentional untreated-wastewater reuse may be approximately 10 times greater than intentional treated-wastewater reuse (Scott et al., 2010).
This study sought to downscale country-level wastewater estimates to spatially explicit (grid-based) quantifications for purposes such as large-scale water resource assessments and water quality modelling. Wastewater production has previously been quantified based only on simulated return flows in hydrological models (Flörke et al., 2013). We instead used the proportions of simulated return flows to downscale country-based volumes of wastewater production. Our results also represent the first efforts to quantify global wastewater collection, treatment and reuse at the sub-national level. Our validation results suggest that our downscaled estimates of wastewater treatment and reuse are, in general, realistic. However, a number of uncertainties should also be considered. Firstly, our downscaling for wastewater production inherently relies on the ability to accurately simulate domestic and industrial return flows and, hence, on the methodology for calculating gross and net water demand (Wada et al., 2014). As we downscale using the return flows proportionally, accurate spatial disaggregation of return flows is more important than the absolute simulated flow volumes. The accuracy of downscaled wastewater collection relies on the assumption that this preferentially occurs in areas where wastewater production is highest. Due to the high capital costs of wastewater treatment plants, combined with economies of scale, we deem this a logical assumption (Hernández-Chover et al., 2018; Hernandez-Sancho et al., 2011). Lacking more detailed information on the spatial variance in wastewater collection compared to treatment, we assume an equal wastewater treatment rate across all cells that have a collected wastewater allocation. Wastewater reuse is downscaled with the only additional criteria being an indicator of water scarcity. While water scarcity is an important driver of wastewater reuse, site-specific social, economic and political factors will also have a large influence on the viability of wastewater reuse on a case-by-case basis (WWAP, 2017). Accounting for these factors is outside the scope of this study. Furthermore, uncertainties in the validation datasets, both in terms of treatment capacity and geographical location, must also be recognised. Overall, due to the global scale of this work and the available data for validation, we purposely opt for more simple and parsimonious approaches where possible.
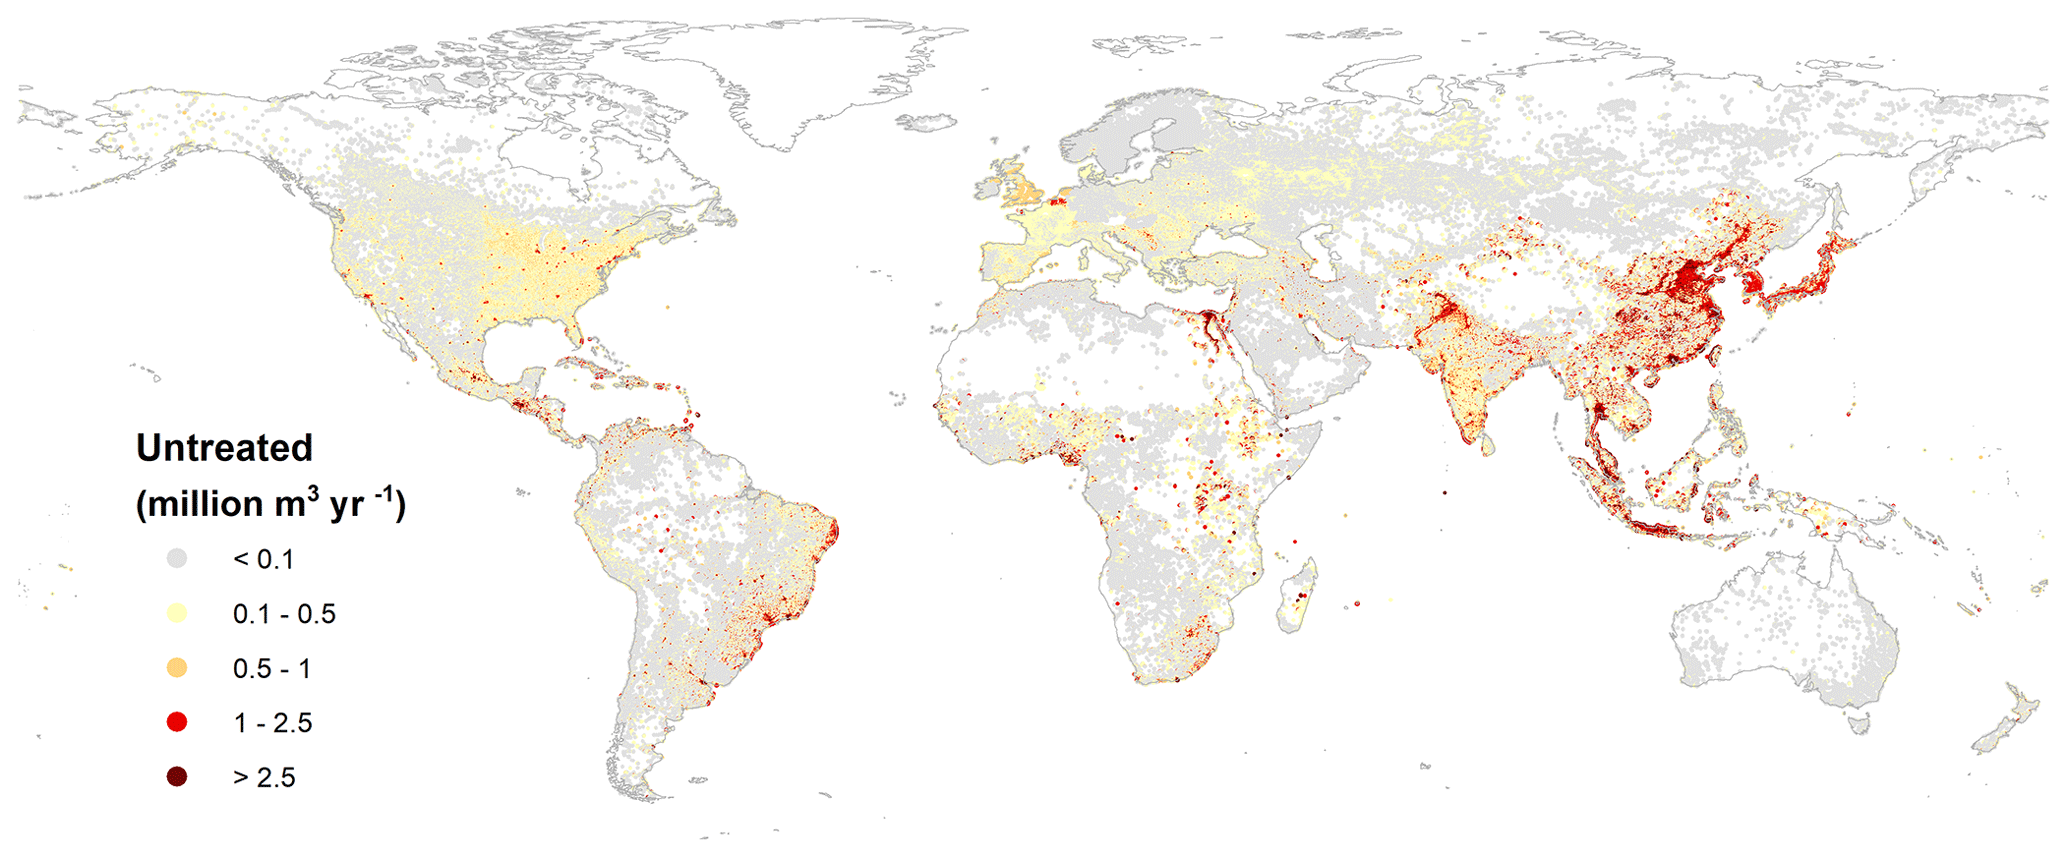
Figure 6Gridded untreated-wastewater flows to the environment (106 m3 yr−1) at 5 arcmin spatial resolution.
This study did not target acreage in its considerations of wastewater reuse, which has been a common method in previous work. For example, estimates made a decade ago suggest that up to 200 million farmers practice wastewater irrigation over an area of 4.5×10⁶–20.0×10⁶ ha worldwide (Jiménez and Asano, 2008; Raschid-Sally and Jayakody, 2008). More recently, a global, spatially explicit assessment of irrigated croplands influenced by municipal wastewater flows estimated the area under direct and indirect wastewater irrigation at 36×106 ha, of which 29×106 ha are likely exposed to untreated-wastewater flows (Thebo et al., 2017). These estimates were based on modelling studies and considered wastewater in both diluted and undiluted forms with a cropping intensity of 1.48 (Thebo et al., 2014). Considering the same cropping intensity and recent estimates of wastewater production (380×109 m3 yr−1), the irrigation potential of undiluted wastewater was estimated at 42×106 ha (Qadir et al., 2020).
Our results have a range of important applications including as input data for water resource assessments and as a baseline for informing and evaluating economic and management policies related to wastewater. For example, our data can be used to assess progress towards SDG 6.3 aimed at halving the proportion of untreated wastewater discharged into water bodies. As our data are standardised for 2015 and provide full geographic coverage, problems of discrepancies in data reporting years and missing data are reduced. Similarly, our data allow for identification of hotspot regions, whereby the proportions of wastewater collected and treated are low, and of areas where large volumes of wastewater are entering the environment untreated (Fig. 6). Volumetrically, substantial untreated-wastewater flows to the environment are found across South and Southeast Asia, particularly in the populous regions of Pakistan, Malaysia, Indonesia, India and China. Information on untreated-wastewater flows have a diverse range of important implications for global water quality modelling and human health assessments.
Our results also highlight the vast potential of treated wastewater as an unconventional water resource for augmenting water resources and alleviating water scarcity, particularly in water-scarce regions. To put wastewater as a potential resource into perspective, its estimated global volume of is comparable to the global consumptive use of non-renewable groundwater for irrigation of 150–400 km3 yr−1 over the years 2000–2010 (Bierkens and Wada, 2019) and more than 10 times greater than the current global desalination capacity of ∼35 km3 yr−1 (Jones et al., 2019). As wastewater production continues to rise with population and economic growth, wastewater management and reuse practices will become more important in the future (WWAP, 2017). Expansion in reuse of wastewater must be accompanied by strong legislation and regulations to ensure its safety (Smol et al., 2020; Voulvoulis, 2018). However, in response to concerns related to groundwater contamination, disruption to industrial processes and impacts for human health, tightening regulation can also be a barrier to expansion in treated-wastewater reuse (Voulvoulis, 2018). It should also be recognised that wastewater reuse is not viable in all regions due to economic, technical and social considerations (Voulvoulis, 2018). Particularly in water-scarce developing countries with economic constraints, the application of untreated wastewater (diluted or undiluted) will likely remain the dominant form of wastewater reuse (Qadir et al., 2010). This is especially true in dry areas, despite official restrictions and regardless of potential health implications, where untreated-wastewater reuse is triggered because (1) wastewater is a reliable or often the only guaranteed water source available throughout the year; (2) the need to apply fertilisers decreases as wastewater is a source of nutrients; (3) wastewater reuse can be cheaper and less energy intensive than other water sources, such as if the alternative clean water source is deep groundwater; and (4) additional economic benefits include higher income generation from the cultivation and marketing of high-value crops, which can create year-round employment opportunities.
The continued failure to address wastewater as a major social and environmental challenge prohibits progress towards the 2030 Agenda for Sustainable Development (WWAP, 2017). Ultimately, the cost of action must also be weighed against the cost of inaction (Hernández-Sancho et al., 2015). A paradigm shift in wastewater management is required from viewing wastewater as solely an environmental problem associated with pollution control and regulations to recognising the economic opportunities of wastewater, which can provide a means of financing management and treatment (Wichelns et al., 2015; WWAP, 2017). In addition to revenue from selling treated wastewater for reuse, these opportunities include fit-for-purpose treatment (Chhipi-Shrestha et al., 2017), recovery of energy and nutrients (Qadir et al., 2020), and cascading reuse of water from high to lower quality (Hansen et al., 2016). Creative exploitation of these opportunities offers the potential to support the transition to a circular economy (Smol et al., 2020; Voulvoulis, 2018) and make progress towards many interconnected SDGs such as achieving a water-secure future for all (WWAP, 2017).
ERJ performed the analyses, drafted the paper, and developed the study with the input of MTHvV and MFPB. MTHvV, MQ and MFPB provided feedback and guidance throughout the entire process. All authors contributed to and approved the paper.
The authors declare that they have no conflict of interest.
The authors are grateful to Edwin Sutanudjaja, Rens van Beek and Yoshihide Wada for providing data from PCR-GLOBWB2 and WFaS to support this work. Manzoor Qadir appreciates support of the government of Canada for UNU-INWEH through Global Affairs Canada.
This paper was edited by David Carlson and reviewed by two anonymous referees.
Beard, J., Bierkens, M. F. P., and Bartholomeus, R.: Following the Water: Characterising de facto Wastewater Reuse in Agriculture in the Netherlands, Sustainability, 11, 5936, https://doi.org/10.3390/su11215936, 2019.
Bierkens, M. F. P. and Wada, Y.: Non-renewable groundwater use and groundwater depletion: a review, Environ. Res. Lett., 14, 063002, https://doi.org/10.1088/1748-9326/ab1a5f, 2019.
Country-specific data on total volume of municipal wastewater produced at the national level, available at: https://www.globalwaterintel.com (last access: 5 January 2020), 2015.
Chhipi-Shrestha, G., Hewage, K., and Sadiq, R.: Fit-for-purpose wastewater treatment: Conceptualization to development of decision support tool (I), Sci. Total Environ., 607–608, 600–612, https://doi.org/10.1016/j.scitotenv.2017.06.269, 2017.
Data on generation and discharge of wastewater in volume in EU member countries, potential EU candidate countries and other European countries, available at: http://ec.europa.eu/eurostat/data/database, last access: 5 January 2020.
de Graaf, I. E. M., van Beek, L. P. H., Wada, Y., and Bierkens, M. F. P.: Dynamic attribution of global water demand to surface water and groundwater resources: Effects of abstractions and return flows on river discharges, Adv. Water Resour., 64, 21–33, https://doi.org/10.1016/j.advwatres.2013.12.002, 2014.
Deblonde, T., Cossu-Leguille, C., and Hartemann, P.: Emerging pollutants in wastewater: a review of the literature, Int. J. Hyg. Environ. Health, 214, 442–448, https://doi.org/10.1016/j.ijheh.2011.08.002, 2011.
El Moussaoui, T., Wahbi, S., Mandi, L., Masi, S., and Ouazzani, N.: Reuse study of sustainable wastewater in agroforestry domain of Marrakesh city, J. Saudi Soc. Agric. Sci., 18, 288–293, https://doi.org/10.1016/j.jssas.2017.08.004, 2019.
Environmental Indicators: https://unstats.un.org/unsd/envstats/qindicators, last access: 5 January 2020.
EPA Facility Registry Service (FRS): Wastewater Treatment Plants, available at: https://edg.epa.gov/data/PUBLIC/OEI/OIC/FRS_Wastewater.zip, last access: 5 January 2020.
Ercin, A. E. and Hoekstra, A. Y.: Water footprint scenarios for 2050: A global analysis, Environ. Int., 64, 71–82, https://doi.org/10.1016/j.envint.2013.11.019, 2014.
Flörke, M., Teichert, E., Bärlund, I., Eisner, S., Wimmer, F., and Alcamo, J.: Domestic and industrial water uses of the past 60 years as a mirror of socio-economic development: A global simulation study, Glob. Environ. Change, 23, 144–156, https://doi.org/10.1016/j.gloenvcha.2012.10.018, 2013.
Garcia, X. and Pargament, D.: Reusing wastewater to cope with water scarcity: Economic, social and environmental considerations for decision-making, Resour. Conserv. Recycl., 101, 154–166, https://doi.org/10.1016/j.resconrec.2015.05.015, 2015.
Geissen, V., Mol, H., Klumpp, E., Umlauf, G., Nadal, M., van der Ploeg, M., van de Zee, S. E. A. T. M., and Ritsema, C. J.: Emerging pollutants in the environment: A challenge for water resource management, Int. Soil Water Conserv. Res., 3, 57–65, https://doi.org/10.1016/j.iswcr.2015.03.002, 2015.
Global information system on water and agriculture, available at: http://www.fao.org/nr/water/aquastat/wastewater/index.stm, last access: 5 January 2020.
Gude, V. G.: Desalination and water reuse to address global water scarcity, Rev. Environ. Sci. Biol., 16, 591–609, https://doi.org/10.1007/s11157-017-9449-7, 2017.
Hanasaki, N., Fujimori, S., Yamamoto, T., Yoshikawa, S., Masaki, Y., Hijioka, Y., Kainuma, M., Kanamori, Y., Masui, T., Takahashi, K., and Kanae, S.: A global water scarcity assessment under Shared Socio-economic Pathways – Part 2: Water availability and scarcity, Hydrol. Earth Syst. Sci., 17, 2393–2413, https://doi.org/10.5194/hess-17-2393-2013, 2013. bibitem17 Hansen, E., Rodrigues, M., and Aquim, P.: Wastewater reuse in a cascade based system of a petrochemical industry for the replacement of losses in cooling towers, J. Environ. Manage., 181, 157–162, https://doi.org/10.1016/j.jenvman.2016.06.014, 2016.
Hernández-Chover, V., Bellver-Domingo, Á., and Hernández-Sancho, F.: Efficiency of wastewater treatment facilities: The influence of scale economies, J. Environ. Manage., 228, 77–84, https://doi.org/10.1016/j.jenvman.2018.09.014, 2018.
Hernandez-Sancho, F., Molinos-Senante, M., and Sala-Garrido, R.: Cost modelling for wastewater treatment processes, Desalination, 268, 1–5, https://doi.org/10.1016/j.desal.2010.09.042, 2011.
Hernández-Sancho, F., Lamizana-Diallo, B., Mateo-Sagasta, J., and Qadir, M.: Economic valuation of wastewater: The cost of action and the cost of no action, UNEP, Nairobi, 2015.
Jiménez, B. and Asano, T.: Water Reuse: An International Survey of Current Practice, Issues and Needs, IWA Publishing, 2008.
Jones, E., Qadir, M., van Vliet, M. T. H., Smakhtin, V., and Kang, S.-M.: The state of desalination and brine production: A global outlook, Sci. Total Environ., 657, 1343–1356, https://doi.org/10.1016/j.scitotenv.2018.12.076, 2019.
Jones, E., van Vliet, M. T. H., Qadir, M., and Bierkens, M. F. P.: Country-level and gridded wastewater production, collection, treatment and re-use, PANGAEA, https://doi.org/10.1594/PANGAEA.918731, 2020.
Khalil, M. and Hussein, H.: Use of waste water for aquaculture: An experimental field study at a sewage-treatment plant, Egypt, Aquac. Res., 28, 859–865, https://doi.org/10.1046/j.1365-2109.1997.00910.x, 2008.
Kummu, M., Guillaume, J., Moel, H., Eisner, S., Flörke, M., Porkka, M., Siebert, S., Veldkamp, T. I. E., and Ward, P.: The world's road to water scarcity: Shortage and stress in the 20th century and pathways towards sustainability, Sci. Rep., 6, 38495, https://doi.org/10.1038/srep38495, 2016.
Luthy, R. G., Sedlak, D. L., Plumlee, M. H., Austin, D., and Resh, V. H.: Wastewater-effluent-dominated streams as ecosystem-management tools in a drier climate, Front. Ecol. Environ., 13, 477–485, https://doi.org/10.1890/150038, 2015.
Mateo-Sagasta, J., Raschid-Sally, L., and Thebo, A.: Global Wastewater and Sludge Production, Treatment and Use, in: Wastewater: Economic Asset in an Urbanizing World, edited by: Drechsel, P., Qadir, M., and Wichelns, D., Springer Netherlands, Dordrecht, 15–38, 2015.
Morote, Á., Olcina, J., and Hernández, M.: The Use of Non-Conventional Water Resources as a Means of Adaptation to Drought and Climate Change in Semi-Arid Regions: South-Eastern Spain, Water, 11, 93, https://doi.org/10.3390/w11010093, 2019.
Murray, A. and Drechsel, P.: Why do some wastewater treatment facilities work when the majority fail? Case study from the sanitation sector in Ghana, Waterlines, 30, 135–149, https://doi.org/10.3362/1756-3488.2011.015, 2011.
Qadir, M., Boelee, E., Amerasinghe, P., and Danso, G.: Costs and Benefits of Using Wastewater for Aquifer Recharge, in: Wastewater: Economic Asset in an Urbanizing World, edited by: Drechsel, P., Qadir, M., and Wichelns, D., Springer Netherlands, Dordrecht, 153–167, 2015.
Qadir, M., Drechsel, P., Jiménez Cisneros, B., Kim, Y., Pramanik, A., Mehta, P., and Olaniyan, O.: Global and regional potential of wastewater as a water, nutrient and energy source, Nat. Resour. Forum, 44, 40–51, https://doi.org/10.1111/1477-8947.12187, 2020.
Qadir, M., Jiménez, G., Farnum, R., Dodson, L., and Smakhtin, V.: Fog Water Collection: Challenges beyond Technology, Water, 10, 372, https://doi.org/10.3390/w10040372, 2018.
Qadir, M., Sharma, B. R., Bruggeman, A., Choukr-Allah, R., and Karajeh, F.: Non-conventional water resources and opportunities for water augmentation to achieve food security in water scarce countries, Agr. Water Manage., 87, 2–22, https://doi.org/10.1016/j.agwat.2006.03.018, 2007.
Qadir, M., Wichelns, D., Raschid-Sally, L., McCornick, P. G., Drechsel, P., Bahri, A., and Minhas, P. S.: The challenges of wastewater irrigation in developing countries, Agr. Water Manage., 97, 561–568, https://doi.org/10.1016/j.agwat.2008.11.004, 2010.
Raschid-Sally, L. and Jayakody, P.: Drivers and Characteristics of Wastewater Agriculture in Developing Countries: Results from a Global Assessment, International Water Management Institute, Colombo, Sri Lanka, 2008.
Rice, J., Wutich, A., and Westerhoff, P.: Assessment of De Facto Wastewater Reuse across the U.S.: Trends between 1980 and 2008, Environ. Sci. Technol., 47, 11099–11105, https://doi.org/10.1021/es402792s, 2013.
Sato, T., Qadir, M., Yamamoto, S., Endo, T., and Zahoor, A.: Global, regional, and country level need for data on wastewater generation, treatment, and use, Agr. Water Manage., 130, 1–13, https://doi.org/10.1016/j.agwat.2013.08.007, 2013.
Scott, C., Drechsel, P., Bahri, A., Mara, D., Redwood, M., Raschid-Sally, L., and Jiménez, B.: Wastewater irrigation and health: Challenges and outlook for mitigating risks in low-income countries, in: Wastewater irrigation and health: Assessing and mitigating risk in low-income countries, edited by: Drechsel, P., Scott, C., Raschid-Sally, L., Redwood, M., and Bahri, A., Earthscan, London, 381–394, 2010.
Smol, M., Adam, C., and Preisner, M.: Circular economy model framework in the European water and wastewater sector, J. Mater. Cycl. Waste, 22, 682–697, https://doi.org/10.1007/s10163-019-00960-z, 2020.
Sutanudjaja, E. H., van Beek, R., Wanders, N., Wada, Y., Bosmans, J. H. C., Drost, N., van der Ent, R. J., de Graaf, I. E. M., Hoch, J. M., de Jong, K., Karssenberg, D., López López, P., Peßenteiner, S., Schmitz, O., Straatsma, M. W., Vannametee, E., Wisser, D., and Bierkens, M. F. P.: PCR-GLOBWB 2: a 5 arcmin global hydrological and water resources model, Geosci. Model Dev., 11, 2429–2453, https://doi.org/10.5194/gmd-11-2429-2018, 2018.
Thebo, A. L., Drechsel, P., and Lambin, E. F.: Global assessment of urban and peri-urban agriculture: irrigated and rainfed croplands, Environ. Res. Lett., 9, 114002, https://doi.org/10.1088/1748-9326/9/11/114002, 2014.
Thebo, A. L., Drechsel, P., Lambin, E. F., and Nelson, K. L.: A global, spatially-explicit assessment of irrigated croplands influenced by urban wastewater flows, Environ. Res. Lett., 12, 074008, https://doi.org/10.1088/1748-9326/aa75d1, 2017.
UNEP: A Snapshot of the World's Water Quality: Towards a global assessment, United Nations Environment Programme, Nairobi, Kenya, 162pp, 2016.
van Vliet, M., Flörke, M., and Wada, Y.: Quality matters for water scarcity, Nat. Geosci., 10, 800–802, https://doi.org/10.1038/ngeo3047, 2017.
Voulvoulis, N.: Water reuse from a circular economy perspective and potential risks from an unregulated approach, Curr. Opin. Environ. Sci. Health, 2, 32–45, https://doi.org/10.1016/j.coesh.2018.01.005, 2018.
Wada, Y., Beek, L. P. H., Viviroli, D., Dürr, H., Weingartner, R., and Bierkens, M. F. P.: Global monthly water stress: II. Water demand and severity of water, Water Resour. Res., 47, https://doi.org/10.1029/2010WR009792, 2011.
Wada, Y., Flörke, M., Hanasaki, N., Eisner, S., Fischer, G., Tramberend, S., Satoh, Y., van Vliet, M. T. H., Yillia, P., Ringler, C., Burek, P., and Wiberg, D.: Modeling global water use for the 21st century: the Water Futures and Solutions (WFaS) initiative and its approaches, Geosci. Model Dev., 9, 175–222, https://doi.org/10.5194/gmd-9-175-2016, 2016.
Wada, Y., Wisser, D., Eisner, S., Flörke, M., Gerten, D., Haddeland, I., Hanasaki, N., Masaki, Y., Portmann, F. T., Stacke, T., Tessler, Z., and Schewe, J.: Multimodel projections and uncertainties of irrigation water demand under climate change, Geophys. Res. Lett., 40, 4626–4632, https://doi.org/10.1002/grl.50686, 2013.
Wada, Y., Wisser, D., and Bierkens, M. F. P.: Global modeling of withdrawal, allocation and consumptive use of surface water and groundwater resources, Earth Syst. Dynam., 5, 15–40, https://doi.org/10.5194/esd-5-15-2014, 2014.
Waterbase – UWWTD: Urban Waste Water Treatment Directive – reported data, available at: https://www.eea.europa.eu/data-and-maps/data/waterbase-uwwtd-urban-waste-water-treatment-directive-6 (last access: 5 January 2020), 2019.
World Health Organization (WHO): Guidelines for drinking-water quality: fourth edition, Geneva, Switzerland, 564 pp., 2011.
Wichelns, D., Drechsel, P., and Qadir, M.: Wastewater: Economic Asset in an Urbanizing World, in: Wastewater: Economic Asset in an Urbanizing World, edited by: Drechsel, P., Qadir, M., and Wichelns, D., Springer Netherlands, Dordrecht, 3–14, 2015.
WWAP: The United Nations World Water Development Report 2017. Wastewater: The Untapped Resource, Paris, UNESCO, 2017.
Zhang, Y. and Shen, Y.: Wastewater irrigation: past, present, and future: Wastewater irrigation, WIRES Water, e1234, https://doi.org/10.1002/wat2.1234, 2017.