the Creative Commons Attribution 4.0 License.
the Creative Commons Attribution 4.0 License.
 | 03 Feb 2021
First ice thickness measurements in Tierra del Fuego at Schiaparelli Glacier, Chile
Guisella Gacitúa
Christoph Schneider
Jorge Arigony
Inti González
Ricardo Jaña
Gino Casassa
Cordillera Darwin in Tierra del Fuego (Chile) remains one of the least studied glaciated regions in the world. However, this region being one of very few terrestrial sites at this latitude in the Southern Hemisphere has the potential to provide key information on the effect of climate variability and climate change on the cryosphere at sub-polar mid-latitudes of the Southern Hemisphere. Schiaparelli Glacier is located at the northern side of the Cordillera Darwin draining the north side of Monte Sarmiento (2187 m a.s.l.). Despite being one of the largest glaciers in the Cordillera Darwin, no previous in situ observation of its ice thickness had been made either at this glacier or at any other location in the Cordillera Darwin. Ice thickness is one of the fundamental parameters to understand glacier dynamics, constrain ice dynamical modelling, and predict glacier evolution. In April 2016 we performed the first successful ice thickness measurements using terrestrial ground-penetrating radar in the ablation area of Schiaparelli Glacier (Gacitúa et al., 2020, https://doi.org/10.1594/PANGAEA.919331). The measurements were made along a transect line perpendicular to the ice flow. Results show a valley-shaped bedrock with a maximum ice thickness of 324 m within a distinct glacier trough. The bedrock is located below current sea level for 51 % of the transect measurements with a minimum of −158 m, which illustrates that the local topography is subject to considerable glacier-related over-deepening.
- Article
(9700 KB) - Full-text XML
- BibTeX
- EndNote


Figure 1Schiaparelli Glacier location. The proglacial lake to the left (west) of Schiaparelli Glacier is named Lago Azul. The inset shows the southernmost tip of South America where Tierra del Fuego is south of the Strait of Magellan; the black areas depict the glaciated areas of Cordillera Darwin. Image: Sentinel 2 RGB −84, 4 February 2019.
In recent decades, efforts have been made to improve the knowledge of the effects of climate variability on glaciers and associated ecosystems in the Southern Hemisphere's sub-polar region. However, an important part of this region, such as Cordillera Darwin in Tierra del Fuego, southernmost South America, remains poorly explored with critical gaps in information. Here we describe geophysical data from the first ice thickness observations in Cordillera Darwin. The study is part of an international multidisciplinary collaboration to decipher the impact of climate variability and climate change on the cryosphere in Patagonia and Tierra del Fuego (Meier et al., 2019, 2018; Malz et al., 2018; Weidemann et al., 2018b). The climate of this region is characterised by the effect of year-round prevailing westerly winds, cool summer temperatures, and high rainfall, particularly along the west side of the mountain regions (Garreaud et al., 2009).
Glacier retreat in the region has been occurring since the Little Ice Age (Davies and Glasser, 2012; Strelin et al., 2008). The spatial variability of glacier retreat within Patagonia and Tierra del Fuego responds to different ice dynamic processes given geographical and topographical conditions (Homlund and Fuenzalida, 1995; Porter and Santana, 2003). Yet most of the glaciers in the region are experiencing major mass loss in comparison with worldwide average rates (Pellicciotti et al., 2014). It has been concluded that the main cause of rapid retreat is the increase in mean annual temperatures (Rosenblüth et al., 1997; Villalba et al., 2003), although ice dynamics and topographic controls are also important (Porter and Santana, 2003).
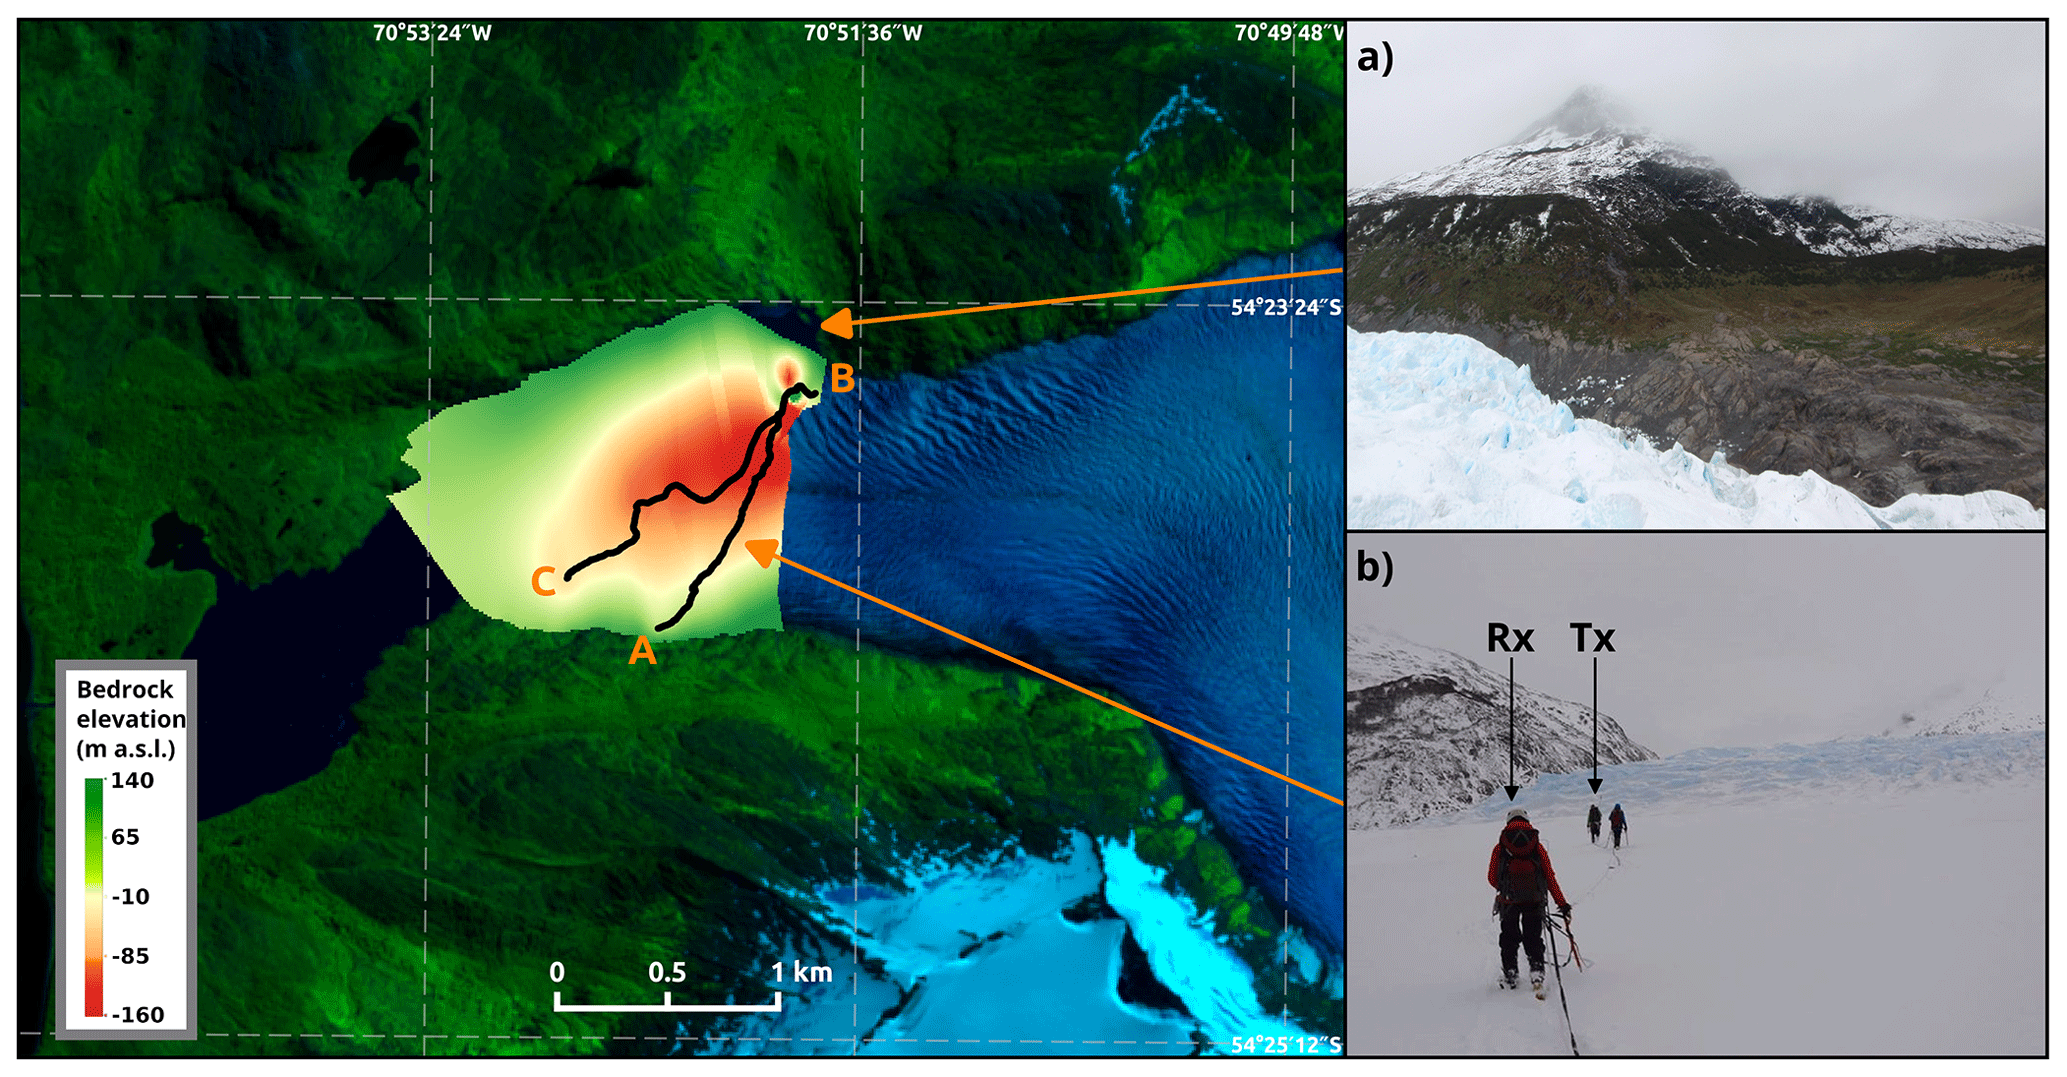
Figure 2The radar track is shown in black. The coloured area depicts the interpolation of the bedrock elevation using the GPR data and surface data (SRTM, LP DACC NASA version 3) as a reference, using a triangulated irregular network (TIN) grid. A, B, and C indicate the respective positions in Fig. 3. The upper frame (a) shows a photo taken during the GPR measurement from B towards the ice-dammed lagoon (north side). The lower frame (b) shows the team performing the measurements from A to B. Tx and Rx are the transmitter and receiver carriers respectively.
Schiaparelli Glacier (24.78 km2) (Bown et al., 2014) is the northernmost glacier of the Sarmiento Massif in western Tierra del Fuego (54∘23′ S, 70∘52′ W) (Fig. 1). It flows towards the NW, being exposed to atmospheric circulation from the Pacific Ocean and thus being an indicator of glacial response to oceanic climatic variability related to both warming trends and variability in atmospheric circulation patterns (Weidemann et al., 2018a). The glacier calves into Lago Azul, for which recent bathymetry observations (April 2018) show a lake depth of approximately 60 m at the calving front (subsequent publication data).
Since direct observations of glaciers, such as ice thickness, are crucial to understand ice dynamics, in April 2016 we carried out fieldwork on Schiaparelli Glacier to obtain in situ data. Among other measurements, we collected the first set of ice thickness data of Schiaparelli Glacier (Gacitúa et al., 2020). This paper describes the methodology and results obtained using ground-penetrating radar. These data are valuable for further studies on ice dynamic modelling, climate impact research in Cordillera Darwin (Meier et al., 2019), and the evaluation of global ice thickness modelling (Huss and Farinotti, 2012; Farinotti et al., 2019).
The ground-penetrating radar used (http://www.unmannedindustrial.com/sites/default/files/GPR.pdf, last access: 1 February 2021) consists of an impulse system (transmitter/receiver), control unit (handheld), and resistively loaded dipole antennas (16 m length each). The antennas' length provides an approximate central frequency of 10 MHz, following the design by Wu and King (1965). The transmitter emits signals with voltage set to 1.4 kV in accordance with relatively shallow ice. The receiver amplifies and stacks the radar signal (traces) and communicates with the handheld unit which controls the collection and stores the data. The system operates at 1 kHz PRF (pulse repetition frequency), and the trigger signal is conveniently synchronised by GPS devices incorporated at both transmitter and receiver, providing the position for each stored trace. The system can stack a maximum of 4096 traces and captures a maximum of 4096 samples per scan. Final data are delivered as consecutive files of 1000 traces each. The receiver uses an analogue-to-digital converter that operates at 80 MSPS (mega-samples per second) and has a resolution of 16 bits. Both transmitter and receiver function with an external battery of 12 V and 7 A h, allowing an autonomy of 1 d of measurements in ideal conditions.
The field operation requires three persons: the first holds one extreme of the transmitter antenna, the second carries the transmitter equipment, and the third carries the receiver equipment. The collinear antennas are connected by the extremes with a rope of half-dipole length, resulting in a 40 m total system length (see inset photo in Fig. 2).
A nearly complete profile across the glacier of approximately 3.1 km (two-way transect) was performed on the lower part of Schiaparelli Glacier. Crevasses on the glacier prevented us from reaching the northern margin of the glacier. We adjusted the parameters, such as vertical range and resolution, during the data collection and obtained seven files (varied size content). We assume a constant wave speed propagation of 0.168 m ns−1 in temperate ice (Johari and Charette, 1975). Data were processed using a commercial software (ReflexW, Sandmeier, 2011). The processing steps include (a) geometric corrections of zero depth considering distance of 24 m between transmitter and receiver, (b) bandpass frequency filter, (c) re-sampling to correct different vertical resolution (number of samples per trace) of files, (d) frequency–wave number (F–K) migration (Stolt, 1978) to reduce diffraction noise and correct the position of the bedrock reflectors, and (e) subtracting average values to reduce horizontal noise.
An estimation of depth-average attenuation rate was made based on the method described by Jacobel et al. (2009). We calculated the power reflected from the bedrock over one transect (A–B) and normalised it to eliminate the inverse square losses due to geometric spreading. We obtained a depth-average attenuation rate of 22.6 dB km−1 from the best-fit line between the ice thickness and the normalised power reflected. Although radar attenuation rates have been calculated in multiple studies on polar ice, these estimations have rarely been made for temperate glaciers. However, our result is in good agreement with those presented in MacGregor et al. (2015) for the Greenland Ice Sheet where they obtained up to 25 dB km−1 by the ice-sheet margin, where ice temperature and conditions might be similar to those of temperate ice in Cordillera Darwin.

Figure 3Resulting radargrams showing the manually interpreted bedrock in red. The x axis shows the distance covered during the measurements. The y axis represents the estimated bedrock depth in metres. The lower plot depicts A-scope examples of the attenuation of the signal at different depths from B to A.

Figure 3 shows the resulting compiled radar data with the manual picking of the bedrock interpretation. Ice depth is subject to at least 10 % error due to manual picking, geometrical variations, and the assumption of homogeneous ice. The radar data show a steep U-shaped valley with a maximum ice thickness of 324 m within a distinct glacier trough. The data show that 51 % of the bedrock is below current sea level (Fig. 4), reaching a minimum of −158 m within a distinct morphological over-deepening, presumably as a result of glacier erosion. An interpolation of the bedrock elevation was made using the glacier outline for the ablation area covered (Fig. 2). Despite the fact that the resulting interpolation suffers from the lack of bedrock data at the north and northwest edges, it provides a fair representation of the valley shape. At the time of the measurements there were visible signs of a recent discharge of an ice-dammed lagoon (Fig. 2, upper right photo) located at the northern side of the glacier tongue. The mid-depth reflections close to B (Fig. 3) suggest we crossed on the surface what might have been a subglacial tunnel through which meltwater drained from the lagoon to the pro-glacial lake.
The dataset containing the georeferenced ice thickness measurements is available for further applications at https://doi.org/10.1594/PANGAEA.919331 (Gacitúa et al., 2020).
These first results provide a calculation of the ice thickness within the ablation area of Schiaparelli Glacier. Only airborne measurements could provide a full coverage of ice depth data of the glacier due to inaccessibility in crevassed areas. Further retreat of Schiaparelli Glacier will probably lead to an enlarged and strongly overdeepened Lago Azul proglacial lake.
CS, GC, RJ, JA, and IG managed the general project under which GPR data were obtained. GG collected the data supported by the co-authors. IG and JA provided the bathymetry data and information. GG processed the GPR data and prepared the manuscript with contributions from all authors.
The authors declare that they have no conflict of interest.
This research was funded by the CONICYT-BMBF project GABY-VASA (BMBF140052) “Responses of Glaciers, Biosphere and Hydrology to Climate Variability across the Southern Andes”. The field campaign was sponsored by UMAG, INACH, CEQUA e INCT da Criósfera. We wish to thank Roberto Garrido, Stephanie Weidemann, Marcelo Arévalo, and Valentina Peredo for their assistance during fieldwork. We thank the Chilean Navy for the logistic support.
This paper was edited by Prasad Gogineni and reviewed by Howard Conway, Kenichi Matsuoka, and one anonymous referee.
Bown, F., Rivera, A., Zenteno, P., Bravo, C., and Cawkwell, F.: Chapter 28: First glacier inventory and recent glacier variations on Isla Grande de Tierra del Fuego and adjacent islands in Southern Chile, in: Global land Ice measurements from space, edited by: Kargel, J. S., Leonard, G. J., Bishop, M. P., and Raup, B., Springer-Praxis, New York, 661–674, https://doi.org/10.1007/978-3-540-79818-7_28, 2014. a
Davies, B. J. and Glasser, N. F.: Accelerating shrinkage of Patagonian glaciers from the Little Ice Age (AD 1870) to 2011, J. Glaciol., 58, 1063–1084, https://doi.org/10.3189/2012JoG12J026, 2012. a
Farinotti, D., Huss, M., Fürst, J., Landmann, J., Machguth, H., Maussion, F., and Pandit, A.: A consensus estimate for the ice thickness distribution of all glaciers on Earth, Nat. Geosci., 12, 168–173, https://doi.org/10.1038/s41561-019-0300-3, 2019. a
Gacitúa, G., Schneider, C., and Casassa, G.: Ice thickness observations in Glacier Schiaparelli, Cordillera Darwin, Chile, PANGAEA, https://doi.org/10.1594/PANGAEA.919331, 2020. a, b, c
Garreaud, R. D., Vuille, M., Compagnucci, R., and Marengo, J.: Present-day South American climate, Palaeogeogr. Palaeocl., 281, 180–195, https://doi.org/10.1016/j.palaeo.2007.10.032, 2009. a
Homlund, P. and Fuenzalida, H.: Anomalous glacier responses to 20th century climatic changes in Darwin Cordillera, southern Chile, J. Glaciol., 41, 465–474, 1995. a
Huss, M. and Farinotti, D.: Distributed ice thickness and volume of all glaciers around the globe, J. Geophys. Res., 117, F04010, https://doi.org/10.1029/2012JF002523, 2012. a
Jacobel, R., Welch, B., Osterhouse, D., Pettersson, R., and MacGregor, J.: Spatial variation of radar-derived basal conditions on Kamb Ice Stream, West Antarctica, Ann. Glaciol., 50, 10–16, 2009. a
Johari, G. and Charette, P.: The permittivity and attenuation in polycrystalline and single-crystal ice Ih at 35 and 60 MHz, J. Glaciol., 14, 293–303, 1975. a
MacGregor, J., Li, J., Paden, J., Catania, G., Clow, G., Fahnestock, M., Gogineni, S., Grimm, R., Morlighem, M., Nandi, S., Seroussi, H., and Stillman, D.: Radar attenuation and temperature within the Greenland Ice Sheet, J. Geophys. Res.-Sol. Ea., 120, 983–1008, https://doi.org/10.1002/2014JF003418, 2015. a
Malz, P., Meier, W., Casassa, G., Jaña, R., Skvarca, P., and Braun, M. H.: Elevation and mass changes of the southern Patagonia icefield derived from TanDEM-X and SRTM data, Remote Sens., 10, 1–17, https://doi.org/10.3390/rs10020188, 2018. a
Meier, W., Aravena, J., Grießinger, J., Hochreuther, P., Soto-Rogel, P., Zhu, H., Schneider, C., and Braun, M.: Late Holocene glacier fluctuations of Glacier Schiaparelli at Monte Sarmiento Massif, Tierra del Fuego (54∘24′ S), MDPI Geosci., 9, 340, https://doi.org/10.3390/geosciences9080340, 2019. a, b
Meier, W. J.-H., Grießinger, J., Hochreuther, P., and Braun, M. H.: An Updated Multi-Temporal Glacier Inventory for the Patagonian Andes With Changes Between the Little Ice Age and 2016, Front. Earth Sci., 6, 62, https://doi.org/10.3389/feart.2018.00062, 2018. a
Pellicciotti, F., Ragettli, S., Carenzo, M., and McPhee, J.: Changes of glaciers in the Andes of Chile and priorities for future work, Sci. Total Environ., 493, 1197–1210, https://doi.org/10.1016/j.scitotenv.2013.10.055, 2014. a
Porter, C. and Santana, A.: Rapid 20th century retreat of Ventisquero Marinelli in the Cordillera Darwin Icefeld, Anales del Instituto de la Patagonia, 31, 17–26, 2003. a, b
Rosenblüth, B., Fuenzalida, H., and Aceituno, P.: Recent Temperature Variations in Southern America, Int. J. Climatol., 17, 67–85, https://doi.org/10.1002/(SICI)1097-0088(199701)17:1<67::AID-JOC120>3.0.CO;2-G, 1997. a
Sandmeier, K.: ReflexW Manual Ver. 6, Zipser Straße 1, 76227 Karlsruhe, Germany, 2011. a
Stolt, R. H.: Migration by Fourier Transform, Geophysics, 43, 23–48, 1978. a
Strelin, J., Casassa, G., Rosqvist, G., and Holmlund, P.: Holocene glaciations in the Ema Glacier valley, Monte Sarmiento Massif, Tierra del Fuego, Palaeogeogr. Palaeocl., 260, 299–314, https://doi.org/10.1016/j.palaeo.2007.12.002, 2008. a
Villalba, R., Lara, A., Boninsegna, J. A., Masiokas, M., Delgado, S., Aravena, J. C., Roig, F. A., Schmelter, A., Wolodarsky, A., and Ripalta, A.: Large-scale temperature changes across the Southern Andes: 20th-century variations in the context of the past 400 years, Clim. Change, 59, 177–232, 2003. a
Weidemann, S. S., Sauter, T., Kilian, R., Steger, D., Butorovic, N., and Schneider, C.: A 17-year Record of Meteorological Observations Across the Gran Campo Nevado Ice Cap in Southern Patagonia, Chile, Related to Synoptic Weather Types and Climate Modes, Front. Earth Sci., 6, 53, https://doi.org/10.3389/feart.2018.00053, 2018a. a
Weidemann, S. S., Sauter, T., Malz, P., Jaña, R., Arigony-neto, J., Casassa, G., and Schneider, C.: Glacier Mass Changes of Lake-Terminating Grey and Tyndall Glaciers at the Southern Patagonia Icefield Derived From Geodetic Observations and Energy and Mass Balance Modeling, Front. Earth Sci., 6, 81, https://doi.org/10.3389/feart.2018.00081, 2018b. a
Wu, T. and King, R.: The cylindrical antenna with nonreflecting resistive loading, IEEE T. Antenn. Propag., 13, 369–373, 1965. a