the Creative Commons Attribution 4.0 License.
the Creative Commons Attribution 4.0 License.
 | 26 May 2021
A new merged dataset for analyzing clouds, precipitation and atmospheric parameters based on ERA5 reanalysis data and the measurements of the Tropical Rainfall Measuring Mission (TRMM) precipitation radar and visible and infrared scanner
Lilu Sun
Yunfei Fu
Clouds and precipitation have vital roles in the global hydrological cycle and the radiation budget of the atmosphere–Earth system and are closely related to both the regional and the global climate. Changes in the status of the atmosphere inside clouds and precipitation systems are also important, but the use of multi-source datasets is hampered by their different spatial and temporal resolutions. We merged the precipitation parameters measured by the Tropical Rainfall Measuring Mission (TRMM) precipitation radar (PR) with the multi-channel cloud-top radiance measured by the visible and infrared scanner (VIRS) and atmospheric parameters in the ERA5 reanalysis dataset. The merging of pixels between the precipitation parameters and multi-channel cloud-top radiance was shown to be reasonable. The 1B01-2A25 dataset of pixel-merged data (1B01-2A25-PMD) contains cloud parameters for each PR pixel. The 1B01-2A25 gridded dataset (1B01-2A25-GD) was merged spatially with the ERA5 reanalysis data. The statistical results indicate that gridding has no unacceptable influence on the parameters in 1B01-2A25-PMD. In one orbit, the difference in the mean value of the near-surface rain rate and the signals measured by the VIRS was no more than 0.87 and the standard deviation was no more than 2.38. The 1B01-2A25-GD and ERA5 datasets were spatiotemporally collocated to establish the merged 1B01-2A25 gridded dataset (M-1B01-2A25-GD). Three case studies of typical cloud and precipitation events were analyzed to illustrate the practical use of M-1B01-2A25-GD. This new merged gridded dataset can be used to study clouds and precipitation systems and provides a perfect opportunity for multi-source data analysis and model simulations. The data which were used in this paper are freely available at https://doi.org/10.5281/zenodo.4458868 (Sun and Fu, 2021).
- Article
(3564 KB) - Full-text XML
- BibTeX
- EndNote


Clouds and precipitation are the result of interactions among several different atmospheric parameters. They have a crucial role in global hydrological and energy cycles which can be used to represent changes in the Earth's weather and climate (Hartmann and Short, 1980; Liou, 1986; Wetherald and Manabe, 1988; Baker, 1997; Houze, 1997; Roscow and Robert, 1999; Oki and Kanae, 2006; Lau and Wu, 2010; Fu and Zhang, 2018). More than two-thirds of all precipitation falls in the tropics and subtropics. The atmosphere obtains energy from the release of the latent heat of condensation during precipitation, and this is one of the main drivers of atmospheric circulation at low latitudes. Precipitating clouds also influence the Earth's radiation budget (Fu et al., 2006; Sassen et al., 2009; Kienast-Sjögren et al., 2016; Fu and Zhang, 2018; Gao et al., 2018). Atmospheric parameters (e.g., the temperature, pressure and wind fields) can be used to demonstrate changes in atmospheric status and the development of cloud and precipitation systems (Wang et al., 2015; Zheng et al., 2015; Pan and Fu, 2015; Xia and Fu, 2016; Wang et al., 2017).
Analysis of the complex distribution of clouds and precipitation, especially their 3D structures, helps to acquire a detailed understanding of the microphysical processes and thermodynamic structure of clouds. The horizontal structure represents the extent of the system, whereas the thermodynamic structure and microphysical processes inside clouds during the phase transition of water can be represented by the vertical structure (Houze, 1981; Szoke et al., 1986; Hobbs, 1991; Zipser and Lutz, 1994; Yuter and Houze, 1995; Liu and Fu, 2001; Luo et al., 2009). A comprehensive understanding of the 3D structure of precipitation and clouds will improve precipitation retrieval algorithms and model simulations (Wilheit et al., 1977; Petty, 1994; Kummerow et al., 1996; Olson et al., 1996; Iguchi et al., 2000; Tustison et al., 2002; Min et al., 2013).
Satellite remote sensing technology has developed rapidly in recent years. The first spaceborne active radar is the precipitation radar (PR) on board the Tropical Rainfall Measuring Mission (TRMM) (Kummerow et al., 1998, 2000; Kozu et al., 2001). The main aim of the TRMM is the effective observation of precipitation and energy exchange in tropical and subtropical regions. The unique instruments on board the satellite provide an excellent opportunity to study the 3D structure of precipitation (Nesbitt et al., 1999; Schumacher and Houze, 2003; Durden et al., 2003; Li and Fu, 2005; Liu and Zipser, 2009), whereas the visible and infrared scanner (VIRS) provides characteristics of cloud parameters near the cloud top (Liu and Fu, 2010; Fu, 2014; Yang et al., 2014; Chen and Fu, 2017).
Many studies of the 3D structure of clouds and precipitation have been based on TRMM measurements (Fu and Liu, 2001; Lu et al., 2016; Wang and Fu, 2017; Luo et al., 2020). Chen and Fu (2015) focused on the characteristics of precipitation and thermal infrared signals of clouds in typhoon and non-typhoon precipitation in eastern Asia by analyzing merged data between the PR and the VIRS pixels. Results showed that the most intense typhoon precipitation occurred on the ocean surface in eastern Asia. Non-typhoon precipitation was the main type of precipitation in the rainy season, but typhoon precipitation made the largest contribution to the total amount of precipitation. Yang et al. (2014) statistically analyzed 10-year data from the TRMM PR and VIRS and found that the cloud height and thickness of anvil clouds over land were always greater than those over the sea surface and that anvil clouds had a greater optical thickness over the land surface and more small ice particles.
Liu and Fu (2001) classified tropical precipitation into two main types (deep convective and stratiform) using the main component method. The mean rain rate profiles of deep convective rain had four layers, whereas stratiform precipitation had only three. Differences in the slopes of the mean profiles can be used to illustrate the microphysical processes at different vertical structures of the rainfall. Liu and Fu (2007) compared rain rate profiles from the Tibetan Plateau, eastern Asia and the tropics. It was found that there was little stratiform precipitation on the Tibetan Plateau, but deep weak convective precipitation was frequently detected in this region. The slope of the mean deep weak convective profile was greater than that for convective precipitation, which meant that more latent heat was released to heat the middle and upper atmosphere. Fu et al. (2008) found that the tops of precipitating clouds were about 4–6 km higher than those in the surrounding area. The difference in the cloud-top heights led to a tower-like structure over the Tibetan Plateau, which can heat the upper troposphere more easily.
Recent research has investigated the status of the atmosphere in clouds and precipitation systems (Wang and Fu, 2017; Li et al., 2018). In addition to observations from surface meteorological stations, atmospheric parameters can be obtained from sounding balloons, sensors on board planes and model simulations. Because of the uneven distribution of ground meteorological stations, the unpredictable routes of sounding balloons and the limited detection area of planes, we therefore analyzed the characteristics and distribution of atmospheric parameters inside clouds and precipitation systems using the ERA5 reanalysis dataset.
It is impossible to obtain simultaneous and comprehensive information using a single detection method or dataset as a result of the different ways of obtaining the cloud, precipitation and atmospheric parameters. The optimum choice to overcome this problem is to combine multiple remote sensing measurements and multi-source datasets (Fu et al., 2013; Chen and Fu, 2017). Hawkins et al. (2008) combined multiple-source datasets, including satellite cloud imagery captured by cloud profile radar and stationary satellites, observations from experimental planes, and model simulations. Fu et al. (2013) used a moving-surface fitting method to combine TRMM microwave imager (TMI) and PR pixel data. The differences in the mean, standard deviation and frequency distribution between the original and merged data are analyzed to validate accuracy. Wang et al. (2017) merged the TRMM PR 2A25 products with the IGRA dataset to investigate the profiles of temperature and humidity for the convective and stratiform precipitation. The merged data can be used to determine the vertical structure of precipitating clouds and the atmospheric parameters in typhoon, frontal and thermal convective precipitation systems.
VIRS pixels can be merged with PR pixels in a similar way to verify precipitating clouds. The results of this type of merger have shown that the reflectivity in the visible channel near the precipitating cloud top is bigger than 0.5 in the intertropical convergence zone; convergence zone of the Southern Hemisphere; monsoon region of Asia; and tropical regions of Africa, North America and South America. The reflectivity on land is greater than that on the sea surface (Fu et al., 2011). Liu and Fu (2010) verified precipitating clouds from several typhoon and frontal precipitation events in eastern China based on the same merged dataset. Precipitating clouds cannot be classified precisely by relying on only the thermal infrared brightness temperature, and other parameters, such as the ratio between the signals in the visible and near-infrared channels, are needed to improve accuracy.
The various temporal and spatial resolutions of different datasets can cause problems, and it is better to merge data from multiple instruments on board the same satellite, such as the TRMM. The ERA5 reanalysis dataset has a suitable temporospatial resolution for merging with the TRMM data to supplement the atmospheric parameters. This new merged dataset includes comprehensive parameters that can be used to analyze the features of the precipitation and clouds systems.
We merged TRMM PR and VIRS measurements with the ERA5 reanalysis data at the same spatiotemporal resolution to establish a new dataset of precipitation, cloud and atmospheric parameters. Section 2 describes the data and merging methods. Section 3 presents the main results about the influence of the merger on the original data during the merging process and the practical applications of the new merged dataset. Section 4 discusses the advantages of the dataset and work in progress. Access to the dataset is introduced in Sect. 5, and conclusions are presented in Sect. 6.
2.1 Tropical Rainfall Measuring Mission
The TRMM was launched in November 1997 as a joint mission between the US National Aeronautics and Space Administration (NASA) and the Japan Aerospace Exploration Agency (JAXA). The objectives of the TRMM are to obtain satellite measurements of rainfall and energy exchange in tropical and subtropical regions (https://trmm.gsfc.nasa.gov/overview_dir/background.html, last access: 25 January 2021). The TRMM is a non-solar synchronous polar-orbiting satellite in a 350 km (402 km after an orbital boost on 7 August 2001) circular orbit with an inclination angle of 35∘. The TRMM observes a specific location between 38∘ S and 38∘ N every 45 d. One complete scan of the orbit takes about 96 min, so there are 16 orbits in 1 d (Simpson et al., 1996; Kummerow et al., 1998).
2.2 PR and 2A25 dataset
The PR was the first spaceborne precipitation radar on board the TRMM. It is a 128-element active phased array system operating at 13.8 GHz (Kozu et al., 2001). The PR antenna scans in the cross-track direction over 17∘ in a 215 km (220 km after the orbital boost) swath width. There are 49 pixels in each scan line. The PR measures the spatial distribution of the intensity of precipitation from mean sea level to 20 km (80 layers in total) and has a horizontal resolution of 4.5 km at nadir (5 km after the orbital boost). The vertical resolution of the PR is 0.25 km.
The 2A25 data produced by NASA's Goddard Space Flight Center comprise the second-level data product of the TRMM PR. The dataset includes the scan time, geolocation information, rain type, 3D rain rate and so on. The TRMM PR algorithm classifies the type of rain into convective, stratiform and other (Awaka et al., 1997; Hayasaka et al., 1998).
2.3 VIRS and 1B01 datasets
The VIRS antenna scans in the cross-track direction over 45∘ in a 720 km (833 km after the orbital boost) swath width. There are 261 pixels in each scan line, and the horizontal resolution is 2.2 km at nadir (2.4 km after the orbital boost). The VIRS receives upward radiation at five wavelengths ranging from the visible to the far infrared: 0.63 µm (CH1), 1.6 µm (CH2), 3.7 µm (CH3), 10.8 µm (CH4) and 12.0 µm (CH5).
The 1B01 dataset is the first-level data product of the VIRS. The 1B01 data include the reflectivity in CH1 and CH2 (RF1 and RF2) and the infrared radiation brightness temperature (TB3.7, TB10.8 and TB12.0) in CH3, CH4 and CH5, which are calibrated from the spectral signals measured by the VIRS.
2.4 ERA5 reanalysis dataset
The ERA5 reanalysis dataset is the fifth- (latest-)generation of global atmospheric reanalysis datasets produced by the European Centre for Medium-Range Weather Forecasts. The ERA5 dataset is based on the Integrated Forecast System Cy41r2 model and assimilates more model simulation outputs and observational results. The ERA5 dataset is superior to previous versions in terms of its hourly output, finer spatial resolution (0.25∘) and abundant parameters (Zhao et al., 2019; Hersbach et al., 2020). We used the hourly atmospheric parameters (divergence, geopotential height, specific humidity, wind field, vertical velocity and temperature) on pressure levels for 32 layers from 1000 to 10 hPa. All the pressure layers are used during the data merging, except the uppermost pressure layers from 1 to 7 hPa, which are rarely used in studies.
2.5 2A25 and 1B01 merged data
The characteristics of precipitation and clouds are shown by identifying precipitating clouds from the PR and detecting radiance near the top of the cloud by the VIRS (Liu and Fu, 2010; Fu et al., 2011; Chen et al., 2018). The 2A25 and 1B01 data products (derived from the TRMM PR and VIRS, respectively) can be collocated to establish a merged dataset to provide comprehensive information about precipitation and clouds systems. The feasibility of data merging depends largely on the sensor settings, such as the temporal sampling rate, the synchronism of detection and the spatial resolution.
The PR and the VIRS are the main sensors on board the TRMM. Despite the difference in spatial resolution between 1B01 and 2A25, the time lag between detections of the same target is less than 1 min. The similar cross-track scanning modes make it reasonable to consider that the PR and VIRS are roughly synchronous in their detection area. It is therefore feasible to combine these two orbit-level data products. Spatial merging is the only process that needs to be taken into account because of the quasi-synchronicity between the TRMM PR and VIRS.
On account of the diverse orbital swath widths and spatial resolutions, the horizontal resolution of 1B01 is decreased to match that of 2A25 so that data merging can be easily achieved. The VIRS pixels are merged with the PR pixels through a weight-averaged method. The spectral signals are calculated near the PR pixel, and there are usually about 7 VIRS pixels near 1 PR pixel (Fu et al., 2011). The primary data of 1B01 include the reflectivity at CH1 and CH2 (RF1 and RF2); the equivalent brightness temperature of a black body at CH3, CH4 and CH5 (TB3.7, TB10.8 and TB12.0); the instantaneous near-surface rain rate; and the vertical structure of precipitation in 2A25. All the VIRS signals are within the resolution of the PR pixel which can be used to study the characteristics of precipitating clouds. The 1B01–2A25 pixel-merged data (1B01-2A25-PMD) are then established. The spatial resolution of 1B01-2A25-PMD is 5 km, and the swath width is 220 km (Liu and Fu, 2010; Chen and Fu, 2015, 2017).
2.6 Gridding of 1B01-2A25-PMD
Because 1B01-2A25-PMD contains orbit-level data, data gridding is necessary to merge these data with the ERA5 data. The 1B01-2A25-PMD dataset is gridded between 40∘ S and 40∘ N, and the spatial resolution is 0.25∘, in agreement with the resolution of the ERA5 data. Taking the near-surface rain rate as an example, we first sum the near-surface rain rate of the pixels in the same grid and then count the number of precipitating pixels in one grid and divide the total rain rate by the total number of precipitating pixels to obtain the near-surface rain rate of one grid. The grid-level dataset, namely, the 1B01-2A25 gridded data (1B01-2A25-GD), is calculated in the same way. The dataset includes the gridded spectral signals measured by the VIRS in each PR pixel. The precipitation is classified into three types: total precipitation, convective precipitation and stratiform precipitation. The PR is a Ku-band radar with a working frequency of 13.8 GHz and a wavelength of 2.2 cm. The sensitivity of the PR is 16 dBZ, and the minimum rain rate it can detect is about 0.4 mm h−1. Only pixels with a near-surface rain rate greater than 0.4 mm h−1 are calculated.
2.7 Merging the ERA5 and 1B01-2A25-GD
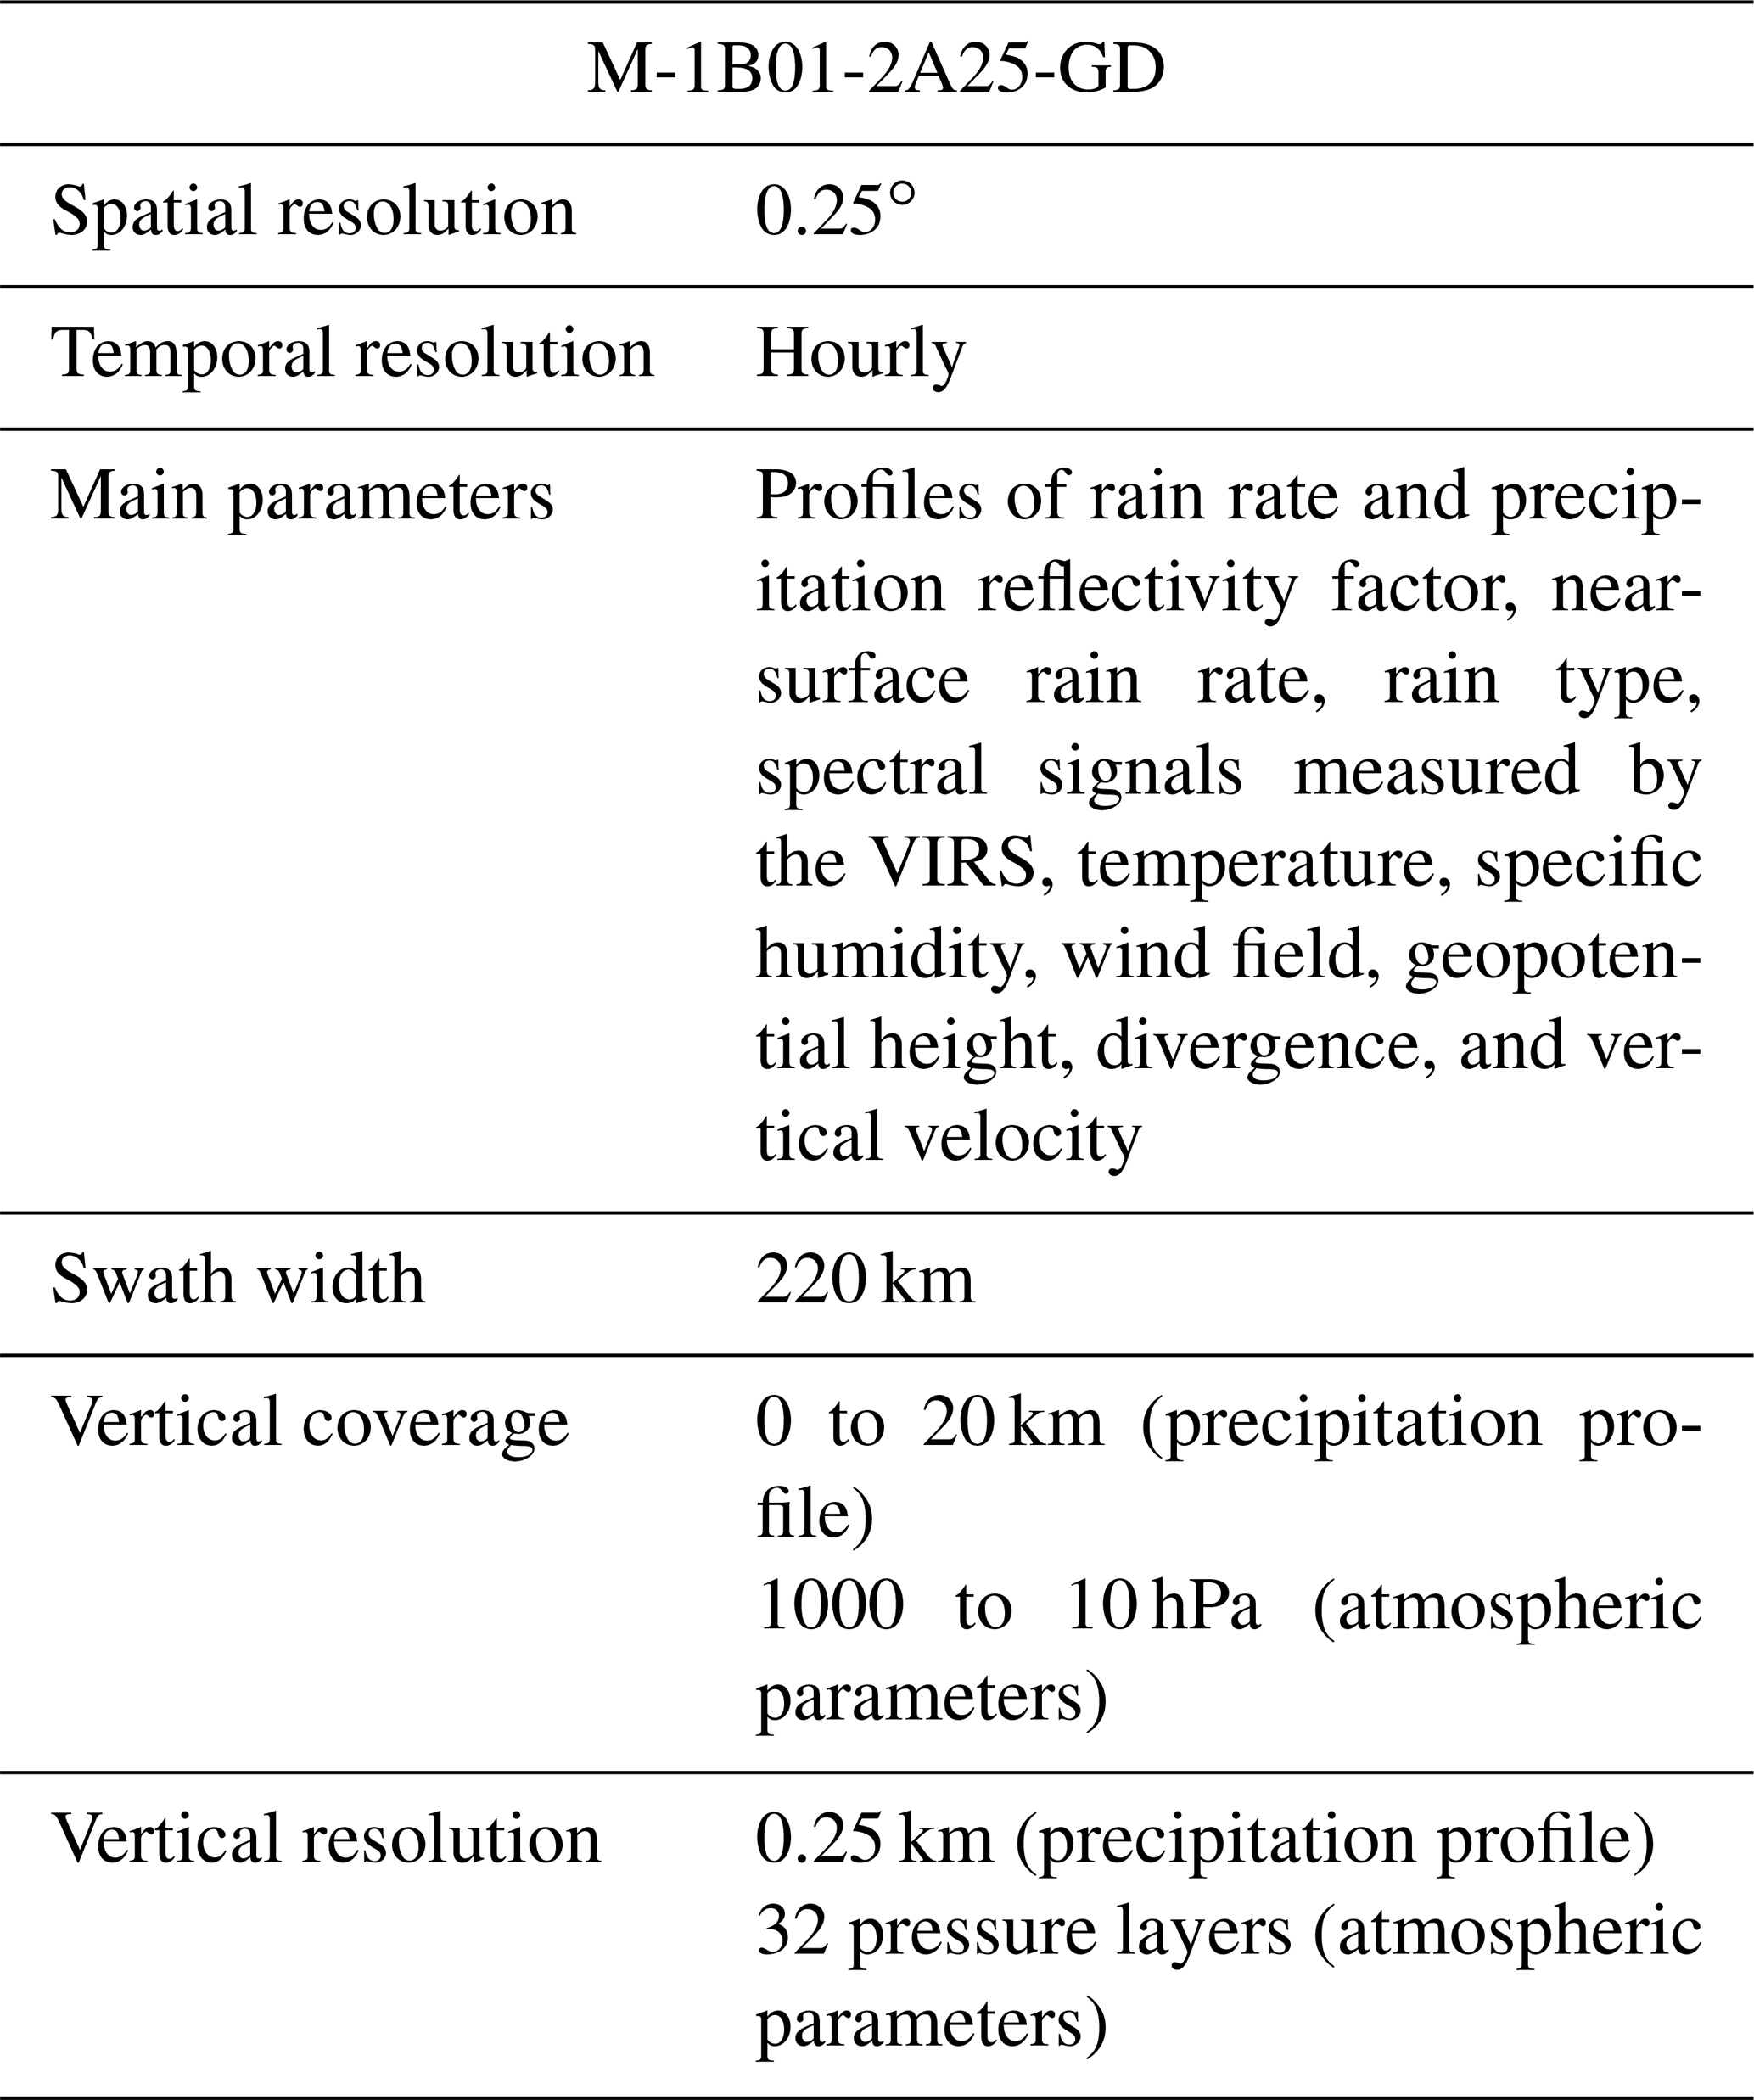
We merged the ERA5 data with the 1B01-2A25-GD dataset to explore the atmospheric status of the precipitation and clouds systems measured by the sensors on board the TRMM. The ERA5 dataset has hourly outputs, and the ERA5 parameters were therefore interpolated according to the grid times in 1B01-2A25-GD. The geolocation of the ERA5 grid was selected to match that of 1B01-2A25-GD. The merged 1B01-2A25 gridded dataset (M-1B01-2A25-GD) was therefore obtained, which includes geolocation information; the time of the grid; and parameters for precipitation, clouds and the atmospheric status. Table 1 contains critical information on M-1B01-2A25-GD.
3.1 Evaluation of 1B01-2A25-PMD
The horizontal resolution of 1B01 is decreased in 1B01-2A25-PMD as a result of merging with the PR pixels. The detection field of the merged data is narrower than that in 1B01 and is about the same as the swath width of the PR. The influence on the original data in 1B01 after merging is presented based on comparisons between the probability distribution functions (PDFs). Taking an arbitrary orbit, for example, orbit 37362 on 5 June 2004, comparisons are made between the signals in five spectral channels in 1B01 and 1B01-2A25-PMD. Figure 1a–e represent the PDFs of RF1, RF2, TB3.7, TB10.8 and TB12.0 in 1B01 and 1B01-2A25-PMD.
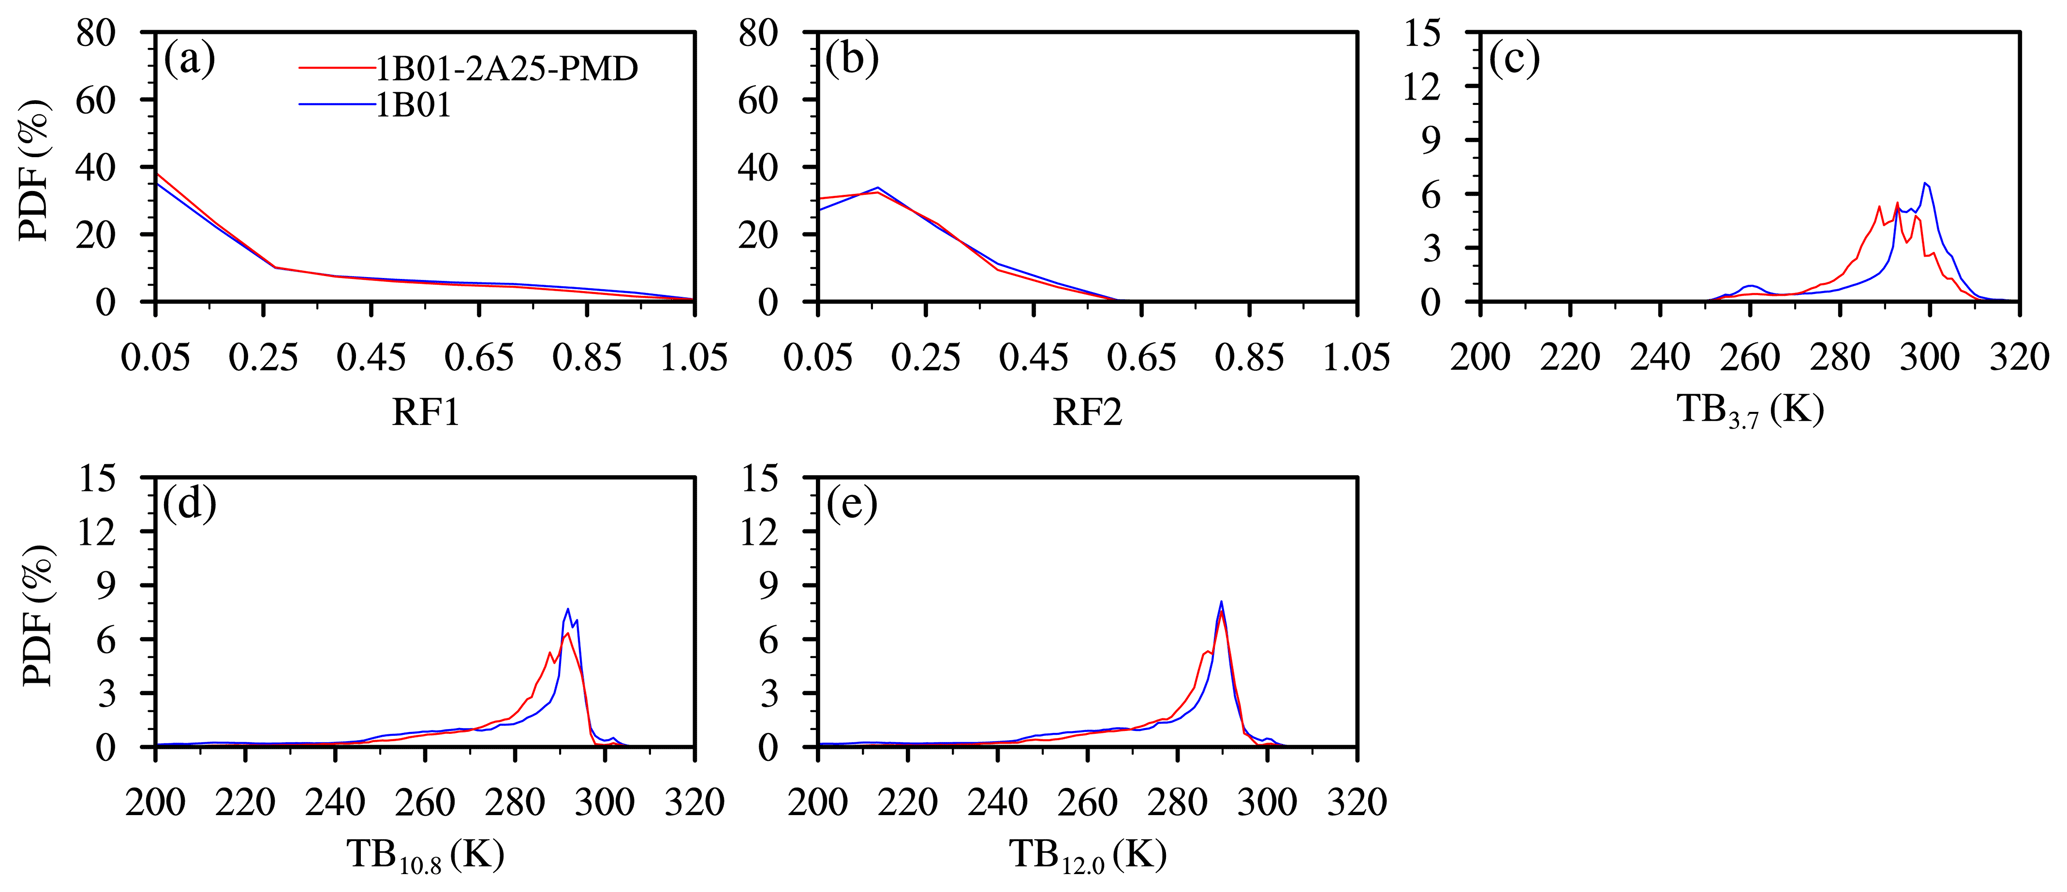
Figure 1PDFs of (a) RF1, (b) RF2, (c) TB3.7, (d) TB10.8 and (e) TB12.0 in 1B01 (blue line) and 1B01-2A25-PMD (red line) for orbit number 37362 on 5 June 2004.
Figure 1a and b show that there is no clear change in RF1 and RF2 after merging. The shapes of the PDFs are nearly the same in 1B01-2A25-PMD and 1B01, with the reflectivity ranging from 0.05 to 1.05, but concentrate in the range 0.05–0.3. By contrast, there is a clear variation in TB3.7 after merging (Fig. 1c). The PDF of 1B01 is a single peak with a maximum at 300 K and a sub-peak at 290 K. The PDF of 1B01-2A25-PMD shows a multi-peak shape, with the peaks mostly in range 280–300 K. TB3.7 ranges from 250 to 320 K in both 1B01 and 1B01-2A25-PMD. The difference in TB3.7 between 1B01 and 1B01-2A25-PMD is probably caused by the uneven cloud distribution. Also the difference in TB10.8 signal is noticeable. Although the ranges and the maximum of the TB10.8 nearly unchanged after merging, but the shape of the PDF line is different near the maximum. TB12.0 have the same distribution after merging. The signals vary from 240 to 300 K and the maxima of the PDFs are both at about 290 K. Although the PDFs of the original and merged datasets are similar, there are slight differences in the peak values. The PDFs of 1B01-2A25-PMD show lower peaks as a result of data averaging inside the grid (Fig. 1c and d).
Two regions are selected to analyze the distinctive changes in TB3.7 after merging with the PR pixels: (1) a region that mainly contains cloudy pixels (the cloudy region), and (2) a region that mainly contains clear-sky pixels (the clear-sky region). When the radiance brightness temperature is greater than 290 K, the pixel is classified as a clear-sky pixel, whereas cloudy pixels are classified as those pixels in which the near-surface rain rate is greater than 0.4 mm h−1.

Figure 2PDFs of TB3.7 in (a) cloudy regions and (b) clear-sky regions in 1B01 (blue line) and 1B01-2A25-PMD (red line) for orbit number 37362 on 5 June 2004.
Figure 2 shows the PDFs of TB3.7 in these two regions. TB3.7 ranges from 260 to 315 K in the cloudy region and the maximum value (310 K) is almost the same in both the 1B01 and 1B01-2A25-PMD datasets (Fig. 2a). This similarity is also seen in the PDF of TB3.7 in the clear-sky region, where TB3.7 varies between 290 and 310 K with a single-peak structure and a maximum at 300 K (Fig. 2b). In a word, the merging process between the PR and the VIRS pixels is considered lead to no dramatic variations on the original data.
3.2 Evaluation of 1B01-2A25-GD
The 1B01-2A25-PMD dataset was gridded to match the ERA5 reanalysis data spatially, and this dataset is referred to as 1B01-2A25-Gridded Data (1B01-2A25-GD). Data processing studies have shown that the precision of the spatial resolution of a dataset can affect the accuracy and physical characteristics of the data (Heng and Fu, 2014), and therefore it is essential to evaluate the effects of the gridding process.
As an example, Fig. 3 compares the near-surface rain rate and the CH1–CH5 signals of the original and gridded data for orbit 37362 on 5 June 2004 in both 1B01-2A25-PMD and 1B01-2A25-GD.
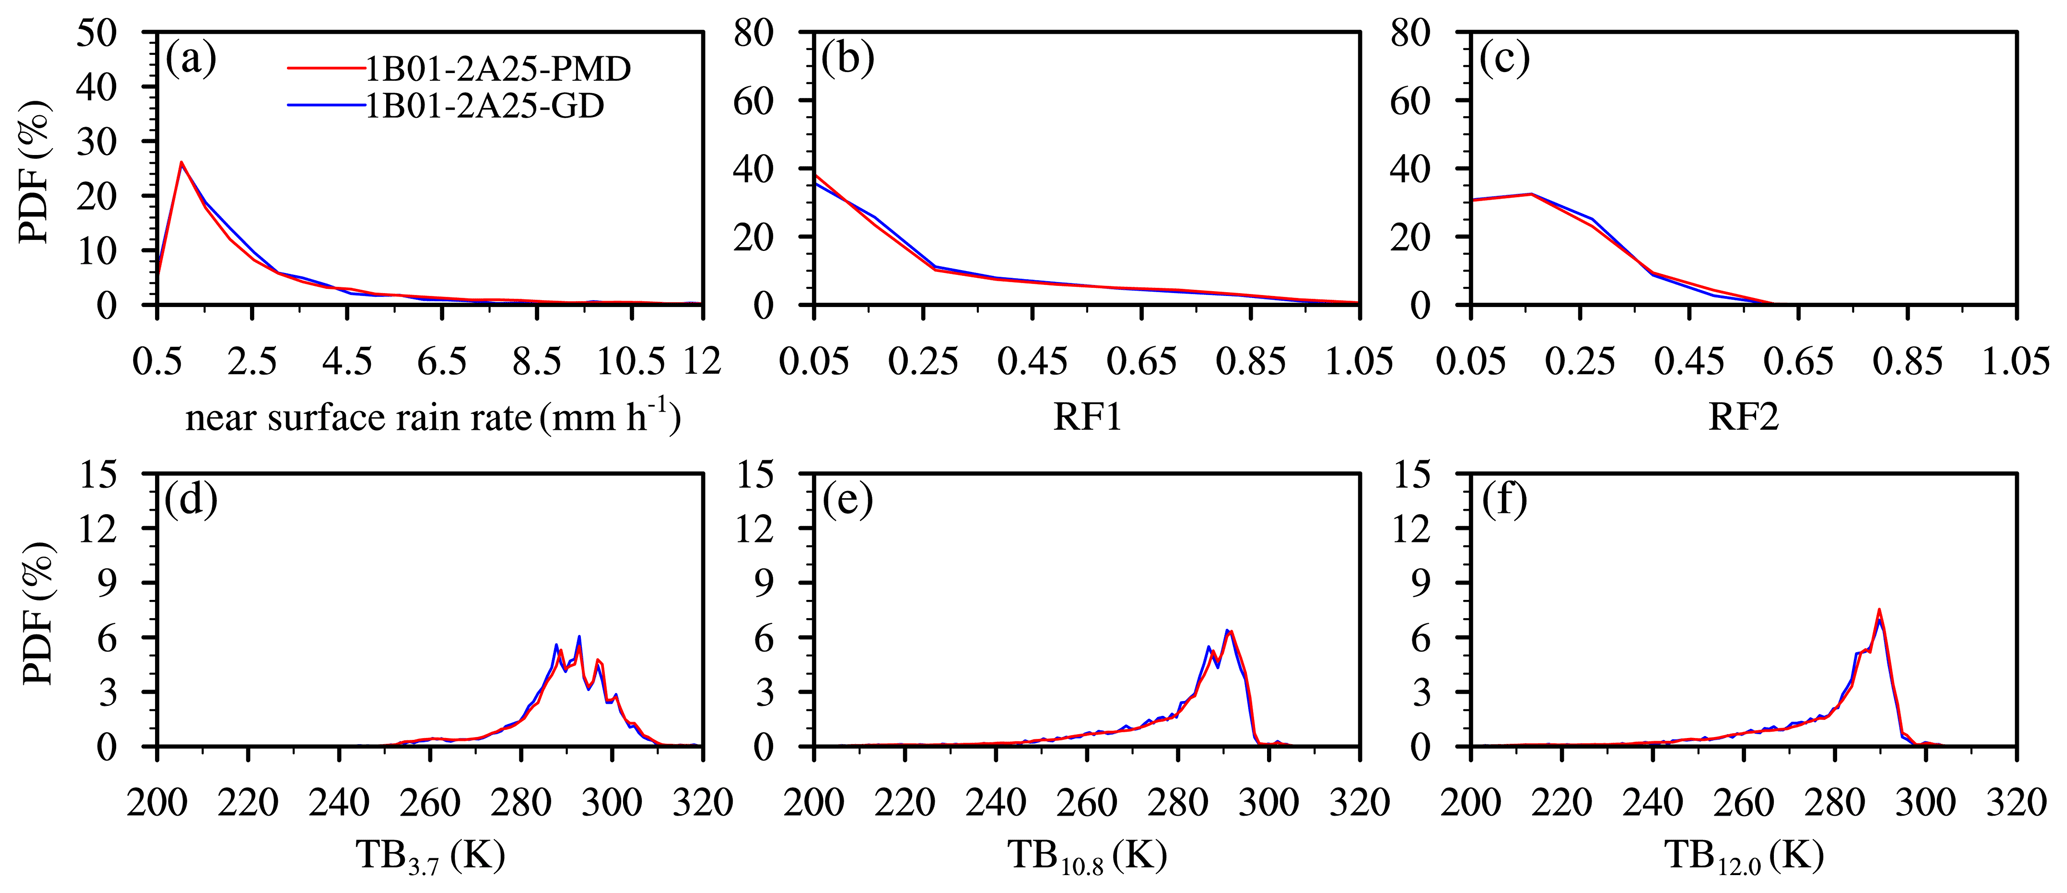
Figure 3PDFs of (a) the near-surface rain rate, (b) RF1, (c) RF2, (d) TB3.7, (e) TB10.8 and (f) TB12.0 in 1B01-2A25-PMD (red line) and 1B01-2A25-GD (blue line) for orbit number 37362 on 5 June 2004.
Figure 3a shows that the PDF of the near-surface rain rate in 1B01-2A25-PMD has a single peak and the rain rate mainly ranges from 1 to 3 mm h−1. The PDF of the gridded data is nearly the same as that of the original data, so gridding has little influence on the near-surface rain rate. The PDFs for RF1 and RF2 are also largely unchanged. RF1 varies from 0.05 to 1.05, and RF2 is mainly in the range 0.05–0.55 (Fig. 3b, c). The brightness temperature (TB3.7, TB10.8 and TB12.0) ranges from 240 to 310 K, and there is little difference in the PDFs of 1B01-2A25-PMD and 1B01-2A25-GD. The PDF of TB3.7 has a multi-peak structure, whereas the PDFs of TB10.8 and TB12.0 are both single peaks (Fig. 3d–f). Gridding therefore does not result in dramatic variations in the parameters in 1B01-2A25-PMD.
Statistical calculations were carried out to quantify the influence of gridding on 1B01-2A25-PMD. Table 2 shows the mean, standard deviation (SD) and corresponding differences in the near-surface rain rate, and the signals from the five channels in 1B01-2A25-PMD and 1B01-2A25-GD for orbit 37362 on 5 June 2004.
Table 2Comparisons of statistical mean and standard deviation (SD) of the near-surface rain rate and signals from five channels in 1B01-2A25-PMD and 1B01-2A25-GD for orbit number 37362 on 5 June 2004.
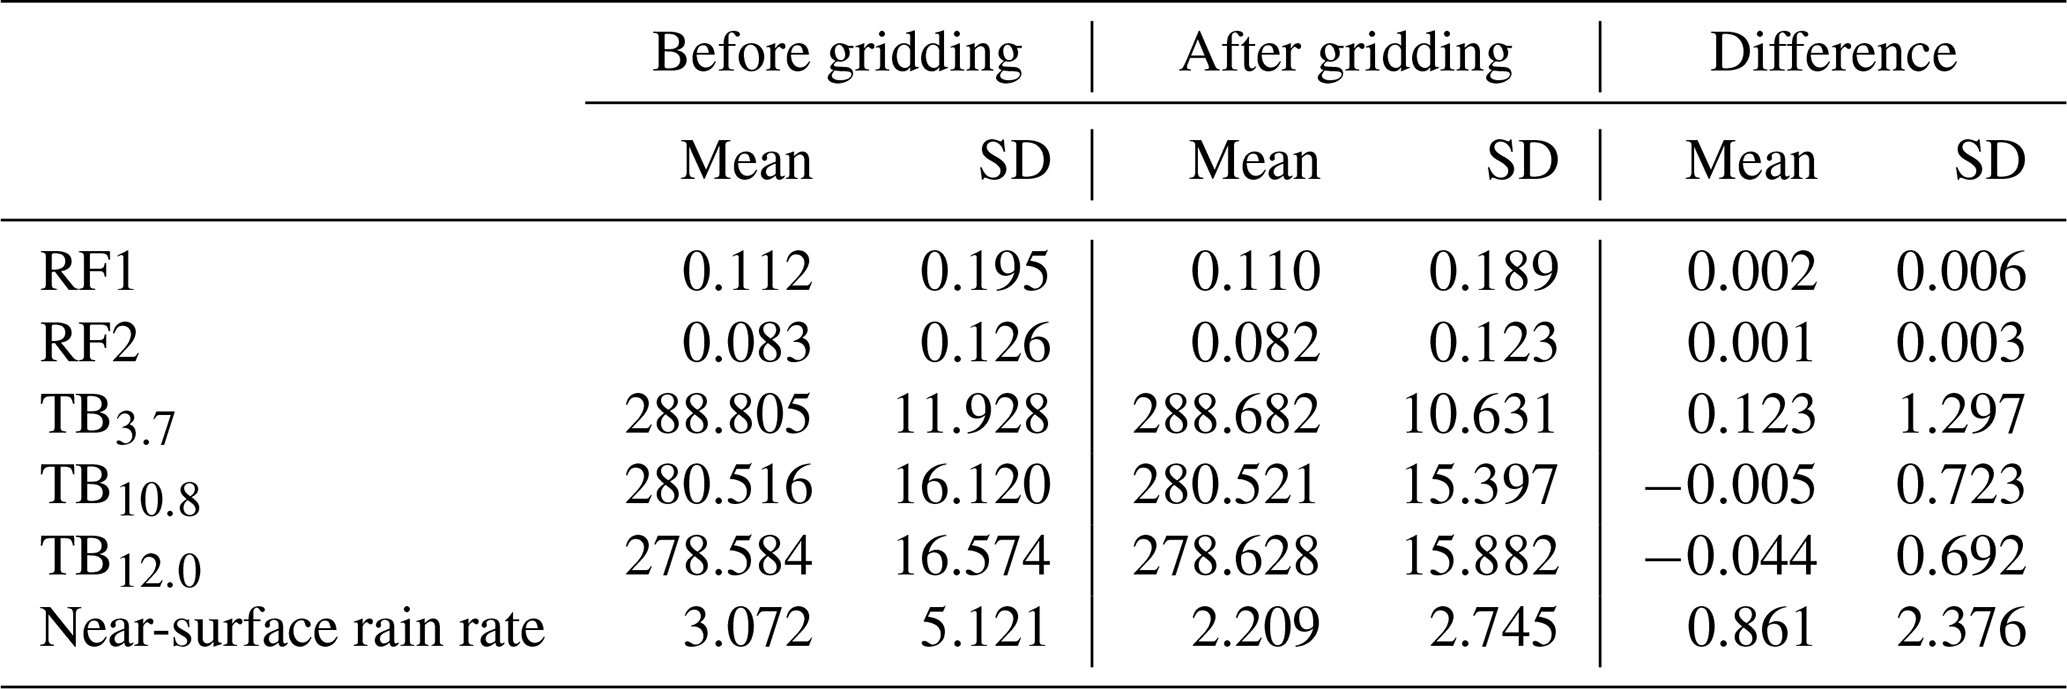
These results show that the difference in the mean value in this orbit is no more than 0.87 and the SD is no more than 2.38. The differences in the near-surface rain rate are always larger than the differences in the signals for the five channels, although all the differences are acceptable. The statistical results quantitatively verify that the slight influence caused by gridding can be neglected and the parameters in 1B01-2A25-GD are reliable.
3.3 Presentation of the M-1B01-2A25-GD parameters
The ERA5 atmospheric parameters are merged with 1B01-2A25-GD to establish a new gridded dataset (M-1B01-2A25-GD). The merging process among the 1B01, 2A25 and ERA5 datasets is based on 2A25, so the detection field is about the same as that measured by the TRMM PR in the new merged dataset, taking orbit 37362 on 5 June 2004 in M-1B01-2A25-GD as an example.
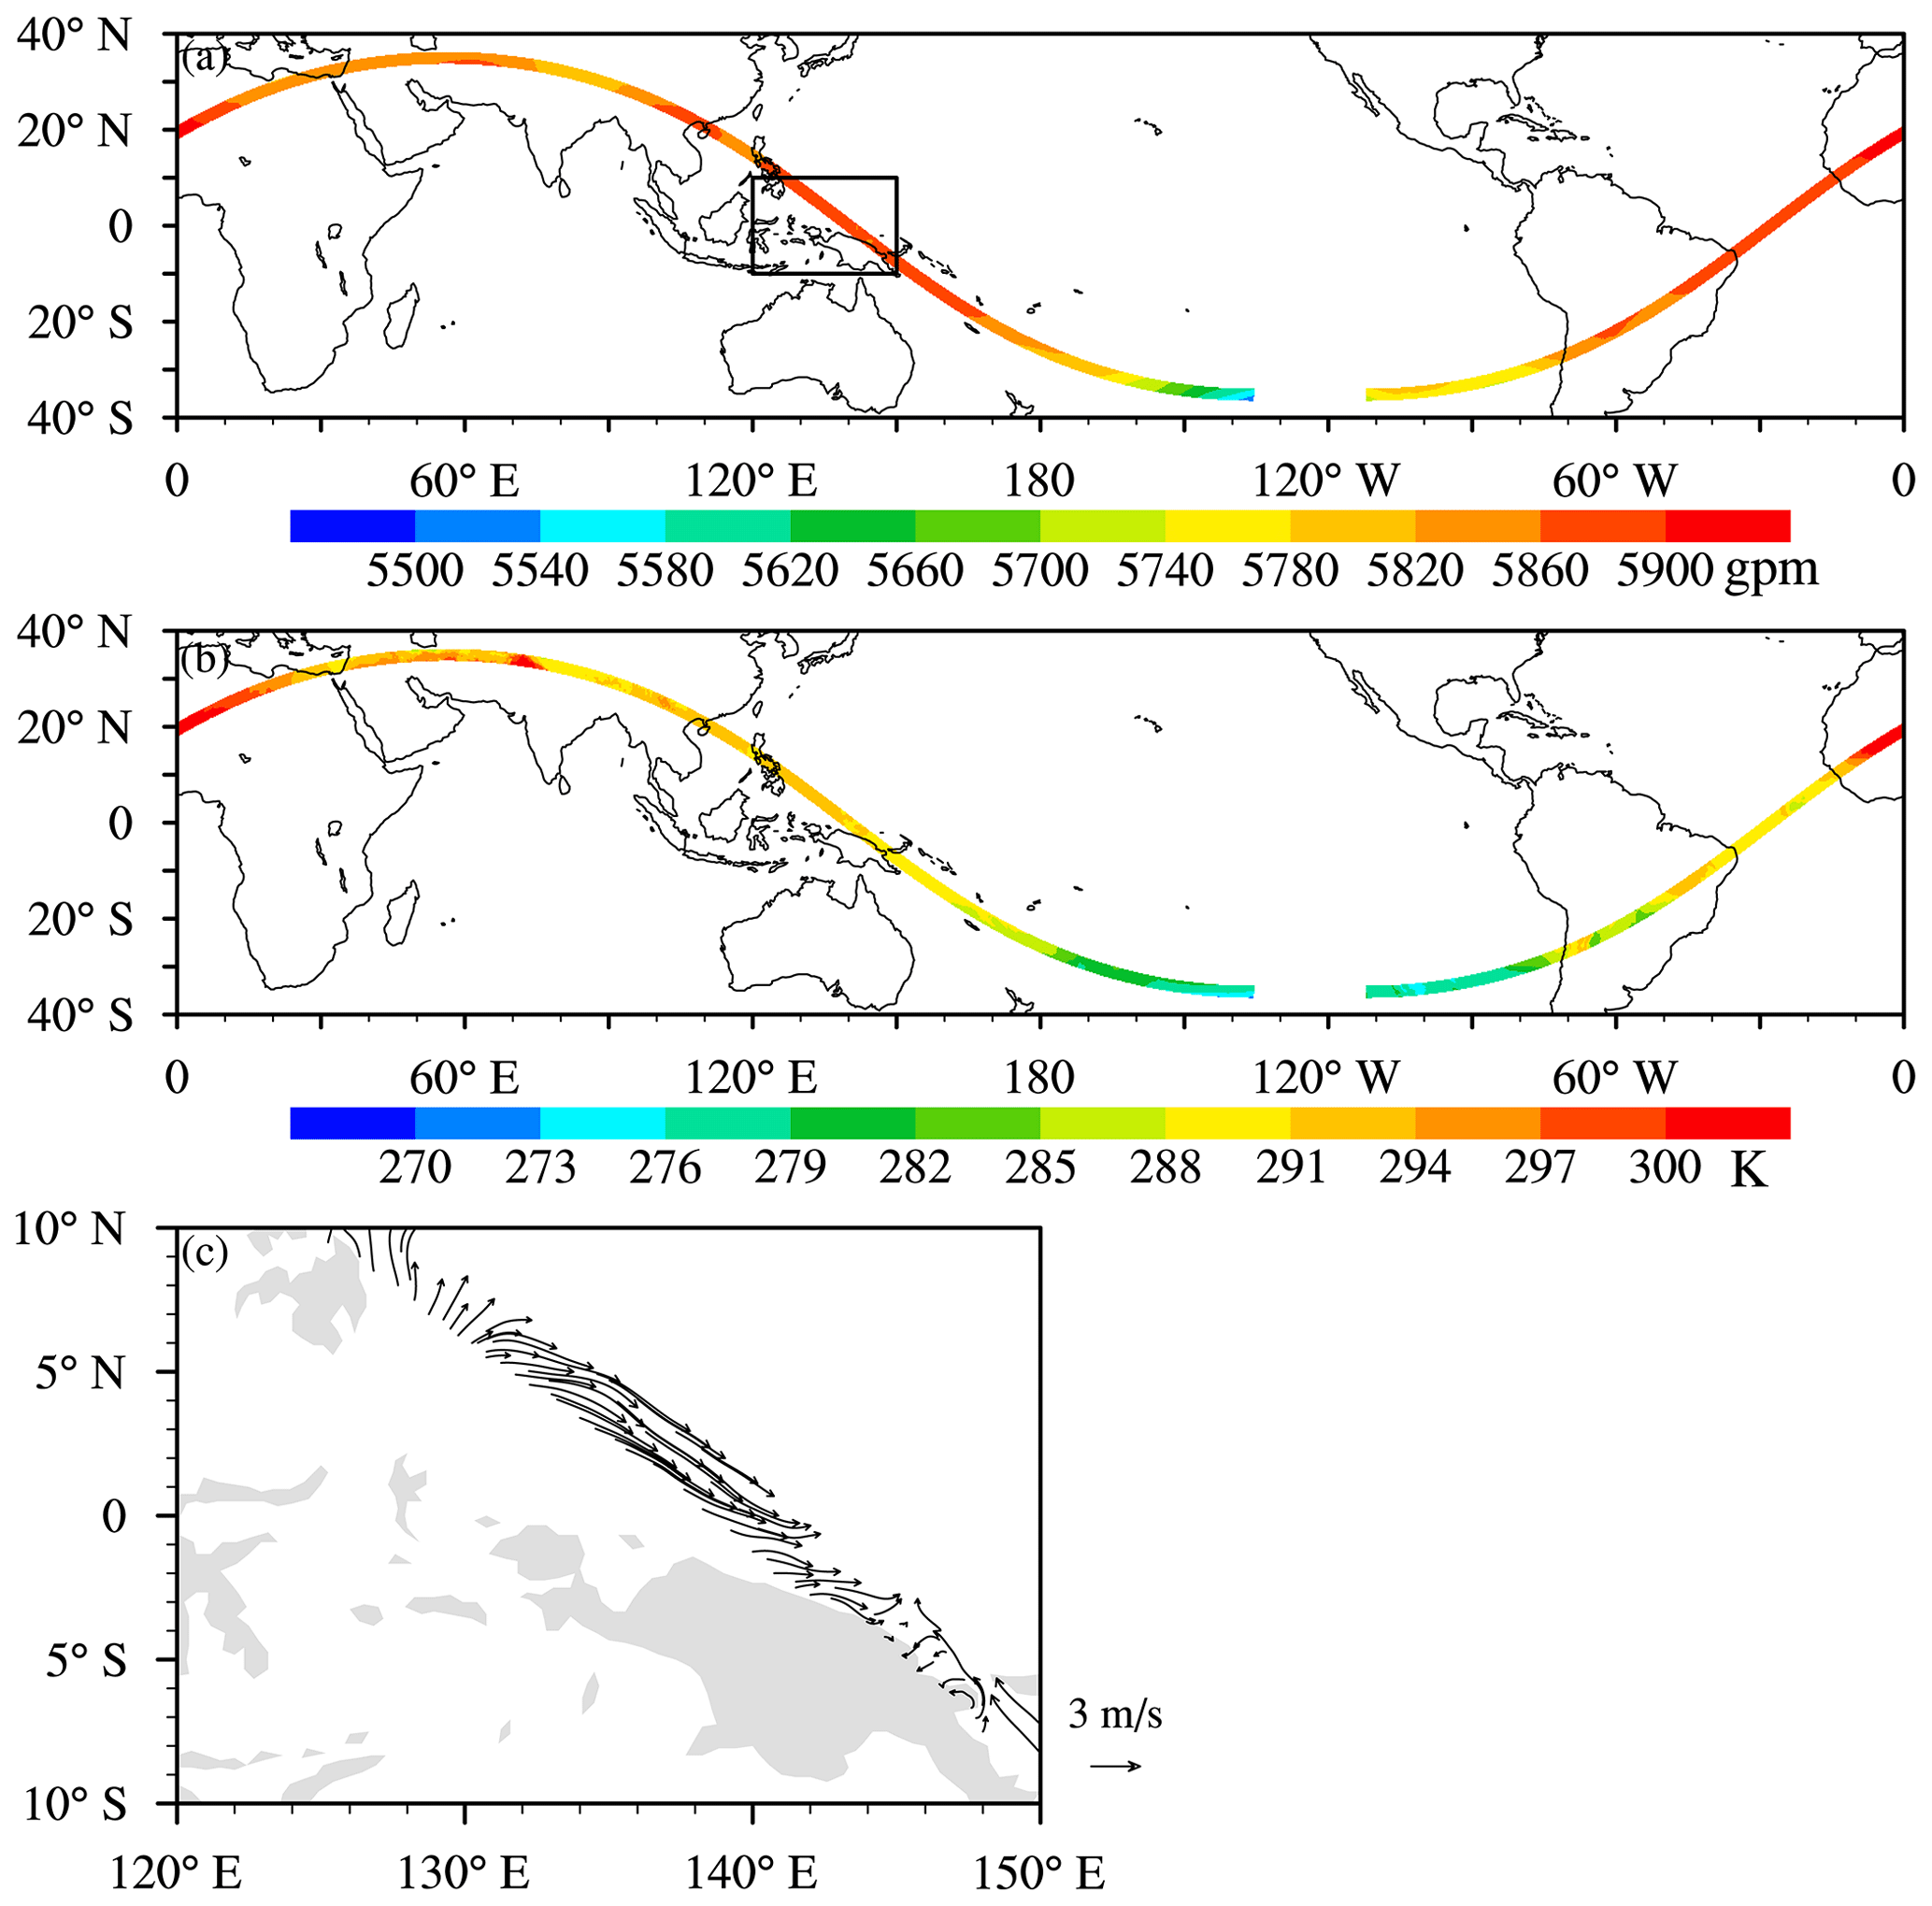
Figure 4Distribution of (a) the geopotential height at 500 hPa, (b) the temperature at 850 hPa and (c) the wind field at 1000 hPa for orbit number 37362 on 5 June 2004 in M-1B01-2A25-GD.
Figure 4 shows the geopotential height at 500 hPa, the temperature at 850 hPa and the wind field at 1000 hPa. The geopotential height is mainly in the range 5540–5900 gpm and the temperature ranges from 270 to 300 K (Fig. 4a, b). The box in Fig. 4a shows an enlarged view of the wind field. A strong northwesterly wind appears on the sea surface. The parameters for precipitation, clouds and the atmospheric status provided by M-1B01-2A25-GD can therefore be used to study the properties of precipitation and clouds systems.
3.4 Applications of M-1B01-2A25-GD
Evaluations of M-1B01-2A25-GD show that the merging process does not seriously distort the original data. The new dataset can therefore be used to analyze different types of precipitation and clouds systems. To illustrate the applicability of this new dataset to a variety of different scenarios, we selected precipitation on the trumpet-shaped topography of the Tibetan Plateau, Typhoon Rananim precipitation and frontal precipitation in eastern China for further analysis.
3.4.1 Precipitation on the trumpet-shaped topography of the southern Tibetan Plateau
The trumpet-shaped topography of the southern Tibetan Plateau (22–32∘ N, 90–100∘ E) is the one of the main channels for the transport of water vapor in this region. The topography here is complex, and there is a clear difference in altitude between the trumpet-shaped area from the hills below the Tibetan Plateau and the steep slopes and the central Tibetan Plateau. We define these three types of topography as the foreland under the Tibetan Plateau (FTP), the slope of the trumpet-shaped area (STS) and the central part of the Tibetan Plateau (CTP).

Figure 5Case study of precipitation in the trumpet-shaped topography on the Tibetan Plateau on 2 July 2004 (orbit number 37786). (a) The near-surface rain rate, (b) vertical cross sections of the precipitation reflectivity factor, (c) RF1, (d) TB10.8, and vertical cross sections of (e) the wind vectors and specific humidity and (f) the divergence of water vapor flux along line A–B in panel (a).
The precipitation occurred on 2 July 2004 (orbit number 37786). Intense rainfall mainly occurs in the STS with a maximum precipitation intensity of over 13 mm h−1. Figure 5a shows the near-surface rain rate in the rain belt, and Fig. 5b shows the vertical cross section of the precipitation reflectivity factor in the direction of the heavy rainfall center shown in Fig. 5a (line A–B). The altitude varies by 2 km from A to B. The storm top height (STH) refers to the height at which the precipitation reflectivity factor of the three continuous layers is greater than 16 dBZ in the precipitation profiles; it decreases gradually, and the strong reflectivity factor weakens over the CTP. The intensity of precipitation in the STS from the atmosphere to the land surface first increases and then decreases. There is usually a strong precipitation reflectivity factor 3 km above the land surface. However, the intensity of precipitation on the CTP is weaker than that in the FTP. Fu et al. (2017) showed that the elevation of water vapor by the complex topography leads to precipitation in the STS. However, the intensity of precipitation is weak because the water vapor column on the CTP is inadequate due to earlier precipitation in the STS.
The physical characteristics of the precipitating clouds are different as a result of the differences in the intensity of precipitation. Figure 5c shows RF1, which ranges between 0.5 and 1.0, with high values in the areas where precipitation is heavy. TB10.8 varies from 190 to 210 K in the region of intense precipitation, which shows that the cloud top is high. The cloud top is slightly lower around the precipitating cloud where TB10.8 is high (Fig. 5d). In addition to the topographic elevation of water vapor, it is also necessary to understand the status of the atmosphere, including the wind field and water vapor conditions.
There is a wet band below 700 hPa with a specific humidity of over 15 g kg−1. The specific humidity decreases in the lower layers of the atmosphere from the FTP to the STS and extending to the CTP. A northeasterly airflow prevails below 700 hPa from the CTP via the STS to the FTP. Between 700 and 500 hPa, this northeasterly airflow turns to the northwest over the CTP. Above 500 hPa, the airflow is mainly westerly with a higher speed. The water vapor content becomes less favorable for precipitation in the higher atmospheric layers (Fig. 5e). The better water vapor conditions in the lower atmosphere are important for the precipitation process. The upward airflow toward the CTP brings abundant water vapor from the FTP via the STS to the CTP.
The water vapor flux divergence (WVFD) is an important parameter used to describe the status of water vapor transportation in the atmosphere. The WVFD of the FTP is about 1– g hPa−1 s−1 cm−2, which means that the water vapor is diverging. The divergence belt extends to the front of the STS. The WVFD changes to be positive in the STS (from to 0 g hPa−1 s−1 cm−2), so the water vapor here is in a convergence field. There is strong divergence on the CTP with a maximum of more than g hPa−1 s−1 cm−2. Figure 5f shows the complex water vapor transportation processes from the FTP to the CTP. Most of the transport and exchange of water vapor occurs in the lower atmosphere. There is more water vapor in the FTP and STS than in the CTP, and the intensity of precipitation is heavy in the STS. The elevated topography increases the transportation of water vapor and chance of precipitation; indeed the wind speed and convergence of water vapor favor heavy rainfall over the STS.
3.4.2 Typhoon Rananim precipitation
The second precipitation example, Typhoon Rananim, occurred in the western Pacific (16–26∘ N, 122–132∘ E) during orbit 38395 on 10 August 2004.
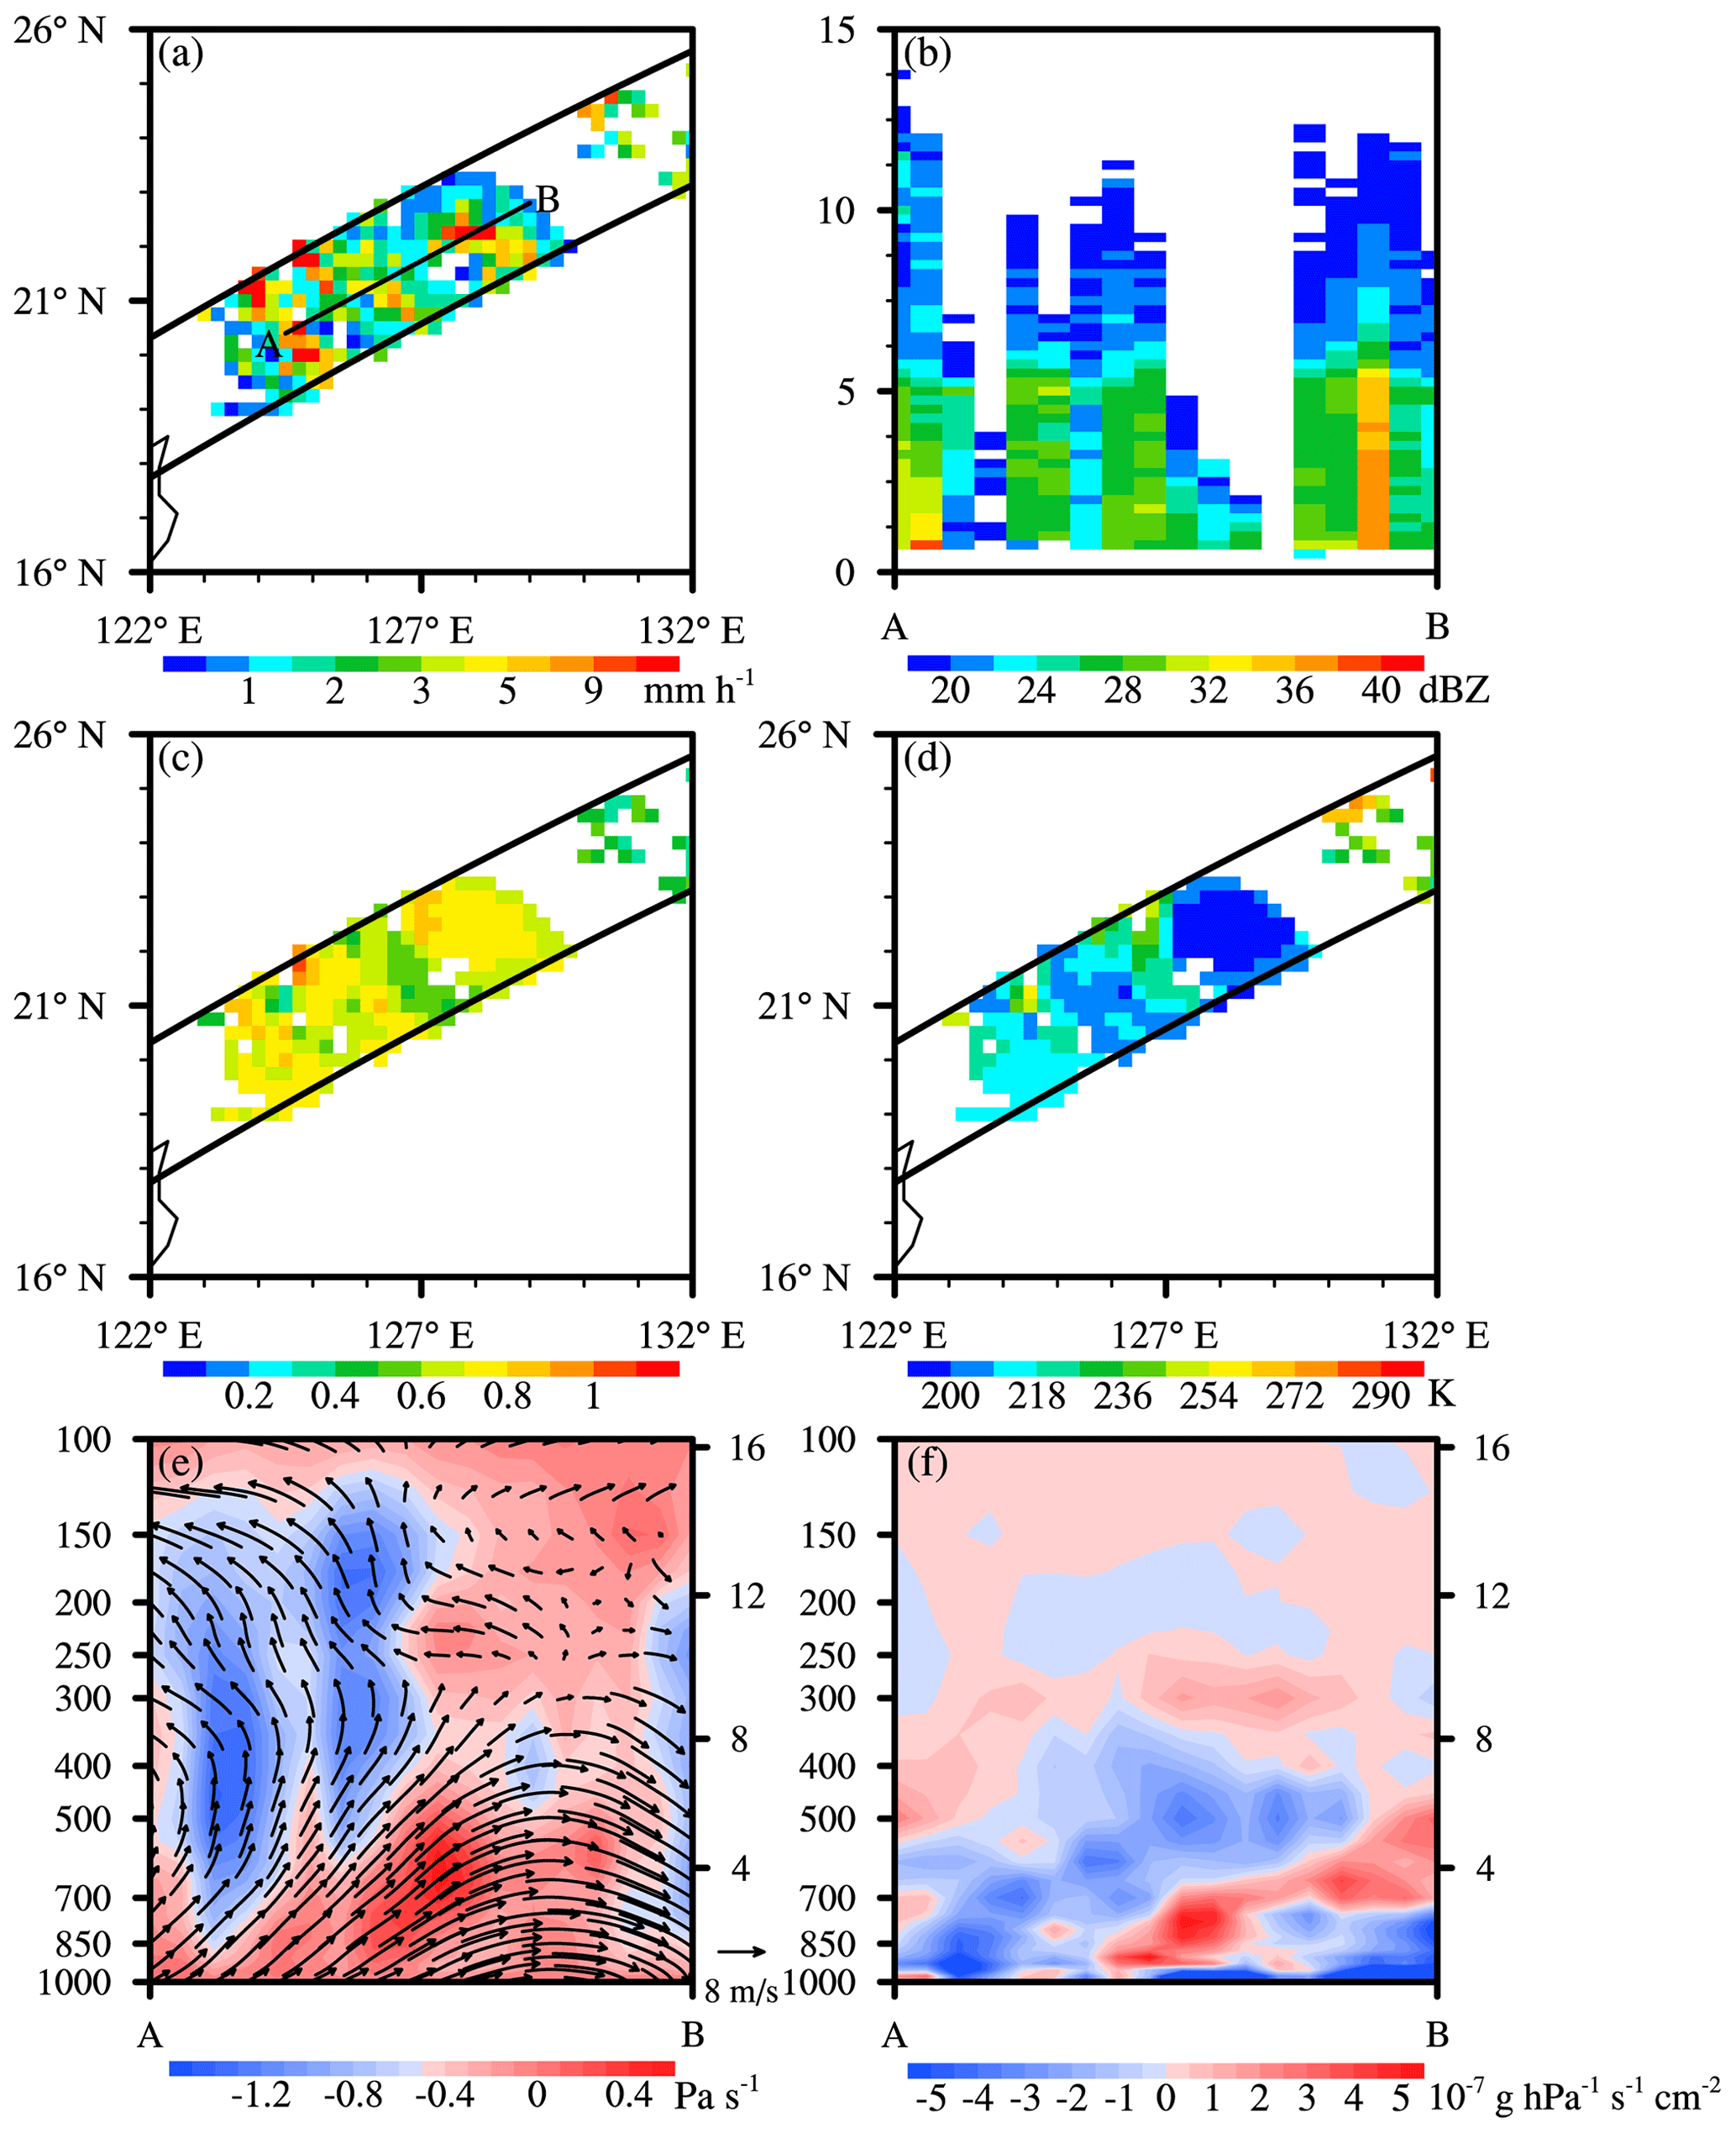
Figure 6Case study of Typhoon Rananim precipitation on 10 August 2004 (orbit number 38395). (a) The near-surface rain rate, (b) vertical cross sections of the precipitation reflectivity factor, (c) RF1, (d) TB10.8, vertical cross sections of (e) the wind vectors and vertical velocity and (f) the divergence of water vapor flux along line A–B in panel (a).
The eye of a typhoon is an important indicator over the whole lifetime of the typhoon. The eye of the typhoon shown in Fig. 6a means the typhoon is in the mature stage, and the cross section along line A–B crosses the middle of the eye. The STH is higher than 13 km in the eye wall region, which means that strong convection occurs here, but is lower than 5 km in the eye of the typhoon. The maximum precipitation reflectivity factor exceeds 35 dBZ, but the precipitation intensity inside the eye is weak, resulting in a low precipitation reflectivity factor and STH (Fig. 6b).
RF1 varies from 0.5 to 1. The values near the precipitating cloud top are small near the eye wall (Fig. 6c). The distribution of TB10.8 shows the height of the precipitating cloud top, which also indirectly represents convection inside the precipitation system. TB10.8 is less than 235 K around the eye of the typhoon. A low brightness temperature means a high precipitating cloud top. The STH is low and the cloud top is high in some regions as a result of cirrus clouds (Fig. 6d). The maximum descending speed in the typhoon eye is over 0.5 Pa s−1, and a southwesterly airflow prevails at high speeds below 400 hPa. The airflow is in the opposite direction at low speeds above 400 hPa. The maximum ascending speed in the eye wall reaches −1.5 Pa s−1 (Fig. 6e).
Figure 6f shows the transportation of water vapor in the typhoon system along line A–B. There is strong convergence of water vapor below 700 hPa, and the maximum WVFD is g hPa−1 s−1 cm−2. There exists a belt of divergence in the middle of the convergence field with WVFD values ranging from to g hPa−1 s−1 cm−2. Water vapor is usually transported in the lower layers of the atmosphere. Water vapor is exchanged between the typhoon and the eye wall, so the intensity of precipitation is different at various locations in the typhoon system.
3.4.3 Frontal precipitation in eastern China
In frontal systems, precipitation is induced by the elevation of air masses when two types of airflow meet. As an example, the frontal precipitation case that occurred in eastern China (30–40∘ N, 112–122∘ E) on 22 June 2003 during orbit 31926 is analyzed.
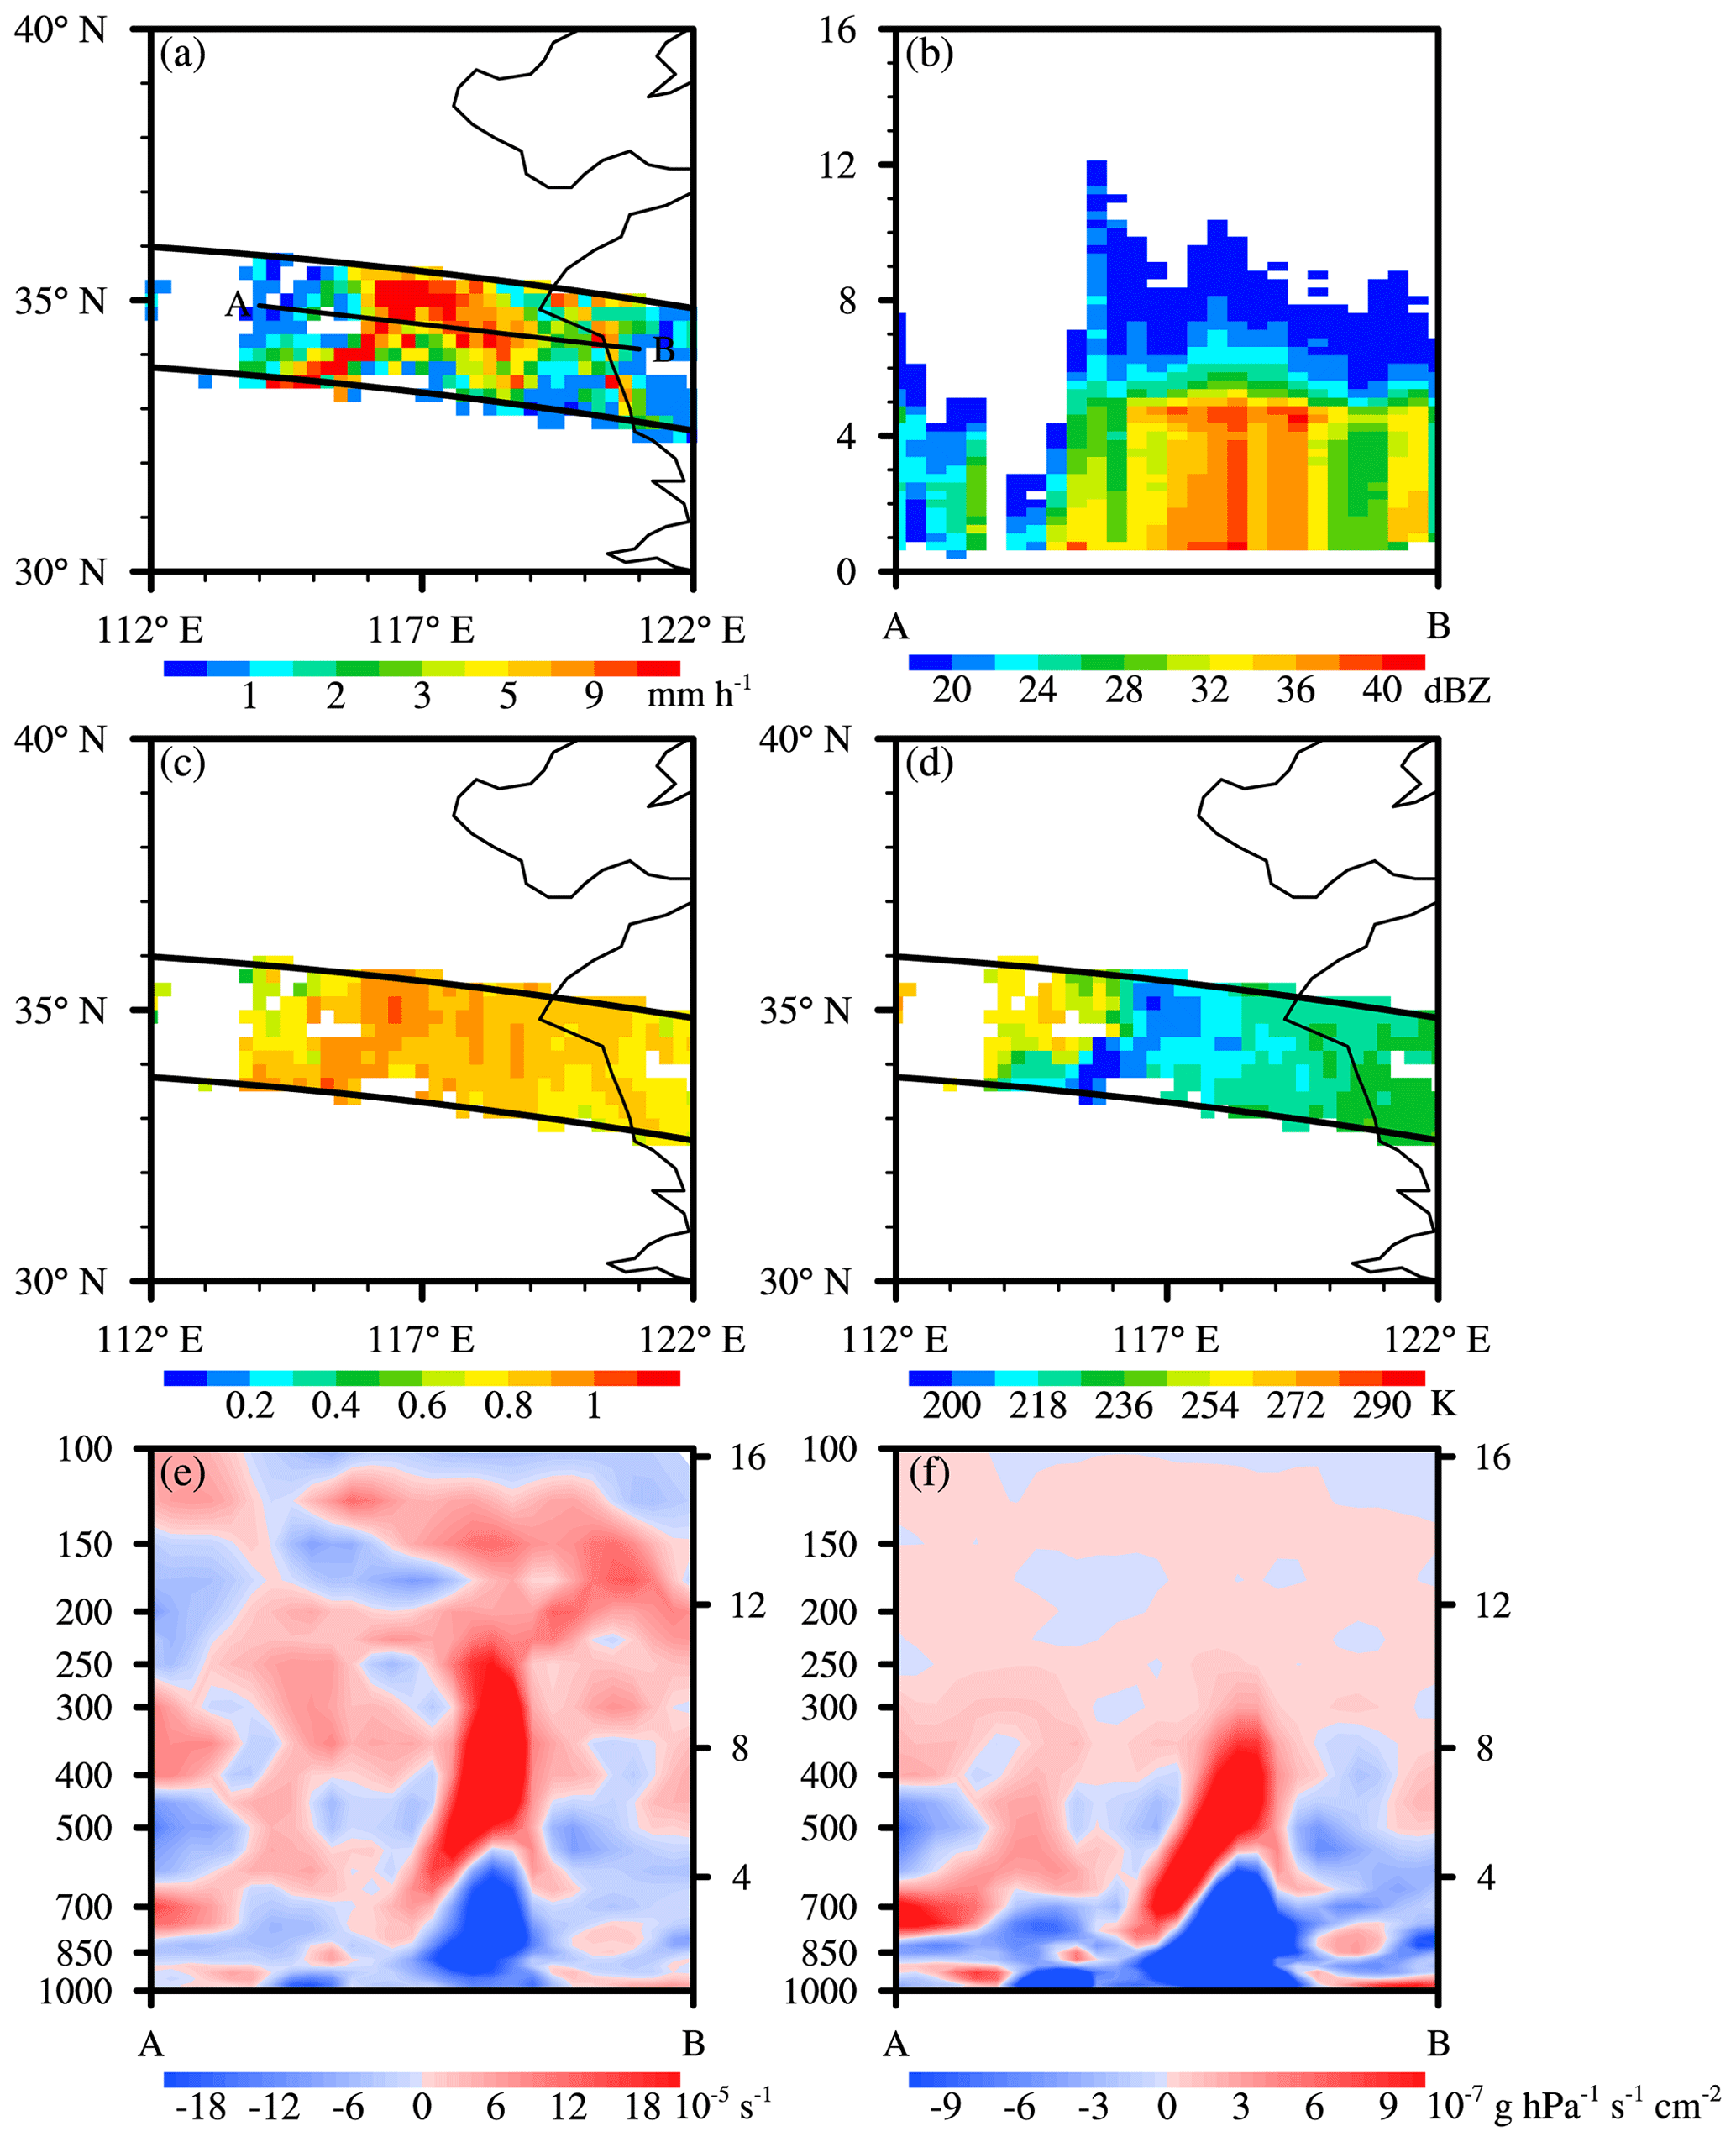
Figure 7Case study of frontal precipitation on 3 June 2003 (orbit number 31926). (a) The near-surface rain rate; vertical cross sections of (b) the precipitation reflectivity factor, (c) RF1 and (d) TB10.8; and vertical cross sections of (e) divergence and (f) the divergence of water vapor flux along line A–B in panel (a).
Figure 7a clearly shows the rain belt at the boundary of the different airflows. The maximum precipitation intensity is more than 10 mm h−1. Figure 7b shows the precipitation reflectivity factor profiles of line A–B to illustrate the vertical structure. The reflectivity factor is high from the land surface to 5 km, and the maximum exceeds 42 dBZ. RF1 shows a high value, which is bigger than 0.8 near the heavy-rainfall region (Fig. 7c). TB10.8 varies between 200 and 235 K in the area of strong precipitation intensity, and the minimum appears in the front, where the height of the precipitating cloud top is highest. The difference in the brightness temperature on each side of the front represents the difference in the height of the precipitating cloud top (Fig. 7d). Figure 7e shows that the calculated divergence in the cross section, which represents convergence below 700 hPa, reaches s−1. Strong divergence of over s−1 occurs above 500 hPa. The WVFD has the same distribution as the divergence. The maximum WVFD exceeds g hPa−1 s−1 cm−2 below 700 hPa. Strong divergence of the water vapor occurs above 500 hPa, with a WVFD of g hPa−1 s−1 cm−2. The exchange of water vapor often occurs below 200 hPa (Fig. 6f). The atmospheric status satisfies the precipitation condition and shows the complexity of vertical motion in the atmosphere.
Due to the rapid development of satellite technology and emergence of various satellite data products, the huge number of satellite datasets usually leads to difficulty in data storage. The M-1B01-2A25-GD dataset is a grid-level dataset with a spatial resolution of 0.25∘, which can largely reduce the digital storage space required. This new dataset will serve as a demonstration for satellite data processing.
The data merging among the precipitation parameters (profiles of rain rate and precipitation reflectivity factor, near-surface rain rate and rain type) measured by the PR, spectral signals measured by the VIRS and atmospheric parameters (temperature, specific humidity, wind field, geopotential height, divergence and vertical velocity) of the ERA5 reanalysis dataset is an initial attempt. This dataset can be helpful in studying the characteristics and changes in precipitation and cloud systems. To further explore the relationship among the precipitation, cloud and atmospheric parameters, the cloud parameters based on the signal retrieval from the TRMM VIRS data will be added to the merged dataset. This work is now in progress but will not be covered in this study due to the limited length of the paper.
Studies on atmospheric dynamics and cloud physics are isolated because of the lack of suitable datasets. Now, the problem can be solved through establishing the new merged dataset. The comprehensive parameters about precipitation, cloud and atmosphere status can be obtained in each single orbit from M-1B01-2A25-GD to support case analysis and model simulations.
The used M-1B01-2A25-GD in this paper are accessible at https://doi.org/10.5281/zenodo.4458868 (Sun and Fu, 2021).
We establish a new merged gridded dataset M-1B01-2A25-GD combining satellite and reanalysis datasets. The precipitation, cloud and atmospheric parameters are spatially and temporally collocated. The gridded data help to reduce the digital storage space required. The statistical results show that there is no obvious bias in 1B01-2A25-PMD when compared with the original swath-level data measured by the TRMM VIRS. The 1B01-2A25-GD dataset has the same spatial resolution as the ERA5 reanalysis dataset. The average inside the grid leads to smoothing effects on the maximum and minimum values but does not adversely influence the parameters in 1B01-2A25-PMD. In the arbitrarily chosen orbit, the difference in the mean value is no more than 0.87 and the SD is no more than 2.38 for the near-surface rain rate and signals measured by the VIRS. The M-1B01-2A25-GD dataset contains comprehensive parameters about precipitation, clouds and the atmosphere that are useful in studies of the characteristics and distribution of precipitation and cloud systems in the tropics and subtropics. Three typical applications of M-1B01-2A25-GD are introduced by analyzing different examples of precipitation. This new dataset can support studies of precipitation, cloud systems and model simulations. Longer time periods of data and more parameters will be added as satellite technology and models are improved.
LS and YF prepared the data in the standardized format. LS uploaded the data in the data repository and prepared the manuscript with contributions from YF.
The authors declare that they have no conflict of interest.
We are greatly appreciative of the European Centre for Medium Range Weather Forecasts (ECMWF) for providing ERA5 data and NASA TRMM PR and VIRS datasets.
This research has been supported by the National Natural Science Foundation of China (grant nos. 91837310 and 41675041), the Second Tibetan Plateau Scientific Expedition and Research (STEP) program (grant no. 2019QZKK0104), the National Key R&D Program of China (grant nos. 2018YFC1507200 and 2017YFC1501402), the key research and development projects in Anhui Province (grant no. 201904a07020099), and CLIMATE‐TPE (ID 32070) in the framework of the ESA MOST Dragon 4 program.
This paper was edited by Qingxiang Li and reviewed by two anonymous referees.
Awaka, J., Iguchi, T., Kumagai, H., and Okamoto, K.: Rain type classification algorithm for TRMM precipitation radar, IEEE International Geoscience and Remote Sensing Symposium Proceedings. Remote Sensing – A Scientific Vision for Sustainable Development, Singapore, 3–8 August 1997, https://doi.org/10.1109/IGARSS.1997.608993, 1997.
Baker, M. B.: Cloud Microphysics and Climate, Science, 276, 1072–1078, https://doi.org/10.1126/science.276.5315.1072, 1997.
Chen, F. and Fu, Y. F.: Characteristics of typhoon precipitation and non-typhoon precipitation over East Asia based on merged PR and VIRS data, Climatic. Environ. Res., 20, 62–74, https://doi.org/10.3878/j.issn.1006-9585.2014.14031, 2015 (in Chinese).
Chen, F., Sheng, S., Bao, Z., Wen, H., Hua, L., Paul, N. J., and Fu, Y.: Precipitation Clouds Delineation Scheme in Tropical Cyclones and Its Validation Using Precipitation and Cloud Parameter Datasets from TRMM, J. Appl. Meteorol. Climatol., 57, 821–836, https://doi.org/10.1175/jamc-d-17-0157.1, 2018.
Chen, Y. and Fu, Y.: Characteristics of VIRS Signals within Pixels of TRMM PR for Warm Rain in the Tropics and Subtropics, J. Appl. Meteorol. Climatol., 56, 789–801, https://doi.org/10.1175/jamc-d-16-0198.1, 2017.
Durden, S. L., Im, E., Haddad, Z. S., and Li, L.: Comparison of TRMM precipitation radar and airbrone radar data, J. Appl. Meteorol., 42, 769–774, https://doi.org/10.1175/1520-0450(2003)042<0769:COTPRA>2.0.CO;2, 2003.
Fu, Y. and Zhang, A.: Life Cycle Effects on the Vertical Structure of Precipitation in East China Measured by Himawari-8 and GPM DPR, Mon. Weather Rev., 146, 2183–2199, https://doi.org/10.1175/mwr-d-18-0085.1, 2018.
Fu, Y., Liu, G., Wu, G., Yu, R., Xu, Y., Wang, Y., Li, R., and Liu, Q.: Tower mast of precipitation over the central Tibetan Plateau summer, Geophys. Res. Lett., 33, L05802, https://doi.org/10.1029/2005gl024713, 2006.
Fu, Y., Liu, Q., Gao, Y., Hong, X., Zi, Y., Zheng, Y., Li, R., and Heng, Z.: A feasible method for merging the TRMM microwave imager and precipitation radar data, J. Quant. Spectrosc. Ra., 122, 155–169, https://doi.org/10.1016/j.jqsrt.2012.08.028, 2013.
Fu, Y., Pan, X., Xian, T., Liu, G., Zhong, L., Liu, Q., Li, R., Wang, Y., and Ma, M.: Precipitation characteristics over the steep slope of the Himalayas in rainy season observed by TRMM PR and VIRS, Clim. Dynam., 51, 1971–1989, https://doi.org/10.1007/s00382-017-3992-3, 2017.
Fu, Y. F.: Cloud Parameyers retrieved by the bispectral reflectance algorithm and associated applications, J. Meteorol. Res-Prc., 28, 965–982, https://doi.org/10.1007/s13351-014-3292-3, 2014.
Fu, Y. F. and Liu, G. S.: The variability of tropical precipitation profiles and its impact on microwave brightness temperatures as inferred from TRMM data, J. Appl. Meteorol., 40, 2130–2143, https://doi.org/10.1175/1520-0450(2001)040<2130:TVOTPP>2.0.CO;2, 2001.
Fu, Y. F., Liu, Q., Zi, Y., Feng, S., Li, Y., and Liu, G. S.: Summer Precipitation andLatent Heating over the Tibet Plateau Based on TRMM Measurements, Plateau. Mountain. Meteor. Res., 28, 8–18, https://doi.org/10.3969/j.issn.1674-2184.2008.01.002, 2008 (in Chinese).
Fu, Y. F., Liu, P., Liu, Q., Ma, M., Sun, L., and Wang, Y.: Climatological Characteristics of VIRS Channels for Precipitating Cloud in Summer Over the Tropics and Subtropics, J. Atmos. Environ. Optics, 6, 129–140, https://doi.org/10.3969/j.issn.1673-6141.2011.02.009, 2011 (in Chinese).
Gao, W., Liu, L., Li, J., and Lu, C.: The Microphysical Properties of Convective Precipitation Over the Tibetan Plateau by a Subkilometer Resolution Cloud-Resolving Simulation, J. Geophys. Res.-Atmos., 123, 3212–3227, https://doi.org/10.1002/2017jd027812, 2018.
Hartmann, D. L. and Short, D. A.: On the Use of Earth Radiation Budget Statistics for Studies of Clouds and Climate, J. Atmos. Sci., 37, 1233–1250, https://doi.org/10.1175/1520-0469(1980)037<1233:Otuoer>2.0.Co;2, 1980.
Hawkins, J., Miller, S., Mitrescu, C., L'Ecuyer, T., Turk, J., Partain, P., and Stephens, G.: Near-Real-Time Applications of CloudSat Data, J. Appl. Meteorol. Climatol., 47, 1982–1994, https://doi.org/10.1175/2007jamc1794.1, 2008.
Hayasaka, T., Kozu, T., Iguchi, T., Meneghini, R., Awaka, J., Okamoto, K. i., Wu, D. L., Jin, Y., and Jiang, J.: Preliminary test results of a rain rate profiling algorithm for the TRMM precipitation radar, Microwave Remote Sensing of the Atmosphere and Environment, China, 19 August 1998, 3503, 86–93, https://doi.org/10.1117/12.319497, 1998.
Heng, Z. and Fu, Y. F.: Impact of gridding scale on TRMM microwave imager cloud water information, Climatic. Environ. Res., 19, 693–702, https://doi.org/10.3878/j.issn.1006-9585.2013.13049, 2014 (in Chinese).
Hersbach, H., Bell, B., Berrisford, P., Hirahara, S., Horányi, A., Muñoz-Sabater, J., Nicolas, J., Peubey, C., Radu, R., Schepers, D., Simmons, A., Soci, C., Abdalla, S., Abellan, X., Balsamo, G., Bechtold, P., Biavati, G., Bidlot, J., Bonavita, M., Chiara, G., Dahlgren, P., Dee, D., Diamantakis, M., Dragani, R., Flemming, J., Forbes, R., Fuentes, M., Geer, A., Haimberger, L., Healy, S., Hogan, R. J., Hólm, E., Janisková, M., Keeley, S., Laloyaux, P., Lopez, P., Lupu, C., Radnoti, G., Rosnay, P., Rozum, I., Vamborg, F., Villaume, S., and Thépaut, J. N.: The ERA5 global reanalysis, Q. J. Roy. Meteorol. Soc., 146, 1999–2049, https://doi.org/10.1002/qj.3803, 2020.
Hobbs, P. V.: Research on the clouds and precipitation past present and future,Part II, B. Am. Meteorol. Soc., 72, 184–191, https://doi.org/10.1175/1520-0477(1991)072<0184:ROCAPP>2.0.CO;2, 1991.
Houze, R. A.: Structures of atmospheric precipitation systems A global survey, Radio. Sci., 16, 671–689, https://doi.org/10.1029/RS016i005p00671, 1981.
Houze, R. A.: Stratiform Precipitation in Regions of Convection: A Meteorological Paradox?, B. Am. Meteorol. Soc., 78, 2179–2196, https://doi.org/10.1175/1520-0477(1997)078<2179:SPIROC>2.0.CO;2, 1997.
Iguchi, T., Meneghini, R., Awaka, J., Kozu, T., and Okamoto, K.: Rain profiling algorithm for TRMM Precipitation Radar data, Adv. Space. Res., 25, 973–976, https://doi.org/10.1016/S0273-1177(99)00933-3, 2000.
Kienast-Sjögren, E., Rolf, C., Seifert, P., Krieger, U. K., Luo, B. P., Krämer, M., and Peter, T.: Climatological and radiative properties of midlatitude cirrus clouds derived by automatic evaluation of lidar measurements, Atmos. Chem. Phys., 16, 7605–7621, https://doi.org/10.5194/acp-16-7605-2016, 2016.
Kozu, T., Kawanishi, T., Kuroiwa, H., Oikawa, M., Kumagai, H., Okamoto, K., Okumura, M., Nakatsuka, H., and Nishikawa, K.: Development of precipitation radar onboard the Tropical Rainfall Measuring Mission (TRMM) satellite., IEEE T. Geosci. Remote. Sens., 39, 102–116, https://doi.org/10.1109/36.898669, 2001.
Kummerow, C., William, S., and Giglio, L.: A simplified scheme for obtaining precipitation and vertical hydrometeor profiles from passive microwave sensors, IEEE T. Geosci. Remote. Sens., 34, 1213–1232, https://doi.org/10.1109/36.536538, 1996.
Kummerow, C., Barnes, W., Kozu, T., Shiue, J., and Simpson, J.: The tropical rainfall measuring mission (TRMM) sensor package, J. Atmos. Ocean. Tech., 15, 809–817, https://doi.org/10.1175/1520-0426(1998)015<0809:TTRMMT>2.0.CO;2, 1998.
Kummerow, C., Simpson, J., Thiele, O., Barnes, W., Chang, A. T. C., Stocker, E., Adler, R. F., Hou, A., Kakar, R., Wentz, F., Ashcroft, P., Kozu, T., Hong, Y., Okamoto, K., Iguchi, T., Kuroiwa, H., Im, E., Haddad, Z., Huffman, G., Ferrier, B., Olson, W. S., Zipser, E., Smith, E. A., Wilheit, T. T., North, G., Krishnamurti, T., and Nakamura, K.: The status of the TRMM after two years in orbit, J. Appl. Meteorol. Climatol., 39, 1965–1982, https://doi.org/10.1175/1520-0450(2001)040<1965:TSOTTR>2.0.CO;2, 2000.
Lau, K. M. and Wu, H. T.: Characteristics of Precipitation, Cloud, and Latent Heating Associated with the Madden-Julian Oscillation, J. Climate, 23, 504–518, https://doi.org/10.1175/2009jcli2920.1, 2010.
Li, J., Lv, Q., Jian, B., Zhang, M., Zhao, C., Fu, Q., Kawamoto, K., and Zhang, H.: The impact of atmospheric stability and wind shear on vertical cloud overlap over the Tibetan Plateau, Atmos. Chem. Phys., 18, 7329–7343, https://doi.org/10.5194/acp-18-7329-2018, 2018.
Li, R. and Fu, Y. F.: Tropical Precipitation Estimated by GPCP and TRMM PR Observations, Adv. Atmos. Sci., 22, 852–864, https://doi.org/10.1007/BF02918685, 2005.
Liou, K.-N.: Influence of Cirrus Clouds on Weather and Climate Processes: A Global Perspective, Mon. Weather Rev., 114, 1167–1199, https://doi.org/10.1175/1520-0493(1986)114<1167:Ioccow>2.0.Co;2, 1986.
Liu, C. and Zipser, E. J.: “Warm Rain” in the Tropics: Seasonal and Regional Distributions Based on 9 yr of TRMM Data, J. Climate, 22, 767–779, https://doi.org/10.1175/2008jcli2641.1, 2009.
Liu, G. S. and Fu, Y. F.: The Characteristics of tropical precipitation profiles as inferred from satellite radar measurements, J. Meteorol. Soc. Jpn., 79, 131–143, https://doi.org/10.2151/jmsj.79.131, 2001.
Liu, Q. and Fu, Y. F.: The difference between precipitation profiles over the Tibetan Plateau and over East Asia and Tropics, Journal of University of Science and technology of China, 37, 885–894, https://doi.org/10.3969/j.issn.0253-2778.2007.08.011, 2007 (in Chinese).
Liu, Q. and Fu, Y.: Comparison of radiative signals between precipitating and non-precipitating clouds in frontal and typhoon domains over East Asia, Atmos. Res., 96, 436–446, https://doi.org/10.1016/j.atmosres.2010.02.003, 2010.
Lu, D., Yang, Y., and Fu, Y.: Interannual variability of summer monsoon convective and stratiform precipitations in East Asia during 1998–2013, Int. J. Climatol., 36, 3507–3520, https://doi.org/10.1002/joc.4572, 2016.
Luo, S., Fu, Y., Zhou, S., Wang, X., and Wang, D.: Analysis of the Relationship between the Cloud Water Path and Precipitation Intensity of Mature Typhoons in the Northwest Pacific Ocean, Adv. Atmos. Sci., 37, 359–376, https://doi.org/10.1007/s00376-020-9204-9, 2020.
Luo, Y., Zhang, R., and Wang, H.: Comparing Occurrences and Vertical Structures of Hydrometeors between Eastern China and the Indian Monsoon Region Using CloudSat/CALIPSO Data, J. Climate, 22, 1052–1064, https://doi.org/10.1175/2008jcli2606.1, 2009.
Min, Q., Li, R., Wu, X., and Fu, Y.: Retrieving latent heating vertical structure from cloud and precipitation Profiles – Part I: Warm rain processes, J. Quant. Spectrosc. Ra., 122, 31–46, https://doi.org/10.1016/j.jqsrt.2012.11.030, 2013.
Nesbitt, S. W., Zipser, E. J., and Cecil, D. J.: A census of precipitation features in the tropics using TRMM Radar, ice scattering, and lightning observations, J. Climate, 13, 4087–4106, https://doi.org/10.1175/1520-0442(2000)013<4087:ACOPFI>2.0.CO;2, 1999.
Oki, T. and Kanae, S.: Global hydrological cycles and world water resources, Science, 313, 1068–1072, https://doi.org/10.1126/science.1128845, 2006.
Olson, W. S., Kummerow, C. D., Heymsfield, G. M., and Giglio, L.: A Method for Combined Passive-Active Microwave Retrievals of Cloud and Precipitation Profiles, J. Appl. Meteorol., 35, 1763–1789, https://doi.org/10.1175/1520-0450(1996)035<1763:Amfcpm>2.0.Co;2, 1996.
Pan, X. and Fu, Y. F.: Analysis on Climatological Characteristics of Deep and Shallow Precipitation Cloud in Summer over Qinghai-Xizang Plateau, Plateau. Meteor., 34, 1191–1203, https://doi.org/10.7522/j.issn.1000-0534.2014.00112, 2015 (in Chinese).
Petty, G. W.: Physical retrievals of over-ocean rain rate from multichannel microwave imagery. Part I: Theoretical Characteristics of Normalized Polarization and Scattering Indices, Meteorol. Atmos. Phys., 54, 79–99, https://doi.org/10.1007/BF01030054, 1994.
Roscow, W. B. and Robert, A.: Advances in understanding clouds from ISCCP, B. Am. Meteorol. Soc., 80, 2261–2288, https://doi.org/10.1175/1520-0477(1999)080<2261:AIUCFI>2.0.CO;2, 1999.
Sassen, K., Wang, Z., and Liu, D.: Cirrus clouds and deep convection in the tropics: Insights from CALIPSO and CloudSat, J. Geophys. Res., 114, D00H06, https://doi.org/10.1029/2009jd011916, 2009.
Schumacher, C. and Houze, R. A.: The TRMM precipitation radar's view of shallow, isolated rain, J. Appl. Meteorol., 42, 1519–1524, https://doi.org/10.1175/1520-0450(2003)042<1519:TTPRVO>2.0.CO;2, 2003.
Simpson, J., Kummerow, C., Tao, W.-K., and Adler, R. F.: On the Tropical Rainfall Measuring Mission (TRMM), Meteorol. Atmos. Phys., 60, 19–36, https://doi.org/10.1007/BF01029783, 1996.
Sun, L. L. and Fu, Y. F.: A new merged dataset for analyzing clouds, precipitation and atmospheric parameters based on ERA5 reanalysis data and the measurements of TRMM PR and VIRS [dataset], Zenodo, https://doi.org/10.5281/zenodo.4458868, 2021.
Szoke, E. J., Zipser, E. J., and Jorgensen, D. P.: A Radar Study of Convective Cells in Mesoscale Systems in GATE. Part I: Vertical Profile Statistics and Comparison with Hurricanes, J. Atmos. Sci., 43, 182–198, https://doi.org/10.1175/1520-0469(1986)043<0182:Arsocc>2.0.Co;2, 1986.
Tustison, B., Foufoula-Georgiou, E., and Harris, D.: Scale-recursive estimation for multisensor Quantitative Precipitation Forecast verification: A preliminary assessment, J. Geophys. Res., 108, CIP2-1-14, https://doi.org/10.1029/2001jd001073, 2002.
Wang, R. and Fu, Y.: Structural characteristics of atmospheric temperature and humidity inside clouds of convective and stratiform precipitation in the rainy season over East Asia, J. Meteorol. Res-Prc., 31, 890–905, https://doi.org/10.1007/s13351-017-7038-x, 2017.
Wang, R., Fu, Y., Xian, T., Chen, F., Yuan, R., Li, R., and Liu, G.: Evaluation of Atmospheric Precipitable Water Characteristics and Trends in Mainland China from 1995 to 2012, J. Climate, 30, 8673–8688, https://doi.org/10.1175/jcli-d-16-0433.1, 2017.
Wang, Y., Zhang, Y., Fu, Y., Li, R., and Yang, Y.: A climatological comparison of column-integrated water vapor for the third-generation reanalysis datasets, Sci. China Earth Sci., 59, 296–306, https://doi.org/10.1007/s11430-015-5183-6, 2015.
Wetherald, R. T. and Manabe, S.: Cloud Feedback Processes in a General Circulation Model, J. Atmos. Sci., 45, 1397–1416, https://doi.org/10.1175/1520-0469(1988)045<1397:Cfpiag>2.0.Co;2, 1988.
Wilheit, T. T., Chang, A. T. C., V. Rao, M. S., Rodgers, E. B., and Theon, J. S.: A Satellite Technique for Quantitatively Mapping Rainfall Rates over the Oceans, J. Appl. Meteorol., 16, 551–560, https://doi.org/10.1175/1520-0450(1977)016<0551:Astfqm>2.0.Co;2, 1977.
Xia, J. and Fu, Y. F.: The vertical characteristics of temperature and humidity inside convective and stratiform precipitating clouds in the East Asian summer monsoon region and Indian summer monsoon region, Chinese J. Atmos. Sci., 40, 563–580, https://doi.org/10.3878/j.issn.1006-9895.1507.15123, 2016 (in Chinese).
Yang, Y.-J., Lu, D.-R., Fu, Y.-F., Chen, F.-J., and Wang, Y.: Spectral Characteristics of Tropical Anvils Obtained by Combining TRMM Precipitation Radar with Visible and Infrared Scanner Data, Pure Appl. Geophys., 172, 1717–1733, https://doi.org/10.1007/s00024-014-0965-x, 2014.
Yuter, S. E. and Houze, R. A.: Three-Dimensional Kinematic and Microphysical Evolution of Florida Cumulonimbus. Part III: Vertical Mass Transport, Mass Divergence, and Synthesis, Mon. Weather Rev., 123, 1964–1983, https://doi.org/10.1175/1520-0493(1995)123<1964:TDKAME>2.0.CO;2, 1995.
Zhao, B., Zhang, B., Shi, C., Liu, J., and Jiang, L.: Comparison of the Global Energy Cycle between Chinese Reanalysis Interim and ECMWF Reanalysis, J. Meteorol. Res-Prc., 33, 563–575, https://doi.org/10.1007/s13351-019-8129-7, 2019.
Zheng, X. Y., Fu, Y. F., Yang, Y. J., and Liu, G. S.: Impact of atmospheric circulations on aerosol distributions in autumn over eastern China: observational evidence, Atmos. Chem. Phys., 15, 12115–12138, https://doi.org/10.5194/acp-15-12115-2015, 2015.
Zipser, E. J. and Lutz, K. R.: The Vertical Profile of Radar Reflectivity of Convective Cells: A Strong Indicator of Storm Intensity and Lightning Probability?, Mon. Weather Rev., 122, 1751–1759, https://doi.org/10.1175/1520-0493(1994)122<1751:Tvporr>2.0.Co;2, 1994.