the Creative Commons Attribution 4.0 License.
the Creative Commons Attribution 4.0 License.
 | 19 May 2021
Construction of homogenized daily surface air temperature for the city of Tianjin during 1887–2019
Peng Si
Phil Jones
Century-long continuous daily observations from some stations are important for the study of long-term trends and extreme climate events in the past. In this paper, three daily data sources – (1) the Department of Industry Agency of the British Concession in Tianjin covering 1 September 1890–31 December 1931, (2) the Water Conservancy Commission of North China covering 1 January 1932–31 December 1950 and (3) monthly journal sheets for Tianjin surface meteorological observation records covering 1 January 1951–31 December 2019 – have been collected from the Tianjin Meteorological Archive. The completed daily maximum and minimum temperature series for Tianjin from 1 January 1887 (1 September 1890 for minimum) to 31 December 2019 has been constructed and assessed for quality control with an early extension from 1890 back to 1887. Several significant breakpoints are detected by the penalized maximal T test (PMT) for the daily maximum and minimum time series using multiple reference series around Tianjin from monthly Berkeley Earth (BE), Climatic Research Unit Time-Series version 4.03 (CRU TS4.03) and Global Historical Climatology Network (GHCN) v3 data. Using neighboring daily series the record has been homogenized with quantile matching (QM) adjustments. Based on the homogenized dataset, the warming trend in annual mean temperature in Tianjin averaged from the newly constructed daily maximum and minimum temperature is evaluated as 0.154 ± 0.013 ∘C per decade during the last 130 years. Trends of temperature extremes in Tianjin are all significant at the 5 % level and have much more coincident change than those from the raw data, with amplitudes of −1.454, 1.196, −0.140 and 0.975 d per decade for cold nights (TN10p), warm nights (TN90p), cold days (TX10p) and warm days (TX90p) at the annual scale. The adjusted daily maximum, minimum and mean surface air temperature dataset for Tianjin city presented here is publicly available at https://doi.org/10.1594/PANGAEA.924561 (Si and Li, 2020).
- Article
(6858 KB) - Full-text XML
-
Supplement
(493 KB) - BibTeX
- EndNote


Instrumental observation records at meteorological stations are the most widely used firsthand information about weather and climate change and variability. They have the advantages of better representativeness as well as accuracy compared to other data (Leeper et al., 2015; Dienst et al., 2017; Xu et al., 2018). The most representative long-term observational temperature datasets in the world since IPCC AR5 (2013) include the Global Historical Climatology Network-Monthly (GHCN-M) dataset (Lawrimore et al., 2011; Menne et al., 2018), Climatic Research Unit (CRU) datasets (Jones et al., 2012; Harris et al., 2020), the Goddard Institute for Space Studies GISTEMP dataset (Hansen et al., 2010; Lenssen et al., 2019) and Berkeley Earth (BE) surface temperature (Rohde et al., 2013; Rohde and Hausfather, 2020). Recently, in order to make up for the limited coverage and the potential regional variability in data quality of current global climate datasets, Xu et al. (2018) have developed a new dataset of monthly integrated and homogenized global land surface air temperature (C-LSAT). This has been updated to C-LSAT2.0, with the data extended to the period 1850–2019 (Li et al., 2020a, 2021). These datasets were all developed at the monthly scale based upon meteorological station records from different continents across the world through the integration of different data sources, quality control of climate outliers, time and space consistency, and the analysis of data homogenization. The Global Historical Climatology Network-Daily (GHCN-D) dataset has also been developed, to meet the needs of climate analysis and monitoring research, but about two-thirds of the stations contributing to this dataset report precipitation only. In addition, the GHCN-D dataset has not been homogenized for artifacts due to changes in reporting practices at different times at particular stations (i.e., systematic biases), although the entire dataset has been quality controlled (Menne et al., 2012).
Chinese scholars, since the 1980s, have also carried out many studies on the establishment of long-term observational time series in China, but they often mainly used tree rings, ice cores, historical materials and other proxy data as part of the restoration of time series before 1950 (Wang et al., 1998, 2000; Zheng et al., 2015; Yu et al., 2018). The results based on these data are of great significance as they reveal the characteristics of climate periodicity and multi-scale changes over the past 100 years, but they are insufficient to meet the needs of quantitative monitoring and detection of long-term extreme climate events. In particular, there are many limitations when homogenizing the time series before the 1950s (including the establishment of reference series) such as the lack of continuous observational data or detailed and reliable metadata information, leading to the increase in uncertainties for regional and/or local climate analysis (Li et al., 2020b). As a result there still exist many uncertainties in the characteristics of climate change from the 19th century to the mid-20th century (Li et al., 2010, 2017; Sun et al., 2017; Cao et al., 2017).
Since daily time series generally contain many more observations than monthly or annual series, daily analyses potentially have greater precision. As a result they are more useful in climate trend and variability studies, especially for extreme events (Vincent et al., 2012; Xu et al., 2013; Trewin, 2013; Hewaarachchi et al., 2017). However, due to difficulties in collecting and/or receiving daily data all over the world as well as non-climatic effects such as changes in observation times, there are numerous issues. For example, observations from temperature sites at principal stations in Canada were changed to be read at 00:00 to 06:00 universal time (Vincent et al., 2002), making it is very difficult to form a global daily data product at the century-long scale. This makes it extremely difficult to study global and/or regional extreme events over the past 100 years, especially before 1950. For some regional areas, daily instrumental observations may be extended to the 19th century, and hence they are more valuable. Png et al. (2020) have compiled 463 530 instrumental observations of daily temperature, precipitation and sunshine from 319 stations distributed over China during 1912–1951 mostly from the sources of monthly reports from the Nanjing Institute of Meteorology, observatories across Japanese-occupied Manchuria and the Japanese Army in North China. Since these are daily data, they are immensely useful for the analysis of mesoscale and sub-seasonal climate variations. Although the earliest instrumental observations in China began in the 1840s, observations at some sites were interrupted during the 1940s due to wars (e.g., the Second Sino–Japanese War, known in China as the War of Resistance against Japan, and the Chinese Communist Revolution, known in China as the War of Liberation), and hence many pieces of information have likely been lost. Studies of the rescuing, processing and constructing of complete and continuous daily site data over China are somewhat rare.
Due to the historic reasons of leased territory in China, some local single sites often have multiple observational sources before 1950. For example, for Qingdao, monthly surface air temperature series during 1899–2014 have been constructed based on newly digitized and homogenized observations from the German National Meteorological Service from 1899 to 1913 (Li et al., 2018). Tianjin Meteorological Station is one of the typical stations with more than 100 years of observed climate data in China (Yan et al., 2001; Si et al., 2017). This station also has multi-source observations before 1950 as observed at some other meteorological stations in China with century-long datasets. Thus, considering Tianjin Station as an example, this paper aims to construct a new daily instrumental maximum and minimum temperature series on the century scale in China, through integration, quality control, extension and homogenization of the multiple daily observations. The newly constructed daily temperatures in Tianjin provide relatively longer and more complete and reliable climate series for studies of climate and extreme climate change over the century-long scale.
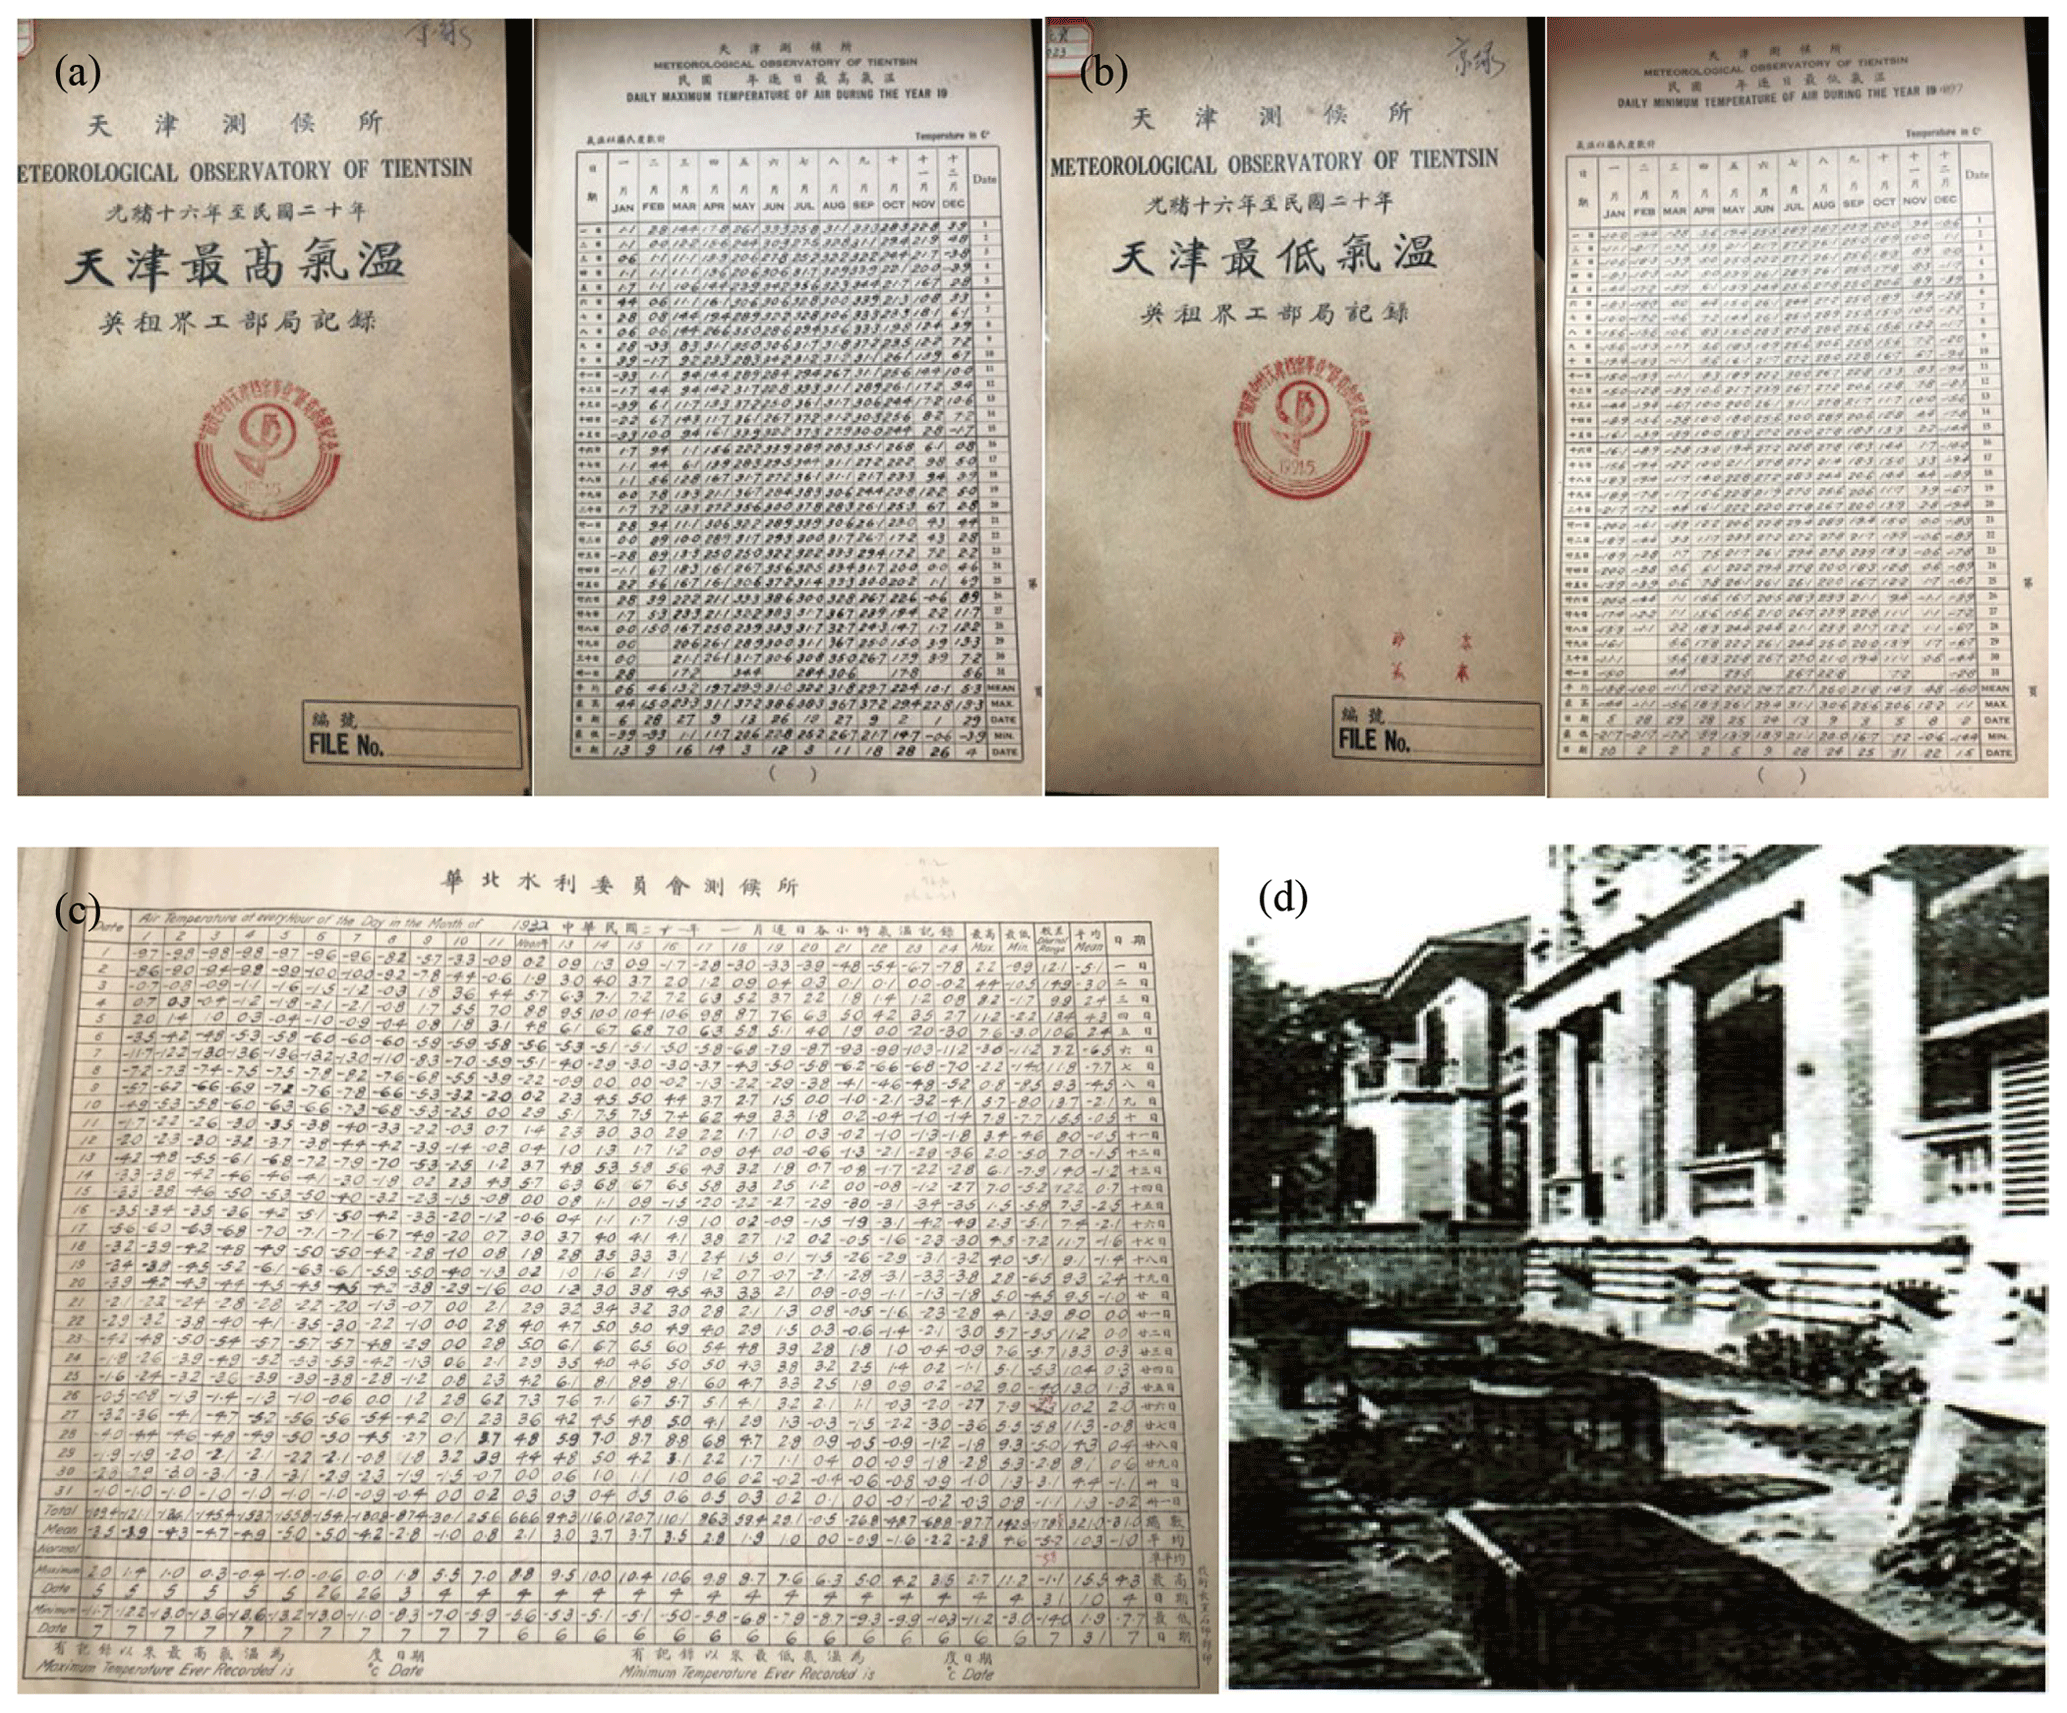
Figure 1The handwritten observation records of Tianjin before 1950: (a) and (b) for records of maximum and minimum temperatures from the Department of Industry Agency of the British Concession in Tianjin and (c) for records from the Water Conservancy Commission of North China. (d) Tianjin Observatory at 22 Ziyou Road. These photographs were provided by the Tianjin Meteorological Archive, Tianjin Meteorological Bureau.
The remainder of this paper is arranged as follows: Sect. 2 describes the station histories from Tianjin. The basic data and reference data sources and their pre-processing are introduced in Sect. 3. Section 4 introduces the procedures of constructing new daily maximum and minimum temperature series. Section 5 presents the average and extreme temperature trend change based on newly constructed series. The availability of the resulting dataset (Si and Li, 2020) is reported in Sect. 6, and a summary of results and some discussion are given in Sect. 7.
Wu (2007) showed that Tianjin Meteorological Observation Station was under the control of the Department of Industry Agency of the British Concession in Tianjin covering September 1887 to December 1941. During the period from September 1904 to December 1949, it was co-ordinated by many departments, such as Japan Central Meteorological Agency, the Central Meteorological Bureau of the Republic of China, the Aviation Department of the North China Military Region of the People's Liberation Army (PLA), the Shunzhi Water Conservancy Commission, the Water Conservancy Commission of North China and the Water Conservancy Engineering Bureau of North China. However, only the records of daily maximum and minimum temperatures from the Department of Industry Agency of the British Concession in Tianjin (Fig. 1a, b) and the Water Conservancy Commission of North China (Fig. 1c) have been collected by the Tianjin Meteorological Archive. Each set of records is continuous and complete, and most importantly they can be connected to each other on 1 January 1932 without overlapping, thereby forming a complete and continuous time series before 1950.
Table 1The history logs at Tianjin Meteorological Observation Station during 1 September 1890–31 December 2019.
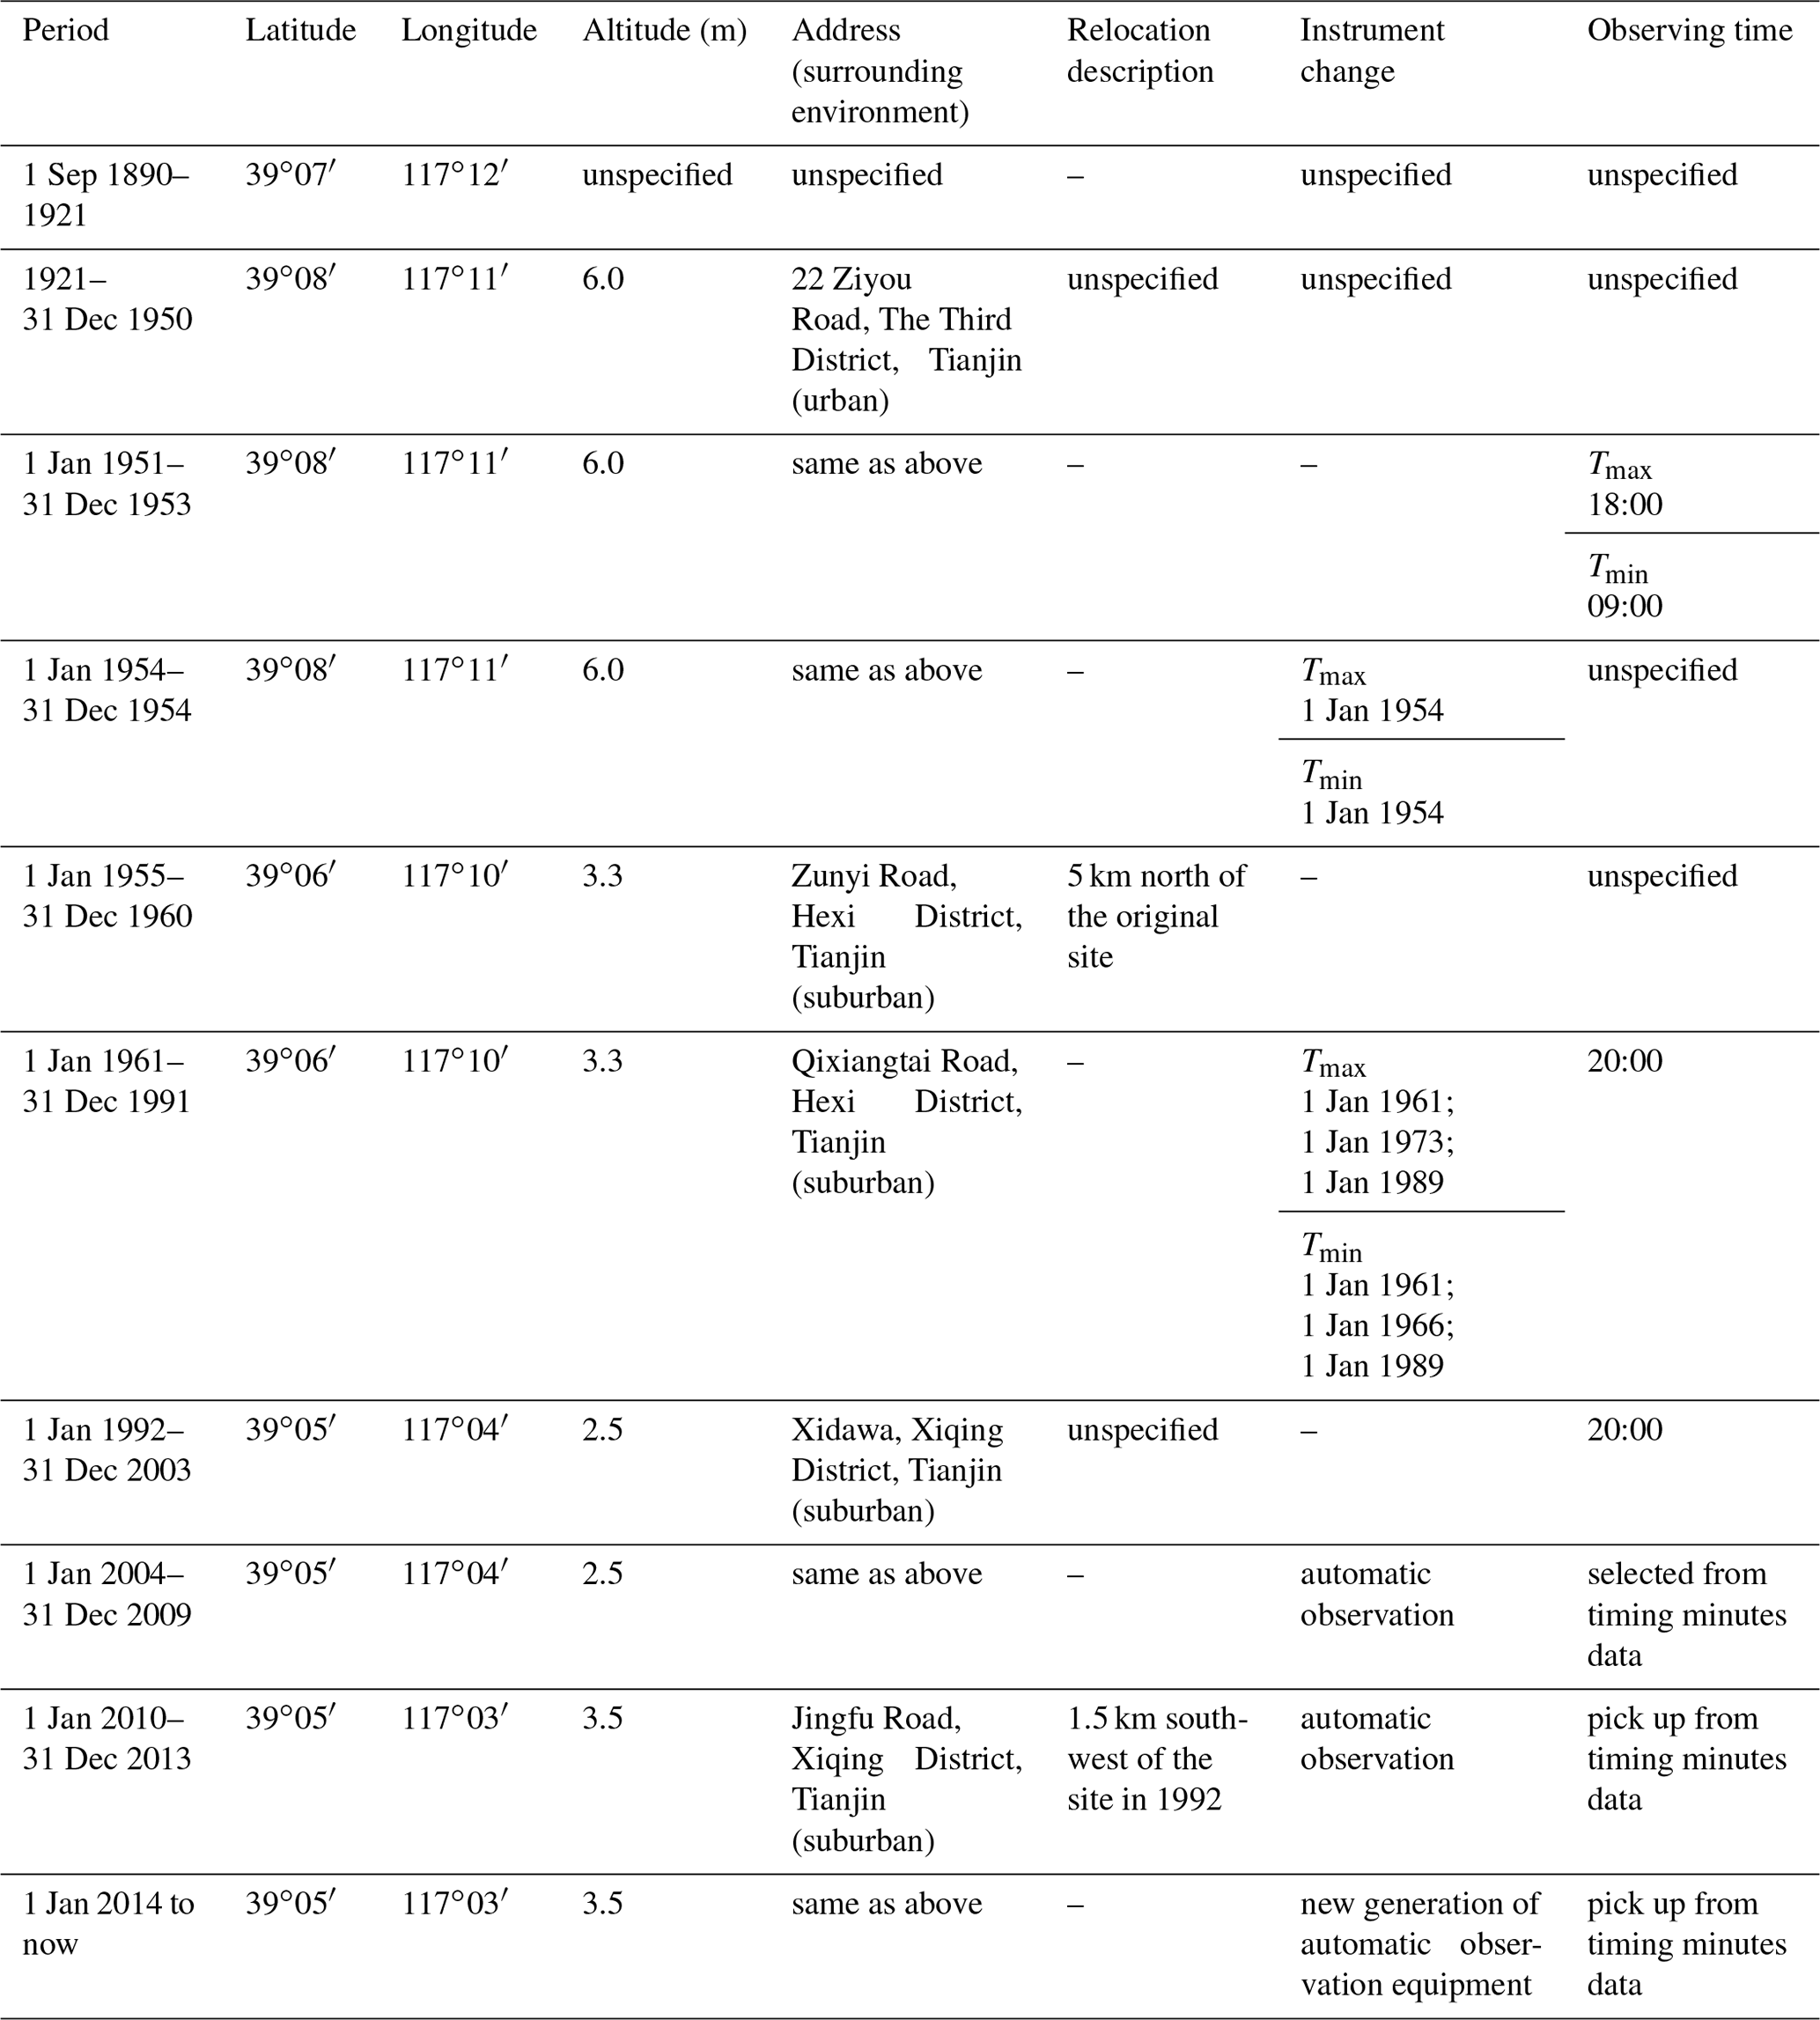
The straight line (–) indicates no change. The observing time in Beijing time (BJT). Tmax and Tmin indicate the maximum and minimum temperature, respectively.
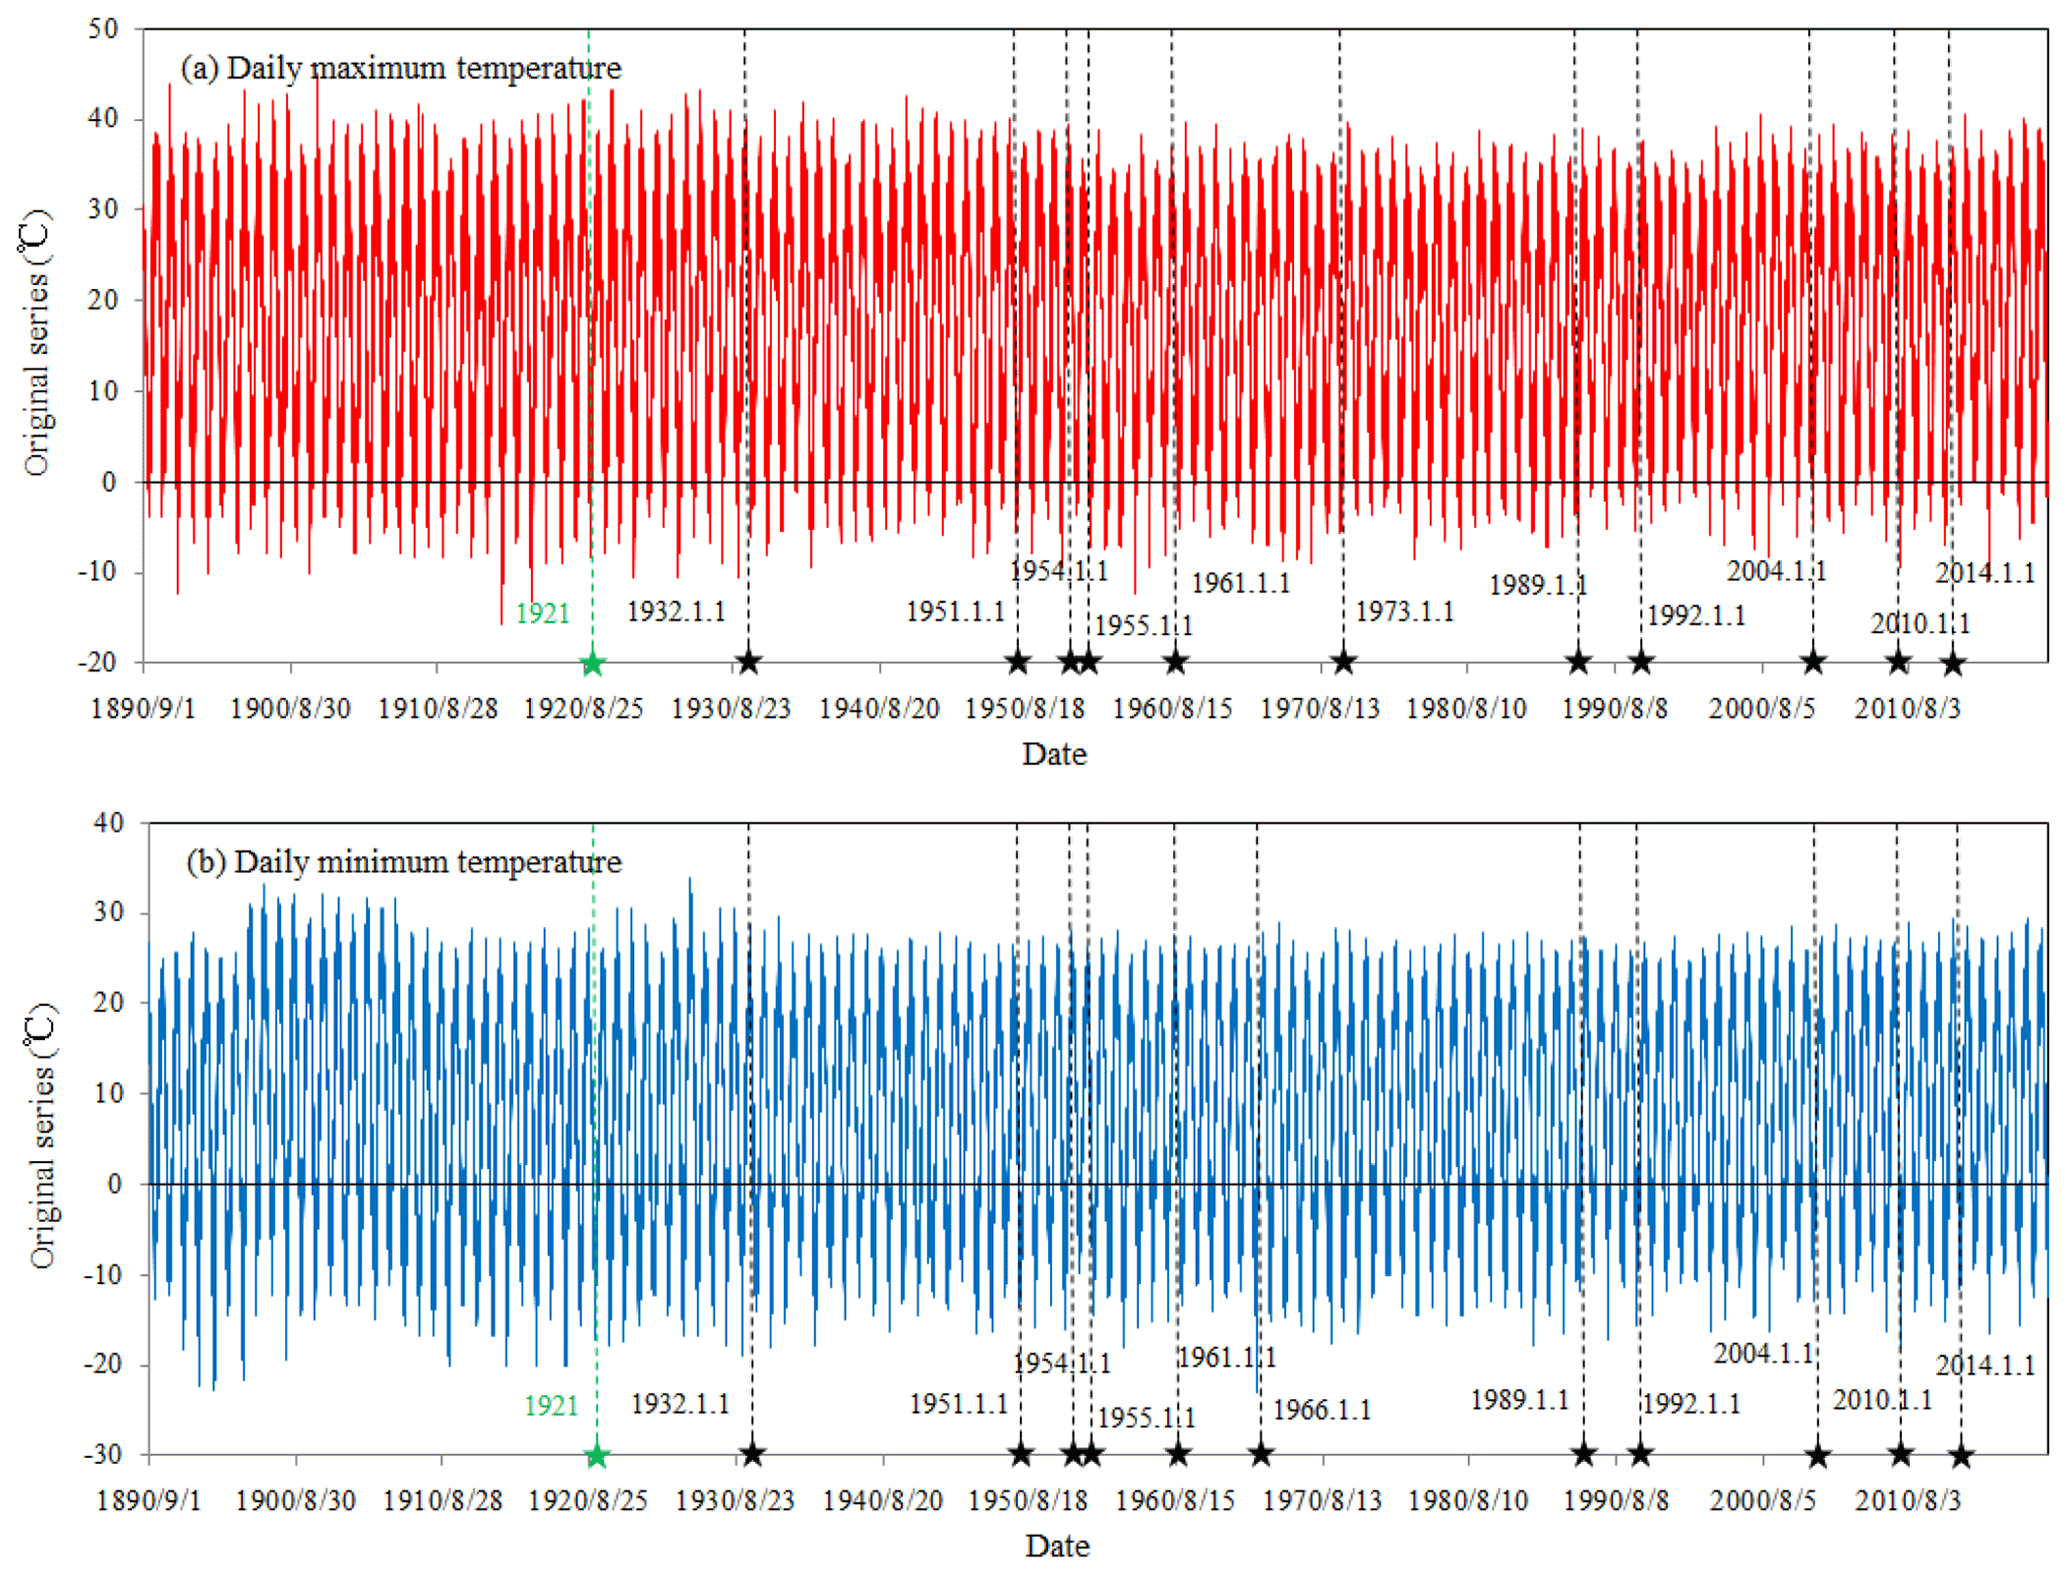
Figure 2Original series of daily maximum temperature (a) and minimum temperature (b) at Tianjin Meteorological Observation Station covering 1 September 1890–31 December 2019. Black stars with vertical dashed lines on the axes mark metadata times (the relocation point in 1921 is marked by green star with vertical dashed line due to no specific date).
The daily temperature records at Tianjin Meteorological Observation Station that we have accessed begin on 1 September 1890 and were collected by the Tianjin Meteorological Archive (Fig. 1a–c). The metadata history logs of Tianjin Observation Station during 1 September 1890–31 December 2019 are listed in Table 1. The history is sorted according to the Specifications for Surface Meteorological Observation in China (versions of 1950, 1954, 1964, 1979 and 2003), metadata of Chinese surface meteorological stations and journal sheets of Tianjin surface meteorological records. Changes to observational times have been marked on the original time series of maximum and minimum temperatures for the city of Tianjin (see Fig. 2). As shown in Table 1, Tianjin Meteorological Observation Station has relocated four times since 1890 – several times in 1921 (Fig. 1d) and on 1 January 1955, 1 January 1992 and 1 January 2010 – without prominent changes in elevations. The environment surroundings of Tianjin Station changed from urban to suburban in 1955, accompanied by a number of instrument changes. In this period, changes to the instrument manufacturer happened four times for both maximum and minimum temperature series, as well as changes in automatic observation instead of manual observation in 2004 and a new-generation replacement of the previous automatic instrument in 2014. In documented metadata (Table 1), there have been changes in observing time four times for both maximum and minimum temperatures since 1951, but they were always recorded over a 24 h observational window in Beijing time (BJT) or similar to BJT (as for the period of 1 January 1954–31 December 1960). Moreover, it is important to mention here that since 1951 there have been two stations, viz. Tianjin and Xiqing, colocated in the Tianjin area. Due to rapid urbanization in the surrounding environmental Tianjin area, the old Tianjin site gradually became less representative as a climate observation station, and therefore since 1 January 1992, observations at Xiqing Station have been used to replace the old Tianjin Station. It can be considered that Tianjin Station was relocated to Xiqing Station on that date.
3.1 Original data and preliminary quality control
Based on the analyses of metadata history at Tianjin Station discussed in Sect. 2, this paper selects three observational temperature data sources collected by the Tianjin Meteorological Archive for the basic data to construct the daily maximum and minimum temperature time series at Tianjin Station from 1890 (Fig. 2). These are the daily observation records from (1) the Department of Industry Agency of the British Concession in Tianjin covering 1 September 1890–31 December 1931, (2) the Water Conservancy Commission of North China during 1 January 1932–31 December 1950 and (3) monthly journal sheets of Tianjin surface meteorological observation records covering 1 January 1951–31 December 2019. Since there are no missing data or overlap for each of the three daily sources, the three daily data resources are directly spliced into a complete time series. However, in view of the regime changes of operation and different station numbers between Tianjin Station and Xiqing Station that happened on 1 January 1992 (Table 1), the daily records from 1 January 1951 to 31 December 1991 observed in the Hexi area and those observed in the Xiqing area from 1 January 1992 to 31 December 2019 are used to form the basic daily time series from 1 January 1951 to 31 December 2019 for the long series.
A preliminary quality control procedure consisting of multiple steps was carried out on the original integrated daily time series of maximum and minimum temperature from 1 September 1890 to 31 December 2019 at Tianjin to remove any errors caused by manual observations, instrument malfunctions and digital inputs. Firstly, the range of the daily maximum or minimum temperature was scrutinized for magnitude beyond the limit of 60 and −80 ∘C, which would be classified as errors. Fortunately, both the series have no such errors. Secondly based on anomalies from the 1961–1990 as reference period, climatic outliers of maximum and minimum temperature are assessed considering a magnitude exceeding 5 standard deviations of their monthly anomalies as outliers during 1890–2019. There is no outlier found in our validation. Finally, internal consistency was investigated by checking if there are any minimum-temperature data greater than or equal to the maximum on the same date, and no such inconsistencies were found. It is important to mention that there is a sudden rise in the annual minimum temperature series during the year 1927 even after these three checks. The offsets of the discontinuities in 1927 compared with averages for the two sections before and after it are 4.2 and 3.4 ∘C, respectively. We repeated the steps of outlier checks once by reviewing the earlier condition with 3 times the standard deviation of monthly anomalies. Results indicate that most of the daily minimum data for April to October 1927 exceed the current conditions and the data during this period, so they were set to missing values. Even though the quality of original daily maximum and minimum temperatures during 1890–2019 at Tianjin Station is good, these checks provide a good foundation for the subsequent construction of a reliable homogenized daily series.

Figure 3The annual and seasonal average anomalies of maximum (a–e) and minimum (f–j) temperatures based on the interpolated series of BE and CRU TS4.03 and the station series of GHCN v3 for Tianjin Station.
3.2 Reference data
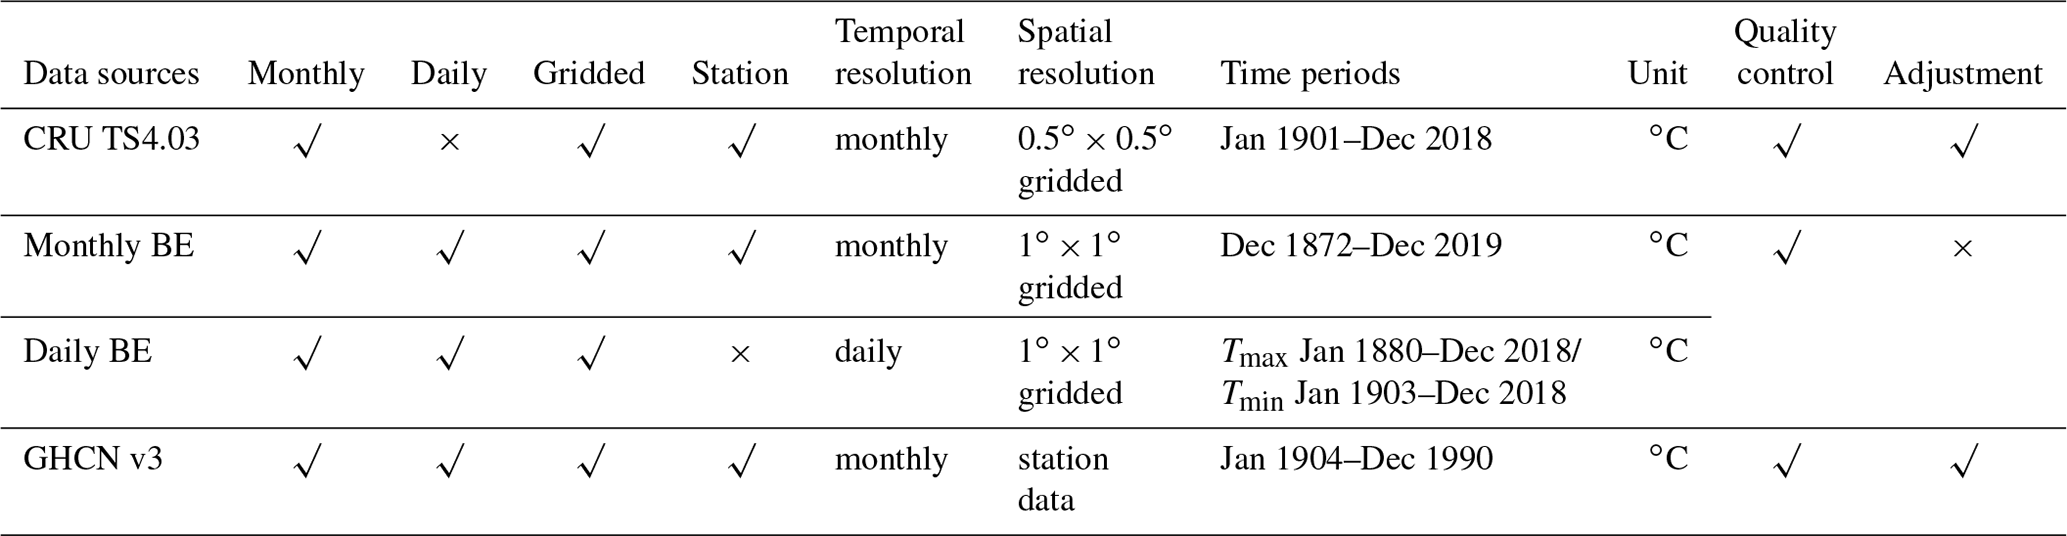
Wu (2007) documented that although the earliest surface observation records at Tianjin Station start with the year 1887, the observed daily maximum and minimum temperatures collected by the Tianjin Meteorological Archive began in September 1890 (Fig. 2). Therefore, some additional reference data sources are selected to extend the daily temperature series from January 1887 to August 1890 and lengthen the established daily temperature data to as early as possible. In addition, it is extremely important to establish an objective as well as a reasonable reference series for data homogenization. But due to non-availability of observation records and station metadata before 1950, especially for daily data, it is impossible to find a complete and reliable observed temperature series as a reliable reference series for Tianjin. Based on a few recently reported studies (Li et al., 2020a; Lenssen et al., 2019; Xu et al., 2018; Menne et al., 2018), we employ the station series or the interpolated temperature series using neighboring grid boxes from three global land surface temperature observation series (Table 2) as reference data sources for extension and establishment of reference data series used in data homogenization at Tianjin Station. Plots of Tianjin Station from all three series are shown in Fig. 3. The three global land surface temperature (LSAT) datasets are (1) Berkeley Earth (BE) land temperature (Rohde and Hausfather, 2020; http://berkeleyearth.org/data/, last access: May 2020), (2) Climatic Research Unit Time-Series version 4.03 (CRU TS4.03; Harris et al., 2020; http://data.ceda.ac.uk/badc/cru/data/cru_ts/cru_ts_4.03/data/, last access: May 2020) and (3) Global Historical Climatology Network version 3 (GHCN v3; Lawrimore et al., 2011; https://www.ncdc.noaa.gov/ghcnd-data-access, last access: May 2020).
The selected three LSAT datasets are not independent as they likely use common input observations. The multiple datasets provide a variety of useful checks because they employ different ways of handling data problems such as incomplete spatial and temporal coverage and non-climatic influences on meteorological measurement (Hansen et al., 2010). As shown in Table 2, the three LSAT datasets involve quality control and homogenization but use different methods. The records of BE were usually split into portions occurring before and after known and presumed discontinuities (e.g., from station relocation or instrument changes) without adjustment. For CRU TS4.03, most of these data have been adjusted, because the ultimate sources of most station records are from national meteorological services (NMSs), that is, China Meteorological Administration (CMA) for Tianjin. GHCN v3 station data used in this paper are the quality-controlled and adjusted (QCA) data, which were produced by the developers of GHCN-Monthly. Two types of grid data, CRU TS4.03 and BE, are both interpolated to the site level using the bilinear method.
From Table 2, only daily BE maximum and minimum temperatures are available. So the daily BE maximum-temperature data corresponding to the site level Tianjin Station are selected as the extension data for the period of 1 January 1887–31 August 1890 (the specific information about extending the processing for this period is in Sects. S1–S3 in the Supplement), and the daily minimum series still begins with the date on 1 September 1890 due to scarcity of reference data sources.
On the basis of the quality-controlled and the extended series, the daily homogenized maximum and minimum observation temperature series in Tianjin were constructed by means of the flowchart illustrated in the dashed-box part of Fig. 4. Homogenization is an important step to eliminate the discontinuities in observation records induced by non-climatic influences such as station relocation, instrument change and observing time change. Most importantly, the true characteristics of climate change are preserved in this process (Quayle et al., 1991; Della-Marta and Wanner, 2006; Haimberger et al., 2012; Rahimzadeh and Zavareh, 2014; Hewaarachchi et al., 2017).
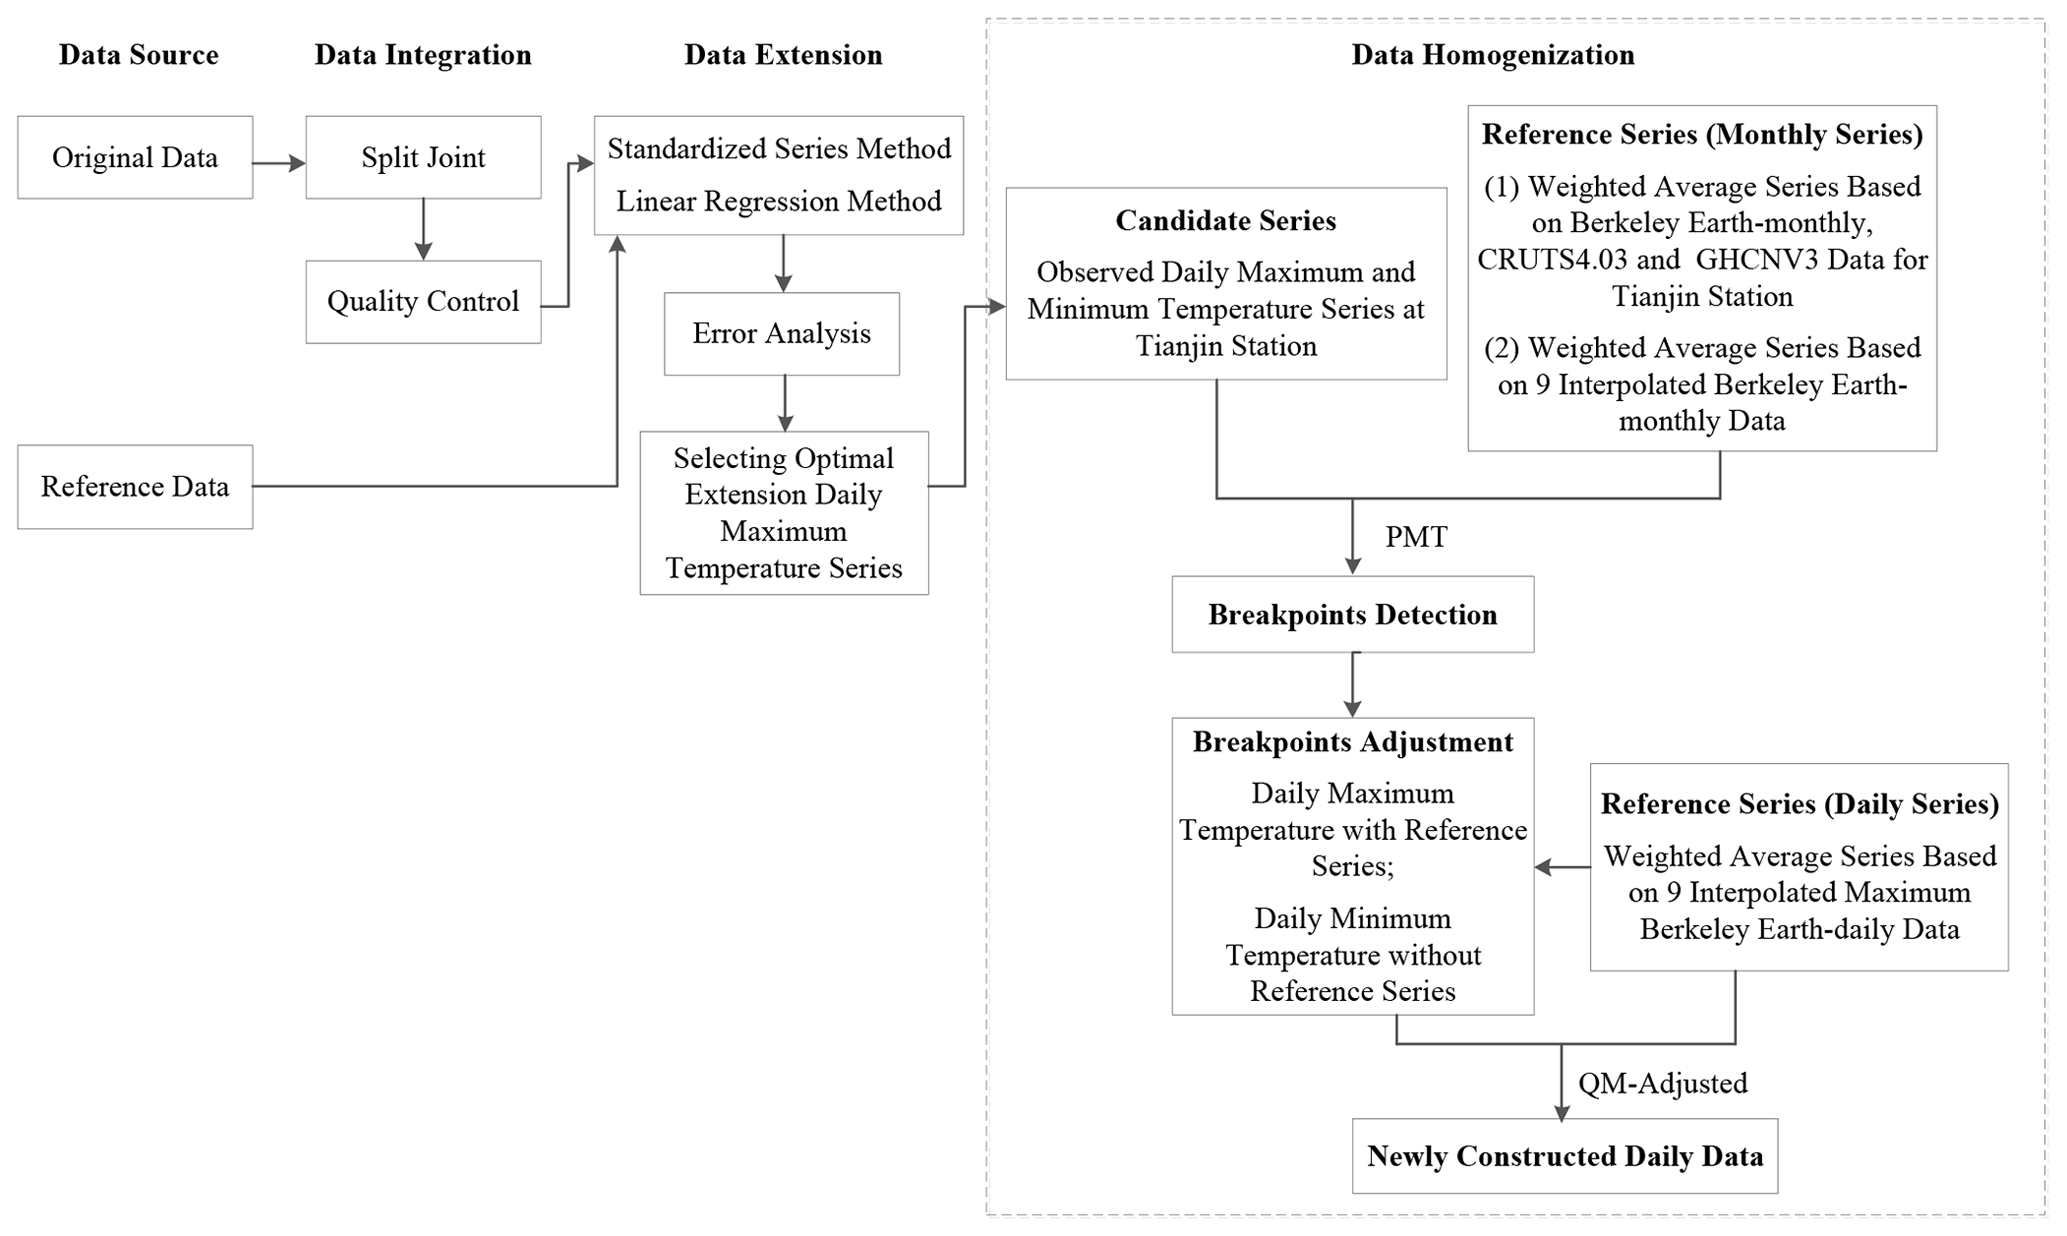
Figure 4The flowchart of construction for century-long daily maximum and minimum temperature series in Tianjin.
4.1 Establishment of the reference series
In the process of homogenization, reasonable reference series play an important role in the reliability of the detected breakpoints. So in this section, we will establish monthly and daily reference series for the maximum or minimum temperature series at Tianjin Station and use them for breakpoint detection and adjustment, respectively. Both reference series are established using a weighted average method. For monthly reference series, we will establish two types in order to make the detected breakpoints more reasonable and reliable. First, reference data are based on the combination of the interpolated temperature series from monthly BE and CRU TS4.03 and station series from GHCN v3 data for the Tianjin site (the three global LSAT datasets), and secondly they are based on the interpolated temperature series from monthly BE data only. From the three LSAT datasets, the weight coefficients are the square of the correlation coefficients between each LSAT and Tianjin's observed data. The daily reference series we use is based on the interpolated temperature series from daily BE data only.
In the case of the interpolated temperature series from monthly or daily BE data only, the site level data are derived from the station network across the Beijing–Tianjin–Hebei area in China (Fig. 5). These stations are selected as follows: firstly, the potential stations at horizontal distances less than 300 km from Tianjin Station and with altitude differences within 200 m are chosen; secondly, we select the 10 stations that are closest to Tianjin Station using a spherical distance; finally, nine stations are confirmed which are consistent between step 1 and step 2. In Fig. 5 (the right), these nine stations are identified by solid green circles with black or red stars; some metadata are also provided in Table 3. Thus, the interpolated temperature series from BE reference series are generated using the weighted average of the nine stations. These weights are calculated as the square of correlation coefficients between the interpolated temperature series from monthly or daily BE data for each of the nine stations and Tianjin's observed data. Recall also that the missing values in the original daily minimum temperature at Tianjin for April to October 1927 (checked in Sect. 3.1) were replaced by the corresponding data from the nine weighted interpolated temperature series from daily BE data.
Table 3Metadata information of the nine stations used to build reference series.
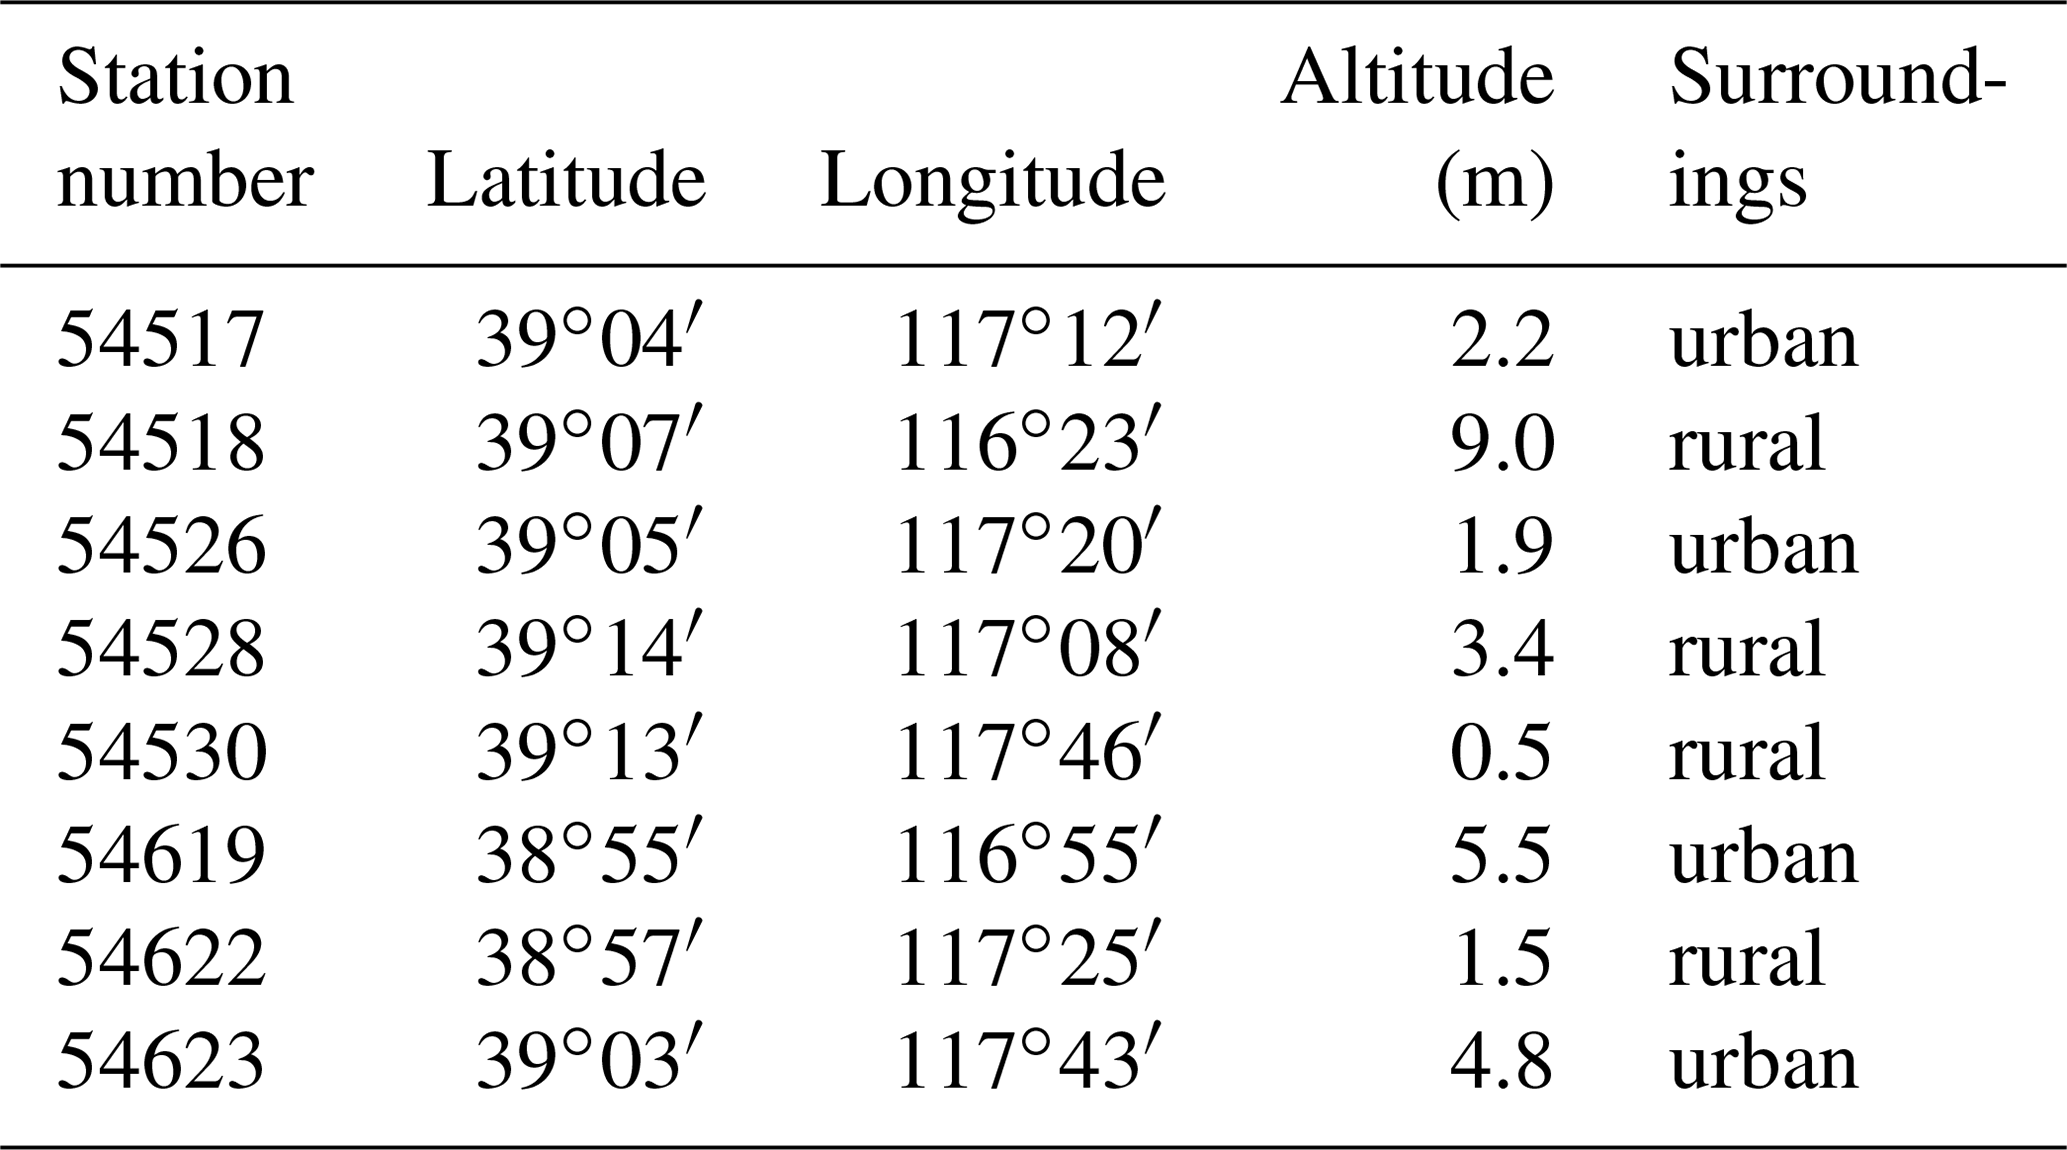
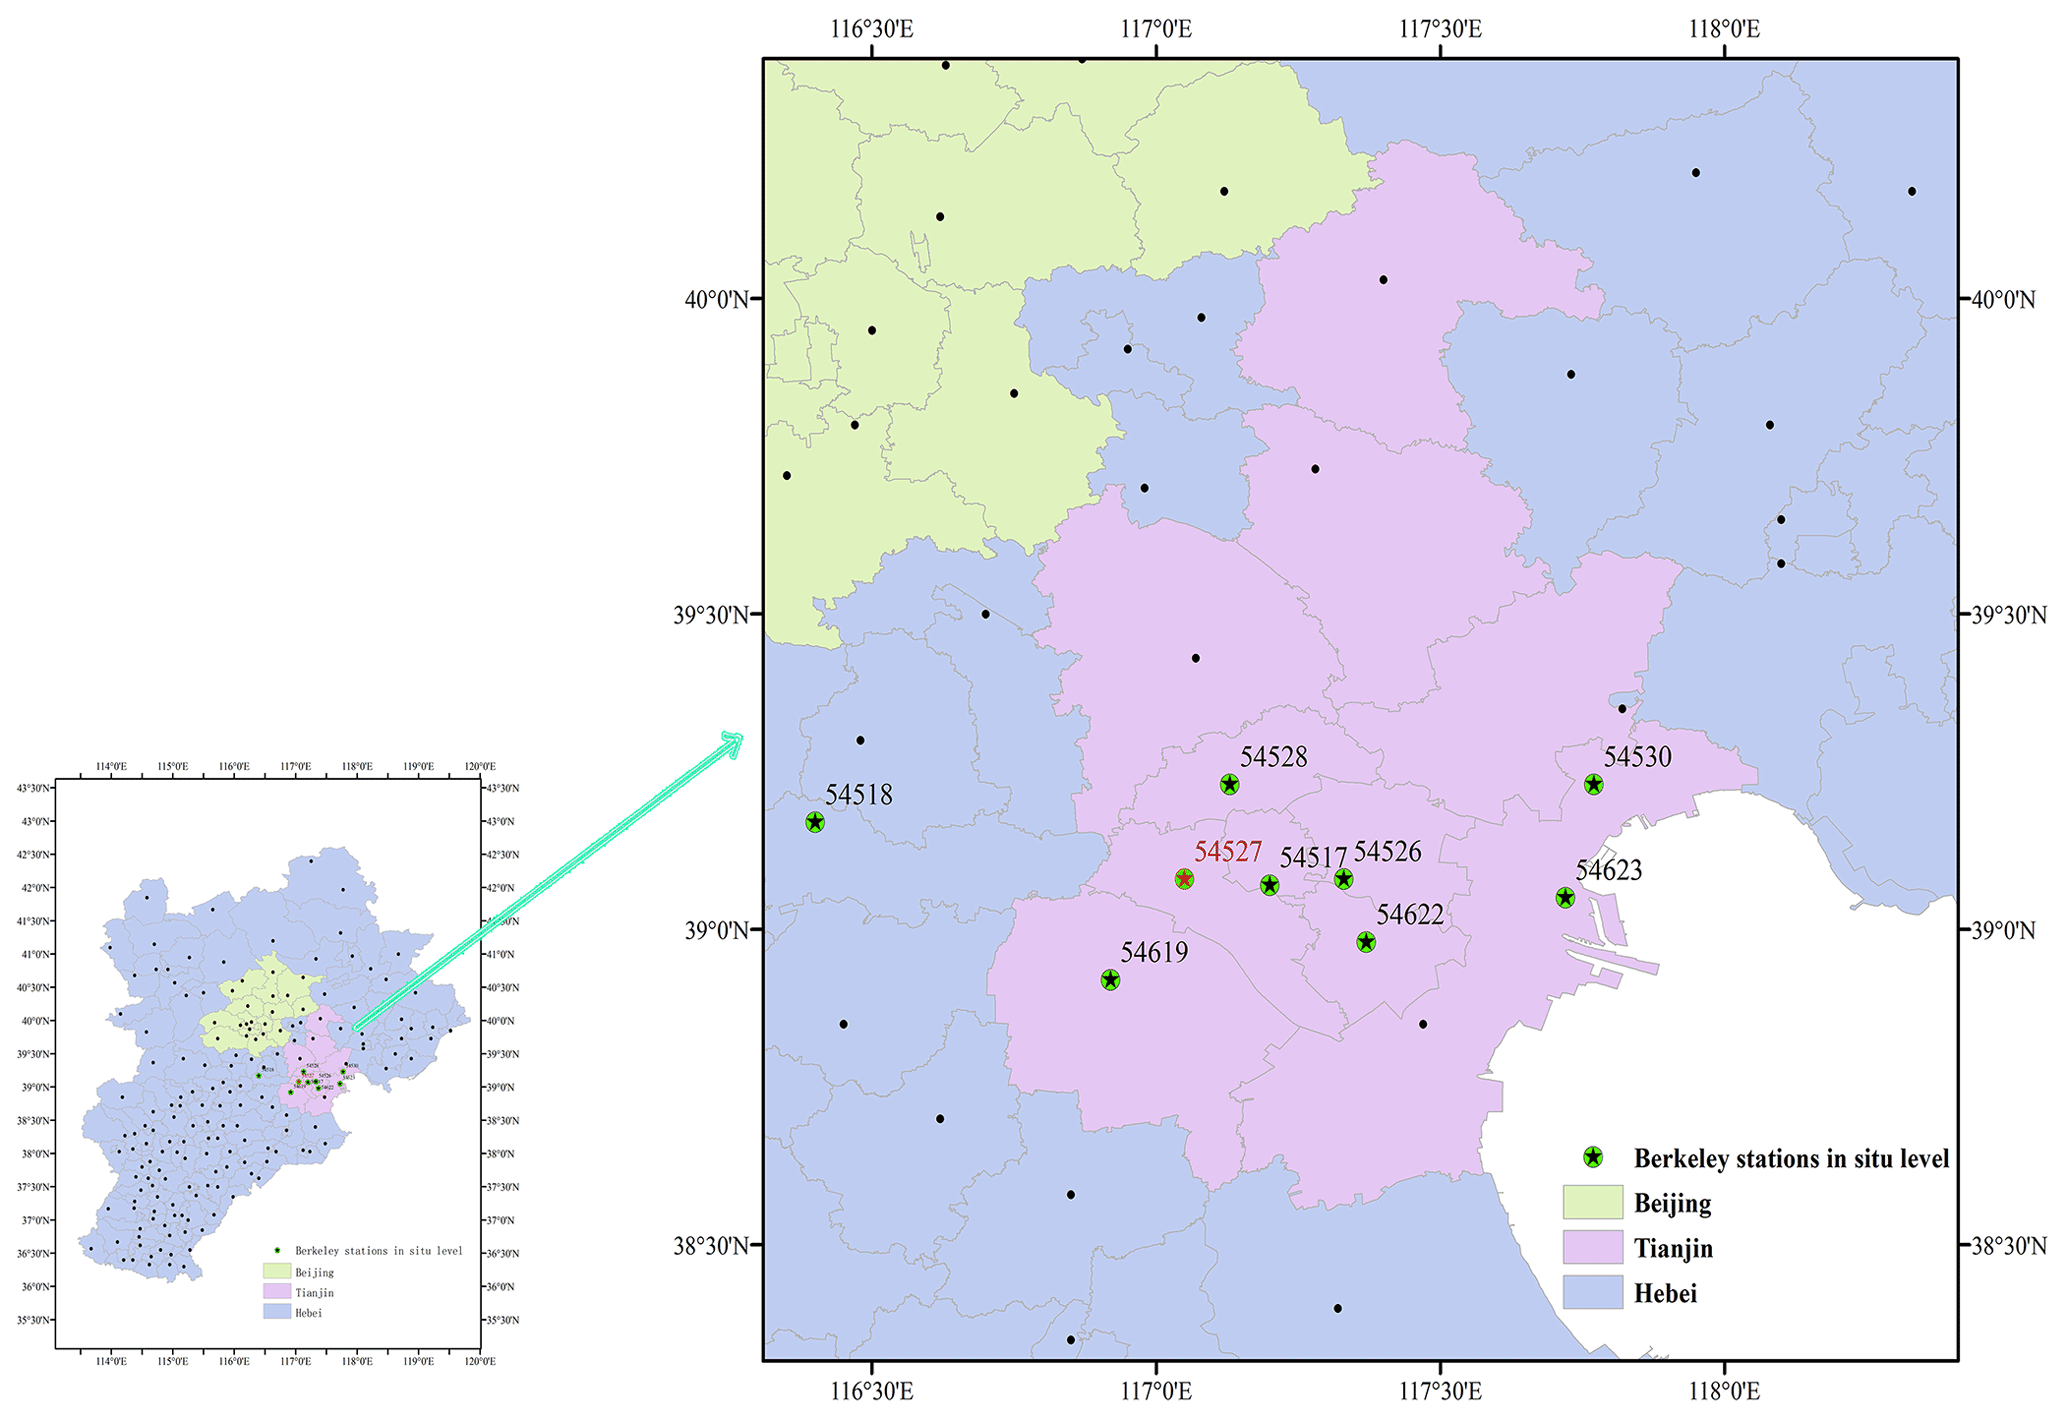
Figure 5Geographical distribution of the surface weather stations (solid black circles) in the Beijing–Tianjin–Hebei area in China and the nine selected stations (solid green circles with black or red stars).
4.2 Breakpoint detection and adjustment
The RHtestsV4 software package is used to homogenize the daily maximum- and minimum-temperature data at Tianjin Station. The software consists of the penalized maximal T test (PMT) (Wang et al., 2007) and quantile matching (QM) adjustment (Wang et al., 2010; Bai et al., 2020; Lv et al., 2020), both of which are used to detect and adjust the known or presumed discontinuities. As observed in earlier reported studies (Vincent, 2012; Trewin, 2013; Xu et al., 2013), homogenization at the daily timescale is much more challenging than that at monthly or annual scales. Thus, firstly we test Tianjin's monthly observed maximum and minimum temperature series averaged from the daily ones to find the significant breakpoints by means of the PMT at the 5 % significance level using two types of monthly reference series. We then adjust the daily series at Tianjin Station by QM adjustment with or without the daily reference series.
The breakpoints in the segment before 1921 are mainly determined by objective judgment from the same shifts at the 2-monthly timescale simultaneously due to the scarcity of station metadata. Those after 1921 are additionally assessed together with the station metadata and PMT detection at the 5 % significance level. We made a list according to Table 1 containing some possibilities that could cause shifts in Tianjin's daily maximum and minimum temperature series (Fig. 2, vertical dashed lines). The dates of 1 January 1932 and 1 January 1951 are connection points for different data sources; 1921, 1 January 1955, 1 January 1992 and 1 January 2010 indicate station relocations, and the other dates are the times of instrument and/or observing time change. However, due to statistical non-significance, those potential discontinuities are not considered the final discontinuities (Fig. 6). So potential dates do not always cause artificial discontinuities at the joining of the three observation segments for daily maximum or minimum temperature series. All the instrument changes that happened for maximum and minimum series have also not introduced any significant shifts. In this regard, they do not look like the changes that happened with other networks around the world, such as the US Cooperative Observer Program (COOP) network (Leeper et al., 2015). Moreover, different observing times (including the automated observation system) also do not introduce any significant biases to the temperature time series, since the daily maximum and minimum temperatures are always recorded over a 24 h observational window. Additionally, various versions of Specifications for Surface Meteorological Observation in China (e.g., versions of 1950, 1954, 1964, 1979 and 2003) imply that the observation principles of the highest and lowest thermometers are consistent, although there were a number of alterations in observing times.

Figure 6QM-adjusted and raw series (after quality control and extension) of daily maximum temperature (a) and minimum temperature (b) at Tianjin Meteorological Observation Station covering 1 January 1887 (1 September 1890 for minimum) to 31 December 2019 (Rohde and Hausfather, 2020). Vertical solid lines demarcate the discontinuities on 1 March 1897, 1 June 1907, 1 January 1955 and 1 January 1992.
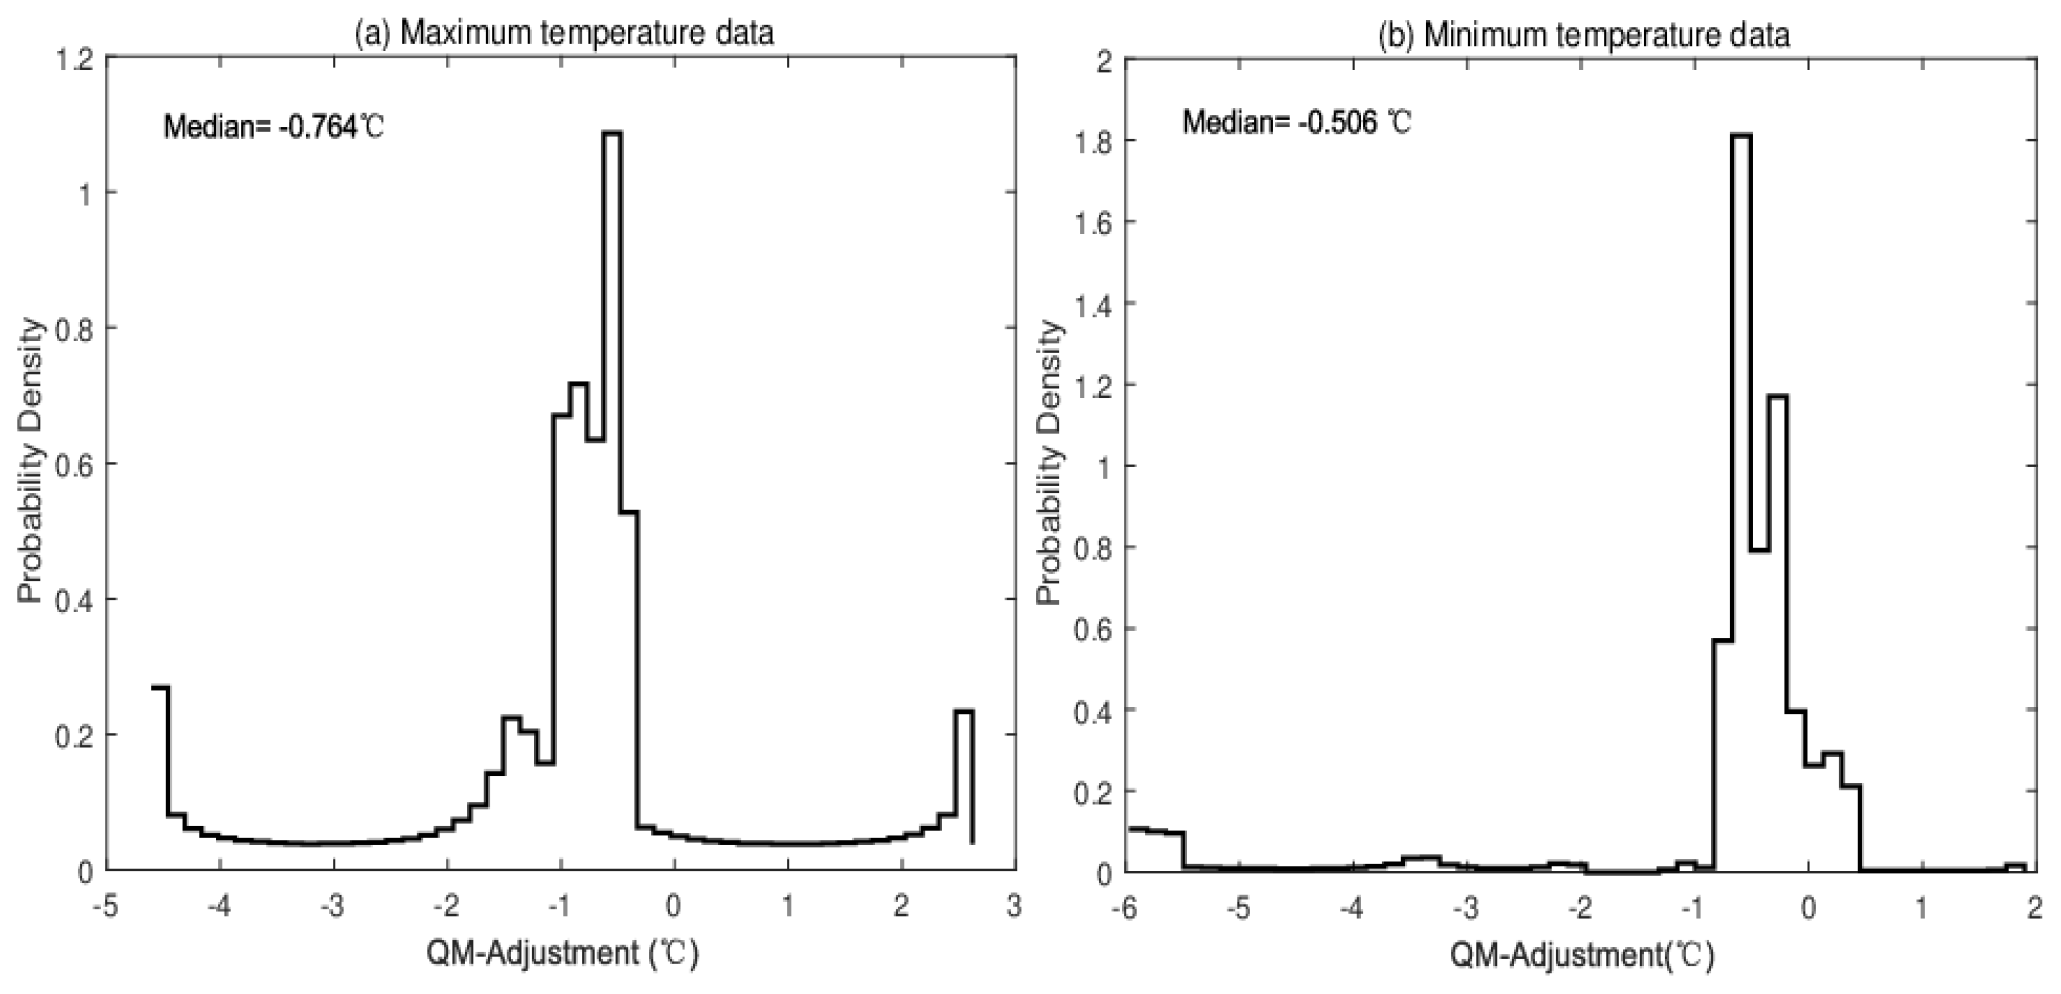
Figure 7The amplitudes of QM adjustment applied to daily maximum (a) and minimum (b) temperature data at Tianjin Meteorological Observation Station.
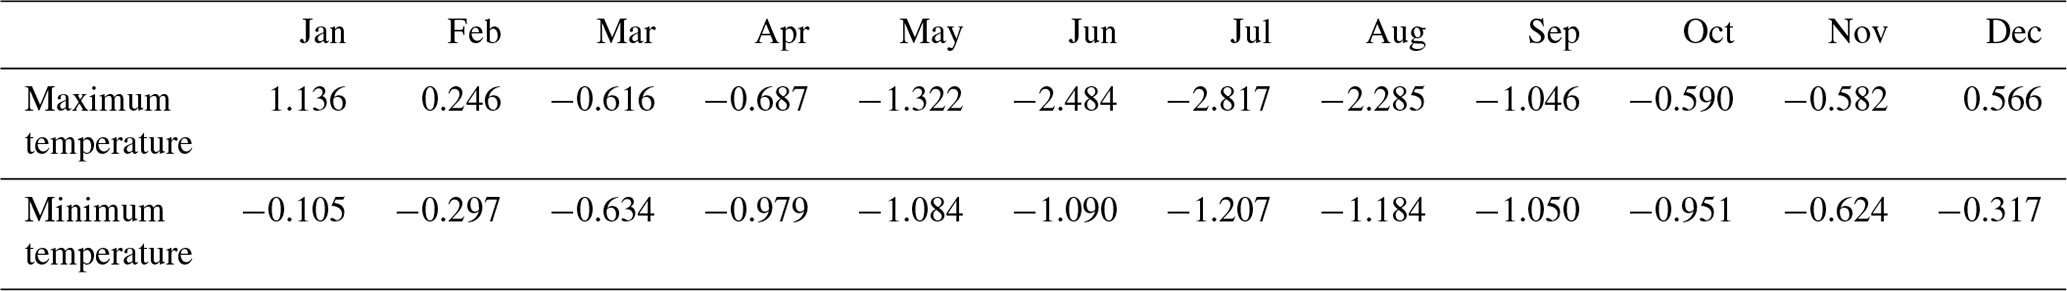
Table 4The average QM adjustments at the monthly timescale applied to daily maximum- and minimum-temperature data at Tianjin Meteorological Observation Station (unit – ∘C).
Breakpoints on 1 March 1897 and 1 June 1907 are without metadata support, but those on 1 January 1955 and 1 January 1992 are confirmed by metadata of station relocations. On 1 January 1955 Tianjin Meteorological Station was relocated from 22 Ziyou Road to Zunyi Road, which is only 5 km north of the original site and is more open and clear, and on 1 January 1992 it was relocated from Qixiangtai Road, Hexi District, to Xidawa, Xiqing District (Table 1). The significant breakpoints are given in Fig. 6 as vertical solid lines.
The amplitudes of QM adjustment applied to each individual daily maximum- and minimum-temperature data are [−4.606, 2.621 ∘C] (Fig. 7a) and [−5.972, 1.897 ∘C] (Fig. 7b). The medians of QM adjustment are −0.764 and −0.506 ∘C, respectively. As shown in Fig. 7, about 75 % of adjustments cover −2.5 to 0.8 ∘C in daily maximum series. For the minimum ones, about 85 % of adjustments cover −0.8 to 0.5 ∘C. Table 4 provides the average amplitudes of QM adjustment at the monthly timescale. It shows that for the maximum data, the larger positive adjustments are mainly applied to series in January and December, while the larger negative adjustments are mainly in June, July and August. For the minimum data, all the average amplitudes of QM adjustment at the monthly timescale are negative, which is the same characteristic as those of the maximum ones; temperature series in the warm months (i.e., June, July and August) are adjusted with larger negative amplitudes, but smaller negative amplitudes are used for the series in the colder months (i.e., January, February and December).
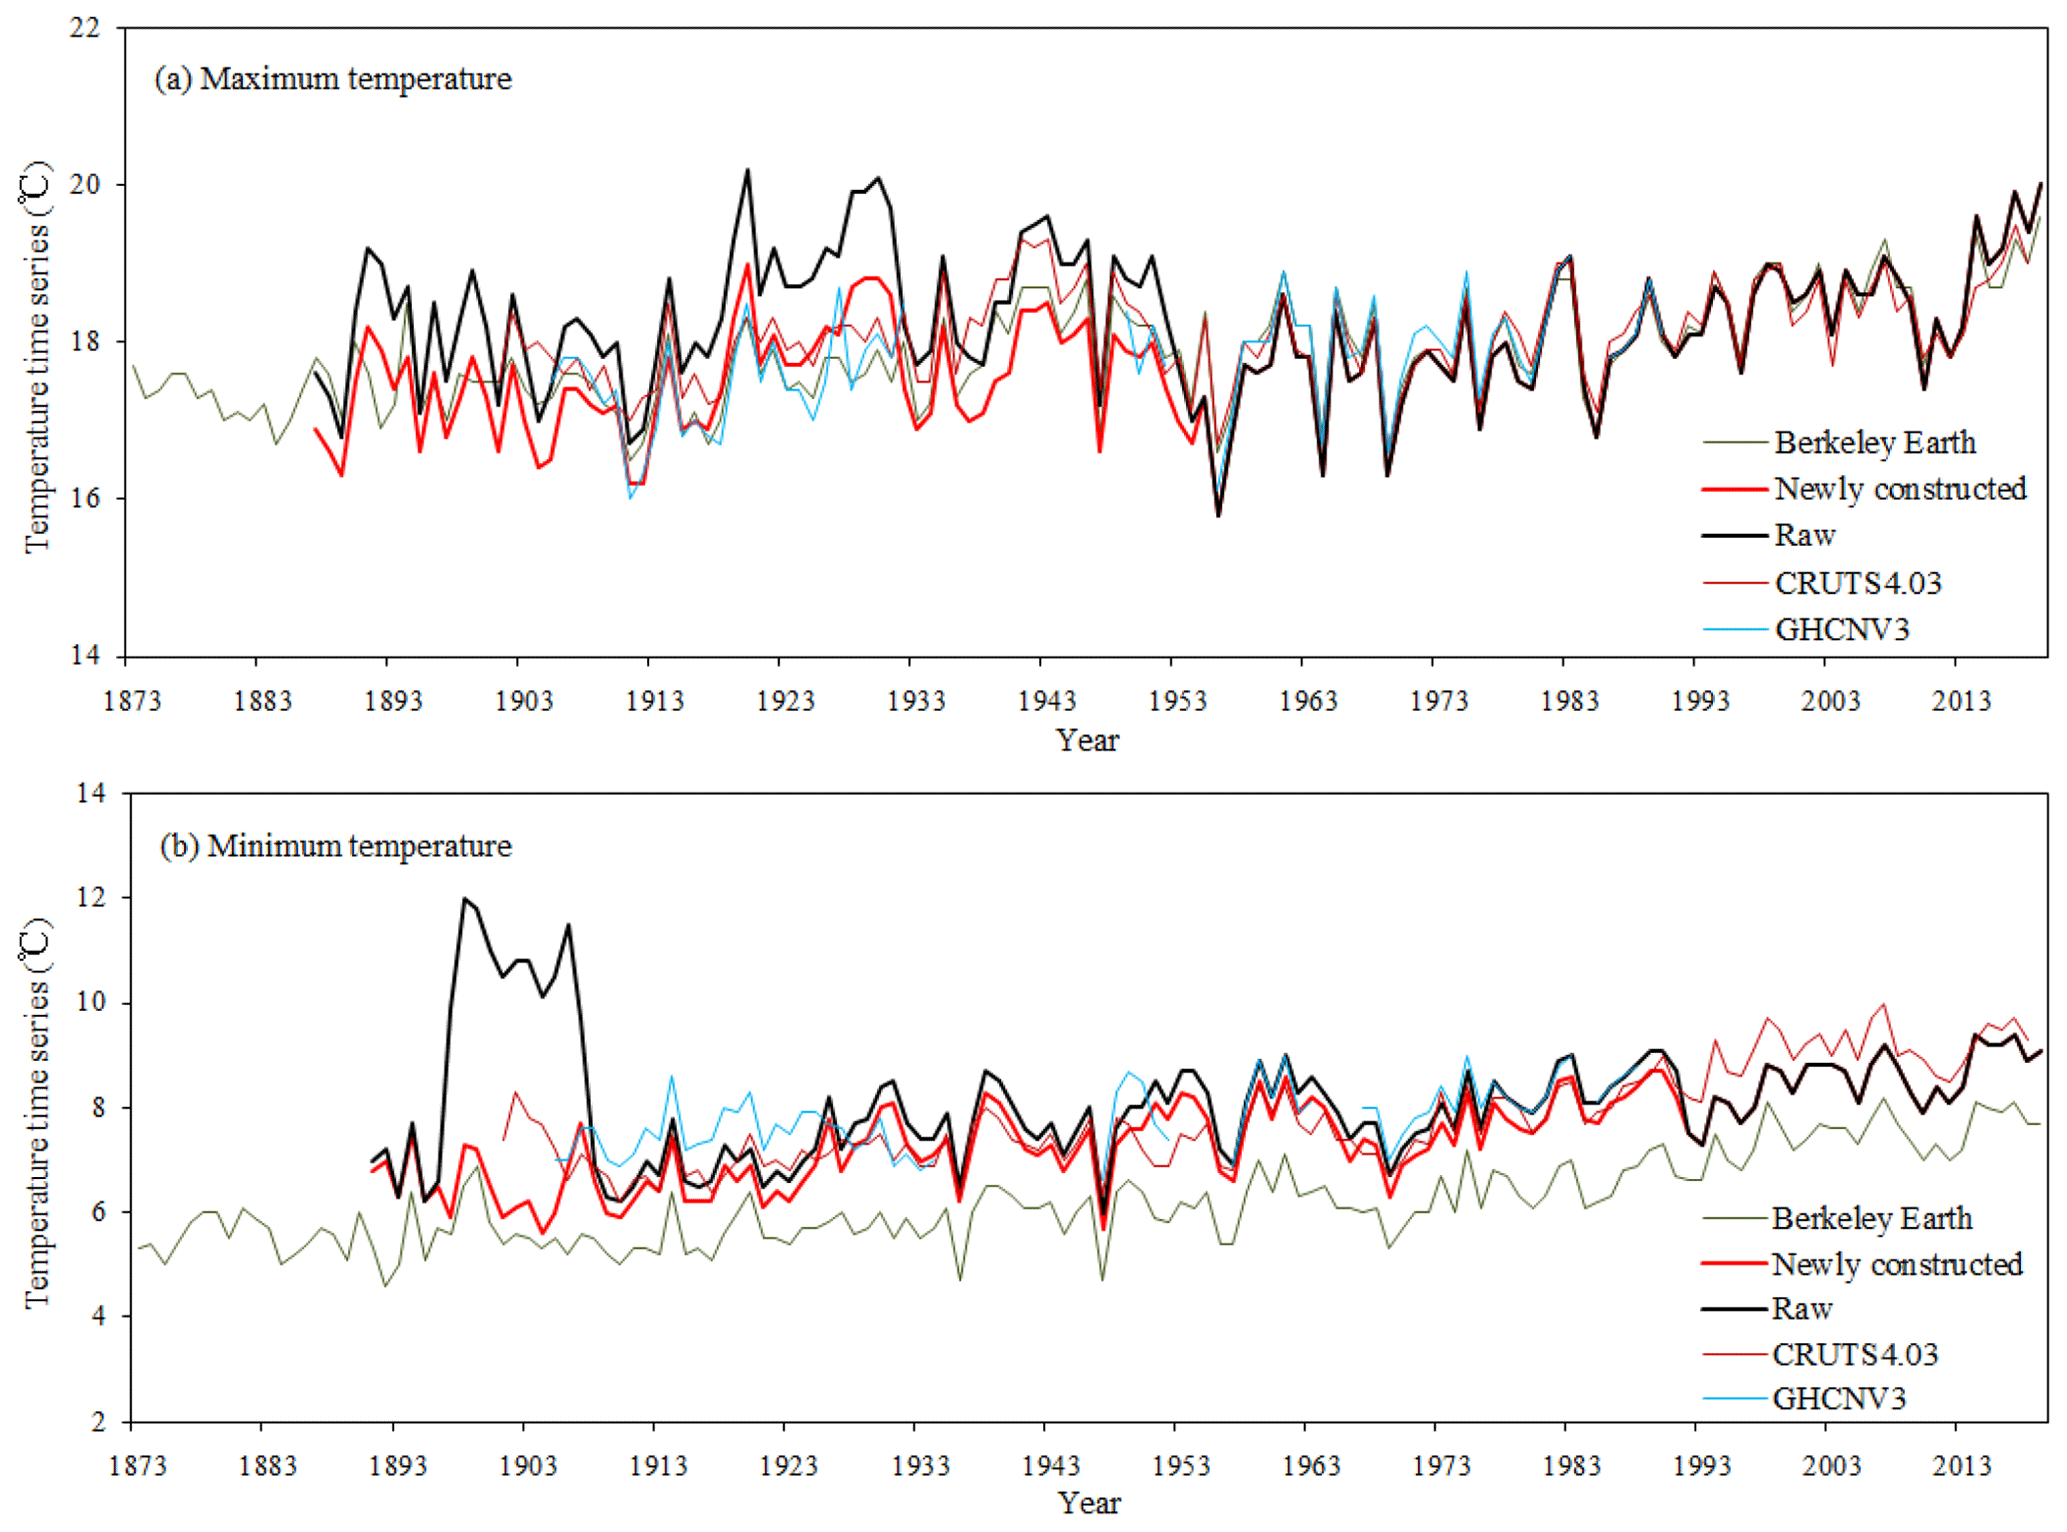
Figure 8Annual average series of maximum (a) and minimum (b) temperatures in Tianjin from 1887 (1891 for minimum) to 2019 based on newly constructed and raw daily data (after quality control and extension), correspondingly with annually averaged data based on the interpolated series from monthly BE (1873–2019) and CRU TS4.03 (1901–2018) and station series from GHCN v3 (1905–1990) for Tianjin Station.
The average annual maximum and minimum temperature series based on the adjusted daily data (the red lines) in Tianjin are given in Fig. 8. The raw time series for Tianjin (after quality control and extension), the interpolated series from BE and CRU TS4.03, and station series from GHCN v3 for Tianjin Station averaged from their monthly data are also displayed in Fig. 8. This shows that the newly constructed time series has removed the large shifts in maximum and minimum temperature series before 1955 and 1992 (Fig. 8, red lines) compared with the raw ones (Fig. 8, black lines). Especially for the minimum data, the QM adjustments have offset the shifts between 1896 and 1908 to the greatest extent. Meanwhile, the newly constructed temperature data have similar inter-annual variability and trend changes compared to those of BE, CRU TS4.03 and GHCN v3 during the overlapping period.
Table 5Definition of temperature extremes (Zhang et al., 2011). Days with maximum or minimum temperature above the 90th and below the 10th percentiles are relative to the reference period of 1961–1990.
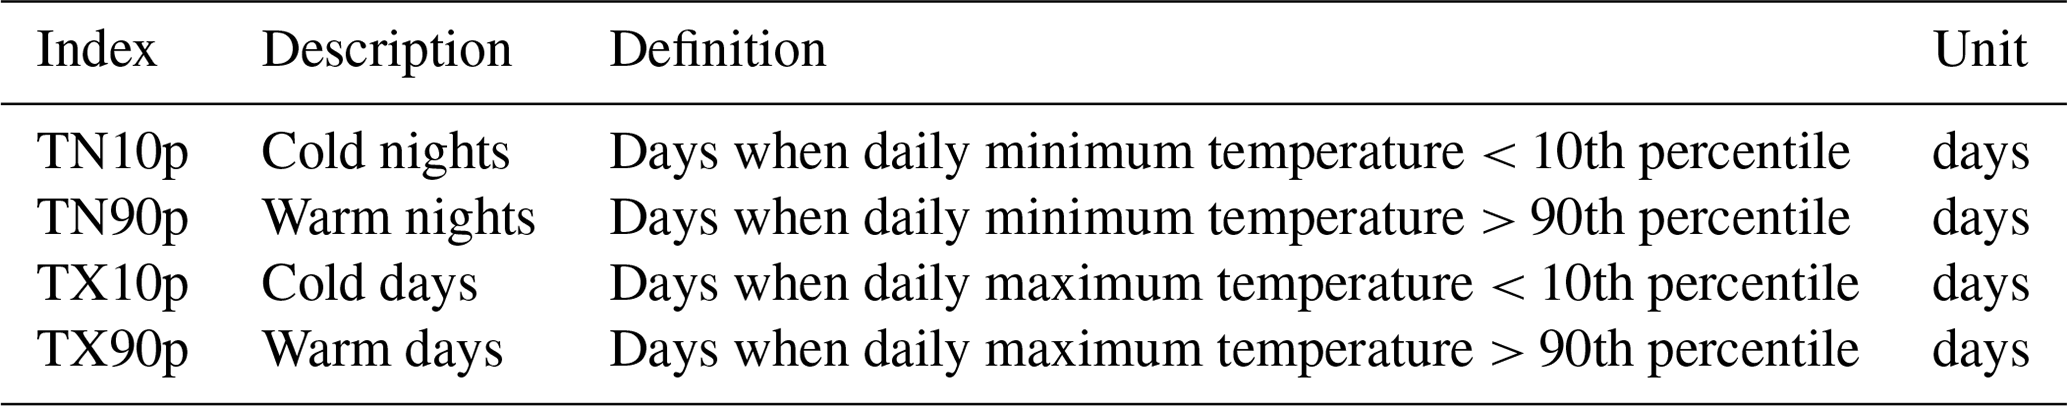
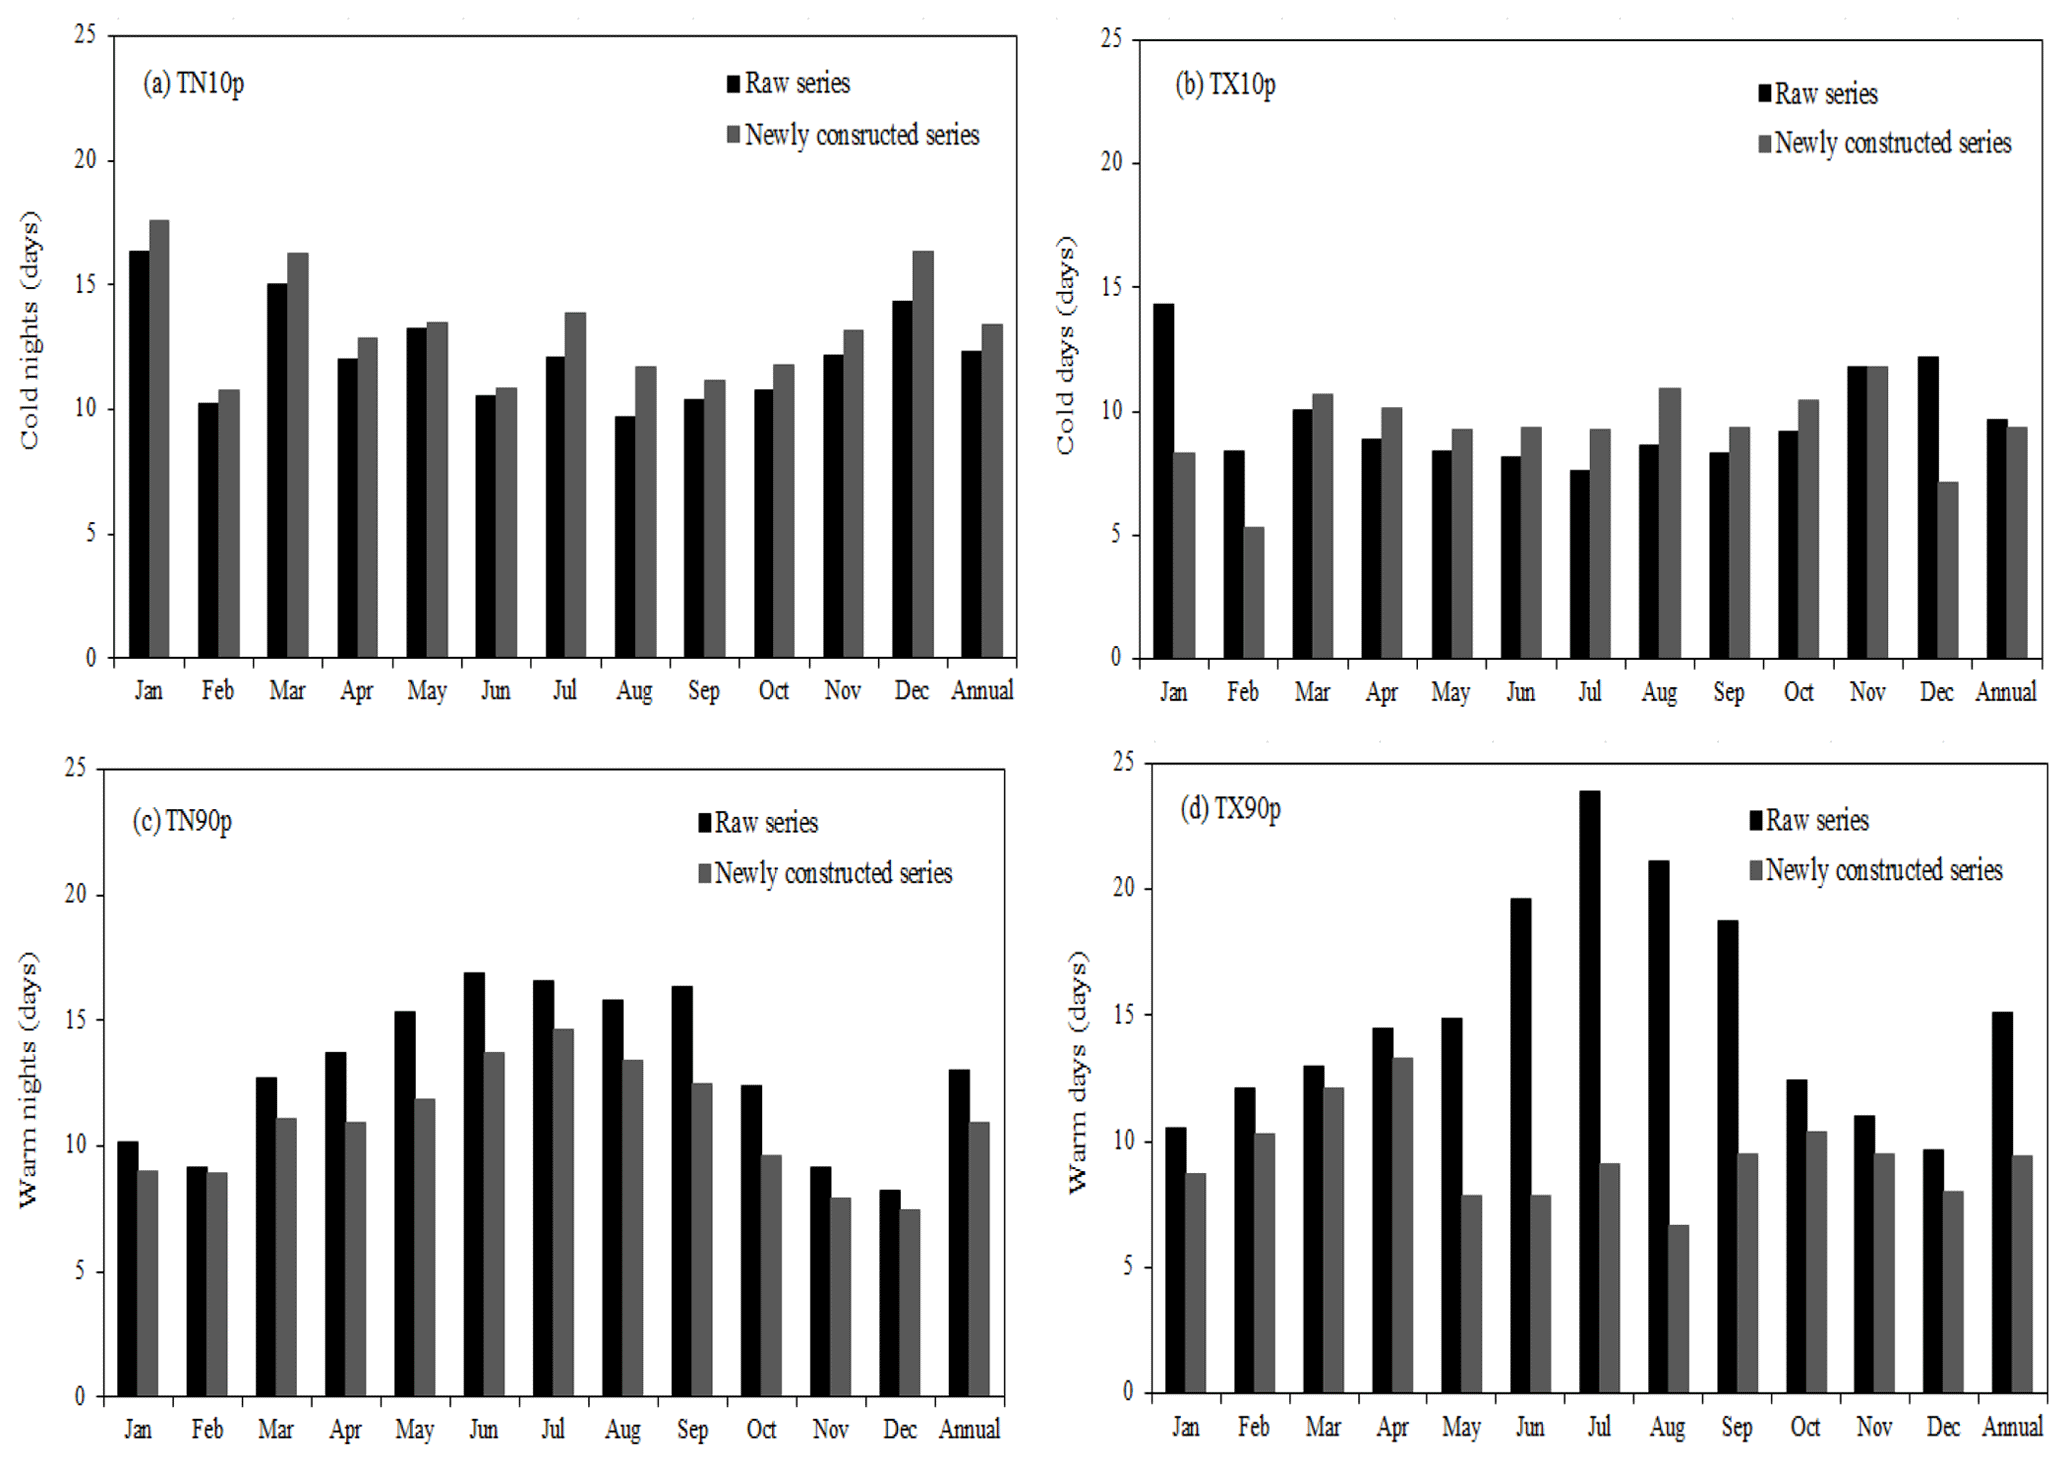
Figure 9Annual and monthly temperature extremes of cold nights (TN10p) (a), cold days (TX10p) (b), warm nights (TN90p) (c) and warm days (TX90p) (d) for daily newly constructed and raw temperatures (after quality control and extension) in Tianjin.
Table 5 provides the definition of temperature extremes (Zhang et al., 2011). They are calculated based on the newly constructed and raw series (after quality control and extension) in Tianjin. As shown in Fig. 9, the number of TN10p (Fig. 9a) and TX10p (Fig. 9b) days at the monthly timescale are increased by 0.3–2.0 d and 0.6–2.3 d based on the newly constructed series, with increase especially in August when they are increased by 2.0 and 2.3 d, respectively. TX10p days in cold months (January, February and December) from newly constructed data are all less than those from the raw data, with the number of days decreased by 3.1–6.1. This is mainly due to large positive adjustments applied to daily maximum temperature in these months (Table 4). In the opposite sense, the number of TN90p (Fig. 9c) and TX90p (Fig. 9d) days are decreased by 0.2–3.8 d and 0.9–14.8 d, respectively, based on the newly constructed series. The decreasing numbers of the two indices between May and September are prominent, especially for TX90p from June to August when the number is decreased by 11.8–14.8 d. This is due to the large negative adjustments applied to daily maximum temperature in these months (Table 4). The number of TN10p days (Fig. 9a) from newly constructed series at the annual timescale are increased by 1.1 d compared to the raw ones while for TX10p (Fig. 9b), TN90p (Fig. 9c) and TX90p (Fig. 9d) days are decreased by 0.3, 2.1 and 5.7 d, respectively.
Table 6Comparisons between newly constructed surface air temperatures and previous assessments of the annual trend change at the century-long scale in Tianjin with uncertainties at the 95 % significance level (unit – ∘C per decade).

5.1 Mean temperature trend during the last 130 years
Table 6 shows that the annual trends of newly constructed maximum (1887–2019) and minimum (1891–2019) temperature series in Tianjin are 0.119 ± 0.015 and 0.194 ± 0.013 ∘C per decade. Trend changes based on the newly constructed series are nearly consistent with those in BE and CRU TS4.03 on the century-long scale, and these are 0.099 ± 0.010 and 0.156 ± 0.010 ∘C per decade and 0.062 ± 0.015 and 0.217 ± 0.015 ∘C per decade, respectively. The trend of the mean temperature for the newly constructed series (0.154 ± 0.013 ∘C per decade) is slightly larger than those from the interpolated series from BE, CRU TS4.03 and Cao et al. (2013) (0.128 ± 0.009, 0.140 ± 0.013 and 0.098 ± 0.017 ∘C per decade, respectively). Moreover, annual trend change in mean temperature based on the newly constructed series at Tianjin is also a little larger than those over the whole of China (Li et al., 2020b), which are 0.130 ± 0.009, 0.114 ± 0.009 and 0.121 ± 0.009 ∘C per decade from CRUTEM4, GHCN v3 and C-LSAT (during 1900–2017), respectively. This conforms to the underlying changes across China. Increasing trends in northern China are more prominent than those from other regions in mainland China (Li et al., 2004; Zhai et al., 2004).
Table 7Trends in annual and seasonal temperature extremes of cold nights (TN10p), cold days (TX10p), warm nights (TN90p) and warm days (TX90p) for daily newly constructed temperatures in Tianjin (unit – d per decade).
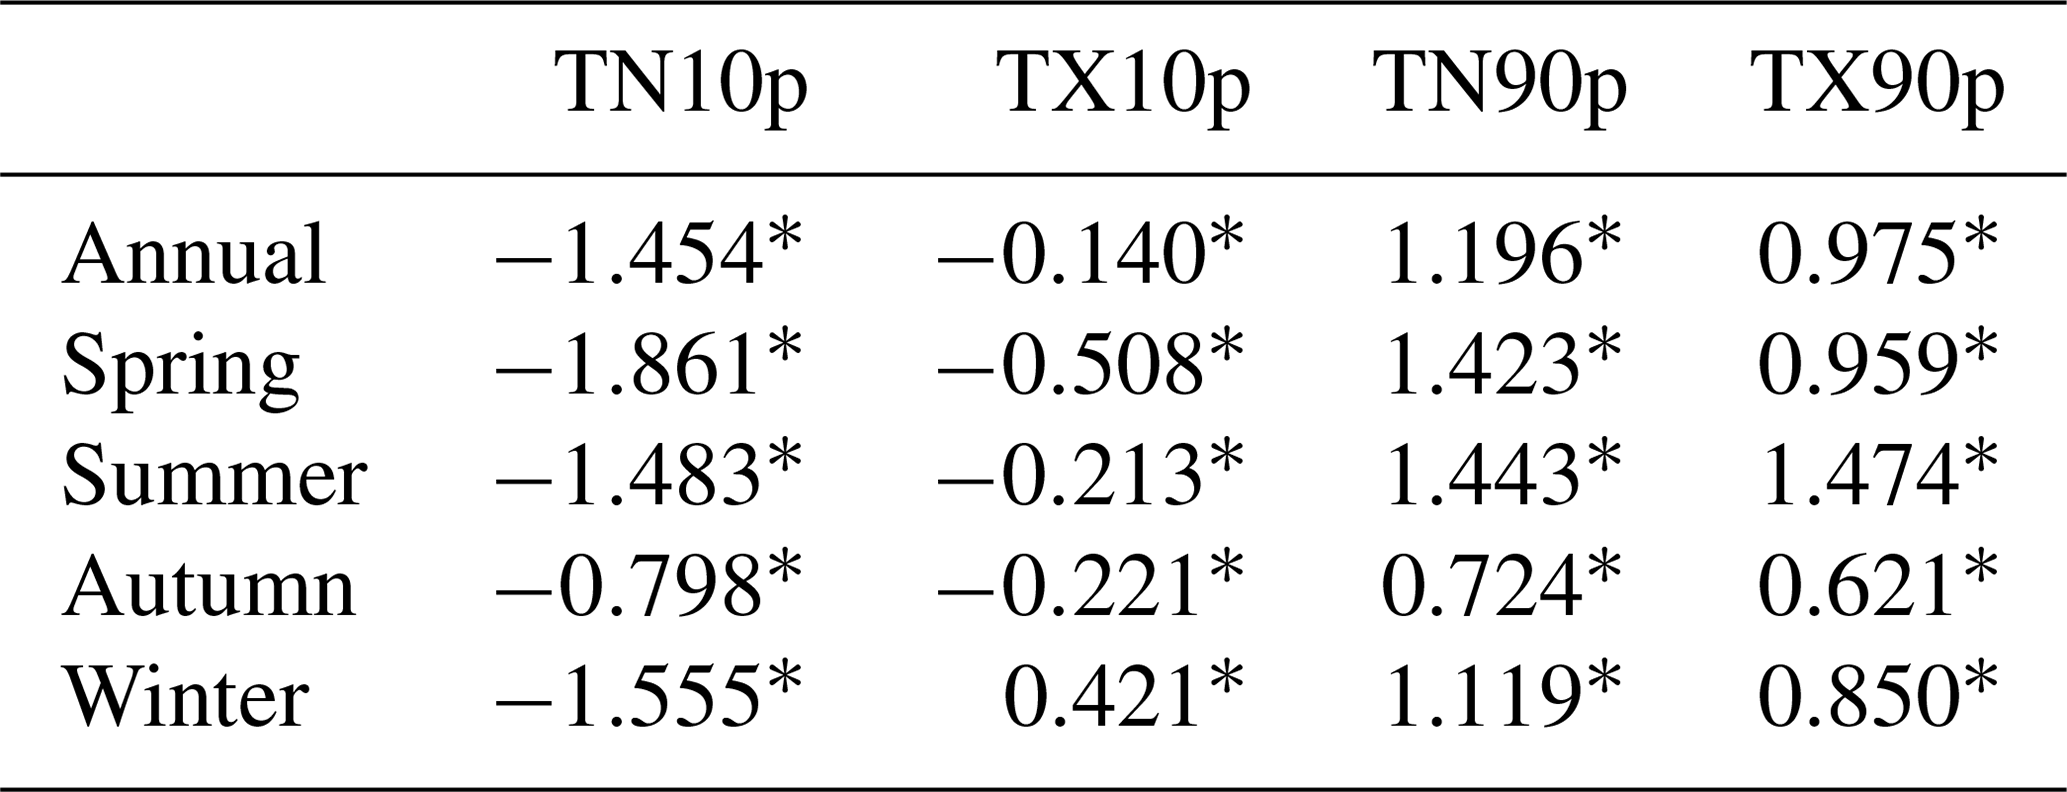
The asterisks indicate trend changes are significant at the 5 % level. The annual time periods of TN10p and TN90p cover the 1891–2019 period, TX10p and TX90p cover 1887–2019. The time periods of TN10p and TN90p in spring and summer cover 1891–2019; those in autumn and winter 1890–2019 (winter ending in 2018) and TX10p and TX90p in all four seasons cover 1887–2019 (winter ending in 2018).
5.2 Extreme-event change trend during the last 130 years
Table 7 illustrates that trends of temperature extremes based on the newly constructed series are all significant at the 5 % level and have much more coincident change. The cold extremes (TN10p and TX10p) at annual and seasonal timescales express significantly decreasing trends (except for TX10p in winter), while the warm extremes (TN90p and TX90p) show increasing trends. Trends of TN10p, TX10p, TN90p and TX90p at the annual timescale are −1.454, −0.140, 1.196 and 0.975 d per decade; all pass the significance test at the 5 % level. For the seasonal change, the negative trends of TN10p and TX10p in spring are the largest, reaching up to −1.861 and −0.508 d per decade during the past 130 years. For TN90p and TX90p, the largest trend change is in summer, with the amplitude of 1.443 and 1.474 d per decade.
The newly homogenized daily surface air temperature data for Tianjin city over the century-long scale are published at PANGAEA under the DOI https://doi.org/10.1594/PANGAEA.924561 (Si and Li, 2020). The dataset contain the maximum, minimum and mean temperature time series before and after adjustment as well as new estimates of average and extreme temperature trend change in Tianjin for the period of 1887–2019.
This paper documents the various procedures necessary to construct a homogenized daily maximum and minimum temperature series starting in 1887 for Tianjin. Procedures similar to these could and should be used for other sufficiently long and complete series across the world. The newly constructed data have reduced non-climatic errors at the daily timescale, improved accuracy, and enhanced the real climate representation of average and extreme temperature over the century-long scale.
Three sources of surface observation daily data collected by the Tianjin Meteorological Archive have been integrated, viz. the Department of Industry Agency of the British Concession in Tianjin covering 1 September 1890–31 December 1931, the Water Conservancy Commission of North China covering 1 January 1932–31 December 1950 and monthly journal sheets of Tianjin surface meteorological observation records covering 1 January 1951–31 December 2019. These three sources have provided a good foundation for the construction of reliable homogenized daily series by quality control of climatic-range checks, climatic-outlier checks and internal-consistency checks. Data extension has been undertaken in the interest of extending the length of the series as far back as possible, but it is carried out only for the daily maximum series due to length limitation of reference daily data.
Using integration, quality control and extension, we detected and adjusted the statistically significant breakpoints in the daily maximum and minimum temperature time series from an objective perspective based on multiple reference series and statistical characteristics from homogenization detection by means of the PMT as well as sophisticated manual data processing. This temperature series provides a set of new baseline data for the field of extreme climate change over the century-long scale and a reference for construction of other long-term reliable daily time series in the region. The annual trends of newly constructed maximum and minimum temperature in Tianjin are 0.119 ± 0.015 and 0.194 ± 0.013 ∘C per decade over the last 130 years, which are similar to those from Berkeley and CRU TS4.03. The trend of mean temperature averaged from the new series is 0.154 ± 0.013 ∘C per decade, which is of the same order as those over the whole of China (Li et al., 2020a, b). The new daily data also show improvements over the archived datasets for trend analyses of extremes. The trends in TN10p, TX10p, TN90p and TX90p are all significant at the 5 % level, and they give a much more consistent set of trends. To some extent, changes in climate extremes can be analyzed with higher confidence using the newly constructed daily data in this paper.
However, in the current study, there may still be some systematic biases (possibly some potential breakpoints missed) in the adjusted time series, since metadata of Tianjin Station are not consistently available in the climatological archives over the whole century as well as not documented during the period before 1921. Climate data homogenization does not always follow a consistent pattern (Si et al., 2018, 2019). It is necessary to constantly improve the existing methodology and explore new techniques in order to obtain reliable homogenized data products. Accordingly, future work should involve more detailed station metadata and more advanced data processing techniques to produce much better daily datasets over the century scale.
The supplement related to this article is available online at: https://doi.org/10.5194/essd-13-2211-2021-supplement.
QL designed and implemented the dataset construction. PS collected the basic and reference data sources, constructed the dataset, and wrote the paper. QL, PS and PJ all contributed to data analysis, discussion and writing of the paper.
The authors declare that they have no conflict of interest.
We thank the many people of Tianjin Climate Center; Tianjin Meteorological Information Center; and National Meteorological Information Center, China Meteorological Administration, who contributed to the raw data and metadata collection, data preprocessing, and construction of this dataset.
This research has been supported by National Natural Science Foundation of China project nos. 41905132 and 41975105.
This paper was edited by Ge Peng and reviewed by two anonymous referees.
Bai, K., Li, K., Wu, C., Chang, N.-B., and Guo, J.: A homogenized daily in situ PM2.5 concentration dataset from the national air quality monitoring network in China, Earth Syst. Sci. Data, 12, 3067–3080, https://doi.org/10.5194/essd-12-3067-2020, 2020.
Cao, L. J., Yan, Z. W., Zhao, P., Zhu, Y. N., Yu, Y., Tang, G. L., and Jones, P.: Climatic warming in China during 1901–2015 based on an extended dataset of instrumental temperature records, Environ. Res. Lett., 12, 064005, https://doi.org/10.1088/1748-9326/aa68e8, 2017.
Della-Marta, P. M. and Wanner, H.: A method of homogenizing the extremes and mean of daily temperature measurements, J. Climate, 19, 4179–4197, https://doi.org/10.1175/JCLI3855.1, 2006.
Dienst, M., Lindén, J., Engström, E., and Esper, J.: Removing the relocation bias from the 155-year Haparanda temperature record in Northern Europe, Int. J. Climatol., 37, 4015–4026, https://doi.org/10.1002/joc.4981, 2017.
Haimberger, L., Tavolato, C., and Sperka, S.: Homogenization of the global radiosonde temperature dataset through combined comparison with reanalysis background series and neighboring stations, J. Climate, 25, 8108–8131, https://doi.org/10.1175/JCLI-D-11-00668.1, 2012.
Hansen, J., Ruedy, R., and Sato Makiko, K. L.: Global surface temperature change, Rev. Geophys., 48, RG4004, https://doi.org/10.1029/2010RG000345, 2010.
Harris, I., Osborn, T., J., Jones, P., and Lister, D.: Version 4 of the CRU TS monthly high-resolution gridded multivariate climate dataset, Sci. Data., 7, 109, https://doi.org/10.1038/s41597-020-0453-3, 2020.
Hewaarachchi, A. P., Li, Y. G., Lund, R., and Rennie, J.: Homogenization of Daily Temperature Data, J. Climate, 30, 985–999, https://doi.org/10.1175/JCLI-D-16-0139.1, 2017.
Huang, J. Y., Liu, X. N., and Li, Q. X.: The experimental study of reconstruction for summer precipitation and temperature in China, Journal of Applied Meteorological Science, 15, 200–206, 2004 (in Chinese).
IPCC: Climate Change 2013: The Physical Science Basis, in: Contribution of Working Group I to the Fifth Assessment Report of the Intergovernmental Panel on Climate Change, edited by: Stocker, T. F., Qin, D., Plattner, G. K., Tignor, M., Allen, S. K., Boschung, J., Nauels, A., Xia, Y., Bex, V., Midgley, P. M., Cambridge University Press, Cambridge, UK and New York, USA, 1535 pp., 2013.
Jones, P. D., Lister, D., Osborn, T. J., Harpham, C., Salmon, M., and Morice, C.: Hemispheric and large-scale land-surface air temperature variations: an extensive revision and an update to 2010, J. Geophys. Res.-Atmos., 117, D05127, https://doi.org/10.1029/2011JD017139, 2012.
Lawrimore, J. H., Menne, M. J., Gleason, B., Williams, C. N., Wuertz, D. B., Vose, R. S., and Rennie, J.: An overview of the Global Historical Climatology Network monthly mean temperature data set, version 3, J. Geophys. Res.-Atmos., 116, D19121, https://doi.org/10.1029/2011JD016187, 2011.
Leeper, R. D., Rennie, J., and Palecki, M. A.: Observation perspectives from U.S. Climate Reference Network (USCRN) and Cooperative Observer Program (COOP) Network: temperature and precipitation comparison, J. Atmos. Ocean. Tech., 32, 703–721, https://doi.org/10.1175/JTECH-D-14-00172.1, 2015.
Lenssen, N. J. L., Schmidt, G. A., Hansen, J., Menne, M. J., Persin, A., Ruedy, R., and Zyss, D.: Improvements in the GISTEMP uncertainty model, J. Geophys. Res.-Atmos., 124, 6307–6326, https://doi.org/10.1029/2018JD029522, 2019.
Li, Q. X., Zhang, H. Z., Liu, X. N., and Huang, J. Y.: Urban heat island effect on annual mean temperature during the last 50 years in China, Theor. Appl. Climatol., 79, 165–174, https://doi.org/10.1007/s00704-004-0065-4, 2004.
Li, Q. X., Dong, W. J., Li, W., Gao, X. R., Jones, P., Parker, D., and Kennedy, J.: Assessment of the uncertainties in temperature change in China during the last century, Chinese Sci. Bull., 55, 1974–1982, https://doi.org/10.1007/s11434-010-3209-1, 2010.
Li, Q. X., Zhang, L., Xu, W. H., Zhou, T. J., Wang, J. F., Zhai, P. M., and Jones, P.: Comparisons of time series of annual mean surface air temperature for China since the 1900's Observation, Model simulation and extended reanalysis, B. Am. Meteorol. Soc., 98, 699–711, https://doi.org/10.1175/BAMS-D-16-0092.1, 2017.
Li, Q. X., Sun, W. B., Huang, B. Y., Dong, W. J., Wang, X. L., Zhai, P. M., and Jones, P.: Consistency of global warming trends strengthened since 1880's, Sci. Bull., 65, 1709–1712, https://doi.org/10.1016/j.scib.2020.06.009, 2020a.
Li, Q. X., Dong, W. J., and Jones, P.: Continental Scale Surface Air Temperature Variations: Experience Derived from the Chinese Region, Earth-Sci. Rev., 200, 102998, https://doi.org/10.1016/j.earscirev.2019.102998, 2020b.
Li, Q. X., Sun, W. B., Huang, B. Y., Dong, W. J., Wang, X. L., Zhai, P. M., and Jones, P.: An updated evaluation on the global Mean Surface Temperature trends since the start of 20th century, Clim. Dynam., 56, 635–650, https://doi.org/10.1007/s00382-020-05502-0, 2021.
Li, Y., Tinz, B., von Storch, H., Wang, Q., Zhou, Q., and Zhu, Y.: Construction of a surface air temperature series for Qingdao in China for the period 1899 to 2014, Earth Syst. Sci. Data, 10, 643–652, https://doi.org/10.5194/essd-10-643-2018, 2018.
Lv, Y. M., Guo, J. P., Yim, S. H., Yun, Y. X., Yin, J. F., Liu, L., Zhang, Y., Yang, Y. J., Yan, Y., and Chen, D. D.: Towards understanding multi-model precipitation predictions from CMIP5 based on China hourly merged precipitation analysis data, Atmos. Res., 231, 104671, https://doi.org/10.1016/j.atmosres.2019.104671, 2020.
Menne, M. J., Durre, I., Vose, R. S., Gleason, B., and Houston, T. G.: An overview of the global historical climatology network-daily database, J. Atmos. Ocean. Tech., 29, 897–910, https://doi.org/10.1175/JTECH-D-11-00103.1, 2012.
Menne, M. J., Williams, C. N., Gleason, B. E., Rennie, J. J., and Lawrimore, J. H.: The global historical climatology network monthly temperature dataset, Version 4, J. Climate, 31, 9835–9854, https://doi.org/10.1175/JCLI-D-18-0094.1, 2018.
Png, I. P. L., Chen, Y., Chu, J. H., Feng, Y. K., Lin, E. K. H., and Tseng, W. L.: Temperature, precipitation and sunshine across China, 1912–1951: A new daily instrumental dataset, Geosci. Data J., 7, 90–101, https://doi.org/10.1002/gdj3.91, 2020.
Quayle, R. G., Easterling, D. R., Karl, T. R., and Hughes, P. Y.: Effects of recent thermometer changes in the cooperative station network, B. Am. Meteorol. Soc., 72, 1718–1723, https://doi.org/10.1175/1520-0477(1991)0722.0.CO;2, 1991.
Rahimzadeh, F. and Zavareh, M. N.: Effects of adjustment for non-climatic discontinuities on determination of temperature trends and variability over Iran, Int. J. Climatol., 34, 2079–2096, https://doi.org/10.1002/joc.3823, 2014.
Rohde, R. A. and Hausfather, Z.: The Berkeley Earth Land/Ocean Temperature Record, Earth Syst. Sci. Data, 12, 3469–3479, https://doi.org/10.5194/essd-12-3469-2020, 2020.
Rohde, R., Muller, R. A., Jacobsen, R., Muller, E., Perlmutter, S., Rosenfeld, A., Wurtele J., Groom, D., and Wickham, C.: A new estimate of the average earth surface land temperature spanning 1753 to 2011, Geoinfor. Geostat.: An overview, 1, 1–7, https://doi.org/10.4172/2327-4581.1000101, 2013
Si, P. and Li, Q. X.: Tianjin homogenized daily surface air temperature over century-long scale, PANGAEA, https://doi.org/10.1594/PANGAEA.924561, 2020.
Si, P., Zheng, Z. F., Ren, Y., Liang, D. P., Li, M. C., and Shu, W. J.: Effects of urbanization on daily temperature extremes in North China, J. Geogr. Sci., 24, 349–362, https://doi.org/10.1007/s11442-014-1092-4, 2014.
Si, P., Hao, L. S., Luo, C. J., Cao, X. C., and Liang, D. P.: The interpolation and homogenization of long-term temperature time series at Baoding observation station in Hebei Province, Climate Change Research, 13, 41–51, 2017 (in Chinese).
Si, P., Luo, C. J., and Liang, D. P.: Homogenization of Tianjin monthly near-surface wind speed using RHtestsV4 for 1951–2014, Theor. Appl. Climatol., 132, 1303–1320, https://doi.org/10.1007/s00704-017-2140-7, 2018.
Si, P., Luo, C. J., and Wang, M.: Homogenization of Surface Pressure Data in Tianjin, China, J. Meteorol. Res.-PRC, 33, 1131–1142, https://doi.org/10.1007/s13351-019-9043-8, 2019.
Si, P., Wang, J., Li, H. J., and Nian, F. X.: Homogenization and application of meteorological observation data at provincial level, China Meteorological Press, Beijing, China, 76–91, 2020 (in Chinese).
Sun, X. B., Ren, G. Y., Xu, W. H., Li, Q. X., and Ren, Y. Y.: Global land-surface air temperature change based on the new CMA GLSAT data set, Sci. Bull., 62, 236–238, https://doi.org/10.1016/j.scib.2017.01.017, 2017.
Trewin, B.: A daily homogenized temperature data set for Australia, Int. J. Climatol., 33, 1510–1529, https://doi.org/10.1002/joc.3530, 2013.
Vincent, L. A., Zhang, X., Bonsal, B. R., and Hogg, W. D.: Homogenization of daily temperature over Canada, J. Climate, 15, 1322–1334, https://doi.org/10.1175/1520-0442(2002)0152.0.CO;2, 2002.
Vincent, L. A., Wang, X. L., Milewska, E. J., Wan, H., Yang, F., and Swail, V. R.: A second generation of homogenized Canadian monthly surface air temperature for climate trend analysis, J. Geophys. Res.-Atmos., 117, D18110, https://doi.org/10.1029/2012JD017859, 2012.
Wang, S. W., Ye, J. L., Gong, D. Y., Zhu, J. H., and Yao, T. D.: Construction of mean annual temperature series for the LSAT one hundred years in China, Quarterly Journal of Applied Meteorology, 9, 392–401, 1998 (in Chinese).
Wang, S. W., Gong, D. Y., Ye, J. L., and Chen, Z. H.: Seasonal precipitation series of Eastern China since 1880 and the variability, Acta Geographica Sinica, 35, 281–293, 2000 (in Chinese).
Wang, X. L., Wen, Q. H., and Wu, Y. H.: Penalized maximal t test for detecting undocumented mean change in climate data series, J. Appl. Meteorol. Clim., 46, 916–931, https://doi.org/10.1175/JAM2504.1, 2007.
Wang, X. L., Chen, H. F., Wu, Y. H., Feng, Y., and Pu, Q.: New techniques for the detection and adjustment of shifts in daily precipitation data series, J. Appl. Meteorol. Clim., 49, 2416–2436, https://doi.org/10.1175/2010jamc2376.1, 2010.
Wu, Z. X.: China Modern Meteorological Station, China Meteorological Press, Beijing, Chian, 180–182, 2007 (in Chinese).
Xu, C. D., Wang, J. F., and Li, Q. X.: A new method for temperature spatial interpolation based on sparse historical stations, J. Climate, 31, 1757–1770, https://doi.org/10.1175/JCLI-D-17-0150.1, 2018.
Xu, W. H., Li, Q. X., Jones, P., Wang, X. L., Trewin, B., Yang, S., Zhu, C., Zhai, P. M., Wang, J. F., Vincent, L. A., Dai, A. G., Gao, Y., and Ding, Y. H.: A new integrated and homogenized global monthly land surface air temperature dataset for the period since 1900, Clim. Dynam., 50, 2513–2536, https://doi.org/10.1007/s00382-017-3755-1, 2018.
Xu, W. Q., Li, Q. X., Wang, X. L., Yang, S., Cao, L. J., and Feng, Y.: Homogenization of Chinese daily surface air temperatures and analysis of trends in the extreme temperature indices, J. Geophys. Res.-Atmos., 118, 9708–9720, https://doi.org/10.1002/jgrd.50791, 2013.
Yan, Z. W., Chi, Y., and Jones, P.: Influence of inhomogeneity on the estimation of mean and extreme temperature trends in Beijing and Shanghai, Adv. Atmos. Sci., 18, 309–322, https://doi.org/10.1007/BF02919312, 2001.
Yu, J., Li, Q. X., Zhang, T. W., Xu, W. H., Zhang, L., and Cui, Y.: The merging test using measurements, paleoclimate reconstruction and climate model data based on Bayesian model, Acta Meteorol. Sin., 76, 304–314, 2018 (in Chinese).
Zhai, P. M., Chao, Q. C., and Zou, X. K.: Progress in China's climate change study in the 20th century, J. Geogr. Sci., 14, 3–11, https://doi.org/10.1007/BF02841101, 2004.
Zhang, X., Alexander, L., Hegerl, G. C., Jones, P. D., Klein Tank, A., Peterson, T. C., Trewin, B., and Zwiers, F. W.: Indices for monitoring changes in extremes based on daily temperature and precipitation data, WIRES. Clim. Change, 2, 851–870, https://doi.org/10.1002/wcc/147, 2011.
Zheng, J. Y., Liu, Y., Ge, Q. S., and Hao, Z. X.: Spring phenodate records derived from historical documents and reconstruction on temperature change in Central China during 1850–2008, Acta Geographica Sinica, 70, 696–704, 2015 (in Chinese).
- Abstract
- Introduction
- Historical evolution of Tianjin Meteorological Observation Station
- Data sources
- Construction of daily maximum and minimum temperature series from 1887 to 2019
- The temperature change trend in Tianjin based on newly constructed series
- Data availability
- Conclusions and discussion
- Author contributions
- Competing interests
- Acknowledgements
- Financial support
- Review statement
- References
- Supplement