the Creative Commons Attribution 4.0 License.
the Creative Commons Attribution 4.0 License.
 | 10 May 2021
Complementing regional moment magnitudes to GCMT: a perspective from the rebuilt International Seismological Centre Bulletin
James Harris
Dmitry A. Storchak
Seismologists and geoscientists often need earthquake catalogues for various types of research. This input usually contains basic earthquake parameters such as location (longitude, latitude, depth, and origin time), as well as magnitude information. For the latter, the moment magnitude Mw has become the most sought after magnitude scale in the seismological community to characterize the size of an earthquake. In this contribution we provide an informative account of the Mw content for the newly rebuilt Bulletin of the International Seismological Centre (ISC, http://www.isc.ac.uk, last access: May 2021), which is regarded as the most comprehensive record of the Earth's seismicity. From this data, we extracted a list of hypocentres with Mw from a multitude of agencies reporting data to the ISC. We first summarize the main temporal and spatial features of the Mw provided by global (i.e. providing results for moderate to great earthquakes worldwide) and regional agencies (i.e. also providing results for small earthquakes in a specific area). Following this, we discuss their comparisons, by considering not only Mw but also the surface wave magnitude MS and short-period body wave magnitude mb. By using the Global Centroid Moment Tensor solutions as an authoritative global agency, we identify regional agencies that best complement it and show examples of frequency–magnitude distributions in different areas obtained both from the Global Centroid Moment Tensor alone and complemented by Mw from regional agencies. The work done by the regional agencies in terms of Mw is fundamental to improve our understanding of the seismicity of an area, and we call for the implementation of procedures to compute Mw in a systematic way in areas currently not well covered in this respect, such as vast parts of continental Asia and Africa. In addition, more studies are needed to clarify the causes of the apparent overestimation of global Mw estimations compared to regional Mw. Such difference is also observed in the comparisons of Mw with MS and mb. The results presented here are obtained from the dataset (Di Giacomo and Harris, 2020, https://doi.org/10.31905/J2W2M64S) stored at the ISC Dataset Repository (http://www.isc.ac.uk/dataset_repository/, last access: May 2021).
- Article
(10546 KB) - Full-text XML
- BibTeX
- EndNote


Among the different magnitude scales developed over the years to measure an earthquake's size, the moment magnitude Mw, introduced by Kanamori (1977) and Hanks and Kanamori (1979), has a fundamental role in seismology. Although Mw alone is not able to fully characterize the energy release of an earthquake (e.g. Choy and Boatwright, 1995; Di Giacomo et al., 2010), it is considered the most reliable and, as such, the reference earthquake magnitude in different areas of research in seismology and geophysics (e.g. earthquake source studies, tsunamis, tectonics, and geodynamics) and related applications (e.g. ground-motion prediction equations, site effects, and seismic hazard). Its computation relies on reliable estimation of the scalar seismic moment M0 (Aki, 1966) via the relationship (e.g. IASPEI, 2013): , with M0 given in Nm. There are several methodologies to obtain M0 (Lee and Engdahl, 2015). The most popular are based on moment tensor inversion from seismic recordings (Gilbert and Dziewonski, 1975), initially applied to earthquakes with Mw above 5–5.5, now expanded to smaller earthquakes recorded at regional distances (Dreger and Helmberger, 1993). Other techniques instead use spectral analysis (Andrews, 1986) to obtain M0 and other source parameters (e.g. stress drop, corner frequency; Brune, 1970). Such techniques are useful for earthquakes recorded in the local distance range as they allow M0 computation for small earthquakes.
Since the introduction of Mw, many research groups developed techniques to routinely compute it for monitoring and/or research purposes. Some seismological agencies systematically compute Mw on a global scale and also in recent years at regional scale (i.e. magnitude 5 and below in a specific area). As part of the mission of the International Seismological Centre (ISC, http://www.isc.ac.uk, last access: May 2021) to collect, integrate, review, and reprocess seismic bulletins from seismological agencies around the world, the ISC Bulletin (International Seismological Centre, 2020) is, to our knowledge, the most comprehensive resource where researchers interested in Mw can combine the information from global agencies and regional ones over several decades (details in the following sections).
With the completion in early 2020 of the Rebuild project (Storchak et al., 2017, 2020) of the ISC Bulletin, here we provide an overview of the Mw content in the rebuilt ISC Bulletin and discuss some of its features. In particular, we outline the spatial and temporal properties of Mw from global and regional agencies (Sect. 2) and then discuss their comparisons (Sect. 3) and characteristics of Mw with the ISC re-computed surface wave magnitude MS and short-period body-wave magnitude mb (Sect. 4). Finally, we discuss the feasibility of complementing regional Mw to global ones by showing the Gutenberg–Richter distribution in some areas where regional Mw is available for a long period of time (Sect. 5).
The ISC Bulletin (International Seismological Centre, 2020) contains the Mw from a multitude of seismological agencies around the world. Each agency contributing data to the ISC Bulletin is identified with a code, and their details can be found at http://www.isc.ac.uk/iscbulletin/agencies (last access: May 2021). The aim of this work is not to outline the different techniques adopted by each agency to compute Mw. Such techniques have been extensively documented in scientific literature, and readers should refer to the citations (if available) for more information on the technique of a specific agency.
Without repeating the whole process behind the production of the ISC Bulletin (see, e.g. Sect. 3 of International Seismological Centre, 2013, for a detailed overview), here we recall that the ISC, to begin with, groups the reported hypocentres and related data (e.g. arrival times, amplitudes, nodal planes, moment tensors) by physical event. Then, usually 24 to 30 months behind real-time, the ISC analysts review the Bulletin by assessing the location and magnitude (Bondár and Storchak, 2011) of selected events (usually with magnitude above 3.5) and running a series of checks, some of which include the unreviewed events (e.g. events too small and often reported by a single agency). During the review process, among other changes, events may be banished, merged or split, hypocentres (and possibly related data) may be re-associated or, in exceptional cases, deprecated. The final product is a bulletin containing the ISC relocations (if the event has been relocated) in addition to the results (e.g. hypocentres, centroid locations, magnitudes) of contributing agencies.
The ISC Bulletin 1964–2017 contains over 7 million events, and about 1.9 million of those have been reviewed. As we focus on Mw in this work, we extracted from the ISC Bulletin (1964–2017) a list of hypocentres with Mw from reporting agencies (the ISC does not currently compute Mw). This dataset is freely available at the ISC Dataset Repository at https://doi.org/10.31905/J2W2M64S (Di Giacomo and Harris, 2020) and is the input for most of the results shown in the following sections. For simplicity, hereafter we refer to this dataset as the “DH Mw List”. Details on how we created the list of Mw entries from the ISC Bulletin, as well as the explanation of the parameters included, can be found in Sect. 6. The DH Mw List starts in 1964 (the official starting year of the ISC) and stops in 2017 (coinciding with the last complete calendar year of the reviewed ISC Bulletin at the time of writing). Mw is obviously available in the ISC Bulletin from 2018 to present and also before 1964, but they are not considered here.
Table 1Details of the agencies contributing with Mw to the ISC Bulletin. Country refers to where the agency is based. The column Mw procedure is to characterize agencies using waveform inversion techniques to obtain moment tensors (Lentas et al., 2019) or spectral fitting techniques (Havskov and Ottemöller, 1999; Havskov et al., 2020) to obtain M0. For several agencies to procedure is not known to us. The “×” symbol in the last column (Analysed) is to identify agencies that will be discussed in the magnitude comparison sections. Full agency details can be found by typing the agency code at http://www.isc.ac.uk/iscbulletin//agencies/ (last access: May 2021).
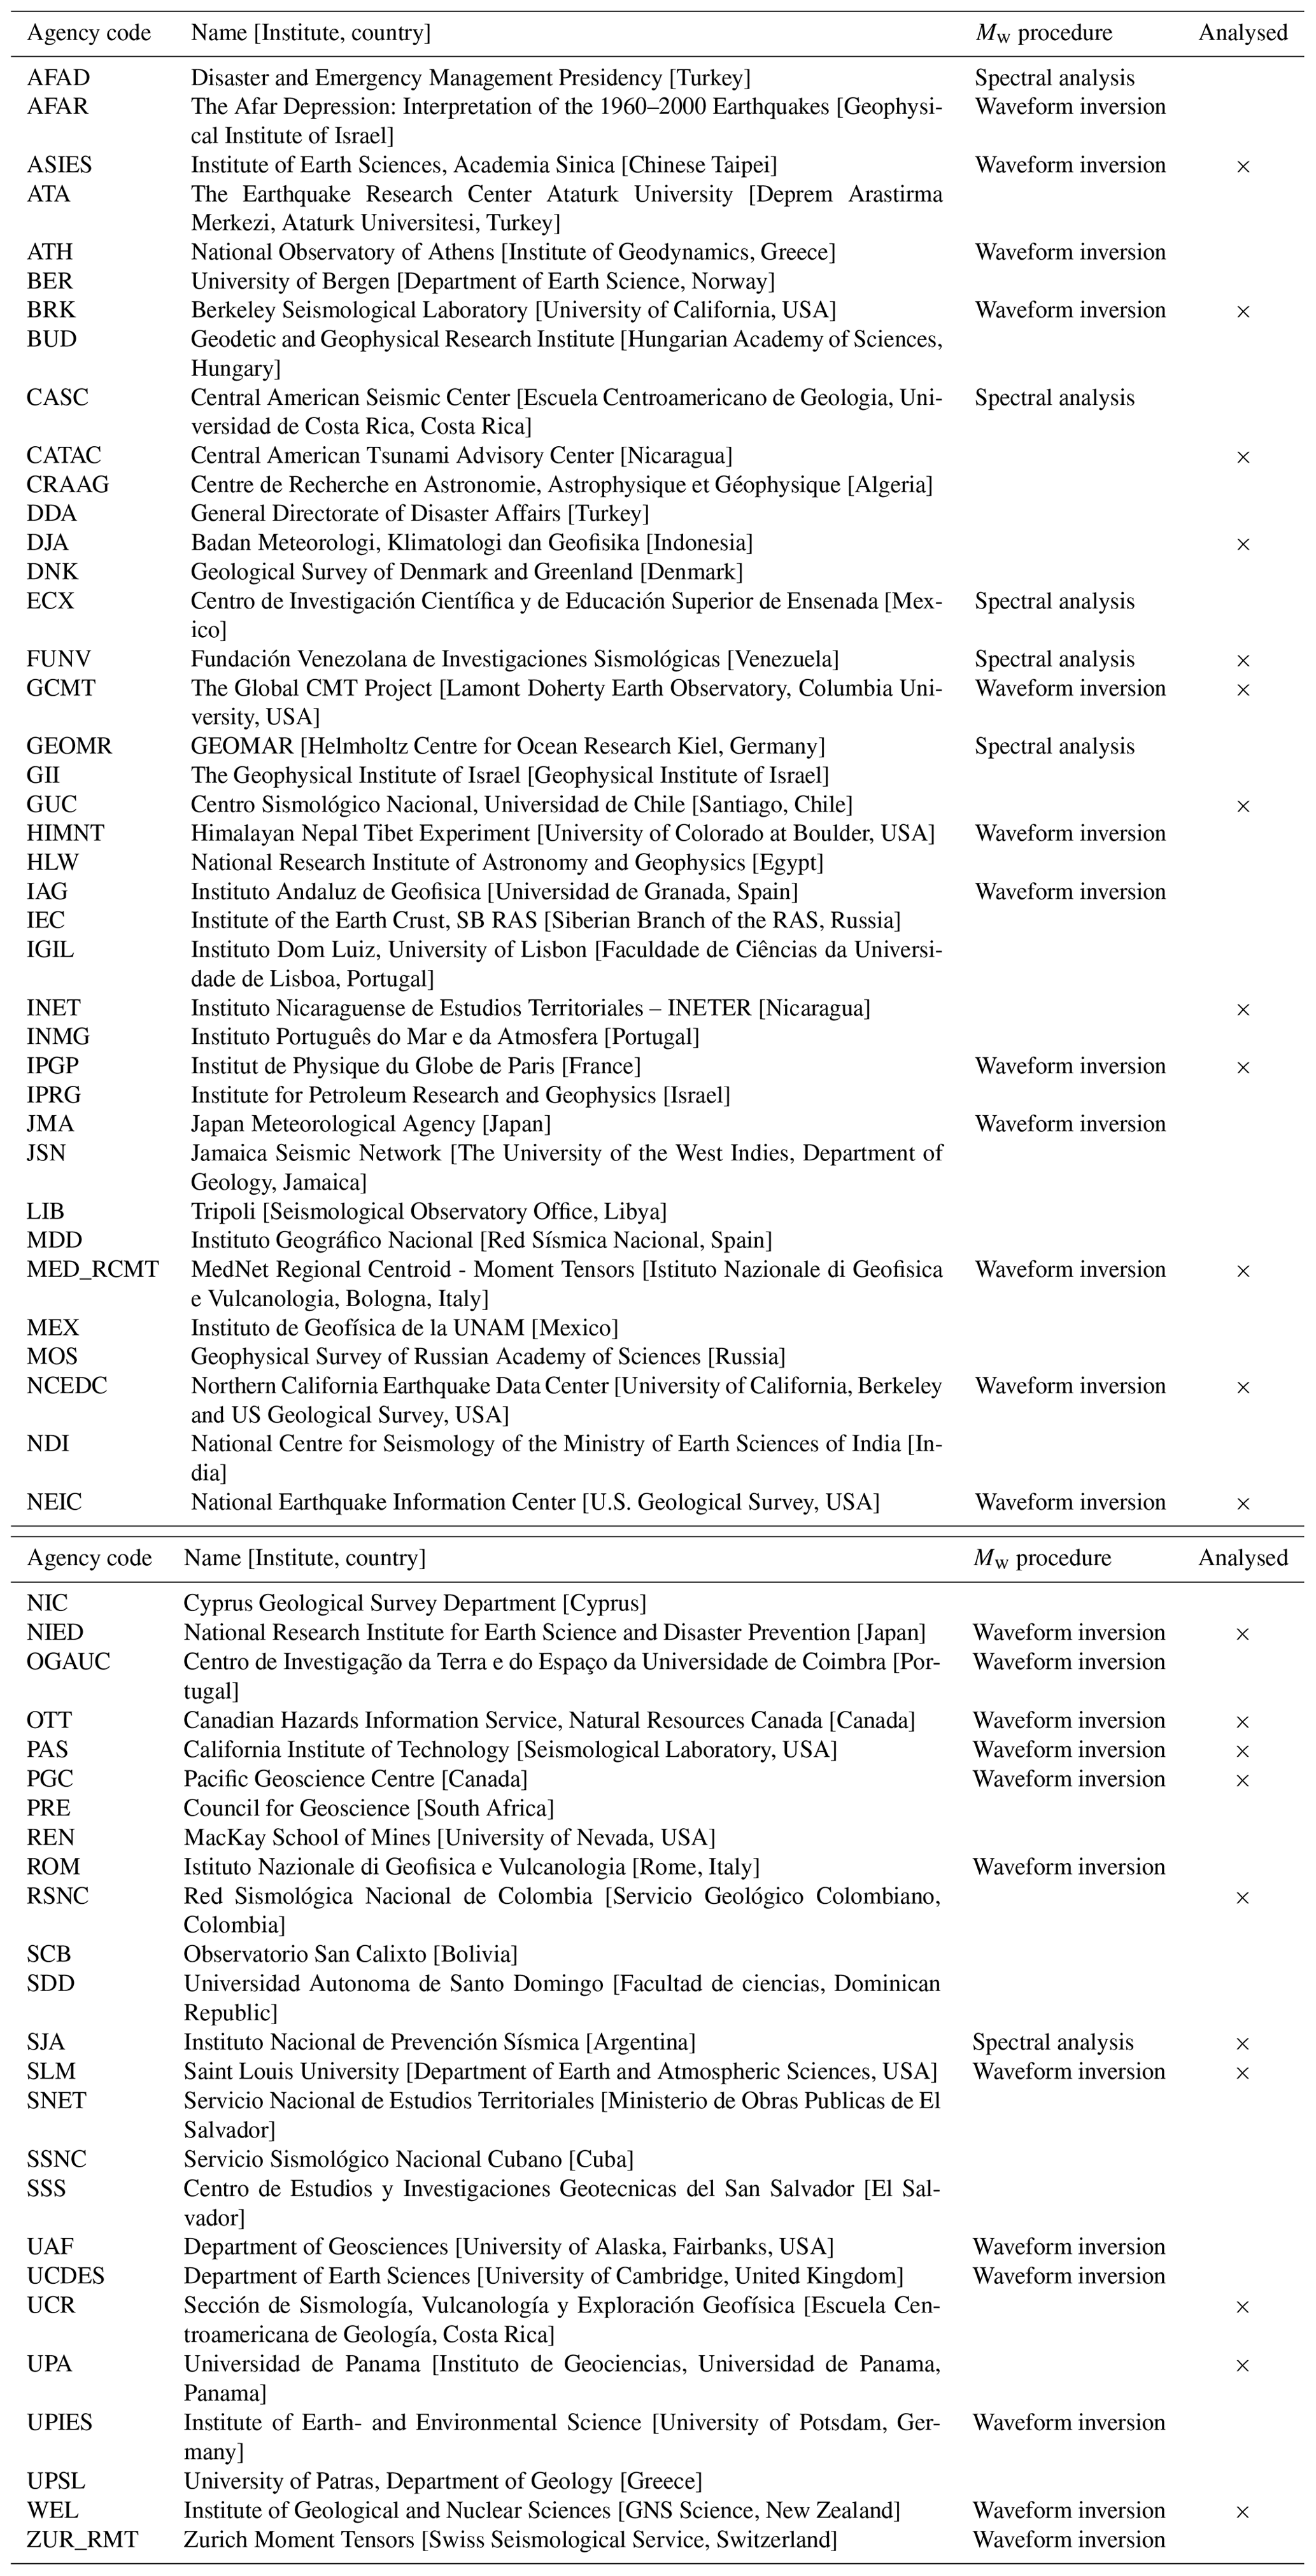
The DH Mw List contains 210 929 entries belonging to 179 112 earthquakes. Of those earthquakes, 42 478 have Mw≥5.0. The ISC Bulletin 1964–2017 contains about 66 000 earthquakes with ISC mb≥5.0 and about 545 000 with ISC mb<5. Hence, Mw, despite being the preferred magnitude scale by the seismological community, is not available for a significant fraction of the Earth's seismicity (see also Di Giacomo and Storchak, 2016). In total, 89 different Mw authors (hereafter, we use agency and magnitude author interchangeably) are included in DH Mw List. Table 1 lists the Mw agency details, along with the methodology used (to the best of our knowledge), whereas their timeline is shown in Fig. 1. Only a few agencies report Mw systematically or with few gaps over several years. Those include the solutions at global scale of the Global Centroid Moment Tensors project (GCMT, http://www.globalcmt.org, last access: May 2021, Dziewonski et al., 1981; Ekström et al., 2012), the National Earthquake Information Center of the US Geological Survey (NEIC, https://earthquake.usgs.gov/earthquakes/search/, last access: May 2021, e.g. Benz and Herrmann, 2014), and, at regional scale, the National Research Institute for Earth Science and Disaster Prevention (NIED, Fukuyama et al., 1998, https://www.fnet.bosai.go.jp/top.php, last access: April 2021) and the Institute of Earth Sciences, Academia Sinica (ASIES, http://www.earth.sinica.edu.tw/, last access: April 2021, Kao et al., 1998; Kao and Jian, 1999). In addition, in the last ∼20 years there has been an increase in the agencies reporting Mw to the ISC, particularly in the Americas. In the following sections, we look in more detail at the agencies reporting Mw to the ISC first at global scale and then the ones operating at regional scale.
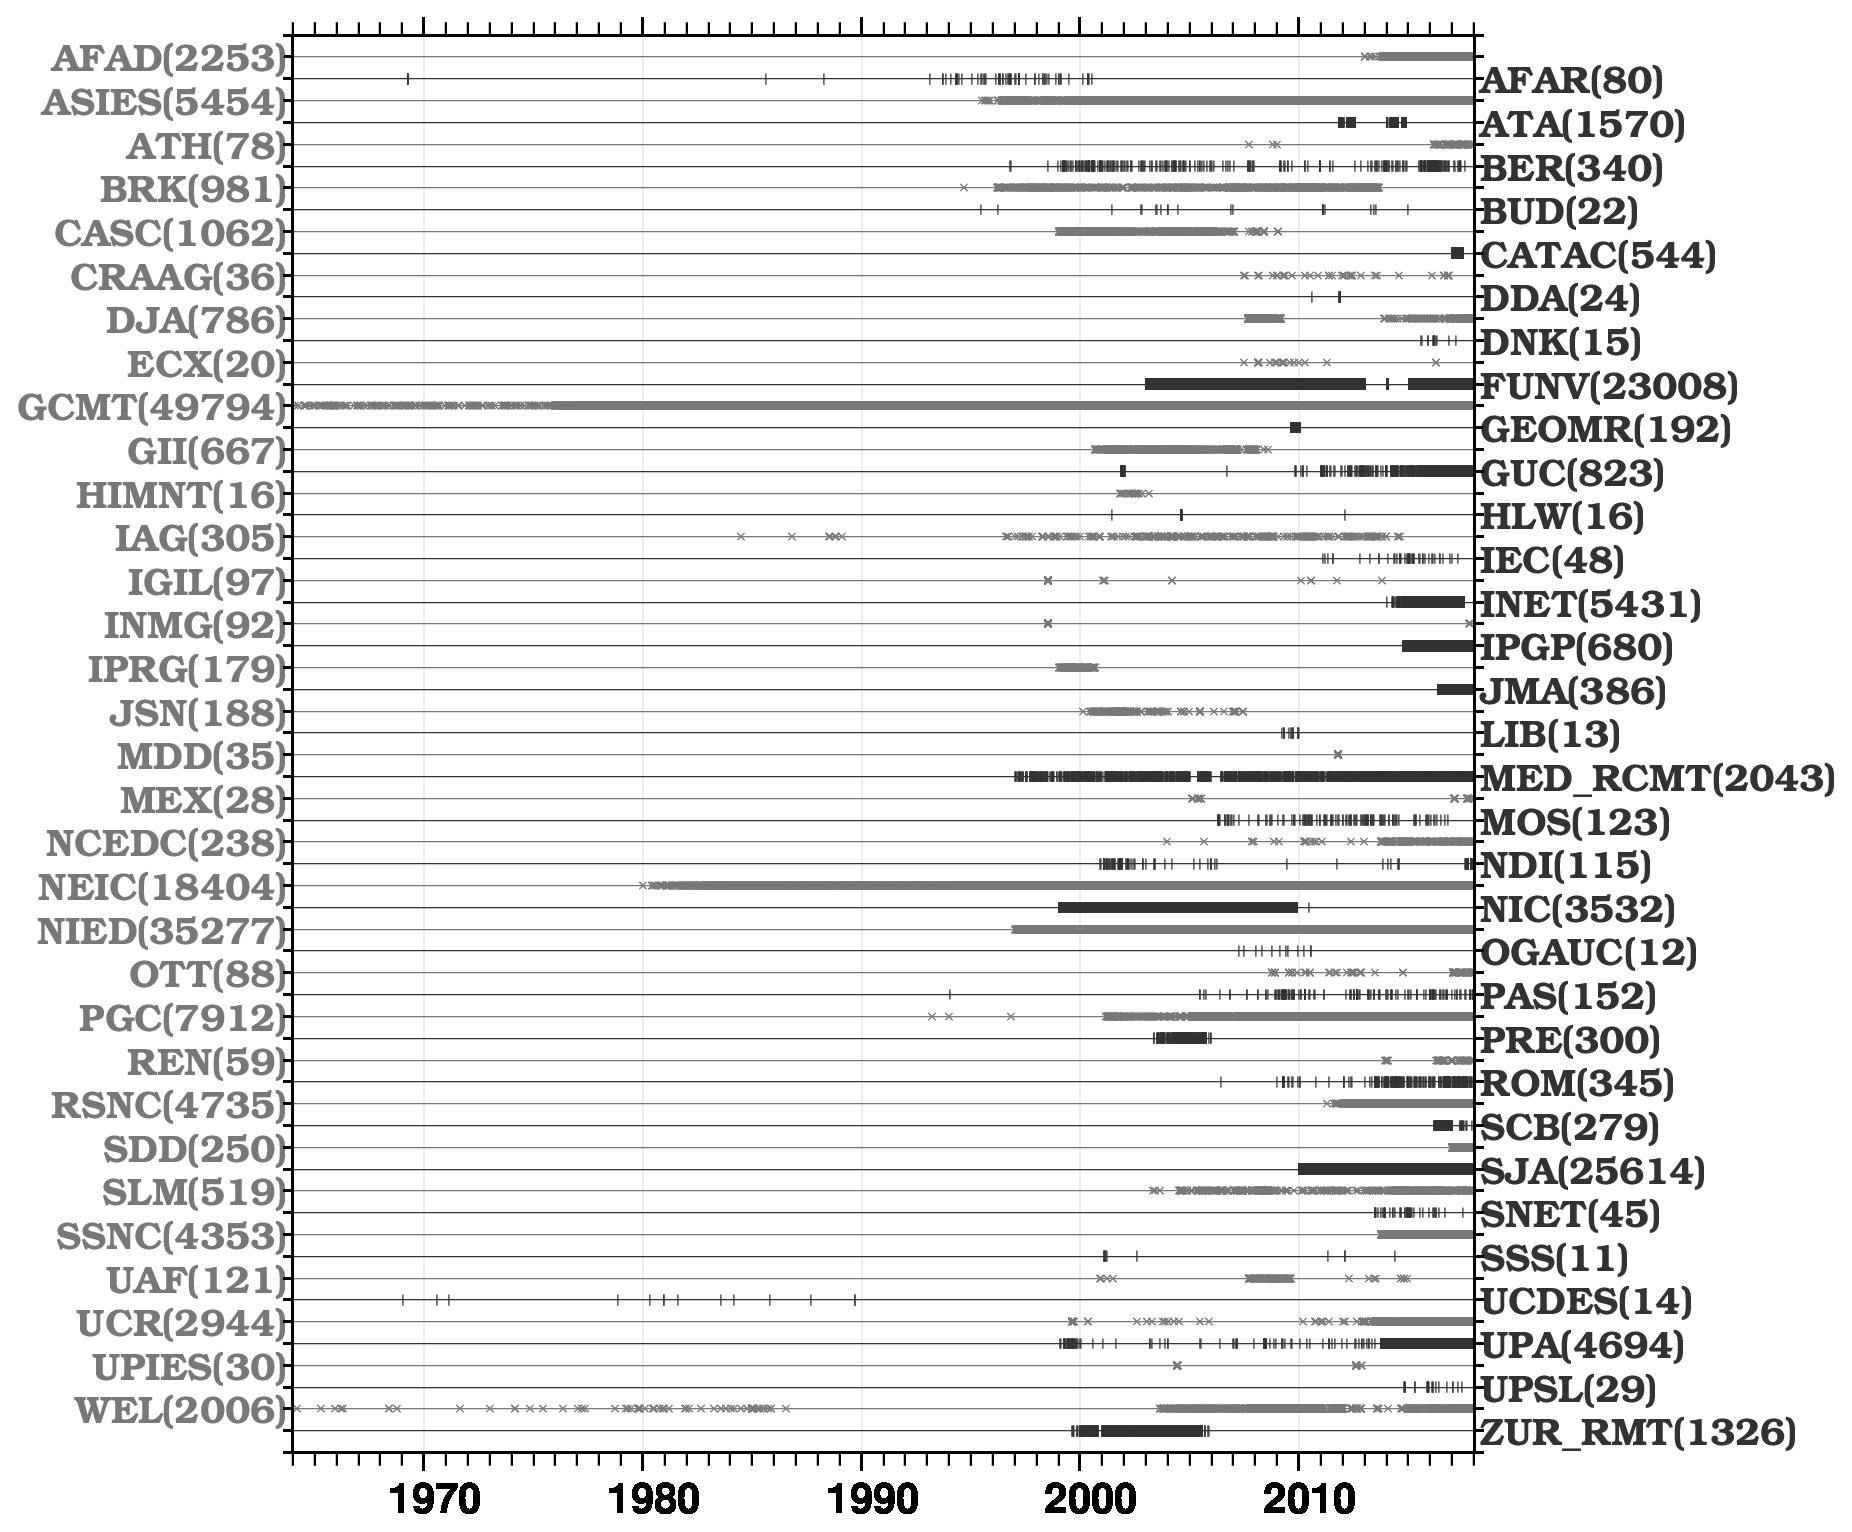
Figure 1Timelines of the agencies contributing with Mw to the ISC Bulletin. Details about each agency's code can be found by typing the agency code at http://www.isc.ac.uk/iscbulletin//agencies/ (last access: May 2021). Each symbol represents the origin time of an earthquake, and in brackets is the total number of Mw for an agency. For better visibility, grey and black text and symbols refer to the agencies listed on the left and on the right, respectively. Note that 25 Mw authors with fewer than 10 entries have been skipped from the DH Mw List.
2.1 Mw from global agencies
The two long-running agencies reporting Mw systematically to the ISC for earthquakes occurring anywhere in the world are GCMT and NEIC. In addition, after the great Sumatra earthquake of 26 December 2004, many agencies developed fast procedures to compute Mw soon after earthquake occurrence. Hence, other agencies also started computing Mw for global earthquakes. Among such agencies, the Institut de Physique du Globe de Paris (IPGP, http://www.ipgp.fr/, last access: April 2021, Vallée et al., 2010; Vallée, 2013) started to report to the ISC. In the following, we give a brief summary of the Mw contribution to the ISC Bulletin of these agencies. Our aim is not to assess the magnitude of completeness of the Mw reporters but simply to highlight their main features.
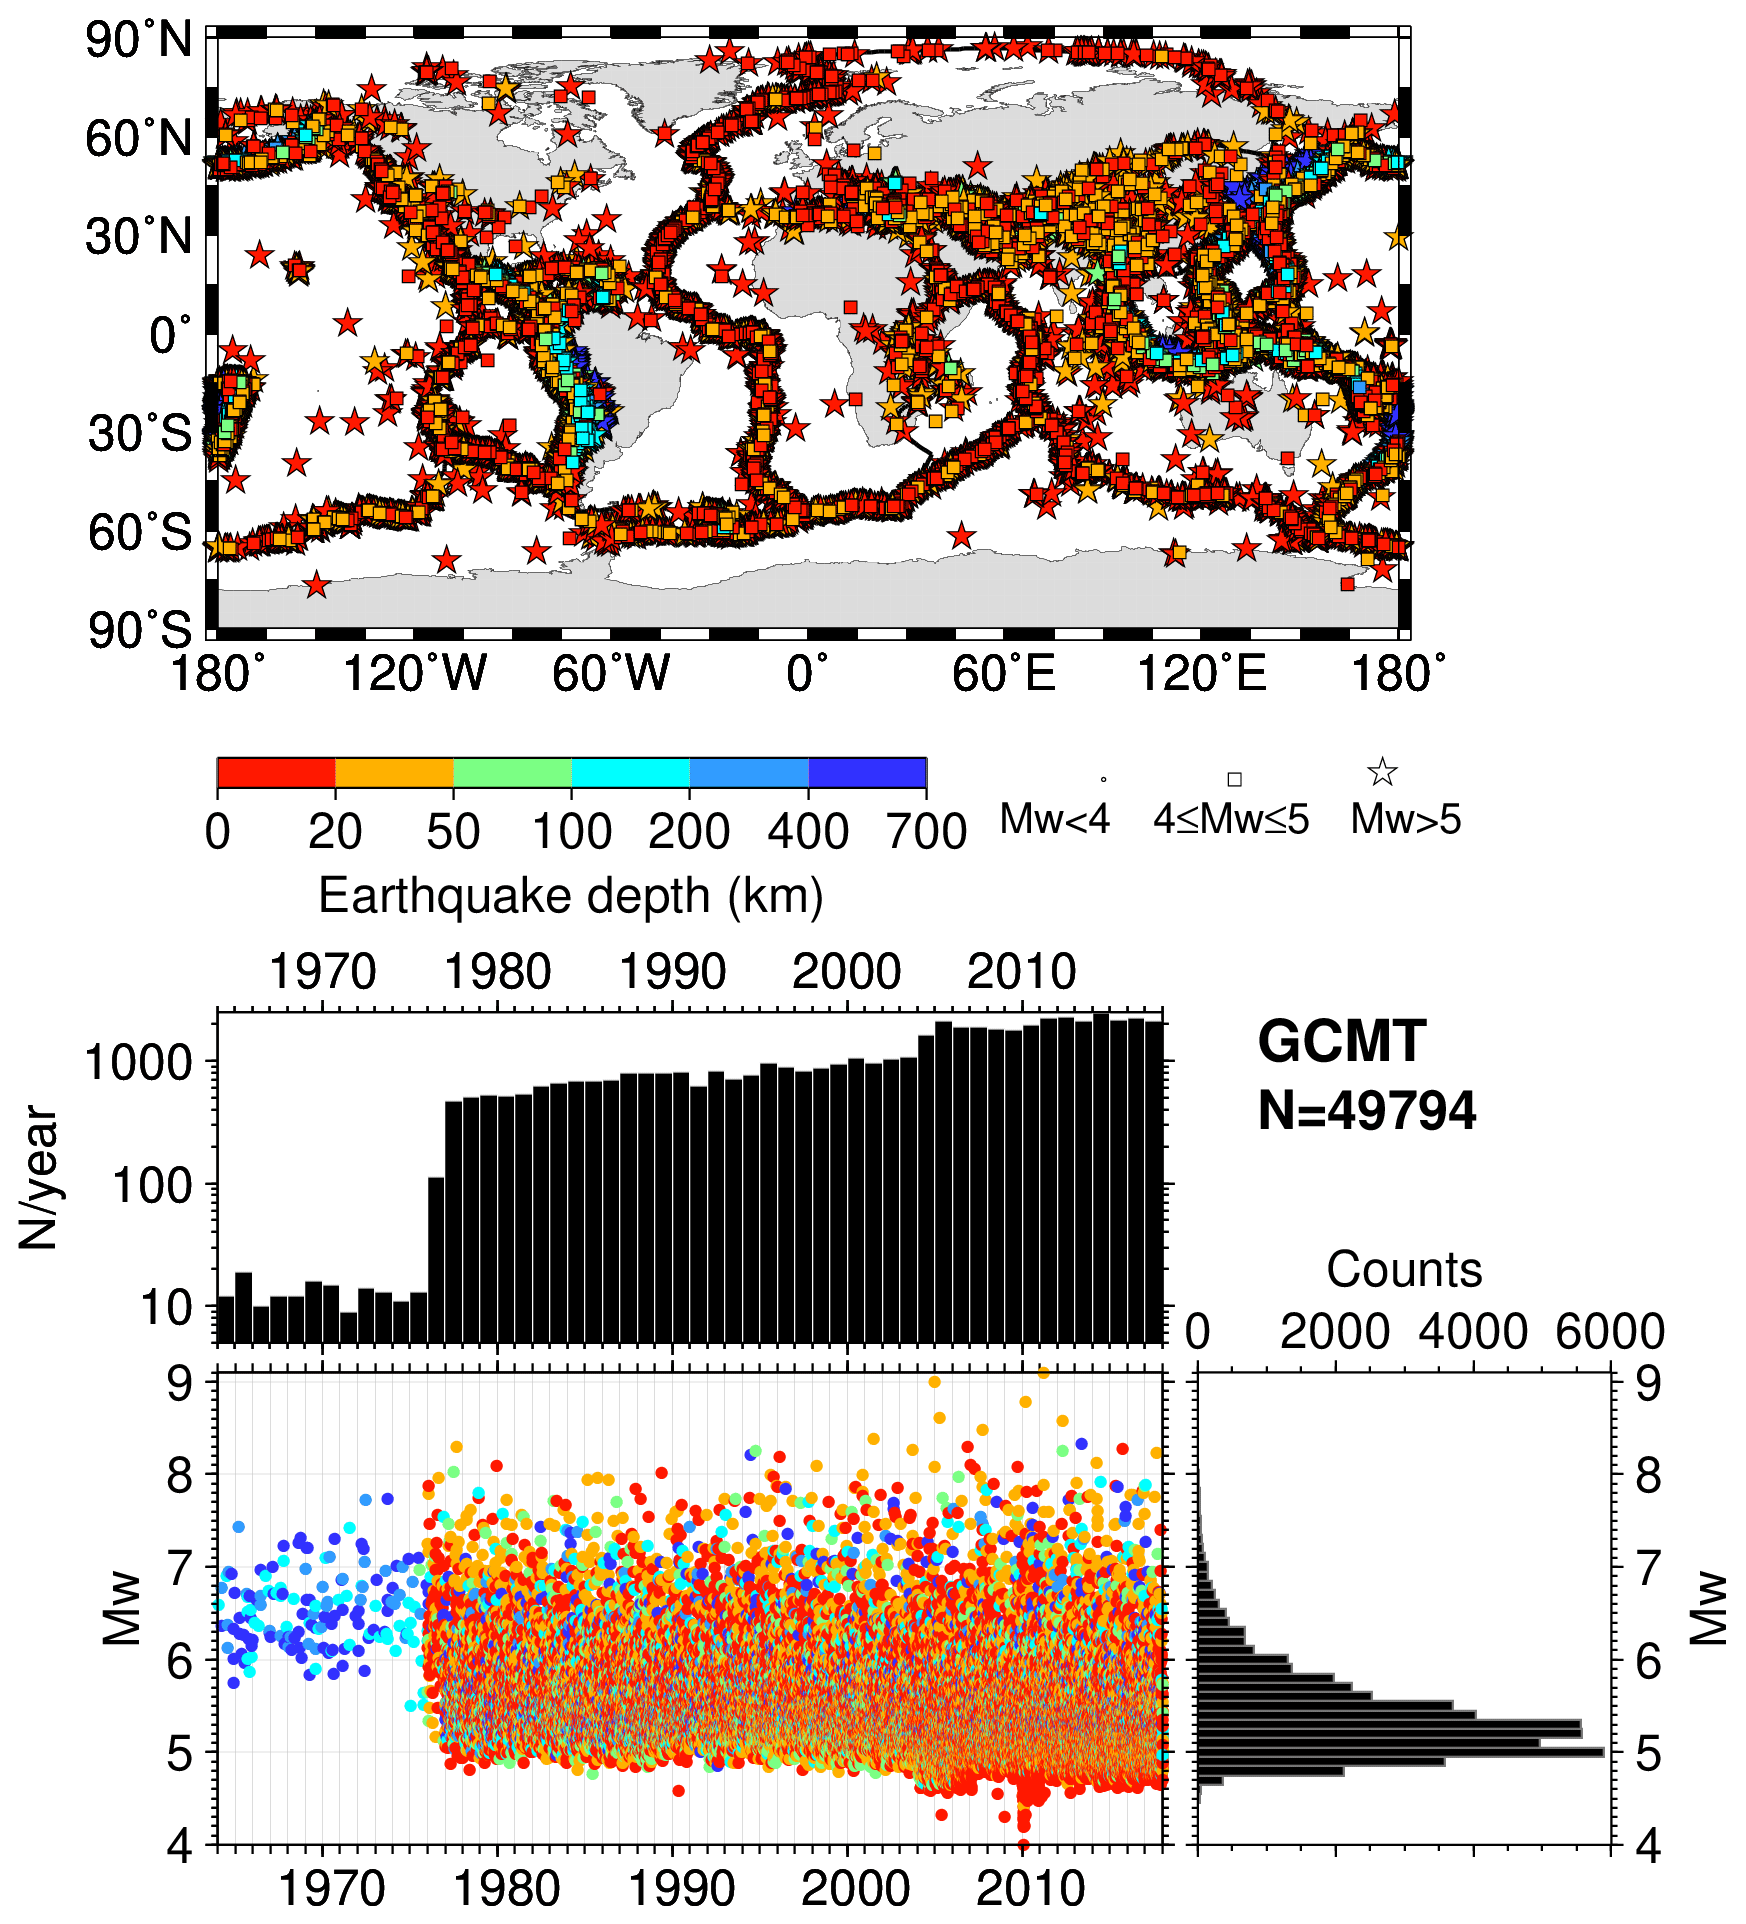
Figure 2Map (top) showing the GCMT centroid location colour-coded by depth. Stars are earthquakes with Mw greater than 5, squares are between 4 and 5, and small circles are below 4. Although not visible here, the map also includes the Bird (2003) plate tectonic boundaries. The lower panel shows the Mw timeline with symbols colour-coded by depth, along with histograms on the right-hand side and the number of earthquakes per year on top of the timeline. Only results of special studies for deep (Huang et al., 1997) and intermediate-depth (Chen et al., 2001) earthquakes are available before 1976. The map was drawn using the Generic Mapping Tools (GMT) (Wessel et al., 2013) software.
Seismologists are very familiar with the Mw provided by GCMT, and its use is quite common in scientific literature (see, e.g. Yoder et al., 2012, for an assessment of GCMT completeness). Its formal start is in 1976, and it was initiated by Harvard University, USA (Dziewonski et al., 1981). Since summer 2006 the GCMT project has been operated at the Lamont-Doherty Earth Observatory of Columbia University (Ekström et al., 2012). Figure 2 is a summary plot showing the GCMT centroid locations, along with the timeline, magnitude histograms, and the number of events per year. We will show such a plot for different agencies to summarize the time and spatial coverage of an agency and the Mw range. The GCMT solutions pre-1976 are only for deep (Huang et al., 1997) and intermediate-depth (Chen et al., 2001) earthquakes, and from 1977 to 2004 they contain mostly earthquakes with Mw 5.0 and above. From 2004–2005 GCMT also computed moment tensors and Mw for earthquakes down to 4.5 or even lower, as obtained from special studies (see Nettles and Hjörleifsdóttir, 2010, and further references at https://www.globalcmt.org/Events/, last access: April 2021). Due to its long-term and highly homogenous solutions, GCMT is considered the most authoritative Mw agency for earthquakes worldwide and used as the reference magnitude in many seismological studies.
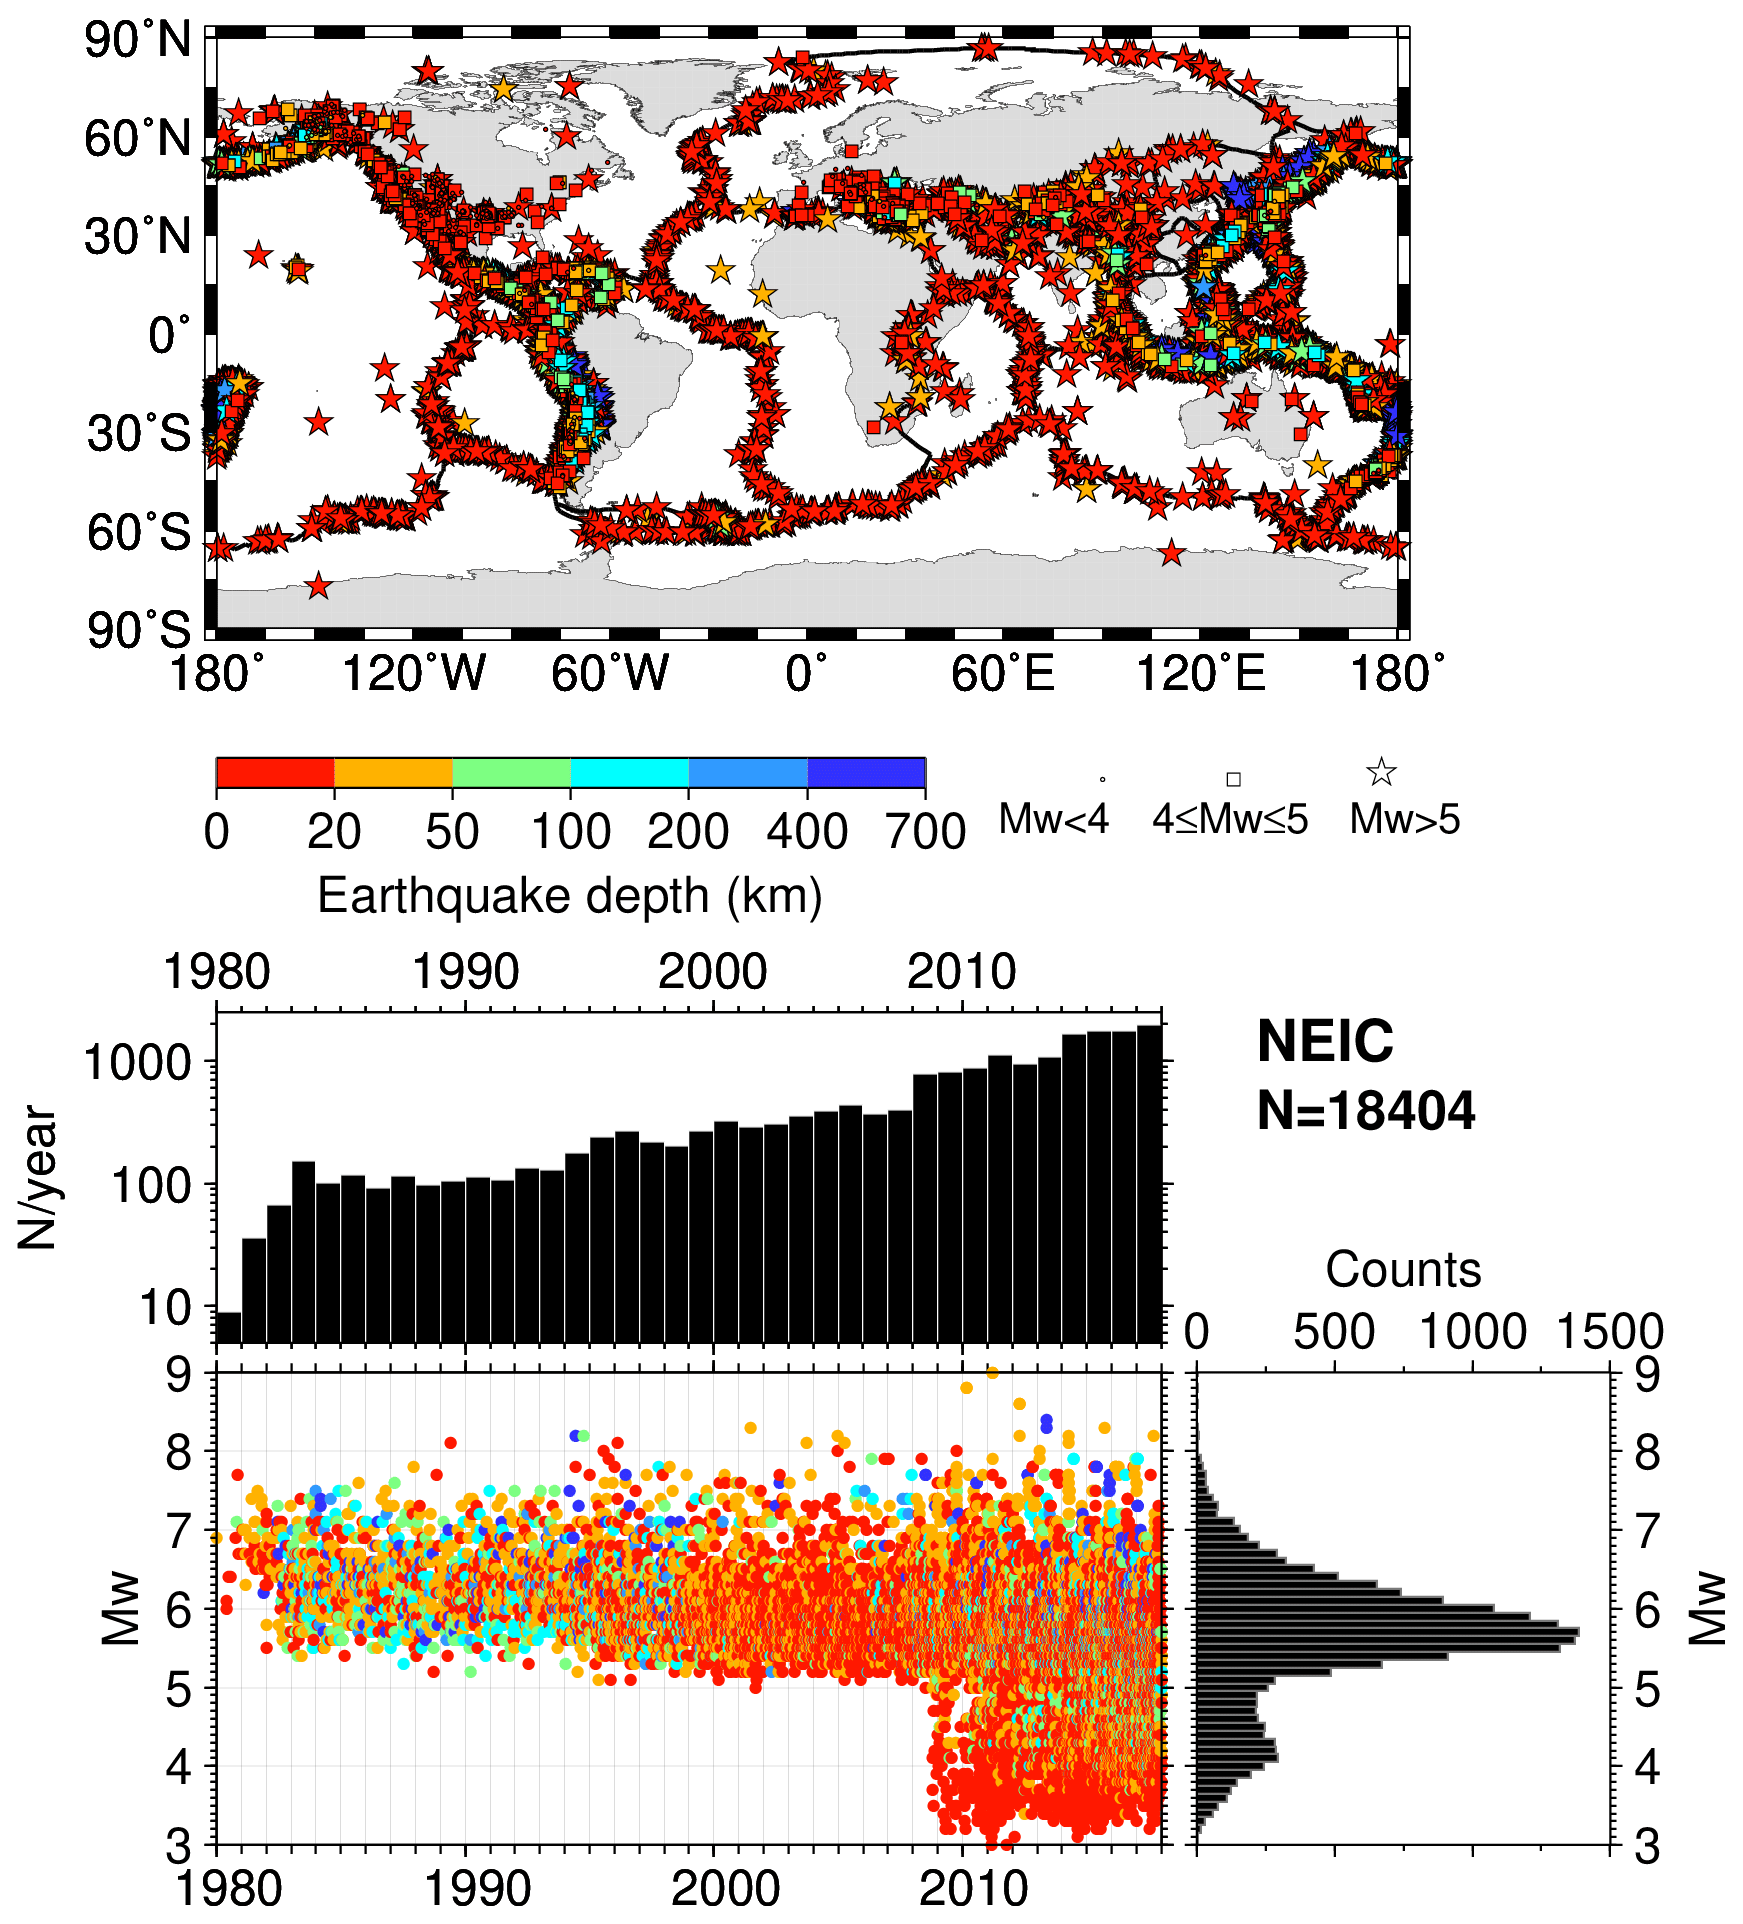
Figure 3The same as Fig. 2 but for NEIC. Note that NEIC may compute more than one Mw per earthquake; hence, the number of Mw reported in the figure here refers to number of Mw entries (number of earthquakes = 14 337). See the text for details. The map was drawn using the Generic Mapping Tools (GMT) (Wessel et al., 2013) software.
Soon after the earthquake occurrence and before the final GCMT solution is available, however, the Mw solution of the NEIC, IPGP, and others are often used as the reference estimation of an earthquake magnitude. Figure 3 shows the summary of the NEIC Mw available in the ISC Bulletin up to 2017. It has to be pointed out that currently the NEIC may obtain Mw using different approaches: the Mww (Hayes et al., 2009) from W-phase (Kanamori, 1993) inversion; the Mwb from body-wave inversion (based on Ammon et al., 1998, and expanded for teleseismic distances); the Mwc from long-period surface wave inversion (see Polet and Thio, 2011, and references therein). In addition, NEIC bulletins may also include the Mwr from different contributors as obtained from the inversion of regional recordings (see the Mwr section at https://earthquake.usgs.gov/data/comcat/#prods, last access: May 2021). The Mw from NEIC does not specify the type for earthquake data prior to August 2013 in the ISC Bulletin. Appendix A contains the summary plots from August 2013 for Mww (Fig. A1), Mwb (Fig. A2), Mwc (Fig. A3), and Mwr (Fig. A4). Figure 3 shows that the NEIC Mw solutions increase in number over the years, particularly over the last 10 years. This is mostly due to the inclusion of Mwr (Fig. A4) from different contributors, with Mwr available even for earthquakes down to magnitude 3. Differently from the regional contributors that we consider in Sect. 2.2, Mwr NEIC is not restricted to a well-defined region, as it is available for earthquakes in the Americas, Euro-Mediterranean area, parts of Asia, and the Pacific ocean.
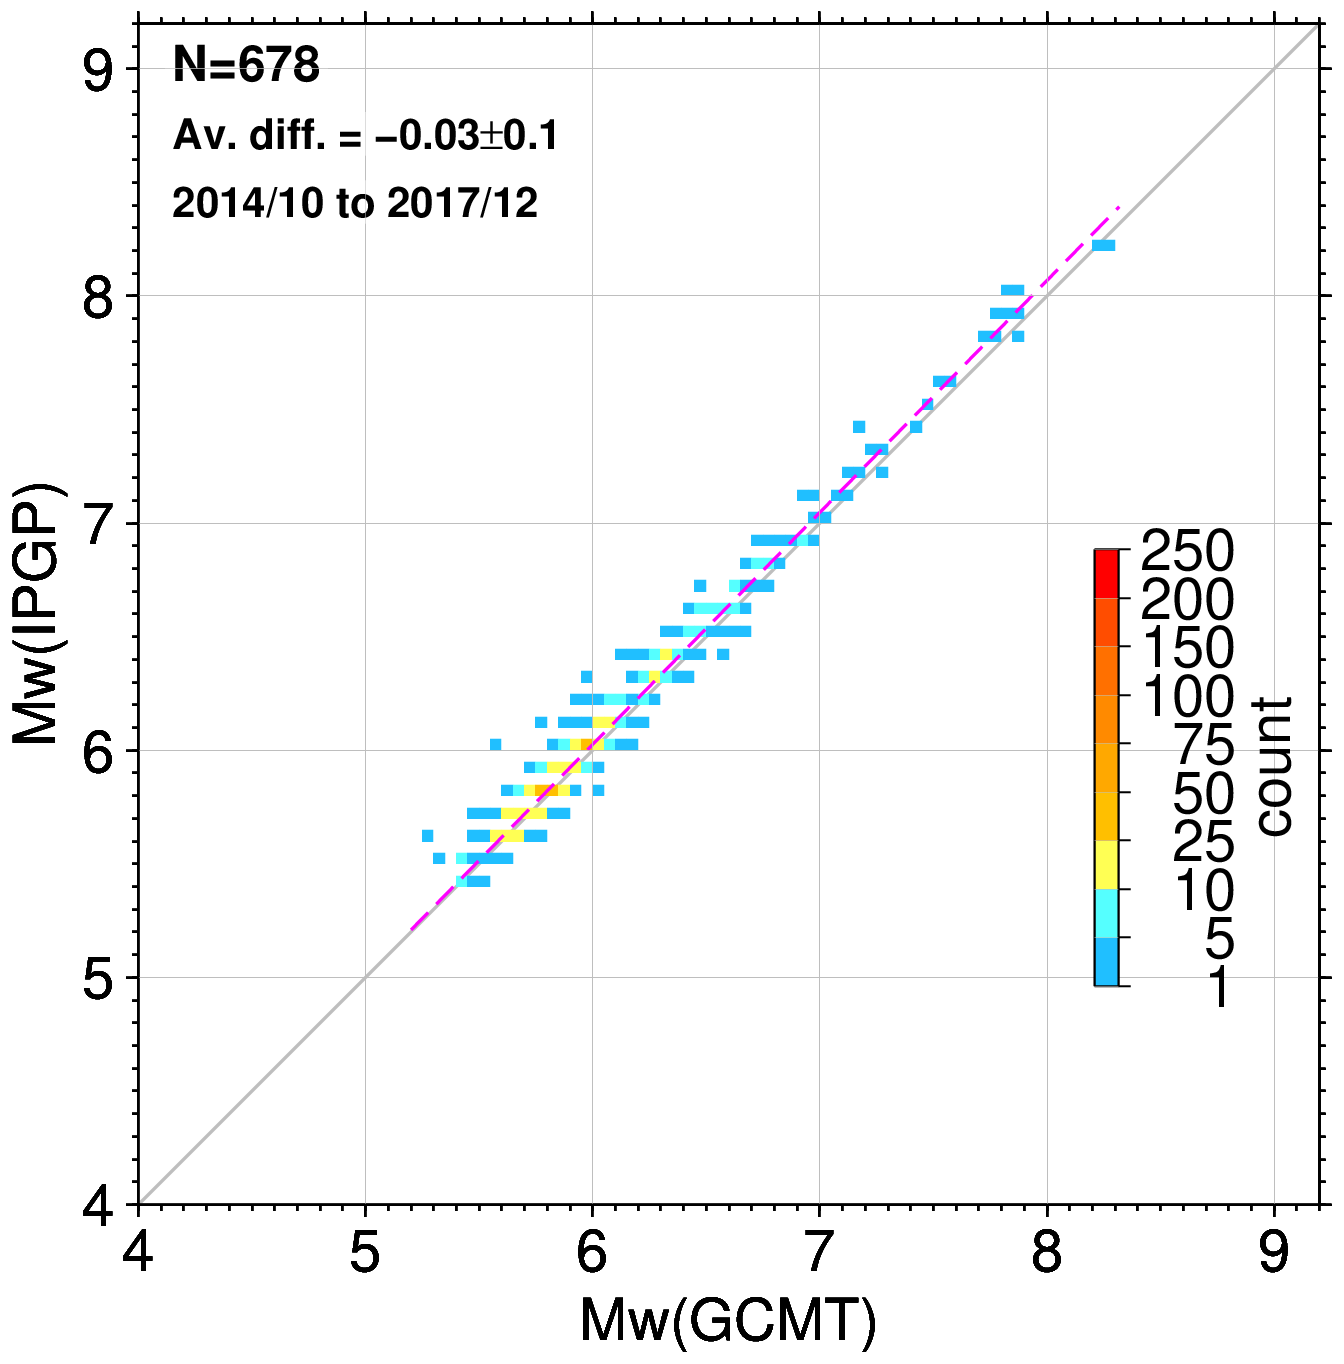
Figure A5 in Appendix A shows the summary plots for IPGP, which reports earthquakes with magnitude 5.8 and above, predominantly from subduction zones. The comparison between Mw from GMCT, NEIC, and IPGP will be discussed in Sect. 3.
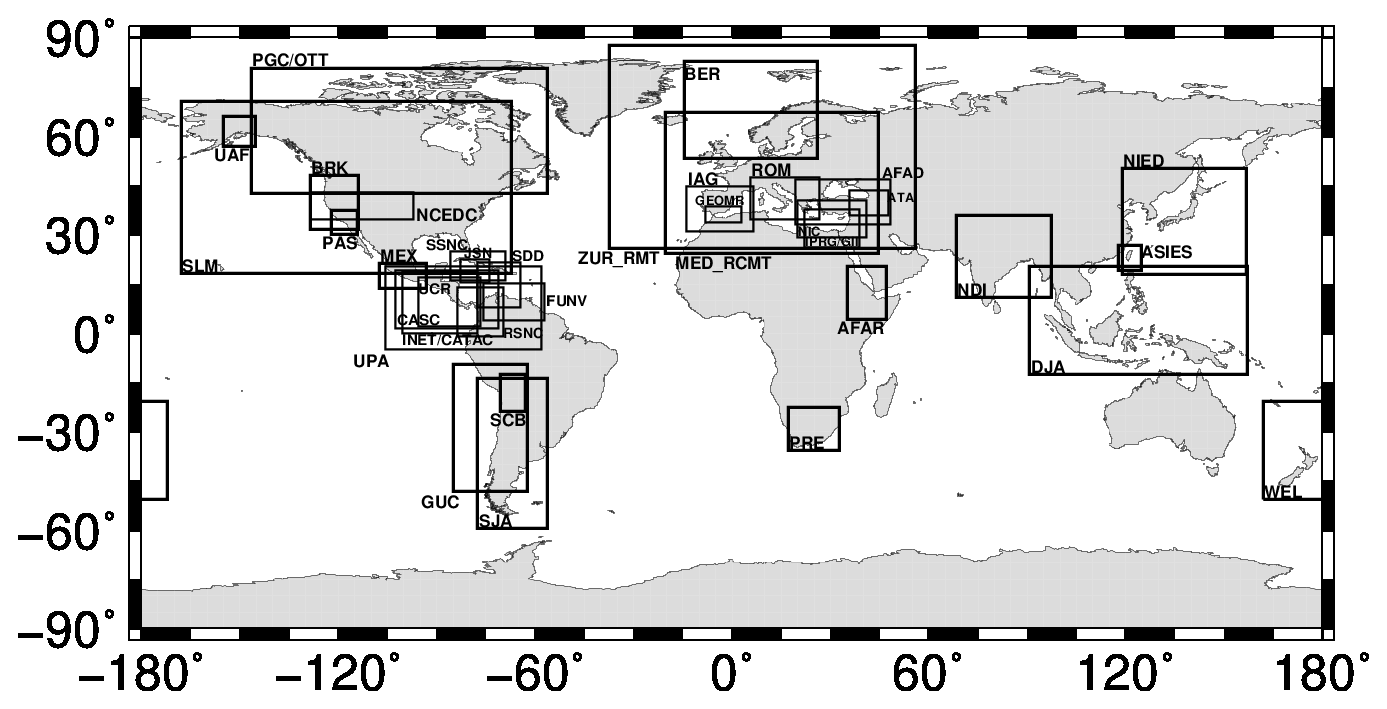
Figure 4Overview of the agencies reporting Mw to the ISC at regional scale. For simplicity, only agencies with at leat 100 Mw entries are shown (including agencies not reporting; see Fig. 1). Furthermore, JMA is not shown here as it covers the same region of NIED but only starting from 2016. The bounding boxes are retrieved from the hypocentres included in the DH Mw List and are not meant as limits of the area monitored by an agency. The boxes are drawn to highlight the regions where Mw is available from one or more agencies and areas where Mw is available in the ISC Bulletin only from global agencies (e.g. vast parts of Asia, Australia, and Africa). The map was drawn using the Generic Mapping Tools (GMT) (Wessel et al., 2013) software.
2.2 Mw from regional agencies
At regional scale several agencies report Mw during different periods (Fig. 1) and in different parts of the world (Fig. 4). The bounding boxes of Fig. 4 are drawn from the hypocentres included in the DH Mw List and are not meant as limits of the area investigated by an individual agency. For the sake of brevity we do not include summary plots for each agency here (as shown in Fig. 2), but we give priority to major regional contributors that are currently active. However, readers interested in reproducing the summary plot for a specific agency or magnitude author can use the DH Mw List and the script available in Di Giacomo and Harris (2020). More details to this end are given in Sect. 6.
In North America, the major regional reporters to the ISC include the Canadian Hazards Information Service, Natural Resources Canada (agencies PGC and OTT, http://www.earthquakescanada.nrcan.gc.ca/index-eng.php, last access: April 2021, Fig. A6), the University of Alaska (UAF, http://www.uaf.edu/geology/research/seismology-geodesy/, last access: April 2021), and, via NEIC reports, Saint Louis University (SLM, http://www.eas.slu.edu/Department/department.html, last access: April 2021, Herrmann et al., 2011), Berkeley Seismological Laboratory (BRK and NCEDC, http://seismo.berkeley.edu/seismo/, last access: April 2021, hereafter referred to as BRK/NCEDC), California Institute of Technology (PAS, http://www.seismolab.caltech.edu/, last access: April 2021), and the Servicio Sismológico Nacional, Mexico (MEX, http://www.ssn.unam.mx/, last access: April 2021, Pérez-Campos et al., 2019), which resumed reporting Mw in 2017.
In the Caribbean and Central America, among the agencies actively reporting Mw to the ISC are the Instituto Nicaraguense de Estudios Territoriales (INET, http://www.ineter.gob.ni/, last access: April 2021, now reporting as CATAC, http://catac.ineter.gob.ni/, last access: April 2021, Fig. A6), Universidad de Panama (UPA, http://www.geocienciaspanama.org/informacion-general-2, last access: April 2021, Fig. A7), and Universidad de Costa Rica (UCR, http://www.rsn.ucr.ac.cr/, last access: April 2021, Fig. A8).
In South America, major contributors are the Red Sismológica Nacional de Colombia (RSNC, https://www.sgc.gov.co/, last access: April 2021, Fig. A10), Fundación Venezolana de Investigaciones Sismológicas (FUNV, http://www.funvisis.gob.ve/, last access: April 2021, Fig. A11), Centro Sismológico Nacional, Universidad de Chile (GUC, http://www.csn.uchile.cl/, last access: April 2021, Fig. A12) and Instituto Nacional de Prevención Sísmica (SJA, http://www.inpres.gov.ar/, last access: April 2021, Sánchez et al., 2013, Fig. A13).
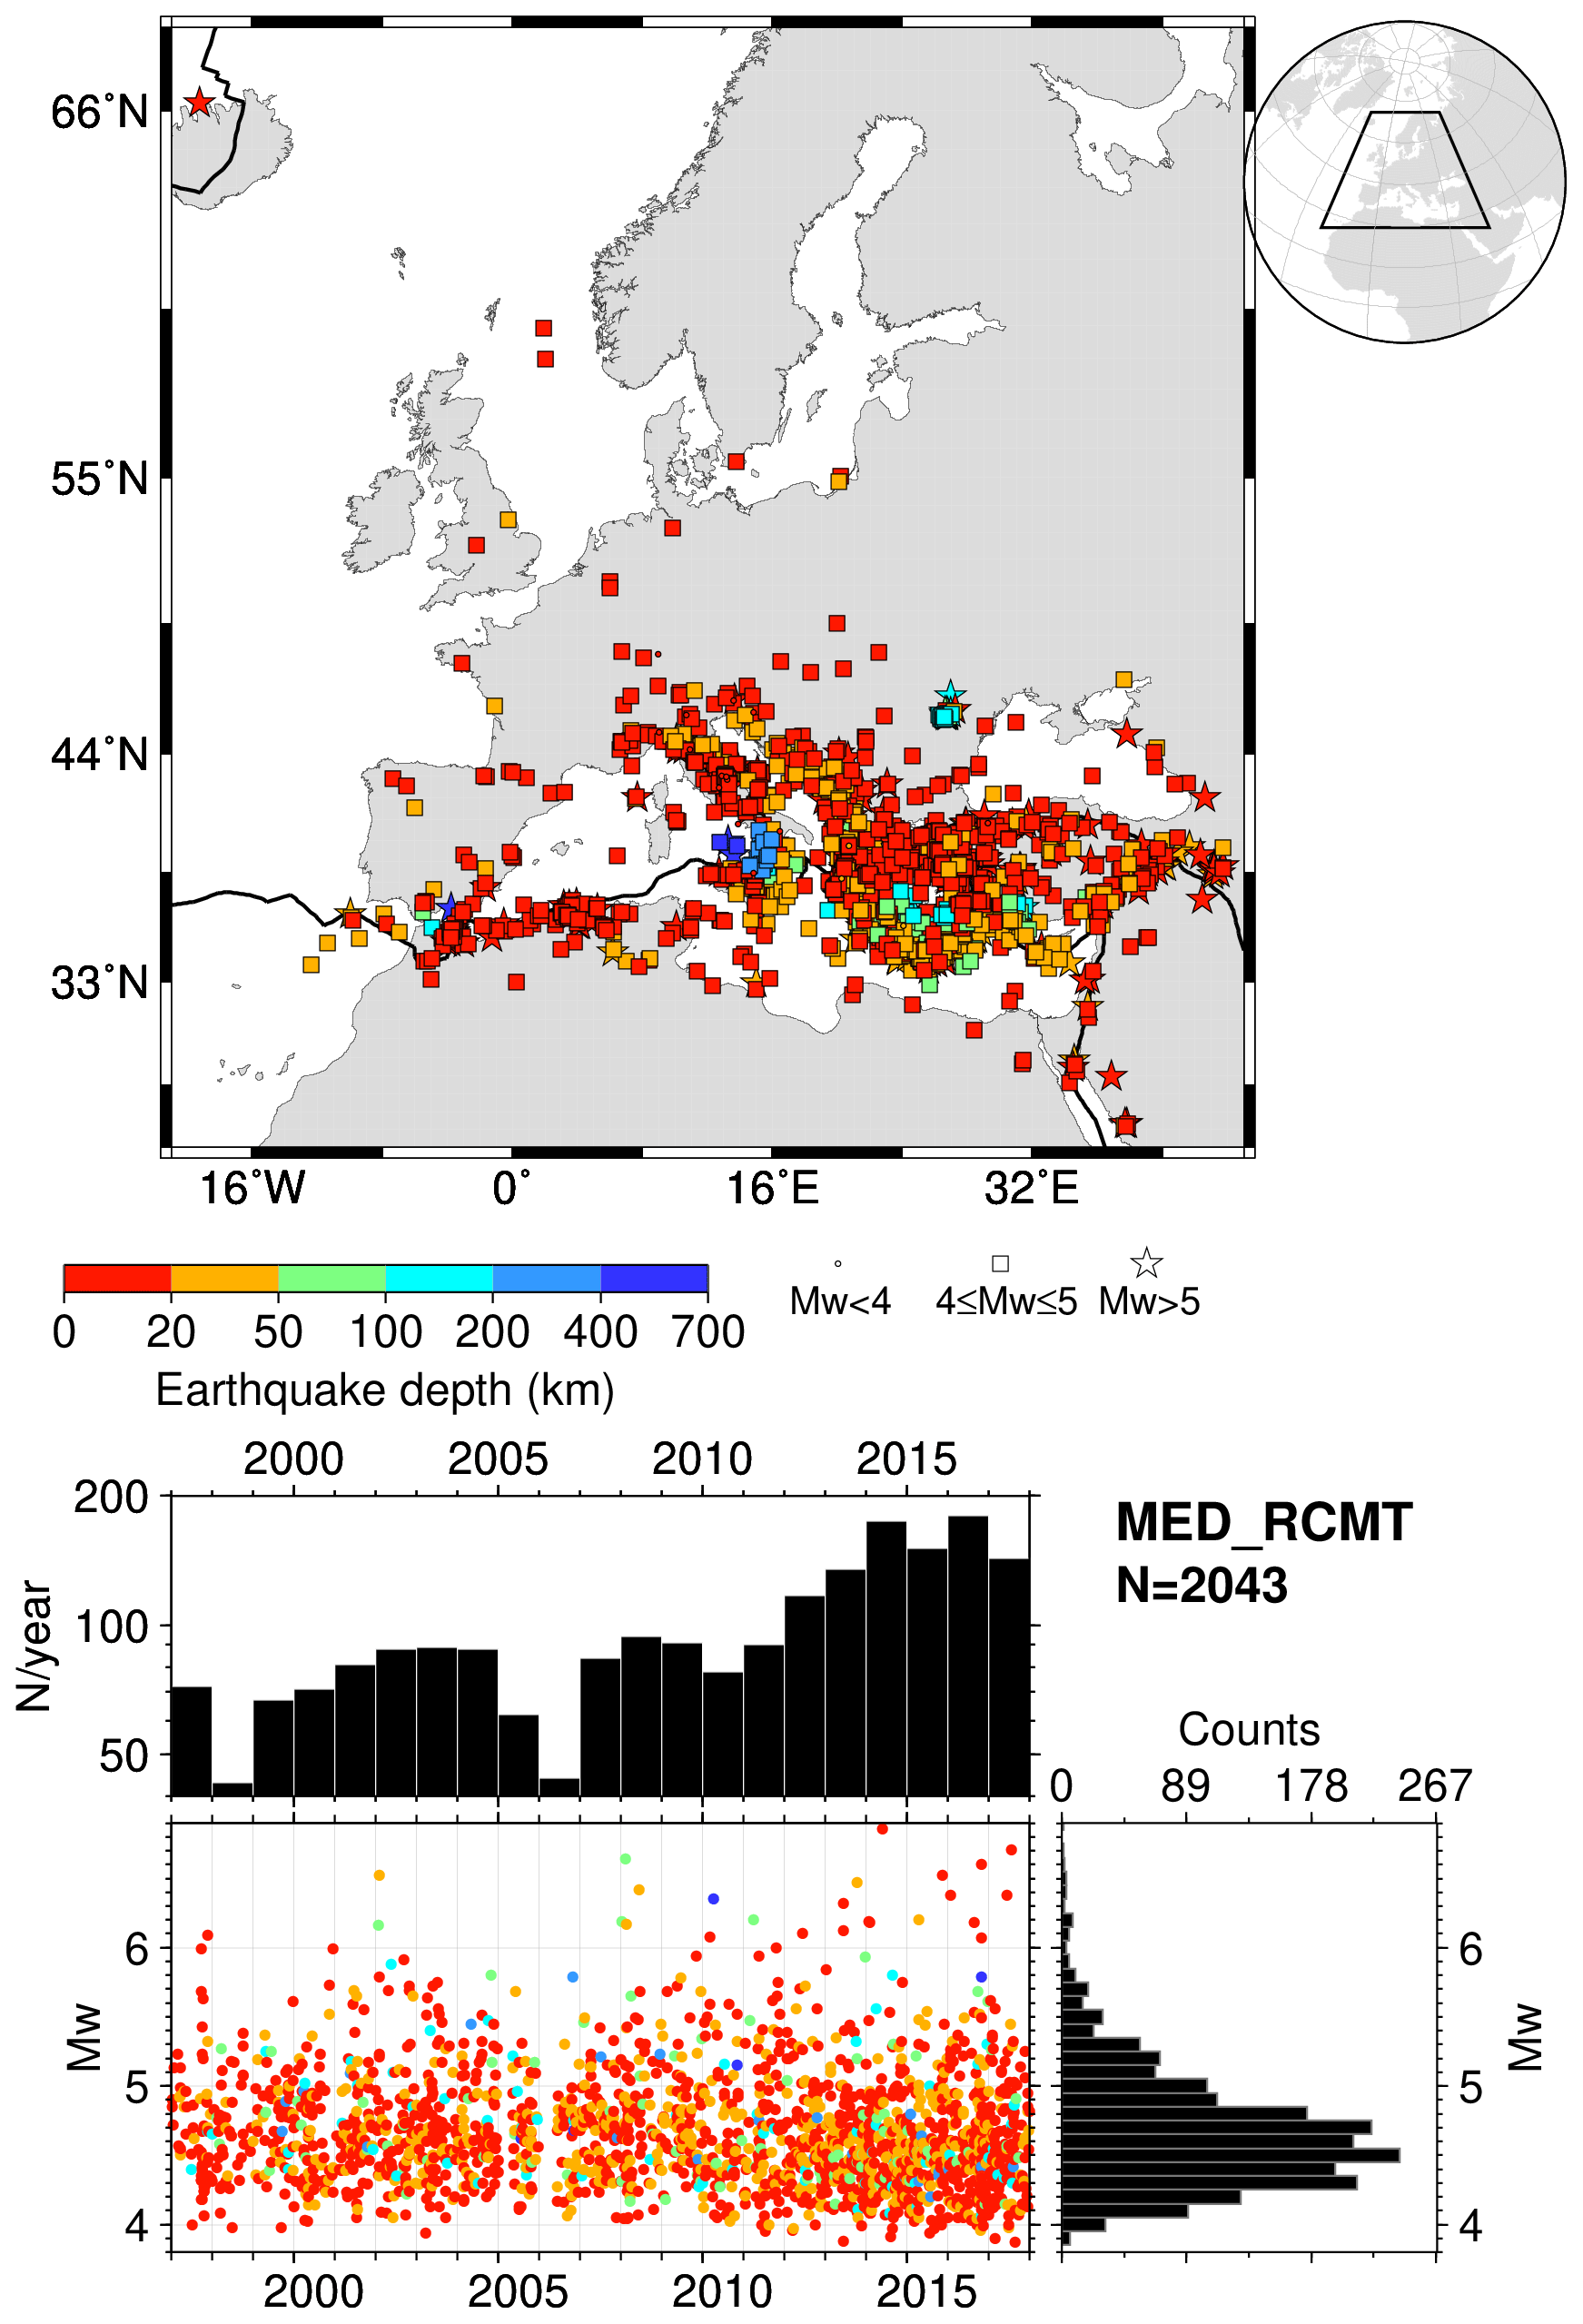
Figure 5The same as Fig. 2 but for MED_RCMT. The map was drawn using the Generic Mapping Tools (GMT) (Wessel et al., 2013) software.
In the Euro-Mediterranean area, several agencies over the years reported Mw to the ISC (not all are shown in Fig. 4). Among the active Mw reporters, the most continuous is the European-Mediterranean Regional Centroid-Moment Tensors (MED_RCMT, http://rcmt2.bo.ingv.it/, last access: April 2021, Pondrelli, 2002, Fig. 5), which largely overlaps both in space and time with currently reporting agencies (AFAD, http://www.deprem.gov.tr/, last access: April 2021, Alver et al., 2019; BER, http://www.geo.uib.no/seismo/, last access: April 2021, Ottemöller et al., 2018; ROM, http://www.ingv.it/, last access: April 2021, Scognamiglio et al., 2006) and other agencies currently not reporting to the ISC (e.g. ZUR_RMT, IPRG and GII, ATA, NIC). The Mw from the Instituto Andaluz de Geofisica (IAG, http://www.ugr.es/~iag/, last access: April 2021, Stich et al., 2003, 2006, 2010; Martín et al., 2015) and GEOMAR (GEOMR, https://www.geomar.de/, last access: April 2021, Grevemeyer et al., 2015) have been included after the Rebuild project of the ISC Bulletin (Storchak et al., 2017, 2020) from results in journal publications.
With the exception of North African earthquakes reported by MED_RCMT, no active regional agency is reporting Mw to the ISC for most of Africa. Past contributions come from the work of Hofstetter and Beyth (2003, and references therein, in the ISC Bulletin under agency AFAR) and the Council for Geoscience in South Africa (PRE, https://www.geoscience.org.za/, last access: April 2021) for 2003–2005.

Figure 6The same as Fig. 2 but for NIED. The map was drawn using the Generic Mapping Tools (GMT) (Wessel et al., 2013) software.

Figure 7The same as Fig. 2 but ASIES. The map was drawn using the Generic Mapping Tools (GMT) (Wessel et al., 2013) software.
In Asia, the two largest and continuous Mw contributors are NIED (Fig. 6) for the Japanese archipelago and ASIES (Fig. 7) for the Taiwan island region. Smaller contributions in terms of Mw come from the National Centre for Seismology (NDI, https://seismo.gov.in/, last access: April 2021) for the Indian subcontinent (Fig. A14) and the Badan Meteorologi, Klimatologi dan Geofisika (DJA, https://www.bmkg.go.id/gempabumi/gempabumi-terkini.bmkg?lang=EN, last access: April 2021, for the Indonesian archipelago (Fig. A15). These last two agencies started to contribute more systematically in August 2017 and January 2017, respectively.
In Oceania, the only regional contributor is the Institute of Geological and Nuclear Sciences (WEL, http://www.gns.cri.nz/, last access: April 2021), mostly for the area surrounding New Zealand's North and South islands (Fig. A16).
Overall, the contribution of regional agencies to the ISC is important for expanding the Mw data for earthquakes not usually considered by global agencies (i.e. about magnitude 5 and below). We have seen that regional agencies can cover anything from relatively small areas (e.g. BRK/NCEDC, PAS, UAF) to larger ones (e.g. NIED, SLM, SJA, MED_RCMT) and that from a temporal point of view many more regional agencies started computing Mw in the last 10–20 years, although gaps are present and some agencies stopped reporting or are no longer active.
In the context just described, we give special attention in the following sections to NIED and ASIES in Asia, MED_RCMT in the Euro-Mediterranean region, and the above-mentioned agencies in the Americas that currently report Mw to the ISC.
In this section we show the comparisons between Mw GCMT (as the most homogenous and long-running agency for global earthquakes) with NEIC and selected regional agencies. The aim of such comparisons is to show the variability in Mw estimates for global and regional events. The figures shown in the following also include the orthogonal regression (e.g. Bormann et al., 2007, and references therein). The regression results from this work are not meant to be used as authoritative formulas for magnitude conversions but are only shown for guidance to highlight similarities and/or the most significant differences in the magnitude comparisons shown here.
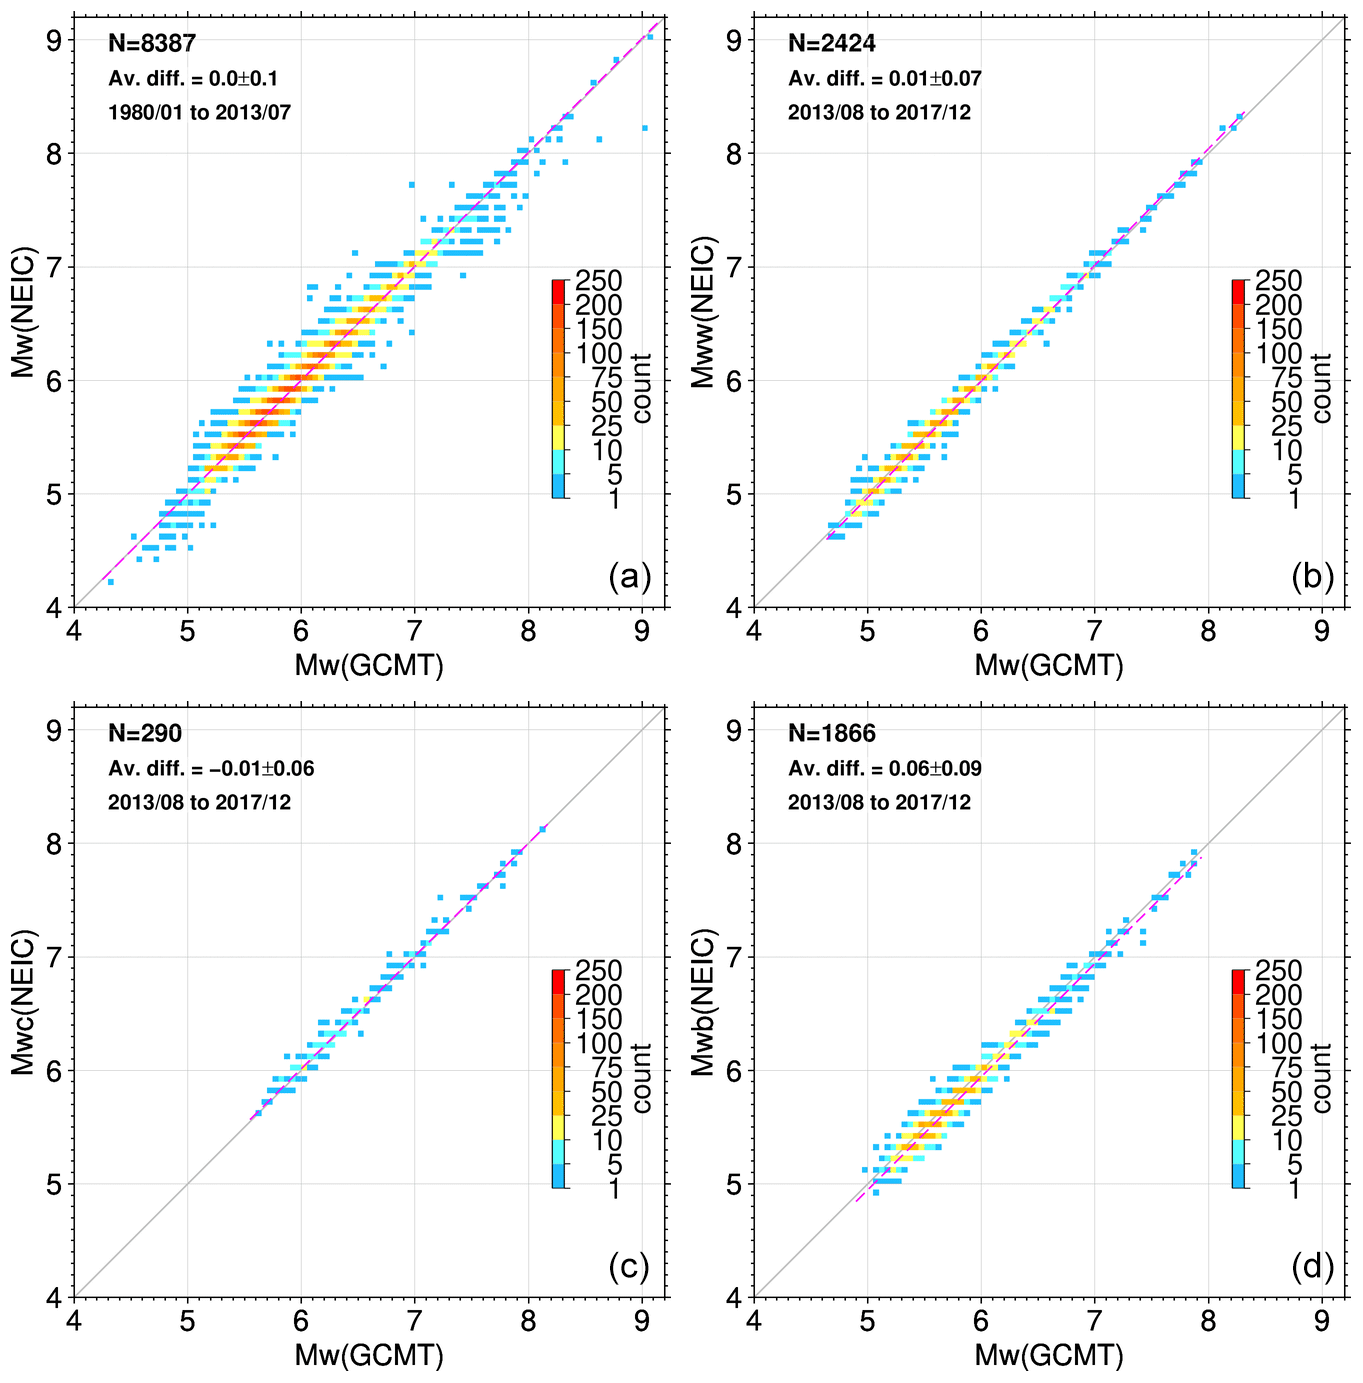
Figure 8Comparison between Mw from GCMT and generic Mw NEIC for 1980–2013/07 (a) and Mww (b), Mwc (c), and Mwb (d) for the period August 2013–December 2017. The comparison of Mw GCMT with Mwr NEIC is shown in Sect. 3.3.6. The distributions are shown as a colour-coded data frequency for 0.1×0.1 m.u. cells. The dashed magenta line represents the orthogonal regression (e.g. Bormann et al., 2007; Lolli and Gasperini, 2012, and references therein). The total number of data points, average differences (Mw GCMT − Mw NEIC), and standard deviations, as well as the period covered, are reported in the top-left corner of each subplot.
3.1 Mw GCMT and Mw NEIC
As shown in Sect. 2, NEIC can report different types of Mw: Mww, Mwb, Mwc, and Mwr. However, only from August 2013 onwards do reports from NEIC specify the procedure used to obtain Mw. For this reason, we compare Mw GCMT and NEIC before August 2013 (generic Mw) and from August 2013 for NEIC Mww, Mwc and Mwb (Fig. 8). The comparison with Mwr will be included in Sect. 3.3.6. Overall, the agreement between GCMT and NEIC Mw is very good, both in the period 1980–2013/07 and 2013/08–2017, as the average difference is within 0.1 magnitude units (m.u.), with 0.1 standard deviation. However, some features can still be seen, as already pointed out by Gasperini et al. (2012). Indeed, Fig. 8 shows how GCMT and NEIC agree well particularly in the magnitude range 5 to 7, whereas GCMT, with a few exceptions, is marginally larger than NEIC for earthquakes below 5 and above 7. In recent years, however, Fig. 8 shows how NEIC and GCMT Mw fit each other very well, particularly with NEIC's Mww, Mwc, and Mwb.
3.2 Mw GCMT and Mw IPGP
Figure A17 shows the comparison between Mw from GCMT and IPGP. The Mw from IPGP shows slightly larger values than GCMT, sometimes by up to 0.4 m.u. However, IPGP in general follows GCMT well along the 1:1 line and is confirmed to be an important asset for the community when it comes to rapidly assessing Mw.
3.3 Mw GCMT and Mw from regional agencies
Since the Mw from global agencies shows very good agreement at global level, here we use the authoritative Mw from GCMT for the comparisons with Mw from regional agencies. We consider Mw from active agencies in the Americas (North America, Central America, and South America), the Euro-Mediterranean area, and the areas around Japan (agency NIED) and Taiwan island (agency ASIES). Finally, we give a quick overview for other agencies, excluding the Caribbean (SDD, JSN, SSNC) that have insufficient data to create comparisons with GCMT and mb and MS from the ISC.
As GCMT provides Mw mostly for earthquakes with magnitude 5.0 and above (see Fig. 2), the Mw shown in the following comparisons are mostly for moderate (i.e. Mw between 5 and 6) and larger earthquakes. The comparisons shown here also serve to establish a hierarchy in the preference of regional agencies when there are spatial overlaps, such as in Central America (see Fig. 4). We will make use of such preferences in Sect. 5.
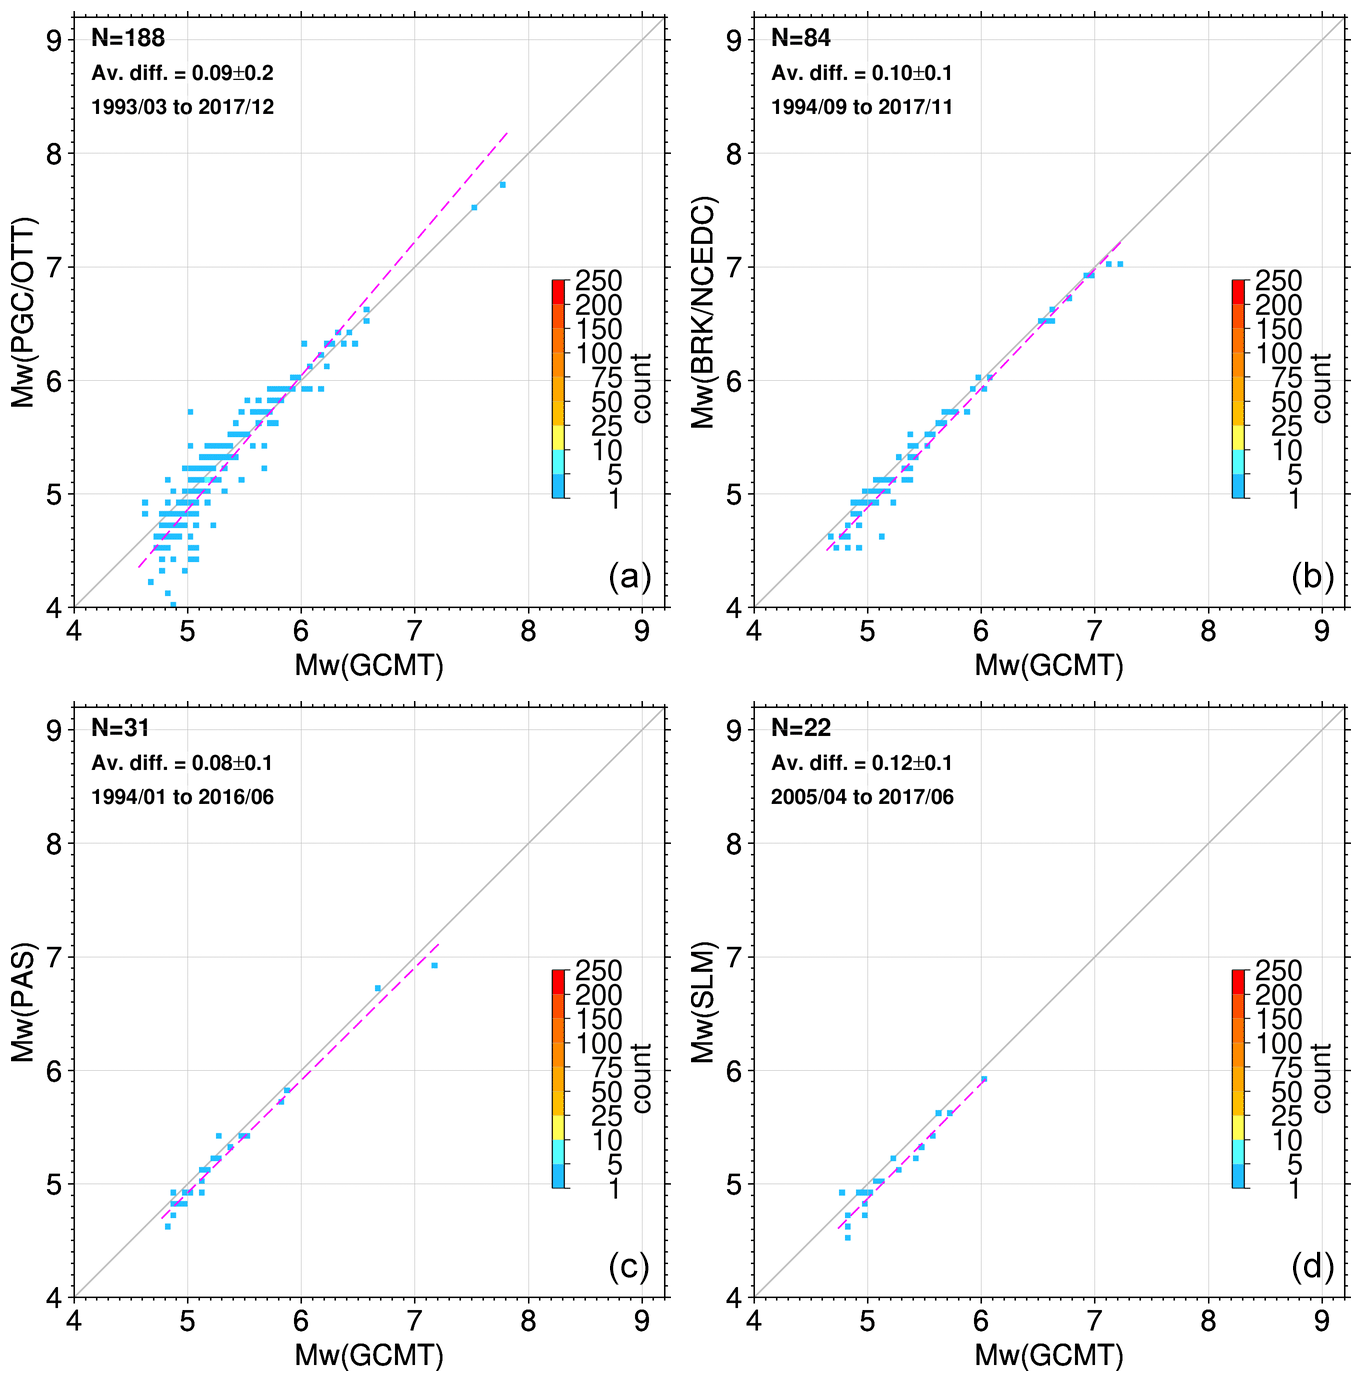
Figure 9The same as Fig. 8 but for GCMT and PGC/OTT (a), GCMT and BRK/NCEDC (b), GCMT and PAS (c), and GCMT and SLM (d).
3.3.1 North America
Among the regional agencies reporting Mw to the ISC in North America (Fig. 4), we show the comparisons with Mw GCMT for agencies PGC/OTT, BRK/NCEDC, PAS, and SLM. All of those agencies use regional waveform inversion methodologies (Table 1). We do not consider UAF and MEX in this section as we have only a few events in common with GCMT in the DH Mw List. Figure 9 shows that Mw GCMT is overall marginally (about 0.1 m.u.) larger than Mw given by North American agencies. Agencies PAS and BRK/NCEDC show a good agreement with GCMT as the orthogonal regression closely follows the 1:1 line, albeit with an average difference of about 0.1 m.u., whereas for PGC/OTT the scatter is larger, particularly for moderate earthquakes and below, and SLM seems offset by −0.1 m.u. from GCMT. For North America the regional Mw preference is therefore PAS with BRK/NCEDC, followed by PGC/OTT.
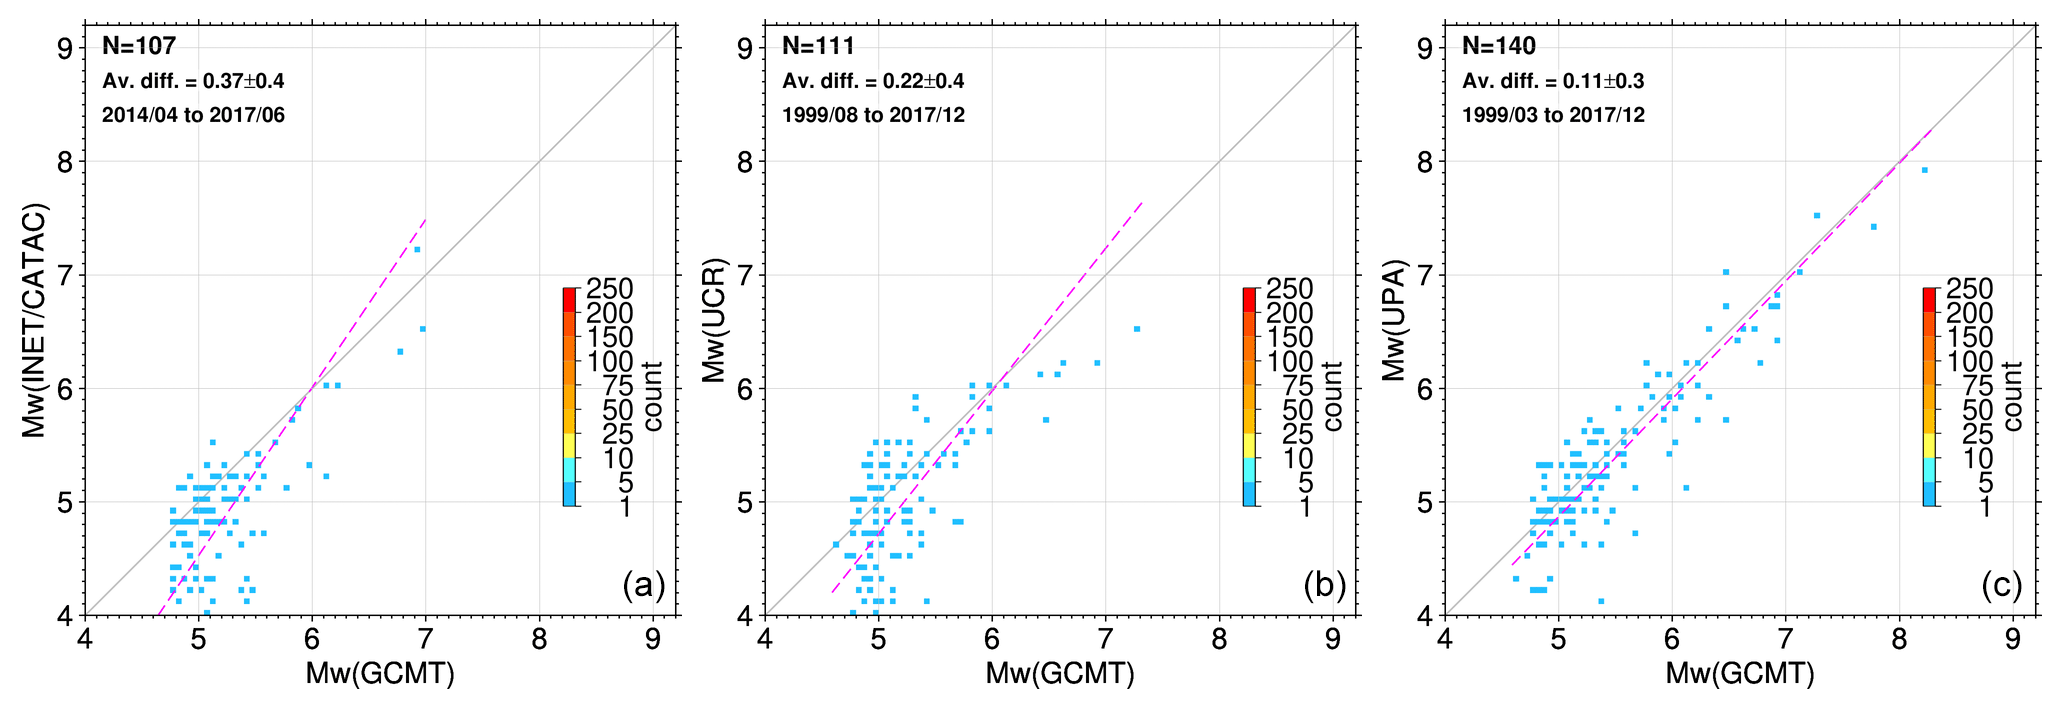
3.3.2 Central America
Among the regional agencies reporting Mw to the ISC in Central America (Fig. 4), we show the comparisons with Mw GCMT for agencies INET/CATAC, UCR, and UPA. We are not aware of the procedures used by those agencies to obtain Mw (Table 1). Figure 10 shows large differences between Mw GCMT and Mw from INET/CATAC and UCR. Agency UPA shows a better agreement with GCMT (∼14 % of the GCMT; UPA Mw values differ by more than ±0.5 m.u.), although large differences of about 1 m.u. can occur. Agency INET/CATAC has a significant average difference with GCMT of about 0.4 m.u., whereas UCR shows a distribution similar to PGC/OTT but with larger scatter and variability (average difference = 0.2 m.u.). For this area, we will use the results from agency UPA in the following sections.
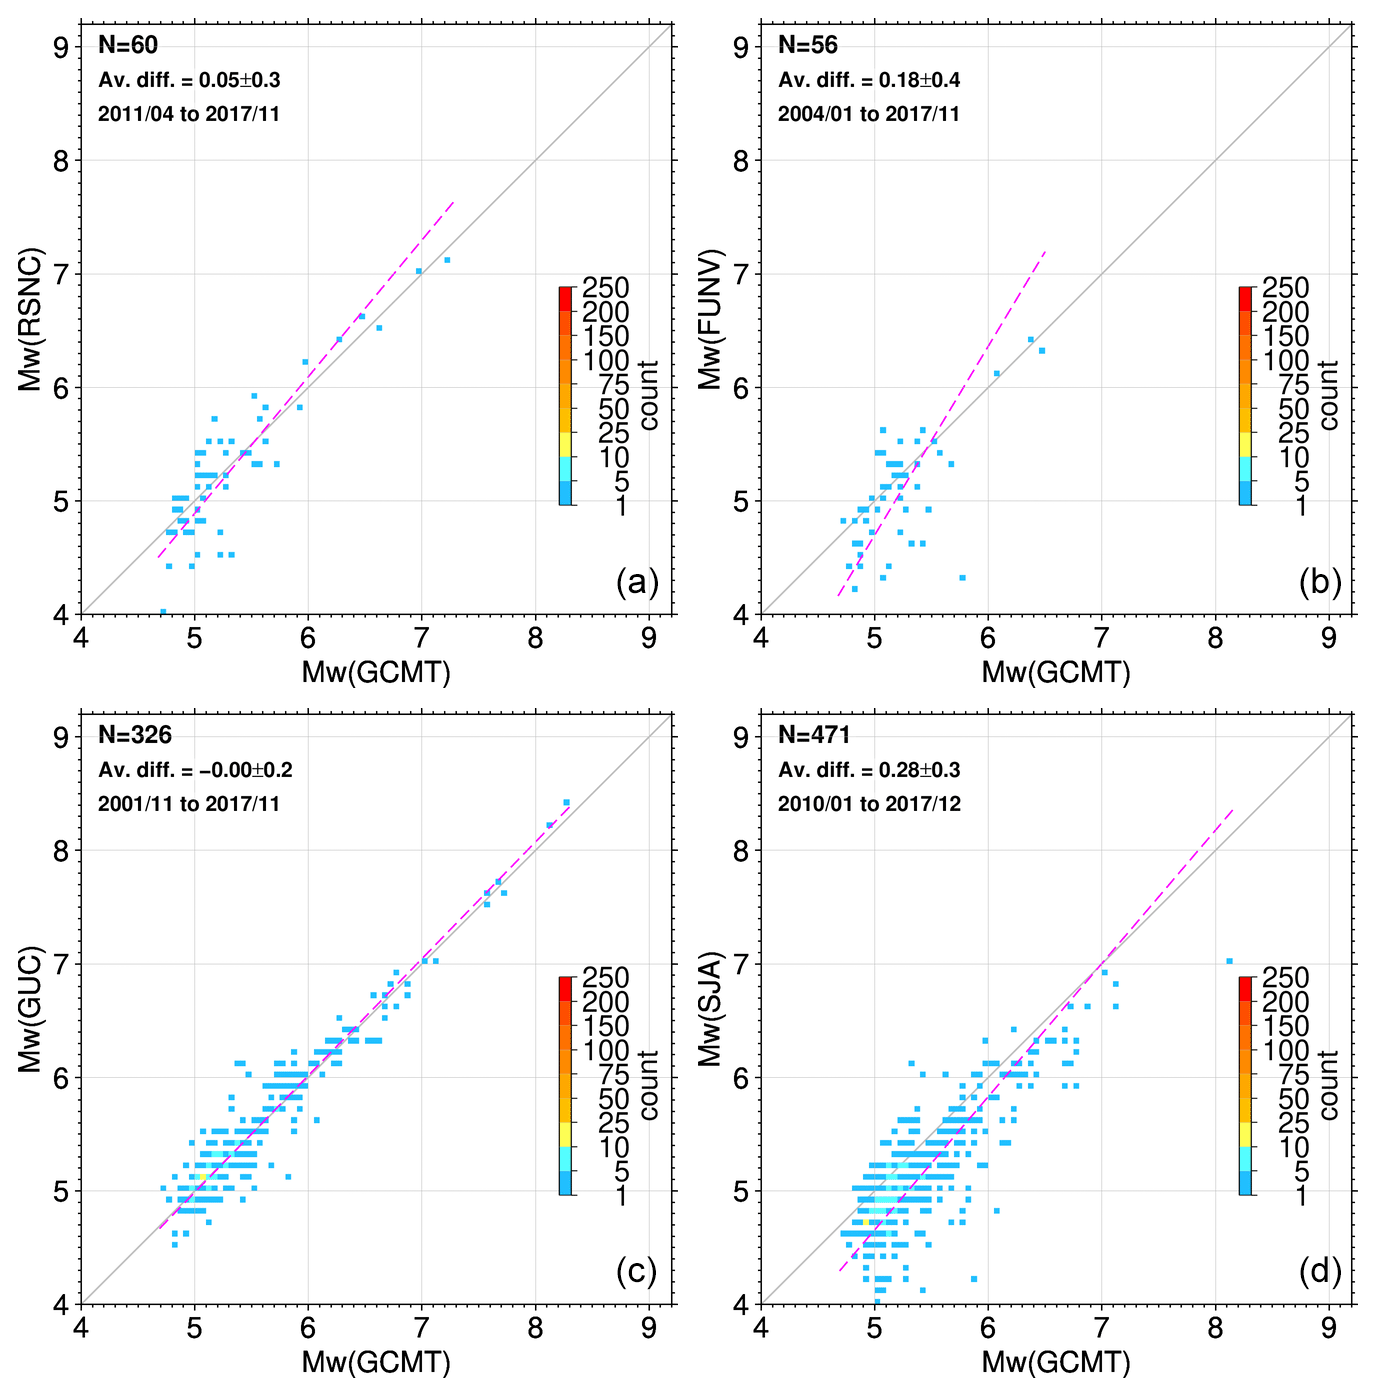
3.3.3 South America
Among the regional agencies reporting Mw to the ISC in South America (Fig. 4), we show the comparisons with Mw GCMT for agencies RSNC, GUC, FUNV, and SJA. The latter two use spectral analysis to obtain Mw, whereas we have no record of the procedures used by RSNC and GUC (Table 1). The Mw comparisons shown in Fig. 11 highlights a good fit between GCMT and agency GUC for the whole magnitude range. Agency SJA shows significant deviations from GCMT in the whole magnitude range. It is more difficult to assess agency RSNC and FUNV due to the paucity of data (total number of points is 60 and 56, respectively). However, we note that RSNC shows a scatter similar to PGC/OTT for moderate earthquakes and agrees well with GCMT for strong (Mw between 6 and 7) to major (Mw between 7 and 8) earthquakes, whereas FUNV shows a larger scatter. Since the areas considered by GUC and SJA as well as RSCN and FUNV overlap to some extent, we give preference to GUC over SJA and to RSNC over FUNV.
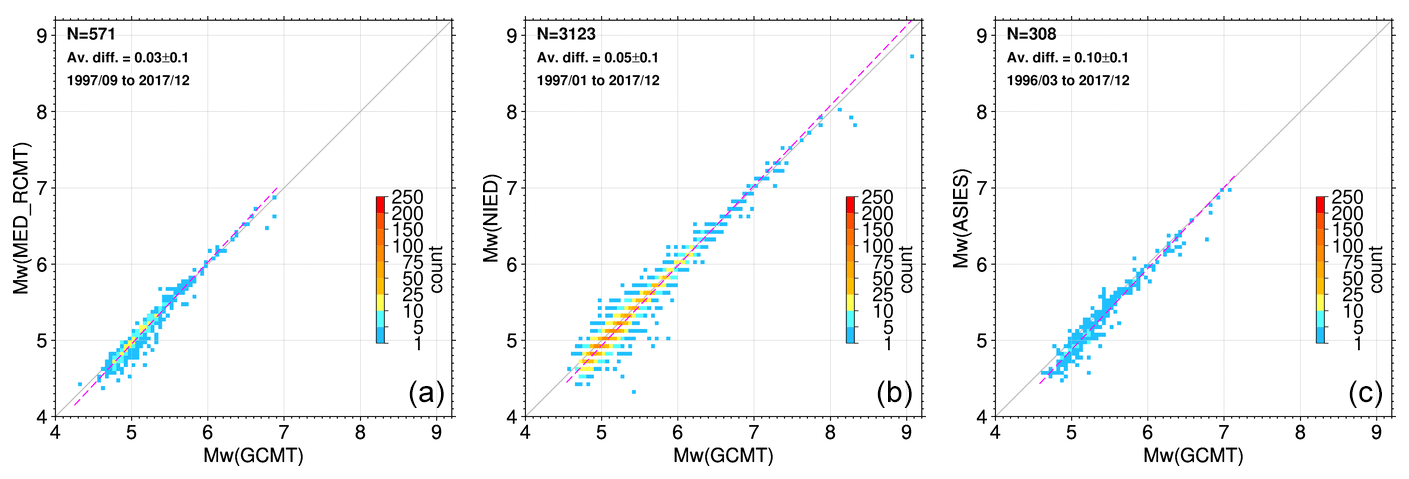
3.3.4 Euro-Mediterranean area
This area is one of the best-monitored in the world, as several agencies report or have reported Mw to the ISC (see Fig. 4). Features of the Mw computed by MED_RCMT, ZUR_RMT and ROM have already been discussed in recent literature (e.g. Konstantinou and Rontogianni, 2011; Gasperini et al., 2012). For the sake of simplicity, here we focus on the Mw from MED_RCMT as it is the most long-running and consistent active reporter to the ISC in this area. The left subplot in Fig. 12 shows its Mw comparison with GCMT. Over about 20 years of data, we notice the good fit between GCMT and MED_RCMT over the whole magnitude range, and generally we confirm the findings of Gasperini et al. (2012). Indeed, also for MED_RCMT, as for regional Mw cases discussed earlier, we notice the tendency of Mw to be smaller than GCMT for earthquakes at lower magnitudes.
We checked the comparisons of the other agencies actively reporting in this area (Fig. 4) and found that IAG (Mw from publications; see text for details) is in very good agreement with GCMT, whereas Mw from AFAD and ROM also show the usual feature of having Mw progressively smaller than GCMT going from strong (Mw between 6 and 7) to light (Mw between 4 and 5) earthquakes. Finally, large differences are present for agency NIC (not actively reporting Mw), whereas not enough points are available for GEOMR, ATA, BER, or IPRG/GII. In this context we give preference to Mw from MED_RCMT for the entire Euro-Mediterranean area.
3.3.5 Japanese islands (NIED) and Taiwan island (ASIES) areas
NIED and ASIES are authoritative agencies for the Japanese archipelago and the region around Taiwan island, respectively. Both agencies show an excellent agreement with GCMT (Fig. 12). We note that among the biggest regional contributors, NIED does not show the common trend of regional Mw to be smaller than GCMT for lower magnitudes. ASIES shows such a trend but it appears less prominent compared to other regional agencies.
3.3.6 Other agencies
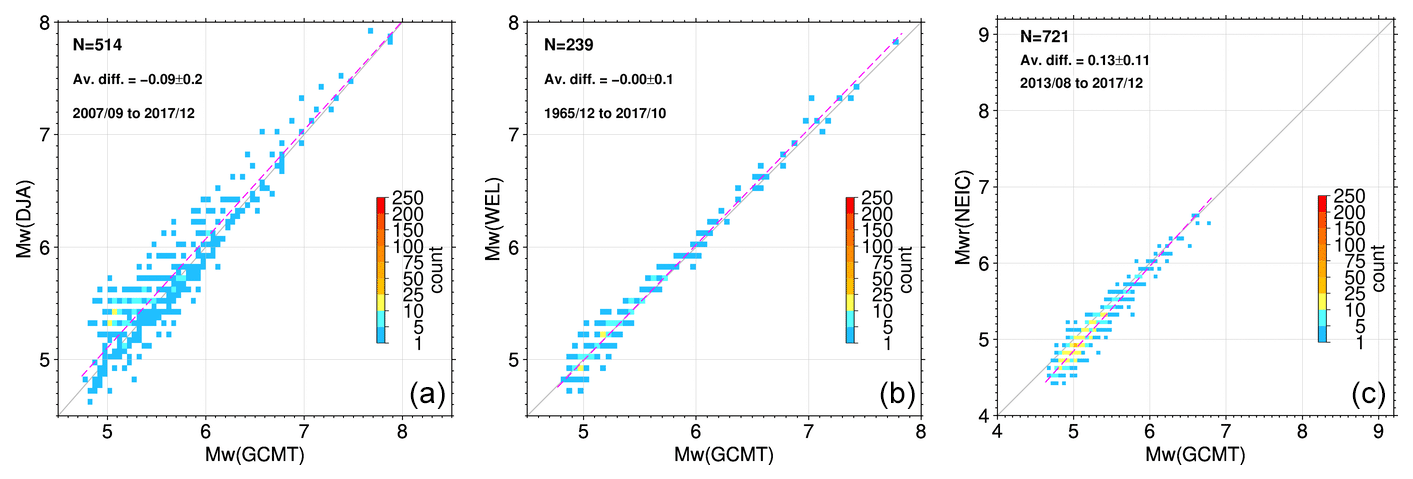
Among the other agencies reporting Mw, we show in Fig. A18 the comparison of GCMT with DJA, WEL, and Mwr NEIC. WEL reports to the ISC in terms of Mw are somewhat discontinuous, but they fit well with GCMT. For DJA the reports are also discontinuous and characterized by a subset of events with Mw smaller than GCMT and another subset of events with Mw larger than GCMT. Further investigations in this respect are beyond the scope of this work. Similar to other regional agencies, the Mwr included in NEIC reports appears to be progressively smaller than Mw GCMT as the earthquake magnitude decreases. Due to the discontinuous nature of the DJA and WEL reports and the overlap of Mwr included in NEIC reports with other regional agencies, in the following sections we focus our attention to agencies in the Americas, MED_RCMT, NIED, and ASIES.
We have seen in previous sections that Mw GCMT and several regional Mw providers fit well for strong and major earthquakes, whereas for moderate and smaller earthquakes the variability of the differences between GCMT and regional Mw values is higher, with GCMT nearly always larger than regional Mw values. This observation is not new as, for example, Patton (1998) and Patton and Randall (2002) showed the tendency of GCMT to overestimate seismic moments (hence of Mw) in central Asia, particularly for lower-magnitude earthquakes. It is not the scope of this work to further investigate the reasons for such differences (Hjörleifsdóttir and Ekström, 2010), as our main aim is to highlight some features of the Mw from the ISC Bulletin as an instrumental resource for further research into Mw.
Figure 2 shows how GCMT, although it is the authoritative agency for global earthquakes, is not systematically computing Mw for earthquakes below 5. Therefore, to further assess the variability of the regional Mw providers at lower magnitudes, we use the ISC re-computed MS and mb (Bondár and Storchak, 2011). The main reasons to use ISC re-computed MS and mb here are that (1) they provide many more data points below magnitude 5 than the GCMT dataset and that (2) they are often used as basis for deriving proxy Mw (e.g. Scordilis, 2006; Lolli et al., 2014; Di Giacomo et al., 2015).

Figure 13Comparisons between MS ISC and Mw GCMT (orange dots) for regional agencies (blue circles) considered in previous sections (the only difference here is that we grouped PAS with BRK/NCEDC). The nonlinear regressions between MS ISC and Mw GCMT (black solid curves) and between MS ISC with the regional agencies (solid purple curves) are also shown, along with the 1:1 lines (dashed dark grey). The second subplot from the left at the bottom shows the box-and-whisker plot for 0.2 MS ISC bins of the difference between MS ISC and Mw GCMT (black, transparent) and Mw from all other agencies (cyan). The box represents the 25 %–75 % quantile, the band inside the box represents the median, and the ends of the whiskers represent the minimum and maximum of all data.
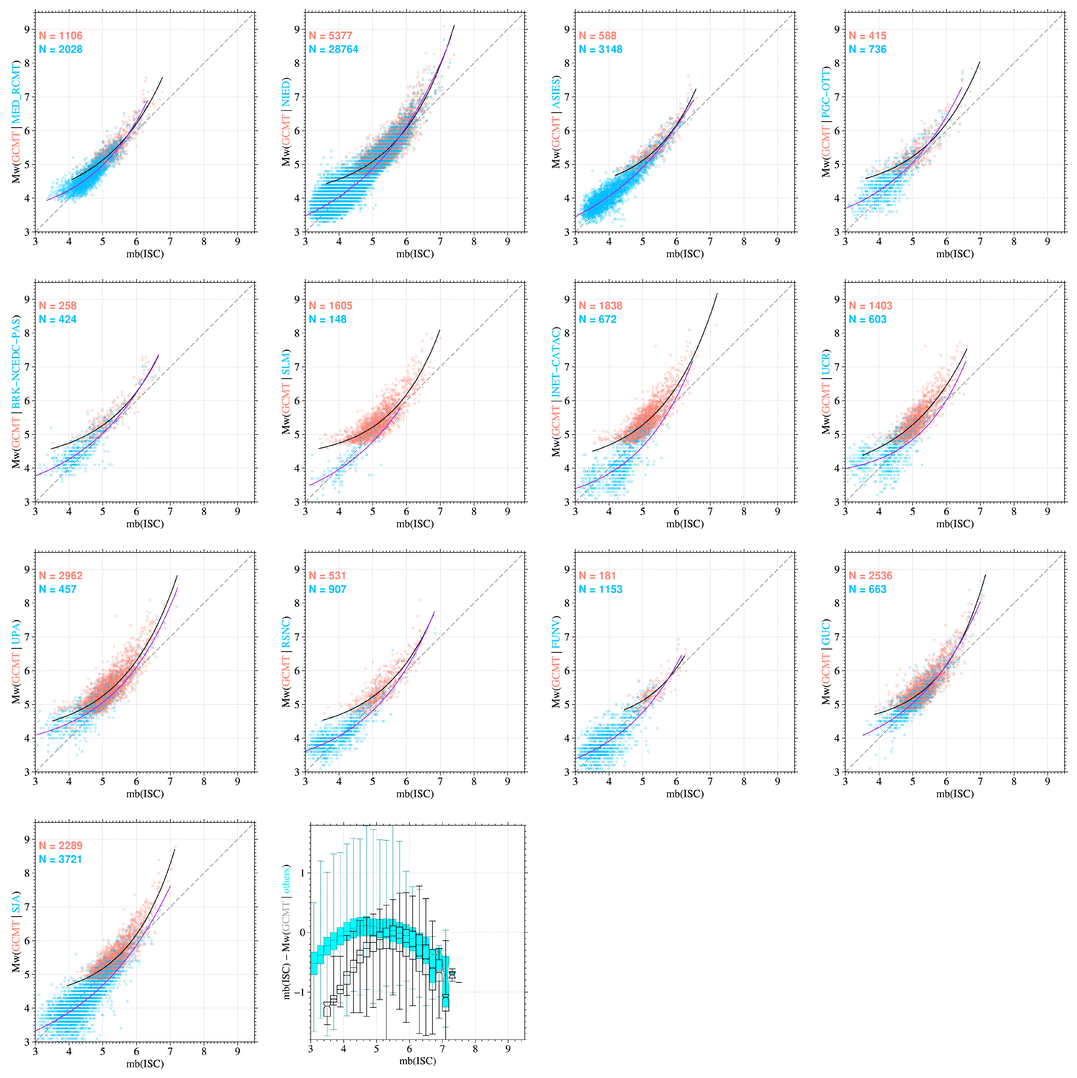
In Figs. 13 and 14 we show, for each regional agency discussed in previous sections, the comparisons between ISC re-computed MS and mb, respectively, with GCMT and each regional agency (the only difference here is that we grouped PAS with BRK/NCEDC). The global comparisons between GCMT Mw and ISC re-computed MS and mb have been extensively discussed in literature. Therefore, Figs. 13 and 14 only include GCMT Mw values for earthquakes that occurred in the same area of the corresponding regional agency (see Fig. 4 for the spatial limits of each agency).
Figures 13 and 14 also show the non-linear regressions between ISC magnitudes and GCMT and regional Mw agencies. The non-linear regressions have been computed similarly to Di Giacomo et al. (2015), with the difference being that in this work we did not use a global dataset split in training and validation subsets. Other non-linear models have been proposed by Lolli et al. (2014) but, as we do not aim to create new conversion relationships, we only use our non-linear regressions to discuss features of the ISC re-computed MS and mb with GCMT and regional agencies.
The non-linear models for regional agencies shown in Figs. 13 and 14, obtained with the same regression technique, serve us as a sort of guideline for earthquakes below magnitude 6 in particular, as for large earthquakes the MS and mb relations with Mw have been studied by several authors (e.g. Bormann et al., 2013, for a comprehensive overview on the subject).
Several papers have shown that MS scales with Mw better than mb for strong and larger earthquakes (e.g. Scordilis, 2006). This is also confirmed by inspecting Fig. 13. Indeed, the MS ISC and Mw GCMT distribution show how the non-linear model closely follows the 1:1 line in the magnitude range between ∼5.6 and ∼7.7, whereas for great earthquakes MS tends to underestimate Mw (Kanamori, 1983) and deviates even more significantly from the 1:1 line going down in magnitude for moderate and smaller earthquakes (see also Bormann et al., 2009). Similar trends can be seen for agencies MED_RCMT, NIED, ASIES, PGC/OTT, BRK/NCEDC and PAS, UPA, and GUC, although the non-linear models below 6 are much closer to the 1:1 line than the GCMT model. This is not surprising considering the Mw comparisons that showed how Mw GCMT is generally larger than those agencies for moderate earthquakes and below. Larger deviations are observed for the other agencies. Overall, the regional MS–Mw distributions appear to complement the global MS–Mw distribution well, although regional variations are present (compare, e.g. MED_RCMT and ASIES), as already pointed out by Ekström and Dziewonski (1988). The difference between MS ISC and Mw GCMT and all other agencies is also shown as box-and-whisker plot for bins of 0.2 m.u. of MS ISC (last subplot in Fig. 13). Despite the large scatter of Mw shown by regional agencies, such differences become progressively larger as the magnitude decreases.
The comparison between mb ISC and Mw GCMT is characterized by a large scatter in the whole magnitude range and shows stronger features compared to MS. Indeed, due to the early saturation of mb already for strong to major earthquakes (Kanamori, 1983), Mw is, in general, significantly larger than mb. This feature is well documented in the literature; hence, we focus on the significant difference between GCMT and the other agencies for lower-magnitude earthquakes. Indeed, whilst the GCMT distribution with mb is strongly non-linear, for all other agencies the non-linear models are much closer to the 1:1 line than the GCMT curve. In particular, agencies MED_RCMT and ASIES appear to extend nearly linearly the mb–Mw global distribution from the GCMT. Similar trends can be noticed for NIED and PGC/OTT, although with a larger scatter, whereas for other agencies the number of data points are significantly smaller and the regional mb–Mw distribution appears to complement the global mb–Mw distribution less clearly. As for MS, we observe a significant difference between mb–Mw from GCMT and all other agencies for smaller earthquakes (last subplot in Fig. 14).
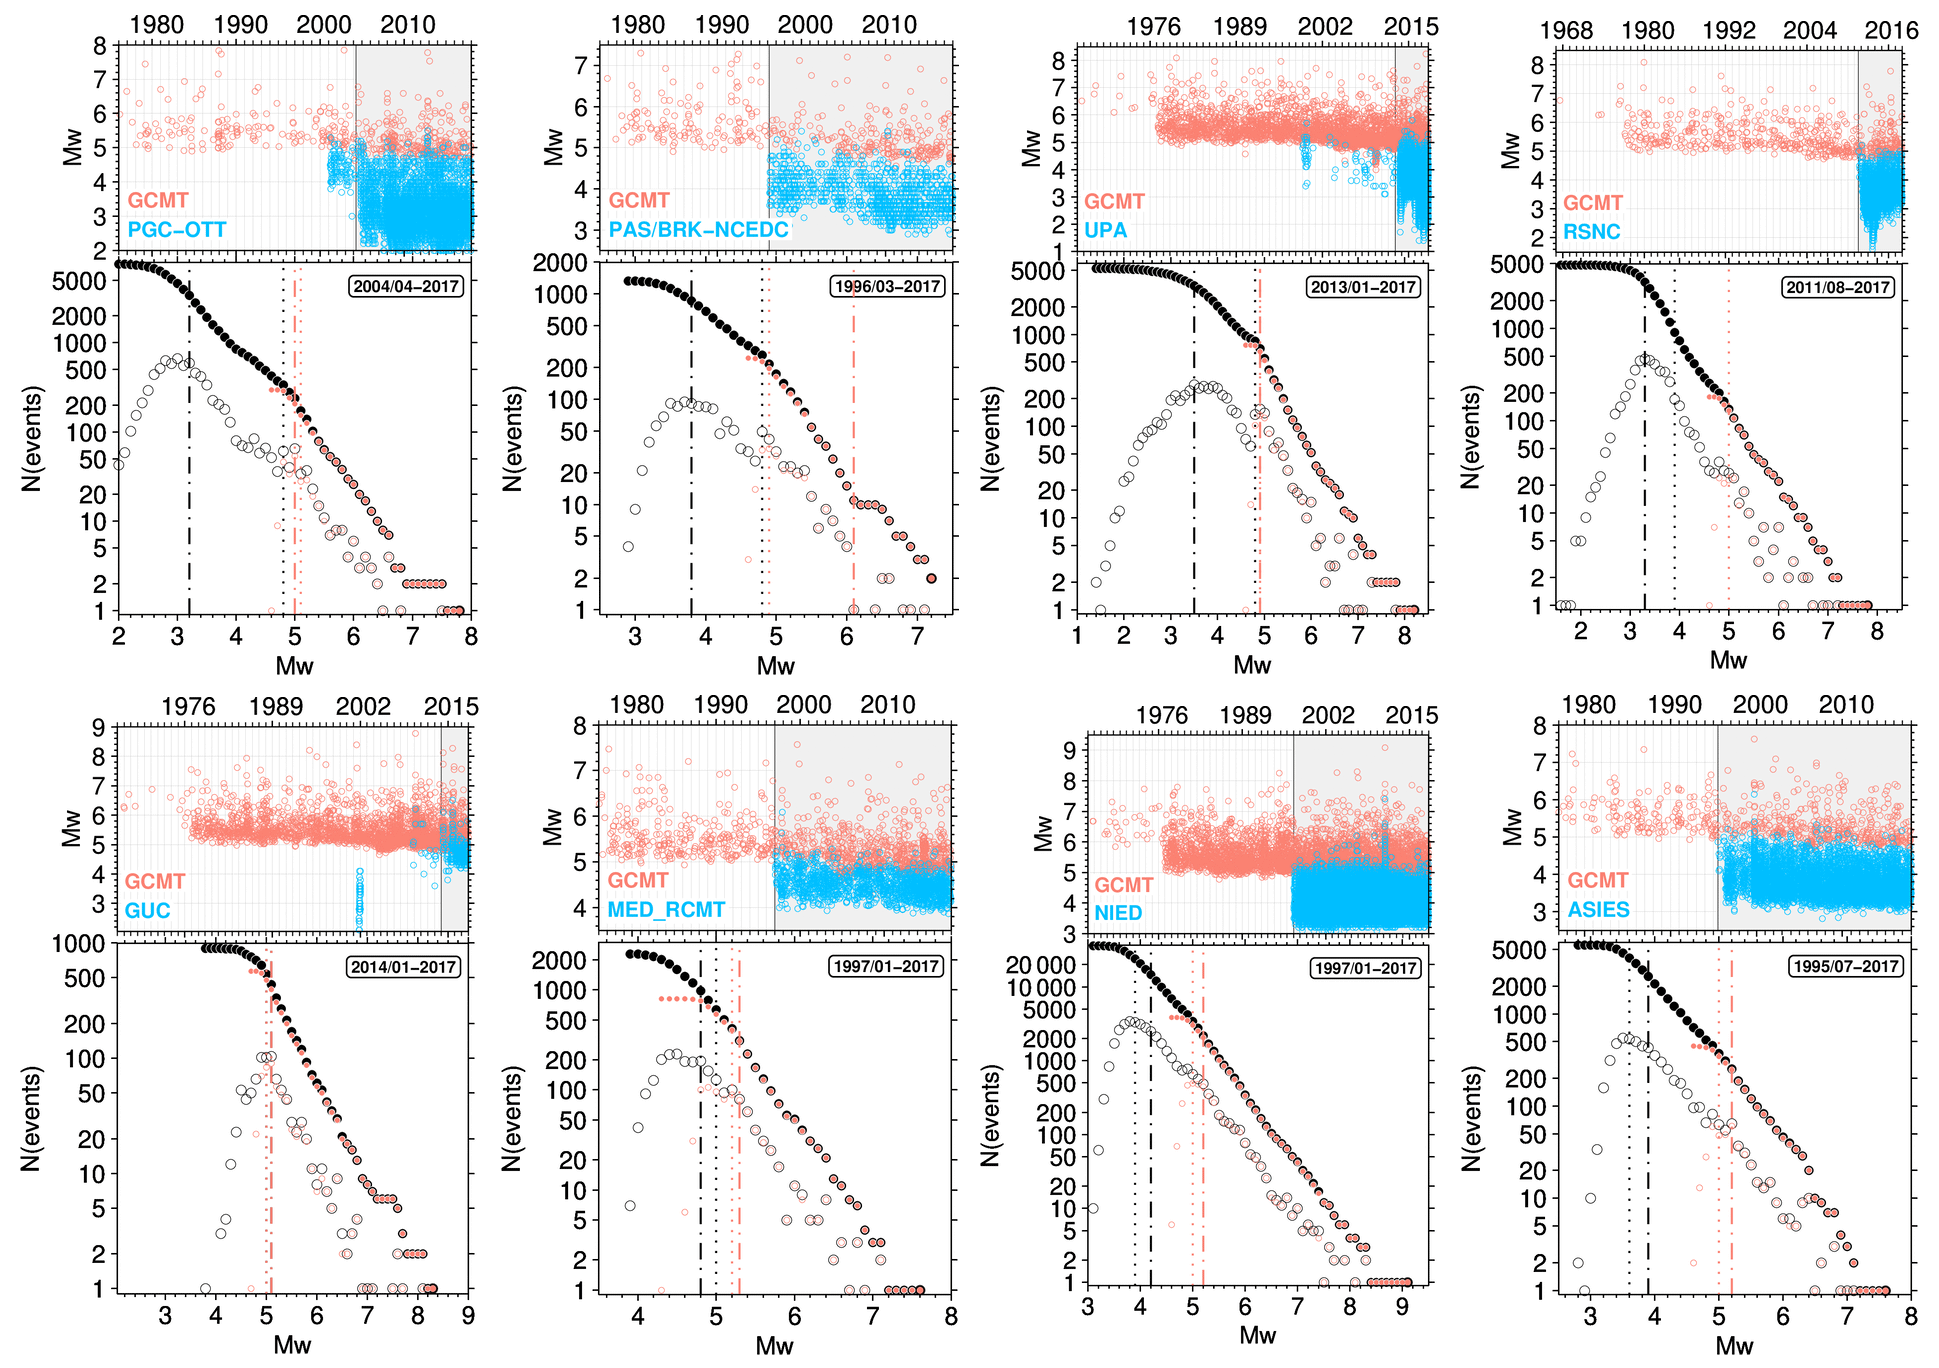
Figure 15Magnitude timelines and frequency–magnitude distributions (FMD) for GCMT only (orange symbols) and GCMT complemented by some regional agency discussed above (blue in the timelines and black in the FMDs, with agency name reported in each subplot). The date range in the FMD panels (coinciding with the shaded grey areas in the timeline panels) in every subplot identifies the time period over which the FMD have been obtained both for GCMT alone and by complementing it with the corresponding regional agency. The filled and empty circles are cumulative and single frequencies, respectively. The dashed–dotted vertical lines (orange for GCMT only, black for GCMT and regional agency) depict the magnitude of completeness (Mc) obtained with the median-based analysis of the segment slope by Amorese (2007), whereas the dotted vertical lines depict the Mc as obtained from the goodness-of-fit test by Wiemer and Wyss (2000). Note that Mc values for Chile (as covered by agency GUC) are identical for GCMT and GCMT + GUC, as from the timeline the GUC contribution started only in recent years. All the Mc values shown here have been obtained by using the rseismNet R package by Arnaud Mignan, available at https://github.com/amignan/rseismNet, last accessed in September 2020. Details about the Mc estimation methods can be found in Mignan and Woessner (2012).
As one of the possible uses of the ISC Bulletin as a source of Mw, Fig. 15 shows the frequency–magnitude distributions (FMD) for GCMT alone and GCMT complemented by regional agencies discussed above. The FMDs are used in many hazard studies and are fundamental in catalogue-based assessments of the magnitude of completeness Mc for an area in a given time period. The FMDs have been obtained for the time period covered both by GCMT and the corresponding regional agency, as also outlined in the magnitude timelines of Fig. 15. The choice of the agency that best complements GCMT in a specific area has been discussed in previous sections. Figure 15 also shows Mc estimations by two different methods, the median-based analysis of the segment slope by Amorese (2007) and the goodness-of-fit test by Wiemer and Wyss (2000). Other methods for estimating Mc are available (see, e.g. Mignan and Woessner, 2012), but here we only use these two methods to provide two independent estimations of Mc for GCMT and GCMT complemented by a regional agency. Overall, the effect of complementing the Mw from a regional agency with GCMT is to improve the Mc for an area, with the exception of Chile, where the recent contribution by the regional agency GUC does not yet significantly expand the GCMT contribution.
We note significant fluctuations in the FMDs for all agencies shown for the Americas, as, for example, in California and neighbouring regions (agencies PAS/BRK-NCEDC), as also shown by the large discrepancy between the Mc from the goodness-of-fit test and median-based analysis of the segment slope methods. Agencies NIED, ASIES, and MED_RCMT extend the GCMT's FMDs to lower magnitudes better than other agencies. Such FMD examples further emphasize the important role of regional agencies in complementing global solutions (e.g. from GCMT).
The DH Mw List (filename: MW_all_1964-2017, Di Giacomo and Harris, 2020) is available in the ISC Dataset Repository at https://doi.org/10.31905/J2W2M64S. It has been extracted from the ISC Bulletin (International Seismological Centre, 2020) and each line contains the following fields (as in the file header line):
event type (etype), ISC event identifier (isc_evid), hypocentre identifier (hypid), hypocentre author (h.author), hypocentre author origin time (OT), hypocentre author latitude (lat), hypocentre author longitude (lon), hypocentre author depth (depth), magnitude type (mtype), magnitude author (n.author), magnitude (mag), magnitude uncertainty (unc), data provider (reporter), magnitude identifier (magid), prime location author (prime), absolute depth difference between h.author and prime (Hdiff, in km), and epicentral distance between h.author and prime (dist, in km).
The database identifiers (isc_evid, hypid, and magid) are included for facilitating identification of entries from users. Note that for the same event (i.e. one isc_evid) there can be from 1 to N hypid and magid entries. For some entries the n.author is different from the h.author as some reporters (e.g. NEIC) often provide magnitude values from third parties.
The entries included in the DH Mw List, as extracted from the ISC Bulletin, include only the following mtype (case insensitive): Mw, Mwb, Mwc, Mwr, Mww. This means that Mw computed for rapid response purposes, such as Mwp (Tsuboi et al., 1995, 1999; Tsuboi, 2000), MwMwp (Whitmore et al., 2002), Mwpd (Lomax et al., 2007), or proxy values such as Mw(mB) (Bormann and Saul, 2008) have been skipped.
Other Mw entries in the ISC Bulletin not included in the DH Mw List are those with associated uncertainty larger than 0.5 (note that unc = 0 means no formal uncertainty is associated to the magnitude value). Finally, with the exception of Mw from GCMT, we skipped Mw entries where dist is larger than 300 km and Hdiff > 150 km.
Below are the Perl lines used to write out the DH Mw List:
$str = sprintf "%s %12d %12d %8s %s %9.3f %10.3f %6.1f %6s %12s %4.2f %3.1f %12s %12d %8s %8.1f %8.1f\n", $etype, $evid, $hypid, $hauthor, $ot, $lat, $lon, $depth, $mtype, $nauthor, $magnitude, $unc, $reporter, $magid, $primeauthor, $diffdepth, $deltakm ;
print OUT ("$str") ; # OUT is the DH Mw List in the manuscript, file name = MW_all_1964-2017 in the ISC Dataset Repository, doi:10.31905/J2W2M64S
In Di Giacomo and Harris (2020) we also include the Generic Mapping Tools (GMT4.5, Wessel et al., 2013) script to create the summary plots (as in Fig. 2 or 5 for any magnitude author the user may wish to visualize, as mentioned in Sect. 2.2).
Finally, users can find (see README file in Di Giacomo and Harris, 2020) the files used to create the magnitude comparisons shown in this work in dedicated subfolders.
The ISC Bulletin, in its rebuilt shape after the work described in Storchak et al. (2017, 2020), is a unique resource for seismological and multidisciplinary geoscience studies. In this work we focused on the content and features of the moment magnitude Mw, as it is possibly the preferred magnitude scale in the seismological community. The earliest records of Mw are for deep and intermediate-depth earthquakes in the 1960s obtained from special studies by the GCMT group (Huang et al., 1997; Chen et al., 2001). Following this, since 1976 GCMT has become the authoritative global agency providing Mw for moderate to great earthquakes. In recent decades other agencies also implemented procedures to compute Mw for global earthquakes (e.g. NEIC and IPGC), often due to the need for having a quick but reliable assessment of an earthquake's impact soon after its occurrence (e.g. Hayes et al., 2009; Vallée et al., 2010). We have summarized the main time and spatial features of the global Mw providers, and by their comparisons we confirm the findings of previous works (Gasperini et al., 2012). In brief, there is a very good agreement between such agencies for strong to great earthquakes, although minor differences are present.
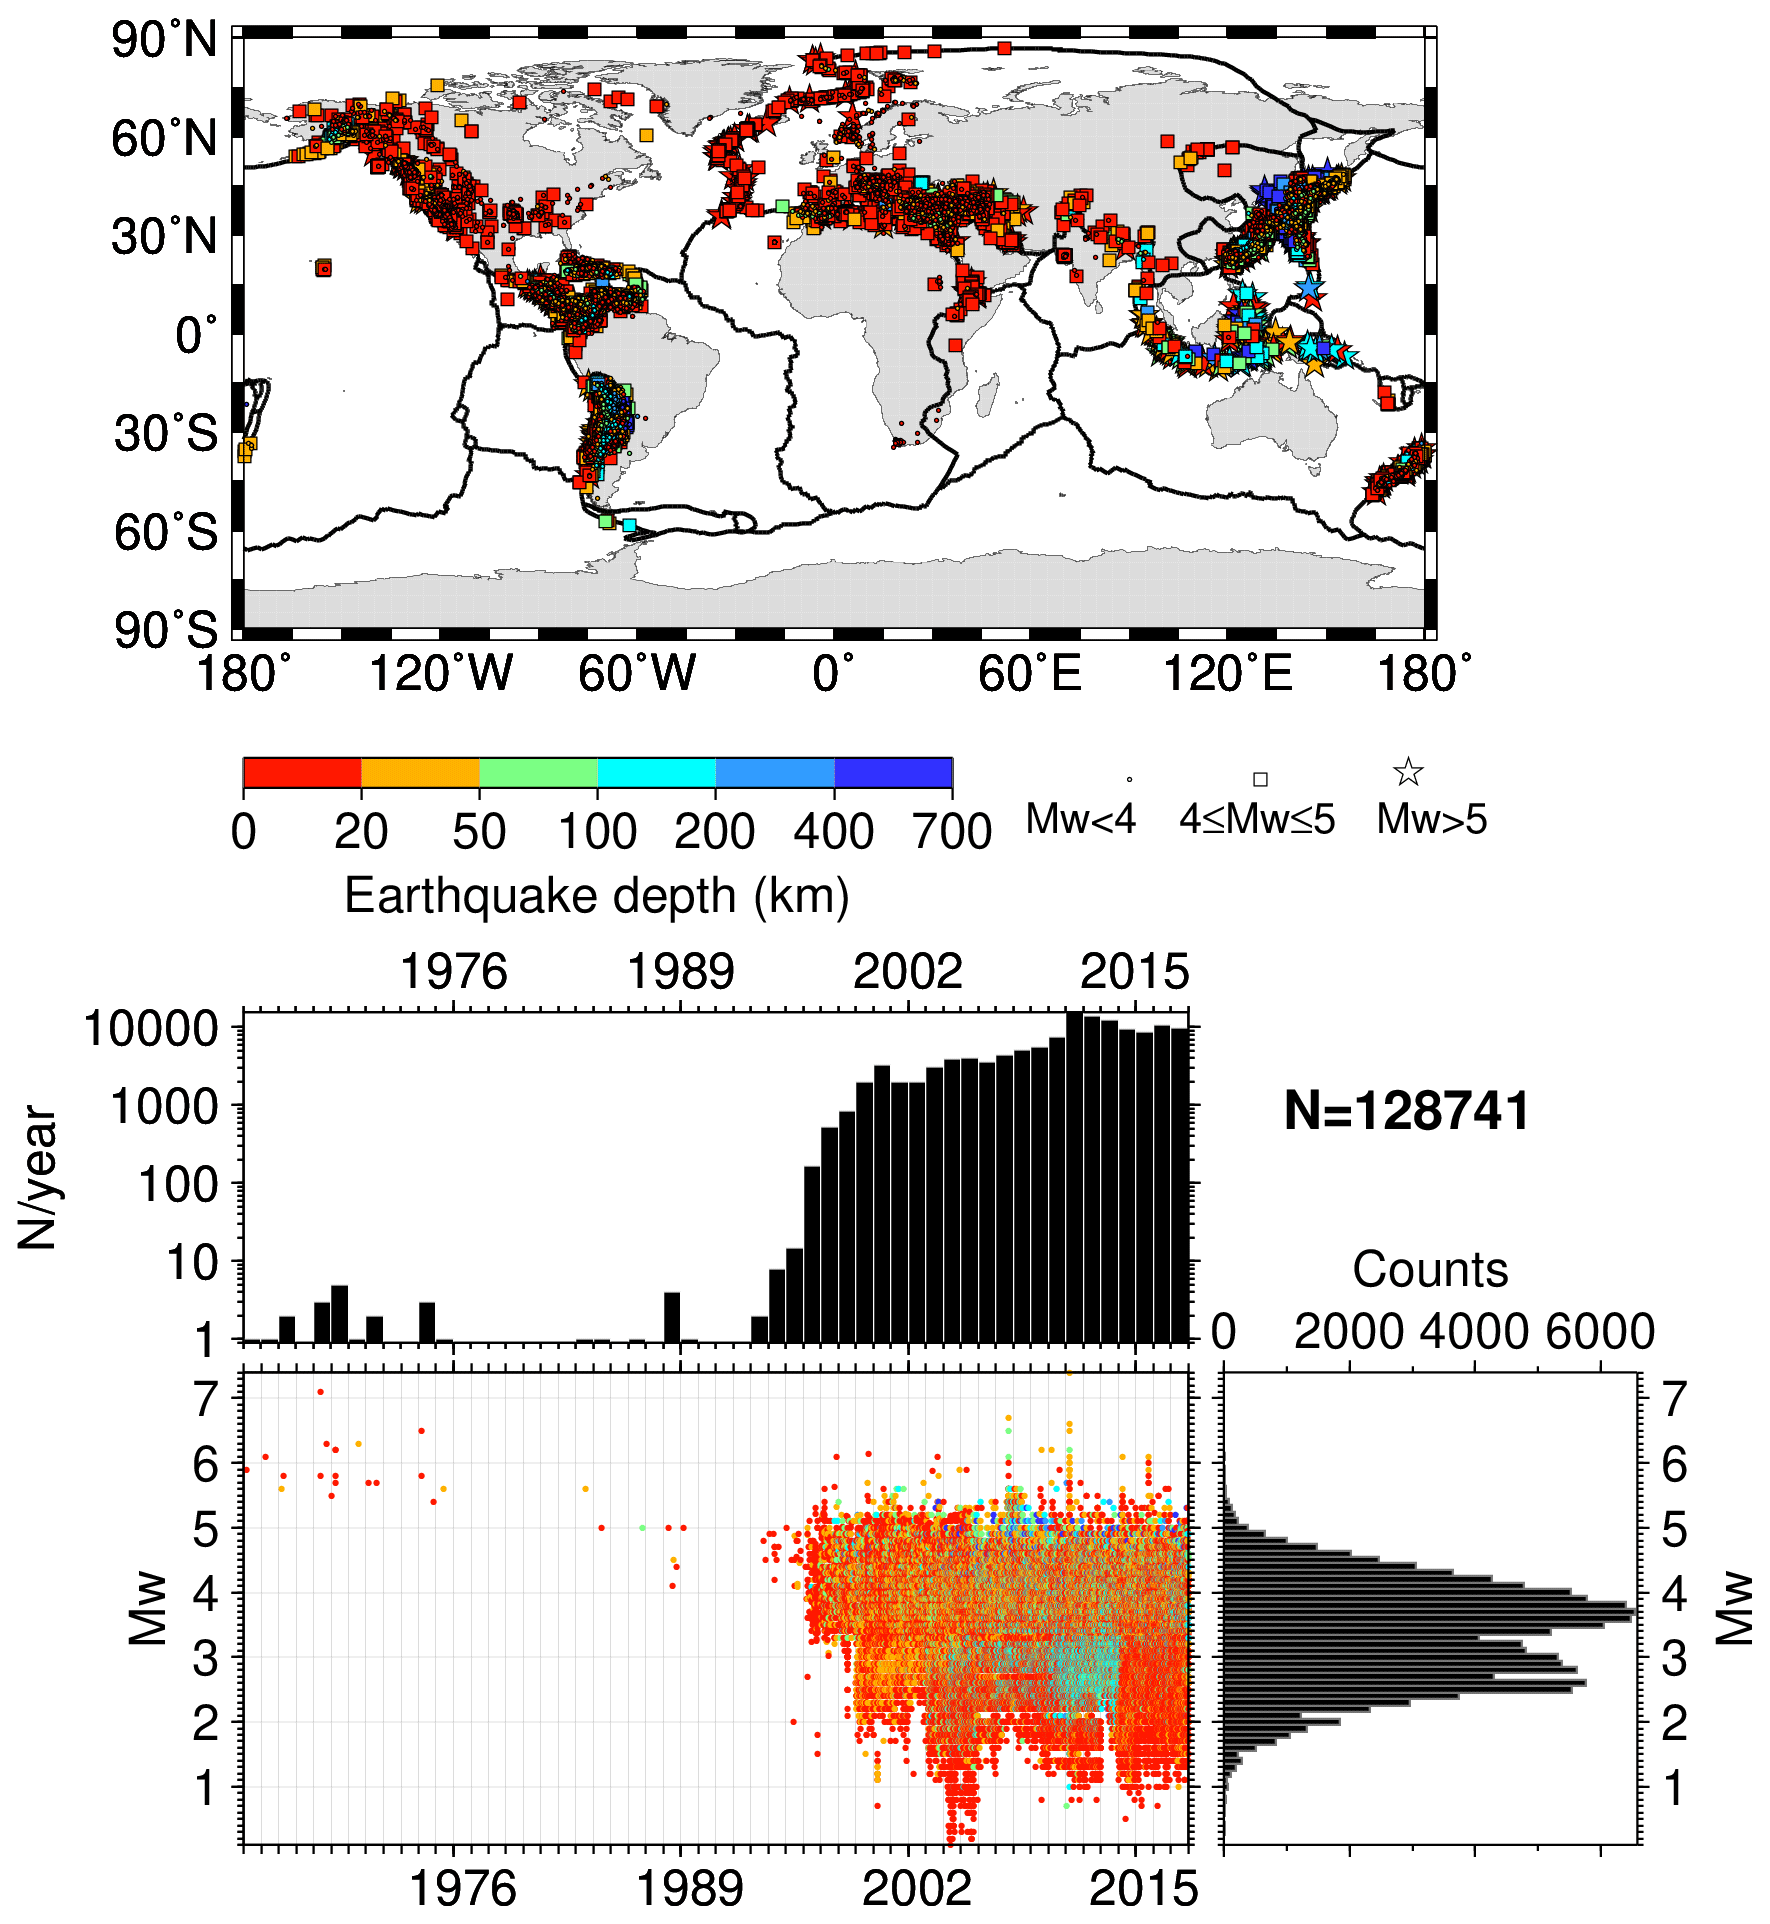
Figure 16The same as Fig. 2 but for earthquakes with Mw from regional agencies only (i.e. earthquakes with Mw from global agencies, with the exception of Mwr from NEIC, are excluded). The map was drawn using the Generic Mapping Tools (GMT) (Wessel et al., 2013) software.
In recent years, the computation of Mw has been expanded to smaller earthquakes by a multitude of agencies covering anything from small areas (i.e. country-wide) to whole continents. The contributions from regional agencies are fundamental for improving seismicity records of an area. To emphasize this point, Fig. 16 shows the summary of the contribution from regional agencies if we exclude earthquakes with Mw from global agencies (the only exception is Mwr from NEIC, which is included in the figure). As regional agencies make up about 72 % of the earthquakes in the DH Mw List, we remark the need for continuous and systematic Mw solutions to be provided over a long period of time, as such datasets will be fundamental tools for a better understanding of the seismicity of an area. It would also be desirable that agencies document the procedures used over time and whether automatic or revised solutions are obtained.
The time and spatial summaries of the regional agencies highlighted the recent increase in Mw providers, although the agencies currently active and having few interruptions in their contributions are located mostly in North America, Euro-Mediterranean, Japanese archipelago, and Taiwan areas. Unfortunately, large parts of the world with significant seismicity (e.g. vast parts of continental Asia and Africa) lack regional agencies reporting Mw (see Figs. 4 and 16).
The Mw comparisons between GCMT and regional agencies showed a characteristic already discussed in literature, i.e. a growing deviation from the 1:1 line for moderate to smaller earthquakes. Such deviation is usually accompanied by a larger scatter in the data points compared to earthquakes in higher magnitude ranges (e.g. magnitude 6 and above). These observations are not limited to a specific area but appear to be common in different parts of the world. In addition, the GCMT Mw comparisons with the ISC-recomputed magnitudes, MS and mb, confirm such discrepancies. Indeed, GCMT appears systematically larger than regional ones for earthquakes in the same area below about magnitude 5.5, as highlighted by the nonlinear regressions shown in this work. Nearly all deviate from the 1:1 line more significantly for GCMT than corresponding models for regional agencies.
When multiple agencies overlap in space and time, we used magnitude comparisons to select individual regional agencies that better complement GCMT in a given area. This way we discussed examples of frequency–magnitude distributions from GCMT alone and GCMT complemented by specific regional agencies in different parts of the world. It is not surprising that by complementing GCMT with the Mw of a regional agency we have shown improvements in Mc estimations. The best examples of extending the GCMT FMDs to smaller magnitudes are from agencies MED_RCMT, NIED and ASIES, whereas in other areas the GCMT and the GCMT complemented by regional agencies show marked fluctuations. Although we did not aim to investigate the frequency–magnitude distributions in detail, a possible source of such fluctuations, e.g. for California, may be due to the short time window considered. Hence, we encourage agencies to continue or implement procedures for systematically computing Mw for the years to come so that future works may benefit from long-running and homogenous datasets.
Finally, we point out that further investigations on the difference between Mw from GCMT and regional agencies are desirable, although several papers (e.g. Patton, 1998; Patton and Randall, 2002; Hjörleifsdóttir and Ekström, 2010; Konstantinou and Rontogianni, 2011) considered this aspect. Addressing such discrepancies may have significant impacts in different types of studies (e.g. magnitude conversion relationships, ground-motion prediction equations, hazard). In particular, we envisage studies that estimate the effects of possible data censoring in Mw computations in different regions, which may even partially explain the growing deviations from the 1:1 lines between Mw GCMT and mb|MS in the lower magnitude ranges.
Here we include additional summary plots similar to Fig. 2 or magnitude comparisons similar to Fig. 8 for agencies and magnitude authors or specific types of Mw that were not discussed in detail in the main text.
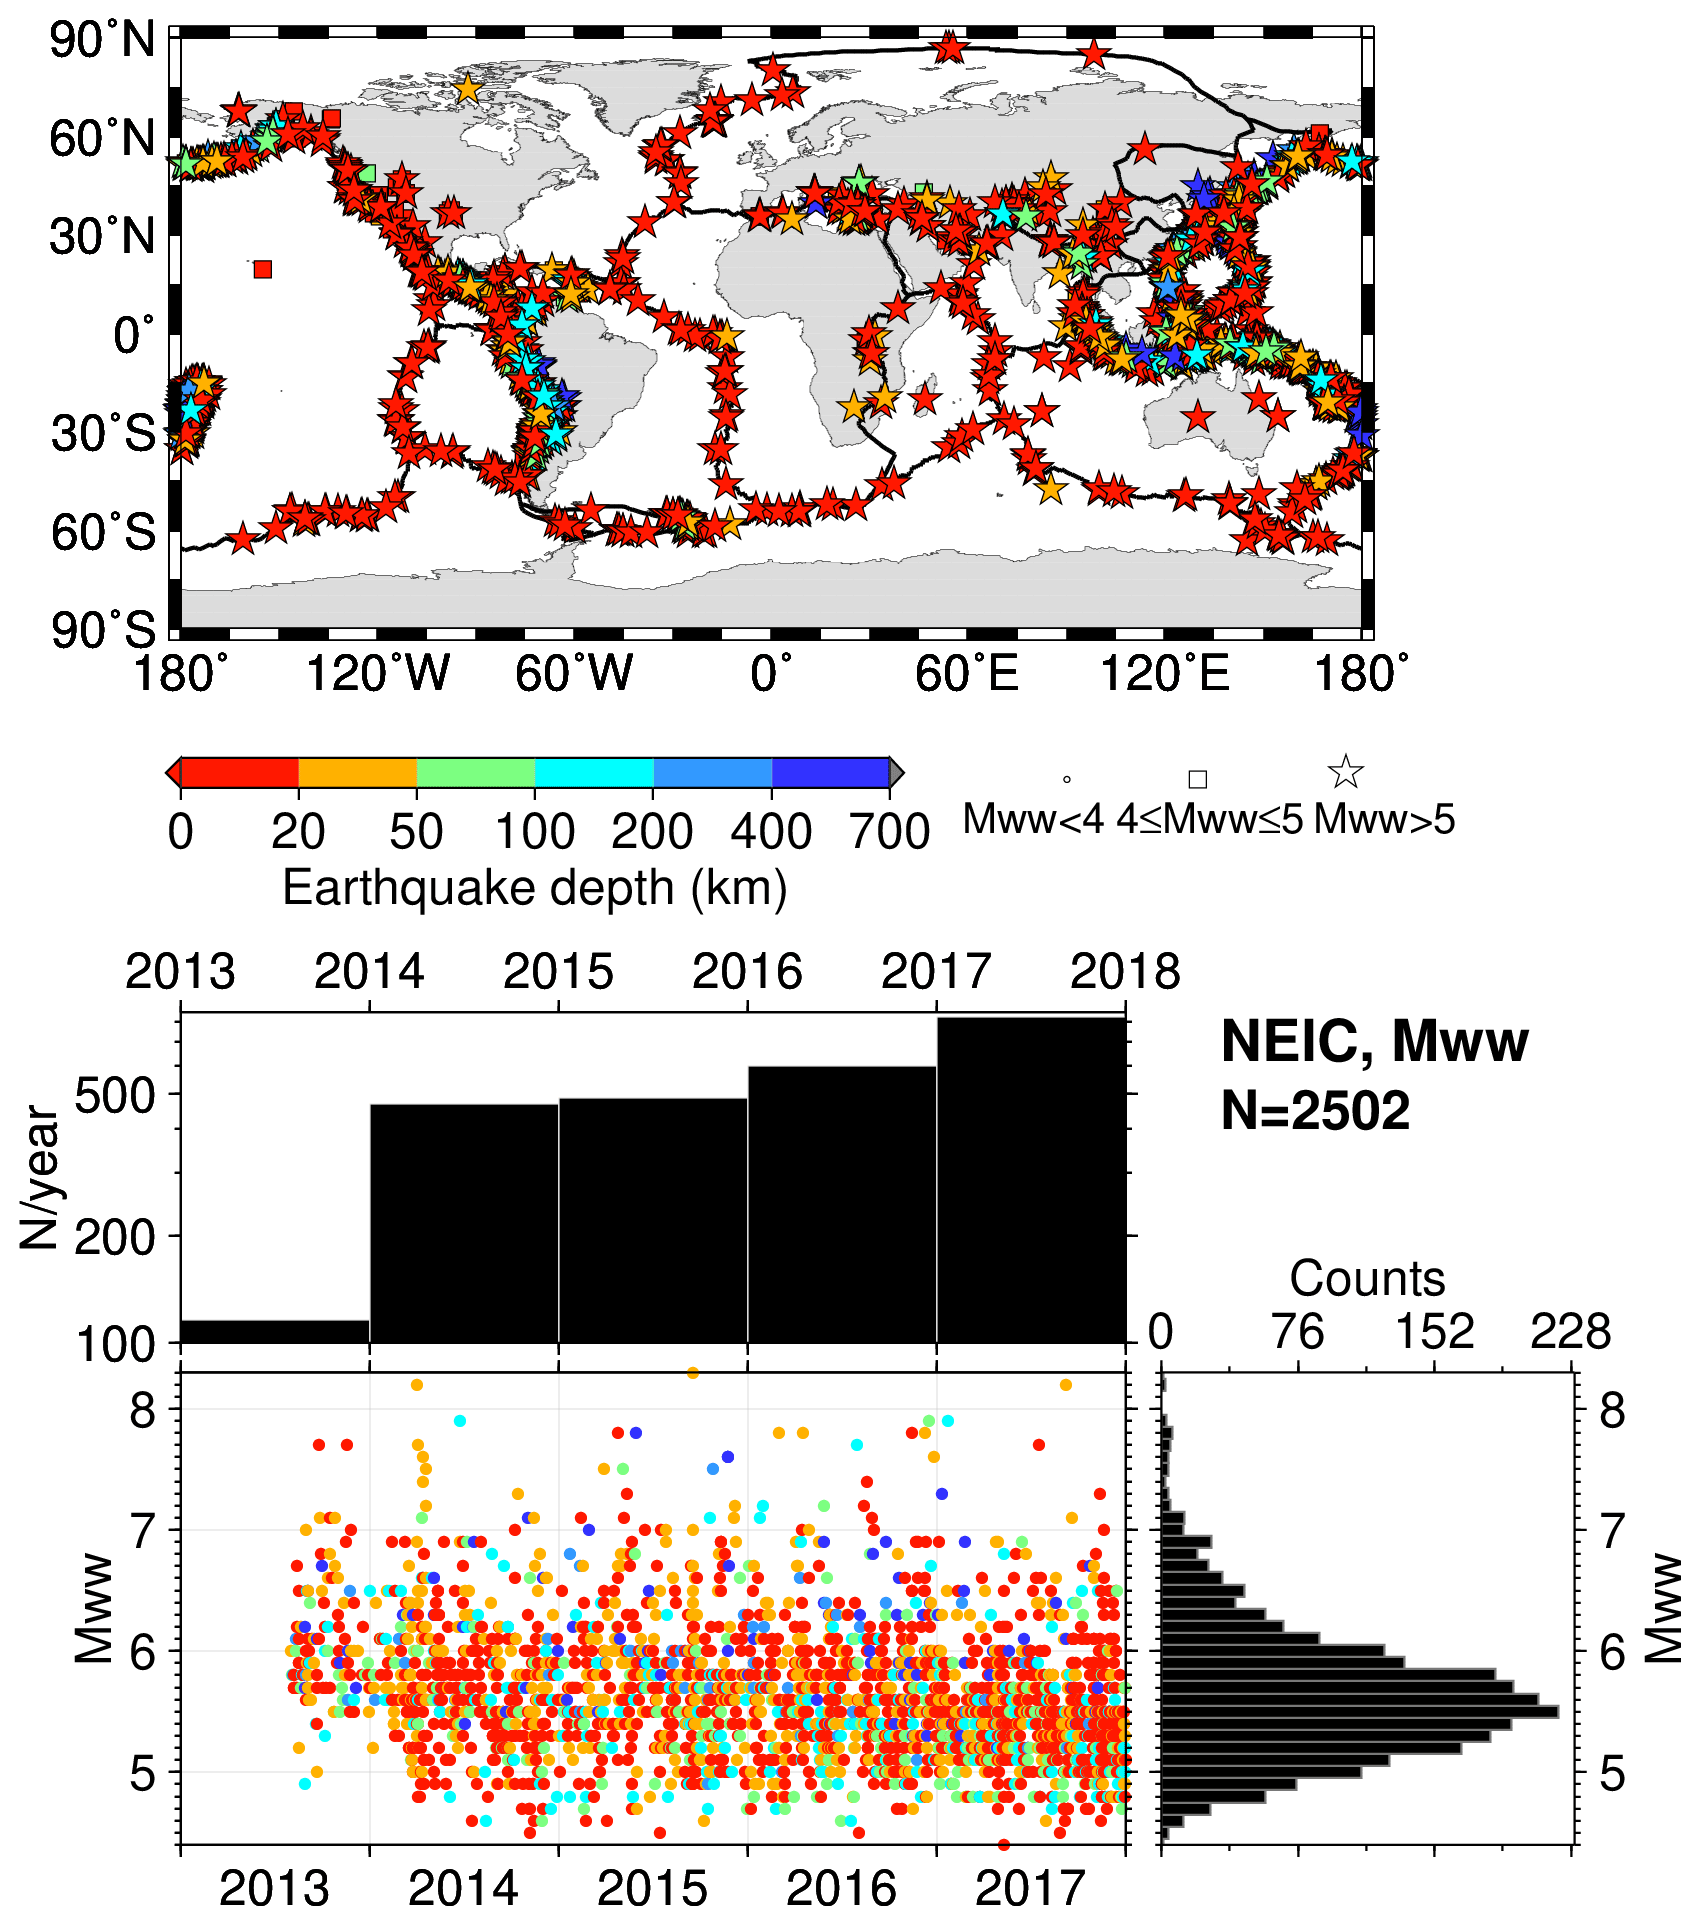
Figure A1The same as in Fig. 2 but for NEIC and Mww. The map was drawn using the Generic Mapping Tools (GMT) (Wessel et al., 2013) software.
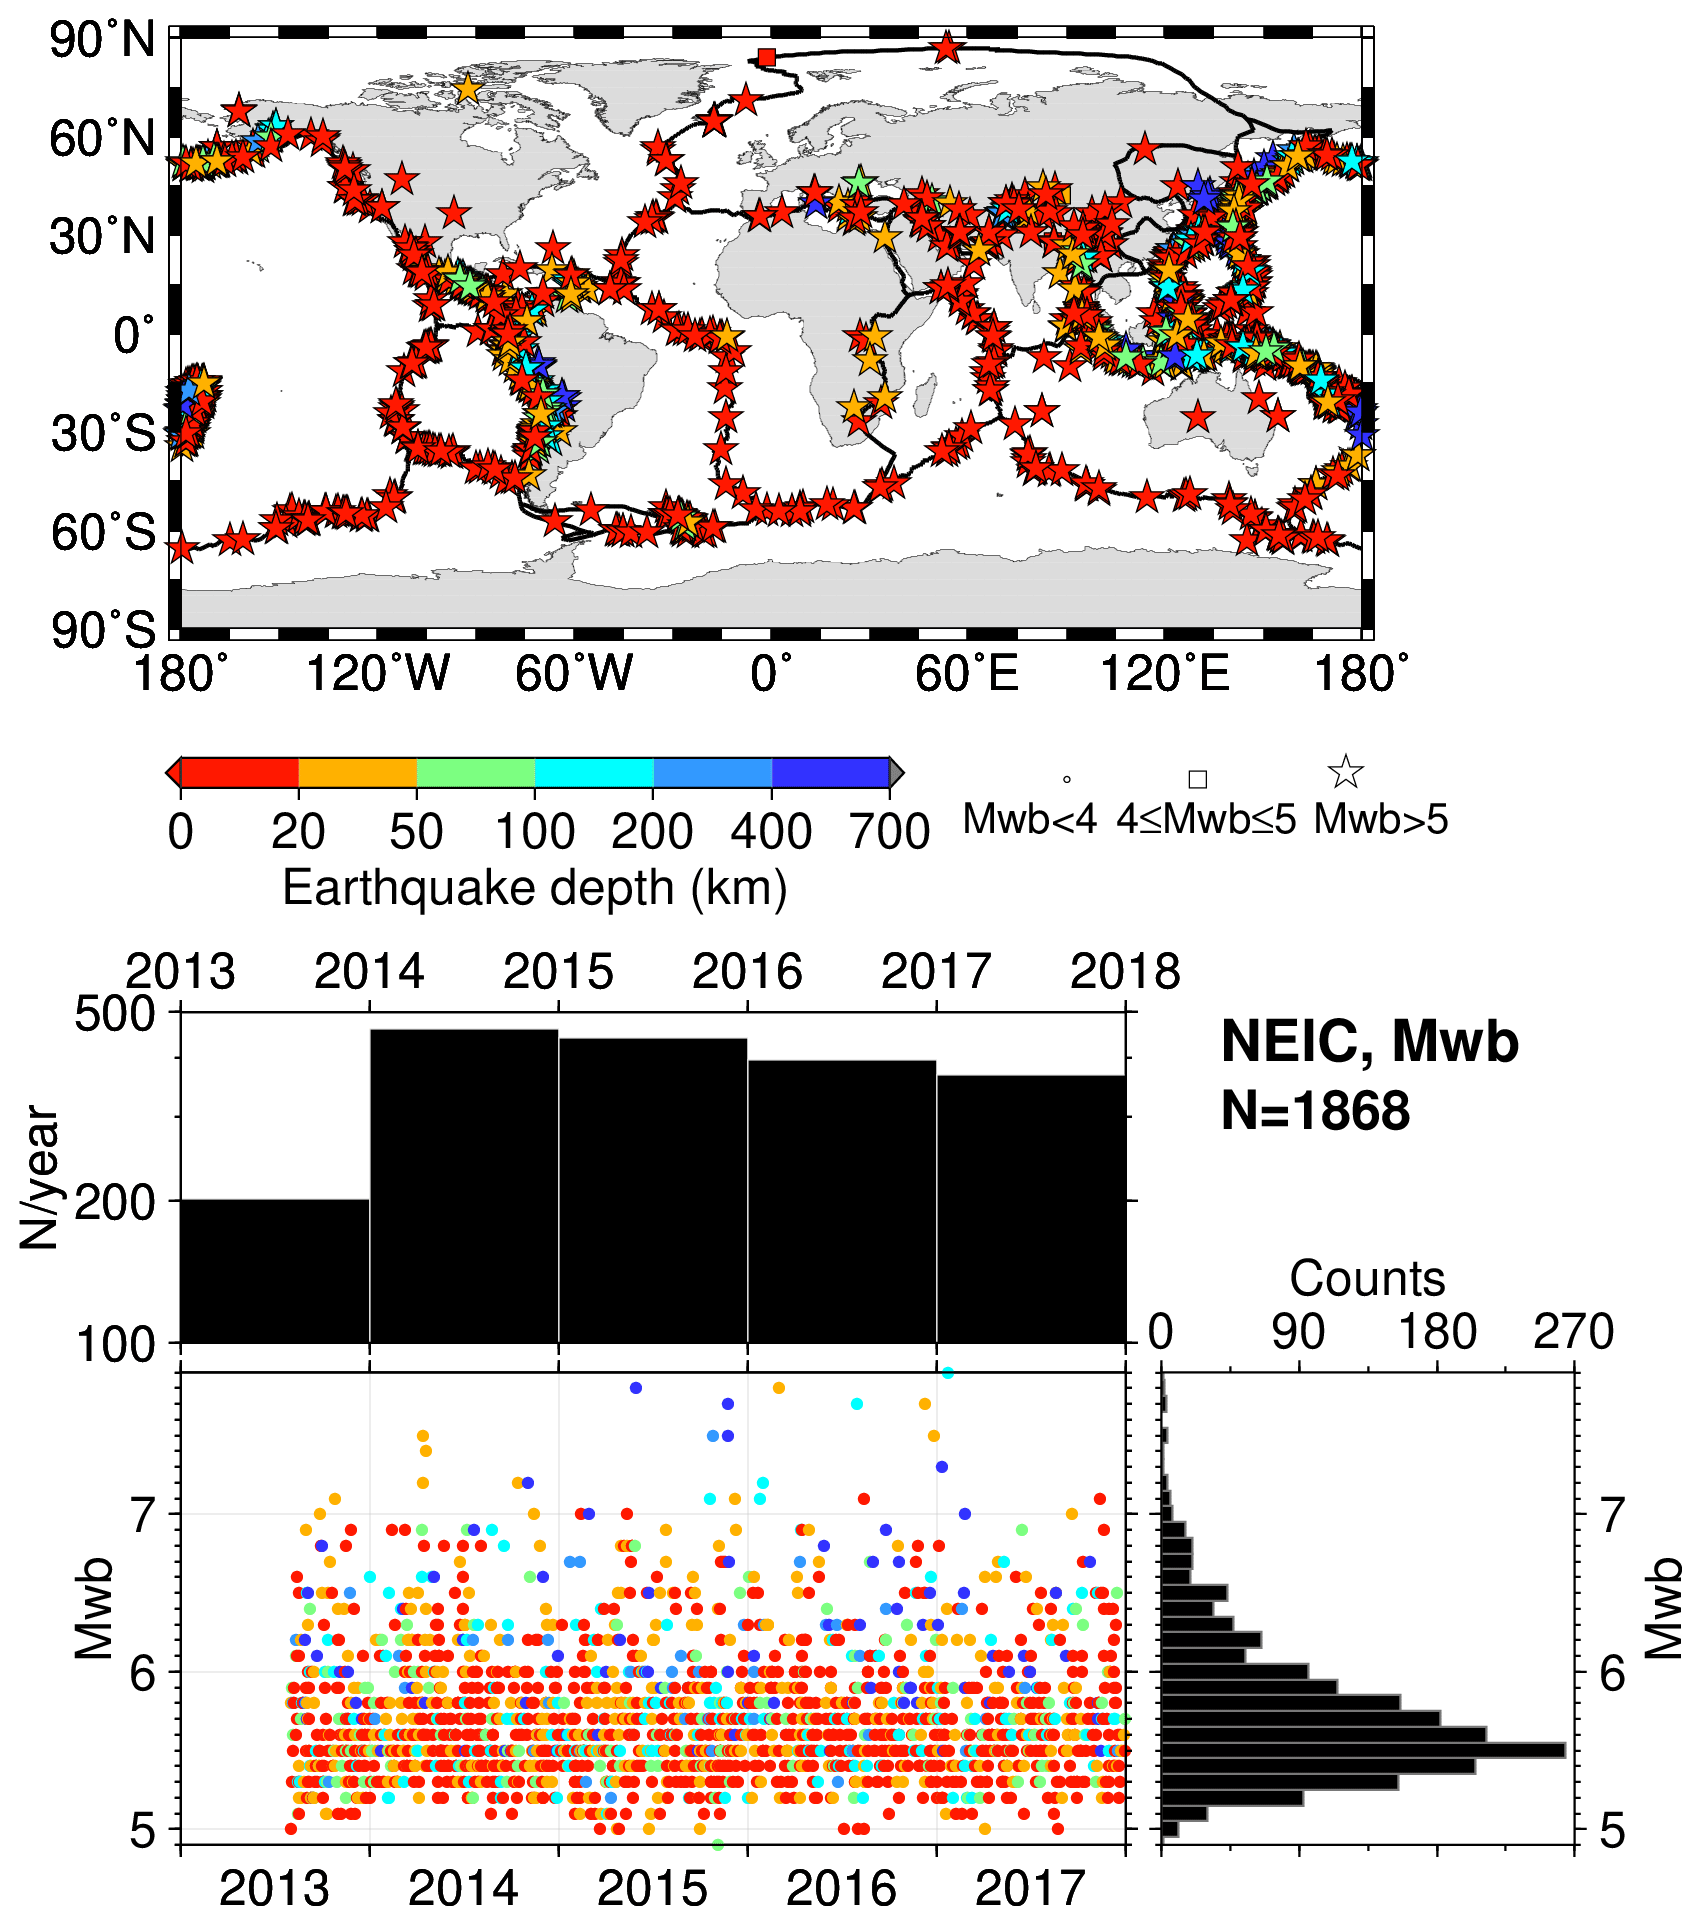
Figure A2The same as in Fig. 2 but for NEIC and Mwb. The map was drawn using the Generic Mapping Tools (GMT) (Wessel et al., 2013) software.
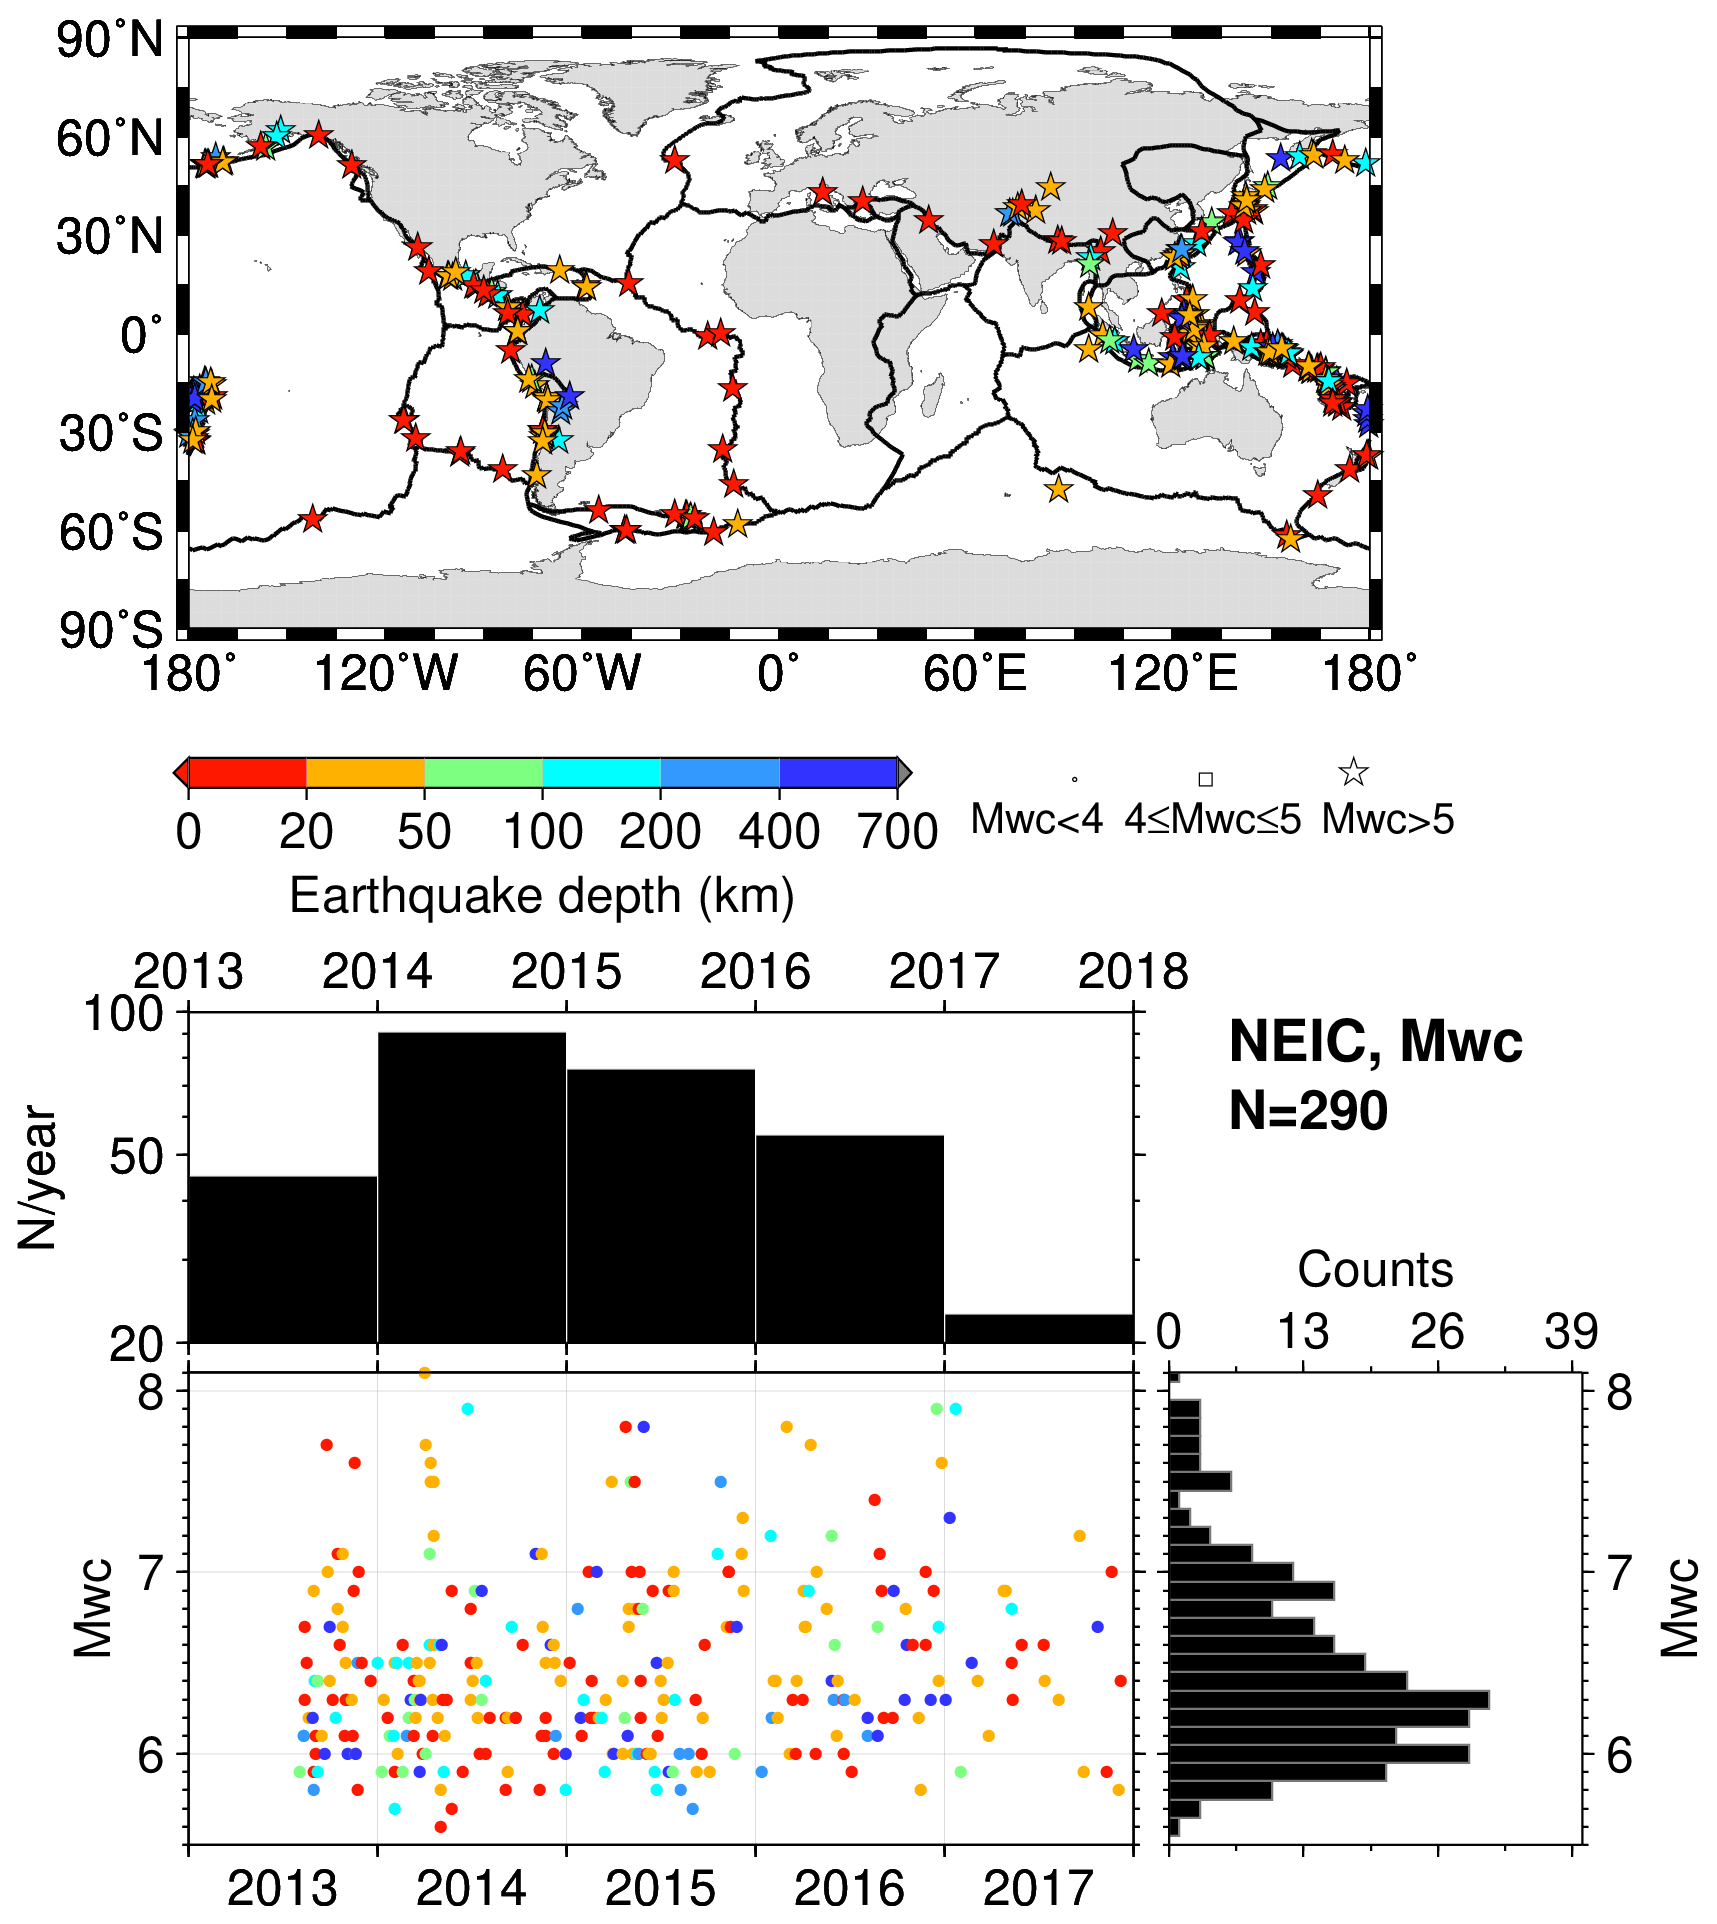
Figure A3The same as in Fig. 2 but for NEIC and Mwc. The map was drawn using the Generic Mapping Tools (GMT) (Wessel et al., 2013) software.

Figure A4The same as in Fig. 2 but for NEIC and Mwr. The map was drawn using the Generic Mapping Tools (GMT) (Wessel et al., 2013) software.
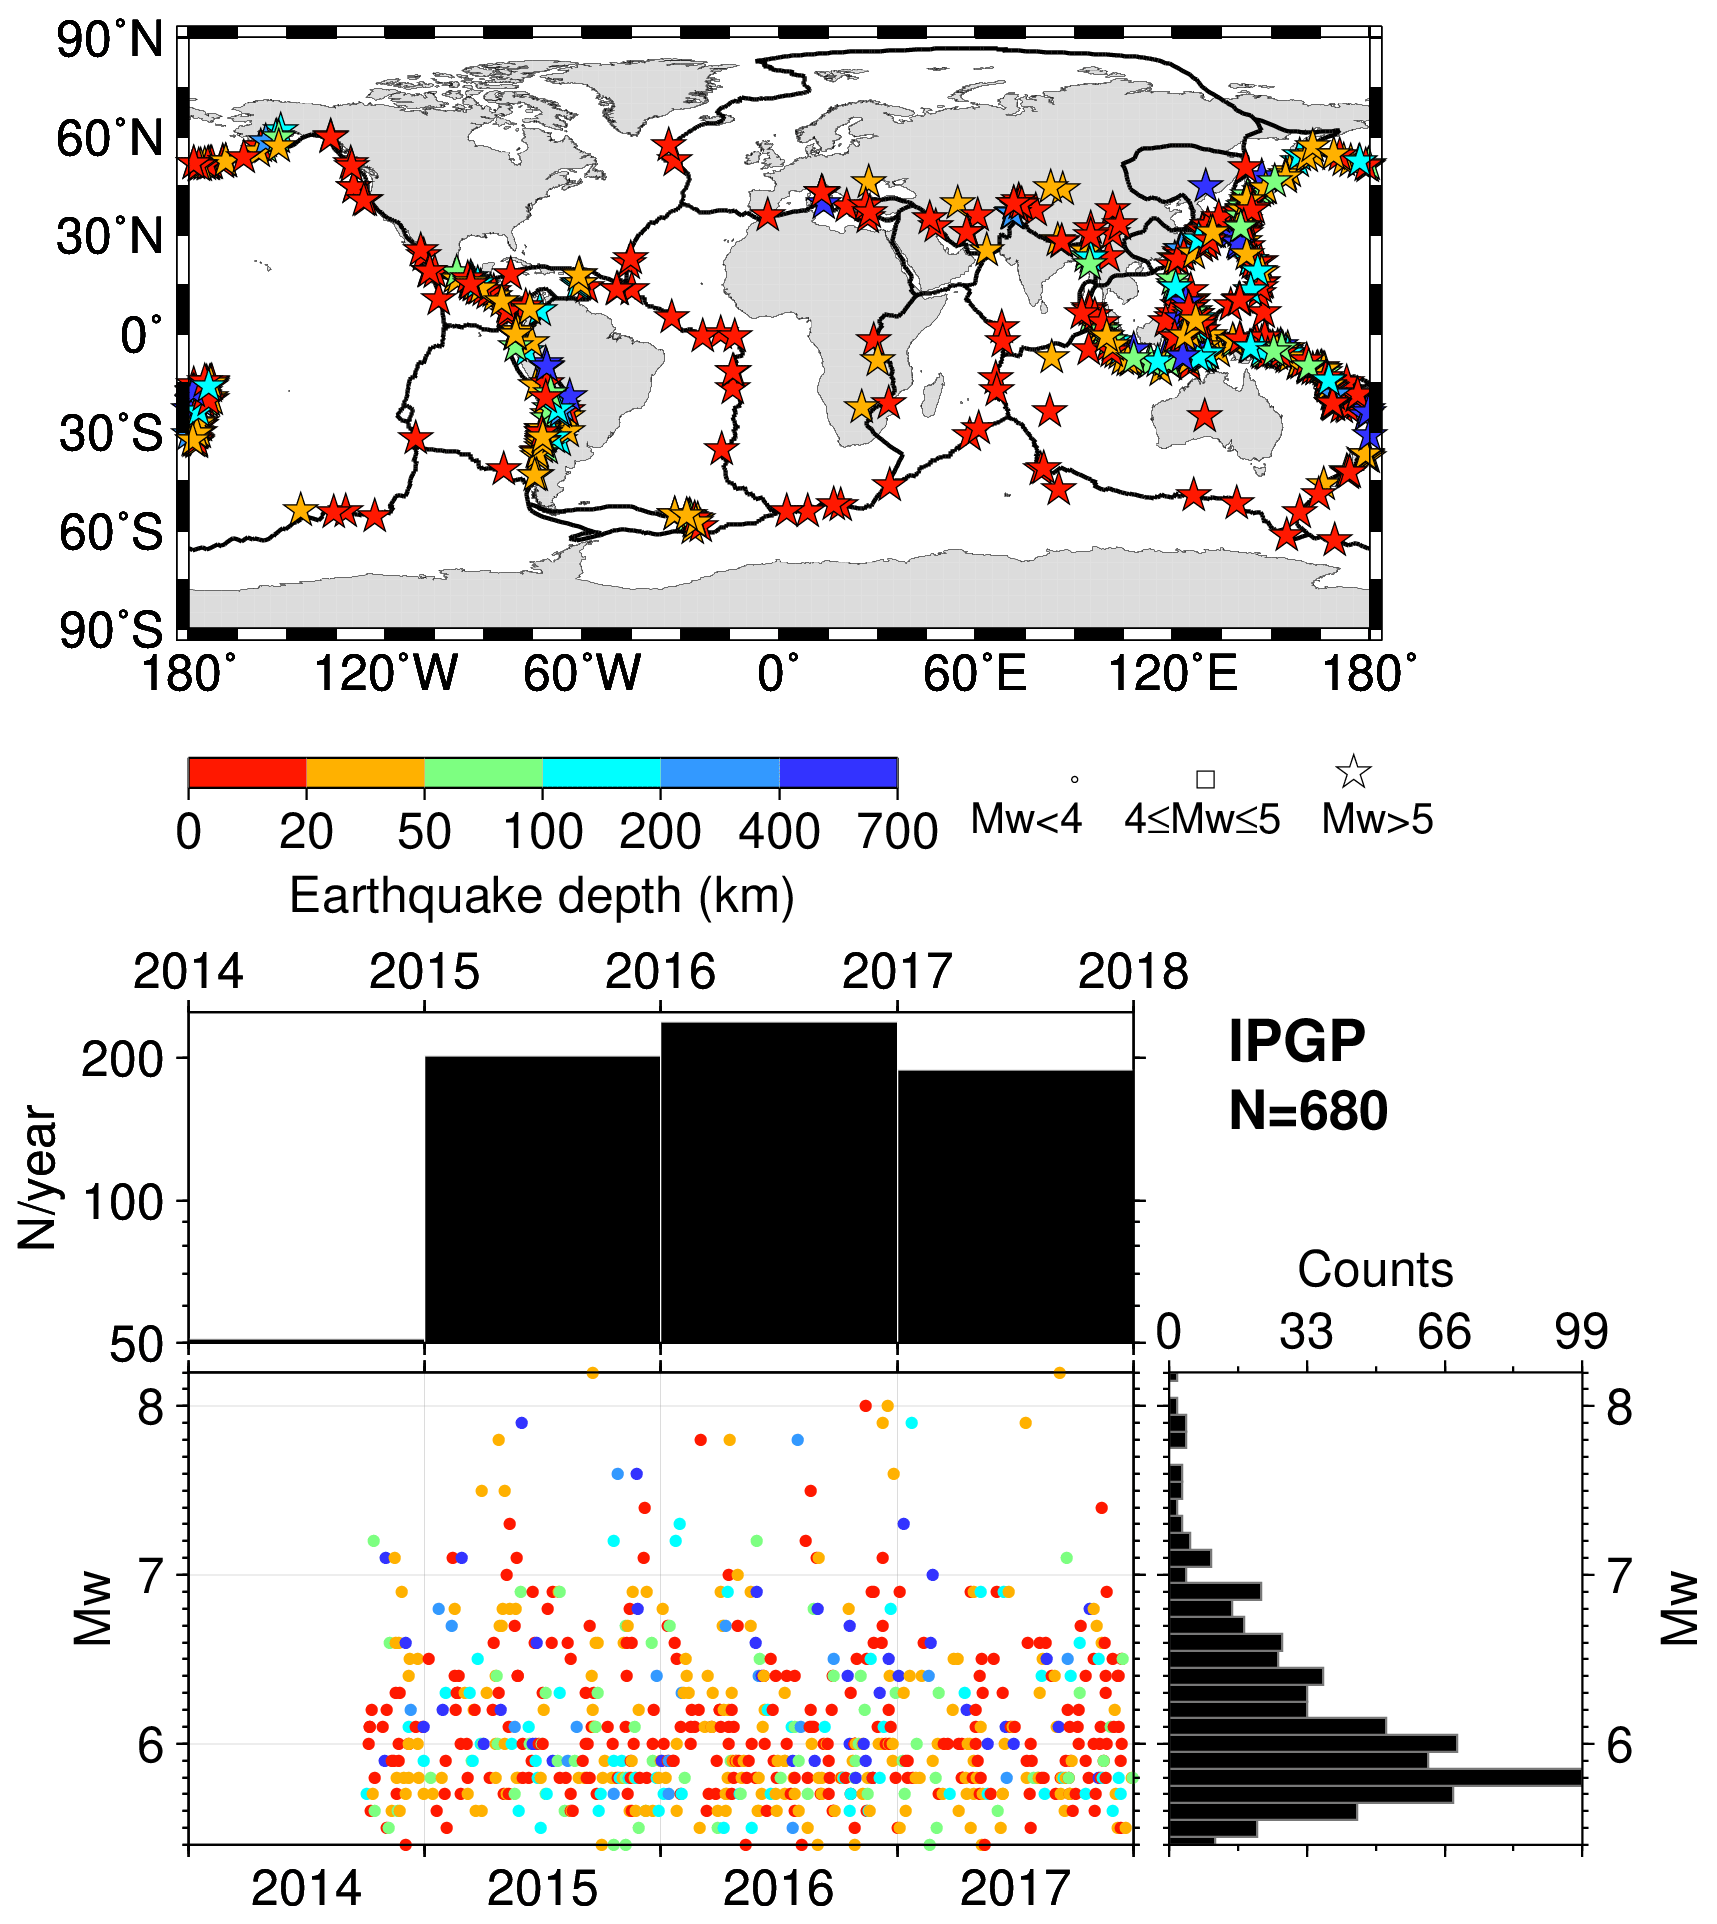
Figure A5The same as in Fig. 2 but for IPGP. The map was drawn using the Generic Mapping Tools (GMT) (Wessel et al., 2013) software.
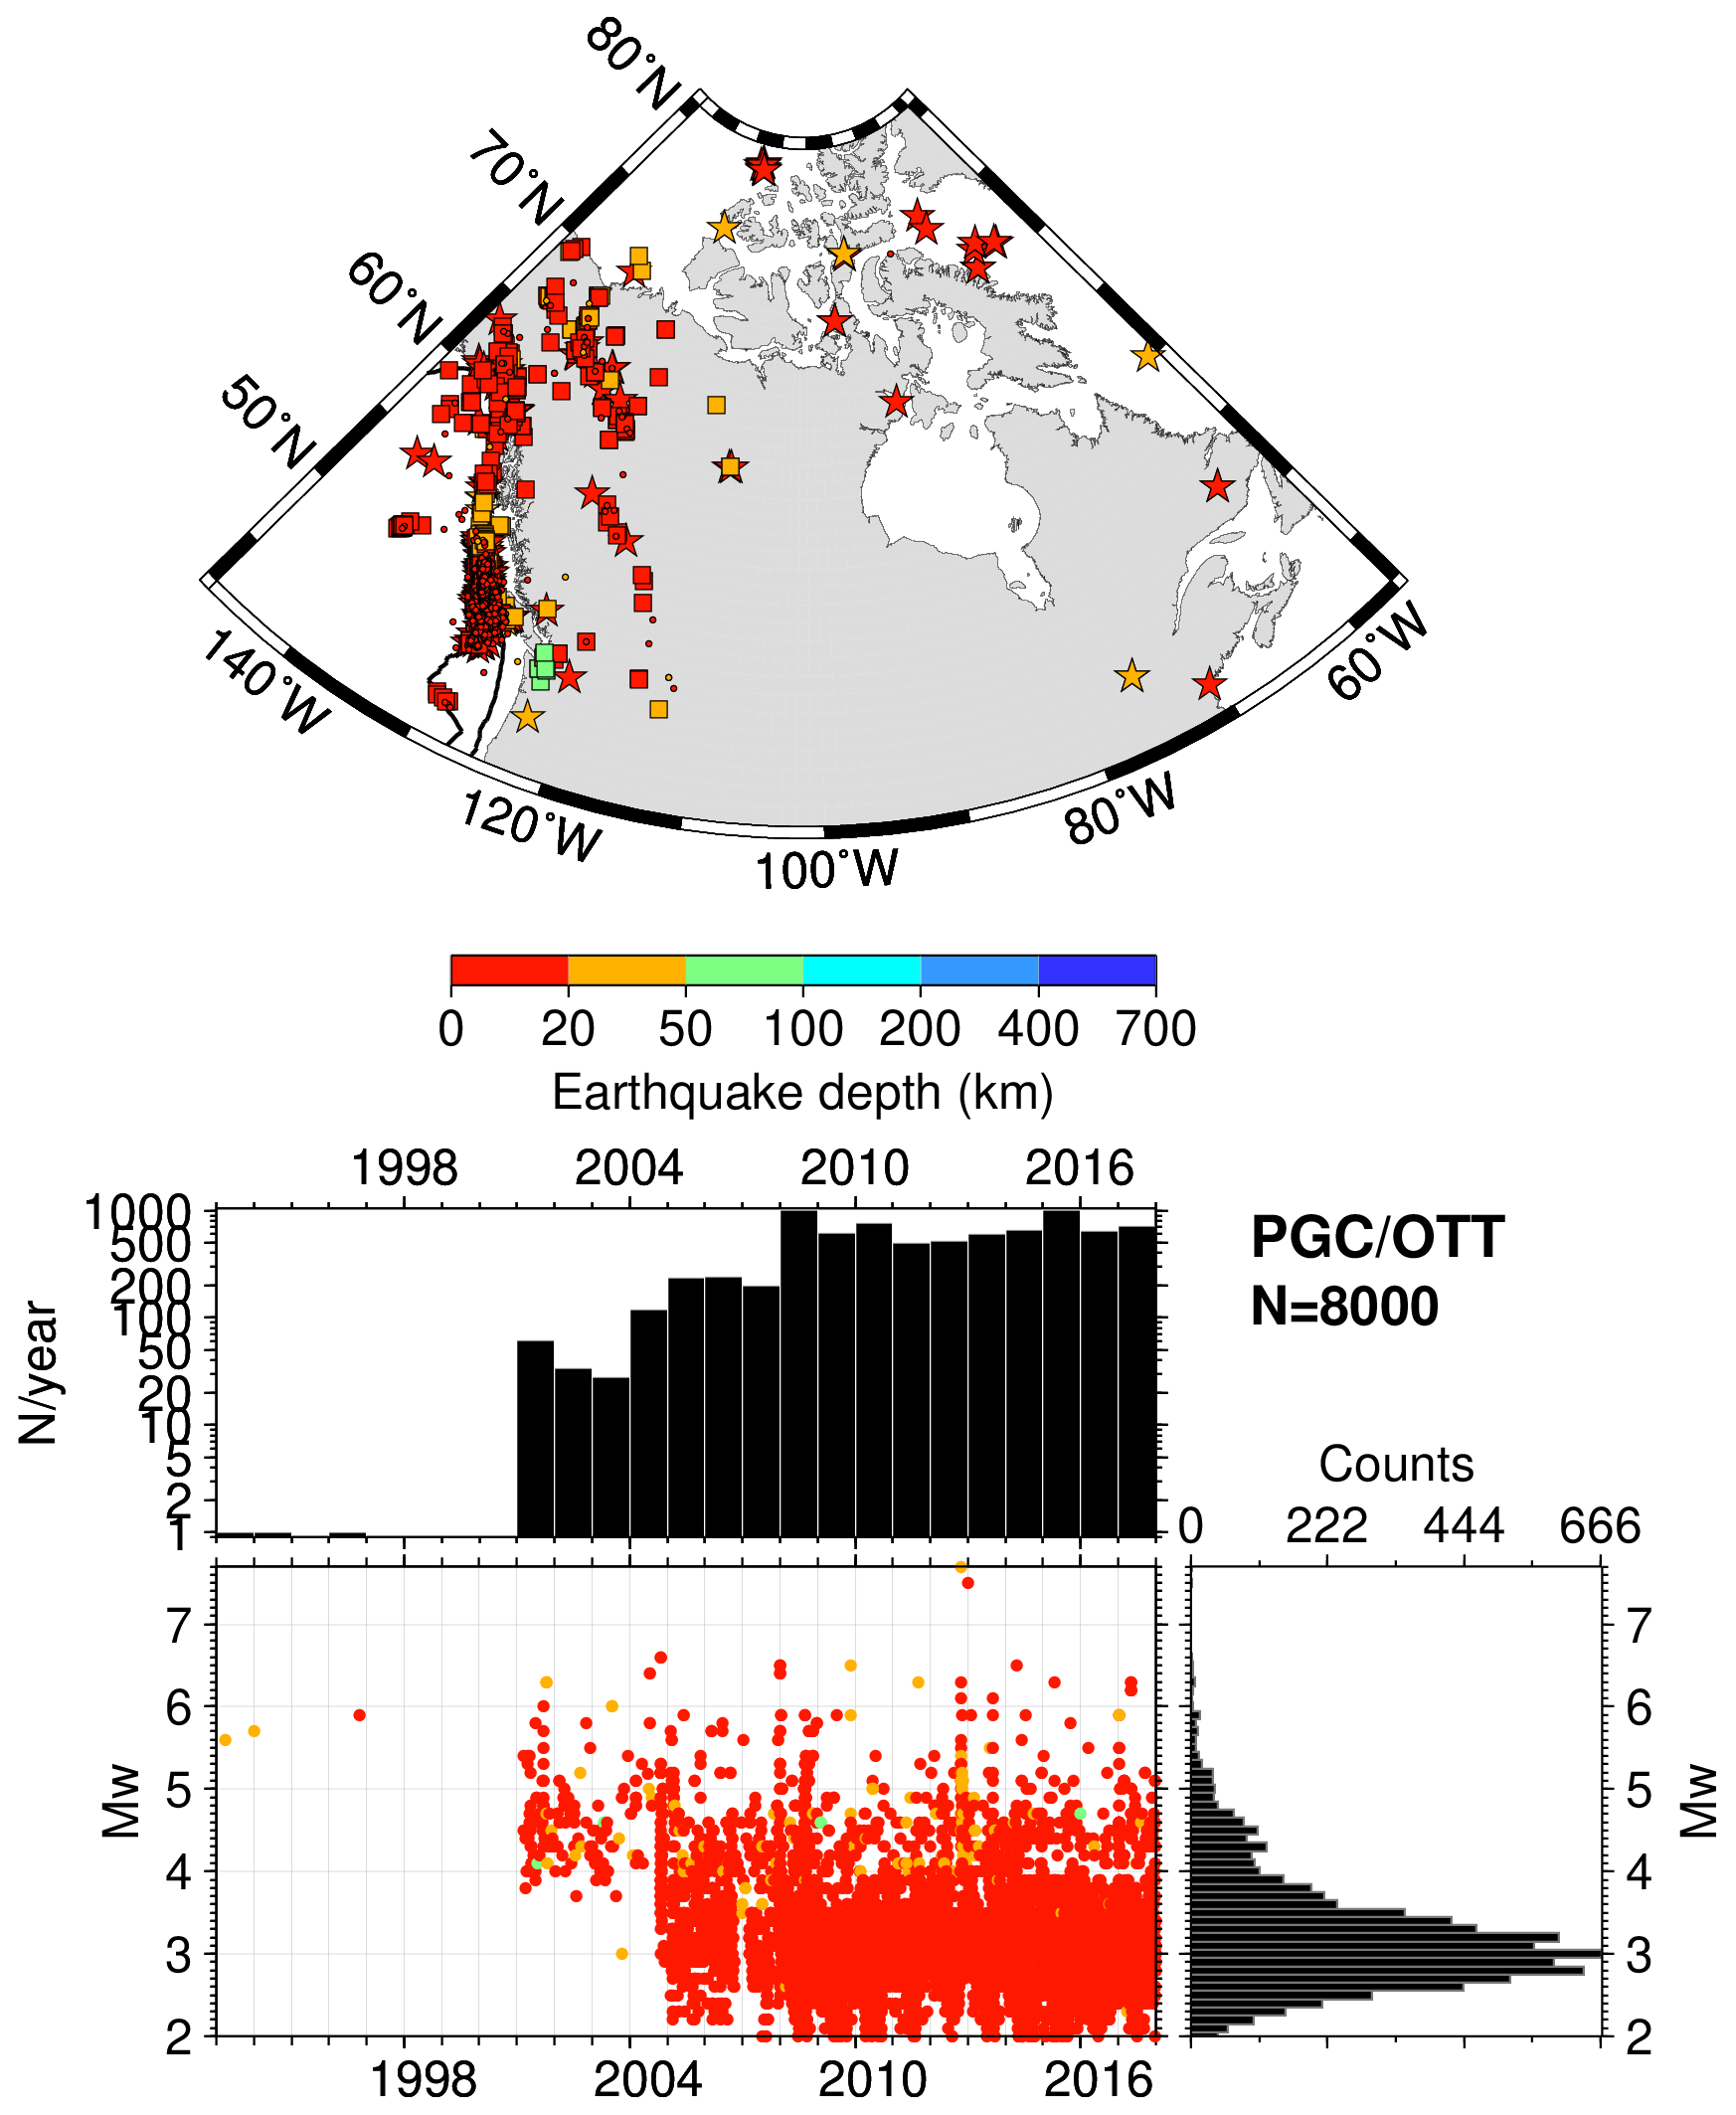
Figure A6The same as in Fig. 2 but for PGC and OTT. The procedures used by this reporter are described at http://www.isc.ac.uk/iscbulletin/agencies/OTT-MW-mags.pdf (last access: April 2021) and Mulder (2015). The map was drawn using the Generic Mapping Tools (GMT) (Wessel et al., 2013) software.
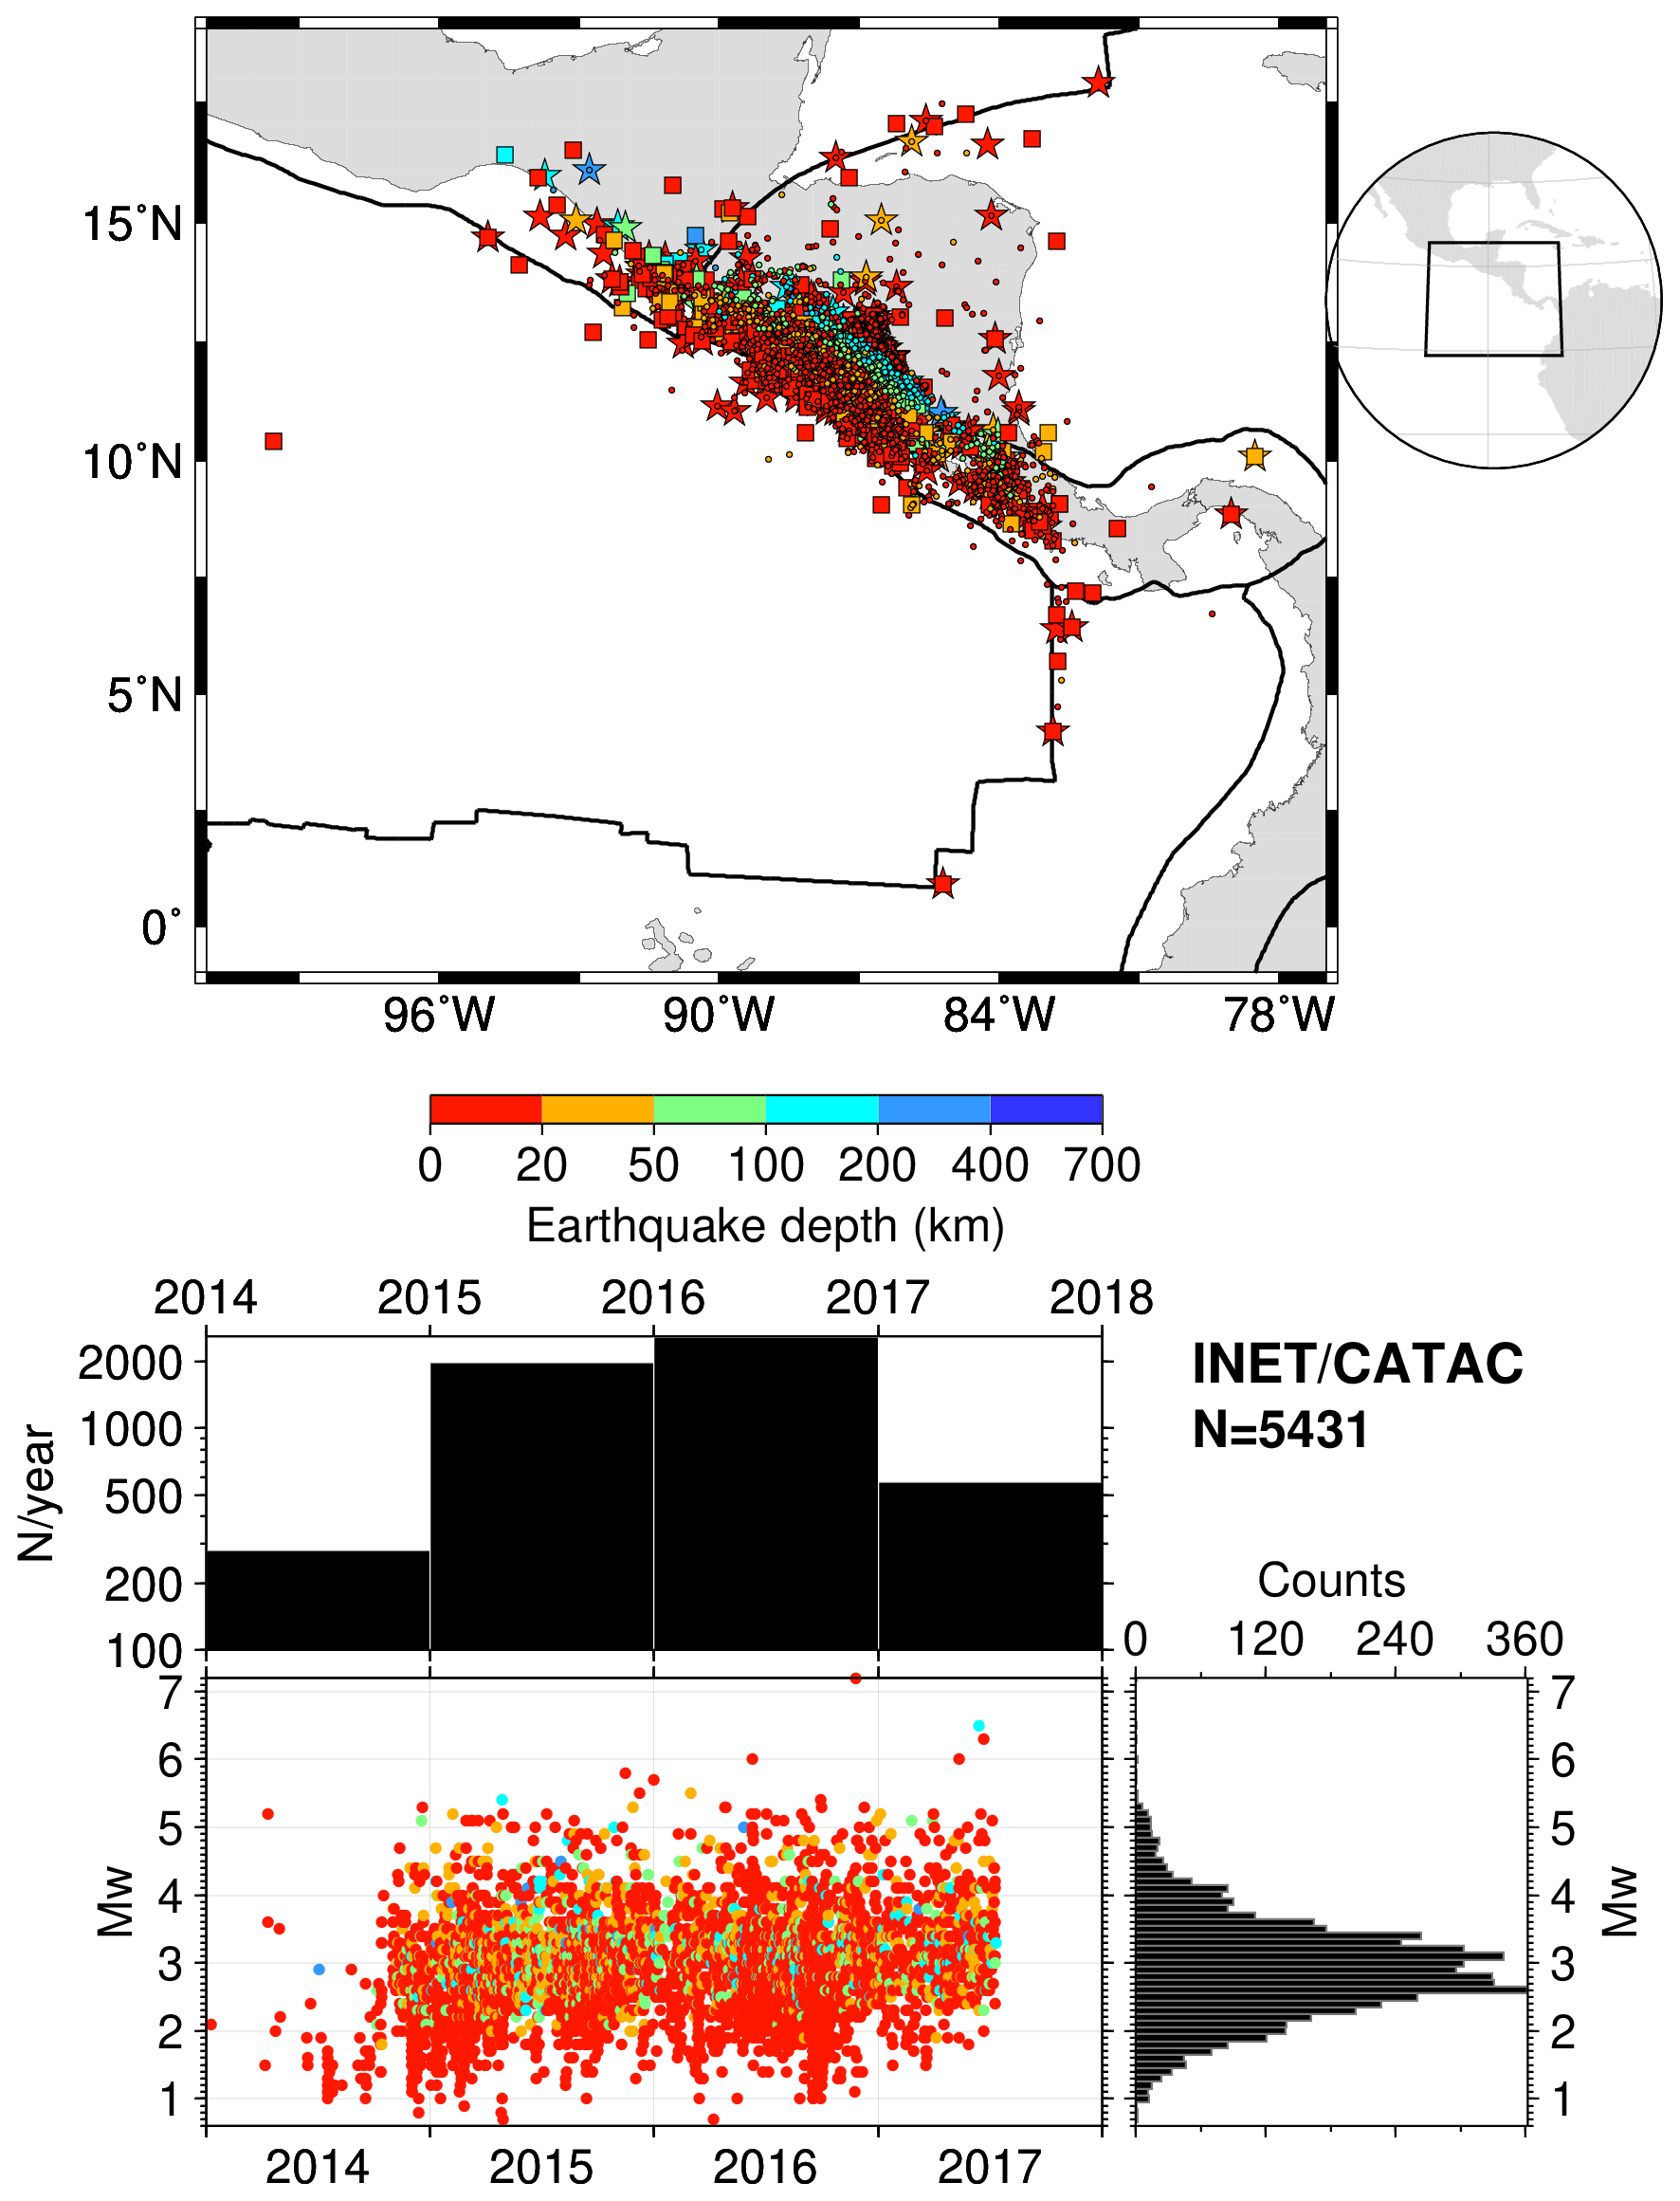
Figure A7The same as in Fig. 2 but for INET and CATAC. The map was drawn using the Generic Mapping Tools (GMT) (Wessel et al., 2013) software.
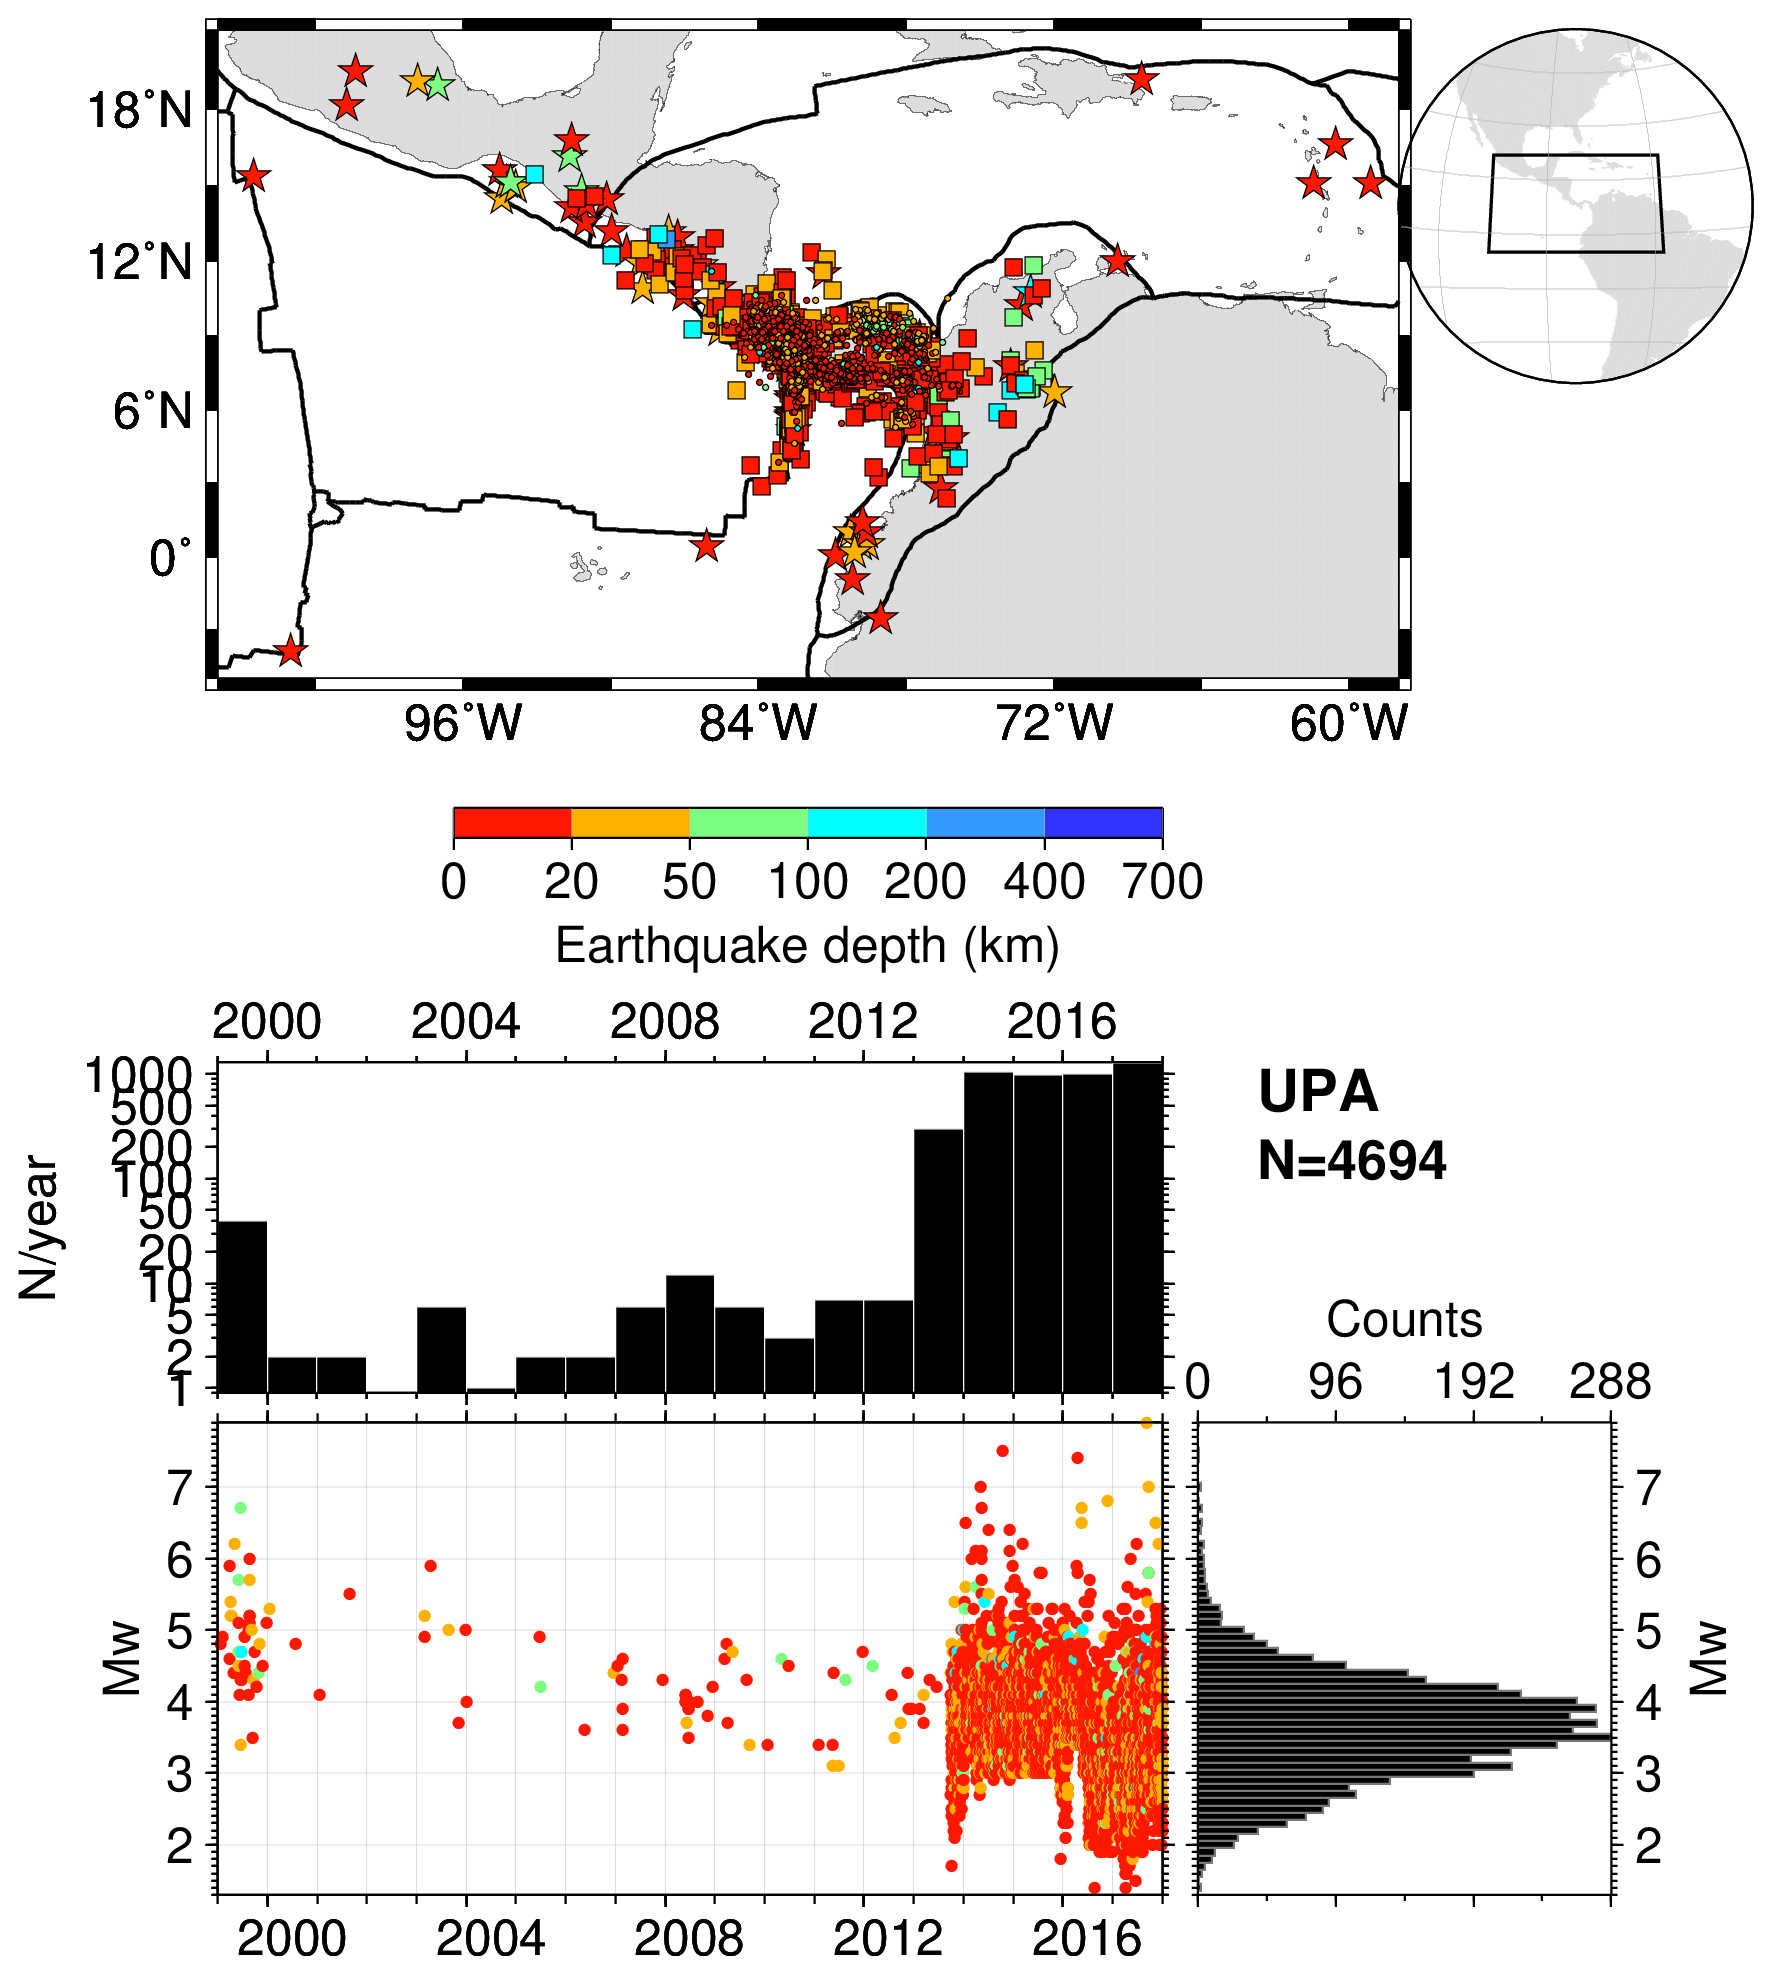
Figure A8The same as in Fig. 2 but for UPA. The map was drawn using the Generic Mapping Tools (GMT) (Wessel et al., 2013) software.
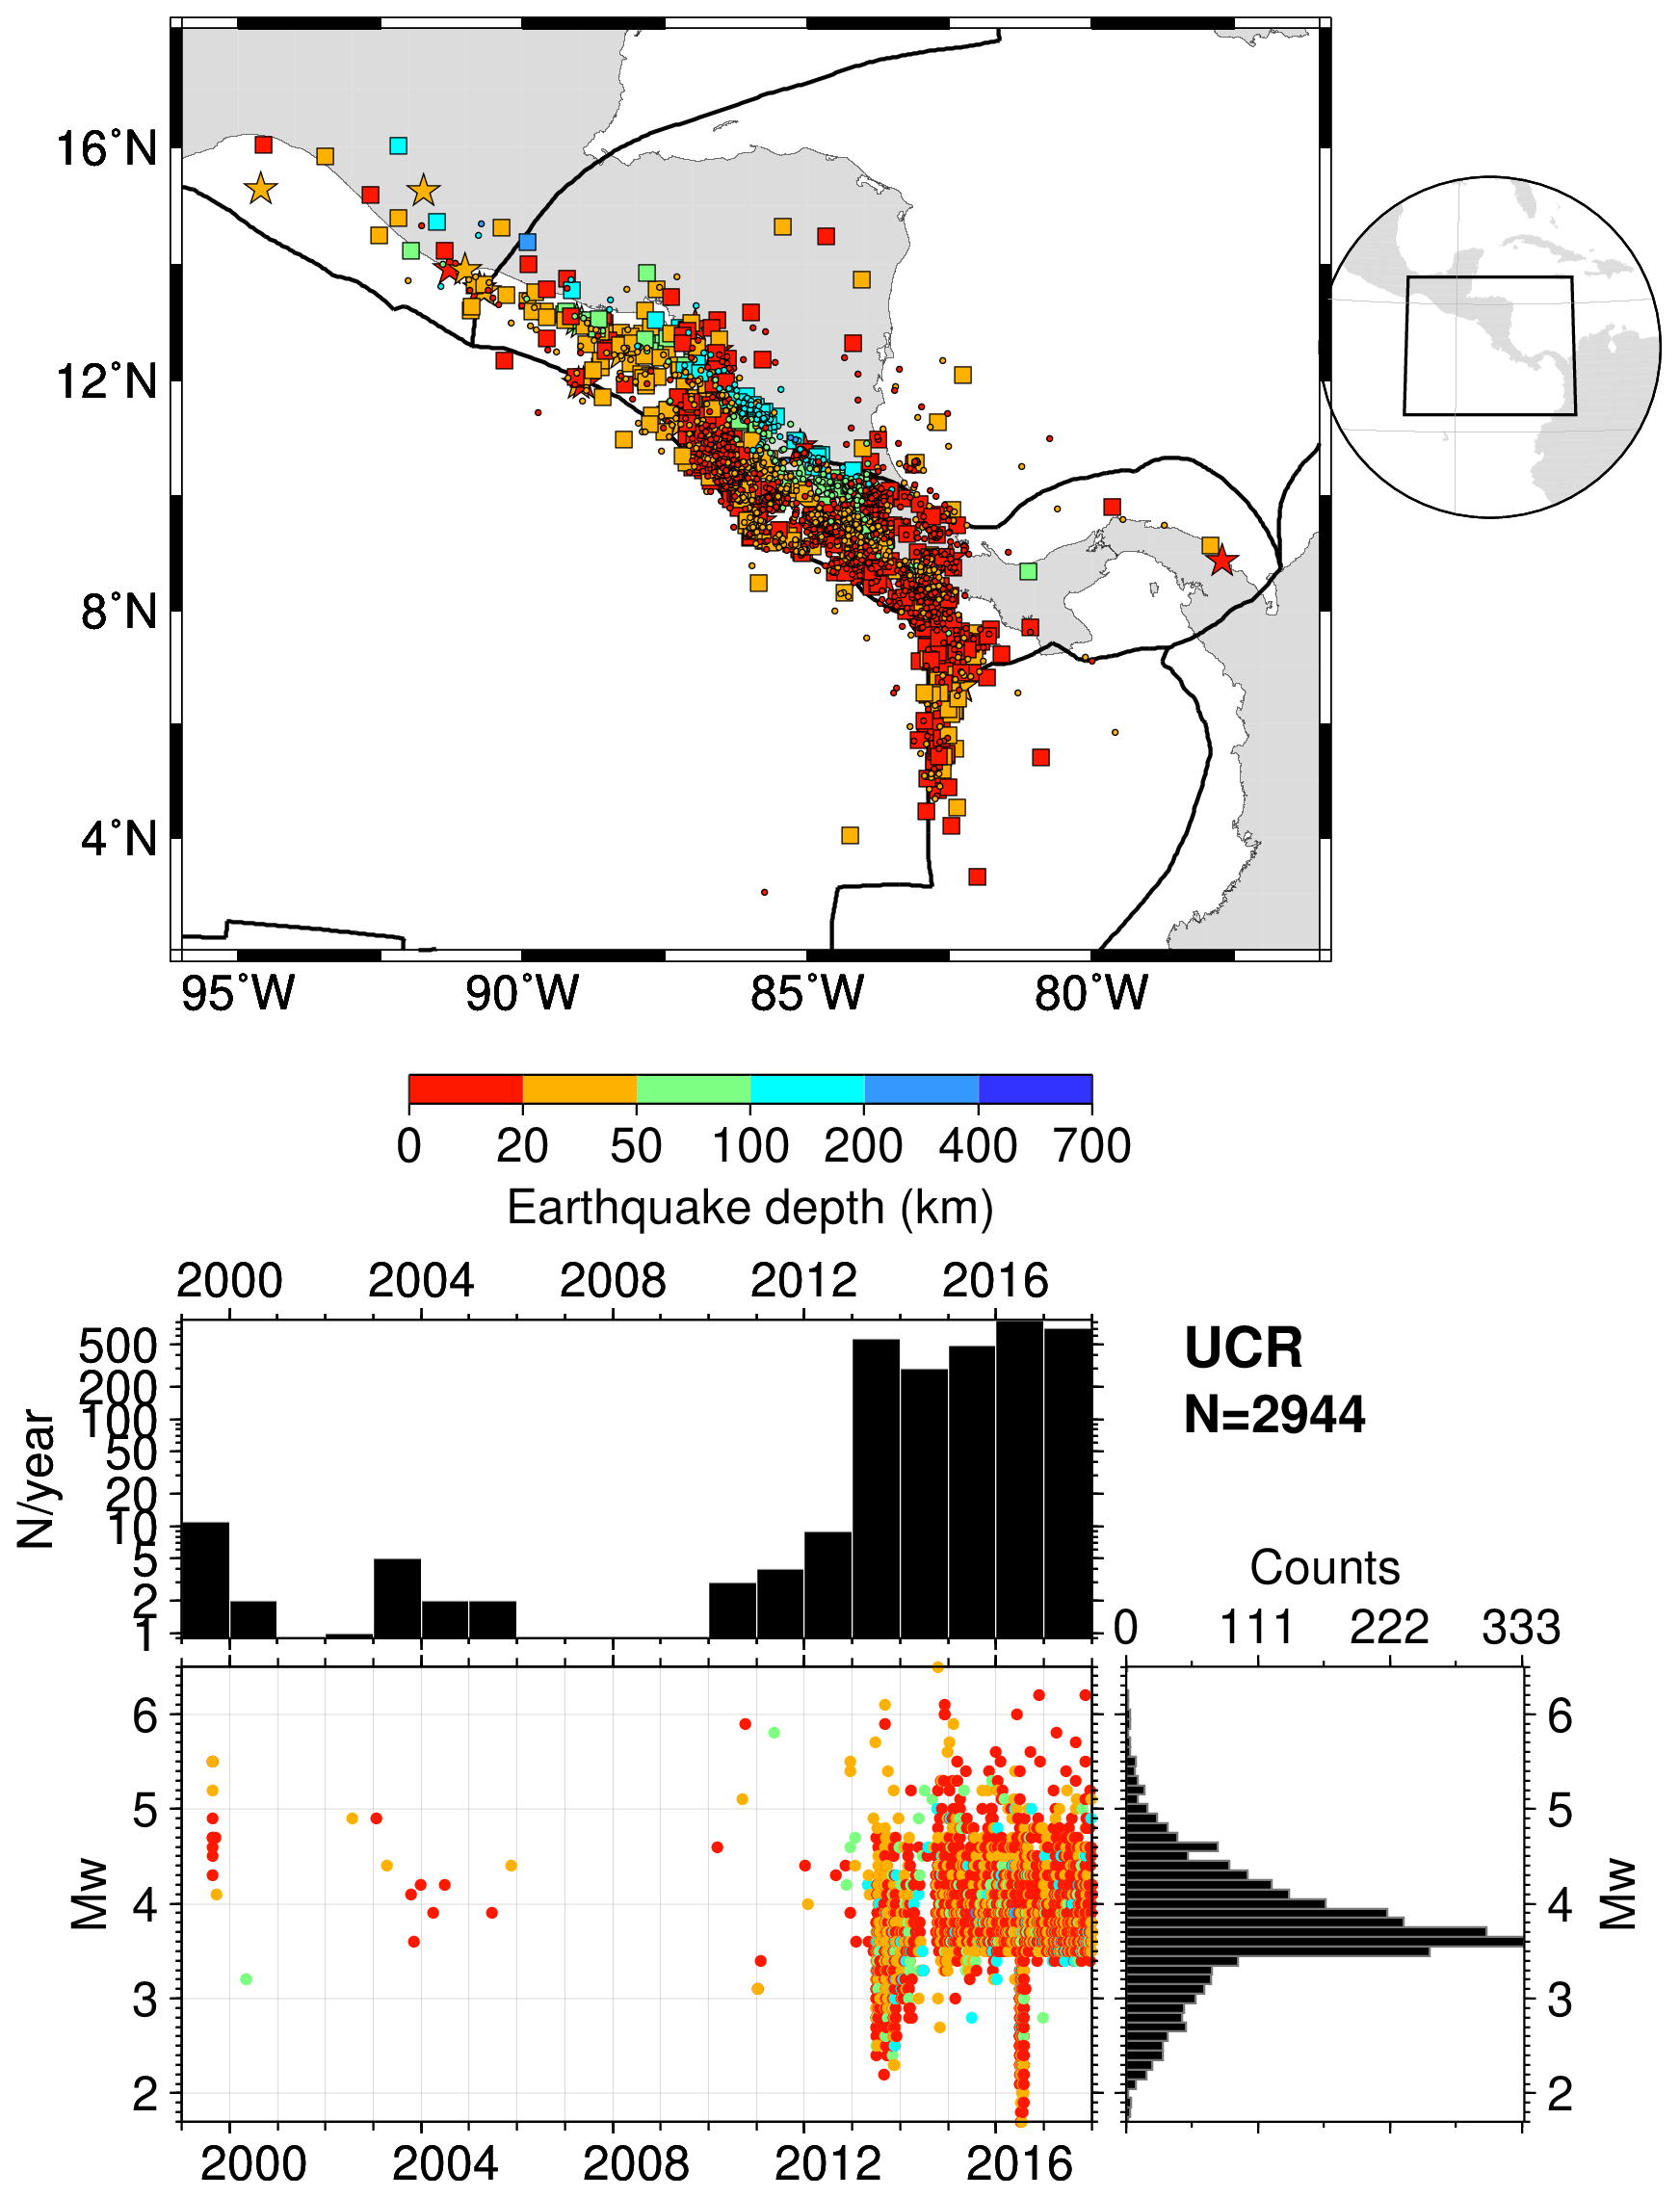
Figure A9The same as in Fig. 2 but for UCR. The map was drawn using the Generic Mapping Tools (GMT) (Wessel et al., 2013) software.

Figure A10The same as in Fig. 2 but for RSNC. The map was drawn using the Generic Mapping Tools (GMT) (Wessel et al., 2013) software.
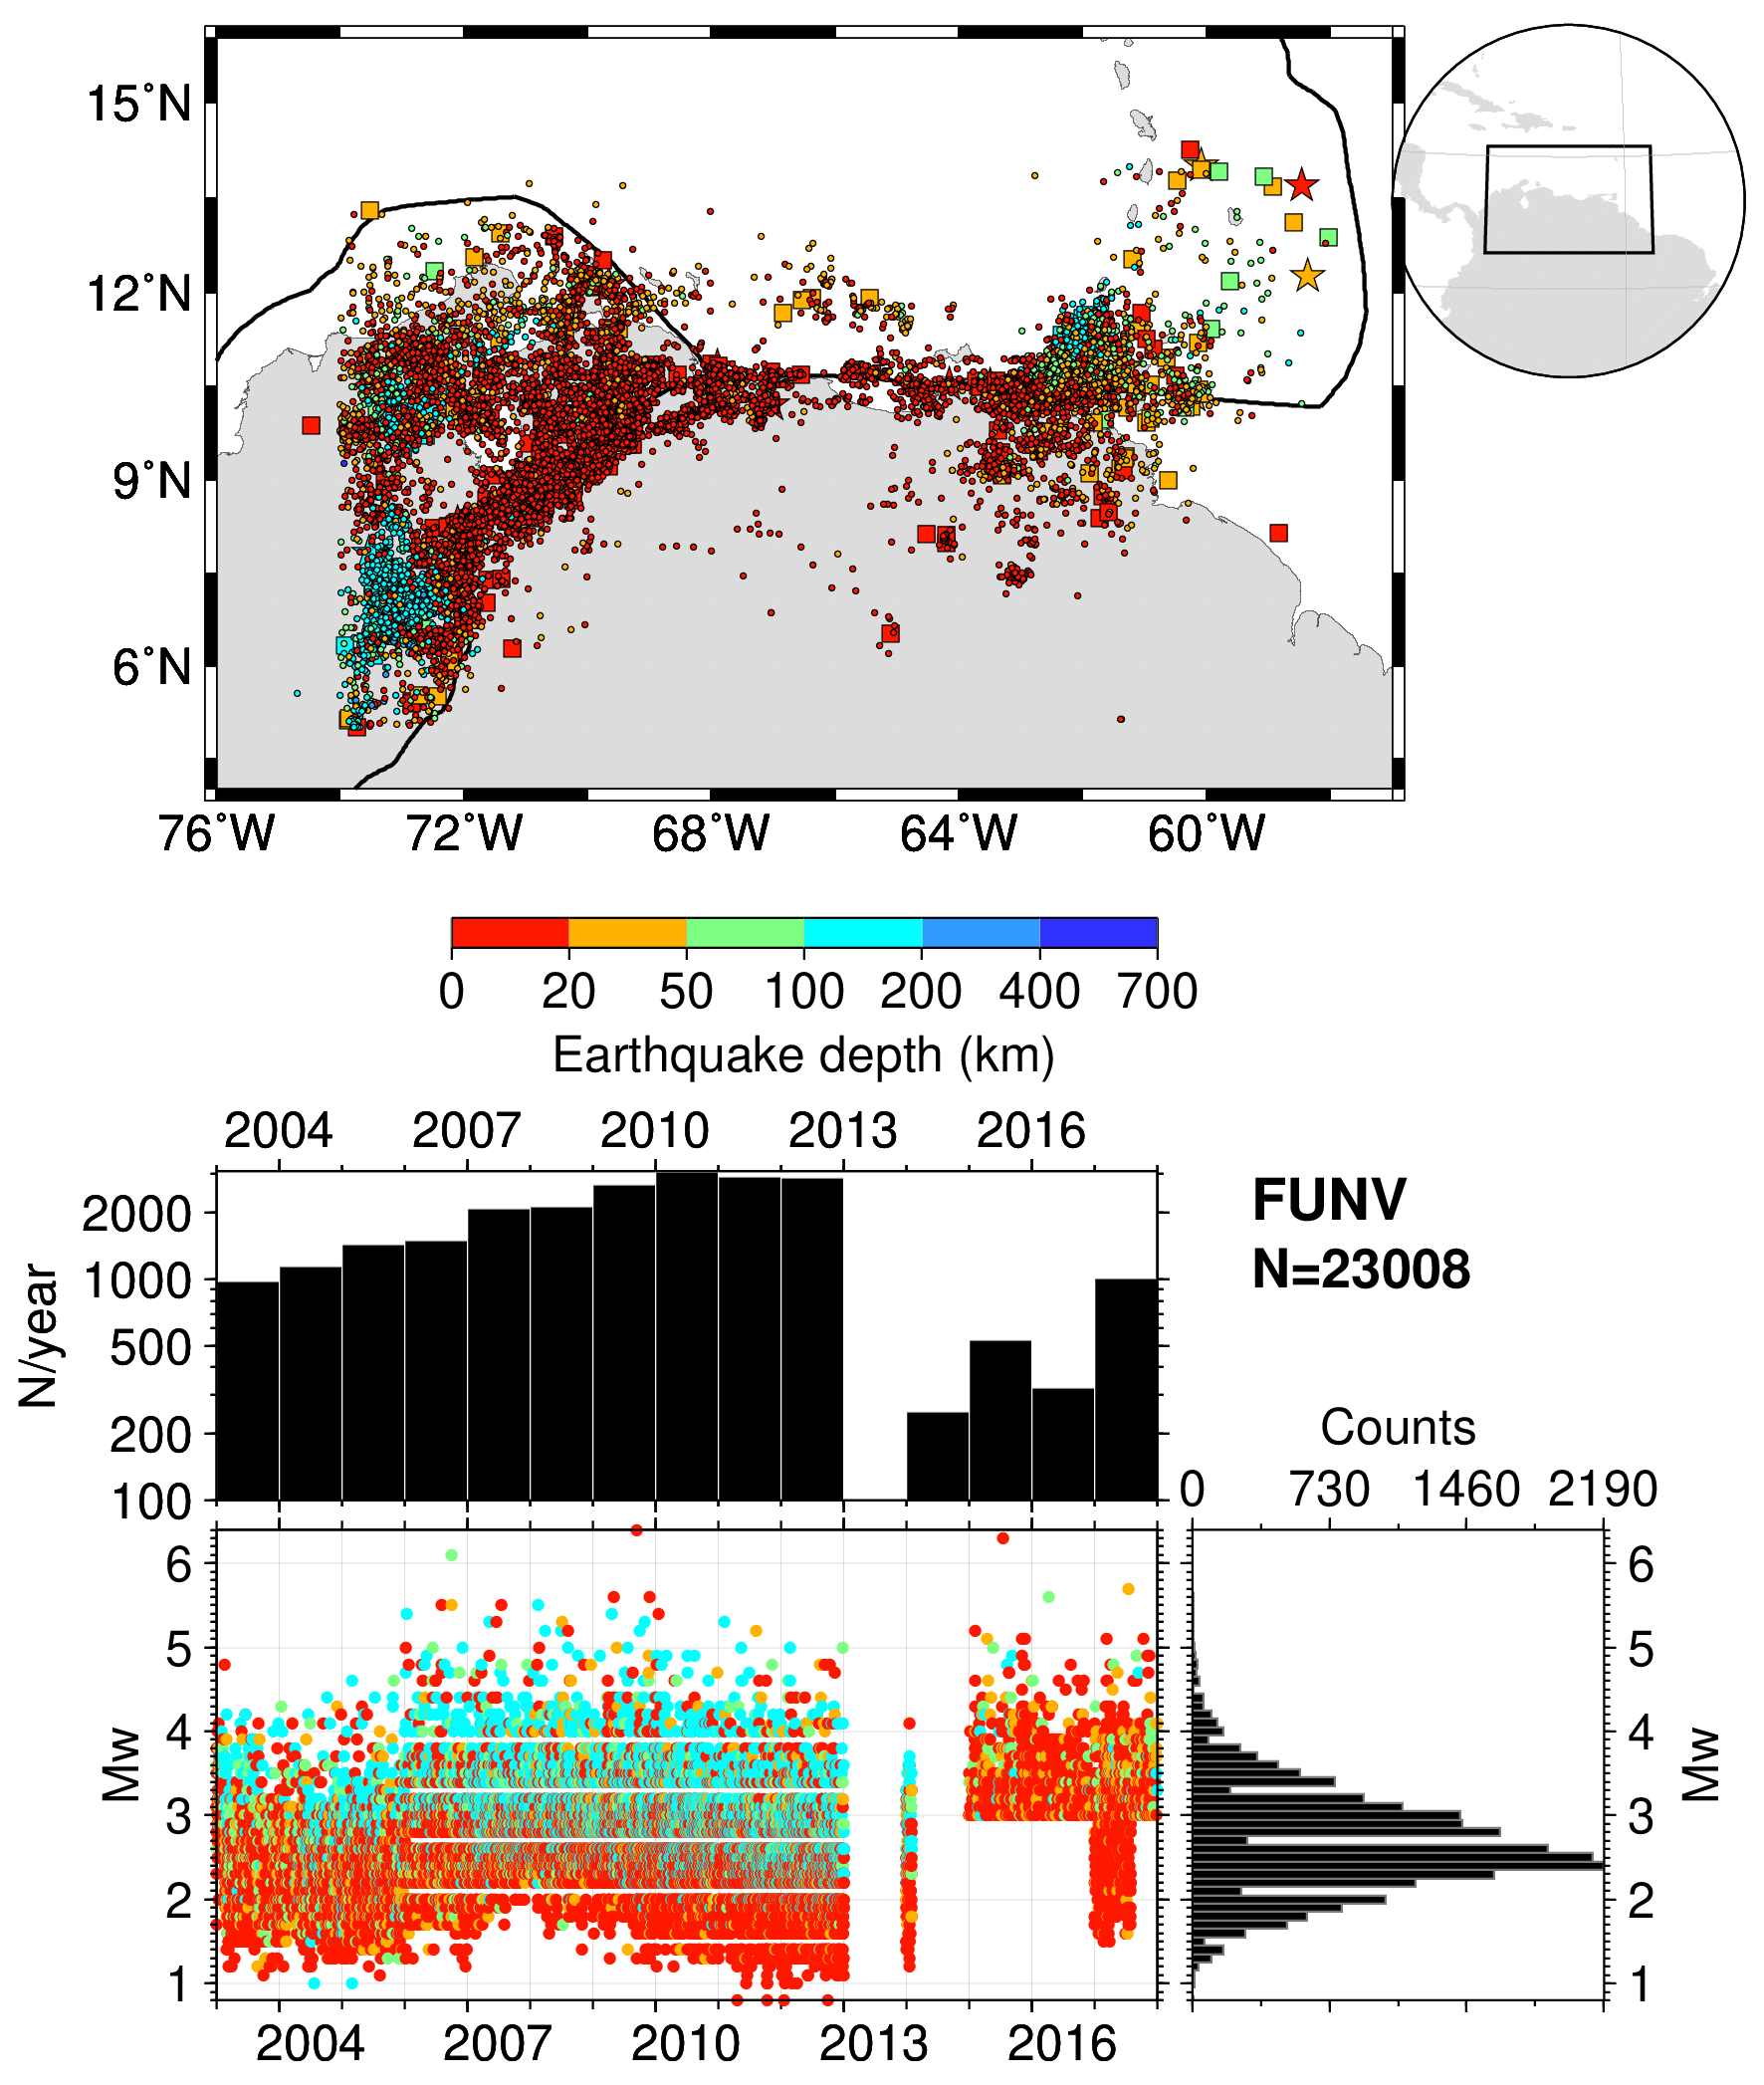
Figure A11The same as in Fig. 2 but for FUNV. Possible rounding effects in pre-2013 Mw values are visible in the timeline and histograms. The map was drawn using the Generic Mapping Tools (GMT) (Wessel et al., 2013) software.
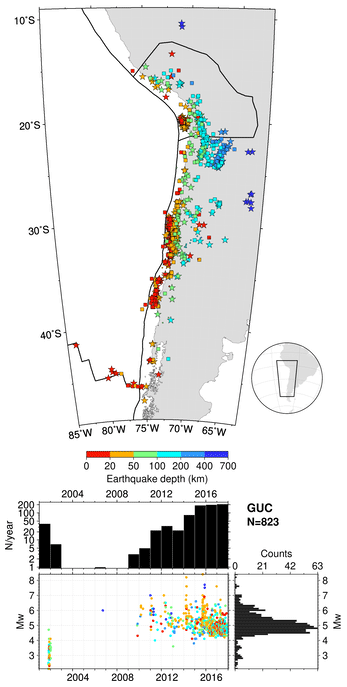
Figure A12The same as in Fig. 2 but for GUC. The map was drawn using the Generic Mapping Tools (GMT) (Wessel et al., 2013) software.
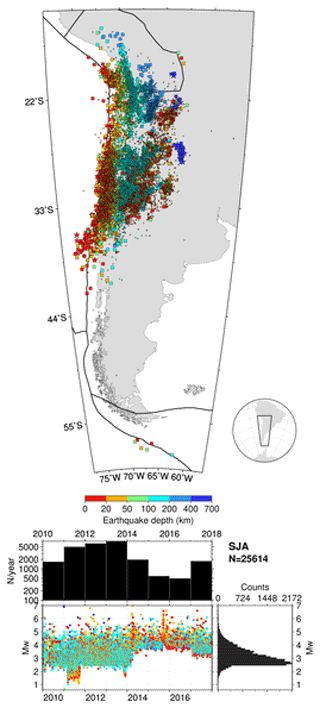
Figure A13The same as in Fig. 2 but for SJA. The map was drawn using the Generic Mapping Tools (GMT) (Wessel et al., 2013) software.
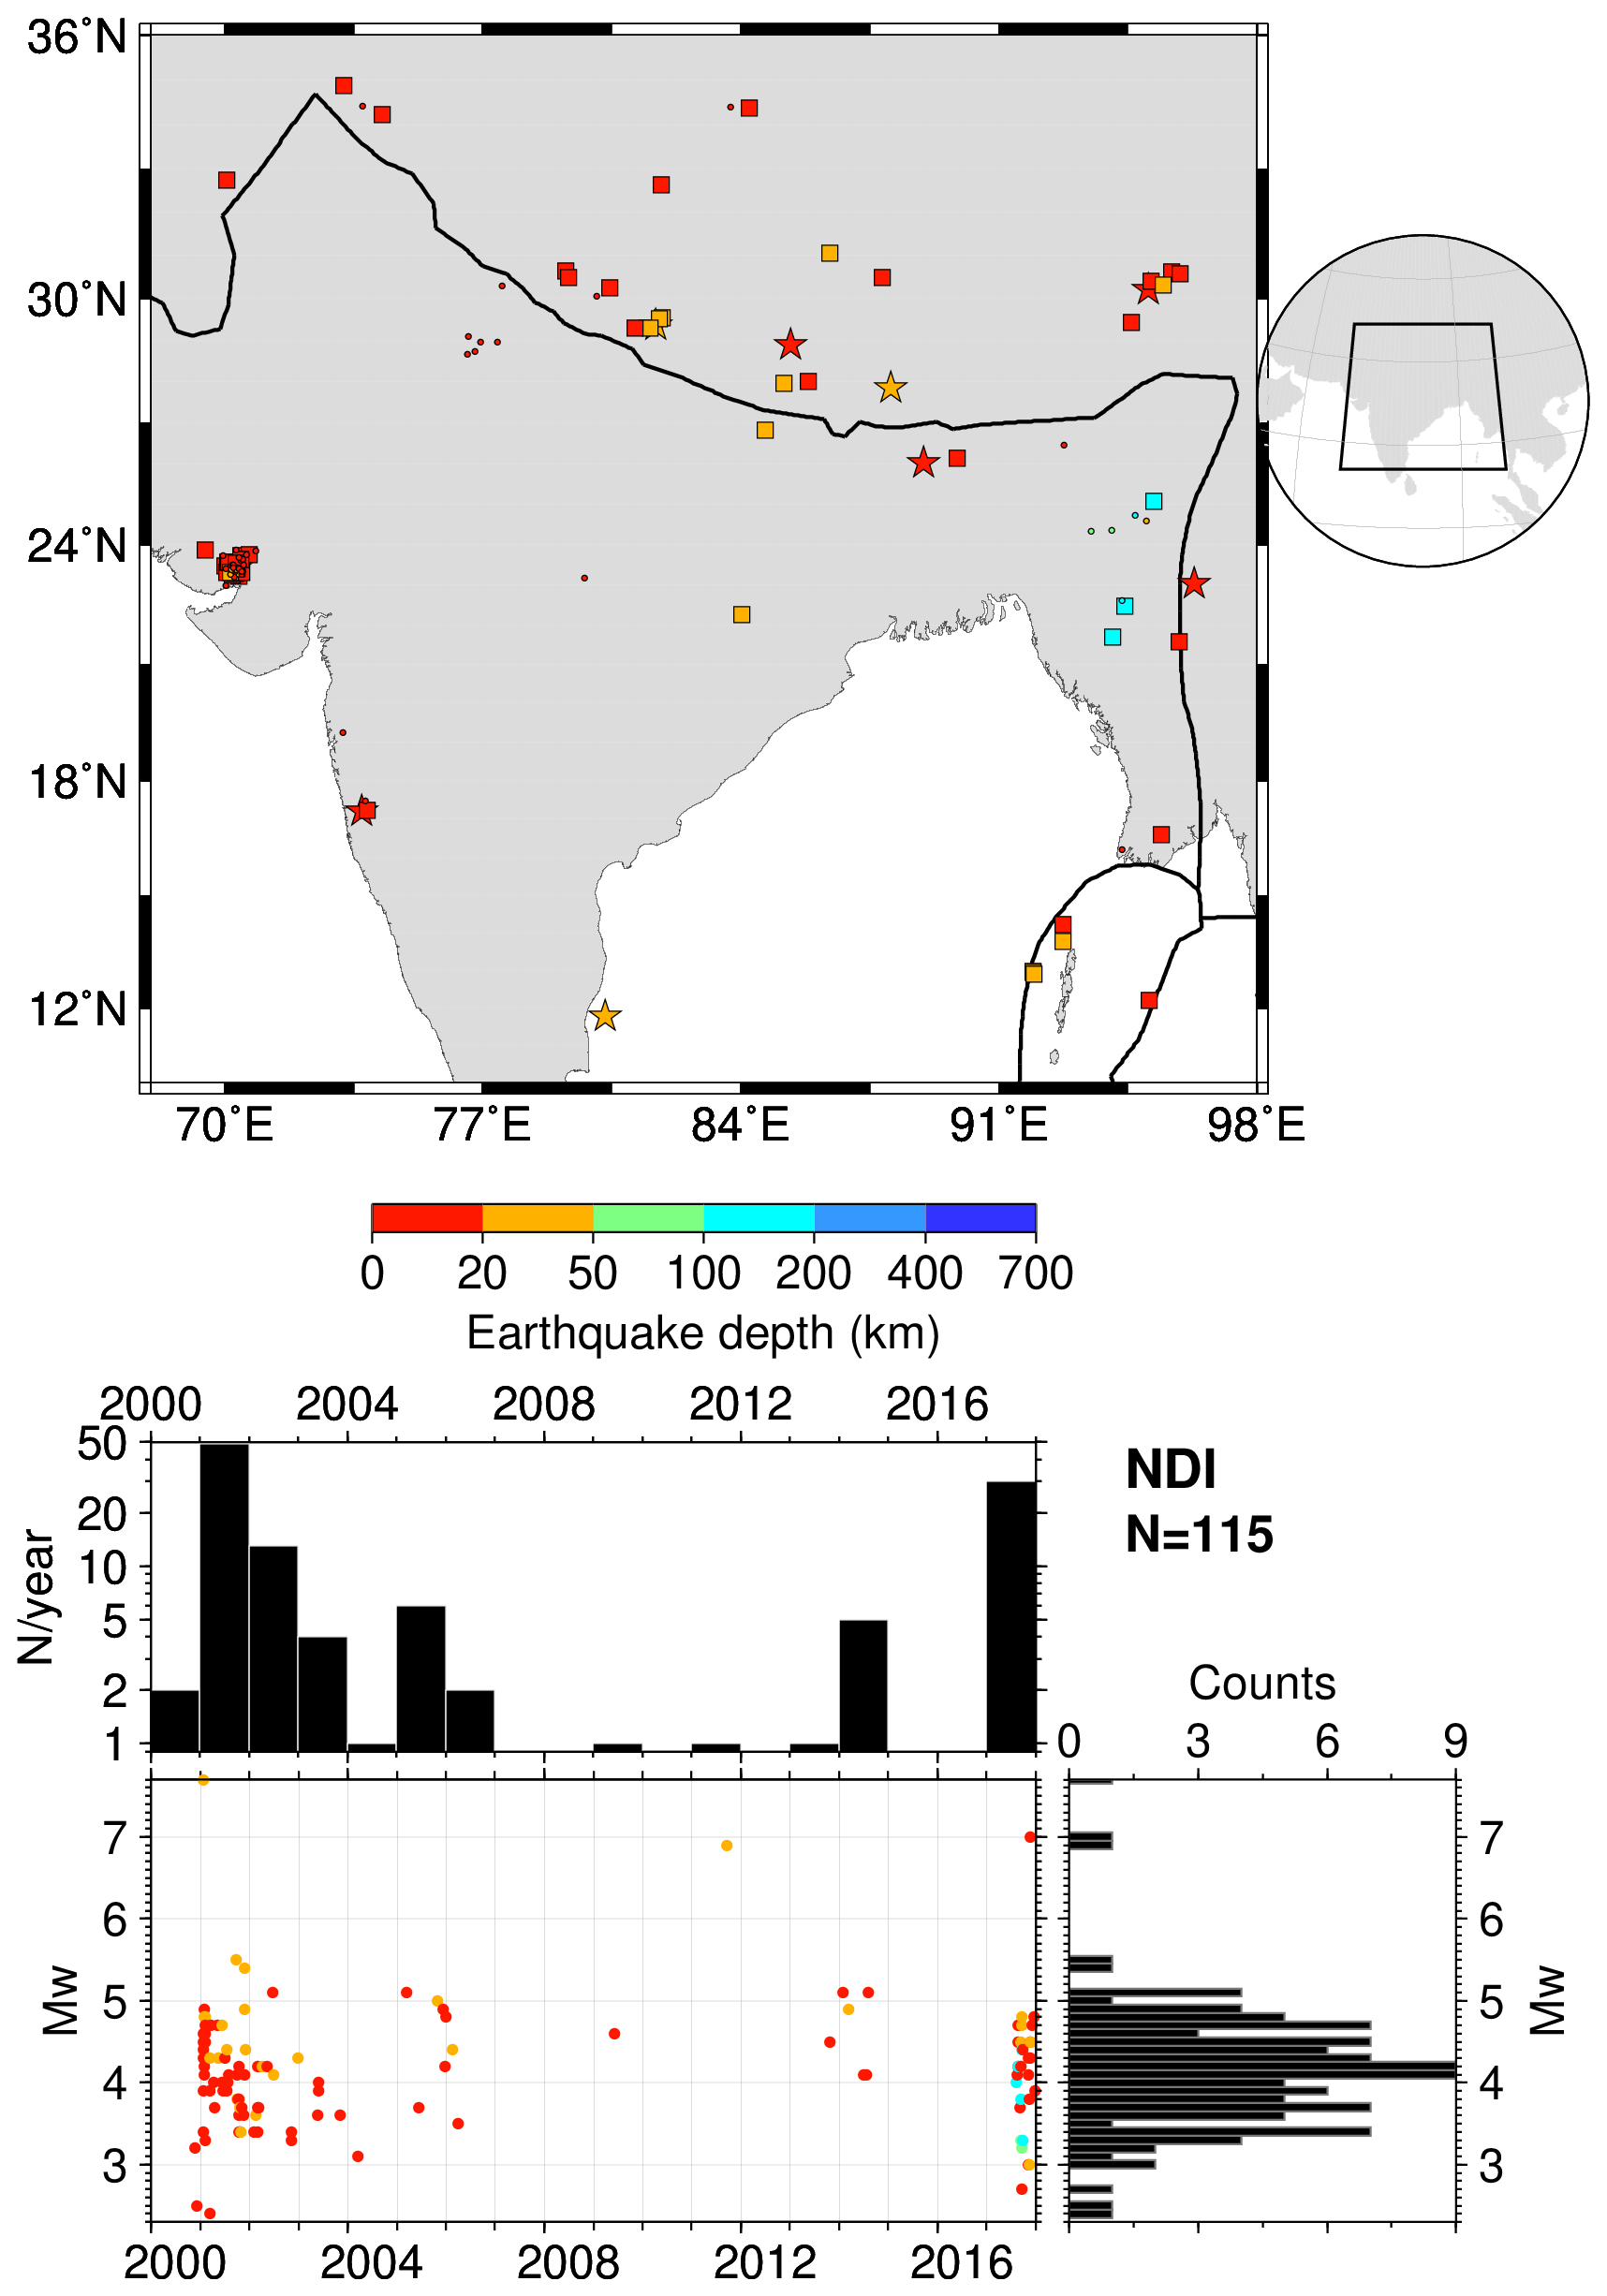
Figure A14The same as in Fig. 2 but for NDI. The map was drawn using the Generic Mapping Tools (GMT) (Wessel et al., 2013) software.
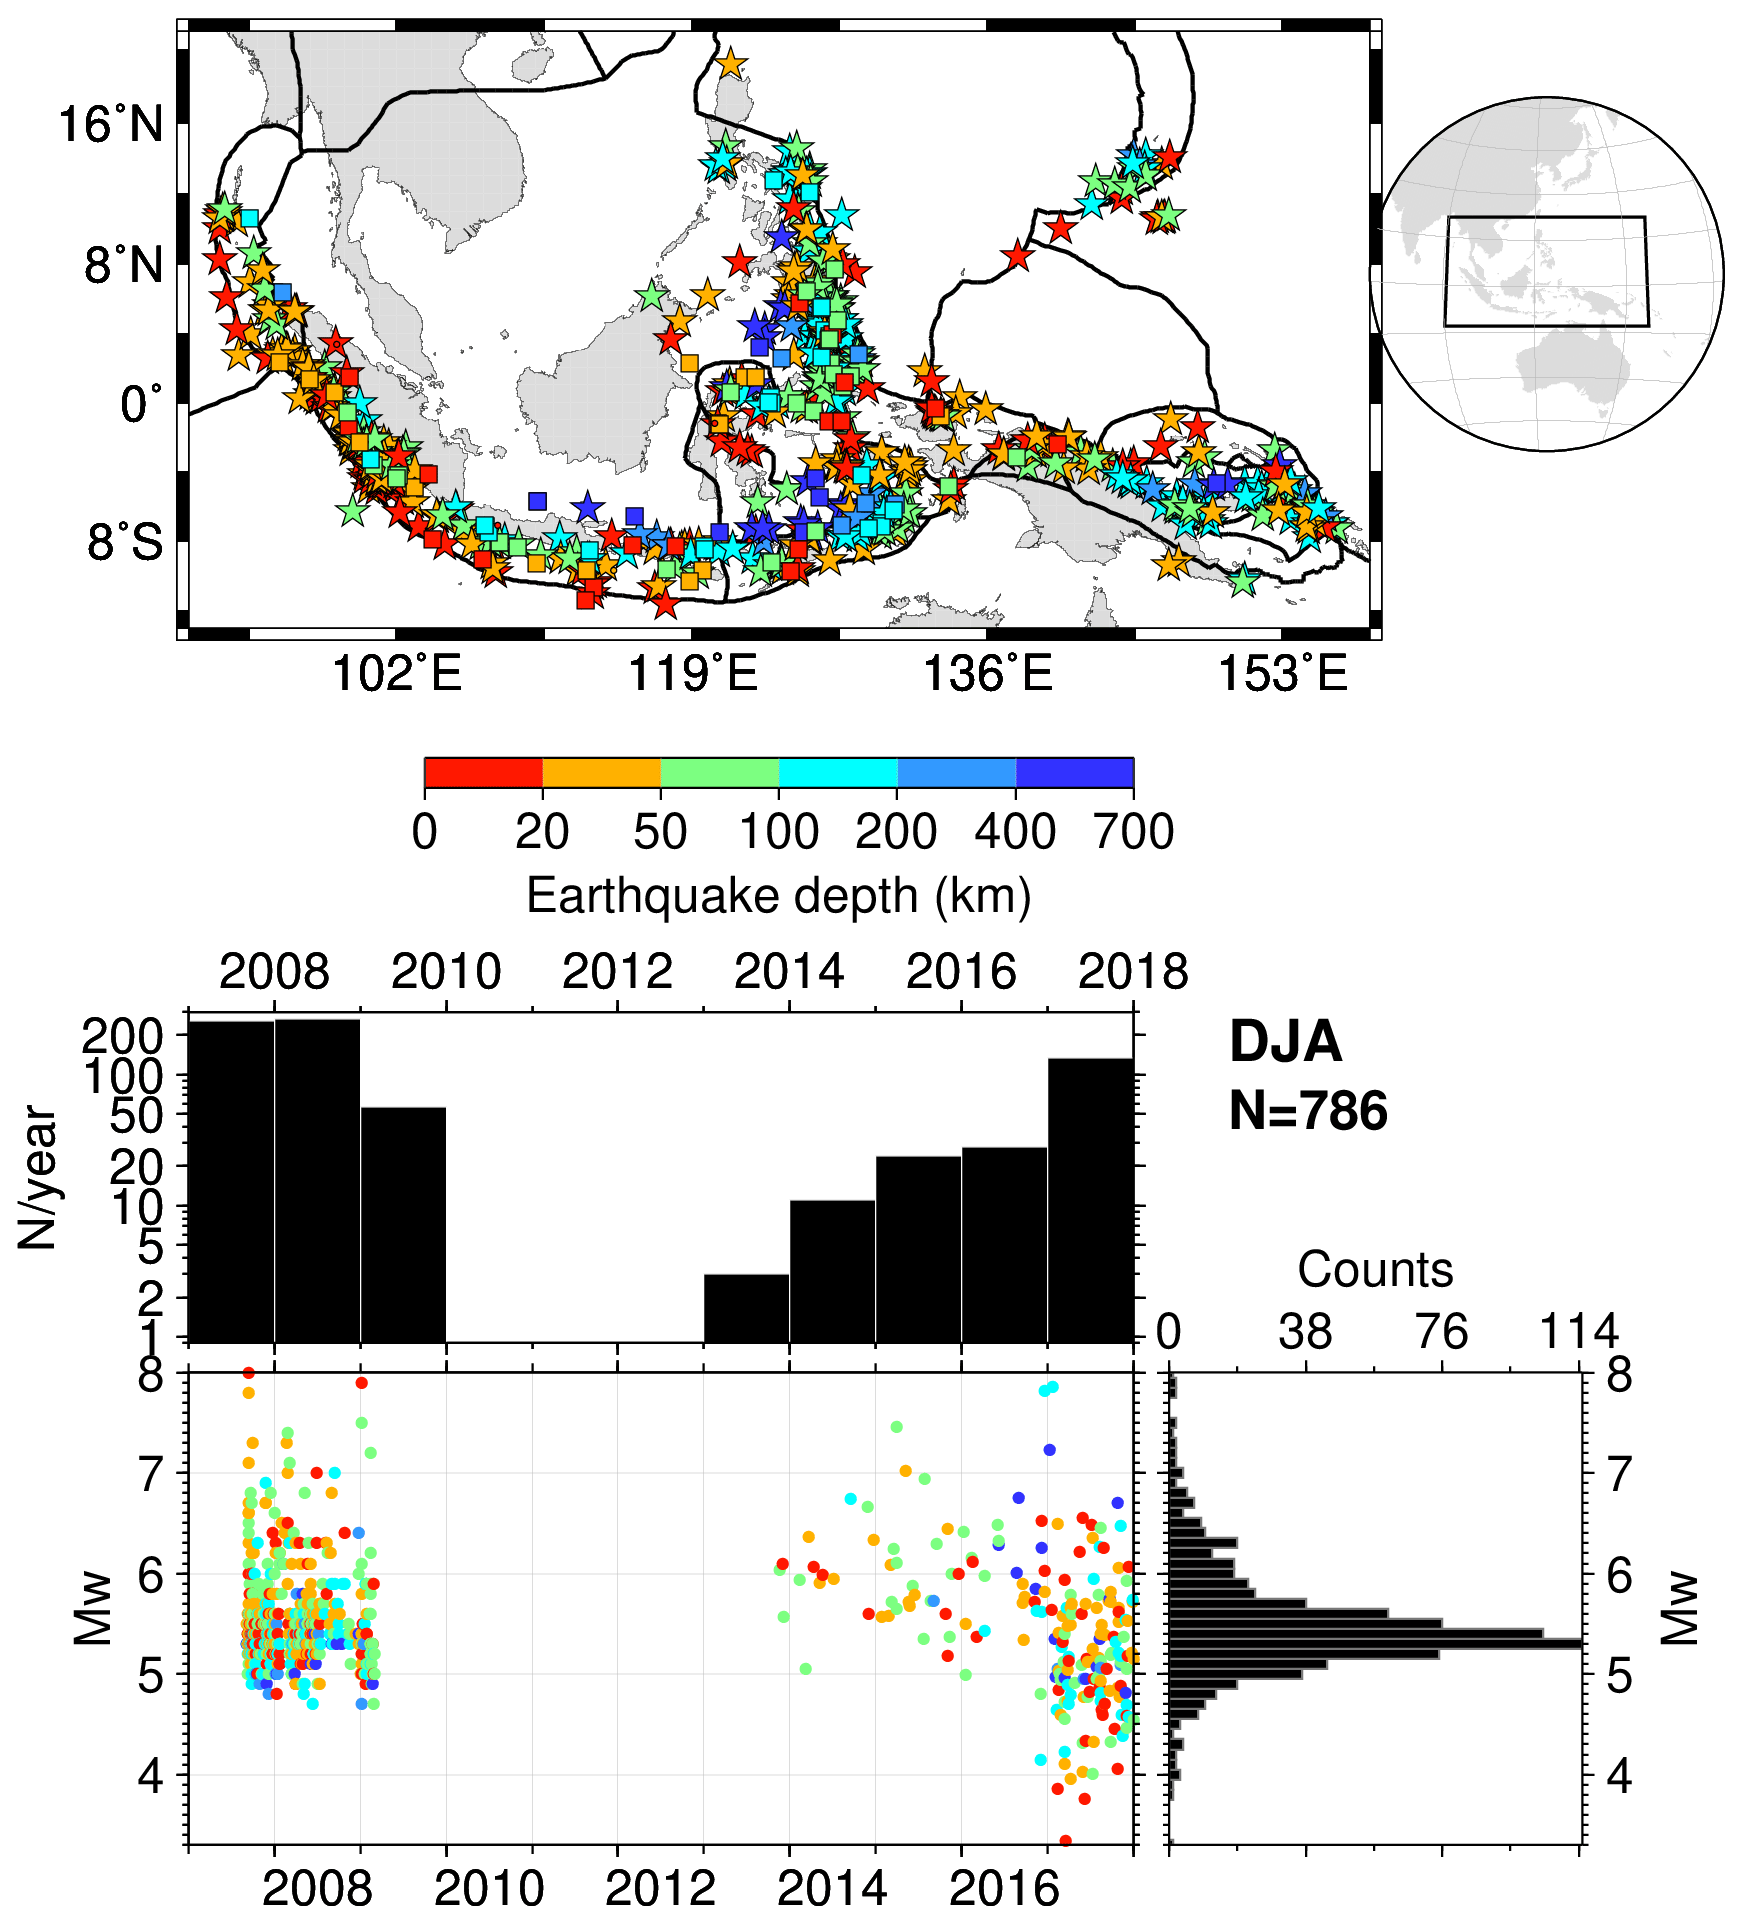
Figure A15The same as in Fig. 2 but for DJA. The map was drawn using the Generic Mapping Tools (GMT) (Wessel et al., 2013) software.
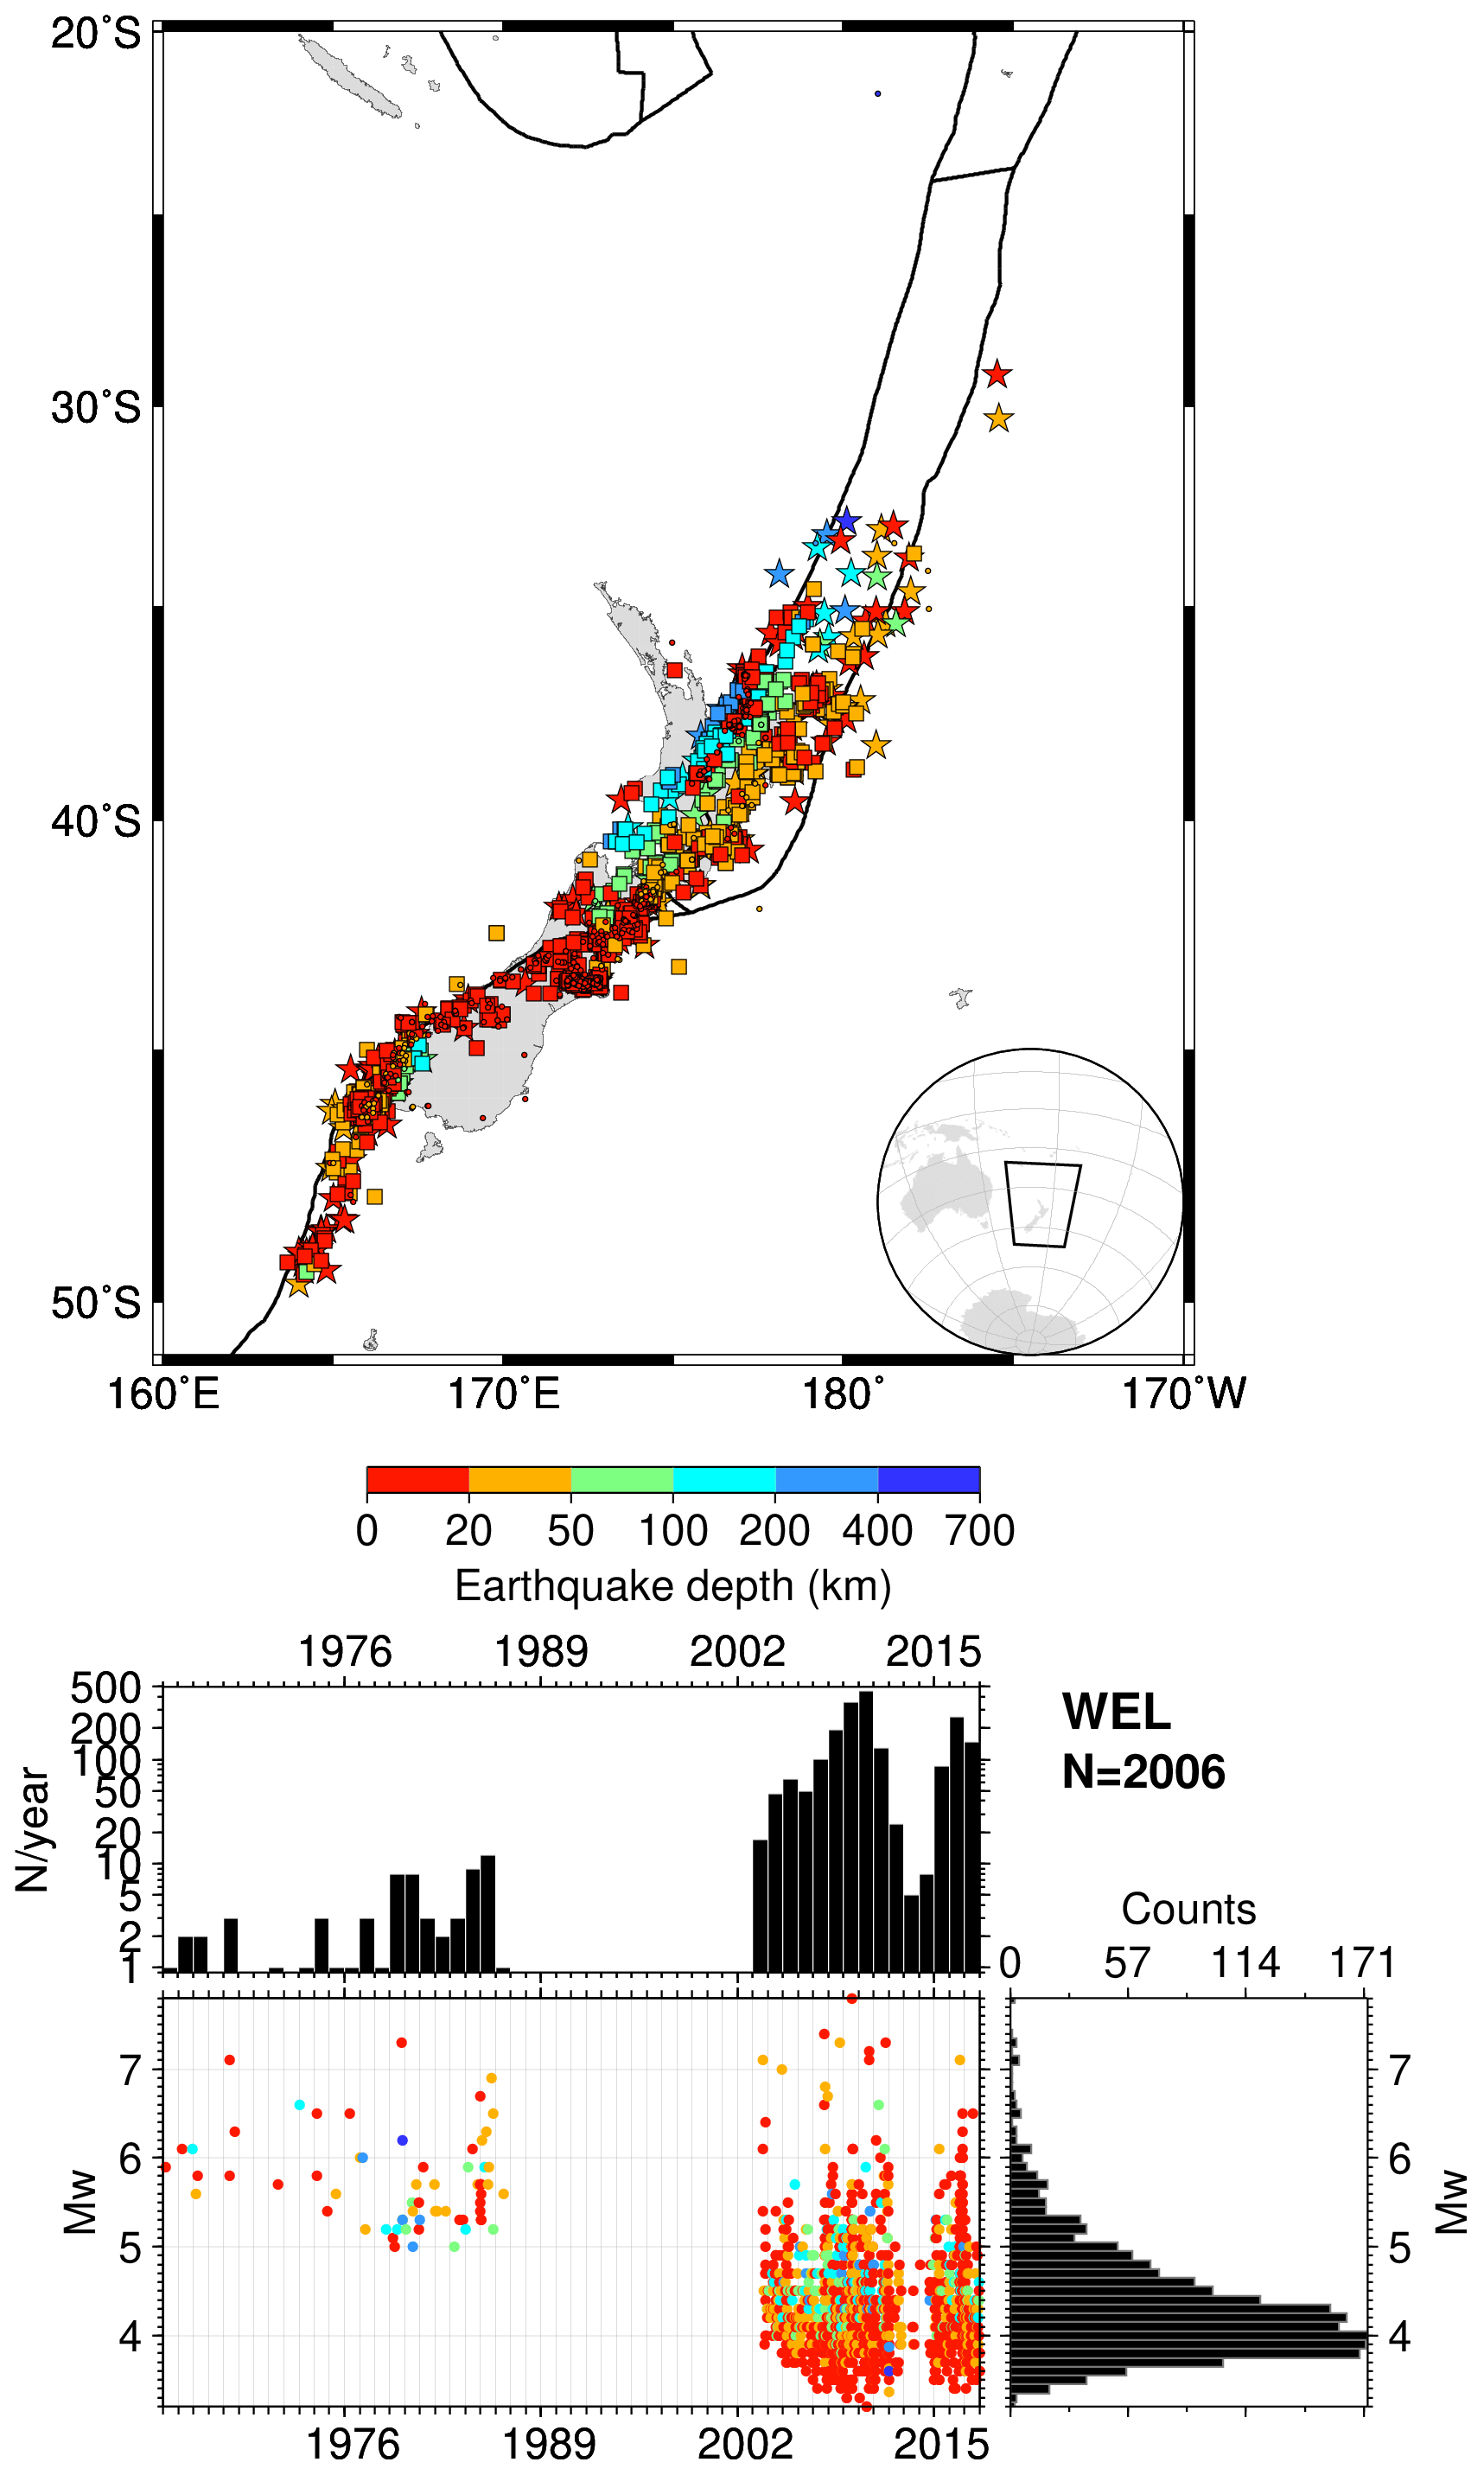
Figure A16The same as in Fig. 2 but for WEL. The map was drawn using the Generic Mapping Tools (GMT) (Wessel et al., 2013) software.
DDG is the lead author and prepared the dataset and figures. JH maintains the database and ISC web services, and DAS obtained the funding for the work and established and maintained connections with many data providers. All the authors contributed to the manuscript and approved the final version.
The authors declare that they have no conflict of interest.
We are grateful to all reporters that contribute or have contributed data to the ISC, particularly in terms of Mw for this work. The work done at the ISC is possible thanks to the support of its members (http://www.isc.ac.uk/members/, last access: December 2020) and sponsors (http://www.isc.ac.uk/sponsors/, last access: December 2020). We thank Lars Ottemöller and an anonymous reviewer for their comments that helped us to improve the manuscript. All figures were drawn using the Generic Mapping Tools (Wessel et al., 2013).
This work has been partially funded by the National Science Foundation (grant nos. 1811737, 1417970, and 0949072) and USGS (award nos. G14AC00149, G15AC00202, G18AP00035, and G19AS00033).
This paper was edited by Kirsten Elger and reviewed by Lars Ottemöller and one anonymous referee.
Aki, K.: Generation and Propagation of G Waves from the Niigata Earthquake of June 16, 1964. Part 2. Estimation of earthquake moment, released energy, and stress-strain drop from the G wave spectrum, Bulletin of the Earthquake Research Institute, University of Tokyo, 44, 73–88, available at: http://hdl.handle.net/2261/12237 (last access: April 2021), 1966. a
Alver, F., Ömer Kılıçarslan, Kuterdem, K., Türkoğlu, M., and Şentürk, M. D.: Seismic Monitoring at the Turkish National Seismic Network (TNSN), Summ. Bull. Internatl. Seismol. Cent., 53, 41–58, https://doi.org/10.31905/D9GRP8RD, 2019. a
Ammon, C. J., Herrmann, R. B., Langston, C. A., and Benz, H.: Faulting Parameters of the January 16, 1994 Wyomissing Hills, Pennsylvania Earthquakes, Seismol. Res. Lett., 69, 261–269, https://doi.org/10.1785/gssrl.69.3.261, 1998. a
Amorese, D.: Applying a Change-Point Detection Method on Frequency-Magnitude Distributions, B. Seismol. Soc. Am., 97, 1742–1749, https://doi.org/10.1785/0120060181, 2007. a, b
Andrews, D. J.: Objective Determination of Source Parameters and Similarity of Earthquakes of Different Size, in: Earthquake Source Mechanics, edited by: S. Das, J. B. and Scholz, C., American Geophysical Union, 259–267, https://doi.org/10.1029/gm037p0259, 1986. a
Benz, H. M. and Herrmann, R. B.: Rapid Estimates of the Source Time Function and Mw using Empirical Green's Function Deconvolution, B. Seismol. Soc. Am., 104, 1812–1819, https://doi.org/10.1785/0120130325, 2014. a
Bird, P.: An updated digital model of plate boundaries, Geochemistry, Geophysics, Geosystems, 4, 1027, https://doi.org/10.1029/2001gc000252, 2003. a
Bondár, I. and Storchak, D. A.: Improved location procedures at the International Seismological Centre, Geophys. J. Int., 186, 1220–1244, https://doi.org/10.1111/j.1365-246x.2011.05107.x, 2011. a, b
Bormann, P. and Saul, J.: The New IASPEI Standard Broadband Magnitude mB, Seismol. Res. Lett., 79, 698–705, https://doi.org/10.1785/gssrl.79.5.698, 2008. a
Bormann, P., Liu, R., Ren, X., Gutdeutsch, R., Kaiser, D., and Castellaro, S.: Chinese National Network Magnitudes, Their Relation to NEIC Magnitudes, and Recommendations for New IASPEI Magnitude Standards, B. Seismol. Soc. Am., 97, 114–127, https://doi.org/10.1785/0120060078, 2007. a, b
Bormann, P., Liu, R., Xu, Z., Ren, K., Zhang, L., and Wendt, S.: First Application of the New IASPEI Teleseismic Magnitude Standards to Data of the China National Seismographic Network, B. Seismol. Soc. Am., 99, 1868–1891, https://doi.org/10.1785/0120080010, 2009. a
Bormann, P., Wendt, S., and Di Giacomo, D.: Seismic Sources and Source Parameters, Deutsches GeoForschungsZentrum GFZ, 1–259, https://doi.org/10.2312/GFZ.NMSOP-2_CH3, 2013. a
Brune, J. N.: Tectonic stress and the spectra of seismic shear waves from earthquakes, J. Geophys. Res., 75, 4997–5009, https://doi.org/10.1029/jb075i026p04997, 1970. a
Chen, P.-F., Nettles, M., Okal, E. A., and Ekström, G.: Centroid moment tensor solutions for intermediate-depth earthquakes of the WWSSN–HGLP era (1962–1975), Phys. Earth Planet. In., 124, 1–7, https://doi.org/10.1016/s0031-9201(00)00220-x, 2001. a, b, c
Choy, G. L. and Boatwright, J. L.: Global patterns of radiated seismic energy and apparent stress, J. Geophys. Res.-Sol. Ea., 100, 18205–18228, https://doi.org/10.1029/95jb01969, 1995. a
Di Giacomo, D. and Harris, J.: An Mw list from the Rebuilt ISC Bulletin (1964–2016), ISC Seismological Dataset Repository, https://doi.org/10.31905/J2W2M64S, 2020. a, b, c, d, e, f
Di Giacomo, D. and Storchak, D. A.: A scheme to set preferred magnitudes in the ISC Bulletin, J. Seismol., 20, 555–567, https://doi.org/10.1007/s10950-015-9543-7, 2016. a
Di Giacomo, D., Parolai, S., Bormann, P., Grosser, H., Saul, J., Wang, R., and Zschau, J.: Suitability of rapid energy magnitude determinations for emergency response purposes, Geophys. J. Int., 180, 361–374, https://doi.org/10.1111/j.1365-246x.2009.04416.x, 2010. a
Di Giacomo, D., Bondár, I., Storchak, D. A., Engdahl, E. R., Bormann, P., and Harris, J.: ISC-GEM: Global Instrumental Earthquake Catalogue (1900–2009), III. Re-computed MS and mb, proxy MW, final magnitude composition and completeness assessment, Phys. Earth Planet. In., 239, 33–47, https://doi.org/10.1016/j.pepi.2014.06.005, 2015. a, b
Dreger, D. S. and Helmberger, D. V.: Determination of source parameters at regional distances with three-component sparse network data, J. Geophys. Res.-Sol. Ea., 98, 8107–8125, https://doi.org/10.1029/93jb00023, 1993. a
Dziewonski, A. M., Chou, T.-A., and Woodhouse, J. H.: Determination of earthquake source parameters from waveform data for studies of global and regional seismicity, J. Geophys. Res.-Sol. Ea., 86, 2825–2852, https://doi.org/10.1029/jb086ib04p02825, 1981. a, b
Ekström, G. and Dziewonski, A. M.: Evidence of bias in estimations of earthquake size, Nature, 332, 319–323, https://doi.org/10.1038/332319a0, 1988. a
Ekström, G., Nettles, M., and Dziewoński, A. M.: The global CMT project 2004–2010: Centroid-moment tensors for 13,017 earthquakes, Phys. Earth Planet. In., 200-201, 1–9, https://doi.org/10.1016/j.pepi.2012.04.002, 2012. a, b
Fukuyama, E., Ishida, M., Dreger, D. S., and Kawai, H.: Automated Seismic Moment Tensor Determination by Using On-line Broadband Seismic Waveforms, Zisin (Journal of the Seismological Society of Japan. 2nd ser.), 51, 149–156, https://doi.org/10.4294/zisin1948.51.1_149, 1998. a
Gasperini, P., Lolli, B., Vannucci, G., and Boschi, E.: A comparison of moment magnitude estimates for the European-Mediterranean and Italian regions, Geophys. J. Int., 190, 1733–1745, https://doi.org/10.1111/j.1365-246x.2012.05575.x, 2012. a, b, c, d
Gilbert, F. and Dziewonski, A. M.: An application of normal mode theory to the retrieval of structural parameters and source mechanisms from seismic spectra, Philos. T. Roy. Soc. Lond. A, 278, 187–269, https://doi.org/10.1098/rsta.1975.0025, 1975. a
Grevemeyer, I., Gràcia, E., Villaseñor, A., Leuchters, W., and Watts, A. B.: Seismicity and active tectonics in the Alboran Sea, Western Mediterranean: Constraints from an offshore-onshore seismological network and swath bathymetry data, J. Geophys. Res.-Sol. Ea., 120, 8348–8365, https://doi.org/10.1002/2015jb012073, 2015. a
Hanks, T. C. and Kanamori, H.: A moment magnitude scale, J. Geophys. Res., 84, 2348–2350, https://doi.org/10.1029/jb084ib05p02348, 1979. a
Havskov, J. and Ottemöller, L.: SeisAn Earthquake Analysis Software, Seismol. Res. Lett., 70, 532–534, https://doi.org/10.1785/gssrl.70.5.532, 1999. a
Havskov, J., Voss, P. H., and Ottemöller, L.: Seismological Observatory Software: 30 Yr of SEISAN, Seismol. Res. Lett., 91, 1846–1852, https://doi.org/10.1785/0220190313, 2020. a
Hayes, G. P., Rivera, L., and Kanamori, H.: Source Inversion of the W-Phase: Real-time Implementation and Extension to Low Magnitudes, Seismol. Res. Lett., 80, 817–822, https://doi.org/10.1785/gssrl.80.5.817, 2009. a, b
Herrmann, R. B., Benz, H., and Ammon, C. J.: Monitoring the Earthquake Source Process in North America, B. Seismol. Soc. Am., 101, 2609–2625, https://doi.org/10.1785/0120110095, 2011. a
Hjörleifsdóttir, V. and Ekström, G.: Effects of three-dimensional Earth structure on CMT earthquake parameters, Phys. Earth Planet. In., 179, 178–190, https://doi.org/10.1016/j.pepi.2009.11.003, 2010. a, b
Hofstetter, R. and Beyth, M.: The Afar Depression: interpretation of the 1960-2000 earthquakes, Geophys. J. Int., 155, 715–732, https://doi.org/10.1046/j.1365-246x.2003.02080.x, 2003. a
Huang, W.-c., Okal, E. A., Ekström, G., and Salganik, M. P.: Centroid moment tensor solutions for deep earthquakes predating the digital era: the World-Wide Standardized Seismograph Network dataset (1962–1976), Phys. Earth Planet. In., 99, 121–129, https://doi.org/10.1016/s0031-9201(96)03177-9, 1997. a, b, c
IASPEI: Summary of Magnitude Working Group recommendations on standard procedures for determining earthquake magnitudes from digital data, available at: ftp://ftp.iaspei.org/pub/commissions/CSOI/Summary_WG_recommendations_20130327.pdf (last access: April 2021), 2013. a
International Seismological Centre: Summary of the Bulletin of the International Seismological Centre, January–June 2010, https://doi.org/10.5281/zenodo.998584, 2013. a
International Seismological Centre: On-line Bulletin, https://doi.org/10.31905/d808b830, 2020. a, b, c
Kanamori, H.: The energy release in great earthquakes, J. Geophys. Res., 82, 2981–2987, https://doi.org/10.1029/jb082i020p02981, 1977. a
Kanamori, H.: Magnitude scale and quantification of earthquakes, Tectonophysics, 93, 185–199, https://doi.org/10.1016/0040-1951(83)90273-1, 1983. a, b
Kanamori, H.: W phase, Geophys. Res. Lett., 20, 1691–1694, https://doi.org/10.1029/93gl01883, 1993. a
Kao, H. and Jian, P.-R.: Source Parameters of Regional Earthquakes in Taiwan: July 1995–December 1996, Terr. Atmos. Ocean. Sci., 10, 585, https://doi.org/10.3319/tao.1999.10.3.585(t), 1999. a
Kao, H., Jian, P.-R., Ma, K.-F., Huang, B.-S., and Liu, C.-C.: Moment-tensor inversion for offshore earthquakes east of Taiwan and their implications to regional collision, Geophys. Res. Lett., 25, 3619–3622, https://doi.org/10.1029/98gl02803, 1998. a
Konstantinou, K. I. and Rontogianni, S.: A Comparison of Teleseismic and Regional Seismic Moment Estimates in the European-Mediterranean Region, Seismol. Res. Lett., 82, 188–200, https://doi.org/10.1785/gssrl.82.2.188, 2011. a, b
Lee, W. H. and Engdahl, E. R.: Bibliographical search for reliable seismic moments of large earthquakes during 1900–1979 to compute MW in the ISC-GEM Global Instrumental Reference Earthquake Catalogue, Phys. Earth Planet. In., 239, 25–32, https://doi.org/10.1016/j.pepi.2014.06.004, 2015. a
Lentas, K., Di Giacomo, D., Harris, J., and Storchak, D. A.: The ISC Bulletin as a comprehensive source of earthquake source mechanisms, Earth Syst. Sci. Data, 11, 565–578, https://doi.org/10.5194/essd-11-565-2019, 2019. a
Lolli, B. and Gasperini, P.: A comparison among general orthogonal regression methods applied to earthquake magnitude conversions, Geophys. J. Int., 190, 1135–1151, https://doi.org/10.1111/j.1365-246x.2012.05530.x, 2012. a
Lolli, B., Gasperini, P., and Vannucci, G.: Empirical conversion between teleseismic magnitudes (mb and Ms) and moment magnitude (Mw) at the Global, Euro-Mediterranean and Italian scale, Geophys. J. Int., 199, 805–828, https://doi.org/10.1093/gji/ggu264, 2014. a, b
Lomax, A., Michelini, A., and Piatanesi, A.: An energy-duration procedure for rapid determination of earthquake magnitude and tsunamigenic potential, Geophys. J. Int., 170, 1195–1209, https://doi.org/10.1111/j.1365-246x.2007.03469.x, 2007. a
Martín, R., Stich, D., Morales, J., and Mancilla, F.: Moment tensor solutions for the Iberian-Maghreb region during the IberArray deployment (2009–2013), Tectonophysics, 663, 261–274, https://doi.org/10.1016/j.tecto.2015.08.012, 2015. a
Mignan, A. and Woessner, J.: Estimating the magnitude of completeness for earthquake catalogs, Community Online Resource for Statistical Seismicity Analysis, https://doi.org/10.5078/CORSSA-00180805, 2012. a, b
Mulder, T.: Geological Survey of Canada: Canadian National Seismic Network, Summ. Bull. Internatl. Seismol. Cent., 48, 29–38, https://doi.org/10.5281/ZENODO.998832, 2015. a
Nettles, M. and Hjörleifsdóttir, V.: Earthquake source parameters for the 2010 January Haiti main shock and aftershock sequence, Geophys. J. Int., 183, 375–380, https://doi.org/10.1111/j.1365-246x.2010.04732.x, 2010. a
Ottemöller, L., Strømme, M. L., and Storheim, B. M.: Seismic Monitoring and Data Processing at the Norwegian National Seismic Network, Summ. Bull. Internatl. Seismol. Cent., 52, 27–40, https://doi.org/10.31905/1M97CSYL, 2018. a
Patton, H. J.: Bias in the centroid moment tensor for central Asian earthquakes: Evidence from regional surface wave data, J. Geophys. Res.-Sol. Ea., 103, 26963–26974, https://doi.org/10.1029/98jb02529, 1998. a, b
Patton, H. J. and Randall, G. E.: On the causes of biased estimates of seismic moment for earthquakes in central Asia, J. Geophys. Res.-Sol. Ea., 107, 2302, https://doi.org/10.1029/2001jb000351, 2002. a, b
Pérez-Campos, X., Espíndola, V. H., Pérez, J., Estrada, J. A., Cárdenas Monroy, C., Zanolli, B. F., Bello, D., González-López, A., González Ávila, D., Maldonado, R., Montoya-Quintanar, E., Vite, R., Martínez, L. D., Tan, Y., Rodríguez Rasilla, I., Vela Rosas, M. Á., Cruz, J. L., Cárdenas, A., Navarro Estrada, F., Hurtado, A., and Mendoza Carvajal, A. D. J.: Servicio Sismológico Nacional, Mexico, Summ. Bull. Internatl. Seismol. Cent., 53, 29–40, https://doi.org/10.31905/sz7rybtm, 2019. a
Polet, J. and Thio, H. K.: Rapid calculation of a Centroid Moment Tensor and waveheight predictions around the north Pacific for the 2011 off the Pacific coast of Tohoku Earthquake, Earth Planets Space, 63, 541–545, https://doi.org/10.5047/eps.2011.05.005, 2011. a
Pondrelli, S.: European-Mediterranean Regional Centroid-Moment Tensors Catalog (RCMT) [Data Set], Istituto Nazionale di Geofisica e Vulcanologia (INGV), https://doi.org/10.13127/RCMT/EUROMED, 2002. a
Sánchez, G., Recio, R., Marcuzzi, O., Moreno, M., Araujo, M., Navarro, C., Suárez, J. C., Havskov, J., and Ottemöller, L.: The Argentinean National Network of Seismic and Strong-Motion Stations, Seismol. Res. Lett., 84, 729–736, https://doi.org/10.1785/0220120045, 2013. a
Scognamiglio, L., Tinti, E., and Quintiliani, M.: Time Domain Moment Tensor [Data set], Istituto Nazionale di Geofisica e Vulcanologia (INGV), https://doi.org/10.13127/TDMT, 2006. a
Scordilis, E. M.: Empirical Global Relations Converting MS and mb to Moment Magnitude, J. Seismol., 10, 225–236, https://doi.org/10.1007/s10950-006-9012-4, 2006. a, b
Stich, D., Ammon, C. J., and Morales, J.: Moment tensor solutions for small and moderate earthquakes in the Ibero-Maghreb region, J. Geophys. Res.-Sol. Ea., 108, https://doi.org/10.1029/2002jb002057, 2003. a
Stich, D., Serpelloni, E., de Lis Mancilla, F., and Morales, J.: Kinematics of the Iberia–Maghreb plate contact from seismic moment tensors and GPS observations, Tectonophysics, 426, 295–317, https://doi.org/10.1016/j.tecto.2006.08.004, 2006. a
Stich, D., Martín, R., and Morales, J.: Moment tensor inversion for Iberia–Maghreb earthquakes 2005–2008, Tectonophysics, 483, 390–398, https://doi.org/10.1016/j.tecto.2009.11.006, 2010. a
Storchak, D. A., Harris, J., Brown, L., Lieser, K., Shumba, B., Verney, R., Di Giacomo, D., and Korger, E. I. M.: Rebuild of the Bulletin of the International Seismological Centre (ISC), part 1: 1964–1979, Geosci. Lett., 4, 32, https://doi.org/10.1186/s40562-017-0098-z, 2017. a, b, c
Storchak, D. A., Harris, J., Brown, L., Lieser, K., Shumba, B., and Di Giacomo, D.: Rebuild of the Bulletin of the International Seismological Centre (ISC) – part 2: 1980–2010, Geosci. Lett., 7, 18, https://doi.org/10.1186/s40562-020-00164-6, 2020. a, b, c
Tsuboi, S.: Application ofMwpto tsunami earthquake, Geophys. Res. Lett., 27, 3105–3108, https://doi.org/10.1029/2000gl011735, 2000. a
Tsuboi, S., Abe, K., Takano, K., and Yamanaka, Y.: Rapid determination of Mw from broadband P waveforms, B. Seismol. Soc. Am., 85, 606–613, 1995. a
Tsuboi, S., Whitmore, P. M., and Sokolowski, T. J.: Application of Mwp to deep and teleseismic earthquakes, B. Seismol. Soc. Am., 89, 1345–1351, 1999. a
Vallée, M.: Source time function properties indicate a strain drop independent of earthquake depth and magnitude, Nat. Commun., 4, 2606, https://doi.org/10.1038/ncomms3606, 2013. a
Vallée, M., Charléty, J., Ferreira, A. M. G., Delouis, B., and Vergoz, J.: SCARDEC: a new technique for the rapid determination of seismic moment magnitude, focal mechanism and source time functions for large earthquakes using body-wave deconvolution, Geophys. J. Int., 184, 338–358, https://doi.org/10.1111/j.1365-246x.2010.04836.x, 2010. a, b
Wessel, P., Smith, W. H. F., Scharroo, R., Luis, J., and Wobbe, F.: Generic Mapping Tools: Improved Version Released, Eos, Transactions American Geophysical Union, 94, 409–410, https://doi.org/10.1002/2013eo450001, 2013. a, b, c, d, e, f, g, h, i, j, k, l, m, n, o, p, q, r, s, t, u, v, w, x, y
Whitmore, P. M., Tsuboi, S., Hirshorn, B., and Sokolowski, T. J.: Magnitude-dependent correction for Mwp, Science of Tsunami Hazards, 20, 187–192, 2002. a
Wiemer, S. and Wyss, M.: Minimum Magnitude of Completeness in Earthquake Catalogs: Examples from Alaska, the Western United States, and Japan, B. Seismol. Soc. Am., 90, 859–869, https://doi.org/10.1785/0119990114, 2000. a, b
Yoder, M. R., Holliday, J. R., Turcotte, D. L., and Rundle, J. B.: A geometric frequency–magnitude scaling transition: Measuring b=1.5 for large earthquakes, Tectonophysics, 532–535, 167–174, https://doi.org/10.1016/j.tecto.2012.01.034, 2012. a
- Abstract
- Introduction
- Mw in the ISC Bulletin
- Mw comparisons
- Comparisons of MS and mb from the ISC with Mw
- Examples of frequency–magnitude distributions
- Code and data availability
- Conclusions
- Appendix A: Additional plots
- Author contributions
- Competing interests
- Acknowledgements
- Financial support
- Review statement
- References