the Creative Commons Attribution 4.0 License.
the Creative Commons Attribution 4.0 License.
 | 29 Apr 2021
Measurements from the RV Ronald H. Brown and related platforms as part of the Atlantic Tradewind Ocean-Atmosphere Mesoscale Interaction Campaign (ATOMIC)
Patricia K. Quinn
Elizabeth J. Thompson
Derek J. Coffman
Sunil Baidar
Ludovic Bariteau
Timothy S. Bates
Sebastien Bigorre
Alan Brewer
Gijs de Boer
Simon P. de Szoeke
Kyla Drushka
Gregory R. Foltz
Janet Intrieri
Suneil Iyer
Chris W. Fairall
Cassandra J. Gaston
Friedhelm Jansen
James E. Johnson
Ovid O. Krüger
Richard D. Marchbanks
Kenneth P. Moran
David Noone
Sergio Pezoa
Robert Pincus
Albert J. Plueddemann
Mira L. Pöhlker
Ulrich Pöschl
Estefania Quinones Melendez
Haley M. Royer
Malgorzata Szczodrak
Jim Thomson
Lucia M. Upchurch
Chidong Zhang
Dongxiao Zhang
Paquita Zuidema
The Atlantic Tradewind Ocean-Atmosphere Mesoscale Interaction Campaign (ATOMIC) took place from 7 January to 11 July 2020 in the tropical North Atlantic between the eastern edge of Barbados and 51∘ W, the longitude of the Northwest Tropical Atlantic Station (NTAS) mooring. Measurements were made to gather information on shallow atmospheric convection, the effects of aerosols and clouds on the ocean surface energy budget, and mesoscale oceanic processes. Multiple platforms were deployed during ATOMIC including the NOAA RV Ronald H. Brown (RHB) (7 January to 13 February) and WP-3D Orion (P-3) aircraft (17 January to 10 February), the University of Colorado's Robust Autonomous Aerial Vehicle-Endurant Nimble (RAAVEN) uncrewed aerial system (UAS) (24 January to 15 February), NOAA- and NASA-sponsored Saildrones (12 January to 11 July), and Surface Velocity Program Salinity (SVPS) surface ocean drifters (23 January to 29 April). The RV Ronald H. Brown conducted in situ and remote sensing measurements of oceanic and atmospheric properties with an emphasis on mesoscale oceanic–atmospheric coupling and aerosol–cloud interactions. In addition, the ship served as a launching pad for Wave Gliders, Surface Wave Instrument Floats with Tracking (SWIFTs), and radiosondes. Details of measurements made from the RV Ronald H. Brown, ship-deployed assets, and other platforms closely coordinated with the ship during ATOMIC are provided here. These platforms include Saildrone 1064 and the RAAVEN UAS as well as the Barbados Cloud Observatory (BCO) and Barbados Atmospheric Chemistry Observatory (BACO). Inter-platform comparisons are presented to assess consistency in the data sets. Data sets from the RV Ronald H. Brown and deployed assets have been quality controlled and are publicly available at NOAA's National Centers for Environmental Information (NCEI) data archive (https://www.ncei.noaa.gov/archive/accession/ATOMIC-2020, last access: 2 April 2021). Point-of-contact information and links to individual data sets with digital object identifiers (DOIs) are provided herein.
- Article
(7939 KB) - Full-text XML
- BibTeX
- EndNote


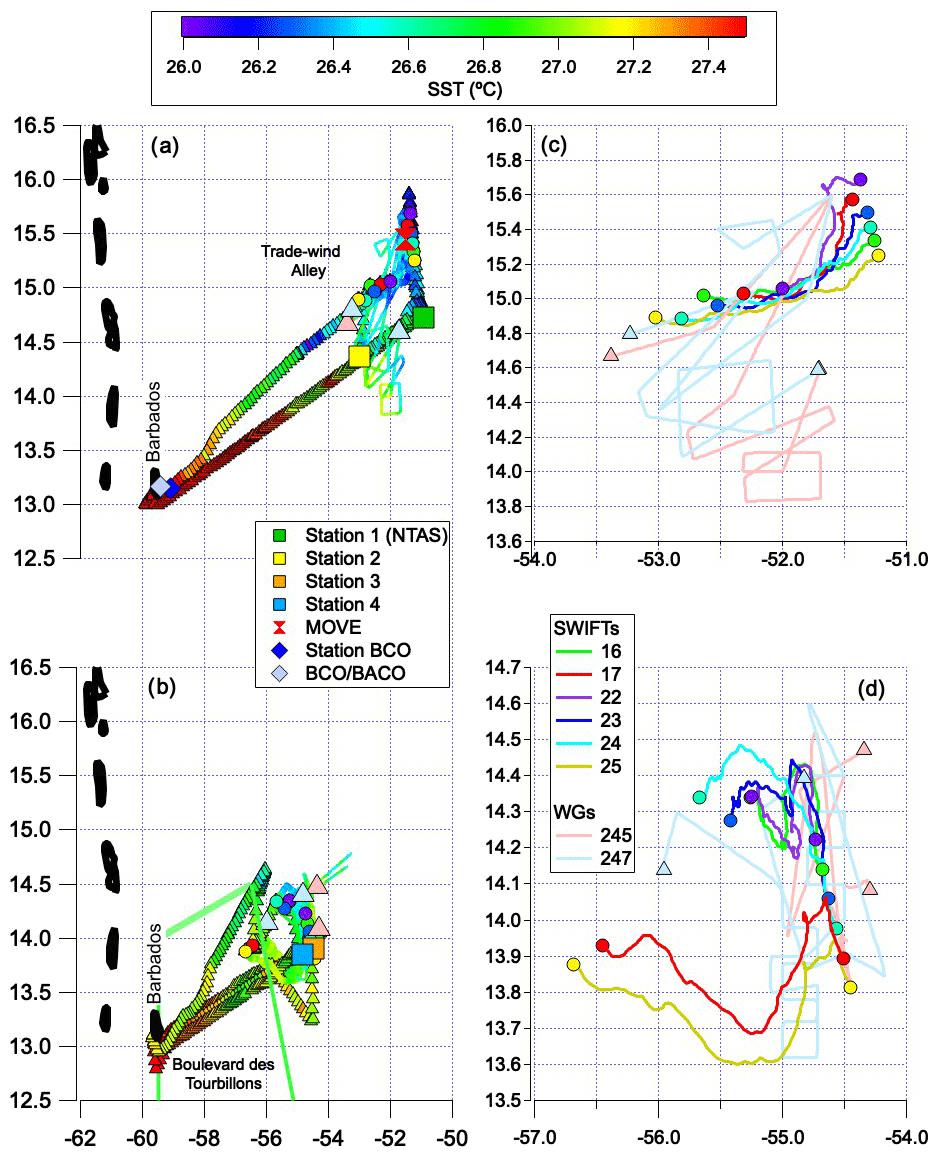
Figure 1Tracks of the RV Ronald H. Brown, Wave Gliders, and SWIFTS during ATOMIC (colored by seawater skin T calculated by PSL) for (a) Leg 1 and (b) Leg 2. Tracks for Wave Gliders and SWIFTS are magnified in (c) Leg 1 and (d) Leg 2. The portion of the EUREC4A study area overlapping with ATOMIC is indicated by the solid green line in (b). Locations of RV Ronald H. Brown stations, MOVE, and BCO/BACO are also shown in (a) and (b).
Shallow, liquid clouds persist at altitudes of hundreds to a few thousand meters above most of the world's oceans. Convection and mixing in the boundary layer can lead to the formation of shallow clouds, which can drive more mixing throughout the cloud layer and result in deeper convection. These clouds reflect incoming solar radiation and lead to a cooling of the surface (Vial et al., 2016). In addition, shallow mixing influences sea surface temperature (SST) and salinity by moderating the air–sea exchanges of energy and moisture (Stevens et al., 2016). Climate models have difficulty accurately representing low clouds in trade-wind regions because many of the processes involved in their formation occur at sub-grid scales (Bony et al., 2015). Improving model performance requires measurements that will result in a better understanding of (1) the boundary layer conditions that lead to cloudiness, (2) the influence of clouds and the atmospheric boundary layer on the upper ocean mixed layer, and in turn, (3) the influence of ocean mixing processes on surface fluxes and the atmospheric boundary layer.
ATOMIC took place in the boreal winter to study shallow convection and low, liquid clouds at a time of year when other cloud types are mostly absent. ATOMIC is the United States complement to the Elucidating the Role of Clouds Circulation Coupling in Climate Campaign (EUREC4A) (Bony et al., 2017; Stevens et al., 2021). Together, ATOMIC and EUREC4A involved four research vessels, four research aircraft, land-based observations from Barbados, and uncrewed seagoing and aerial vehicles. The ATOMIC–EUREC4A study region stretched from the eastern shores of Barbados to the Northwest Tropical Atlantic Station (NTAS) buoy located ∼500 nmi to the northeast and south along the coast of South America to ∼5∘ N. EUREC4A platforms focused on the western portion of the study area while the RV Ronald H. Brown (RHB) and P-3 aircraft worked primarily in the eastern, upwind sector from mid-January to mid-February (Fig. 1). ATOMIC was composed of two legs with Leg 1 conducted between 7 and 25 January 2020 and Leg 2 conducted between 28 January and 13 February 2020. NOAA- and NASA-sponsored Saildrones covered the entire study area between January and July 2020. The Robust Autonomous Aerial Vehicle-Endurant Nimble (RAAVEN) uncrewed aerial system (UAS) flew near the shore from Morgan Lewis on the eastern side of Barbados between 24 January and 15 February. Surface Velocity Program Salinity (SVPS) type surface ocean drifters were deployed from the RV L'Atalante and operated along the South American coast (23 January to 29 April).
A thorough description of the objectives of ATOMIC and first highlights of the data analyses are presented in Zuidema (2021a). A description of data collected from the P-3 is described in Pincus et al. (2021), and data collected by the RAAVEN are documented in de Boer et al. (2021b). Here, a detailed overview of the data collected from the RV Ronald H. Brown and deployed assets is provided. The goal is to document the sampling strategy, instrumentation used, and data availability to advance the widespread use of the data by the ATOMIC and broader research communities. A description of the sampling strategy, including coordination with other platforms, is described in Sect. 2. Also detailed in Sect. 2 are the measurements made from the RV Ronald H. Brown, the NTAS-moored buoy, Wave Gliders and SWIFT vessels, Saildrones, RAAVEN UAS, and SVPS drifters. An overview of oceanic and atmospheric conditions sampled is provided in Sect. 3. Results from inter-platform comparisons of atmospheric and oceanic parameters are detailed in Sect. 4. Data availability, format, and quality control are described in Sect. 5 along with links to individual data sets. Available measurement uncertainties are reported in the data set metadata at https://www.ncei.noaa.gov/archive/accession/ATOMIC-2020 (last access: 2 April 2021).
Sampling on board the RV Ronald H. Brown took place from 7 January to 13 February 2020 and focused on the region between 57 and 51∘ W east of Barbados and between 13 and 16∘ N in the so-called trade wind alley (Fig. 1). The overarching strategy of ATOMIC was to provide a view of the atmospheric and oceanic conditions upwind of the EUREC4A study region. Operations of the RV Ronald H. Brown were coordinated with the Wave Gliders and Surface Wave Instrument Floats with Tracking (SWIFTs) deployed from the ship, the P-3 aircraft, Saildrone 1064, and Barbados Cloud Observatory (BCO) and Barbados Atmospheric Chemistry Observatory (BACO). An additional logistical objective included recovering the NTAS-17 mooring and replacing it with the NTAS-18 mooring. A third objective was to triangulate and download data from a Meridional Overturning Variability Experiment (MOVE) subsurface mooring and related Pressure Inverted Echo Sounders (PIES). MOVE is designed to monitor the integrated deep meridional flow in the tropical North Atlantic.
Optimal aerosol and flux measurements were made when the ship was pointed into the wind to avoid contamination by the ship's stack and air flow distortion. Coordinating with the P-3 and Saildrone and deploying the NTAS Mooring, Wave Gliders, and SWIFTs had the advantage of providing redundant and complementary data streams but the disadvantage of requiring the ship to transit away from the wind for maneuvers. In addition, ship transits to Bridgetown, Barbados, for a scheduled stay in port (26 to 28 January) and a medical emergency (3 to 6 February) were downwind relative to prevailing northeast trade winds. Periods of unfavorable winds for atmospheric sampling were identified by relative winds from behind the ship's beam ( through 180∘ to +90∘ relative to the bow at 0∘). A time series of relative winds and corresponding high particle number concentrations due to emissions from the ship's stack ( cm−3) is shown in Fig. 2. These periods have been removed from the aerosol data. Unfavorable sampling conditions were experienced 15 % of the time the ship was at sea at the dates and times indicated in Table 1. Seawater measurements were less accurate when the ship's speed over water was near zero due to mechanical stirring of the water surface by the ship's propulsion system.
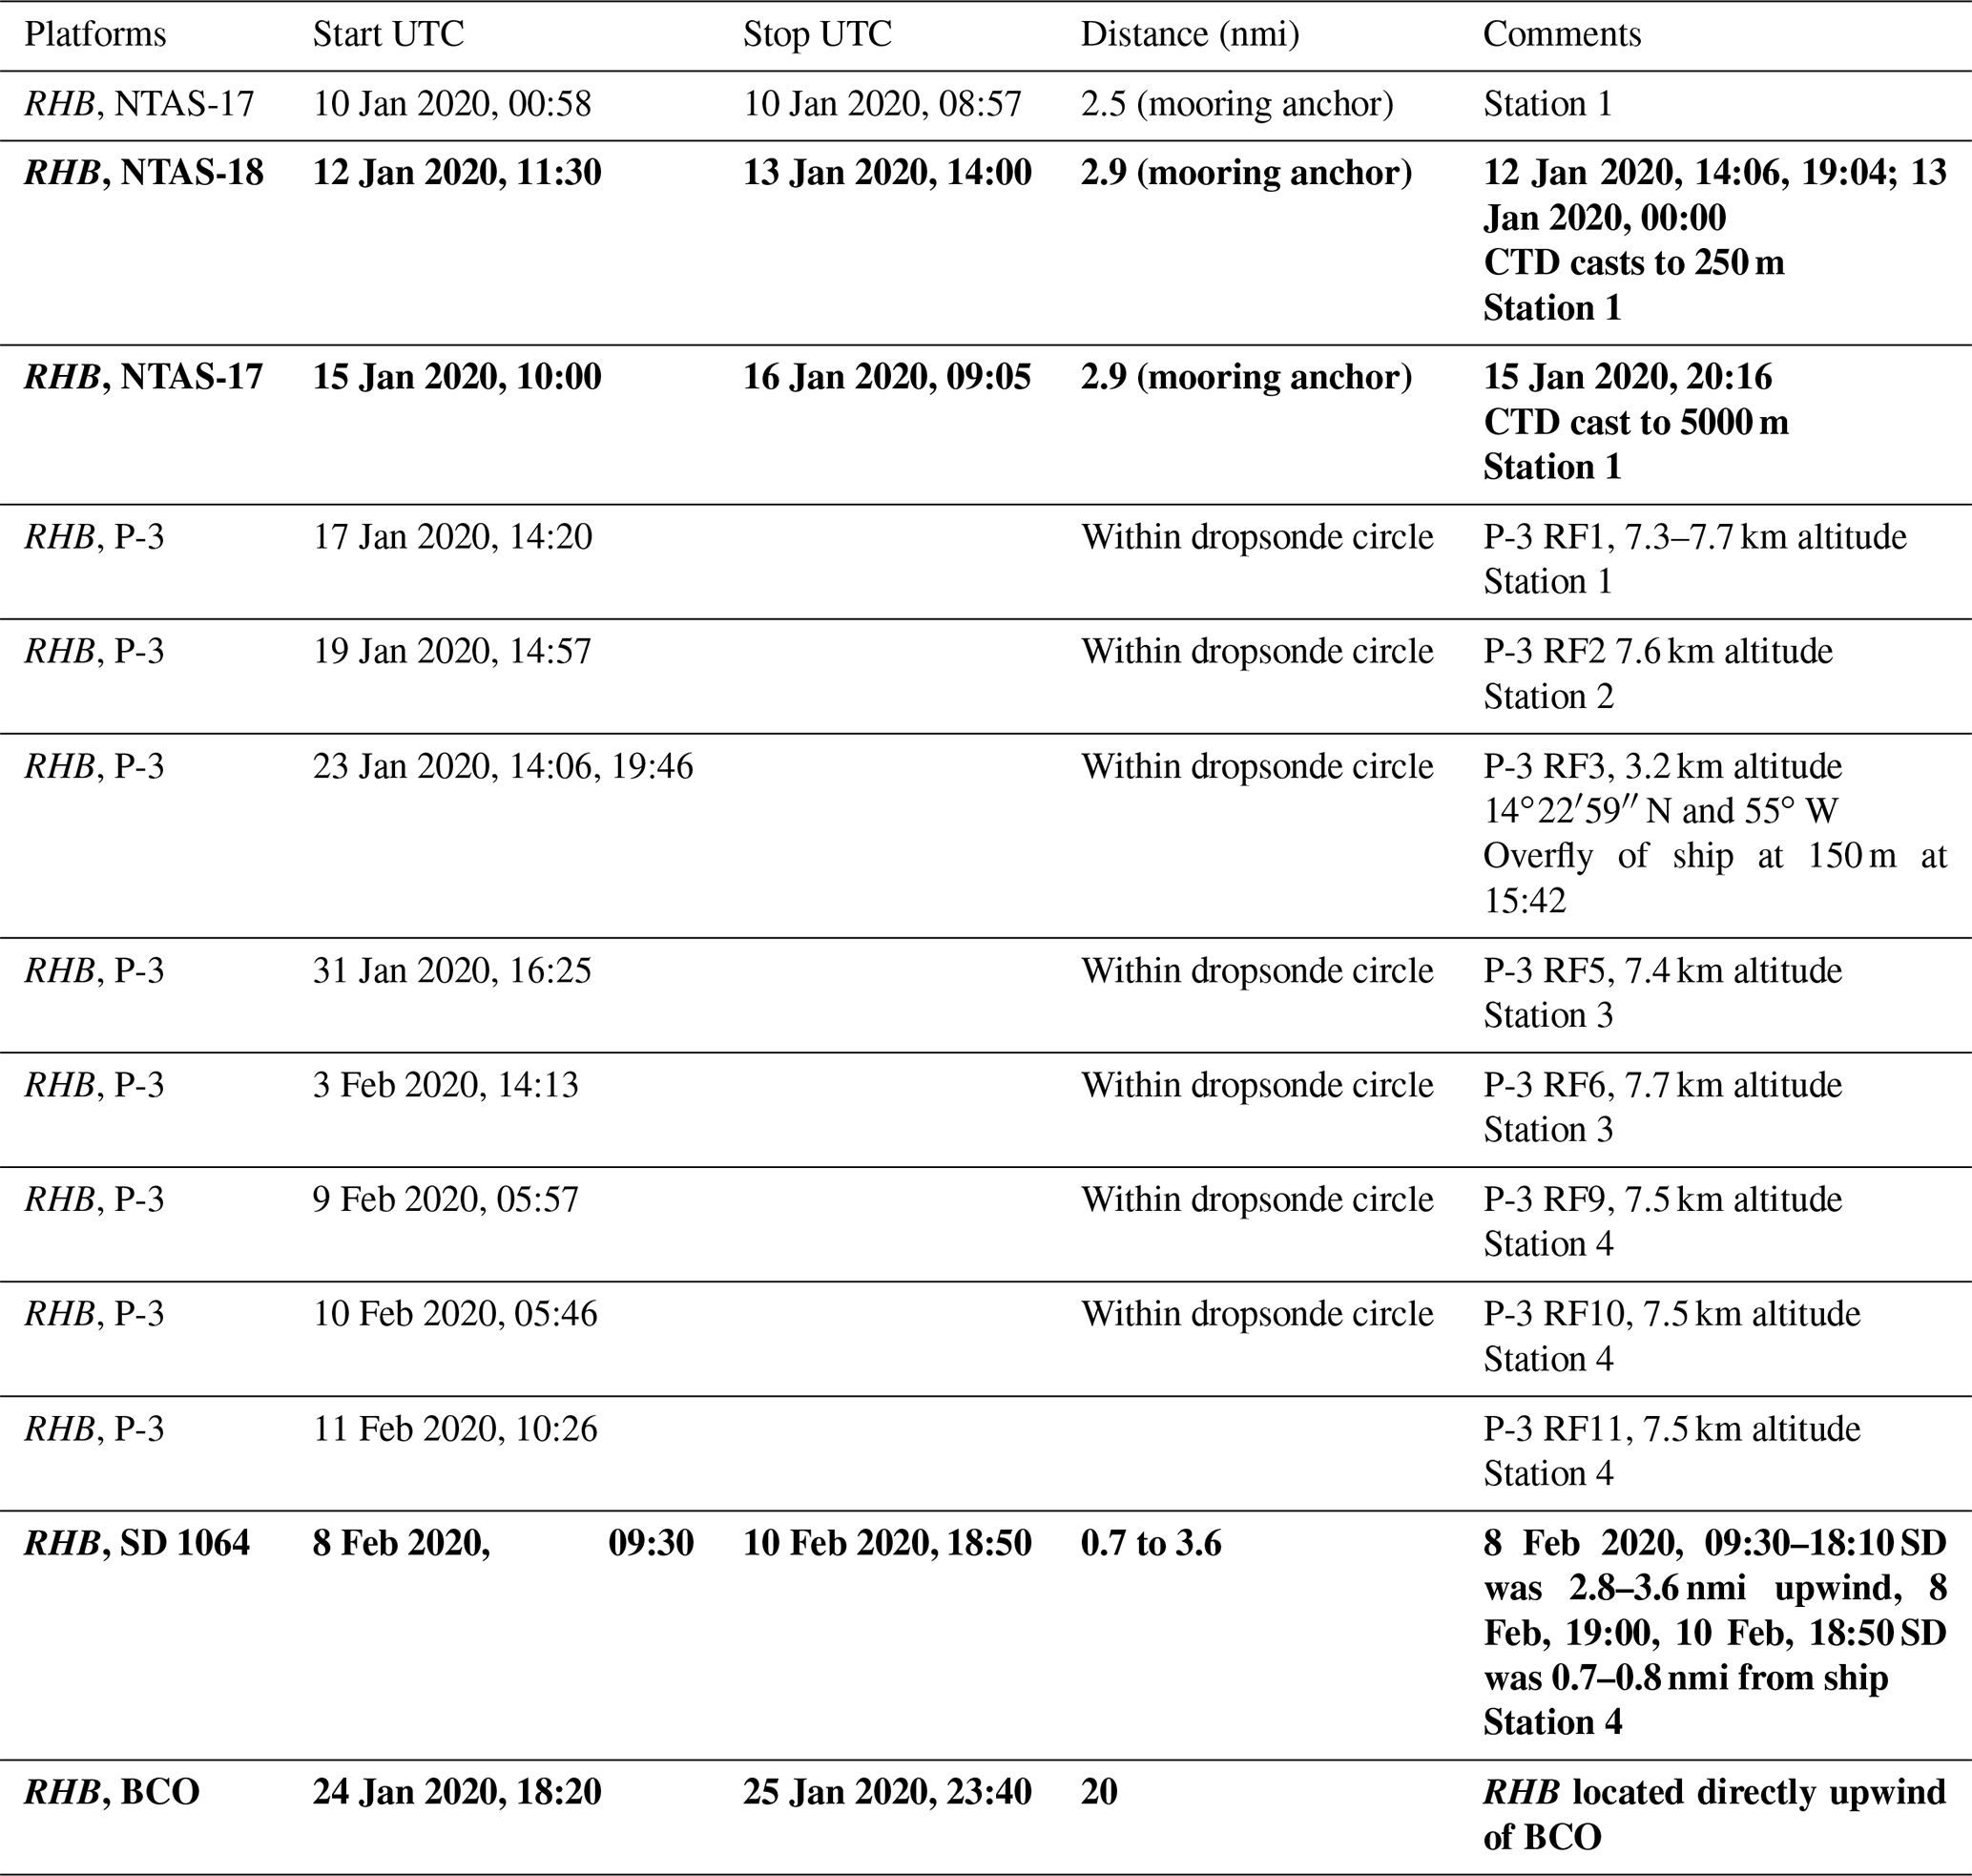
Table 1Timeline of sampling events on board the RV Ronald H. Brown (RHB) including coordination with other platforms, NTAS operations, downwind transits, and periods at each station. The different symbols shown under RHB correspond to the sampling status of the ship and coordination with other assets with spacing of vertical bars indicating time of day (UTC).
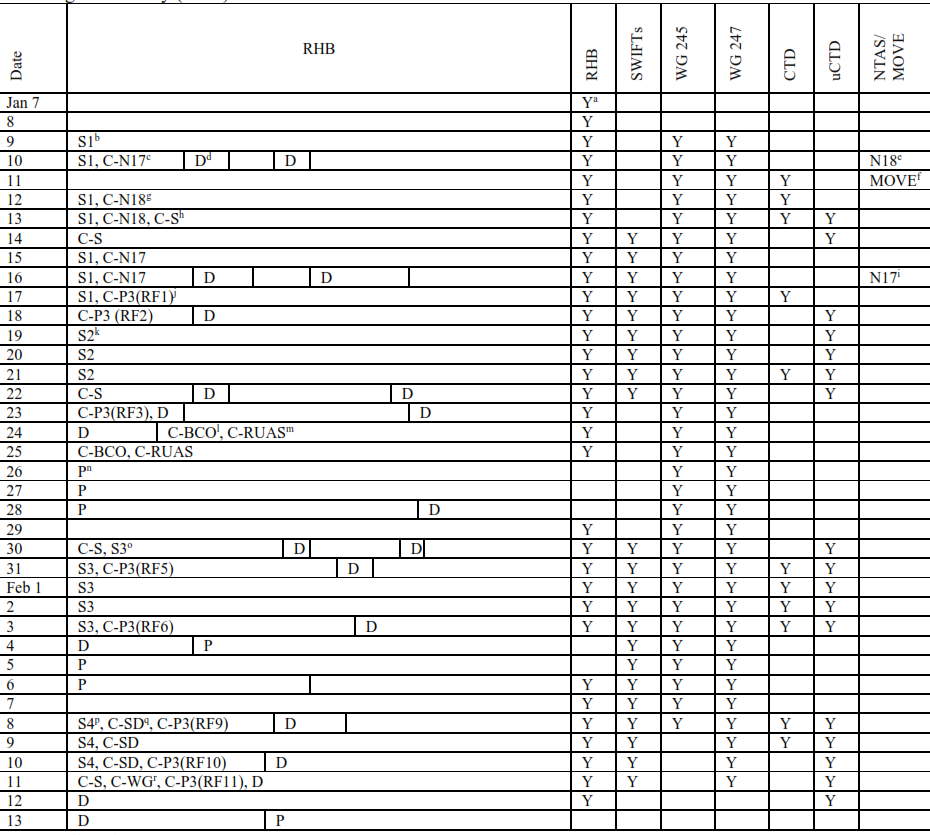
a Y, sampling day. b S1, Station 1; 14∘44′ N, 50∘ 56′ W (NTAS area). c C-N17, comparison between RHB and NTAS-17. d D, downwind transit. e N18, NTAS-18 deployed. f MOVE, MOVE operations. g C-N18, comparison between RHB and NTAS-18. h C-S, comparison between RHB and SWIFTs. i N17, NTAS-17 recovered. j C-P3(RF#), comparison between RHB and P3 Research Flight #. k S2, Station 2; 14∘21′44′′ N, 53∘ W. l C-BCO, comparison between RHB and BCO with RHB at Station BCO (13∘8′55.7′′, 59∘4′59.2′′ W). m C-RUAS, comparison between RHB and RAAVEN UAS. n P, RHB in port. o S3, Station 3; 13∘54′ N, 54∘30′ W. p S4, Station 4; 13∘51′ N, 54∘51′36′′ W. q C-SD, comparison between RHB and Saildrone 1064. r C-WG, comparison between RHB and Wave Gliders.
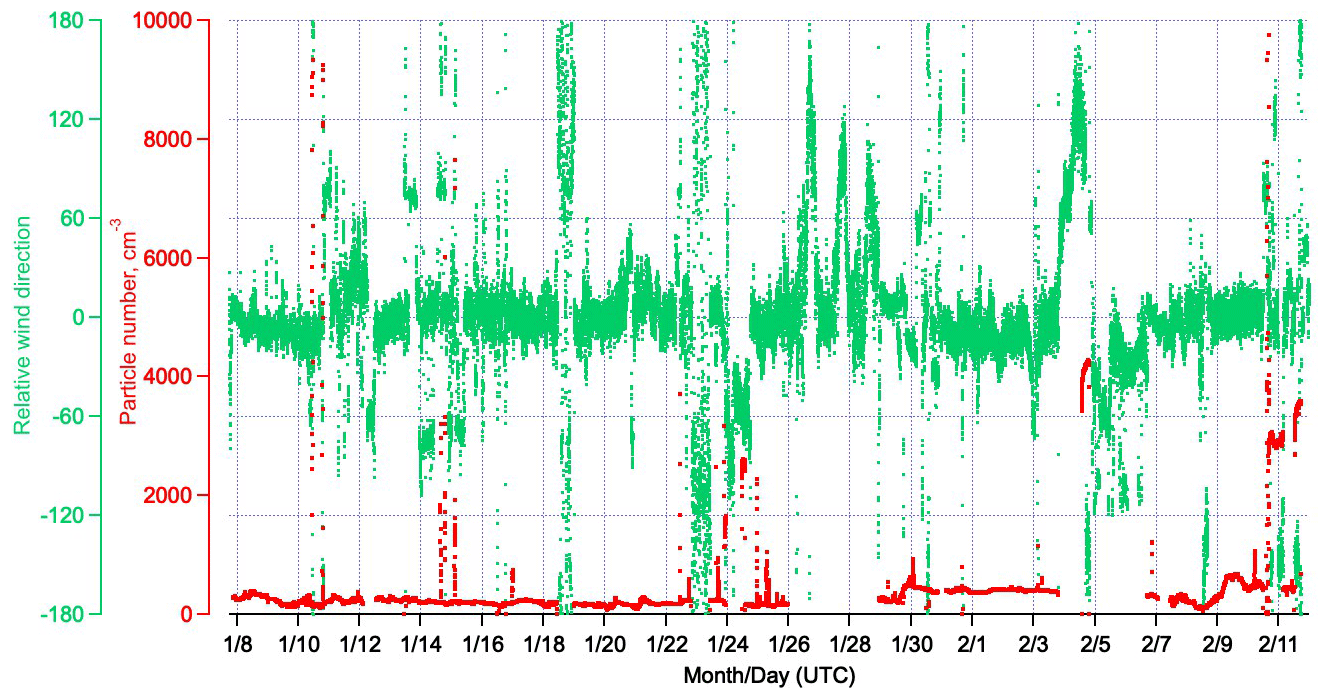
Figure 2Time series of relative wind direction (apparent wind relative to the bow of the ship, negative values are port and positive values are starboard) and particle number concentration (Dgn>13 nm) measured on the RV Ronald H. Brown during ATOMIC.
A general timeline of events for Legs 1 and 2 is provided in Sect. 2.1 and 2.2. Descriptions of the instrumentation on board the ship and deployed assets are provided in Sect. 2.3 to 2.7 and on the Saildrone, RAAVEN UAS, and SVPS drifters in Sect. 2.8 to 2.10.
Table 2Dates (UTC) and positions of deployment and recovery of NTAS moorings, two Wave Gliders, and six SWIFTs. Assets are listed in order of start and stop times of the data stream. Distance traveled is given for the SWIFTs and Wave Gliders.
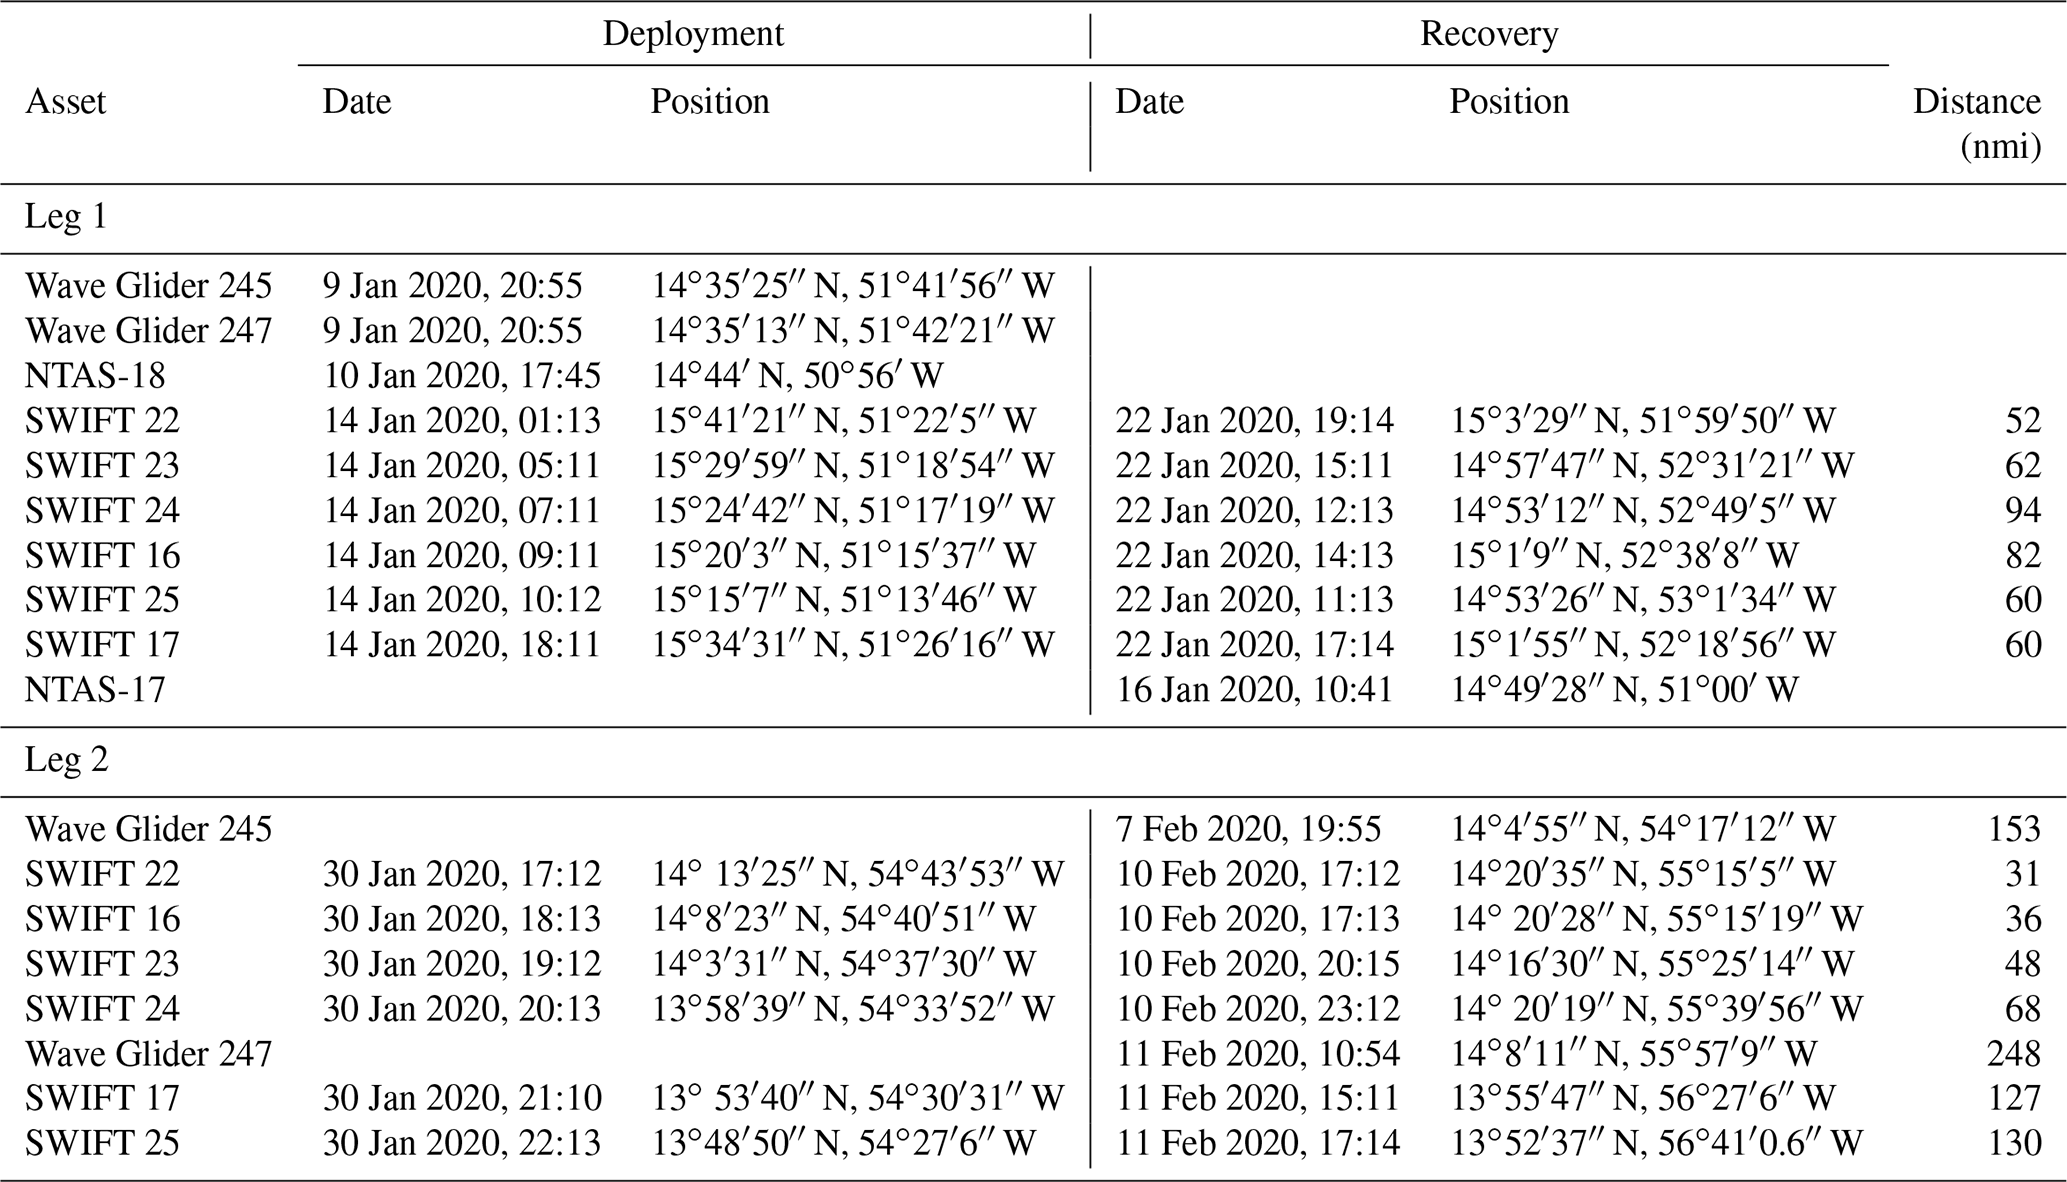
Table 3Times when platforms were within relatively close proximity providing the potential for inter-platform comparisons. Also given are distances between platforms during the comparisons. Results from inter-platform comparisons reported here are indicated in bold. Distances between RHB and NTAS refer to distance to the mooring anchor. Distance to buoys was between 0.25 and 3 nmi.
2.1 Sampling events during Leg 1
Timelines of events for Legs 1 and 2 are shown in Table 1. Dates and positions of deployment and recovery of assets are listed in Table 2. Times when platforms were within relatively close proximity providing the potential for inter-platform comparisons are given in Table 3. All times reported throughout the paper are in UTC.
During Leg 1, the NTAS mooring was swapped out, Wave Gliders were deployed for the duration of the experiment, and the SWIFTs were deployed and then recovered at the end of the leg. In addition to these logistical operations, measurements were made throughout the leg to characterize atmospheric and oceanic conditions upwind of the EUREC4A study region.
The ship departed Bridgetown, Barbados, on 7 January 2020 in transit to the NTAS-18 mooring target location at 14∘44′ N and 50∘56′ W. Radiosonde launches every 4 h and continuous atmosphere and sea surface sampling began early on 8 January. The latitude and longitude of the four stations occupied during the cruise are listed in Table 1 and shown in Fig. 1. Station 1 (S1) was located in the NTAS region. Two Wave Gliders were deployed on 9 January en route to S1. Once at S1, early on 10 January a comparison between shipboard and NTAS-17 atmosphere and ocean measurements was conducted. The NTAS-18 mooring was deployed later on 10 January. After deployment, the ship transited 55 nmi to the northwest of S1 to the MOVE region near 15∘27′ N and 51∘32′ W (Fig. 1). Unsuccessful attempts were made over a 24 h period to triangulate the position of the MOVE1-13 mooring and PIES198 and 238. The ship left the MOVE region on 12 January at 05:30 to transit back to S1. The MOVE work did not compromise continuous atmospheric and surface ocean sampling and is not discussed further.
A comparison of atmospheric and oceanic parameters measured on board the ship and NTAS-18 was conducted 12 to 13 January. The comparison included a CTD (conductivity, temperature, and depth) sensor mounted on the ship's rosette and conductivity and temperature sensors attached to the NTAS mooring line. While waiting for the weather to calm down enough to recover NTAS-17, six SWIFTs were deployed. The ship transited 55 nmi to the northwest and deployed the first SWIFT (22) on 14 January at 01:13 UTC at 15∘41′21′′ N, 51∘22′5′′ W (Fig. 1, Table 2). Following a southeast track, the remaining five SWIFTs were deployed 5 to 12 nmi apart across horizontal gradients in ocean surface current and temperature. SWIFT17, the second one deployed, was recovered due to the failure of a 3-D sonic anemometer. The ship returned to SWIFT17 to swap out the anemometer. It was re-deployed near its original position on 14 January at 18:11 UTC. After each SWIFT deployment, underway CTD (uCTD) casts were performed to a depth of 50 m for comparison to SST and salinity measured on board the SWIFTs and to understand the ocean mixed-layer structure at the beginning of each SWIFT Lagrangian drift. In addition, the ship sat near each SWIFT for at least an hour after deployment for a comparison of measured near-surface atmospheric and surface seawater parameters.
The ship returned to S1 and conducted a second comparison with NTAS-17 on 15 to 16 January, including a CTD cast with the ship's rosette and sensors on the NTAS mooring line. NTAS-17 was recovered on 16 January. The ship stayed at S1 and was within the P-3's dropsonde circle during its first flight (Research Flight 1 or RF1) on 17 January from 15:30 to 16:40. A first comparison between the uCTD and the CTD on the ship's rosette for temperature and salinity was conducted on 17 January at 22:36. The ship's CTD cast went to a depth of 500 m.
With the NTAS and MOVE work finished, the ship transited downwind on 18 January for 14.5 h to Station 2 (S2) located at 14∘21′44′′ N and 53∘ W (Fig. 1a). This location was downwind of the projected paths of the SWIFTs but still upwind of the EUREC4A study region. During the transit, aerosol and flux measurements were compromised by relative winds abaft the beam, but surface ocean and meteorological measurements as well as radiosonde launches continued. In addition, uCTD casts to 100 m depth were made every hour to investigate a large-scale SST gradient between NTAS and S2. The ship briefly slowed to 2 to 4 kn for each cast.
The ship reached S2 on 19 January at 01:30 UTC and turned into the wind for optimal aerosol and flux measurements. Underway CTDs were conducted to a depth of 100 m every 6 h. The second overflight of the P-3 (RF2) occurred on 19 January at 14:57 UTC with the RV Ronald H. Brown within the aircraft's dropsonde circle. A second comparison between the uCTD and the CTD on the ship's rosette was conducted on 21 January at 16:15 with the ship's CTD reaching a depth of 150 m.
On 22 January at 07:30 UTC, the ship left S2 to recover the SWIFTs before the end of Leg 1. The SWIFTs had drifted between 53 and 103 nmi to the southwest with those deployed at the more southern locations drifting the furthest (Fig. 1a, Table 2). The ship transited 32 nmi to the north to reach the southernmost SWIFT and then followed a course to the northeast recovering the remaining SWIFTs, which were 7 to 24 nmi apart. Once all SWIFTs were on board (22 January, 19:14), the ship transited 180 nmi to the southwest to 14∘22′59′′ N and 55∘ W to be in the center of the P-3's dropsonde circle the next day. Aerosol and flux measurements were compromised during the transit due to the relative wind being abaft the beam.
The ship reached the designated position on 23 January at 10:30, turned into the wind for optimal aerosol and flux measurements, and was within the P-3's dropsonde circle on 23 January at 14:06 (RF3). Later in the flight (15:42), the P-3 flew over the ship at an altitude of 150 m. This flyby was the closest the P-3 was to the ship during the ATOMIC campaign while all instrumentation was operational. At 22:00 the ship started the 250 nmi transit back to Bridgetown with a planned stop upwind of BCO/BACO for a measurement comparison. Initially, relative winds were from the port side of the ship at −100∘ relative to the bow, but 6 h into the transit they shifted to a relative direction of −50∘ due to a change in true wind direction and the ship's course, making for better conditions for aerosol and flux measurements. Radiosonde launches were halted on 24 January at 02:45 near 56∘ W with the knowledge that sondes launched from the RV Meteor and BCO could be used to fill in the gap. The ship arrived at the comparison point 20 nmi east of BCO (13∘8′55.7′′ N, 59∘4′59.2′′ W) at 18:20 on 24 January and stayed until 25 January at 23:40 (Fig. 1a). Underway CTDs were conducted approximately every 2 h until 25 January at 21:58.
The ship ended Leg 1 with a transit around the southern end of Barbados and into Bridgetown with an arrival on 26 January at 12:15 for an open house and outreach activities to be conducted on 27 January.
2.2 Sampling events during Leg 2
During Leg 2, the SWIFTs were deployed at the beginning of the leg and then recovered along with the Wave Gliders at the end of the leg. Similar to Leg 1, measurements were made throughout the leg to characterize atmospheric and oceanic conditions upwind of the EUREC4A study region.
The RV Ronald H. Brown left Bridgetown at 22:15 on 28 January and headed for Station 3 (S3) located 290 nmi to the northeast of BCO/BACO at 13∘54′0′′ N and 54∘30′0′′ W (Fig. 1b). S3 was roughly halfway between BCO/BACO and NTAS. Radiosonde launches began on 29 January at 06:45 and continued every 4 h. The ship veered off its NE track on 29 January at 20:18 and turned to the southeast to map the spatial orientation of SST fronts with gradients around 0.75 ∘C for determining where to deploy SWIFTs. When done with mapping, the ship went north on 30 January at 04:15 arriving in the vicinity of S3 and Wave Glider 245 at 08:00. Wave Glider 245 was recovered to replace malfunctioning sensors.
The ship zigzagged to the northwest and then northeast until reaching 14∘13′25′′ N and 54∘43′53′′ W on 30 January at 17:12 where the first SWIFT deployment of Leg 2 took place (Fig. 1d, Table 2). The remaining SWIFTs were deployed on a southeast track approximately 6 nmi apart. After each SWIFT deployment, uCTD casts were performed to a depth of 100 m to provide a subsurface context for SWIFT measurements. During each cast, the ship moved into the wind at 0.5 kn. Wave Glider 245 was re-deployed on 30 January at 18:08 after the last SWIFT was put in the water. The ship then transited back to S3, arriving 5 h later at 23:09. During this 6 h period, as the ship was maneuvering to deploy SWIFTs, relative winds were from the port side between −50 and −100∘, compromising aerosol and flux measurements.
The ship remained at S3 until 3 February at 15:00 to characterize diurnal variations in oceanic and atmospheric conditions and to be in position for the P-3's RF5 and RF6. Continuous atmospheric and surface ocean measurements were made, radiosondes were launched every 4 h, and uCTD casts were conducted every 2 h. Four comparisons between the uCTD and the CTD on the ship's rosette were conducted between 1 and 3 February with the ship's CTD reaching a depth of 400 m. The ship was at the center of the P-3's dropsonde circle on 31 January at 16:25 (RF5) and 3 February at 14:13 (RF6).
On 3 February at 19:30 the ship headed back to Bridgetown for a medical emergency. Aerosol and flux measurements were compromised due to relative winds abaft the beam. Radiosonde launches continued every 4 h. The last launch before reaching port was on 4 February at 10:45. The ship arrived in Bridgetown on 4 February at 19:00.
The ship departed Bridgetown on 6 February at 16:00 and headed northeast to Station 4 (S4) located at 13∘51′ N and 54∘51′36′′ W, 21.2 nmi southwest of S3. Atmospheric measurements resumed along with radiosonde launches every 4 h. The ship arrived at S4 on 8 February at 01:00 but left 6 h later to recover Wave Glider 245 because it was experiencing navigation problems that could have endangered the vehicle. The Wave Glider was recovered 36 nmi to the northeast of S4 (14∘4′55′′ N, 54∘17′12′′ W) on 8 February at 12:45. Aerosol and flux measurements were compromised during the downwind transit back to S4 between 12:45 and 16:25. Once back on station, optimal aerosol and flux measurements resumed along with uCTD casts every 2 h. A CTD cast to a depth of 1000 m with the ship's rosette was conducted on 8 February at 17:00 for comparison to the uCTD.
Still at S4, the ship was within the P-3's nighttime dropsonde circle on 9 February (RF9) at 05:57. The NOAA PMEL-operated Saildrone 1064 completed a first leg between BCO and NTAS and then sailed near the ship for a comparison of fluxes and measured meteorological and seawater parameters. The Saildrone was 2.8 to 3.6 nmi upwind of the ship between 8 February from 09:30 to 18:10 and within 0.7 to 0.8 nmi of the ship between 8 February, 19:00 and 10 February, 18:50. Two final comparisons between the uCTD and the CTD on the ship's rosette were conducted on 8 and 9 February with the ship's CTD going to depths of 1000 and 400 m, respectively. The ship remained at S4 for the P-3's second night flight (RF10) and was within the dropsonde circle on 10 February from 05:46 to 06:42. The ship's final coordination with the P-3 occurred during a combination research and sightseeing flight with press (RF11) on 11 February. The ship was not within the dropsonde circle but was flown over at sunrise at 10:26.
The ship remained at S4 until 10 February at 12:00, at which point aerosol measurements were ended and the ship began the transit to recover SWIFTs and Wave Glider 247. Recovery operations were conducted between 10 February, 15:00 and 11 February, 18:15. The four SWIFTs (16, 22, 23, and 24) that were initially deployed to the north between 14∘13′25′′ and 13∘58′39′′ N drifted to the northwest, traveling a total distance ranging from 31 to 68 nmi (Table 2, Fig. 1b). The two SWIFTs (17 and 25) deployed to the south between 13∘53′40′′ N and 13∘48′50′′ N initially drifted to the southwest, each traveling 130 nmi. The ship transited to the northeast to pick up the northern cluster of SWIFTs first, staying near each asset for up to 1.5 h for a comparison of measured atmospheric and oceanic parameters. The ship then did several back-and-forth tracks between the position of Wave Glider 247 and SWIFT 17 mapping a SST front before recovering the Wave Glider and the last two SWIFTs.
After the SWIFTs and Wave Glider were recovered, the ship started a northeast transit on 11 February around 19:30 across a SST front in the upwind direction to study air–sea interaction and atmospheric and oceanic mixed-layer variability. Underway CTDs were made continuously. On 12 February at 06:00, the ship began the southwest transit back to Bridgetown for the final time. Atmospheric sampling was compromised during the downwind transit. The last radiosonde launch occurred on 12 February at 10:45. The ship arrived in port on 13 February at 10:00.
2.3 NTAS operations and measurements
NTAS was established to provide accurate air–sea flux estimates and upper ocean measurements in a region with strong SST anomalies and the likelihood of significant local air–sea interaction on interannual to decadal timescales (Weller, 2018; Bigorre and Galbraith, 2018). The station is maintained at a site near 15∘ N and 51∘ W through successive mooring turnarounds. During Leg 1, the Upper Ocean Processes Group of the Woods Hole Oceanographic Institution (WHOI) and crew of the RV Ronald H. Brown deployed the NTAS-18 mooring and recovered the NTAS-17 mooring at nearby sites. Both moorings used Surlyn foam buoys as the surface element. These buoys are outfitted with two Air–Sea Interaction Meteorology (ASIMET) systems (Colbo and Weller, 2009). The ASIMET system measures, records, and transmits via Iridium satellites the surface meteorological variables necessary to compute air–sea fluxes of heat, moisture, and momentum. The upper 160 m of the mooring line is outfitted with oceanographic sensors for the measurement of temperature, salinity, and velocity. Information on the instruments providing real-time data, measured atmospheric and oceanic parameters, and height/depth of the measurements on the NTAS mooring is provided in Table 4.
Table 4Instrumentation providing real-time data on board the NTAS mooring.
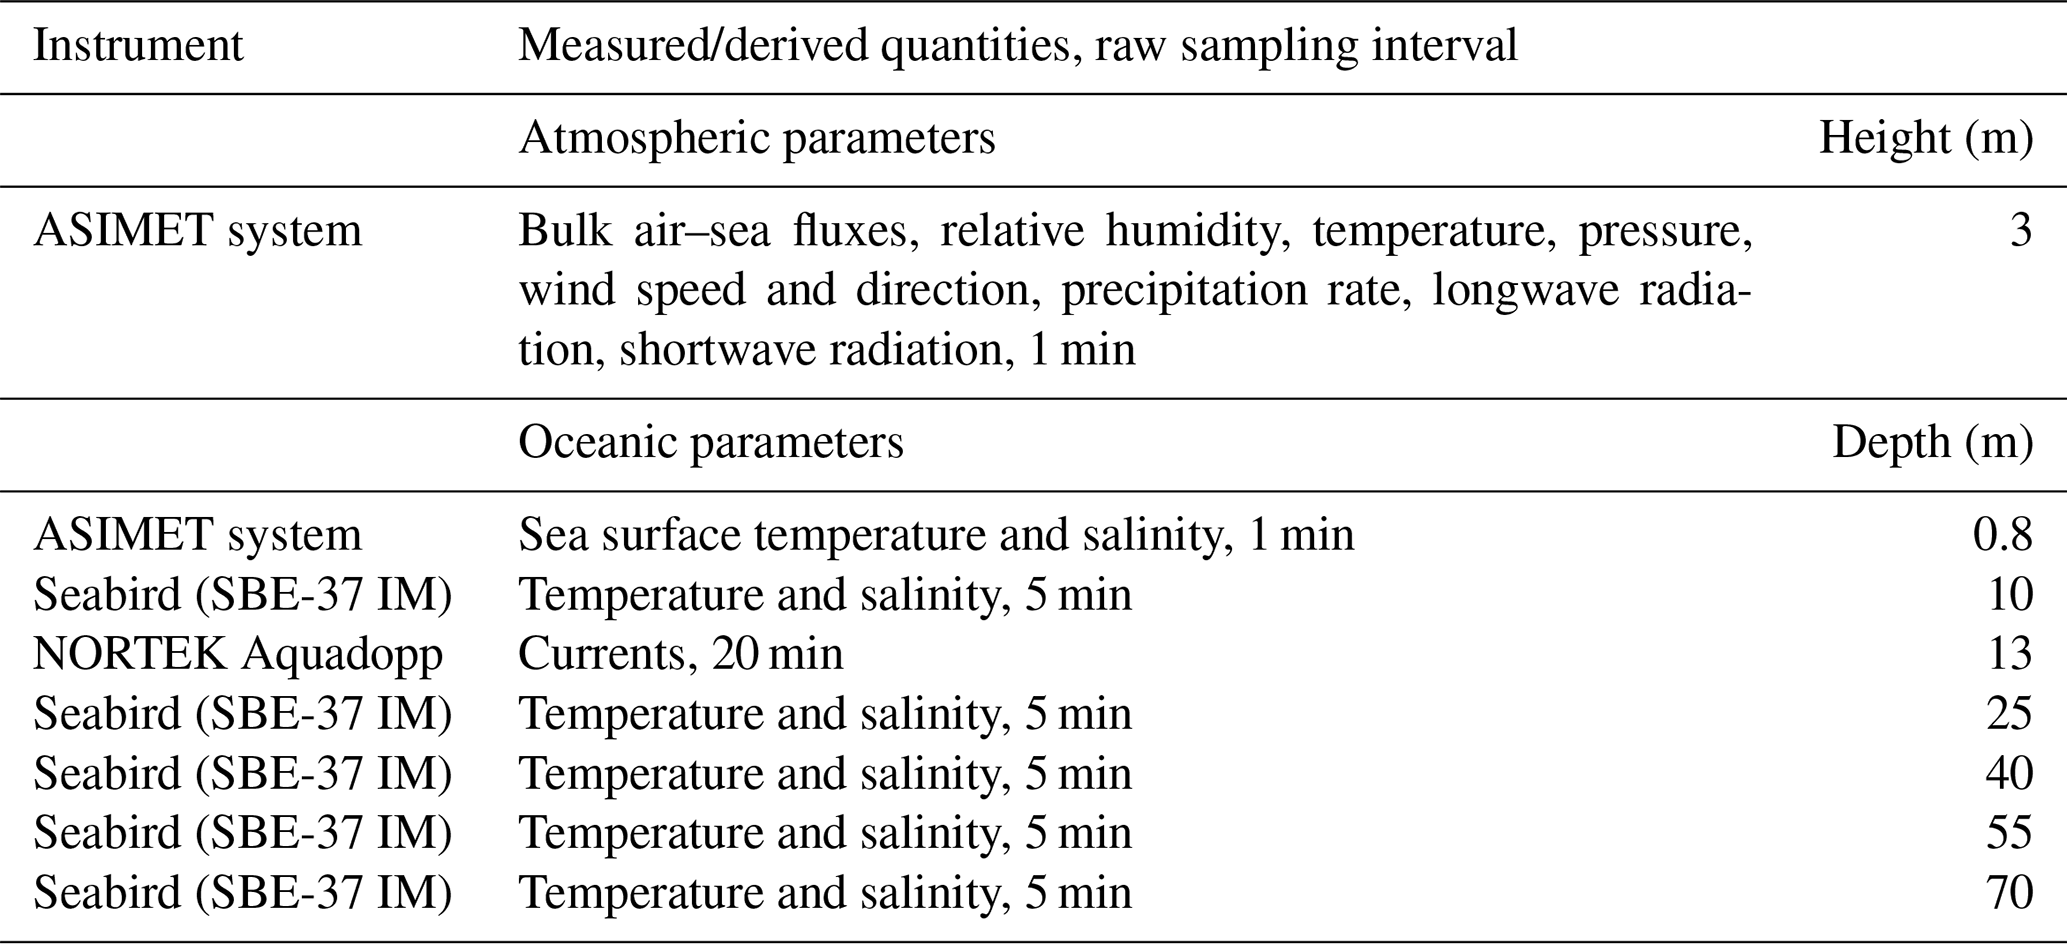
ASIMET data are sampled and recorded internally every minute. The oceanographic measurements are recorded either every 5 or 10 min for temperature and salinity (depending on the instrument type) and 20 min or 1 h for currents. The NTAS-18 mooring was deployed on 10 January at 14∘44′ N, 50∘56′ W with anchor drop at 17:45 in 5055 m of water. The NTAS-17 mooring was recovered on 16 January with anchor release at 10:41. Both buoys have a watch circle of about 2 nmi from their respective anchors and were separated by about 6 nmi during the 10 to 16 January period, allowing for comparisons of measured ocean and atmosphere parameters. Atmospheric data from NTAS-17 and NTAS-18 were combined for comparison to measurements on board the RV Ronald H. Brown (Sect. 4.2.1). Wind speed, air temperature, and specific humidity were adjusted to a height of 10 m and neutral atmospheric stability using the COARE 3.6 bulk model for the comparison (Fairall et al., 2003; Edson et al., 2013). NTAS data in the ATOMIC archive only include data collected during the ATOMIC campaign.
On 8 April 2020 at 08:00 UTC, the NTAS-18 buoy went adrift. It meandered slowly toward the Caribbean for 7 months until being recovered on 20 October 2020. NTAS-19 was deployed on 22 October 2020.
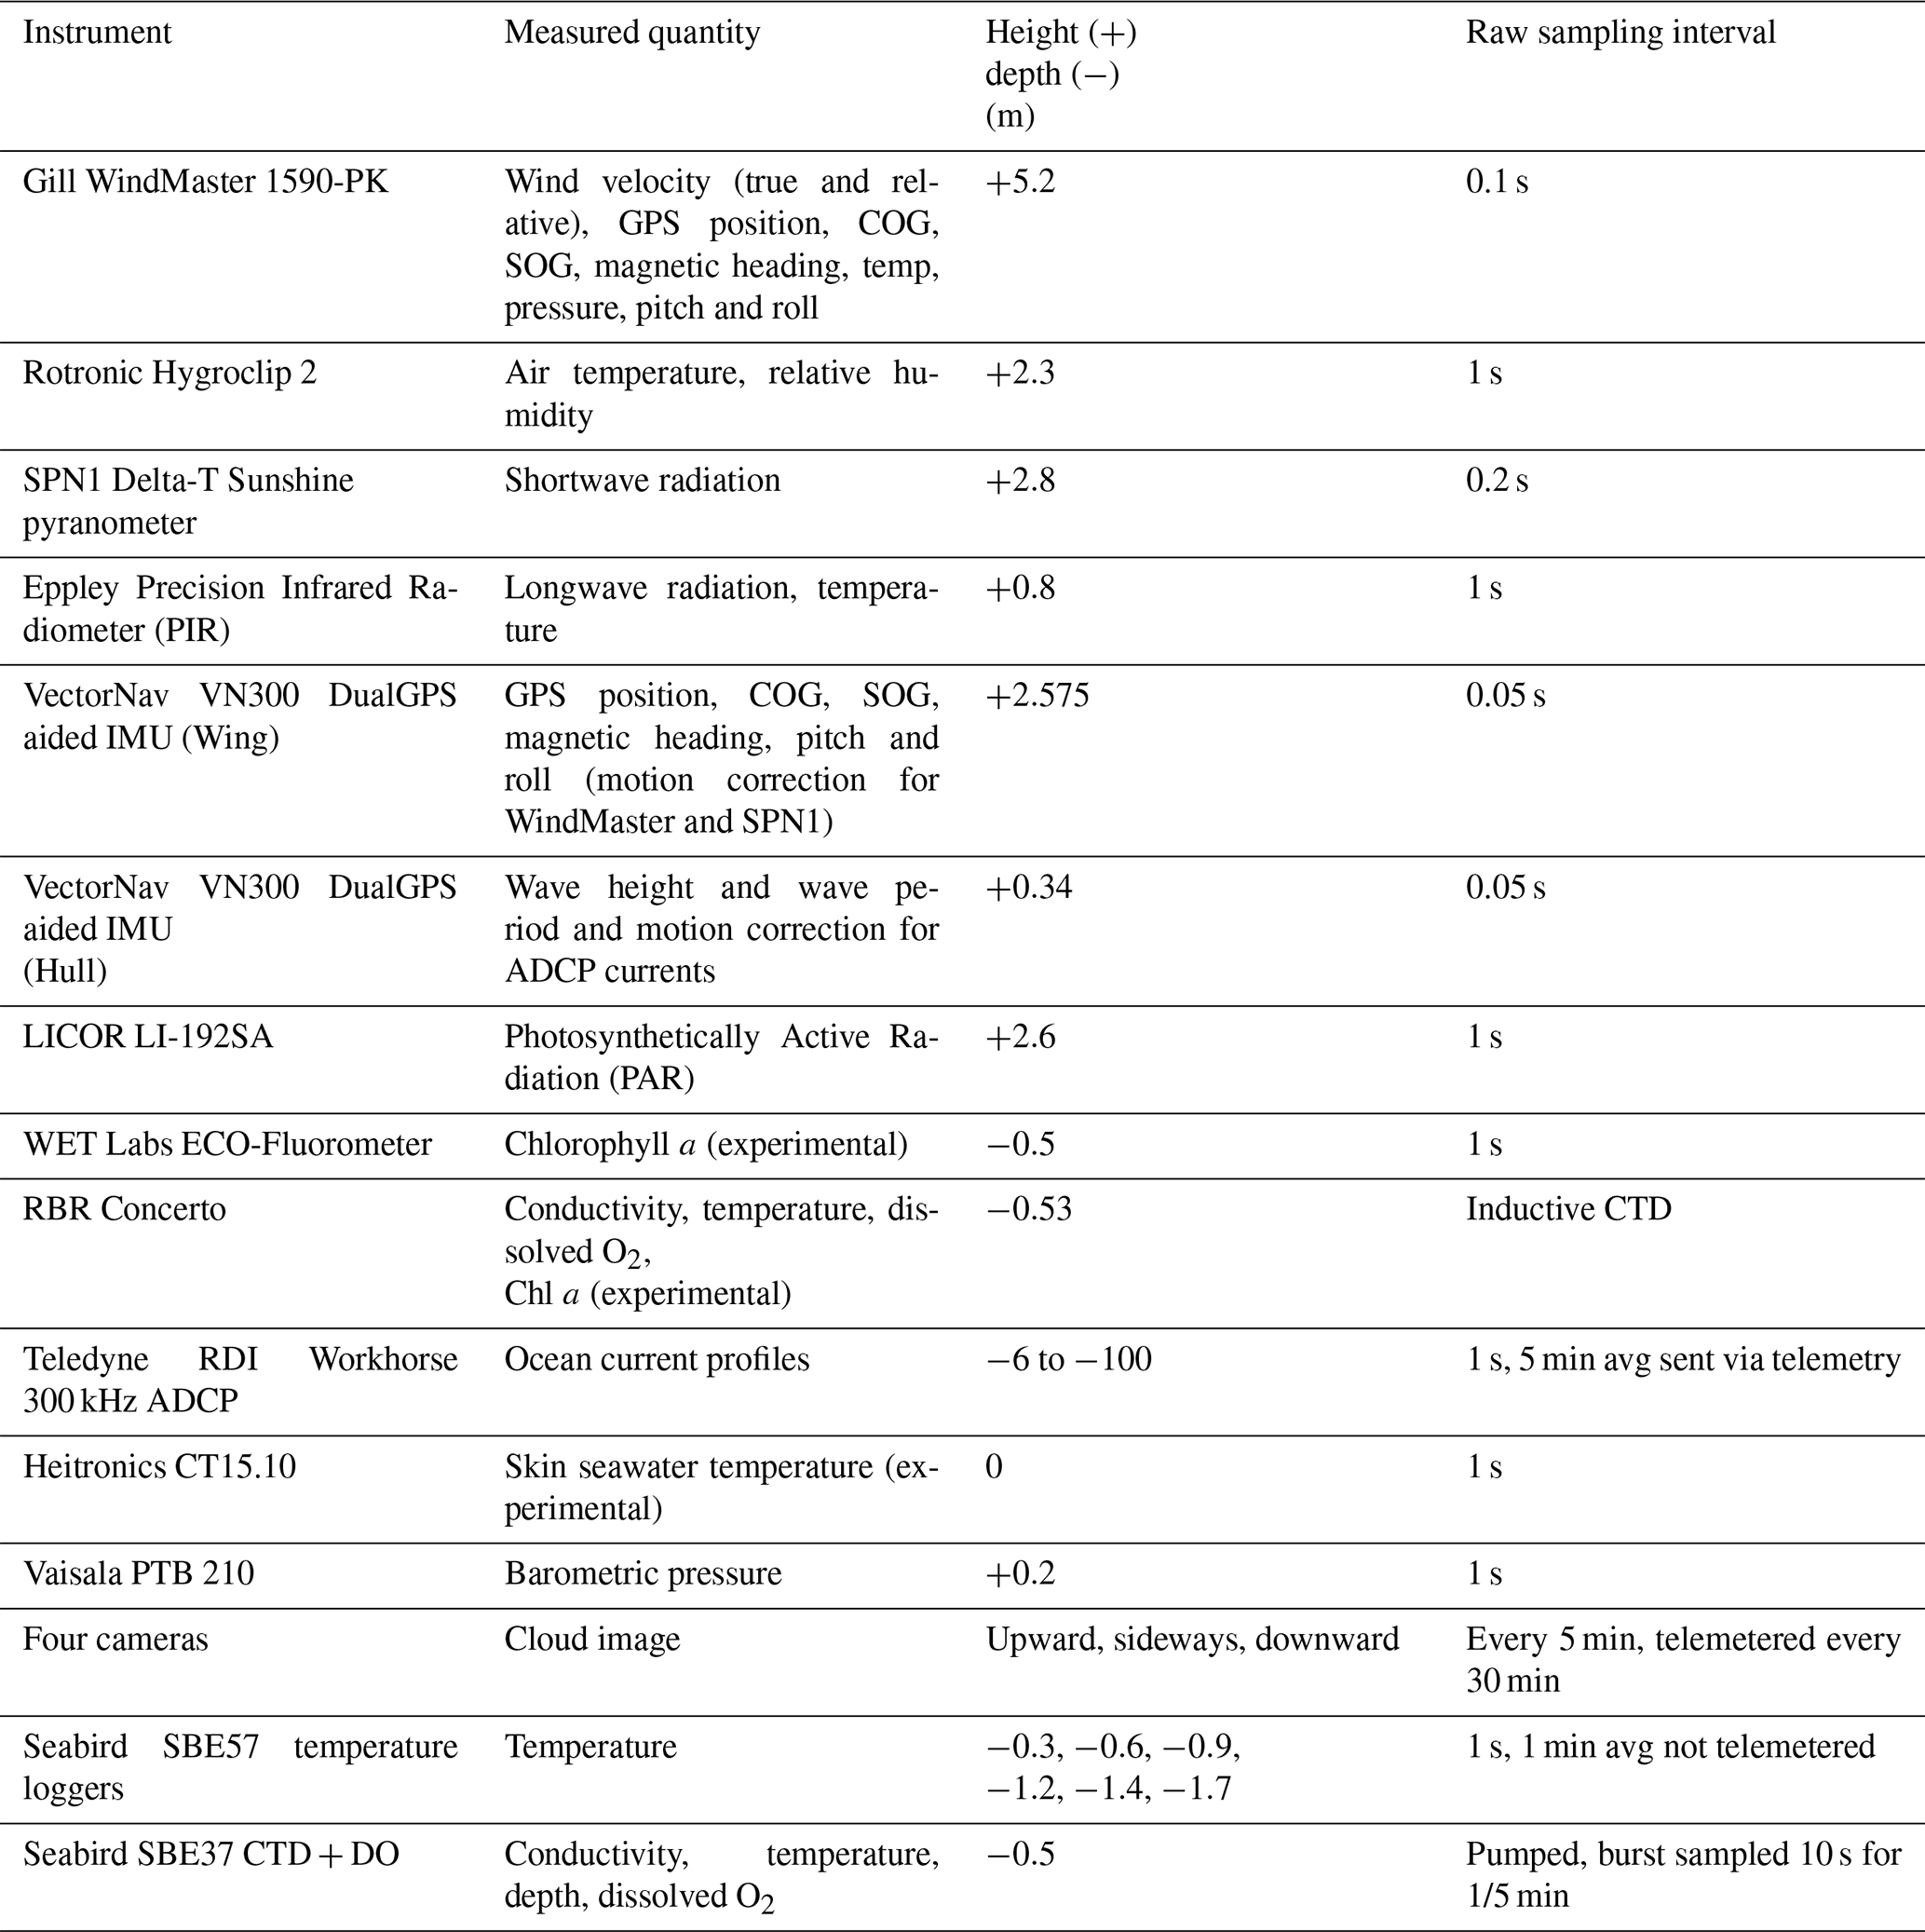
Table 5Instrumentation on board the RV Ronald H. Brown for the measurement of atmospheric and aerosol parameters. The O2 and O3 decks were two and three levels above the main deck, respectively.
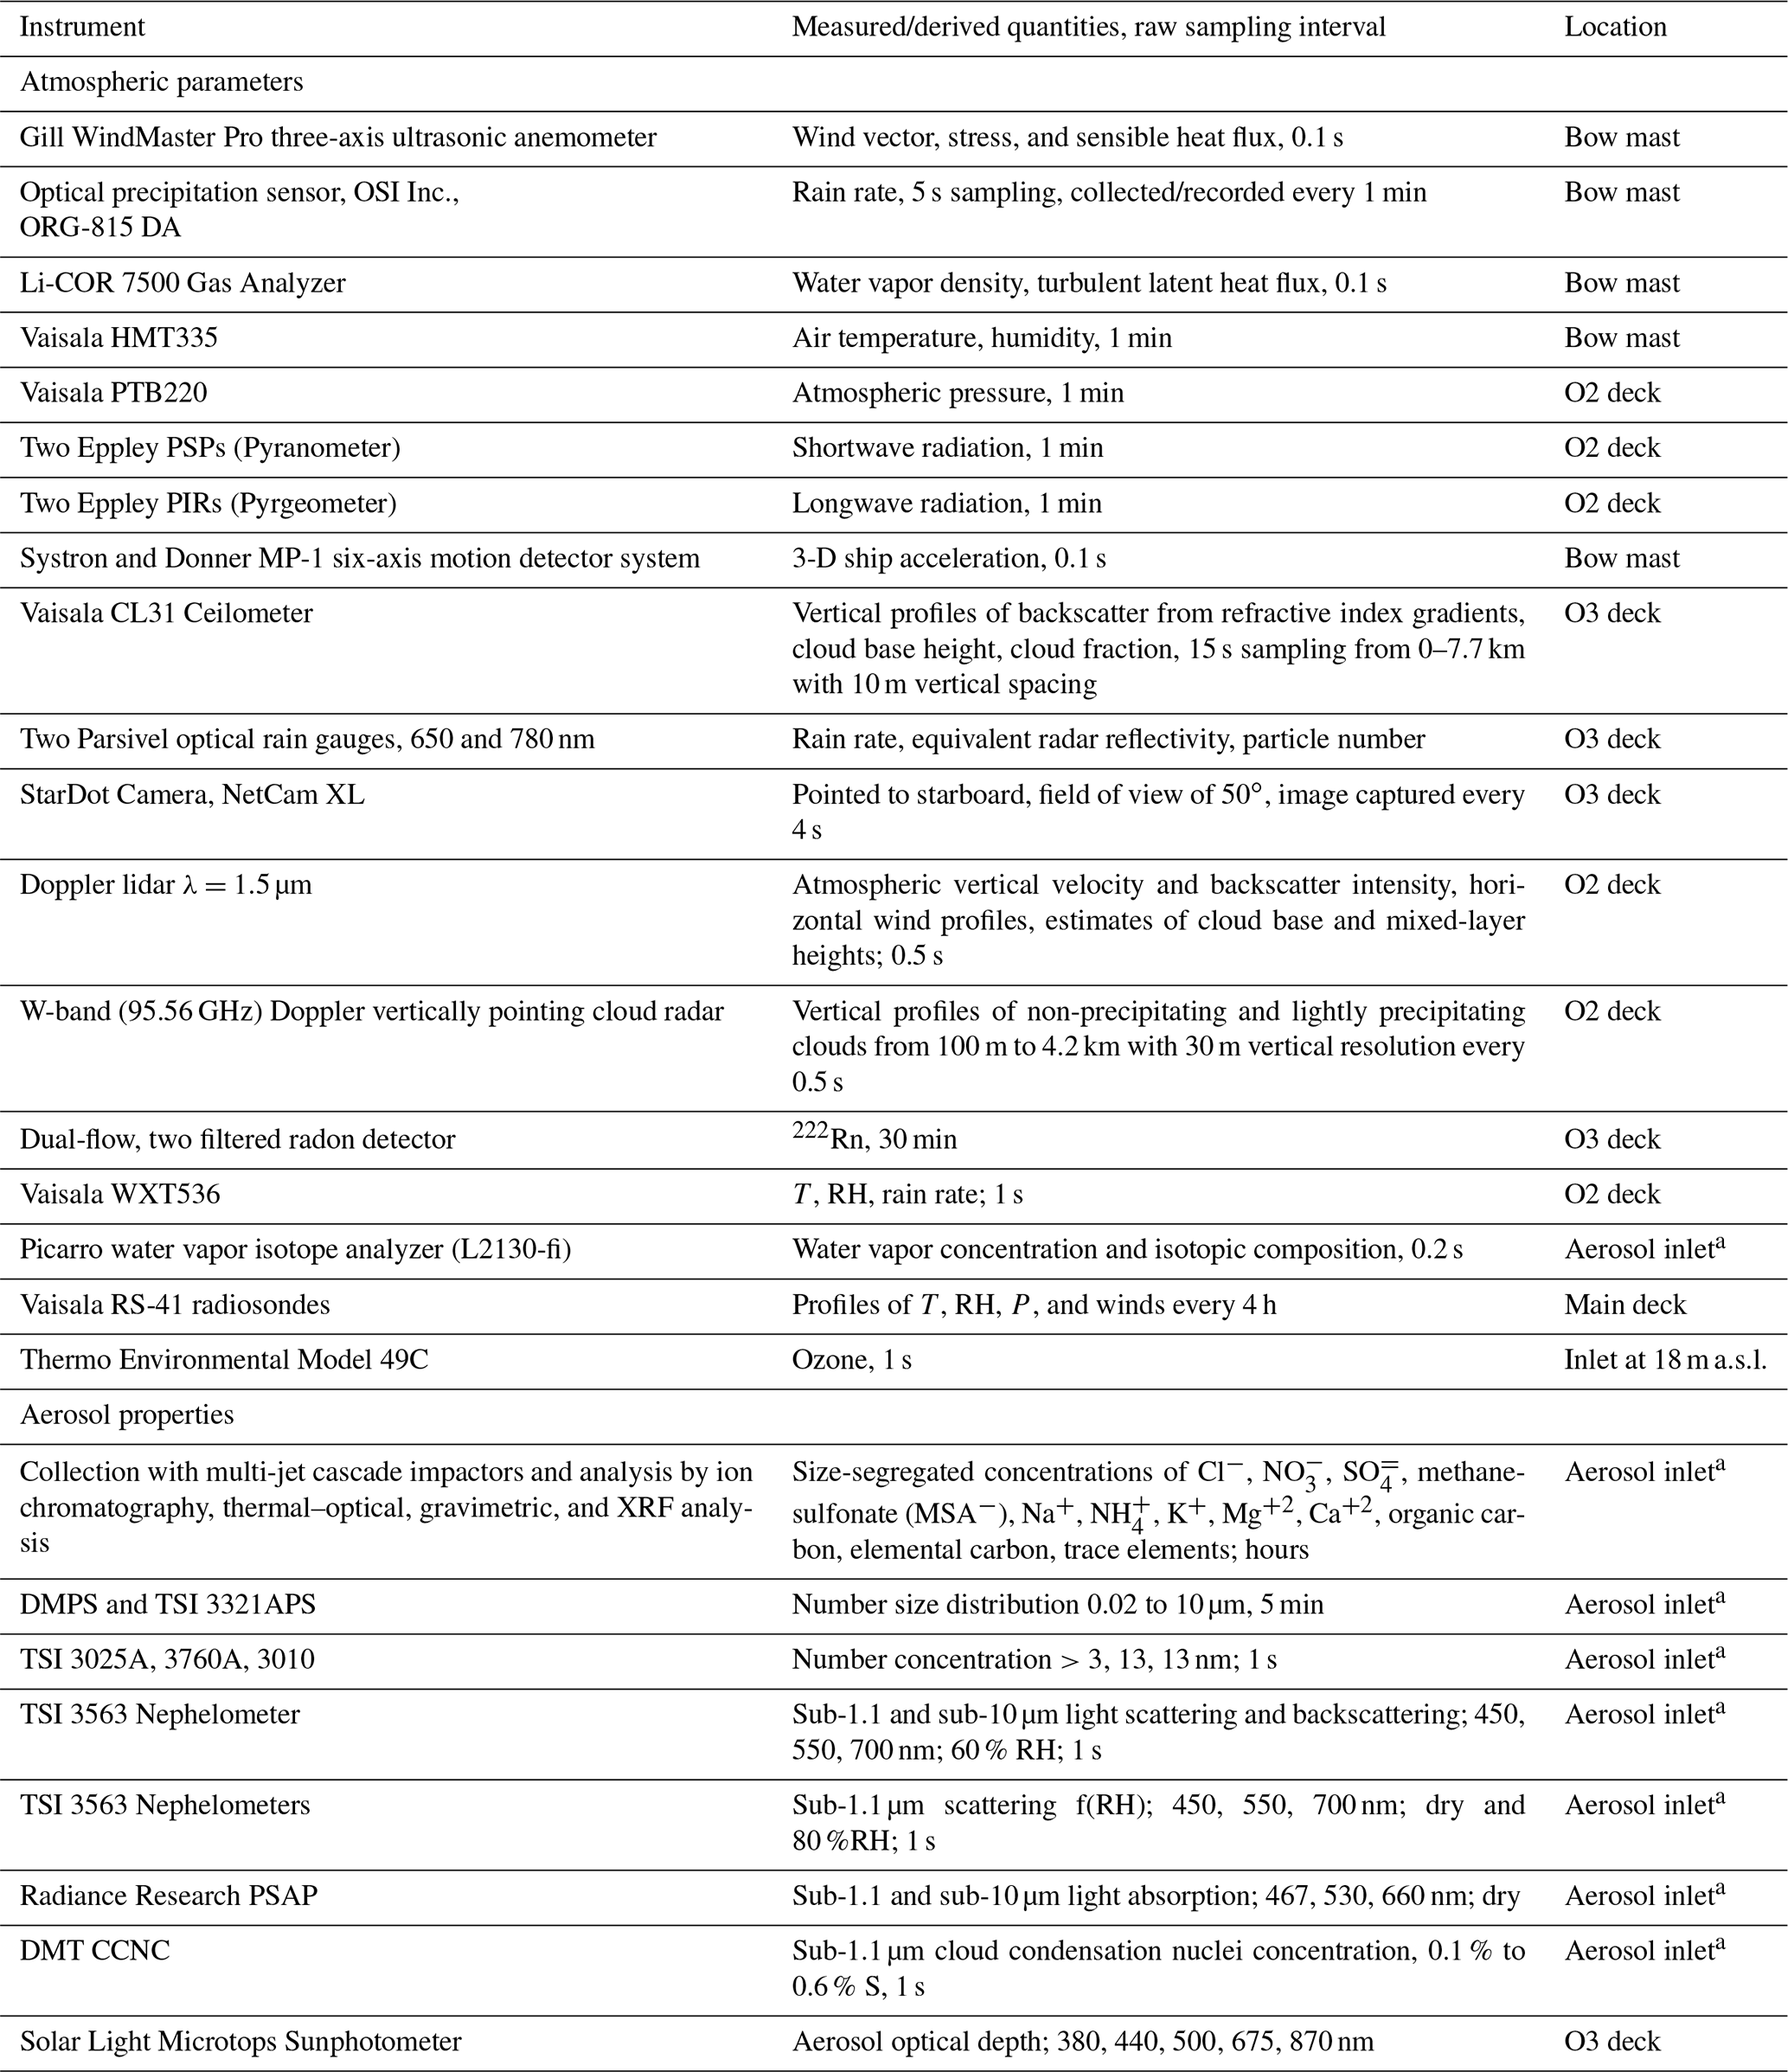
a Aerosol inlet was located on the O2 deck, 18 m a.s.l. Final data products of meteorological and navigation data are 1 and 10 min averages of high-resolution raw data and time-stamped at the beginning of the 1 and 10 min period. Fluxes were calculated at 10 min resolution, then interpolated to 1 min for those files.
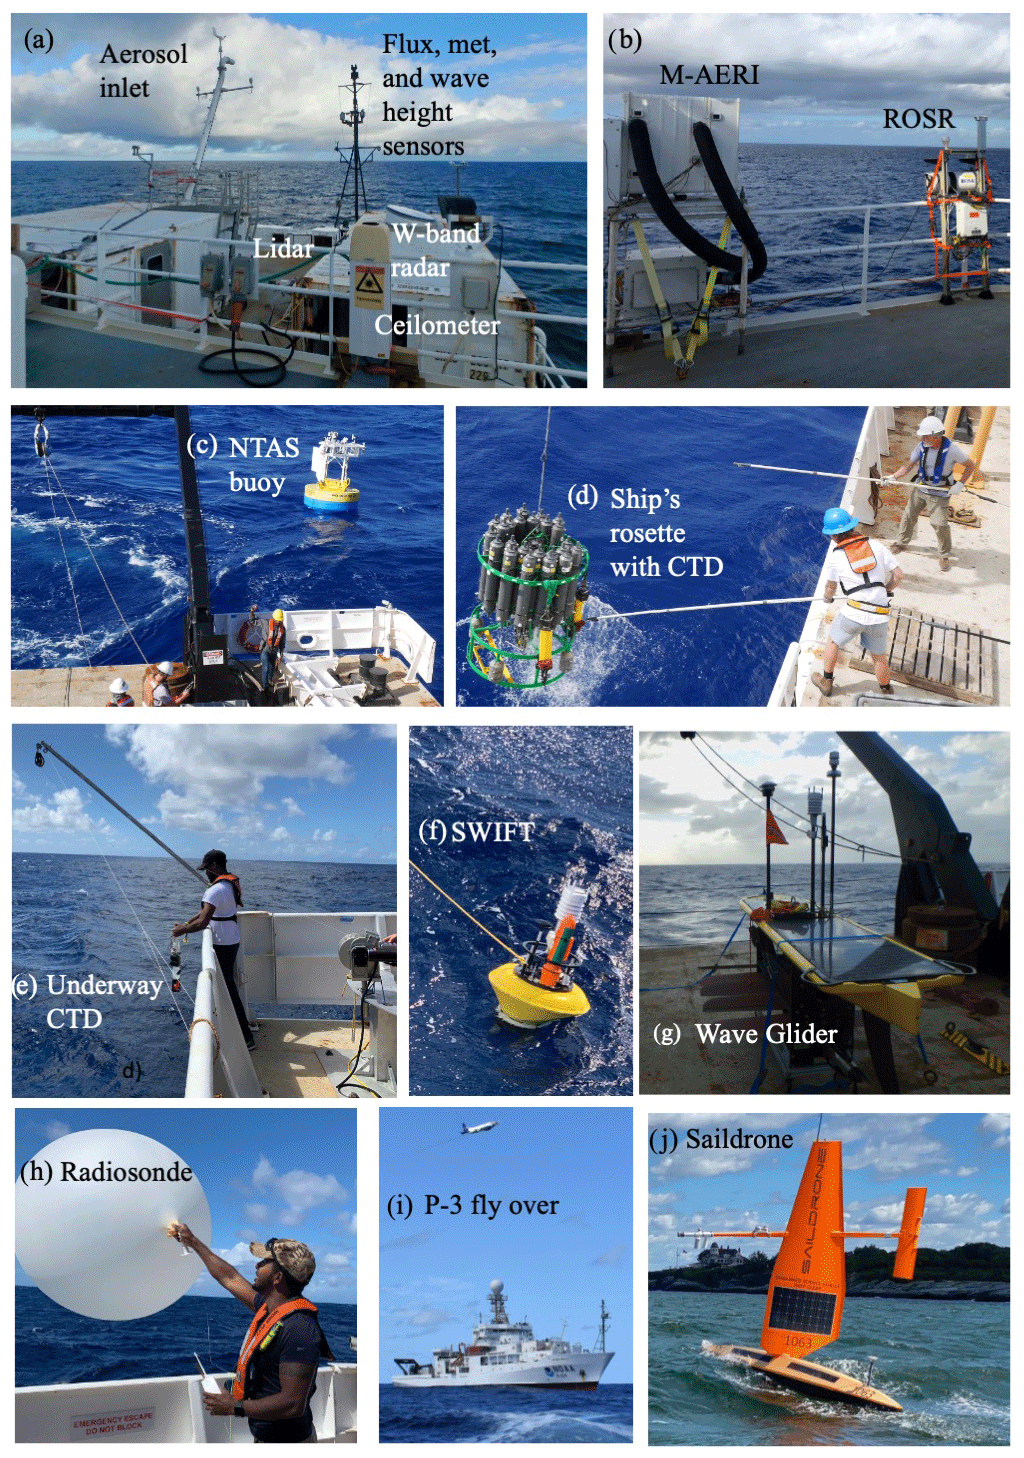
Figure 3Instrumentation on board the RV Ronald. H. Brown for the measurement of atmospheric and oceanic parameters located on (a) the bow mast and forward O2 deck and (b) port side O3 deck. Asset deployments are shown for (c) NTAS mooring, (d) ship's rosette with CTD and Niskin bottles, (e) uCTD, (f) SWIFT, (g) Wave Glider, and (h) radiosonde. Also shown are (i) P-3 fly over of the ship on 23 January and (j) Saildrone upon its return to the United States (Newport, RI) from Barbados. Not shown are disdrometers on the port O3 deck and camera on the starboard O3 deck.
2.4 Shipboard atmospheric measurements
Instrumentation on board the RV Ronald H. Brown for the measurement of atmospheric and aerosol parameters is listed in Table 5. Locations of instruments on deck are shown in Fig. 3. NOAA's Physical Science Laboratory (PSL) collected data to enable a deeper understanding and quantification of cloud processes, the environments in which they either grow or dissipate, how the ocean and atmosphere interact, and the spatial variability of these processes. Instrumentation mounted on the bow mast and forward O2 deck (two levels above the main deck) measured sea-surface meteorological properties, rain rate, radiative fluxes, and air–sea turbulent fluxes using bulk, eddy covariance, and inertial dissipation methods (Fairall et al., 1997, 1996, 2003; Edson et al., 2013). Vertical profiles of backscatter from a ceilometer mounted on the forward O3 deck (three levels above the main deck) provided cloud base height and temporal cloud fraction. For comparison with other platforms (NTAS and Saildrone 1064), wind speed, air temperature, air pressure, and specific humidity were adjusted to a height of 10 m using the COARE 3.6 bulk algorithm. Final data products of meteorological and navigation data are 1 and 10 min averages of high-resolution raw data (see Table 5 for raw sampling intervals). The data are time-stamped at the beginning of the 1 and 10 min period. Fluxes were calculated at 10 min resolution, then interpolated to 1 min.
University of Miami (UM) provided high-resolution measurements of cloud and rain to better understand the relationship between cloud properties and cloud spatial organization as a function of cloud mesoscale organization, in particular rain and the associated atmospheric cold pools (Stevens et al., 2021; Löffler-Mang and Joss, 2000). Two collocated Parsivel disdrometers mounted on the forward O3 deck provided precipitation intensity, drop number, and equivalent radar reflectivity. A sky camera provided a 50∘ field of view oriented horizontally off the starboard side of the ship every 4 s. A microwave radiometer was deployed to provide cloud liquid water path estimates, but its data acquisition was unsuccessful and no data are available. A Marine Atmospheric Emitted Radiance Interferometer (M-AERI) was mounted on the port side O2 deck rail (two levels above the main deck) (Minnett et al., 2001). It measured the spectra of infrared emission from the sea surface and atmosphere for the derivation of skin sea surface temperature and lower troposphere profiles of temperature and humidity (Szczodrak et al., 2007). A W-band Doppler vertically pointing cloud radar was housed in a container on the O2 deck for the measurement of vertical profiles of non-precipitating and lightly precipitating clouds (Moran et al., 2012). The radar was not functional during Leg 1 and operated with a 10 dB attenuator on Leg 2 that prevented detection of non-precipitating clouds. Although the loss of this information limited the ship-based observations of non-precipitating cloud, data from the shipboard ceilometer and Doppler radar and the cloud radar on the P-3 will be used to fill in gaps.
NOAA's Chemical Sciences Laboratory (CSL) operated a microjoule class, pulsed Doppler lidar (microDop) operating at a wavelength of 1.5 µm to assess atmospheric turbulence, aerosol backscatter intensity, and horizontal winds (Schroeder et al., 2020). The lidar was mounted on the forward O2 deck. The system was motion stabilized while staring vertically to within 0.25∘ of zenith. Ship motion projected onto the line-of-site velocity measurement was estimated and removed using a six-axis inertial navigation unit (INU). The INU allowed the lidar to measure the mean and turbulent motions of aerosol in clear air and cloud scatterers with a spatial and temporal resolution of 33.6 m and 2 Hz respectively. The first valid gate was 75 m above the ocean surface. The maximum height of valid data depends on the availability of aerosol scattering targets. Typically, the instrument provided data through the top of the marine atmospheric boundary layer, in the presence of elevated dust layers to 3 km, and clouds to a height of 7 km. The lidar pointed vertically 95 % of the time to sample updrafts and downdrafts in the subcloud mixed layer and in the interstitial trade cumulus boundary layer and spent 2 min of every hour performing a 65∘ elevation, full azimuthal scan to measure horizontal wind profiles. Real-time quicklooks of backscatter intensity profiles showing strongly scattering cloud base and updraft structures were available for awareness of the clouds and turbulent mixed layer throughout the cruise. Cloud base height (CBH) was retrieved by applying Haar wavelet covariance transforms to the backscatter intensity profiles.
Oregon State University and the National Center for Atmospheric Research (NCAR) operated a Picarro water vapor isotope analyzer on Leg 2 of the cruise to investigate processes that shape the atmosphere's humidity structure and its variations. The spectroscopic analyzer measured water vapor concentration and its isotopic composition, the isotope ratios of oxygen () and hydrogen (). All three quantities were measured continuously at 5 Hz frequency via the aerosol inlet on the O2 deck at 18 m above sea level (m a.s.l.). Complementary gas-phase water isotopic measurements were made from the P-3, at BCO, from the French ATR aircraft, and aboard German and French research vessels. Rainwater and seawater were also collected from the ship platforms for future offline analysis. Surface seawater and water column samples from CTD casts were also collected to investigate the upper ocean mixing and the freshwater balance to be evaluated in the context of air–sea gas exchange and upper ocean circulation.
The goals of NOAA's Pacific Marine Environmental Laboratory (PMEL) were to assess the impacts of aerosols on clouds and direct aerosol light scattering and absorption on the temporal variability of net radiation reaching the ocean surface and SST for the conditions of a well-mixed boundary layer. Measurements included aerosol chemical composition, total number concentration, number size distribution, light scattering and its dependence on relative humidity, light absorption, and cloud nucleating ability. Aerosol instrumentation was housed in two containers on the O2 deck. All instruments drew sample air from an inlet 18 m a.s.l. mounted on top of one of the O2 deck vans (Bates et al., 2002) (Fig. 3). Aerosol optical depth (AOD) was measured using Microtops hand-held sun photometers. The raw Microtops data were processed by the NASA Maritime Aerosol Network in conjunction with the Aerosol Robotic Network (Smirnov et al., 2009). In addition, 222Rn was measured for its use as a tracer of continentally influenced air masses (Whittlestone and Zahorowski, 1998), and O3 was measured for its use as an indicator of entrainment from the upper troposphere.
Radiosondes were launched throughout the ATOMIC campaign to provide information about the temporal evolution and vertical structure of the boundary layer, upper atmosphere, and clouds. A total of 97 radiosondes (Vaisala RS41-SGP) were launched from the fantail during Leg 1, and 66 were launched during Leg 2. There were six launches per day at 02:45, 06:45, 10:45, 14:45, 18:45, and 22:45 UTC. Vertical profiles of pressure, temperature, relative humidity, and winds were measured from the surface to approximately 25 km. Measurements were also made during the radiosondes' descent. Data were communicated to the Global Telecommunications System (GTS) following each sounding via email to the U.S. National Weather Service and via FTP to Météo-France. The data were put into 10 m altitude bins and merged with the EUREC4A sounding network. Raw (Level-0), quality-controlled 1 s (Level-1), and vertically gridded (Level-2) data in NetCDF format are available to the public at AERIS (https://doi.org/10.25326/62). The methods of data collection and post-processing can be found in Stephan et al. (2021).
Radiosonde operations were suspended on the ship west of ∼56∘ W when the ship transited to Bridgetown for the planned in port (24 January at 2:45) and an emergency medical evacuation (4 February at 10:45). Soundings from BCO were stitched together with those from the ship to allow for an uninterrupted data record over the entire cruise.
The lifted condensation level (LCL) was calculated from the BCO–RHB radiosonde data record and assumed to represent cloud base height (CBH). The LCL (in m) was calculated as
where T50 is temperature and Td,50 is dew point, both at 50 m height (Espy, 1836; Bolton, 1980). The lowest altitude considered was 50 m to avoid contamination by the temperature and relative humidity near the ship's deck and to minimize the effect of vertical gradients in the surface layer. Since the calculation started at 50 m, 50 was added to the LCL.
Table 6Instrumentation on board the RV Ronald H. Brown for the measurement of seawater parameters. O2 deck is two levels above the main deck.
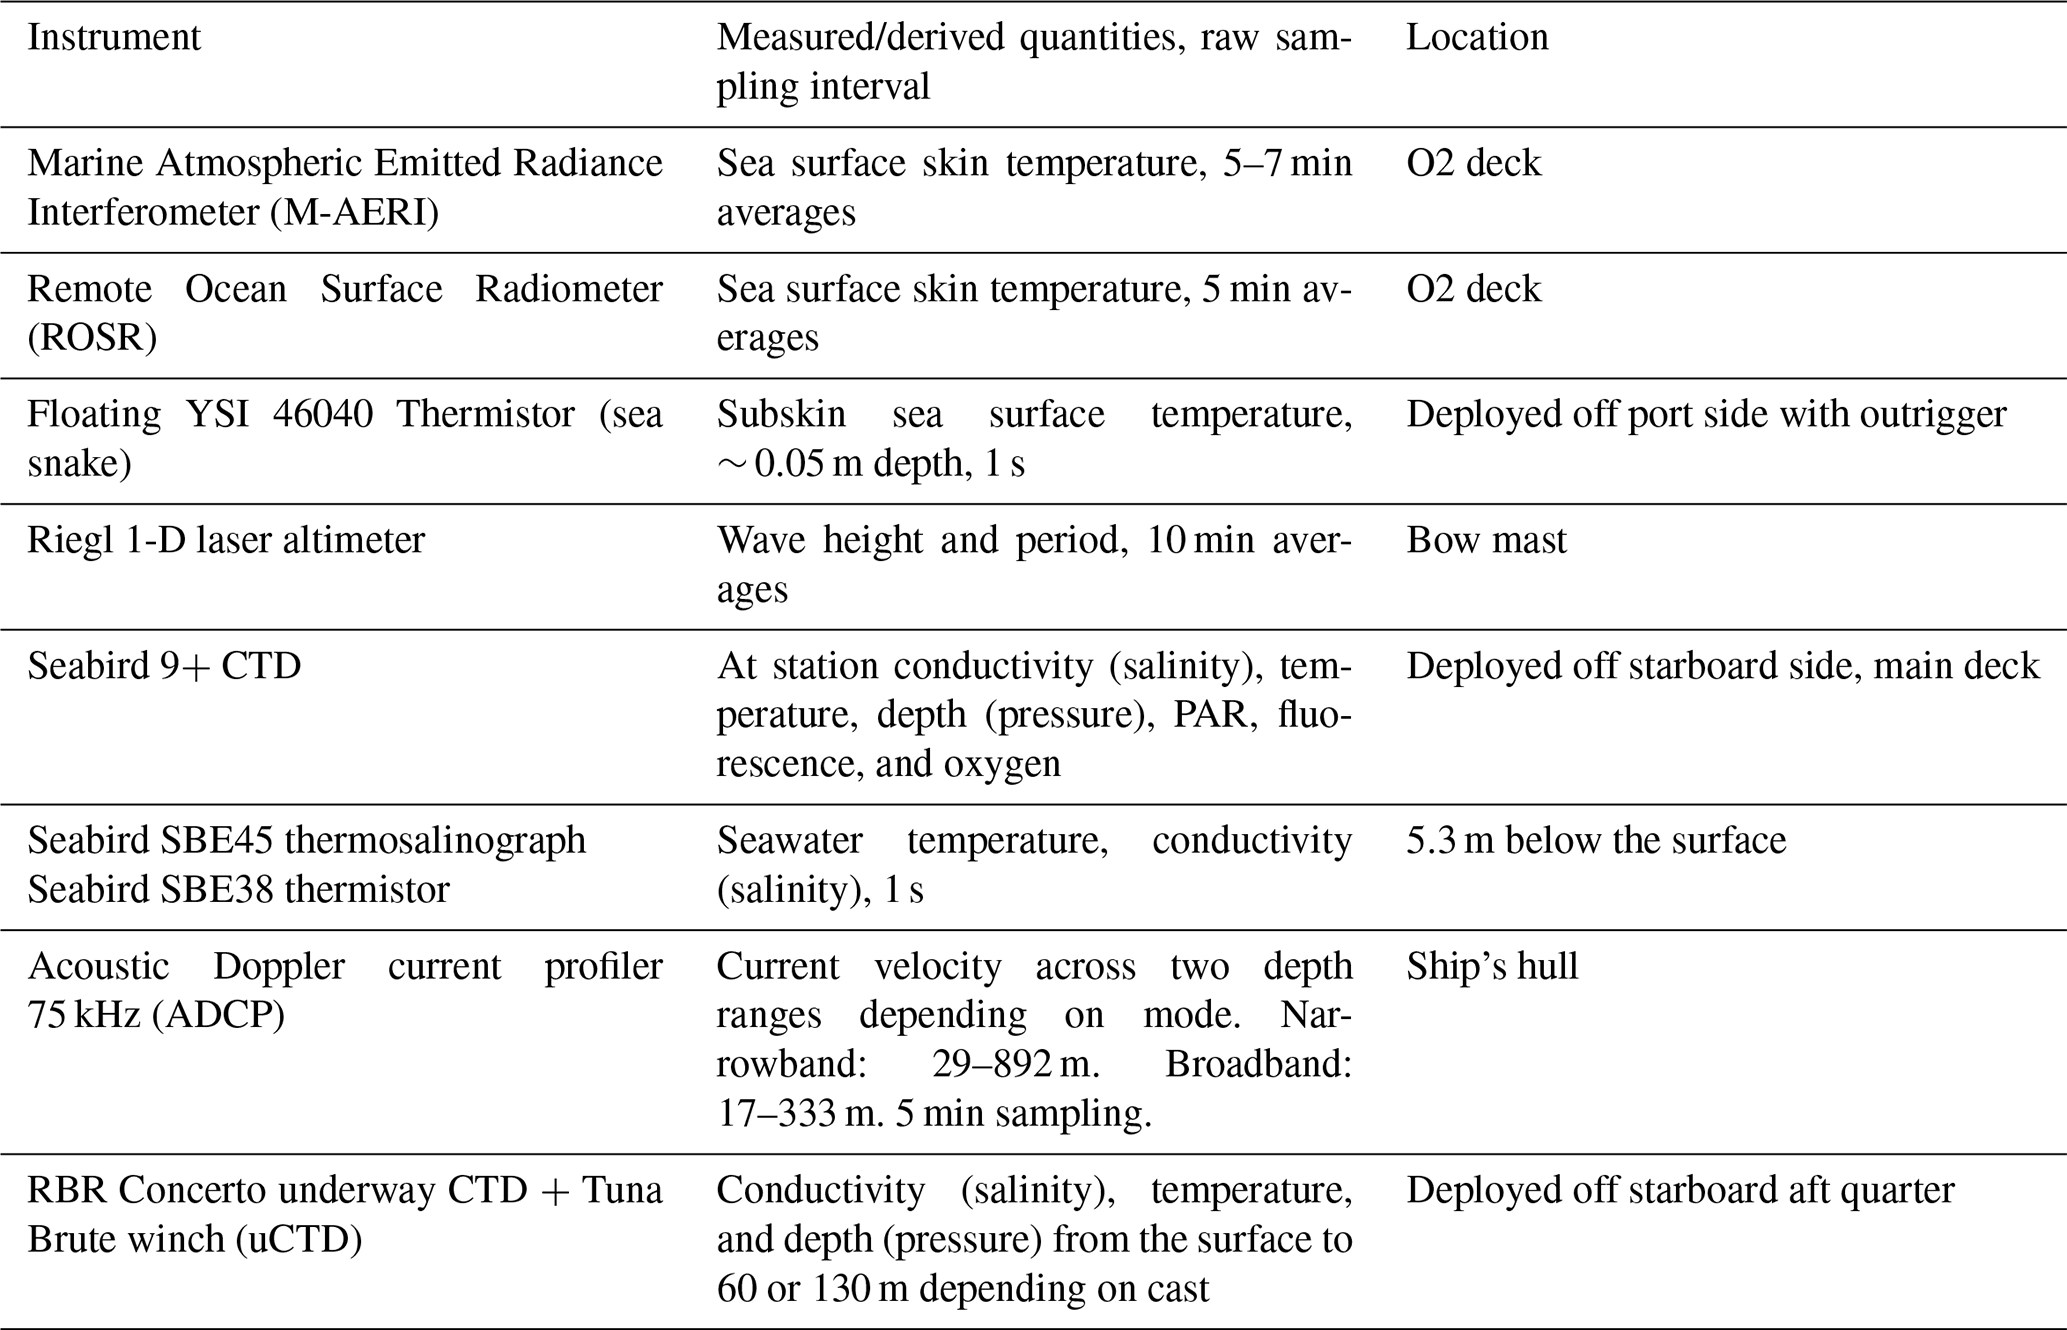
2.5 Shipboard oceanic measurements
Instrumentation on board the RV Ronald H. Brown for the measurement of oceanic parameters is listed in Table 6. Locations of instruments mounted on the deck are shown in Fig. 3. As stated above, UM's M-AERI, located on the port side forward O2 deck, measured sea surface skin temperature (Minnett et al., 2001).
During Leg 1, the Applied Physics Laboratory at the University of Washington (APL-UW) also measured sea surface skin temperature with a Remote Ocean Surface Radiometer (ROSR) located near the M-AERI. PSL measured subskin temperature at approximately 0.05 m depth with a floating thermistor (a.k.a. sea snake) deployed off the port side. A skin temperature value was estimated by the COARE algorithm using the sea snake data as input (Fairall et al., 1996, 1997). This algorithm accounts for the cool skin present in the upper ∼0.2–1 mm and any potential diurnal warm layers in the upper ∼10 m. This COARE-calculated skin T and the current-relative wind were used to compute bulk, eddy covariance, and inertial dissipation air–sea fluxes (Fairall et al., 1997, 2003). The COARE 3.6 algorithm estimated wave parameters using wind as input. The parameterization is based on fits to the Banner and Morison (2010) wave model and the flux database collected by NOAA PSL, University of Connecticut, and Woods Hole Oceanographic Institution (Fairall et al., 2003; Edson et al., 2013). PSL also measured significant wave height and period with a 1-dimensional downward-looking RIEGL laser altimeter mounted on the bow mast.
The ship's rosette-mounted CTD was intermittently deployed off the starboard main deck for comparison to the uCTD, Wave Gliders, SWIFTs, and NTAS moorings. Water was collected from the Niskin bottles for analysis of the isotopic composition of oxygen and hydrogen. In addition, the ship had an underway seawater sampling system consisting of a thermistor SBE38 located at the intake valve on the hull and a thermosalinograph SBE45 located inside the ship. These sensors produced underway measurements of temperature and conductivity (salinity) from water sampled at ∼5.3 m below the surface. The values recorded may be representative of seawater properties shallower in depth due to an unknown amount of mixing along the hull of the ship that is dependent on currents, ship speed, and waves. The ship also had a 75 kHz acoustic Doppler current profiler (ADCP) for the measurement of currents at depths greater than ∼17 m.
UW deployed an underway CTD (uCTD) for the measurement of conductivity (salinity), temperature, and pressure (depth) to assess variability in the upper 60 to 130 m of the water column (Mojica and Gaube, 2021). The uCTD was deployed off the starboard aft quarter. Initially, the probe was lowered by hand with line pre-measured to 50 m. Casts were completed more frequently and with an electric winch after the NTAS mooring work was done which freed up deck space. During Leg 2, a cast with the ship's CTD was conducted every day at 13:00 (31 January, 1 and 2 February) or 17:00 (3, 8, and 9 February) shortly after a uCTD cast. These casts were used to correct the uCTD conductivity data which had a small offset due to interference from the sensor guard. A transect of intensive uCTD data was collected when the ship transited from NTAS (S1) to S2 on 18 January. While at S2, uCTD casts were conducted every 1 to 4 h. In addition, uCTD casts were conducted every 2 h during the majority of Leg 2 when the ship was stationary. The frequency of uCTD sampling increased to every 10 min between 13:00 and 15:15 on 9 February to study heaving of periodic internal waves located at the base of the mixed layer (60–80 m depth) and for 7 h at the end of Leg 2 on 11 and 12 February as the ship transited across a strong SST front in the upwind direction. uCTD casts were also performed when deploying or recovering the SWIFTs and Wave Gliders for comparison purposes.
2.6 Wave Glider measurements
Two Wave Gliders (serial numbers 245 and 247) operated by APL-UW were deployed within 15 min of each other on 9 January (Fig. 1a and Table 2). The Wave Gliders greatly increased the sampling of spatial inhomogeneities in atmospheric and oceanic properties as well as bulk air–sea fluxes in the study area (Thomson and Girton, 2017; Thomson et al., 2018). The deployment occurred in transit to NTAS approximately 45 nmi to the southwest of the buoy with the intent of leaving the Wave Gliders in the water throughout the length of the cruise. They were remotely piloted from shore via an online portal to cross gradients in SST and ocean currents. Data were available in near real time, which helped guide their course. The Wave Gliders were equipped with surface meteorological sensors (bulk winds, air temperature, relative humidity, pressure, and longwave and shortwave radiation), sky cameras, wave motion sensors, downward-looking ADCPs for currents, and CTDs at 1 and 8 m depth for conductivity (salinity) and temperature measurements at 1 and 8 m depth. Measurements were collected during 20 min bursts every 30 min. Final data products are 60 min averages of high-resolution raw data within each hour, time-stamped at the beginning of the hour. Instrumentation on board the Wave Gliders is listed in Table 7.
Table 7Instrumentation on board the Wave Gliders for the measurement of atmospheric and seawater parameters. Data were collected during bursts lasting 20 min at the top of each hour. Measurements were collected during 20 min bursts every 30 min. Final data products are 60 min averages of high-resolution raw data within each hour and time-stamped at the beginning of the hour.
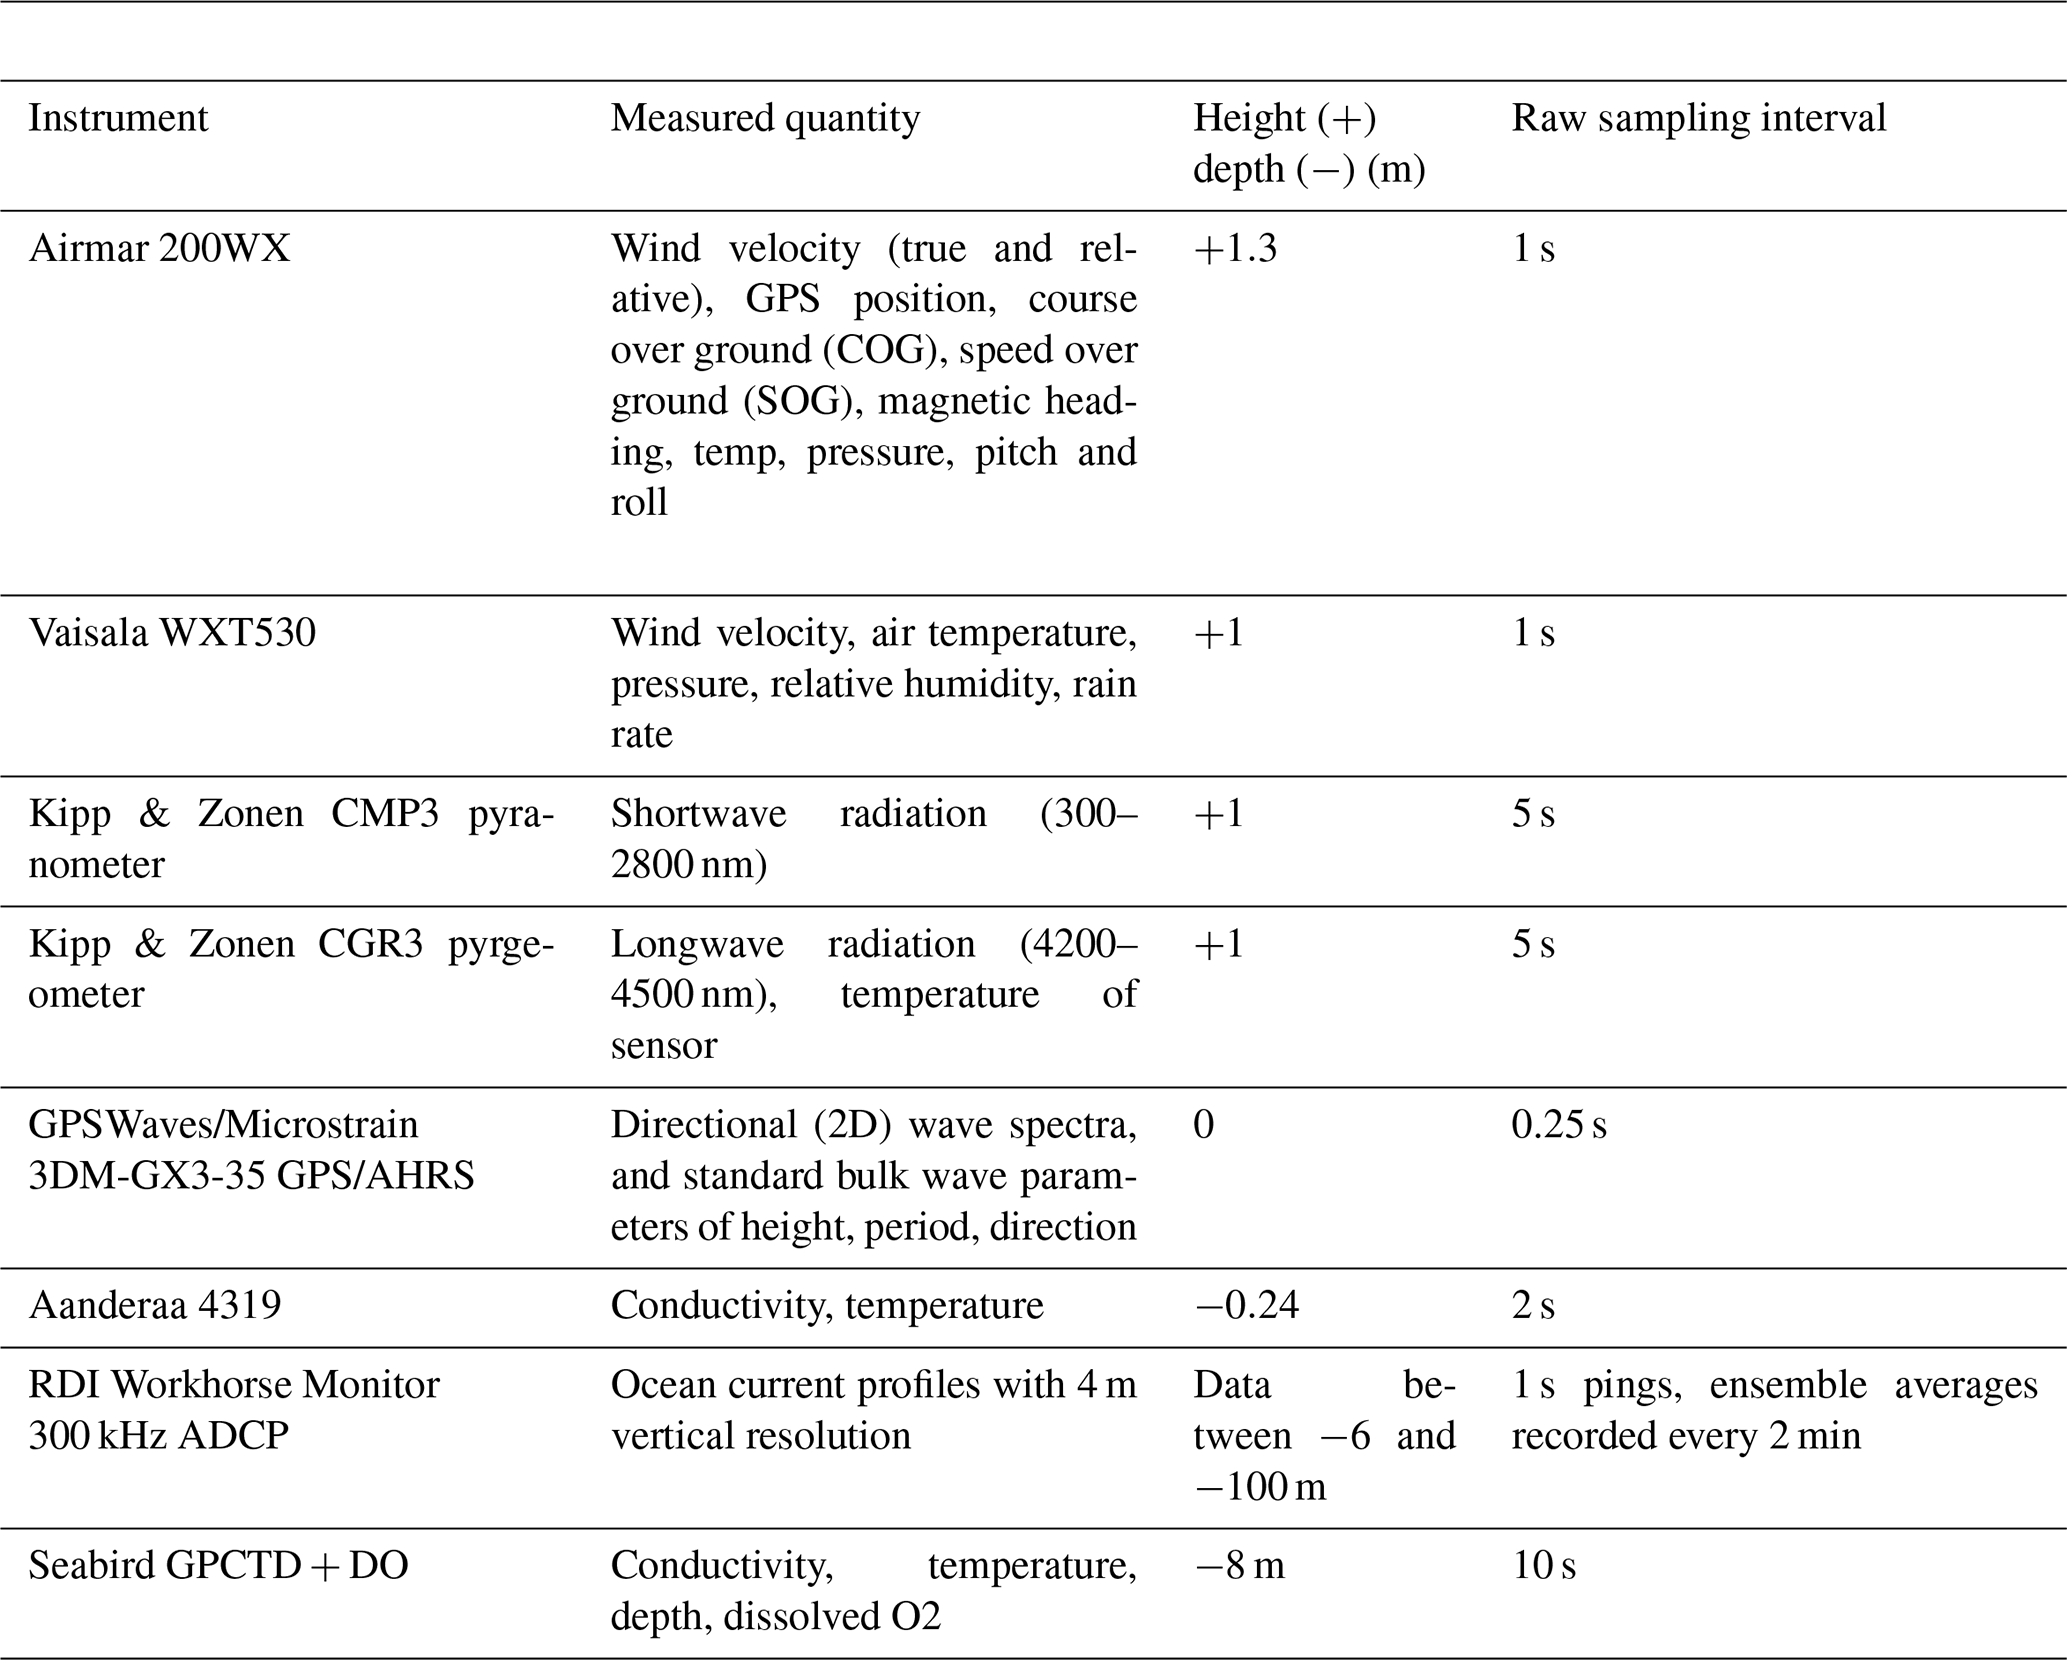
Wave Glider 245 was recovered, repaired, and redeployed on 30 January. Telemetered data suggested that the humidity sensor had malfunctioned. When recovered, it was found that the radiometers and their entire mounting pole were gone, water was inside the data logger housing, the Airmar meteorological sensor and light were broken, and the Vaisala meteorological sensor was destroyed. The radiation measurements lasted approximately 1 week into the deployment. The Wave Glider was redeployed with spare Vaisala and Airmar meteorological sensors but no radiometer. Wave Glider 245 was recovered for the final time on 7 February because it was experiencing navigation problems that could have endangered the vehicle. Wave Glider 247 sampled from 9 January to 11 February. On 31 January, Wave Glider 247 was inspected with the ship at close range after finding Wave Glider 245 damaged the day before. The meteorological sensors were found to be in good condition, but the radiometers had detached and were being dragged by wires on the port side of vehicle. A small boat was deployed to clip the radiometer wires and take the instruments back to the ship.
Table 8Instrumentation on board the v4 SWIFTs (serial numbers 22, 23, 24, 25) for the measurement of atmospheric and seawater parameters. Measurements were collected during 8 min bursts at the beginning of each hour. Final data products are 8 min averages of high-resolution raw data, time-stamped at the beginning of each hour.
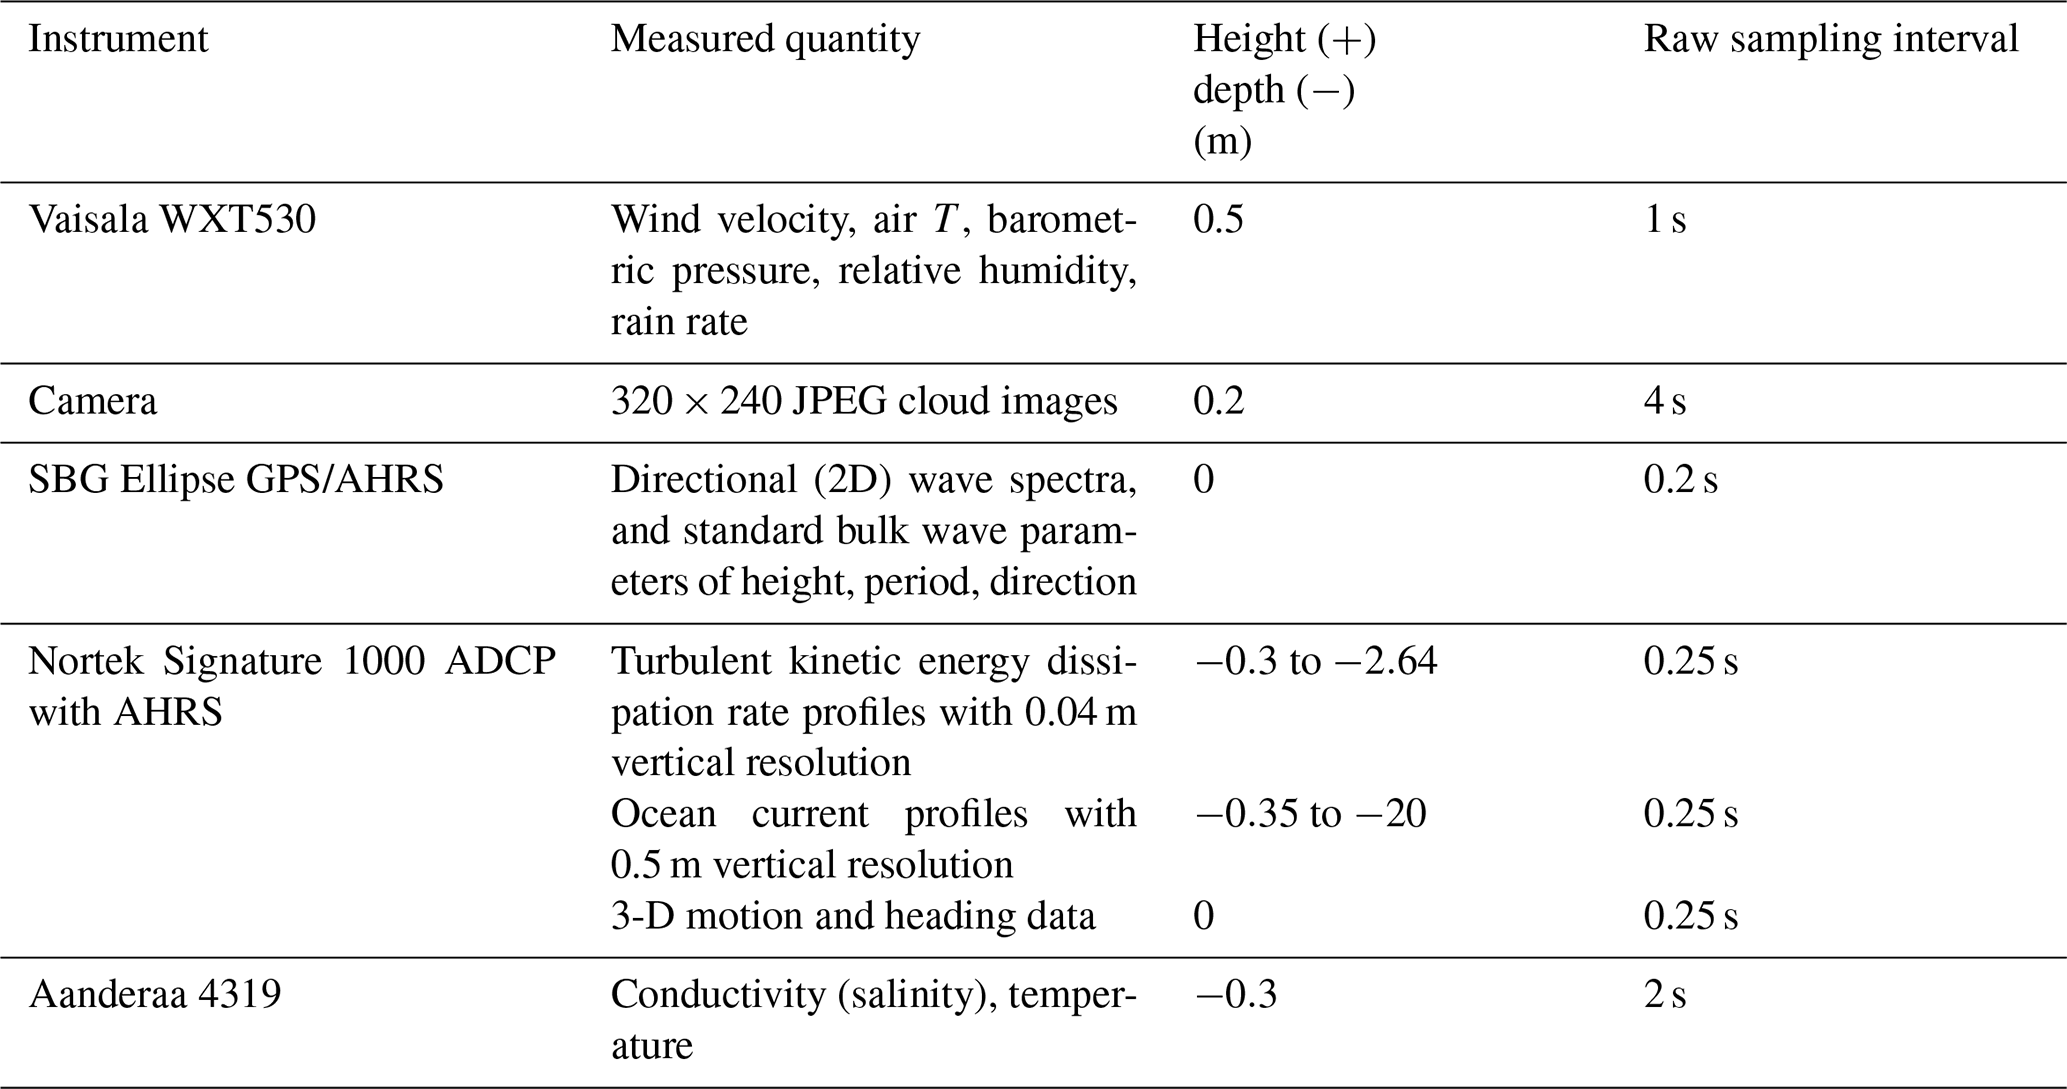
Table 9Instrumentation on board the v3 SWIFTs (serial numbers 16 and 17) for the measurement of atmospheric and seawater parameters. Measurements were collected during 8 min bursts at the beginning of each hour. Final data products are 8 min averages of high-resolution raw data and time-stamped at the beginning of the hour.
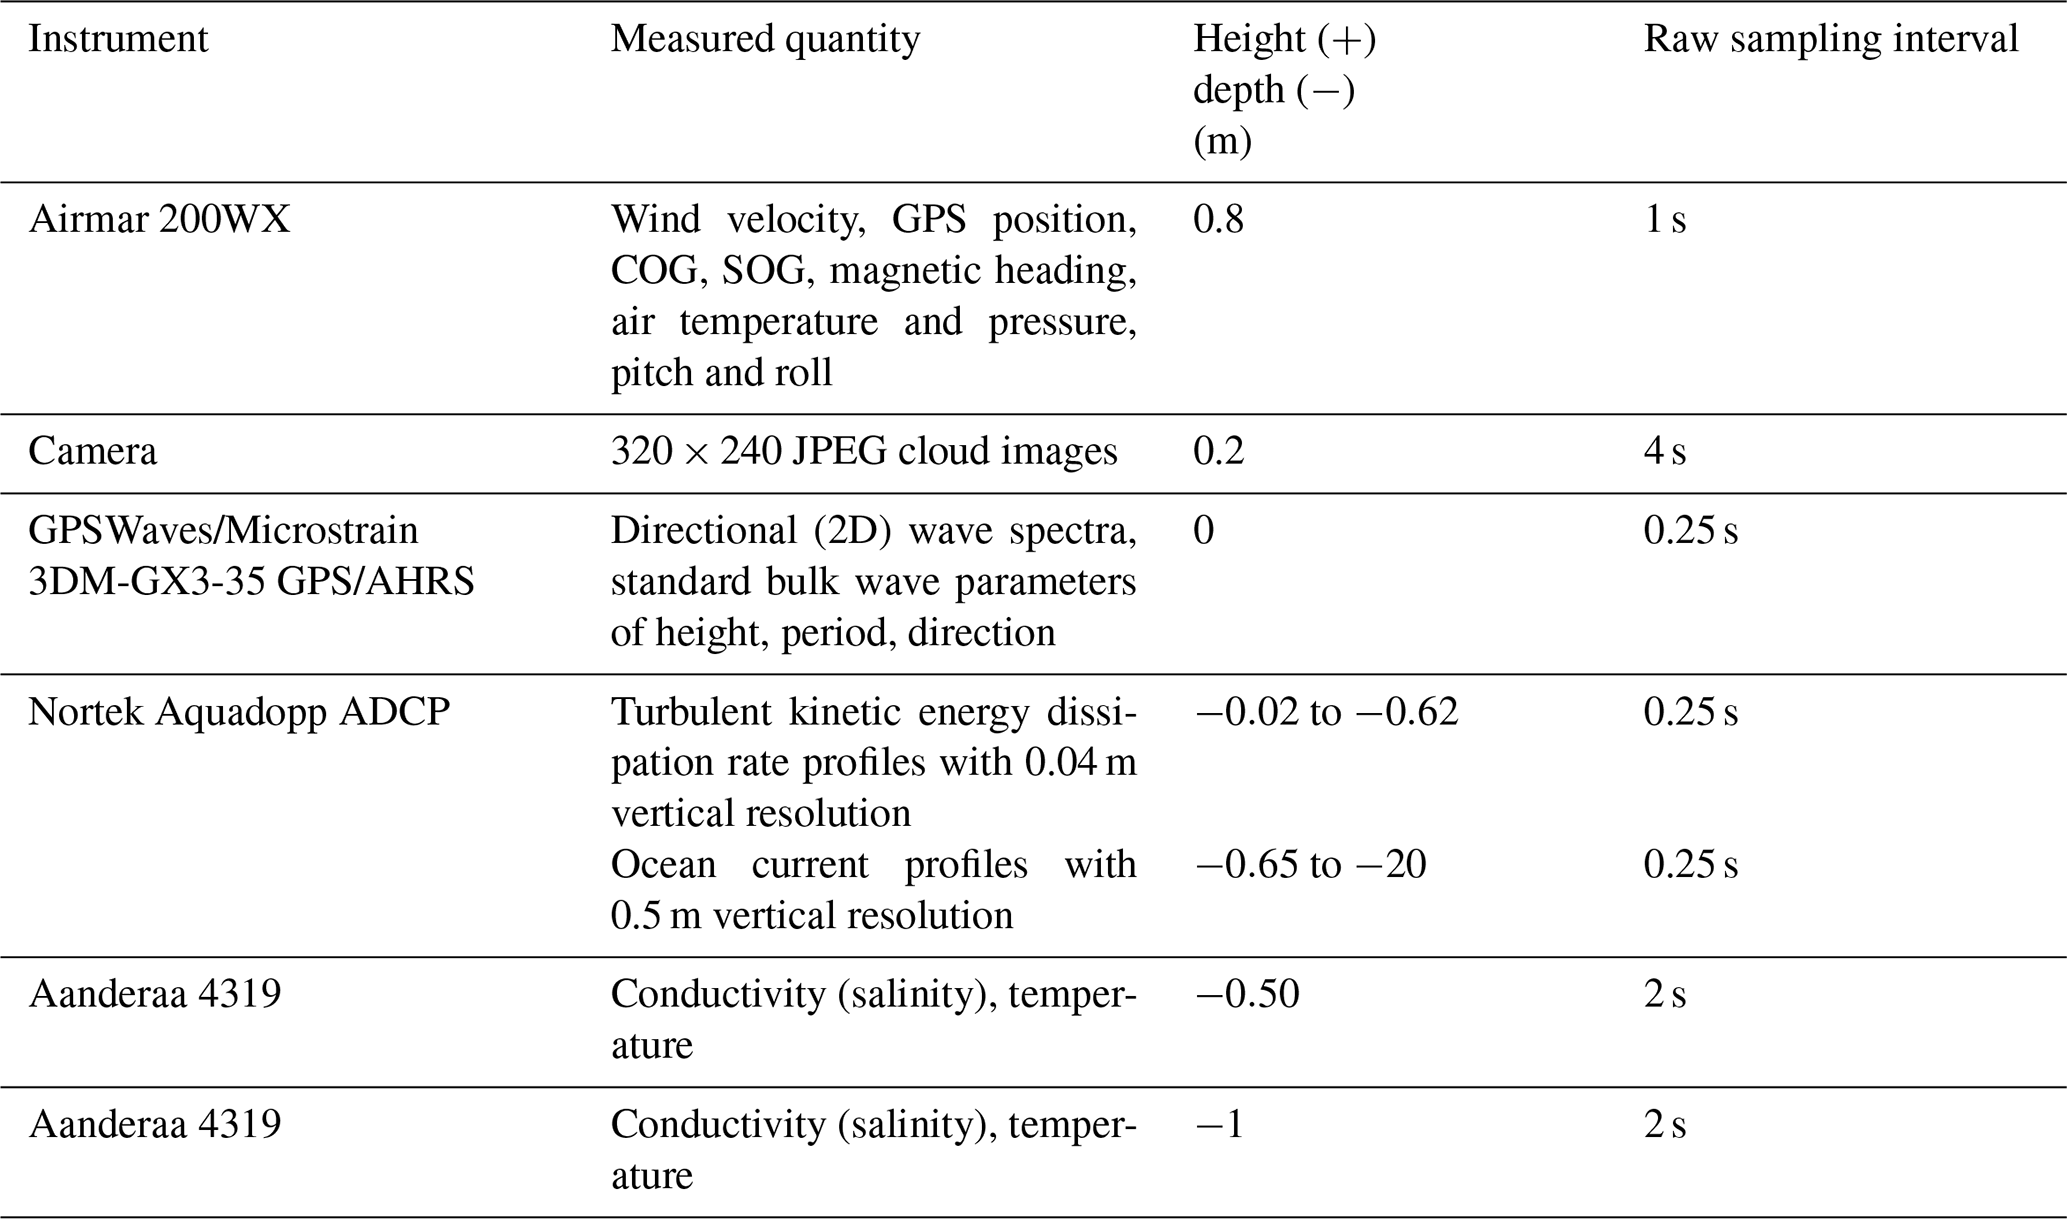
2.7 SWIFT measurements
Drifting with ocean currents and winds, the SWIFTs (Surface Wave Instrument Floats with Tracking) offered a Lagrangian view of the near-surface ocean and atmospheric properties, ocean waves and currents, bulk air–sea fluxes, and cloud features (Thomson, 2012; Thomson et al., 2019). Instrumentation on board SWIFTs v4 and v3 is listed in Tables 8 and 9, respectively. Six SWIFT drifters were deployed in two SE–NW lines across gradients in SST and ocean surface currents – once during Leg 1 and once during Leg 2. These gradients were identified with satellite MUR v4 SST daily plots and the ship's underway thermistor, thermosalinograph, and ADCP. Two v3 (serial number 16 and 17) and four v4 (serial number 22, 23, 24, and 25) SWIFTs were deployed. All had bulk meteorological sensors (winds, air temperature and pressure on all models, plus relative humidity on the v4 models), sky cameras, and CTD sensors at 0.3 m depth for measuring temperature and conductivity (salinity). The v3 models also had conductivity and temperature sensors at 1.1 m depth. The v3 SWIFTs measured ocean turbulence in the upper 0.62 m. The v4 SWIFTs measured ocean turbulence in the upper 2.64 m. Both versions had ADCPs that measured vertical profiles of currents down to 20 m. The SWIFTs sampled high-resolution bursts of data for 8 min at the top of each hour. These data were archived on board the vehicle for final processing once recovered. The 8 min data segments and platform location were also averaged and reported via Iridium satellite telemetry each hour for monitoring purposes. SWIFT locations were also tracked in real time using the AIS ship traffic system (local VHF radio signals). The SWIFTs were deployed for 8 d during Leg 1 (14 to 22 January) and 13 d during Leg 2 (30 January to 11 February).
Table 10Instrumentation on board the NOAA-sponsored Saildrones; 1 min averages (5 min average for ADCP current) were telemetered in real time except where noted below. Final data products are 1 min averages of high-resolution raw data.
2.8 Saildrone measurements
NOAA sponsored two Saildrones for the ATOMIC campaign to obtain high-quality multiscale air–sea fluxes (Zhang et al., 2019) in two different regimes. Both were launched from Bridgetown, Barbados, on 12 January 2020. Saildrone SD1063 focused on the large ocean eddies southeast of BCO, where the North Brazil Current Rings propagate northwestward toward Barbados. Saildrone 1064 sampled in trade wind alley along the leg between BCO and NTAS. In addition, Saildrone 1064 coordinated sampling with the RV Ronald H. Brown, remote sensing from research aircraft, NTAS, Wave Gliders, and SWIFTs. Saildrones 1063 and 1064 were equipped to measure near-surface ocean temperature and salinity, upper-ocean current profiles (6–100 m), surface air temperature, humidity, pressure, wind direction and speed, wave height and period, short- and longwave radiation, and cloud images (Table 10). This system enabled calculation of the bulk latent heat flux and direct turbulent fluxes of momentum and sensible heat. Six thermistors were strapped on the keel to measure the surface layer stratification. Onboard data processing included averaging and motion correction; 1 min averages (5 min average for ADCP current) were telemetered in real time, while high-resolution data were downloaded after the Saildrones returned to United States. During the 1-month ATOMIC intensive observation period of 12 January to 12 February, Saildrone 1064 continuously measured air–sea interaction processes between BCO and NTAS and sailed 1777 nmi. After ATOMIC, the Saildrones continued their observations until 16 July and then sailed back to the United States, arriving in Newport, RI, on 30 August 2020.
Three additional Saildrones were piloted by a NASA-funded effort. These data and their details are posted at https://podaac.jpl.nasa.gov/dataset/SAILDRONE_ATOMIC (last access: 30 July 2020), https://doi.org/10.5067/SDRON-ATOM0.
2.9 RAAVEN UAS measurements
The University of Colorado operated a small remotely piloted aircraft system (RAAVEN) from Morgan Lewis Beach on the northeastern shore of Barbados between 24 January and 16 February. The miniFlux payload flew on board the RAAVEN UAS (de Boer et al., 2021b). Flights conducted during this campaign targeted the thermodynamic and kinematic structure of the lower atmosphere, with sampling occurring between the surface and 1 km altitude. The vast majority of the flights were focused on the sub-cloud layer, with extended sampling conducted at cloud base and a sequence of set altitudes within the sub-cloud layer. Included in these flights were regular sampling intervals at 20 m above the ocean surface to collect information on turbulent surface fluxes of heat and momentum. Most flights were conducted in the near-coastal zone between 0 and 2 km from the coastline. MiniFlux sensors included a multihole pressure probe (MHP); fine-wire array; IR thermometers; pressure, temperature and humidity sensors similar to those used in radiosondes and dropsondes; redundant pressure, temperature, and humidity probes; and an inertial navigation system.
2.10 SVPS drifter measurements
Though not deployed from the RV Ronald H. Brown, the ATOMIC field campaign and its archive also includes a data set of nine SVPS type surface ocean drifters deployed by NOAA AOML (Surface Velocity Program Salinity, Centurioni et al., 2015; Hormann et al., 2015). These were deployed from the EUREC4A ship RV L'Atalante 50 to 150 nmi from the South American coast, between 6 and 10∘ N, the so-called Boulevard de Tourbillons (Eddy Boulevard), where North Brazil Current Rings transit northwestward (Fig. 1b). The purpose of these drifters was to measure air–sea interaction, ocean properties, and atmospheric variability amidst ocean eddies and low-salinity plumes from a Lagrangian perspective. During ATOMIC the SVPS drifters measured air pressure and relative wind at 0.5 m height. They also measured ocean salinity and temperature (0.3, 5, 10 m depth, with a duplicate T sensor at 0.3 m) and ocean velocity representative of water located between 11–19 m depth and centered at 15 m. The drifter was equipped with a drogue centered at 15 m in the form of a long vertically oriented holey sock. The drogue's full extent spanned a depth of 11.34 to 18.66 m. Therefore, currents calculated from the drifter location are representative of currents between these depths. Bulk wind stress and the bulk drag coefficient were estimated from these data using COARE 3.6. Data records began at different times and locations to sample different ocean features. Four drifters started on 23 January, one drifter on 26 January, four drifters on 2 February, and one drifter on 4 February. The drifters exited the ATOMIC/EUREC4A region on about 29 April, which marks the end of this archived ATOMIC data set. After this date, data were still being reported from some sensors and can be accessed by contacting the PI (Table 11). The drifter sensors sampled every 90 s and then computed averages over 30 min. The averaged data were transmitted to land via satellite telemetry. The position and time data were instantaneous every 30 min. Ten total drifters were deployed, but GPS did not work on one so that data set is not posted.
2.11 BACO aerosol measurements
Size-resolved cloud condensation nuclei (CCN) number concentrations were measured with a custom-made differential mobility analyzer (DMA) for size selection connected to a Droplet Measurement Technologies (DMT) CCNC-100 and a GRIMM 5.412 CPC. Aerosol number size distributions were made with a Scanning Mobility Particle Sizer (SMPS) (GRIMM 5.420) with a diameter range of 0.10 to 1.094 µm. Measurements were made from an isokinetic aerosol inlet located at roughly 47 m a.s.l.
2.12 BCO measurements
BCO is at a height of 25 m a.s.l. Meteorological sensors (Vaisala WXT-520) were mounted at 4 m a.g.l. BCO launched 182 radiosondes. Data from the sondes were merged into the EUREC4A sounding network (Stephan et al., 2021). A Lufft ceilometer CHN 15k NIMBUS was used for the determination of cloud base height.
During ATOMIC, the RV Ronald H. Brown primarily operated in trade wind alley, north of 12.5∘ N between ∼56∘ W and NTAS (Fig. 1a). During the boreal winter, near-surface winds from the northeast carry air masses from NTAS to BCO in about 1.5 d. Positioning the RV Ronald H. Brown in trade wind alley allowed for sampling of atmosphere and ocean conditions from the surface in between NTAS and BCO. Winds were fairly steady throughout the cruise with an average speed (10 m) of 8.3±2.1 m s−1 and direction of 70±21∘ (Fig. 4a). Air temperature (10 m) ranged between 22.7 and 27.9 ∘C and averaged 25.7±0.61 ∘C. RH averaged 71±4.7 % (Fig. 4b). Radiosondes launched within trade wind alley revealed dryer conditions in the lower and middle troposphere compared to observations made to the south in the Boulevard de Tourbillons, which paralleled the coast of South America (Fig. 1b). Stephan et al. (2021) attribute the difference to more frequent periods of a deep moist layer and deeper convection to the south.
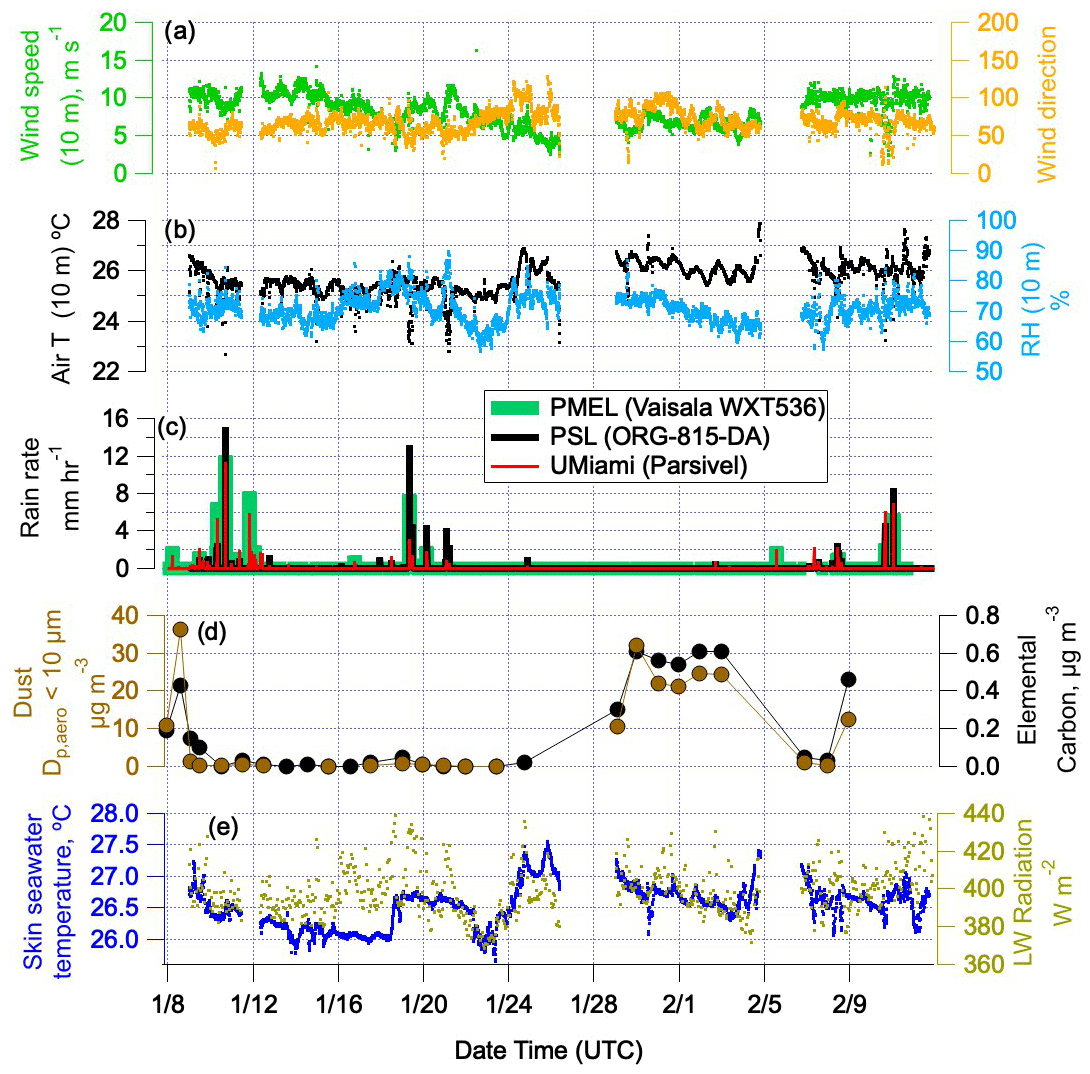
Figure 4Time series of bow mast measurements of (a) wind speed and direction, (b) air temperature and relative humidity all adjusted to 10 m height using the COARE 3.6 bulk model. Also shown are (c) rain rate measured with three different instruments, (d) dust and elemental carbon mass concentration for particles with aerodynamic diameters less than 10 µm, and (e) skin seawater temperature from the sea snake and downwelling longwave radiation.
Rain rate was measured by three instruments during the cruise located at different places on the ship. Two Parsivel disdrometers were located on the port rail on the O3 deck, an ORG-815 DA optical range gauge was located on the mast tower, and a Vaisala WXT536 was mounted on top of an aerosol sampling van on the O2 deck. Although instruments and locations were not identical, a coherent picture of rain occurrence emerges with frequent events between 9 and 12 January; 19 and 21 January; and 8, 10, and 11 February (Fig. 4c). January rain events were associated with a stationary front extending along 20∘ N from the east into Barbados. February events occurred as an Atlantic ridge progressed eastward inducing strong winds and scattered showers.
One unique feature of the atmospheric conditions during ATOMIC was the occurrence of high concentrations of dust in the boreal winter. Dust concentrations have long been documented to increase each summer in the Caribbean due to transport from Africa (Prospero and Mayol-Bracero, 2013). A layer of warm, dry air above the marine boundary, known as the Saharan Air Layer (SAL), extends from Africa to North America during the summer, which leads to relatively long aerosol residence times and efficient transport of dust between the two continents (Petit et al., 2005; Carlson and Prospero, 1972). Factors contributing to dust transport to the Caribbean during the winter are not as well understood but have been shown to correlate with the southward movement of the Intertropical Convergence Zone (ITCZ), which affects near-surface northeasterly winds over North Africa (Doherty et al., 2012). As a result, the SAL occurs at lower altitudes and more southern latitudes in the winter (Tsamalis et al., 2013; Liu et al., 2012).
Filter measurements of particulate Al, Si, Ca, Fe, and Ti on board the RV Ronald H. Brown were used to derive dust concentrations (Malm et al., 1994). As shown in Fig. 4d, elevated dust concentrations were observed at the beginning of Leg 1 (8 January, 00:00 to 9 January, 12:00) and two more times during Leg 2 (29 January, 12:00 to 3 February, 19:00 and 9 February, 00:00 to 11 February, 12:00). Dust concentrations were still elevated when aerosol sampling was halted on 3 and 11 February. Elemental carbon (EC) concentrations were enhanced during these same periods, indicating transport of biomass burning along with the dust. The NASA Fire Information for Resource Management System (FIRMS) satellite product indicated a wide swath of fires over North Africa during January and February of 2020 (https://earthdata.nasa.gov/earth-observation-data/near-real-time/firms, last access: 20 October 2020).
The ATOMIC study area was characterized by warmer skin seawater temperatures nearer to Barbados (west of ∼55∘ W) due, in part, to the North Brazil Current (NBC) that transports South Atlantic warm water along the coast of Brazil and into the Northern Hemisphere, separating from the coast around 6 to 8∘ N. Occasionally the NBC curves back on itself and pinches off warm eddies that move further north and into the Caribbean Sea (Fratantoni and Glickson, 2002). The coolest skin seawater temperatures were encountered in the vicinity of the NTAS and MOVE operations on the most northeastern portion of the cruise track between 12 and 16 January (Figs. 1a and 4e). A second period of low skin seawater temperatures coincided with sustained relatively low longwave downwelling radiation on 22 and 23 January (Fig. 4e), although causes of the low temperatures have yet to be determined.
Times when the RV Ronald H. Brown was in close proximity to or upwind of other sampling platforms are listed in Table 3. These periods provide the potential for inter-platform comparisons for data quality checks or scientific purposes. Inter-platform comparisons reported here include (1) NTAS moorings and the ship (seawater and atmospheric parameters), (2) Saildrone 1064 and the ship (seawater and atmospheric parameters), (3) BCO and the ship (atmospheric parameters), (4) BACO and the ship (aerosol properties), and (5) BCO, the ship, and RAAVEN UAS (cloud base height). These comparisons were done to evaluate consistencies in the measurements. Resolving identified inconsistencies will be the subject of future research.
4.1 Comparison of seawater parameters
4.1.1 Onboard RHB
No significant offsets or biases were found among the independently calibrated subsurface temperature measurements on board RV Ronald H. Brown. Measurements from the ship's CTD, uCTD, PSL sea snake, and ship's underway thermosalinograph and thermistor were similar. After correcting for a small bias found in the uCTD salinity, no significant difference was found among the different salinity measurements recorded.
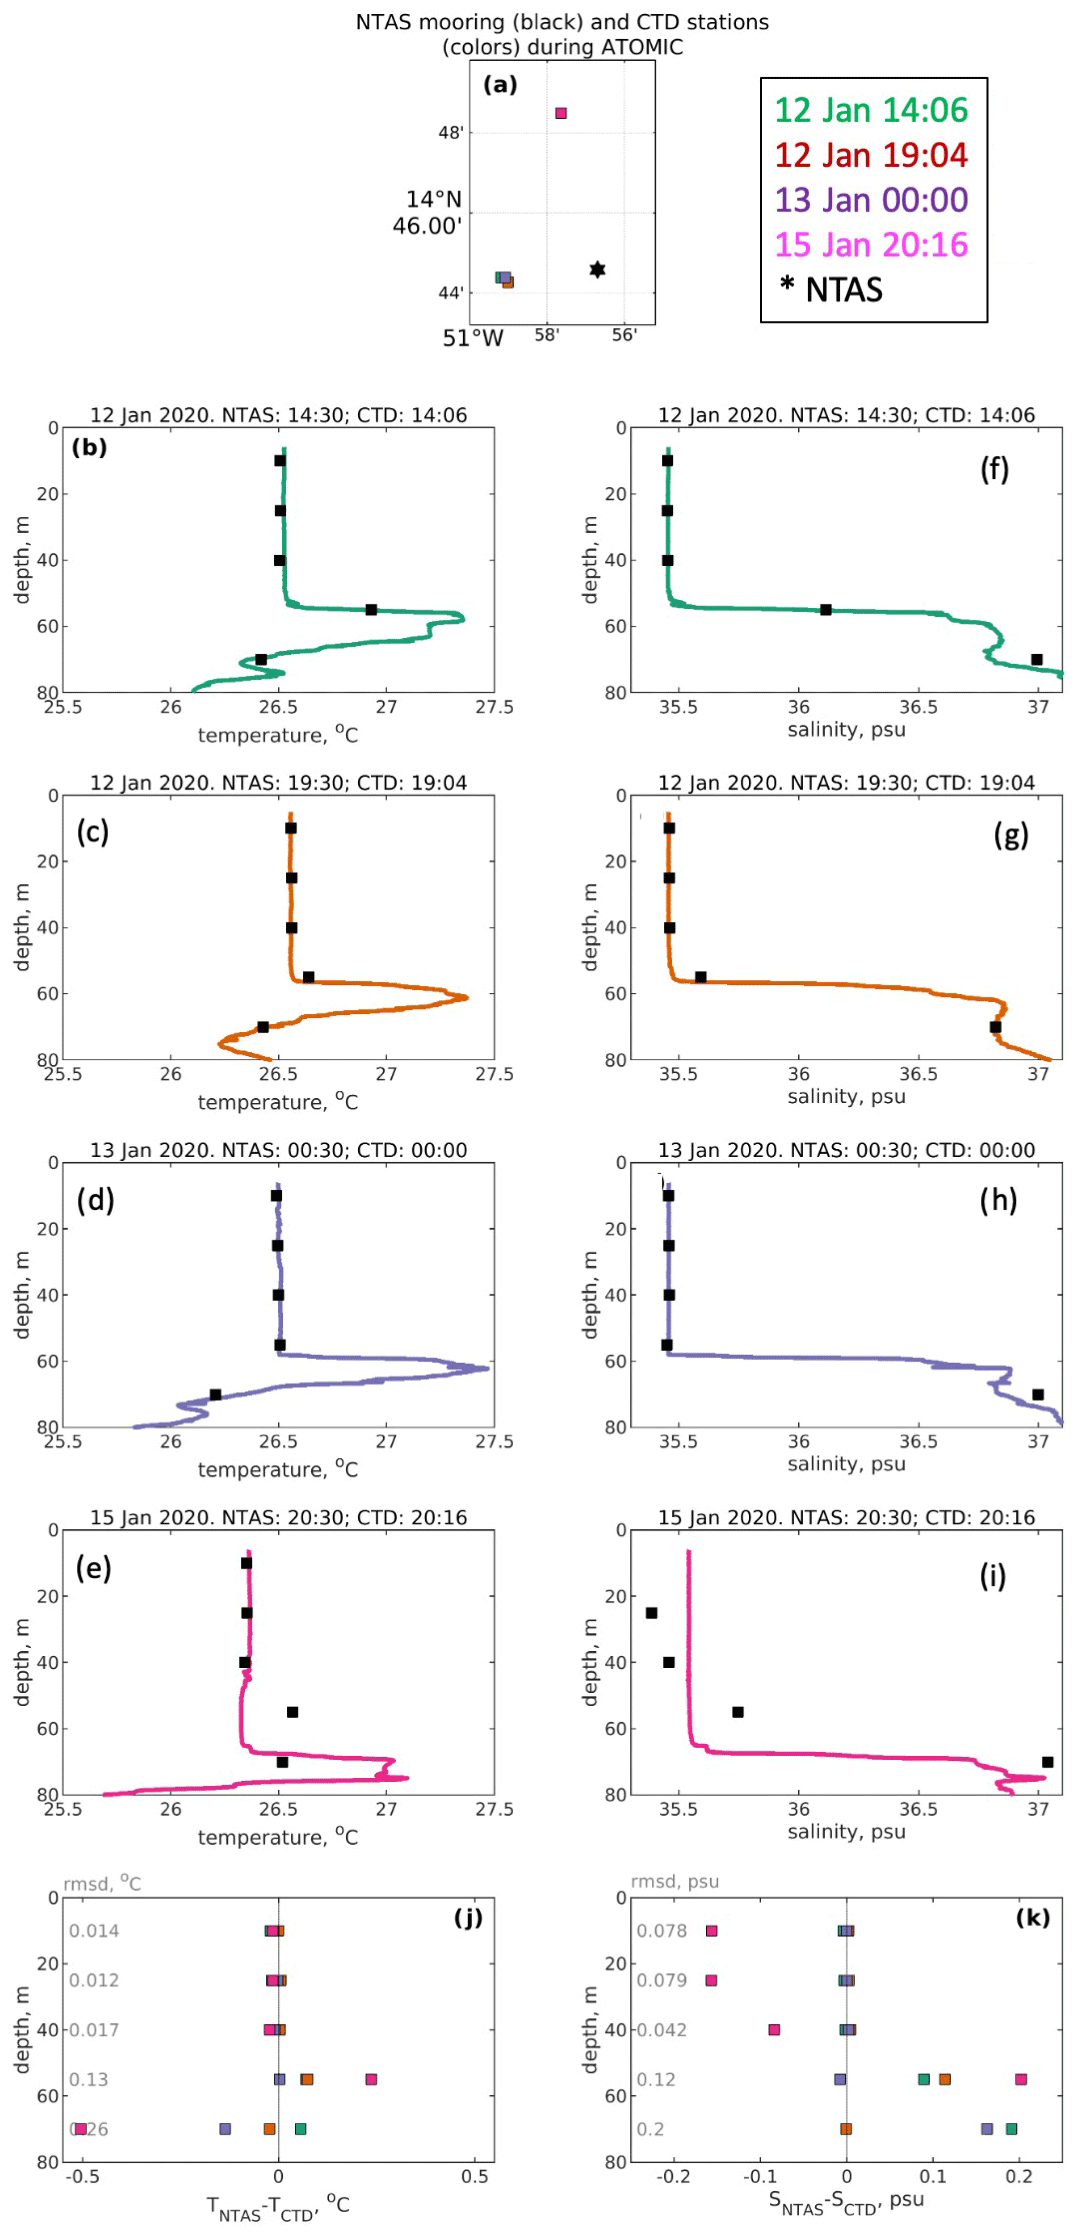
Figure 5Comparison of upper ocean measured parameters from the NTAS-18 mooring and the RV Ronald H. Brown on 12, 13, and 15 January with (a) location of NTAS-18 mooring anchor. The NTAS buoys were about 2 nmi downwind (SW) of the anchor, so the CTD and mooring measurements were within 0.5 to 3 nmi of each other. Also shown are (b–e) temperature, (f–i) salinity, and (j–k) absolute differences and root mean square differences (RMSDs) for temperature and salinity, respectively. Number of samples =4.
4.1.2 NTAS − RHB
Four CTD casts with the ship's rosette were conducted to compare to the NTAS moorings' upper ocean measurements between 12 and 15 January. The ship was 3 nmi southwest of the NTAS-18 mooring anchor on 12 and 13 January and 3.8 nmi northwest of the NTAS-17 mooring anchor on 15 January (Table 3 and Fig. 5a). With an anchor radius watch circle of ∼2 nmi for each buoy, the ship and buoys were within 0.25 to 3 nmi of each other. NTAS measurements of temperature and salinity at five depths (10, 25, 40, 55, and 70 m) are overlaid onto data from the ship's CTD in Fig. 5. Absolute differences (NTAS − RHB) in temperature are less than 0.1 ∘C for all depths of the three casts conducted on 12 and 13 January except for the last cast during that period (Fig. 5j). For the most part, the salinity comparisons show good agreement for the 12 and 13 January casts with absolute differences at depths between 10 and 40 m being less than 0.03 (Fig. 5k). Exceptions occurred at lower depths due to strong vertical gradients.
The comparison from January 15 shows significant differences for both temperature (Fig. 5j) and salinity (Fig. 5k) likely due to horizontal gradients. Satellite-derived sea surface salinity and SST for this day indicate that NTAS and the ship were located in a frontal region with the ship in warmer and saltier surface water to the north of NTAS. The sign of the absolute differences (NTAS − RHB) in temperature and salinity varied with depth. The ship's ADCP revealed vertical structure in the currents consistent with the sign of observed absolute differences at the surface versus lower depths.
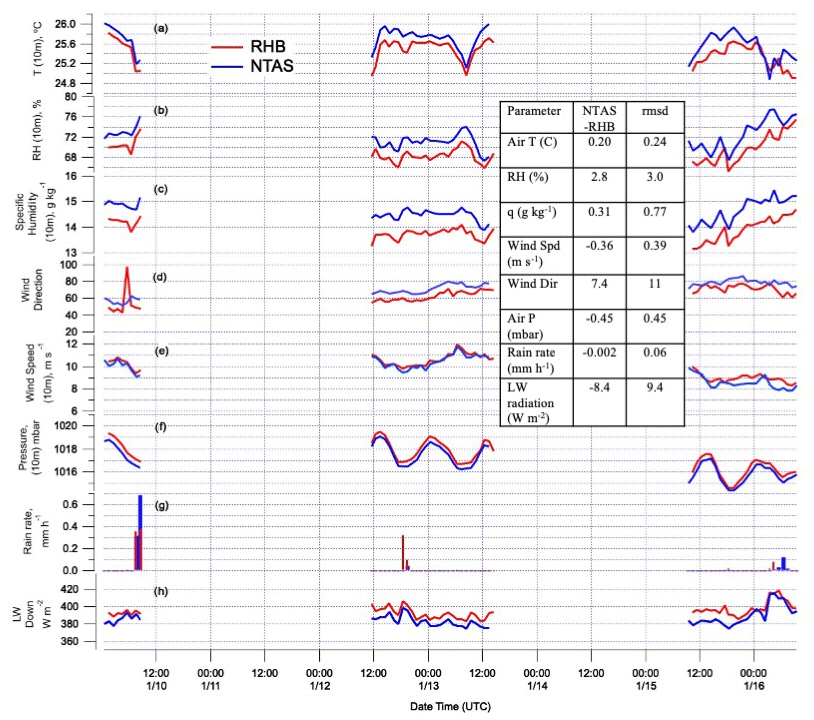
Figure 6Comparison of meteorological parameters measured on board the NTAS buoy and the RV Ronald H. Brown (RHB) when the platforms were between 0.25 and 3 nmi apart between 10 and 15 January including (a) atmospheric temperature (10 m), (b) relative humidity (10 m), (c) specific humidity (10 m), (d) wind direction, (e) wind speed (10 m), (f) atmospheric pressure (10 m), (g) rain rate, and (h) longwave downwelling radiation. The averages of absolute differences (NTAS − RHB) and root mean square differences (RMSDs) are reported in the inset table. Number of samples based on 1 h averaged data =59.
4.2 Comparison of atmospheric parameters
4.2.1 NTAS − RHB
Atmospheric parameters (temperature, relative humidity, specific humidity, wind speed, pressure, rain rate, and longwave downwelling radiation) measured on board the NTAS buoys and the RV Ronald H. Brown were compared when the platforms were within 3 nmi of each other between 10 and 15 January (Table 3). Measurements from NTAS-17 and NTAS-18 were combined into one data set for the comparison. Based on 1 h averaged data, 59 samples were available for comparison.
Wind speed, temperature, and specific humidity from both platforms were adjusted to a height of 10 m. Absolute differences (NTAS − RHB) were positive for temperature (Fig. 6a), RH (Fig. 6b), specific humidity (Fig. 6c), and wind direction (Fig. 6d). These differences, however, were within either reported accuracies of the instrumentation or within the range reported for a previous 24 h RV Ronald H. Brown – Stratus 4 buoy comparison (Colbo and Weller, 2009). Absolute differences (NTAS − RHB) were negative for wind speed, pressure, rain rate, and longwave downwelling radiation, although all differences were within accuracies of the instrumentation or within the range reported by Colbo and Weller (2009).
4.2.2 BCO − RHB
The Barbados Cloud Observatory (BCO) is located at Deebles Point on the eastern coast of Barbados. Atmospheric parameters (temperature, RH, wind direction and speed, pressure, and rain rate) were compared between BCO and the ship during the period the ship was 20 nmi east and upwind of the observatory (24 January, 18:20 to 25 January, 23:40) (Table 3). BCO meteorological sensors were located at 30 m a.s.l. and were not adjusted to a height of 10 m due to uncertainties in adjusting overland measurements (BC0) with surface fluxes from the RV Ronald H. Brown. Based on 10 min averaged data, 177 samples were available for comparison.
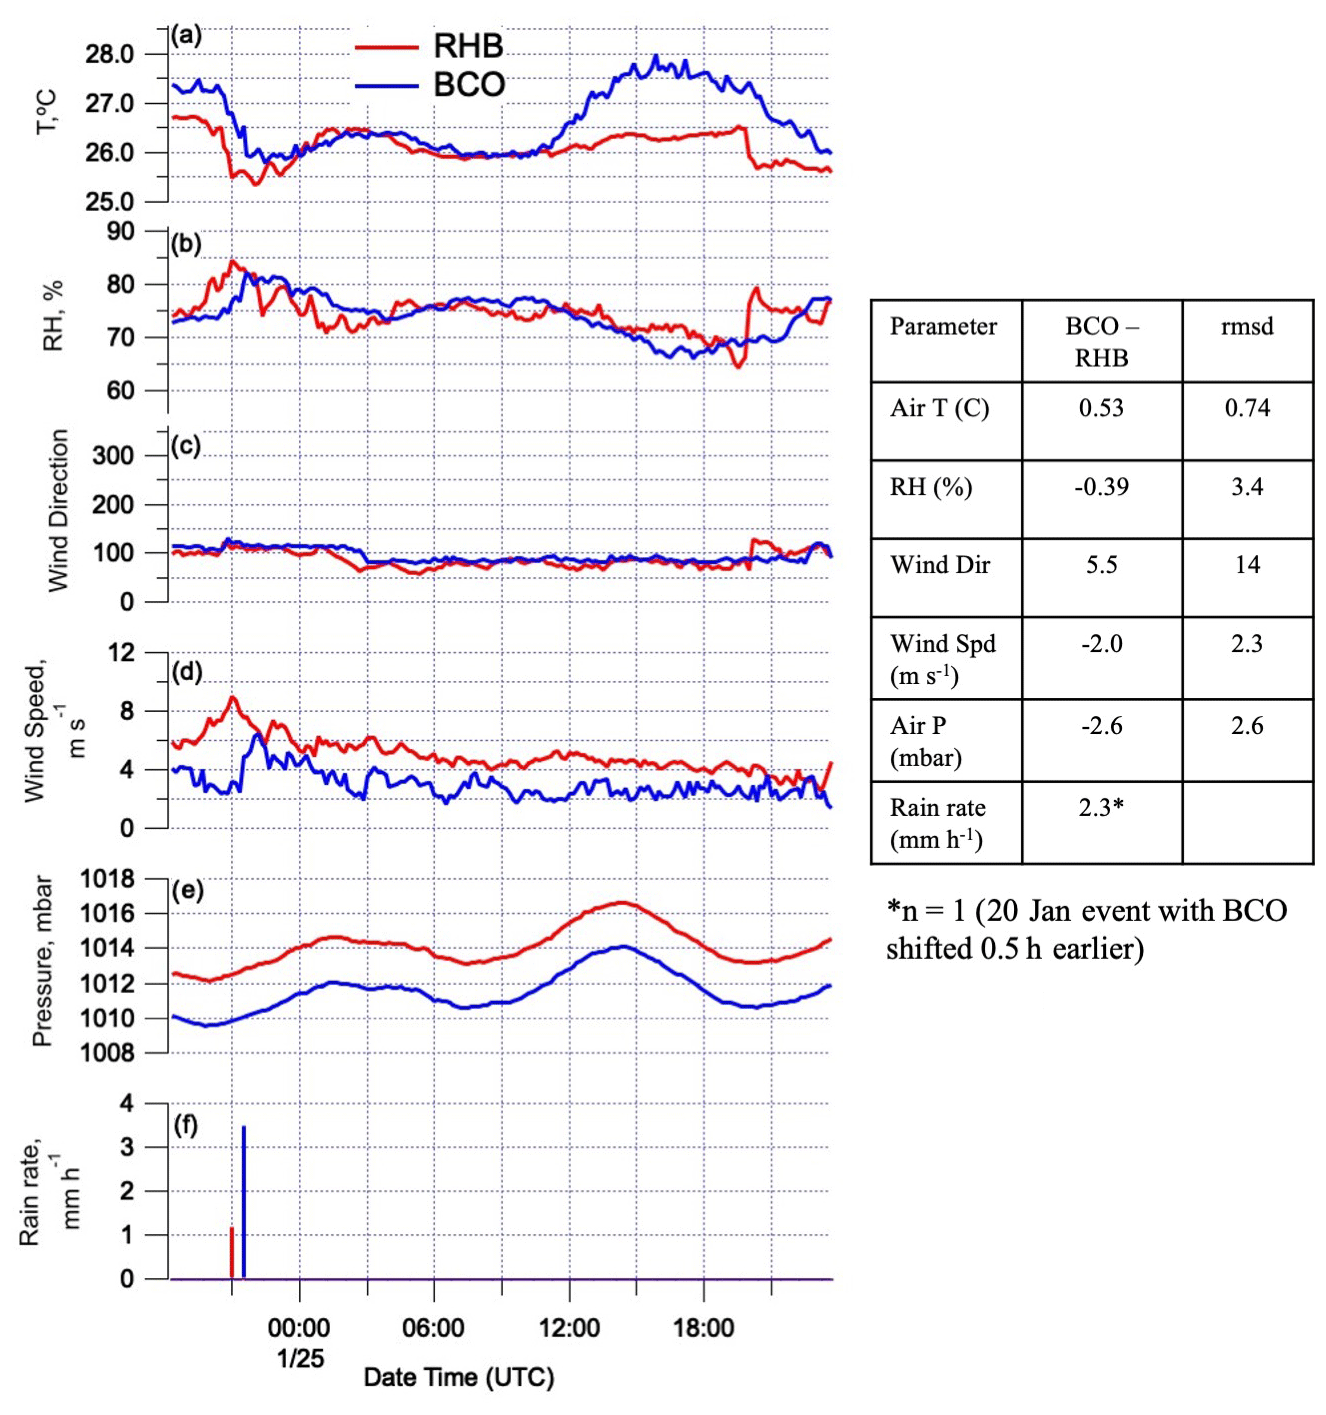
Figure 7Meteorological parameters measured during the RV Ronald H. Brown (RHB) and the Barbados Cloud Observatory (BCO) comparison (24 January, 18:20 to 25 January, 23:40) when RHB was 20 nmi due east of BCO. Parameters include (a) atmospheric temperature, (b) relative humidity (RH), wind direction, wind speed, atmospheric pressure, and rain rate. The average of the absolute differences (BCO − RHB) and root mean square differences (RMSDs) are reported in the inset table. BCO meteorological sensors were located at 30 m a.s.l. and were not adjusted to a height of 10 m. Number of samples based on 10 min averaged data =177.
The average of the absolute difference (BCO − RHB) in temperature over the entire period was larger than instrumental accuracies (Fig. 7a). The largest difference was observed after 12:00 UTC (08:00 local), indicating relatively more warming of the sensor and/or atmosphere at BCO due to diurnal heating of the land surface. Even with differences in temperature, RH values from the two platforms agreed well with the exception of the end of the period. The ship observed an abrupt change in temperature and RH on 25 January at 19:30 (Fig. 7a, b) suggesting that the platforms were in different air masses. Wind direction agreed well between platforms (Fig. 7c), but the averages of the absolute differences (BCO − RHB) in wind speed (Fig. 7d) and pressure (Fig. 7e) were larger than instrumental uncertainties. One rain event occurred during the comparison. It was observed on 24 January on the ship and 30 min later at BCO with observed rain rates of 1.2 and 3.5 mm h−1, respectively (Fig. 7f).
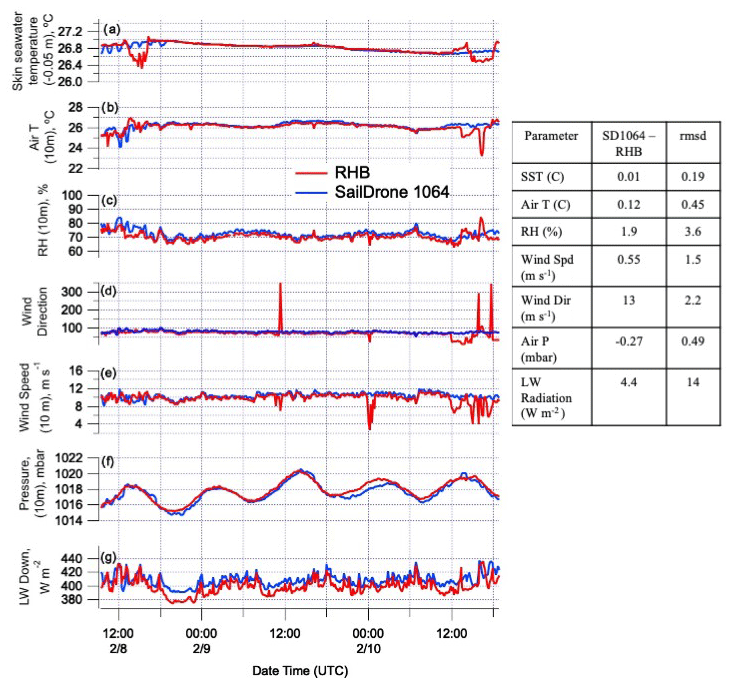
Figure 8Comparison of parameters measured on board Saildrone 1064 (SD1064) and RV Ronald H. Brown (RHB) when the platforms were within 0.7 to 3.6 nmi of each other between 8 and 10 February. Parameters include (a) SST (SD at −0.05 m and RHB sea snake), (b) air temperature (10 m), (c) RH (10 m), (d) wind direction, (e) wind speed (10 m), (f) atmospheric pressure (10 m), and (g) longwave downwelling radiation. Absolute differences (SD1064 − RHB) and root mean square differences (RMSDs) are reported in the inset table. Number of samples based on 10 min averaged data =663.
4.2.3 SD1064 − RHB
Saildrone 1064 and the RV Ronald H. Brown were within 0.7 to 3.6 nmi of each other between 8 and 10 February. Based on 10 min averaged data, 663 samples were available for the comparison. Air temperature, RH, and wind speed adjusted to 10 m were used for the comparison. Skin seawater temperature was measured at a depth of 0.05 m on the Saildrone and from the ship's sea snake. On average, skin seawater temperature agreed within 0.01 ∘C, atmospheric temperature within 0.12 ∘C, and RH within 1.9 % – all within the uncertainty of the measurements or within the agreement observed between the NTAS buoy and the ship (see Sect. 4.2.1) (Fig. 8a, b, c). At the end of the comparison, ship-measured seawater temperature at 0.05 m decreased, atmospheric temperature decreased, and RH increased while Saildrone-observed parameters remained steady even though the platforms were within 0.8 nmi of each other. These differences indicate the fine-scale nature of structural differences in surface oceanic and lower atmospheric conditions.
On average, agreement for wind direction and wind speed was not within instrumental uncertainties or the agreement observed between the NTAS buoy and the ship due to spikes in the ship's measurements not observed by the Saildrone (Fig. 8d, e). Atmospheric pressure agreed well with an absolute difference (SD0164 − RHB) of −0.27 mbar (Fig. 8f). The absolute difference in downward longwave radiation (SD0164 − RHB) was 4.4 W m−2, indicating a systemic offset (Fig. 8g).
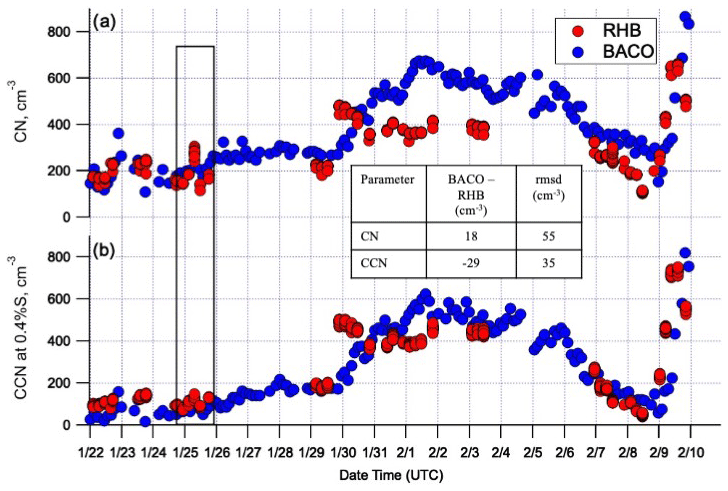
Figure 9Aerosol parameters measured on board the RV Ronald H. Brown (RHB) and at Barbados Atmospheric Chemistry Observatory (BACO) for the period of overlapping measurements. The rectangle indicates the comparison period (24 January, 18:20 to 25 January, 23:40) when RHB was 20 nmi due east of BACO. Parameters include (a) total particle number condensation (CN) and (b) cloud condensation nuclei concentration (CCN) measured at 0.4 % supersaturation. The average of the absolute differences (BACO − RHB) and root mean square differences (RMSDs) for the comparison period are reported in the inset table. Number of samples =5.
4.3 Comparison of aerosol and cloud parameters
4.3.1 BACO − RHB – aerosol parameters
The Barbados Atmospheric Chemistry Observatory (BACO) is located at Ragged Point, 400 m across a cove from BCO. Total particle number concentration (CN), cloud condensation nuclei (CCN) concentration at 0.4 % supersaturation, and particle number size distributions were compared between BACO and the ship when the ship was 20 nmi east and upwind of BACO (24 January, 18:20 to 25 January, 23:40) (Table 3). Details on the RV Ronald H. Brown aerosol measurements are shown in Table 5, and details on CCN calibration and measurements are provided in Quinn et al. (2019). Details on BACO CCN calibrations and measurements are provided in Pöhlker et al. (2018).
CN and CCN concentrations are shown in Fig. 9 from the time when BACO measurements began (22 January, 00:16) to when the ship's measurements ended (9 February, 20:20). Based on CN concentrations below 300 cm−3, both platforms encountered clean marine conditions until ∼29 January at 12:00. Subsequent enhanced concentrations of both CN and CCN correspond to periods when dust and biomass burning reached the study area after transport from Africa (Fig. 4d) as observed in related earlier studies (Wex et al., 2016). The coherence of CN and CCN between the platforms, even when separated by 4∘ of longitude, indicates a broad-scale dust event.
The comparison when the ship was 20 nmi upwind of BACO is indicated by the rectangle in Fig. 9. CCN concentrations were compared at a single supersaturation (S=0.4 %), which limited the number of samples to 5. The absolute difference (BACO − RHB) was 18 cm−3 for CN, which is less than 10 % of the average CN concentration during the comparison period and less than measurement uncertainties (Rose et al., 2008) (Fig. 9a). The difference for CCN was −29 cm−3, indicating the ship observed more CCN at S=0.4 % than BACO (Fig. 9b). However, this difference is within the combined uncertainty of 30 % for mono- and polydisperse CCN measurements.
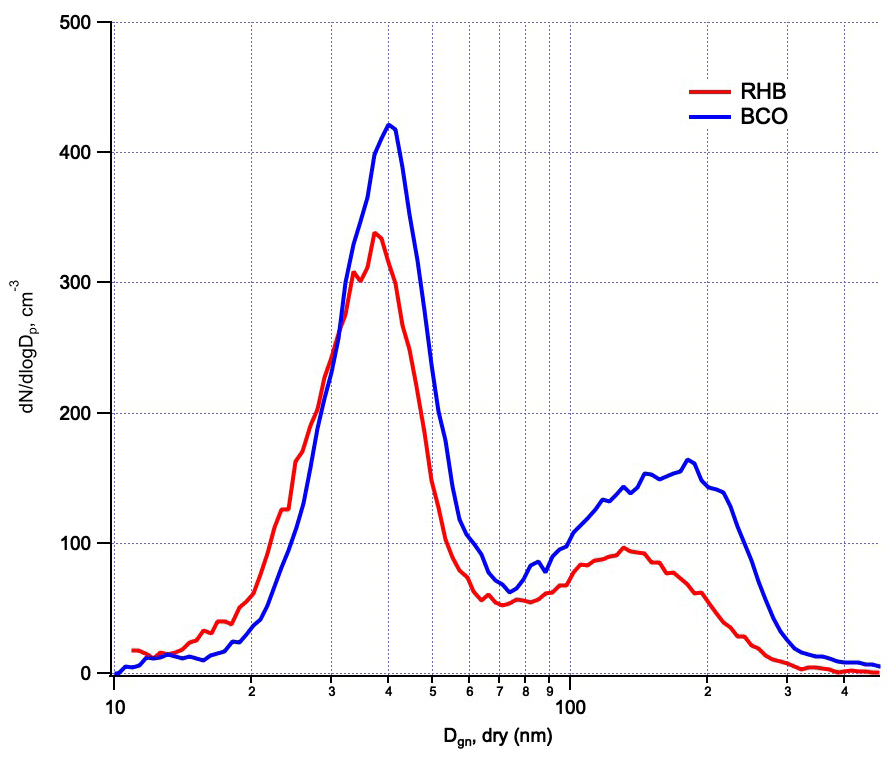
Figure 10Comparison of aerosol number size distribution measured on board the RV Ronald H. Brown (RHB) and at the Barbados Atmospheric Chemistry Observatory (BACO) during the comparison period (24 January, 18:20–25 January, 23:40) when RHB was 20 nmi to the east of BACO.
Shipboard and BACO size distributions averaged over the length of the comparison were bimodal with Aitken modal diameters of ∼40 nm for both the ship and BACO and 130 and 170 nm for the accumulation mode for the ship and BACO, respectively (Fig. 10). Differences in magnitude could be due to instrumental issues or local aerosol sources at BACO.
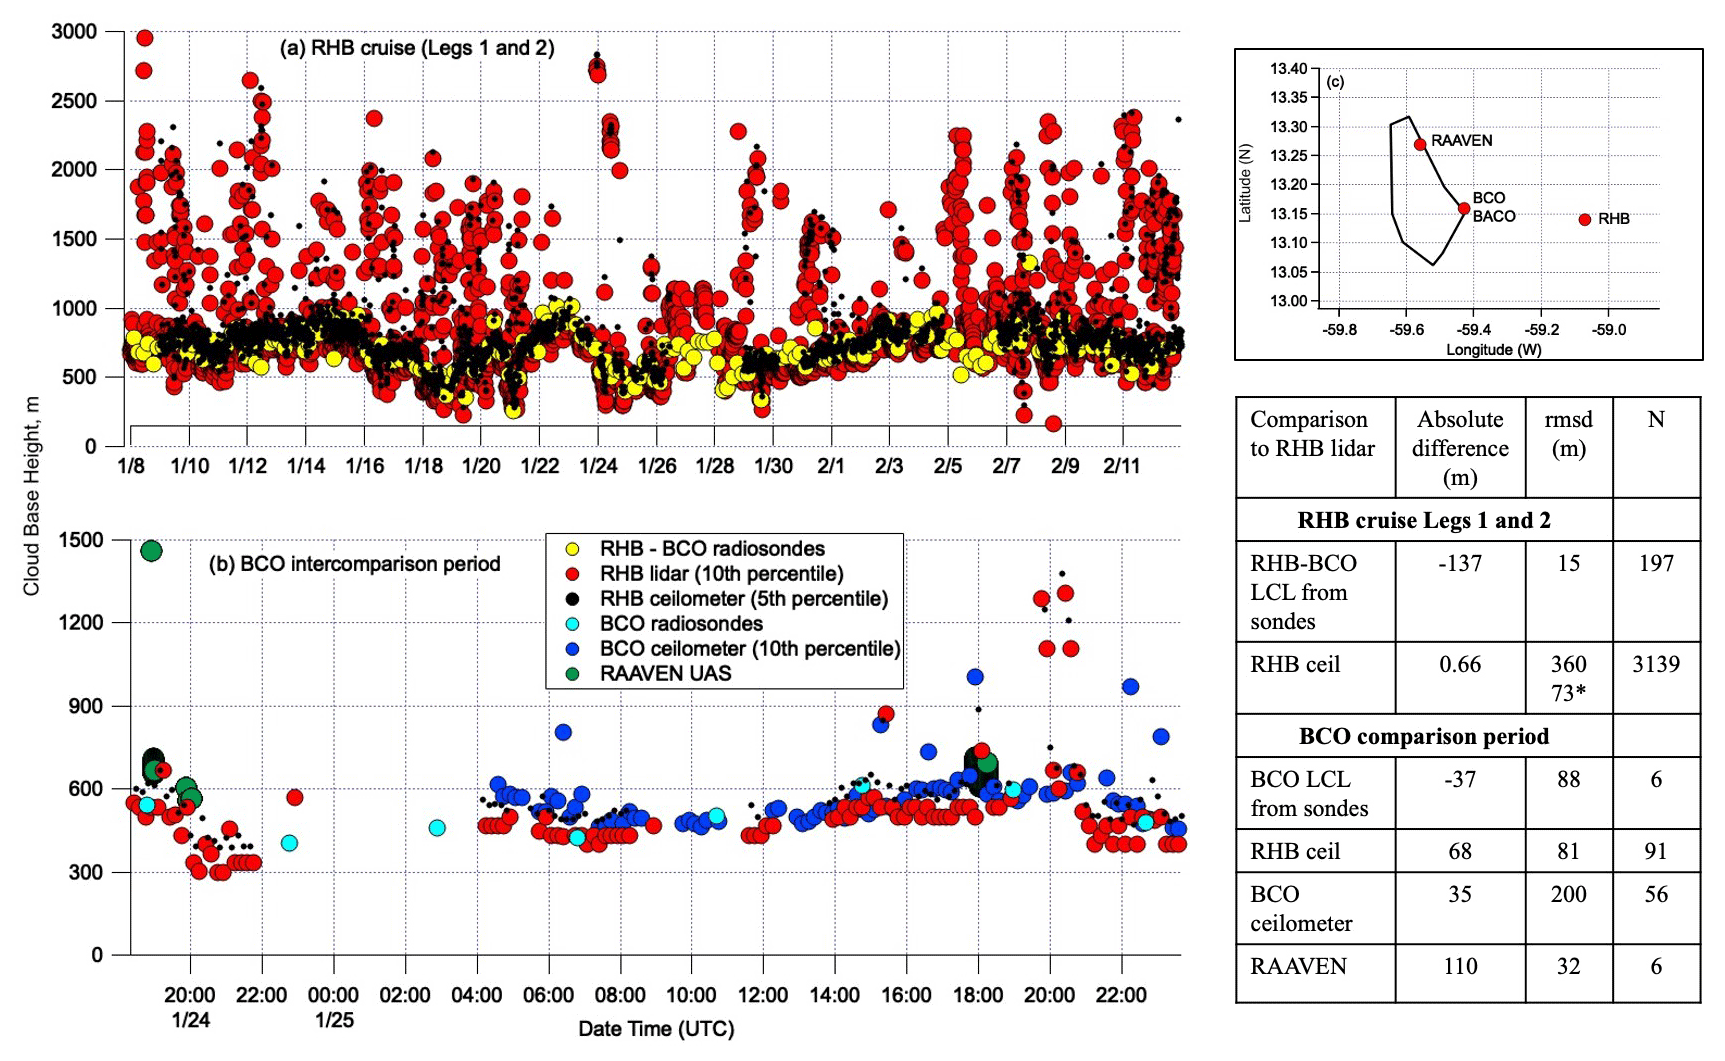
Figure 11Comparison of cloud base height (CBH) for (a) legs 1 and 2 on board RV Ronald H. Brown (RHB) based on LCL calculated from the stitched together RHB − BCO radiosonde record (Eq. 1), the ceilometer, and the Doppler lidar and (b) for the RHB − BCO comparison period (24 January, 18:20–25 January, 23:40) based on the BCO ceilometer, LCL from BCO radiosondes, the RHB ceilometer and microDop lidar, and the RAAVEN UAS flown from Morgan Lewis (30 km north of BCO). Locations of the RAAVEN launch site, BCO, and RHB are shown in (c). The average of the absolute differences and root mean square differences (RMSDs) are shown in the table inset relative to the RHB lidar-derived CBH. N indicates number of samples used in the comparison. * RMSD for RHB ceilometer – RHB microDop lidar with CBH greater than 1000 m removed from comparison.
4.3.2 BCO − RHB – cloud base height
Cloud base height (CBH) was derived from three different measurements on board the RV Ronald H. Brown – LCL calculated from the stitched together RHB − BCO radiosonde record (Eq. 1), the ceilometer, and the microDop lidar (Fig. 11a). Fifth and 10th percentile values of the lowest cloud scattered return were averaged over 10 min intervals of the ceilometer and lidar data, respectively. The choice of percentile levels was tested to reduce inclusion of scattering at the surface made by rain and scattering aloft from horizontally sheared cloud edges. Higher altitude ceilometer and lidar values that remain in this time series are not representative of cloud base due to the presence and scattering by sheared edges or detrained portions of clouds that are separated horizontally from the locations of cloud base. Dilution of surface parcels with drier air could also contribute to rising heights of the cloud base. Lowest values from both the ceilometer and lidar track well with the LCL values derived from the radiosondes.
On average, the absolute difference between the LCL and lidar values (RHB–BCO LCL − RHB lidar) is −137 m due to lidar scattering off of slightly higher altitude clouds. On average, the absolute difference between the RHB ceilometer and microDop lidar (RHB ceilometer − RHB lidar) is 0.66 m, indicating good agreement, while the RMSD value of 360 m reveals larger point-to-point differences. If CBHs from the ship's ceilometer and microDop lidar are limited to values less than 1000 m, RMSD decreases to 73 m.
For the BCO comparison period (24 January, 18:20–25 January, 23:40), CBHs were compared from the ship's ceilometer and microDop lidar, BCO's ceilometer and LCLs from radiosondes, and the RAAVEN UAS miniFlux payload (Fig. 11b). The RAAVEN UAS flew from the eastern side of Barbados, 30 km north of BCO. Locations of the RAAVEN launch site, BCO, and ship during the comparison are shown in Fig. 11c. Absolute differences in average values between the BCO ceilometer and RHB microDop lidar (BCO ceilometer − RHB microDop lidar) and BCO LCLs and RHB microDop lidar (BCO LCL − RHB microDop lidar) are around 35 m or 7 % of the average sonde-derived CBH. The absolute difference in average values between the RHB ceilometer and RHB microDop lidar (RHB ceilometer − RHB microDop lidar) is slightly higher at 68 m. RAAVEN values are slightly higher with an absolute difference (RAAVEN miniFlux − RHB microDop lidar) of 110 m. Differences could be related to finer-scale horizontal and vertical variability in boundary layer structure not readily resolved by the measurements.
Table 11Summary of data sets and DOIs, point-of-contact information, and references for data collected on board the RV Ronald H. Brown, NTAS, Wave Gliders, SWIFTs, NOAA- and NASA-operated Saildrones, and RAAVEN UAS during ATOMIC. The data are permanently and publicly available at NCEI.
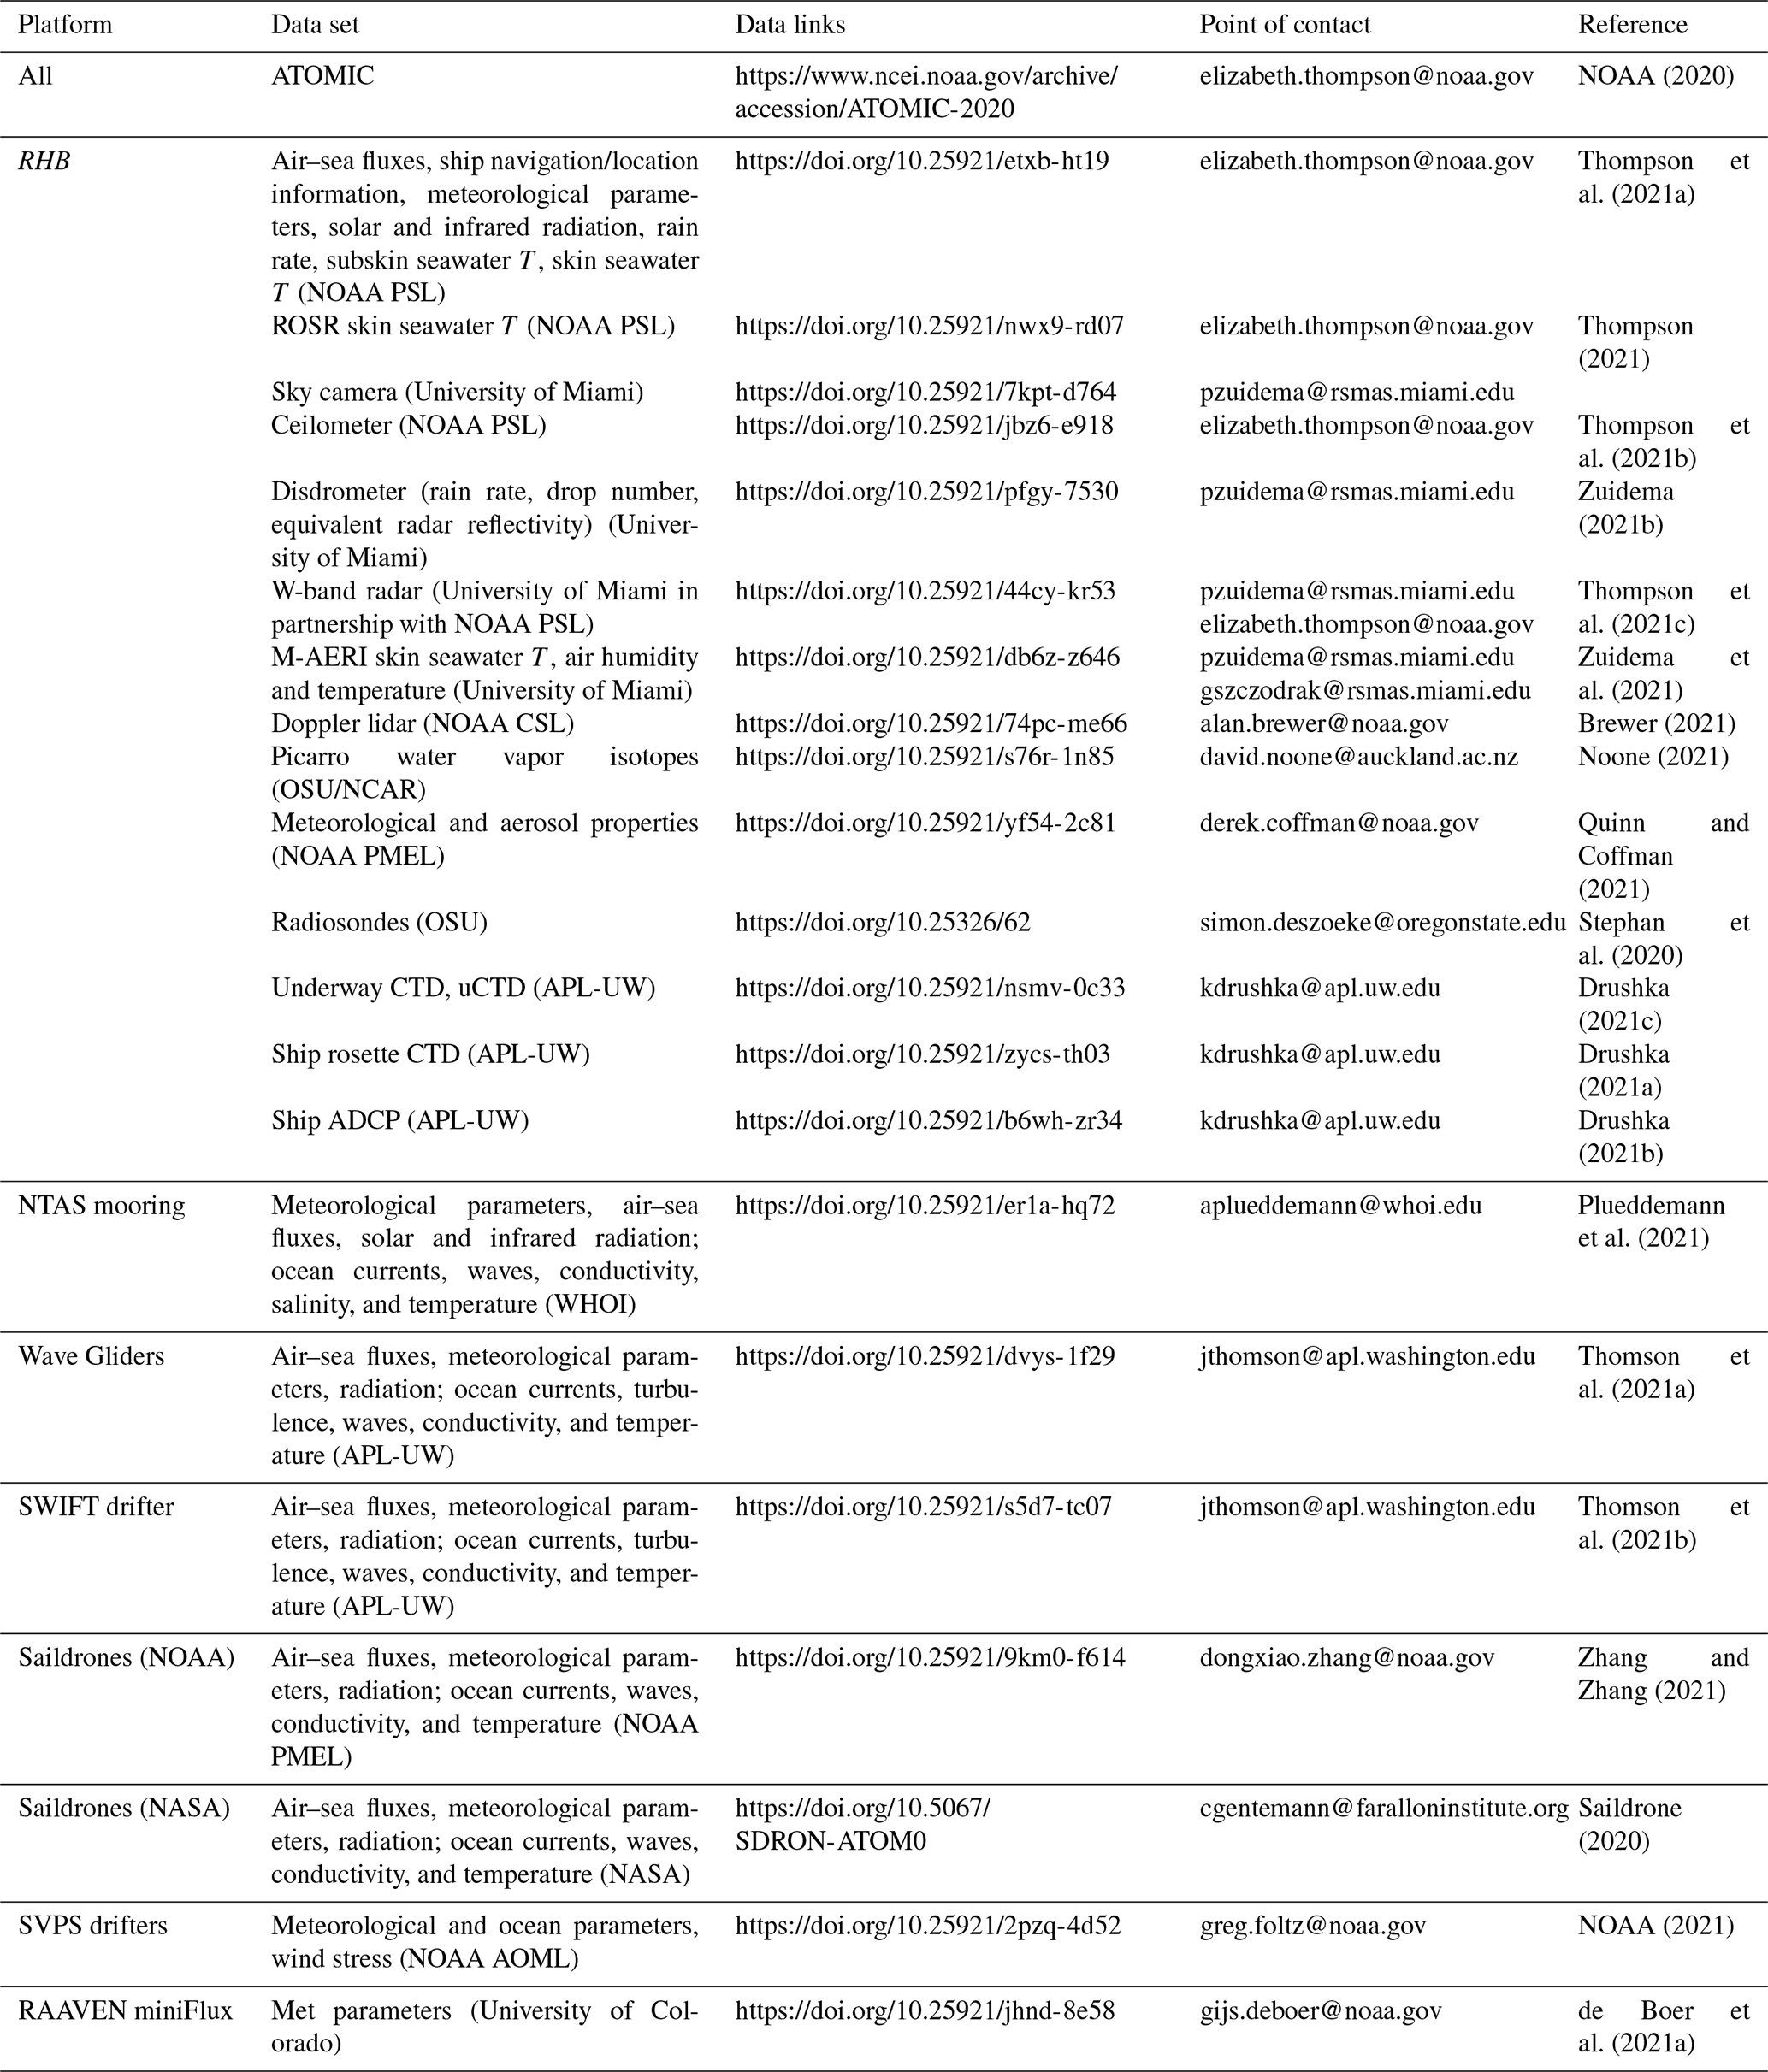
All ATOMIC data sets discussed herein are publicly available at NOAA's National Center for Environmental Information (https://www.ncei.noaa.gov/archive/accession/ATOMIC-2020, last access: 2 April 2021). Point-of-contact information, links, and DOIs for the individual data sets are provided in Table 11. The data are permanently and publicly available at NCEI.
All of the data sets included in the discussion have been quality-controlled based on procedures implemented by the individual research teams. Versioning also is based on protocols put in place by individual research teams. Details can be found in the references listed in Table 11. Data are CF compliant. File name structure is as follows: 〈campaign_id〉_〈project_id〉_〈platform_id〉_〈instrument_id〉 _〈variable_id〉_〈time_id〉_〈version_id〉.nc. An example of data collected from the ceilometer on the RV Ronald H. Brown is as follows. The name of the data and link are EUREC4A_ATOMIC_RonBrown_Ceilometer_10min_ 20200109_20200212_v1.0.nc. Metadata are embedded in the individual .nc files for each data set. As an example, the metadata for cloud base height are as follows:
-
long_name: cloud base height
-
standard_name: cloud_base_altitude
-
units: km
-
coverage_content_type: thematicClassification
-
instrument: ceilometer_instrument
-
platform: RonBrown
-
coordinates: time
-
cell_methods: time: point
-
valid_range: 0.0, 7.0
-
actual_range: 0.28, 6.86975
-
_FillValue: −9999.0.
-
comment: computed as the 5th percentile of cloud 1, the height of first cloud layer detected, from 15 s raw data over this time period.
During ATOMIC, in situ and remote sensing measurements of oceanic and atmospheric properties and air–sea fluxes were made from the RV Ronald H. Brown. In addition, the NTAS mooring, radiosondes, SWIFTs, and Wave Gliders were deployed. Descriptions of the instrumentation on board the ship and the deployed assets are provided along with the sampling strategy and day-to-day events. Atmospheric and oceanic conditions encountered during the cruise are described. Also detailed is how to access to all data collected. Comparisons were conducted with the NTAS moorings, Saildrone 1064, BCO, BACO, and the RAAVEN UAS. Data from inter-platform comparisons are presented to assess consistency in data sets. Resolving identified inconsistencies will be the subject of future research. The intention of the paper is to advance widespread use of the data by the ATOMIC and broader research communities.
PKQ prepared the paper with the help of all co-authors. EJT prepared data sets for archival on the PSL ftp server and at NCEI. DJC prepared data for inclusion in the paper's figures. All authors participated in collecting and analyzing ATOMIC data.
The authors declare that they have no conflict of interest.
This article is part of the special issue “Elucidating the role of clouds–circulation coupling in climate: data sets from the 2020 (EUREC4A) field campaign”. It is not associated with a conference.
We thank the crew of the RV Ronald H. Brown for their enthusiastic help and cooperation throughout the ATOMIC cruise and Edmund Blades and Peter Sealey for technical support at the BACO site. We would like to thank David Farrell of the Caribbean Institute for Meteorology and Hydrology (CIMH) for his assistance with the organization of this campaign and Sandy Lucas of NOAA's Climate Program Office for her efforts that made ATOMIC and related outreach programs a success. This is PMEL contribution number 5172.
NOAA's Climate Variability and Predictability Program provided funding under NOAA CVP NA19OAR4310379, GC19-301, and GC19-305. The Joint Institute for the Study of the Atmosphere and Ocean (JISAO) supported this study under NOAA cooperative agreement NA15OAR4320063. Additional support was provided by the NOAA's Uncrewed Aircraft Systems (UAS) Program Office, NOAA's Physical Sciences Laboratory, and NOAA AOML's Physical Oceanography Division. The NTAS project is funded by the NOAA's Global Ocean Monitoring and Observing Program (CPO FundRef number 100007298), through the Cooperative Institute for the North Atlantic Region (CINAR) under cooperative agreement NA14OAR4320158.
This paper was edited by Lisan Yu and reviewed by two anonymous referees.
Banner, M. L. and Morison, R. P.: Refined source terms in wind wave models with explicit wave breaking prediction. Part I: Model framework and validation against field data, Ocean Model., 33, 177–189, 2010.
Bates, T. S., Coffman, D. J., Covert, D. S., and Quinn, P. K.: Regional marine boundary layer aerosol size distributions in the Indian, Atlantic and Pacific Oceans: A comparison of INDOEX measurements with ACE-1, ACE-2, and Aerosols99, J. Geophys. Res.-Atmos., 107, 8026, https://doi.org/10.1029/2001JD001174, 2002.
Bigorre, S. P. and Galbraith, N. R.: Sensor performance and data quality control, in: Observing the Oceans in Real Time, edited by: Venkatesan, R., Tandon, A., D'Asaro, E., and Atmanand, M. A., Springer International, Switzerland, 243–261, 2018.
Bolton, D.: The Computation of Equivalent Potential Temperature, Mon. Weather Rev., 108, 1046–1053, 1980.
Bony, S., Stevens, B., Frierson, D. M. W., Jakob, C., Kageyama, M., Pincus, R., Shepherd, T. G., Sherwood, S. C., Siebesma, A. P., Sobel, A. H., Watanabe, M., and Webb, M. J.: Clouds, circulation, and climate sensitivity, Nat. Geosci., 8, 261–268, 2015.
Bony, S., Stevens, B., Ament, F., Bigorre, S., Chazette, P., Crewell, S., Delanoe, J., Emanuel, K., Farrell, D., Flamant, C., Gross, S., Hirsch, L., Karstensen, J., Mayer, B., Nuijens, L., Ruppert, J. H., Sandu, I., Siebesma, P., Speich, S., Szczap, F., Totems, J., Vogel, R., Wendisch, M., and Wirth, M.: EUREC4A: A field campaign to elucidate the couplings between clouds, convection and circulation, Surv. Geophys., 38, 1529–1568, 2017.
Brewer, W. A.: Continuous profiles of vertical velocity and uncalibrated aerosol backscatter intensity at a wavelength of 1.5 micron in the atmospheric boundary layer measured by a vertically-stabilized Doppler lidar aboard NOAA Ship Ronald H. Brown in the North Atlantic Ocean by the NOAA Chemical Sciences Laboratory during the Atlantic Tradewind Ocean-Atmosphere Mesoscale Interaction Campaign (ATOMIC), near Barbados, 2020-01-07 to 2020-02-12, NOAA NCEI [data set], https://doi.org/10.25921/74pc-me66, 2021.
Carlson, T. N. and Prospero, J. M.: The large-scale movement of Saharan air outbreaks over the northern equatorial Atlantic, J. Appl. Meteorol., 11.2, 283–297, 1972.
Centurioni, L. R., Hörmann, V., Chao, Y., Reverdin, G., Font, J., and Lee, D.-K.: Sea surface salinity observations with Lagrangian drifters in the tropical North Atlantic during SPURS: Circulation, fluxes, and comparisons with remotely sensed salinity from Aquarius, Oceanography, 28, 96–105, 2015.
Colbo, K. and Weller, R. A.: Accuracy of the IMET Sensor Package in the Subtropics, J. Atmos. Ocean. Tech., 26, 1867–1890, 2009.
de Boer, G., Borenstein, S., Calmer, R., Rhodes, M., Choate, C., Hamilton, J., Argrow, B., and Intrieri, J.: Lower-atmospheric meteorological and surface properties from the CU-RAAVEN unmanned aircraft system (UAS) over the Tropical Atlantic Ocean by University of Colorado Boulder/Physical Sciences Laboratory Cooperative Institute for Research in Environmental Sciences during the Atlantic Tradewind Ocean-Atmosphere Mesoscale Interaction Campaign (ATOMIC), near Barbados, 2020-01-24 to 2020-02-16, NOAA NCEI [data set], https://doi.org/10.25921/jhnd-8e58, 2021a.
de Boer, G., Calmer, R., Cox, C. J., Borenstein, S., Rhodes, M., Choate, C., Hamilton, J., Argrow, B., and Intrieri, J.: Measurements from the University of Colorado RAAVEN Remotely-Piloted Aircraft System during ATOMIC, in preparation, 2021b.
Doherty, O. M., Riemer, N., and Hameed, S.: Control of Saharan mineral dust transport to Barbados in winter by the Intertropical Convergence Zone over West Africa, J. Geophys. Res.-Atmos., 117, D19117, https://doi.org/10.1029/2012JD017767, 2012.
Drushka, K.: Vertical profiles of ocean temperature, salinity, pressure, chlorophyll-a, turbidity, and oxygen, estimated from the in situ Conductivity, Temperature, Depth (CTD), fluorometer, and dissolved oxygen sensors aboard the NOAA Ship Ronald H. Brown in the North Atlantic Ocean by the ship equipment and saved by the Applied Physics Laboratory at the University of Washington during the Atlantic Tradewind Ocean-Atmosphere Mesoscale Interaction Campaign (ATOMIC), near Barbados, 2020-01-08 to 2020-02-09, NOAA NCEI [data set], https://doi.org/10.25921/zycs-th03, 2021a.
Drushka, K.: Vertical profiles of ocean currents estimated from an Acoustic Doppler Current Profiler remote sensing instrument aboard the NOAA Ship Ronald H. Brown in the North Atlantic Ocean by the ship equipment and saved by the Applied Physics Laboratory at the University of Washington during the Atlantic Tradewind Ocean-Atmosphere Mesoscale Interaction Campaign (ATOMIC), near Barbados, 2020-01-09, NOAA NCEI, [data set], https://doi.org/10.25921/b6wh-zr34, 2021b.
Drushka, K.: Vertical profiles of ocean temperature and salinity estimated from the underway Conductivity, Temperature, and Depth (uCTD) in-situ instrument aboard NOAA Ship Ronald H. Brown in the North Atlantic Ocean by the Applied Physics Laboratory at the University of Washington during the Atlantic Tradewind Ocean-Atmosphere Mesoscale Interaction Campaign (ATOMIC), near Barbados, 2020-01-14 to 2020-02-12, NOAA NCEI [data set], https://doi.org/10.25921/nsmv-0c33, 2021c.
Edson, J. B., Jampana, V., Weller, R. A., Bigorre, S., Plueddemann, A. J., and Fairall, C. W.: On the exchange of momentum over the open ocean, J. Phys. Oceanogr., 43, 1589–1610, 2013.
Espy, J. P.: Essays on Meteorology, No. IV: North East Storms, Volcanoes, and Columnar Clouds, J. Frankl. Inst., 22, 239–246, 1836.
Fairall, C. W., Bradley, E. F., Rogers, D. P., Edson, J. B., and Young, G. S.: Bulk parameterization of air–sea fluxes in TOGA COARE, J. Geophys. Res.-Atmos., 101, 3747–3767, 1996.
Fairall, C. W., White, A. B., Edson, J. B., and Hare, J. E.: Integrated Shipboard Measurements of the Marine Boundary Layer, J. Atmos. Ocean. Tech., 14, 338–359, 1997.
Fairall, C. W., Bradley, E. F., Hare, J. E., Grachev, A. A., and Edson, J. B.: Bulk parameterization of air-sea fluxes: Updates and verification for the COARE algorithm, J. Climate, 16, 571–591, 2003.
Fratantoni, D. M. and Glickson, D. A.: North Brazil Current Ring Generation and Evolution Observed with SeaWiFS, J. Phys. Oceanogr., 32, 1058–1074, 2002.
Hormann, V., Centurioni, L. R., and Reverdin, G.: Evaluation of drifter salinities in the subtropical North Atlantic, J. Atmos. Ocean. Tech., 32, 185–192, 2015.
Liu, D., Wang, Y., Wang, Z., and Zhou, J.: The Three-Dimensional Structure of Transatlantic African Dust Transport: A New Perspective fom CALIPSO LIDAR Measurements, Adv. Meteorol., 2012, 850704, https://doi.org/10.1155/2012/850704, 2012.
Löffler-Mang, M. and Joss, J.: An optical disdrometer for measuring size and velocity of hydrometeors, J. Atmos. Ocean. Tech., 17, 130–139, 2000.
Malm, W. C., Sisler, J. F., Huffman, D., Eldred, R. A., and Cahill, T. A.: Spatial and seasonal trends in particle concentration and optical extinction in the United States, J. Geophys. Res.-Atmos., 99, 1347–1370, 1994.
Minnett, P., Knuteson, R. O., Best, F., and Osborne, B. J.: The Marine-Atmospheric Emitted Radiance Interferometer (M-AERI), a high-accuracy, sea-going infrared spectroradiometer, J. Atmos. Ocean. Tech., 18, 94–1013, 2001.
Mojica, K. and Gaube, P.: Estimates of mixing and mixed layer depth in the Western North Atlantic, Frontiers, submitted, 2021.
Moran, K., Pezoa, S., Fairall, C. W., Williams, C., Ayers, T., Brewer, A., Szoeke, S. P. D., and Ghate, V.: A Motion-Stabilized W-Band Radar for Shipboard Observations of Marine Boundary-Layer Clouds, Bound.-Lay. Meteorol., 143, 3–24, 2012.
NOAA: The Atlantic Tradewind Ocean-Atmosphere Mesoscale Interaction Campaign (ATOMIC), Barbados, 17 January–12 February 2020, NOAA NCEI [data set], available at: https://www.ncei.noaa.gov/archive/accession/ATOMIC-2020 (last access: 2 April 2021), 2020.
NOAA: Near-surface wind velocity, surface atmospheric pressure, and near-surface ocean parameters (temperature, salinity) estimated from in-situ instruments aboard 9 surface ocean drifters in the North Atlantic Ocean by NOAA Atlantic Oceanographic and Meteorological Laboratory during the Atlantic Tradewind Ocean-Atmosphere Mesoscale Interaction Campaign (ATOMIC), near South America, 2020-01-23 to 2020-04-29, NOAA NCEI [data set], https://doi.org/10.25921/2pzq-4d52, 2021.
Noone, D.: Near-surface humidity and water vapor isotopologue ratios estimated from a Picarro gas analyzer in-situ instrument aboard NOAA Ship Ronald H. Brown in the North Atlantic Ocean by Oregon State University and University of Auckland during the Atlantic Tradewind Ocean-Atmosphere Mesoscale Interaction Campaign (ATOMIC), near Barbados, 2010-01-26 to 2020-02-10, NOAA NCEI [data set], https://doi.org/10.25921/s76r-1n85, 2021.
Petit, R. H., Legrand, M., Jankowiak, I., Molimie, J., Asselin de Beauville, C., Marion, G., and Mansot, J. L.: Transport of Saharan dust over the Caribbean islands: Study on an event, J. Geophys. Res.-Atmos., 110, D18S09, https://doi.org/10.1029/2004JD004748, 2005.
Pincus, R., Fairall, C. W., Bailey, A., Chen, H., Chuang, P. Y., de Boer, G., Feingold, G., Henze, D., Kalen, Q. T., Kazil, J., Leandro, M., Lundry, A., Moran, K., Naeher, D. A., Noone, D., Patel, A. J., Pezoa, S., PopStefanija, I., Thompson, E. J., Warnecke, J., and Zuidema, P.: Observations from the NOAA P-3 aircraft during ATOMIC, Earth Syst. Sci. Data Discuss. [preprint], https://doi.org/10.5194/essd-2021-11, in review, 2021.
Plueddemann, A. J., Bigorre, S., and Pietro, B.: Near-surface meteorology, air-sea fluxes, surface ocean waves, and ocean properties (temperature, salinity, currents) estimated from in-situ instruments aboard the Northwest Tropical Atlantic Station (NTAS) mooring by Woods Hole Oceanographic Institution Upper Ocean Processes Group during the Atlantic Tradewind Ocean-Atmosphere Mesoscale Interaction Campaign (ATOMIC), near Barbados, 2020-01-05 to 2020-02-14, NOAA NCEI [data set], https://doi.org/10.25921/er1a-hq72, 2021.
Pöhlker, M. L., Ditas, F., Saturno, J., Klimach, T., Hrabě de Angelis, I., Araùjo, A. C., Brito, J., Carbone, S., Cheng, Y., Chi, X., Ditz, R., Gunthe, S. S., Holanda, B. A., Kandler, K., Kesselmeier, J., Könemann, T., Krüger, O. O., Lavrič, J. V., Martin, S. T., Mikhailov, E., Moran-Zuloaga, D., Rizzo, L. V., Rose, D., Su, H., Thalman, R., Walter, D., Wang, J., Wolff, S., Barbosa, H. M. J., Artaxo, P., Andreae, M. O., Pöschl, U., and Pöhlker, C.: Long-term observations of cloud condensation nuclei over the Amazon rain forest – Part 2: Variability and characteristics of biomass burning, long-range transport, and pristine rain forest aerosols, Atmos. Chem. Phys., 18, 10289–10331, https://doi.org/10.5194/acp-18-10289-2018, 2018.
Prospero, J. M. and Mayol-Bracero, O. L.: Understanding the transport and impact of African dust on the Caribbean Basin, B. Am. Meteol. Soc., 94, 1329–1337, 2013.
Quinn, P. K., Bates, T. S., Coffman, D. J., Upchurch, L., Moore, R., Ziemba, L. D., Bell, T. G., Saltzman, E. S., Graff, J., and Behrenfeld, M. J.: Seasonal variations in western North Atlantic remote marine aerosol properties, J. Geophys. Res.-Atmos., 124, 14240–14261, 2019.
Quinn, P. K. and Coffman, D. J.: Atmospheric chemistry and composition properties estimated from in-situ instruments aboard NOAA Ship Ronald H. Brown in the North Atlantic Ocean by the NOAA Pacific Marine Enviornmental Laboratory during the Atlantic Tradewind Ocean-Atmosphere Mesoscale Interaction Campaign (ATOMIC), near Barbados, 2010-01-15 to 2010-02-24, NOAA NCEI [data set], https://doi.org/10.25921/yf54-2c81, 2021.
Rose, D., Gunthe, S. S., Mikhailov, E., Frank, G. P., Dusek, U., Andreae, M. O., and Pöschl, U.: Calibration and measurement uncertainties of a continuous-flow cloud condensation nuclei counter (DMT-CCNC): CCN activation of ammonium sulfate and sodium chloride aerosol particles in theory and experiment, Atmos. Chem. Phys., 8, 1153–1179, https://doi.org/10.5194/acp-8-1153-2008, 2008.
Saildrone: Saildrone Arctic ATOMIC Field Campaign Products, Ver. 1.0, PO.DAAC, https://doi.org/10.5067/SDRON-ATOM0, 2020.
Schroeder, P., Brewer, W. A., Choukulkar, A., Weickmann, A., Zucker, M., Holloway, M. W., and Sandberg, S.: A Compact, Flexible, and Robust Micropulsed Doppler Lidar, J. Atmos. Ocean. Tech., 37, 1387–1402, 2020.
Smirnov, A., Holben, B. N., Slutsker, I., D.M.Giles, McClain, C. R., Eck, T. F., Sakerin, S. M., Macke, A., P.Croot, Zibordi, G., Quinn, P. K., Sciare, J., Kinne, S., Harvey, M., Smyth, T. J., Piketh, S., Zielinski, T., Proshutinsky, A., Goes, J. I., Nelson, N. B., Larouche, P., Radionov, V. F., Goloub, P., Moorthy, K. K., Matarrese, R., Robertson, E. J., and Jourdin, F.: Maritime Aerosol Network as a component of Aerosol Robotic Network, J. Geophys. Res.-Atmos., 114, D06204, https://doi.org/10.1029/2008JD011257, 2009.
Stephan, C., Schnitt, S., Schulz, H., Bellenger, H., Szoeke, S. P. d., Acquistapace, C., Baier, K., Dauhut, T., Laxenaire, R., Morfa-Avalos, Y., Person, R., Quinones-Melendez, E., Bagheri, G., Bock, T., Daley, A., Guttler, J., Helfer, K. C., Los, S. A., Neuberger, A., Rottenbacher, J., Raeke, A., Ringel, M., Ritchel, M., Sadoulet, P., Schirmacher, I., Stolla, M. K., Wright, E., Charpentier, B., Doerenbecher, A., Wilson, R., Jansen, F., Kinne, S., Reverdin, G., Speich, S., Bony, S., and Stevens, B.: Ship- and island-based atmospheric soundings from the 2020 EUREC4A field campaign, AERIS [data set], https://doi.org/10.25326/62, 2020.
Stephan, C. C., Schnitt, S., Schulz, H., Bellenger, H., de Szoeke, S. P., Acquistapace, C., Baier, K., Dauhut, T., Laxenaire, R., Morfa-Avalos, Y., Person, R., Quiñones Meléndez, E., Bagheri, G., Böck, T., Daley, A., Güttler, J., Helfer, K. C., Los, S. A., Neuberger, A., Röttenbacher, J., Raeke, A., Ringel, M., Ritschel, M., Sadoulet, P., Schirmacher, I., Stolla, M. K., Wright, E., Charpentier, B., Doerenbecher, A., Wilson, R., Jansen, F., Kinne, S., Reverdin, G., Speich, S., Bony, S., and Stevens, B.: Ship- and island-based atmospheric soundings from the 2020 EUREC4A field campaign, Earth Syst. Sci. Data, 13, 491–514, https://doi.org/10.5194/essd-13-491-2021, 2021.
Stevens, B., Farrell, D., Hirsch, L., Jansen, F., Nuijens, L., Serikov, I., Brugmann, B., Forde, M., Linne, H., Lonitz, K., and Prospero, J. M.: The Barbados Cloud Observatory: Anchoring Investigations of Clouds and Circulation on the Edge of the ITCZ, B. Am. Meteol. Soc., 97, 787–801, 2016.
Stevens, B., Bony, S., Farrell, D., Ament, F., Blyth, A., Fairall, C., Karstensen, J., Quinn, P. K., Speich, S., Acquistapace, C., Aemisegger, F., Albright, A. L., Bellenger, H., Bodenschatz, E., Caesar, K.-A., Chewitt-Lucas, R., de Boer, G., Delanoë, J., Denby, L., Ewald, F., Fildier, B., Forde, M., George, G., Gross, S., Hagen, M., Hausold, A., Heywood, K. J., Hirsch, L., Jacob, M., Jansen, F., Kinne, S., Klocke, D., Kölling, T., Konow, H., Lothon, M., Mohr, W., Naumann, A. K., Nuijens, L., Olivier, L., Pincus, R., Pöhlker, M., Reverdin, G., Roberts, G., Schnitt, S., Schulz, H., Siebesma, A. P., Stephan, C. C., Sullivan, P., Touzé-Peiffer, L., Vial, J., Vogel, R., Zuidema, P., Alexander, N., Alves, L., Arixi, S., Asmath, H., Bagheri, G., Baier, K., Bailey, A., Baranowski, D., Baron, A., Barrau, S., Barrett, P. A., Batier, F., Behrendt, A., Bendinger, A., Beucher, F., Bigorre, S., Blades, E., Blossey, P., Bock, O., Böing, S., Bosser, P., Bourras, D., Bouruet-Aubertot, P., Bower, K., Branellec, P., Branger, H., Brennek, M., Brewer, A., Brilouet, P.-E., Brügmann, B., Buehler, S. A., Burke, E., Burton, R., Calmer, R., Canonici, J.-C., Carton, X., Cato Jr., G., Charles, J. A., Chazette, P., Chen, Y., Chilinski, M. T., Choularton, T., Chuang, P., Clarke, S., Coe, H., Cornet, C., Coutris, P., Couvreux, F., Crewell, S., Cronin, T., Cui, Z., Cuypers, Y., Daley, A., Damerell, G. M., Dauhut, T., Deneke, H., Desbios, J.-P., Dörner, S., Donner, S., Douet, V., Drushka, K., Dütsch, M., Ehrlich, A., Emanuel, K., Emmanouilidis, A., Etienne, J.-C., Etienne-Leblanc, S., Faure, G., Feingold, G., Ferrero, L., Fix, A., Flamant, C., Flatau, P. J., Foltz, G. R., Forster, L., Furtuna, I., Gadian, A., Galewsky, J., Gallagher, M., Gallimore, P., Gaston, C., Gentemann, C., Geyskens, N., Giez, A., Gollop, J., Gouirand, I., Gourbeyre, C., de Graaf, D., de Groot, G. E., Grosz, R., Güttler, J., Gutleben, M., Hall, K., Harris, G., Helfer, K. C., Henze, D., Herbert, C., Holanda, B., Ibanez-Landeta, A., Intrieri, J., Iyer, S., Julien, F., Kalesse, H., Kazil, J., Kellman, A., Kidane, A. T., Kirchner, U., Klingebiel, M., Körner, M., Kremper, L. A., Kretzschmar, J., Krüger, O., Kumala, W., Kurz, A., L'Hégaret, P., Labaste, M., Lachlan-Cope, T., Laing, A., Landschützer, P., Lang, T., Lange, D., Lange, I., Laplace, C., Lavik, G., Laxenaire, R., Le Bihan, C., Leandro, M., Lefevre, N., Lena, M., Lenschow, D., Li, Q., Lloyd, G., Los, S., Losi, N., Lovell, O., Luneau, C., Makuch, P., Malinowski, S., Manta, G., Marinou, E., Marsden, N., Masson, S., Maury, N., Mayer, B., Mayers-Als, M., Mazel, C., McGeary, W., McWilliams, J. C., Mech, M., Mehlmann, M., Meroni, A. N., Mieslinger, T., Minikin, A., Minnett, P., Möller, G., Morfa Avalos, Y., Muller, C., Musat, I., Napoli, A., Neuberger, A., Noisel, C., Noone, D., Nordsiek, F., Nowak, J. L., Oswald, L., Parker, D. J., Peck, C., Person, R., Philippi, M., Plueddemann, A., Pöhlker, C., Pörtge, V., Pöschl, U., Pologne, L., Posyniak, M., Prange, M., Quiñones Meléndez, E., Radtke, J., Ramage, K., Reimann, J., Renault, L., Reus, K., Reyes, A., Ribbe, J., Ringel, M., Ritschel, M., Rocha, C. B., Rochetin, N., Röttenbacher, J., Rollo, C., Royer, H., Sadoulet, P., Saffin, L., Sandiford, S., Sandu, I., Schäfer, M., Schemann, V., Schirmacher, I., Schlenczek, O., Schmidt, J., Schröder, M., Schwarzenboeck, A., Sealy, A., Senff, C. J., Serikov, I., Shohan, S., Siddle, E., Smirnov, A., Späth, F., Spooner, B., Stolla, M. K., Szkółka, W., de Szoeke, S. P., Tarot, S., Tetoni, E., Thompson, E., Thomson, J., Tomassini, L., Totems, J., Ubele, A. A., Villiger, L., von Arx, J., Wagner, T., Walther, A., Webber, B., Wendisch, M., Whitehall, S., Wiltshire, A., Wing, A. A., Wirth, M., Wiskandt, J., Wolf, K., Worbes, L., Wright, E., Wulfmeyer, V., Young, S., Zhang, C., Zhang, D., Ziemen, F., Zinner, T., and Zöger, M.: EUREC4A, Earth Syst. Sci. Data Discuss. [preprint], https://doi.org/10.5194/essd-2021-18, in review, 2021.
Szczodrak, M., Minnett, P. J., Nalli, N. R., and Feltz, W. F.: Profiling the Lower Troposphere over the Ocean with Infrared Hyperspectral Measurements of the Marine-Atmosphere Emitted Radiance Interferometer, J. Atmos. Ocean. Tech., 24, 390–402, https://doi.org/10.1175/JTECH1961.1, 2007.
Thompson, E.: Ocean skin surface temperature estimated from remote sensing of infrared radiation by the Remote Ocean Surface Radiometer (ROSR) aboard NOAA Ship Ronald H. Brown in the North Atlantic Ocean by the NOAA Physical Sciences Laboratory during the Atlantic Tradewind Ocean-Atmosphere Mesoscale Interaction Campaign (ATOMIC), near Barbados, 2020-01-09 to 2020-01-26, NOAA NCEI [data set], https://doi.org/10.25921/nwx9-rd07, 2021.
Thompson, E., Fairall, C. W., Pezoa, S., and Bariteau, L.: Near-surface meteorology, air-sea fluxes, surface ocean waves, and near surface ocean parameters (temperature, salinity, currents) and primary dataset of ship location and navigation estimated from in-situ and remote sensing instruments aboard NOAA Ship Ronald H. Brown in the North Atlantic Ocean by the NOAA Physical Sciences Laboratory during the Atlantic Tradewind Ocean-Atmosphere Mesoscale Interaction Campaign (ATOMIC), near Barbados, 2020-01-09 to 2020-02-12, NOAA NCEI [data set], https://doi.org/10.25921/etxb-ht19, 2021a.
Thompson, E., Fairall, C. W., Pezoa, S., and Bariteau, L.: Cloud base height and vertical profiles of visible light backscattered from aersols and clouds in the atmospheric boundary layer estimated from a vertically-pointing lidar remote sensing instrument aboard NOAA Ship Ronald H. Brown in the North Atlantic Ocean by the NOAA Physical Sciences Laboratory during the Atlantic Tradewind Ocean-Atmosphere Mesoscale Interaction Campaign (ATOMIC), near Barbados, 2010-01-09 to 2010-02-12, NOAA NCEI [data set], https://doi.org/10.25921/jbz6-e918, 2021b.
Thompson, E., Zuidema, P., Fairall, C. W., Pezoa, S., Moran, K., and Bariteau, L.: Vertical Profiles of cloud, vertical velocity, and precipitation parameters estimated from a motion-stabilized vertically-pointing W-band (94 GHz) Doppler radar aboard the NOAA Ship Ronald H. Brown in the North Atlantic Ocean by University of Miami and NOAA Physical Sciences Lab during the Atlantic Tradewind Ocean-Atmosphere Mesoscale Interaction Campaign (ATOMIC), near Barbados, 2020-01-29 to 2020-02-13, NOAA NCEI [data set], https://doi.org/10.25921/44cy-kr53, 2021c.
Thomson, J.: Wave Breaking Dissipation Observed with SWIFT Drifters, J. Atmos. Ocean. Tech., 29, 1866–1882, https://doi.org/10.1175/JTECH-D-12-00018.1, 2012.
Thomson, J. and Girton, J.: Sustained Measurements of Southern Ocean Air-Sea Coupling from a Wave Glider Autonomous Surface Vehicle, Oceanography Magazine, 30, 104–109, 2017.
Thomson, J., Girton, J. B., Jha, R., and Trapani, A.: Measurements of Directional Wave Spectra and Wind Stress from a Wave Glider Autonomous Surface Vehicle, J. Atmos. Ocean. Tech., 35, 347–363, 2018.
Thomson, J., Moulton, M., de Klerk, A., Talbert, J., Guerra, M., Kastner, S., Smith, M., Schwendeman, M., Zippel, S., and Nylund, S.: A new version of the SWIFT platform for waves, currents, and turbulence in the ocean surface layer, IEEE/OES Workshop on Currents, Waves, and Turbulence Measurements, 10–13 March 2019, St. Petersburg, FL, USA, 2019.
Thomson, J., Thompson, E., Iyer, S., Drushka, K., and de Klerk, A.: Near-surface meteorology, air-sea fluxes, surface ocean waves, and near-surface ocean parameters (currents, temperature, salinity) estimated from in-situ and remote sensing instruments aboard two Wave Gliders lauched and recoverd from the NOAA Ship Ronald H. Brown in the North Atlantic Ocean by the Applied Physics Laboratory at the University of Washington during the Atlantic Tradewind Ocean-Atmosphere Mesoscale Interaction Campaign (ATOMIC), near Barbados, 2020-01-09 to 2020-02-11, NOAA NCEI [data set], https://doi.org/10.25921/dvys-1f29, 2021a.
Thomson, J., Thompson, E., Iyer, S., Drushka, K., and de Klerk, A.: Near-surface meteorology, air-sea fluxes, surface ocean waves, and near-surface ocean properties (turbulent dissipation rate, currents, temperature, salinity) estimated from in-situ and remote sensing instruments aboard six SWIFT drifters (Surface Wave Instrument Float with Tracking) lauched and recoverd for two different deployments from the NOAA Ship Ronald H. Brown in the North Atlantic Ocean by the Applied Physics Laboratory at the University of Washington during the Atlantic Tradewind Ocean-Atmosphere Mesoscale Interaction Campaign (ATOMIC), near Barbados, 2020-01-14 to 2020-02-11, NOAA NCEI [data set], https://doi.org/10.25921/s5d7-tc07, 2021b.
Tsamalis, C., Chédin, A., Pelon, J., and Capelle, V.: The seasonal vertical distribution of the Saharan Air Layer and its modulation by the wind, Atmos. Chem. Phys., 13, 11235–11257, https://doi.org/10.5194/acp-13-11235-2013, 2013.
Vial, J., Bony, S., Dufresne, J. L., and Roehrig, R.: Coupling between lower-tropospheric convective mixing and low-level clouds: Physical mechanisms and dependence on convection scheme, J. Adv. Model. Earth Syst., 8, 1892–1911, https://doi.org/10.1002/2016MS000740, 2016.
Weller, R. A.: Observing surface meteorology and air sea fluxes, in: Observing the Oceans in Real Time, edited by: Venkatesan, R., Tandon, A., D'Asaro, E., and Atmanand, M. A., Springer International, Switzerland, 17–35, 2018.
Wex, H., Dieckmann, K., Roberts, G. C., Conrath, T., Izaguirre, M. A., Hartmann, S., Herenz, P., Schäfer, M., Ditas, F., Schmeissner, T., Henning, S., Wehner, B., Siebert, H., and Stratmann, F.: Aerosol arriving on the Caribbean island of Barbados: physical properties and origin, Atmos. Chem. Phys., 16, 14107–14130, https://doi.org/10.5194/acp-16-14107-2016, 2016.
Whittlestone, S. and Zahorowski, W.: Baseline radon detectors for shipborad use: Development and deployment in the First Aerosol Characterization Experiment (ACE-1), J. Geophys. Res.-Atmos., 103, 16743–16751, 1998.
Zhang, D. and Zhang, C.: Near-surface meteorology, air-sea fluxes, surface ocean waves, and near-surface ocean properties (temperature, salinity, currents) measured by in-situ instruments aboard two Saildrones in the North Atlantic Ocean by NOAA/Pacific Marine Environmental Laboratory and Cooperative Institute for Climate, Ocean, and Ecosystem Studies/University of Washington, during the Atlantic Tradewind Ocean-Atmosphere Mesoscale Interaction Campaign (ATOMIC), east and southeast of Barbados, 2020-01-13 to 2020-04-11, NOAA NCEI [data set], https://doi.org/10.25921/9km0-f614, 2021.
Zhang, D., Cronin, M. F., Meinig, C., Farrar, J. T., Jenkins, R., Peacock, D., Keene, J., Sutton, A., and Yang, Q.: Comparing Air-sea flux measurements from a new unmanned surface vehicle and proven platforms during the SPURS-2 Field Campaign, Oceanography, 32, 122–133, 2019.
Zuidema, P.: Overview of ATOMIC, in preparation, 2021a.
Zuidema, P.: Rain rate, rain accumulation, raindrop count, and equivalent radar reflectivity from disdrometer aboard the NOAA Ship Ronald H. Brown in the North Atlantic Ocean by the University of Miami during the Atlantic Tradewind Ocean-Atmosphere Mesoscale Interaction Campaign (ATOMIC), near Barbados, at the native time resolution of 10 seconds, 2020-01-09 to 2020-02-12, NOAA NCEI [data set], https://doi.org/10.25921/pfgy-7530, 2021b.
Zuidema, P., Szczodrak, G., and Minnett, P.: Ocean skin surface temperature and near-surface air temperature retrieved from spectral radiances measured by a Marine-Atmosphere Emitted Radiance Interferometer (M-AERI) aboard the NOAA Ship Ronald H. Brown in the North Atlantic Ocean by the University of Miami during the Atlantic Tradewind Ocean-Atmosphere Mesoscale Interaction Campaign (ATOMIC), near Barbados, 2020-01-06 to 2020-02-13, NOAA NCEI [data set], https://doi.org/10.25921/db6z-z646, 2021.
- Abstract
- Introduction
- Sampling strategy and measurements
- Overview of meteorological and surface seawater conditions sampled
- Inter-platform data comparisons
- Data availability
- Summary
- Author contributions
- Competing interests
- Special issue statement
- Acknowledgements
- Financial support
- Review statement
- References